anatomy and physiology of peritoneal...
TRANSCRIPT

Anatomy and Physiology of Peritoneal Dialysis
Isaac Teitelbaum, MDProfessor of Medicine
Director, Acute & Home Dialysis ProgramsUniversity of Colorado Hospital
Denver, Colorado

Outline• Peritoneal cavity as a dialysis system
• Models of peritoneal transport
• Physiology of peritoneal transport Inverse relationship between solute transport and ultrafiltration
• Kinetics of peritoneal transport
• Synthesis & Application
• Middle Molecules

Anatomy of The Peritoneum
• The lining of the abdominal cavity • Two layers:
parietal - lines the anterior wall and undersurface ofthe diaphragm
- 20% of total SA; blood supply from abdominal wall
visceral - covers the abdominal organs- 80% of total SA; blood supply from mesenteric aa and portal vv
Gokal R, Textbook of PD, pp. 61-70

Anatomy of The Peritoneum
• Size 1.5 – 2 m2; approximates BSA
• Highly Vascular
• Semi-permeable/bi-directional
• “Lymphatic” drainage through diaphragmatic stomata
• Continuous with Fallopian Tubes in females
Gokal R, Textbook of PD, pp. 61-70


The Peritoneal Cavity as a Dialysis System

Transport Processes in Peritoneal Dialysis
Diffusion-
Movement of solute from an area ofhigher concentrationto an area of lowerconcentration
.
Osmosis-
Movement of water from an area of higher concentration (lower solute concentration)to an area of lowerconcentration(higher solute concentration)

Models of Peritoneal Transport
• The three pore model
• The pore- matrix model
• The distributed model

Transport Across the Peritoneal Endothelium:The Three Pore Model
• Large pores (100 - 200 Å)- few in number (3% of SA)- transport macromolecules- clefts between endothelial cells
• Small pores (40 - 60 Å)- most numerous (95% of SA)- allow transport of small solutes and water- postulated to be clefts in the endothelium; have not been
demonstrated anatomically

• Ultrasmall (transcellular) pores (4 - 6 Å)- many in number (but only 2% of SA)- transport water only (Na sieving)- Demonstrated to be AQP 1
Transport Across the Peritoneal Endothelium:The Three Pore Model (cont’d)

Water Transport in Aquaporin- 1 Knockout Mice
Yang et al. AJP 276:C76, 1999

110
115
120
125
130
135
140
0 30 60 90 120 150 180 210 240Dwell time (min)
Sodi
um m
eq/L
2.5% D
4.25% D
Heimburger et al. Kid Int 38: 495, 1990
Changes In Dialysate Sodium During Dwell (Sodium Sieving)

Flessner M. Contrib Nephrol 163:7, 2009
Ultrafiltration in PD:The Pore-Matrix Model

Ultrafiltration in PD:The Pore-Matrix Model
• The small and large pores represent different functional states of a single entity that depends on the density of the glycocalyx.
• The glycocalyx density is decreased by: Oxidized LDL Adenosine Ischemia reperfusion injury TNF α

Flessner M. Contrib Nephrol 163:7, 2009
Ultrafiltration in PD:The Distributed Model

• Increased “effective” peritoneal surface area may occur:- During peritonitis
- After prolonged exposure to high glucose-containing fluids
Effective Peritoneal Surface Area

Two Clinical Endpoints for Peritoneal Transport
• Solute Clearance diffusive
convective
• Fluid Removal

Factors Influencing Solute Diffusion
• Surface Area• Peritoneal Permeability• Solute Characteristics• Concentration Gradient• Temperature of Dialysis Solution• Blood Flow• Dialysis Solution Volume in 24 hrs.• Dwell Time

UreaCreatinine
MM
Dwell time (hours)
1.0
0.8
0.6
0.4
0.2
Dialysate to plasma (D/P) ratios
Diffusion Curves for Solutes of Varying Size
D/P
x
4 8 12 16

Diffusion Kinetics –From Blood to Dialysate
• Diffusive flux is highest in the first hour- the gradient is largest- and decreases over time
• By 4 hours, urea is > 90% equilibrated, creatinine > 60% equilibrated
• Further small solute removal is modest
• Long dwells more important for removal of middle MW solutes (e.g. β2MG)

Factors Influencing Ultrafiltration
• Surface area
• Peritoneal membrane permeability
• Pressure gradients - hydrostatic - oncotic- osmotic (really hydrostatic; 1 mOsm = 17 mm Hg)

What Determines Transcapillary Ultrafiltration?
Flessner M. Kid Int 69:1494, 2006
Jv = Lp S [Pplasma - Pif - ∑αjσi,j (πi,plasma – πi,if)]
Jv flow/areaLp hydraulic conductivityS total pore areaPplasma intraluminal capillary
hydrostatic pressure in plasmaPif interstitial fluid hydrostatic
pressure
αj Fraction of the total pore area that is made up of the jth pore
σi,j Reflection coefficient of the jth
pore for the ith soluteπi,plasma Osmotic pressure in plasma due
to the ith soluteπi,if Osmotic pressure in the
interstitium due to the ith solute
i,j

Or, in English…
Average UF rate (ml/min) =
hydraulic conductivity (cm/min/mmHg) x total effective pore area (cm2) x[average osmotic pressure + net trans-membrane hydrostatic pressure - net oncotic pressure (mm Hg)]
Factors Influencing Ultrafiltration
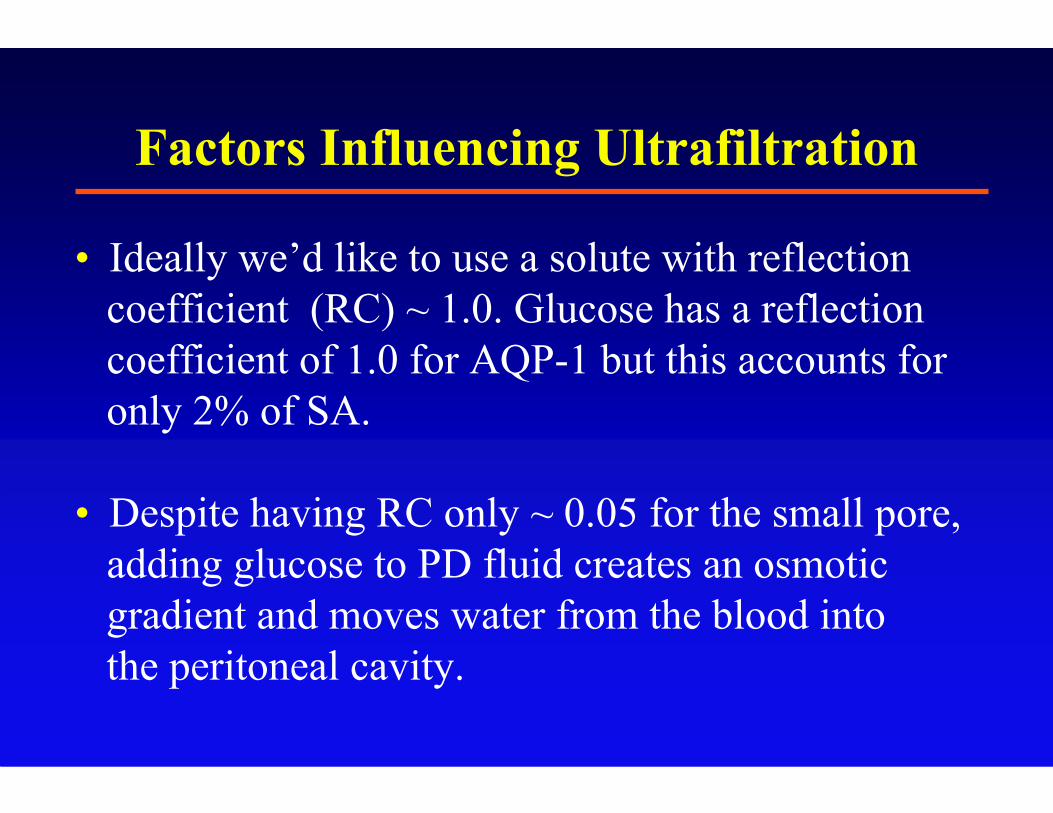
• Ideally we’d like to use a solute with reflection coefficient (RC) ~ 1.0. Glucose has a reflection coefficient of 1.0 for AQP-1 but this accounts for only 2% of SA.
• Despite having RC only ~ 0.05 for the small pore, adding glucose to PD fluid creates an osmotic gradient and moves water from the blood into the peritoneal cavity.

Effect of Glucose Absorption
Therefore, a major determinant of the average UF per exchange is the “average glucose”, as this will affect the rate of glucose absorption and the speed
of decline of the glucose gradient.

Membrane Permeability and Ultrafiltration –“slow transporters”
the “tighter” the peritoneal membrane (higher mean glu)
the slower will glucose diffuse out of the peritoneal cavity
the osmotic gradient will be maintained longer
the more ultrafiltration will take place

Membrane Permeability and Ultrafiltration –“rapid transporters”
the “leakier” the peritoneal membrane (lower mean glu)
the faster will glucose diffuse out of the peritoneal cavity
the faster the osmotic gradient will dissipate
the less ultrafiltration will take place

The Peritoneal Equilibration Test
How easily does solute (creatinine) cross from the blood to the peritoneal cavity?
• Quantified as Dialysate creatinine concentrationPlasma creatinine concentration
orD/P creatinine (at t = 4 hours)

The Peritoneal Equilibration Test
How long is glucose retained in the peritoneal cavity?
• Quantified as:Dialysate concentration of glucose at t = 4hrsDialysate concentration of glucose at t = 0 hr
orD/ D0 glucose (at t = 4 hours)
• cannot use D/P glucose as a surrogate since glucose entering the plasma from dialysate is rapidly metabolized
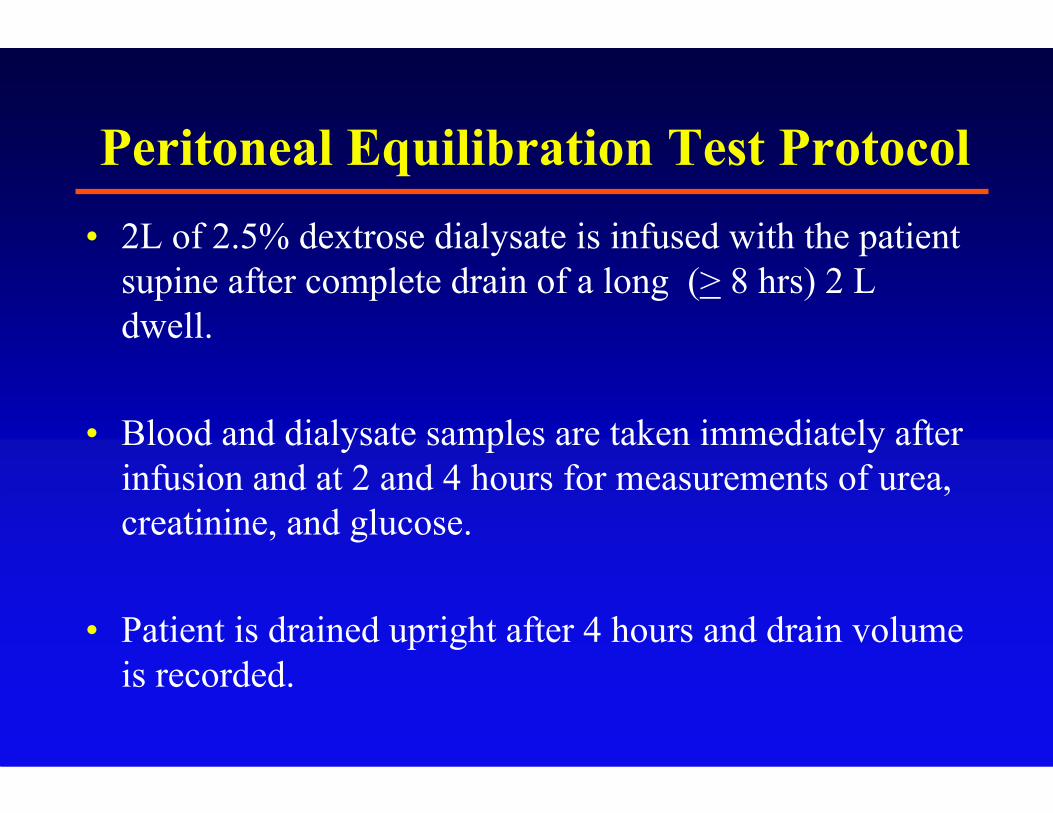
Peritoneal Equilibration Test Protocol• 2L of 2.5% dextrose dialysate is infused with the patient
supine after complete drain of a long (> 8 hrs) 2 L dwell.
• Blood and dialysate samples are taken immediately after infusion and at 2 and 4 hours for measurements of urea, creatinine, and glucose.
• Patient is drained upright after 4 hours and drain volume is recorded.

Twardowski et al. PDB 7; 138, 1987
Urea
0
0.2
0.4
0.6
0.8
1
1.2
0 1 2 3 4
D/P
HighH. AveL. AveLow
Creatinine
0
0.2
0.4
0.6
0.8
1
1.2
0 1 2 3 4
D/P
Standard Peritoneal Equilibration Test (2.5% Dextrose)

GLUCOSE
0
0.2
0.4
0.6
0.8
1
1.2
0 1 2 3 4
D/Do CREATININE
0
0.2
0.4
0.6
0.8
1
1.2
0 1 2 3 4
D/P
0
500
1000
1500
2000
2500
3000
3500
Drain Volume
LowL AveH AveHigh
Twardowski et al. PDB 7: 138, 1987
Standard Peritoneal Equilibration Test (2.5% Dextrose)

Modified Peritoneal Equilibration Test
• Similar to the standard PET except,
• Performed with 4.25% dextrose, thereby creating a large osmotic gradient.

Modified Peritoneal Equilibration Test
• Ultrafiltration failure is defined as net ultrafiltration < 400 cc at 4 hours
• Correlates well with clinical behavior.

0
0.2
0.4
0.6
0.8
1
1.2
0hr 2hr 4hr0
0.2
0.4
0.6
0.8
1
1.2
0 2 4
2.5% 4.25%
Comparison of D/P Urea Obtained by 2.5% and 4.25% PET
Pride et al. Perit Dial Int 22:365, 2002

00.10.20.30.40.50.60.70.80.9
1
0hr 2hr 4hr0
0.10.20.30.40.50.60.70.80.9
1
0 hr 2 hr 4hr
2.5% 4.25%
Comparison of D/P Creatinine Obtained by 2.5% and 4.25% PET
Pride et al. Perit Dial Int 22:365, 2002

0
0.2
0.4
0.6
0.8
1
1.2
0hr 2hr 4hr0
0.2
0.4
0.6
0.8
1
1.2
0hr 2hr 4hr
2.5% 4.25%
Comparison of D/D0 Glucose Obtained by 2.5% and 4.25% PET
Pride et al. Perit Dial Int 22:365, 2002

Discordance (> 1 Category) Between 2.5% and 4.25% PET at 4 Hours
D/Purea 3/47
D/Pcreat 1/47
D/D0 glu 0/45
Pride et al. Perit Dial Int 22:365, 2002

• A PET using 4.25% dextrose may be substituted for the standard 2.5% PET. This allows for simultaneous evaluation of both the small solute transfer and ultrafiltration capacities of the peritoneal membrane.
• However, commercially available programs for modeling peritoneal adequacy have not been standardized to the 4.25% PET.
When Should the PET be Performed?
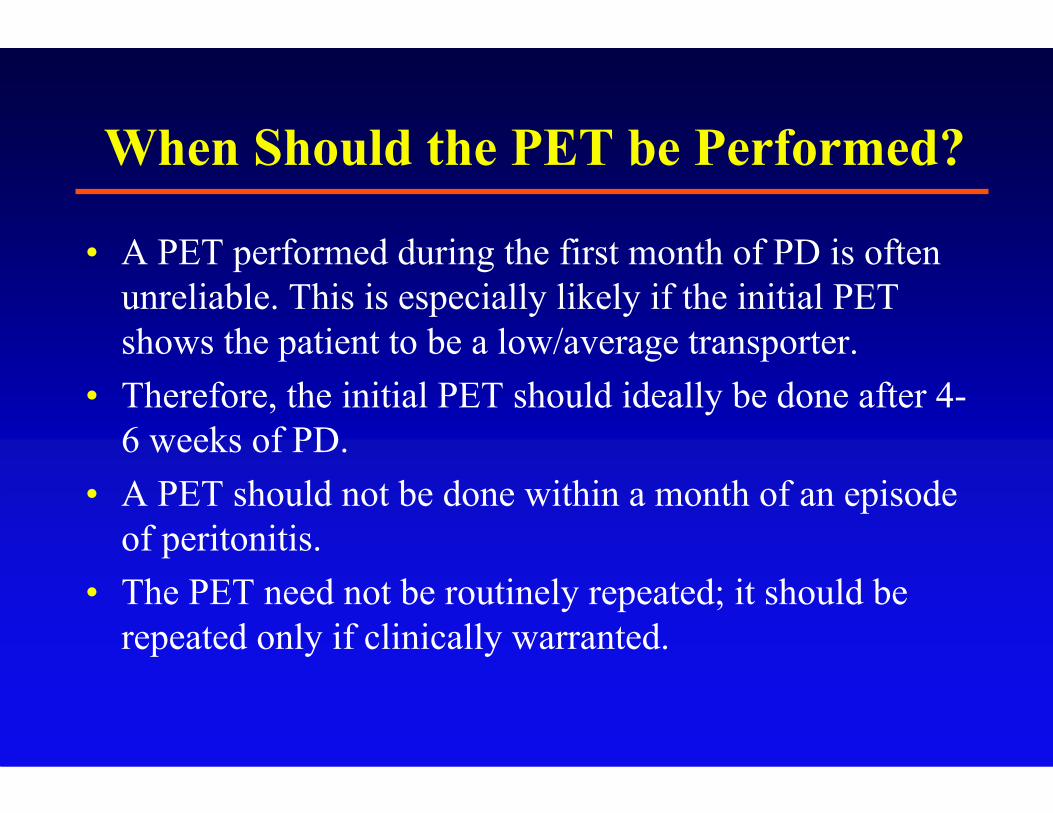
• A PET performed during the first month of PD is often unreliable. This is especially likely if the initial PET shows the patient to be a low/average transporter.
• Therefore, the initial PET should ideally be done after 4-6 weeks of PD.
• A PET should not be done within a month of an episode of peritonitis.
• The PET need not be routinely repeated; it should be repeated only if clinically warranted.

0 100 200 300 400 500 600 700
1600
1800
2000
2200
2400
2600
2800 4.25% Dextrose
1.5% Dextrose
Intra
perit
onea
l vol
ume,
ml
Time, min
Ultrafiltration with Different Strengths of Dialysate

Fluid Absorption from the Peritoneal Cavity
• Occurs directly via lymphatics (~ 10%)
• Also via absorption across tissues
• Difficult to measure but ~ 1-2 ml/min
• These processes are “bulk flow” and therefore detract from solute and fluid removal

Balance of Opposing Forces
-600
-400
-200
0
200
400
600
800
-30 0 30 60 90 120 150 180 210 240
Time (min)
Cum
ulat
ive
tran
spor
t (m
l)
Absorption Transcapillary UF Net UF
Mactier et al. JCI 80:1311, 1987Reabsorption from peritoneal cavity

What Happens To Intraperitoneal (IP) Volume During a Dwell?
Assume 2L, average D/P, 2.5% Dextrose• UF maximal at start (about 15 ml/min)• UF decreases as glucose is absorbed from the
peritoneal cavity and osmotic gradient lessens• IP volume slowly increases until lymphatic
reabsorption (LR) rate = UF rate• Once LRR > UFR, IP volume begins to decrease• After osmotic equilibrium is reached UF ceases;
IP volume continues to decrease by virtue of LR
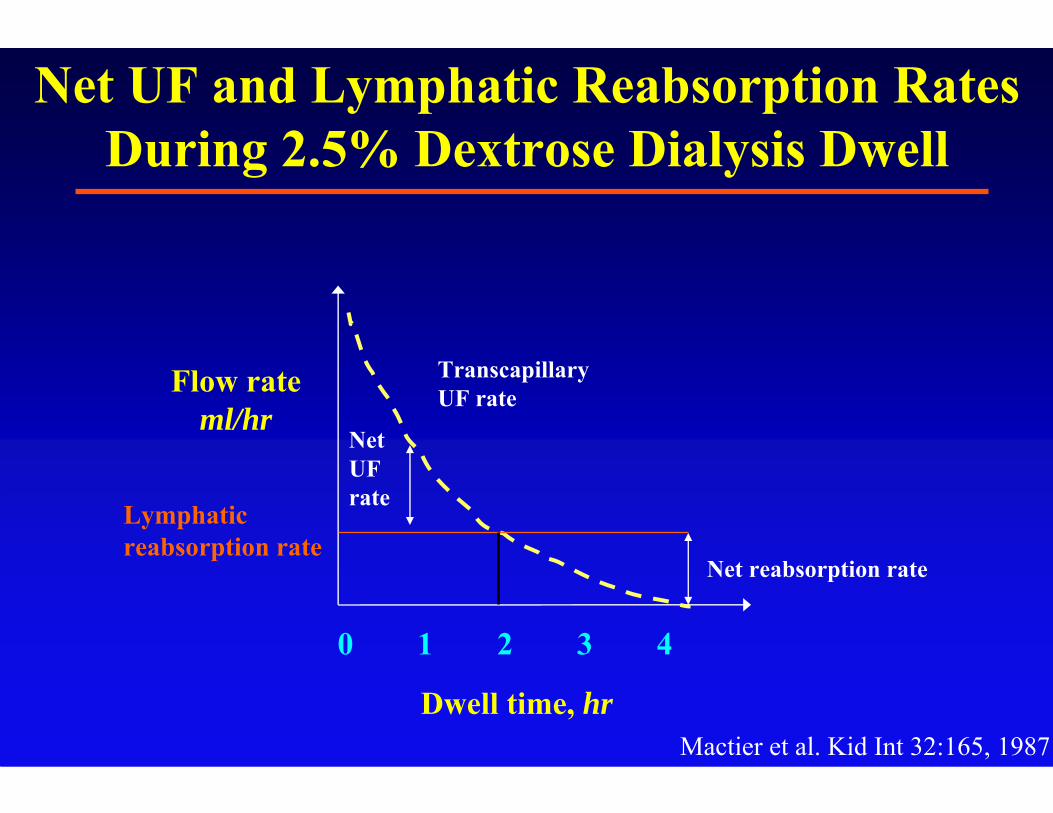
Net UF rate
Net reabsorption rate
Dwell time, hr
Lymphatic reabsorption rate
Flow rate ml/hr
Transcapillary UF rate
Net UF and Lymphatic Reabsorption Rates During 2.5% Dextrose Dialysis Dwell
Mactier et al. Kid Int 32:165, 1987
0 1 2 3 4

Net UF rate
Net reabsorption rate
Dwell time, hr
Lymphatic reabsorption rate
Flow rate ml/hr
Transcapillary UF rate
Net UF and Lymphatic Reabsorption Rates in a Low Transporter
0 1 2 3 4

Net UF rate
Net reabsorption rate
Dwell time, hr
Lymphatic reabsorption rate
Flow rate ml/hr
Transcapillary UF rate
Net UF and Lymphatic Reabsorption Rates in a High Transporter
0 1 2 3 4

Net reabsorption rate
Dwell time, hr
Lymphatic reabsorption rate
Flow rate ml/hr
Transcapillary UF rate
Ultrafiltration Profile in a Patient with High Lymphatic Reabsorption Rate
0 1 2 3 4

Net reabsorption rate
Dwell time, hr
Lymphatic reabsorption rate
Flow rate ml/hr
Transcapillary UF rate
0 1 2 3 4
Net UF in a High Transporter with Increased Lymphatic Reabsorption

Temporal Profiles of CAPD and APD Prescriptions
nighttime period (9 hrs) daytime period (15 hrs)
Cycle3
Cycle2
Cycle4
Cycle1
APDAPD
CAPDCAPD

Features of the Alternative Osmotic Agent Icodextrin
• Glucose polymer with average MW around 16,000 Da.
• Effects ultrafiltration through the numerous small intercellularpores (reflection coefficient = 1.0).

Structure of Icodextrin
Main Main (1(14) chain4) chain
(1(16) branch6) branch

0 100 200 300 400 500 600 700
1600
1800
2000
2200
2400
2600
2800
7.5% Icodextrin
4.25% Dextrose
1.5% Dextrose
Dra
ined
vol
ume,
ml
Time, min
Rippe and Levin. Kid Int 57: 2546, 2000
Temporal Profile of Ultrafiltration by Osmotic Agent

Temporal Profile: Icodextrin
-600
-200
200
600
1000
0 2 4 6 8 10 12 14 16
Time (hr)
Net
UF (
ml)
L LA HA H
CAPDOvernight APD
Daytime

Composition of Icodextrin
Standard IcodextrinDextrose (g/dL) 1.5, 2.5, 4.25 ---
Icodextrin (g/dL) --- 7.5
Sodium (mEq/L) 132.0 132.0
Chloride (mEq/L) 96.0 96.0
Calcium (mEq/L) 3.5 3.5
Magnesium (mEq/L) 0.5 0.5
Lactate (mEq/L) 40.0 40.0
Osmolality (mOsm/kg) 346-485 282
pH 5.2 5.2

Key Determinants of Average UF Rate
• Gradient of osmotic agent
• Average reflection coefficient of osmotic agent for small pores and for aquaporins
• Total pore area for small pores and aquaporins

Reflection Coefficients
Large Pores (radius 250 Ang; 3% of pore area)Glucose 0Icodextrin 0
Small Pore (radius 40-50 Ang; 95% of pore area)Glucose 0.05Icodextrin 1.0
Aquaporins (3-5 Ang; 2% of pore area)Glucose 1.0Icodextrin 1.0
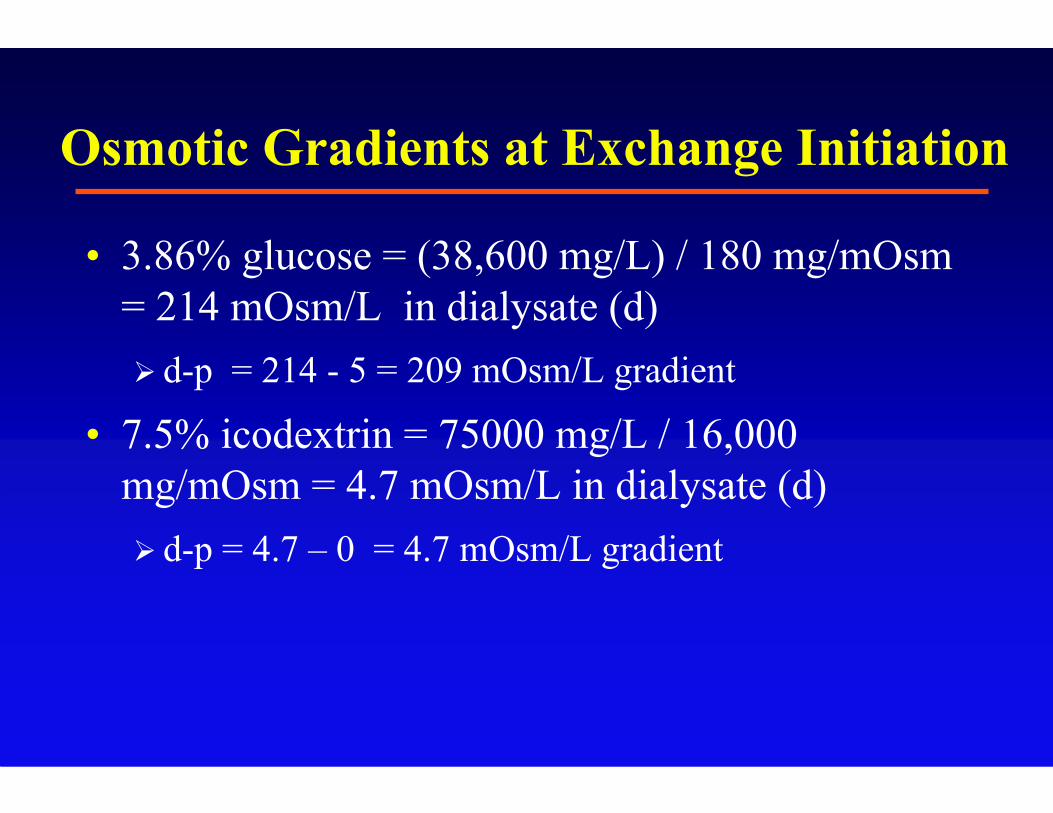
Osmotic Gradients at Exchange Initiation
• 3.86% glucose = (38,600 mg/L) / 180 mg/mOsm = 214 mOsm/L in dialysate (d) d-p = 214 - 5 = 209 mOsm/L gradient
• 7.5% icodextrin = 75000 mg/L / 16,000 mg/mOsm = 4.7 mOsm/L in dialysate (d) d-p = 4.7 – 0 = 4.7 mOsm/L gradient
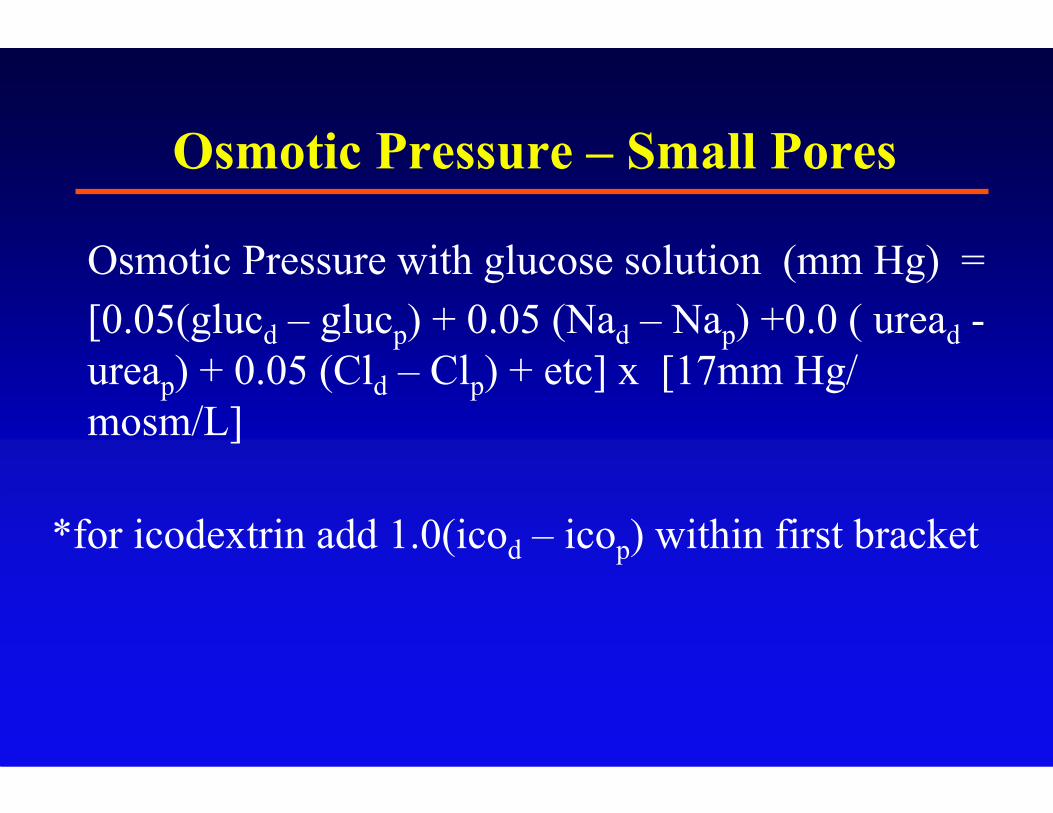
Osmotic Pressure – Small Pores
Osmotic Pressure with glucose solution (mm Hg) = [0.05(glucd – glucp) + 0.05 (Nad – Nap) +0.0 ( uread -ureap) + 0.05 (Cld – Clp) + etc] x [17mm Hg/ mosm/L]
*for icodextrin add 1.0(icod – icop) within first bracket

Osmotic Pressure – Aquaporins
For both glucose and icodextrin solutions use the same equation as on the previous slide but use a
reflection coefficient of 1.0 for each.

How Glucose Induces UF Across Aquaporins
• The reflection coefficient is 1.0• The effective gradient is high (209 mOsm/L)• The initial osmotic pressure is extremely high (209 x 17
= 3553 mm Hg).• The above yields UF despite the very low pore area
(2%).
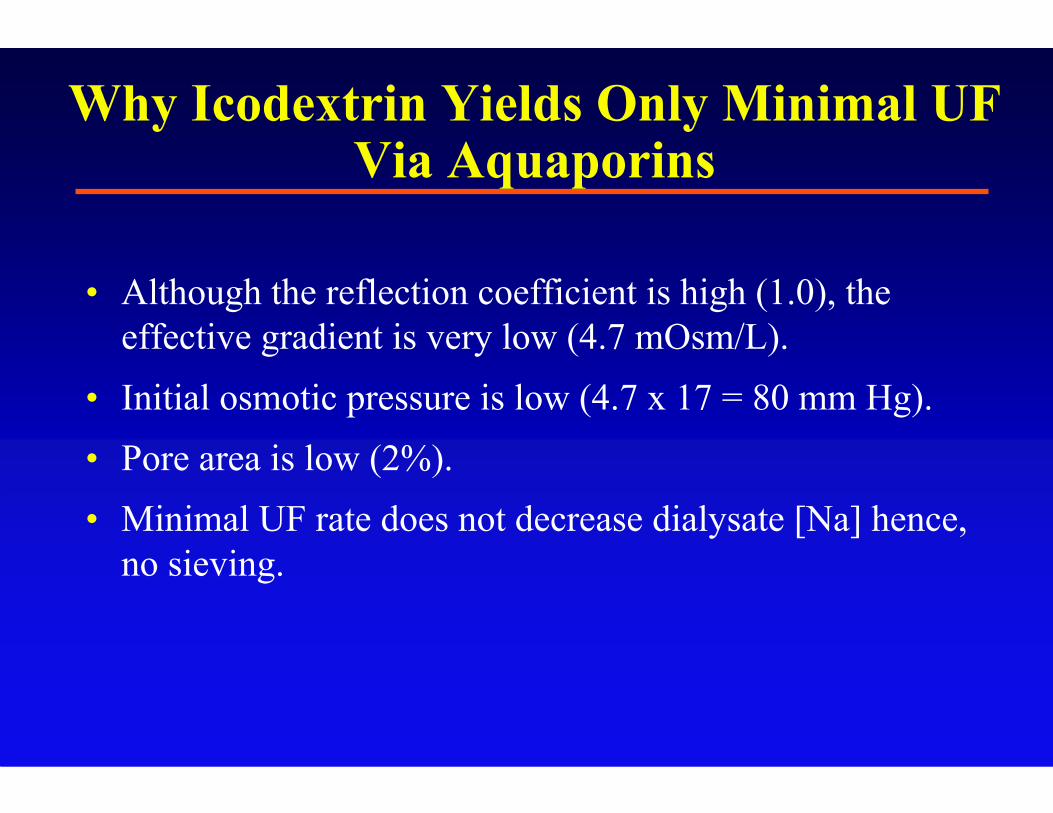
Why Icodextrin Yields Only Minimal UF Via Aquaporins
• Although the reflection coefficient is high (1.0), the effective gradient is very low (4.7 mOsm/L).
• Initial osmotic pressure is low (4.7 x 17 = 80 mm Hg).• Pore area is low (2%).• Minimal UF rate does not decrease dialysate [Na] hence,
no sieving.

Why Icodextrin Solutions Yield UF Even with Osmolality Less than that of Plasma• The effective osmotic gradient due to icodextrin is more
positive than the sums of any negative effective gradients for other solutes yielding a positive effective osmotic gradient.
• This results from the very low reflection coefficients for sodium, chloride, urea, etc.
• And this effect is exerted over a large pore area (97%).

Possible Clinical Ramifications of Retained MMW Solutes in Uremia
Probably related to some long term complications of uremia:• Dialysis acquired amyloidosis
• Accelerated CV risk profile
• Uremic platelet dysfunction
• Immunodeficiency

UreaCreatinine
MM
Dwell time (hours)
1.0
0.8
0.6
0.4
0.2
Dialysate to plasma (D/P) ratios
Diffusion Curves for Solutes of Varying Size
D/P
x
4 8 12 16
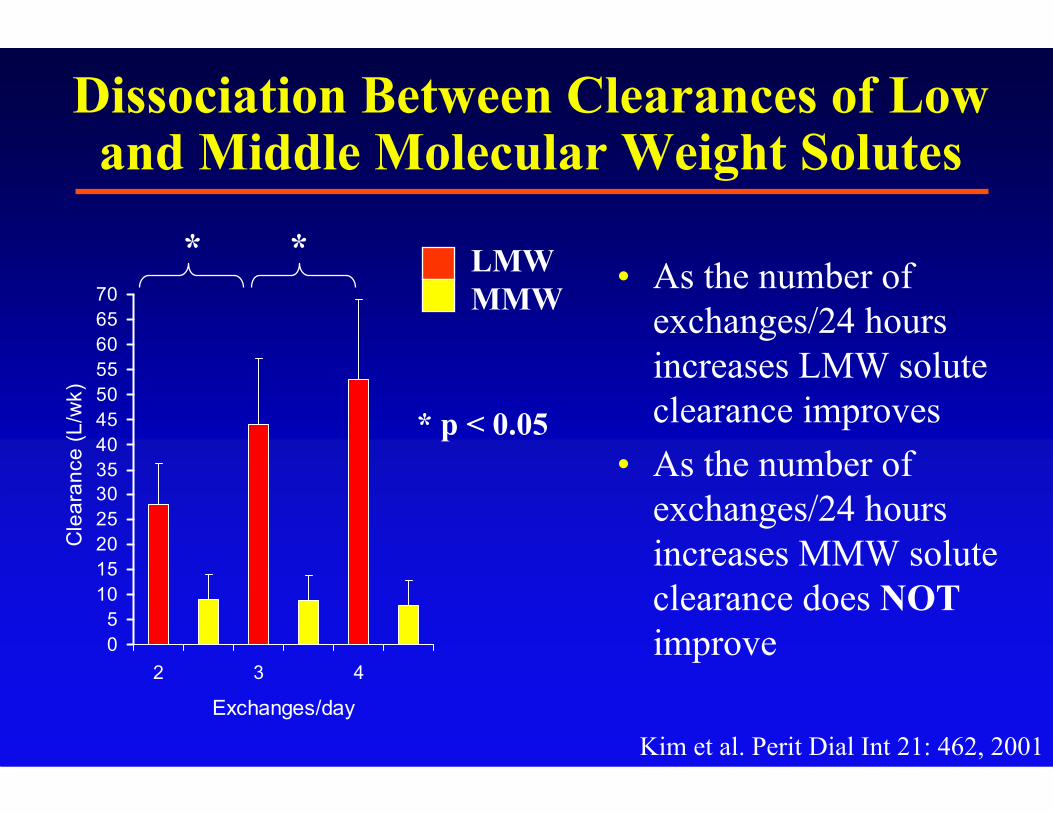
Kim et al. Perit Dial Int 21: 462, 2001
05
10152025303540455055606570
2 3 4
Exchanges/day
Cle
aran
ce (L
/wk)
Dissociation Between Clearances of Low and Middle Molecular Weight Solutes
• As the number of exchanges/24 hours increases LMW solute clearance improves
• As the number of exchanges/24 hours increases MMW solute clearance does NOTimprove
* *
* p < 0.05
LMWMMW

Middle Molecule Clearanceis Dwell Time Dependent
0
2
4
6
8
10
12
14
2 exchanges/ 12 hr
2 exchanges/ 24 hr
β2-m
icro
glob
ulin
Cle
aran
ce (L
/wk
Kim et al. Perit Dial Int 21: 462, 2001
0
2
4
6
8
10
12
14
2 3 4
Exchanges/day
β2-m
icro
glob
ulin
cle
aran
ce (L
/wk
*p <.05 vs 2 exchanges/12 hr
*
) )

β2-Microglobulin Clearance (4 hour dwell): Icodextrin vs. Dextrose
Ho- dac- Pannekeet et al. Kid Int 50: 979, 1996
0.5
1.0
1.5
2.0
2.5
01.5%
dextrose4.25%
dextroseIcodextrin
β 2-m
icro
glob
ulin
Cle
aran
ce(m
L/m
in/1
.73
m2 )
*p = 0.008, icodextrin vs. 1.5% dextrose†p = 0.01, icodextrin vs. 4.25% dextrose
*†

Outline• Peritoneal cavity as a dialysis system
• Models of peritoneal transport
• Physiology of peritoneal transport Inverse relationship between solute transport and ultrafiltration
• Kinetics of peritoneal transport
• Synthesis & Application
• Middle Molecules

THANK YOU

Question #1• A patient is admitted in pulmonary edema and multiple
rapid PD exchanges with 4.25% dextrose are performed. Which of the following may ensue as a consequence of sodium sieving?• A. Hyponatremia due to rapid water transport from dialysate to
plasma via aquaporins. • B.Hypernatremia due to rapid sodium entry from dialysate to
plasma via the small pores.• C. Hypernatremia due to rapid water transport from plasma to
dialysate via aquaporins. • D. Hypokalemia due to rapid Na/ K exchange by Na/K ATPase
in the mesothelium.

Question #1: Answer
• The correct answer is “C”. When doing very hypertonic exchanges, e.g. with 4.25%, free water moves via the aquaporins from blood into dialysate, leaving behind Na in excess of water. If one performs multiple such exchanges in short order this may culminate in hypernatremia.

Question #2• A patient has a 4 hour D/Pcr of 0.88 and D/D0 glucose
of 0.35. Which of the following best describes the anticipated clinical findings using 1.5% dextrose dialysate and CAPD?
• A. Good solute clearance and good ultrafiltration. • B. Poor solute clearance and good ultrafiltration. • C. Poor solute clearance and poor ultrafiltration.• D. Good solute clearance and poor ultrafiltration.

Question #2: Answer
• The correct answer is “D”. The 4 hour D/Pcr of 0.88 and D/D0 glucose of 0.35 are indicative of a very rapid transporter. This individual would therefore be expected to have good solute clearance. However, s/he would dissipate the glucose- induced osmotic gradient very rapidly and would therefore be likely to absorb fluid from the abdominal cavity resulting in poor ultrafiltration