anatomical characteristics of the cerebral surface in
TRANSCRIPT
ARCHIVAL REPORT
Anatomical Characteristics of the Cerebral Surfacein Bulimia NervosaRachel Marsh, Mihaela Stefan, Ravi Bansal, Xuejun Hao, B. Timothy Walsh,and Bradley S. Peterson
Background: The aim of this study was to examine morphometric features of the cerebral surface in adolescent and adult femalesubjects with bulimia nervosa (BN).
Methods: Anatomical magnetic resonance images were acquired from 34 adolescent and adult female subjects with BN and 34 healthyage-matched control subjects. We compared the groups in the morphological characteristics of their cerebral surfaces while controllingfor age and illness duration.
Results: Significant reductions of local volumes on the brain surface were detected in frontal and temporoparietal areas in the BNcompared with control participants. Reductions in inferior frontal regions correlated inversely with symptom severity, age, and Stroopinterference scores in the BN group.
Conclusions: These findings suggest that local volumes of inferior frontal regions are smaller in individuals with BN compared withhealthy individuals. These reductions along the cerebral surface might contribute to functional deficits in self-regulation and to thepersistence of these deficits over development in BN.
Key Words: Bulimia nervosa, eating disorders, frontal cortex,frontostriatal, MRI, surface morphology
Bulimia nervosa (BN) typically begins in adolescence, pri-marily affects female individuals, and is characterized byrecurrent episodes of binge-eating that are accompanied
by a sense of loss of control and followed by self-inducedvomiting or another compensatory behavior to avoid weightgain (1,2). Mood disturbances and impulsive behaviors are alsocommon in persons with BN, suggesting the presence ofpervasive difficulties in behavioral self-regulation (2).
Our previous functional neuroimaging findings from adultwomen with BN suggest that their failure to engage frontostriatalcircuits might contribute to their impaired capacity for self-regulation (3). Our findings from adolescent girls with BN suggestthat this circuit-based dysfunction arises early in the course ofillness and is therefore unlikely to be an effect of chronic illness(4). We do not know, however, whether anatomical abnormalitiesin these circuits are associated with deficient frontostriatalfunctioning in BN or contribute to illness persistence.
Previous anatomical imaging studies of individuals with BN aresparse. Findings from voxel-based morphometric studies of adultswith BN vary; some suggest larger gray matter volumes of theorbitofrontal cortex (5,6) and ventral striatum (6), and otherssuggest no differences in global or regional gray matter volumes(7) in BN compared with control participants. Finer-grainedapproaches to assess and spatially localize structural abnormal-ities, such as measures of cortical thickness and morphological
assessment of the cerebral surface, have not been applied toanatomical data collected from individuals with BN. In addition,no prior studies have assessed brain structure in adolescentswith BN.
With methods previously used to assess brain morphology invarious psychiatric disorders (8–11), we compared morphologicalmeasures of the cerebral surface across adolescent and adultfemale subjects with BN and age-matched healthy participants.On the basis of our previous functional findings, we suspectedthat, relative to healthy participants, those with BN would showreductions in local volumes within the surface of the frontal lobe.In exploratory analyses, we assessed group differences in the agecorrelates of surface measures and whether abnormalities in thefrontal regions of individuals with BN were associated withmeasures of BN symptom severity or with deficits in self-regulatory control, as measured by cognitive interference on aStroop task (12) performed outside of the magnetic resonanceimaging (MRI) scanner.
Methods and Materials
ParticipantsThe sample consisted of 34 adolescents and adults with BN and
34 age-matched control participants who participated in ourfunctional magnetic resonance imaging (fMRI) studies (3,4). Thosewith BN were recruited through flyers posted in the localcommunity and internet advertisements (e.g., craigslist.com andeating disorder-specific websites) and through the Eating DisordersClinic at the New York State Psychiatric Institute, where they werereceiving treatment. Control participants were recruited throughflyers and internet advertisements. All participants were femalesubjects, group-matched by age and body mass index. Those witha history of neurological illness, past seizures, head trauma withloss of consciousness, mental retardation, pervasive developmentaldisorder, or current Axis I disorders (other than major depressionfor the patients) were excluded. Control subjects also had nolifetime Axis I disorders. Formal diagnoses of BN and comorbidneuropsychiatric diagnoses were established with standard adultand child measures (Supplement 1). All participants received
From the Division of Child and Adolescent Psychiatry (RM, MS, BSP); EatingDisorders Research Unit (RM, BTW); and the Center for DevelopmentalNeuropsychiatry (RB, XH, BSP), Department of Psychiatry, the New YorkState Psychiatric Institute and the College of Physicians and Surgeons,Columbia University, New York, New York.
Address correspondence to Rachel Marsh, Ph.D., Columbia University andthe New York State Psychiatric Institute, 1051 Riverside Drive, Unit 74,New York, NY 10032; E-mail: [email protected].
Received Apr 8, 2013; revised Jun 27, 2013; accepted Jul 16, 2013.
0006-3223/$36.00 BIOL PSYCHIATRY 2013;]:]]]–]]]http://dx.doi.org/10.1016/j.biopsych.2013.07.017 & 2013 Society of Biological Psychiatry
monetary compensation for their participation. The InstitutionalReview Board of the New York State Psychiatric Institute approvedthis study, and all participants gave informed consent.
MRI AcquisitionThe MRI scans were acquired on a GE Signa 3 Tesla whole-
body scanner (GE Medical Systems, Waukesha, Wisconsin) with abody transmitter coil and an eight-channel head receiver coil.High-resolution, T1-weighted images were acquired with a fastspoiled gradient-recall three-dimensional pulse sequence: inver-sion time ¼ 500 msec, echo time ¼ 1.3 msec, repetition time4.7 msec, 2 excitations, matrix size ¼ 256 " 256, field of view ¼25 cm, flip angle ¼ 11, number of slices ¼ 164, slice thickness ¼1 mm encoded for sagittal slice reconstruction, providing voxeldimensions of .976 " .976 " 1.0 mm.
Image ProcessingMorphometric analyses were conducted blind to participant
characteristics and hemisphere (images were randomly flipped inthe transverse plane before preprocessing) on Sun Ultra 10workstations with ANALYZE 9.0 (Rochester, Minnesota).
Preprocessing. Large-scale variations in image intensity werecorrected (13), and extracerebral tissues were removed by anautomated tool (14) before connecting dura was removedmanually on each sagittal slice and checked in orthogonal views.
Cortical Gray Matter Segmentation. Gray-scale values of“pure” representations of cortical gray and white matter weresampled bilaterally in frontal, temporal, occipital, and parietalregions with an 8 " 8 ¼ 64 pixel array that was sufficiently largeenough for statistical stability but small enough to avoid partialvolume effects from other tissue types. These four values wereaveraged for each tissue type, and a threshold value (halfwaybetween the gray and white matter values) was applied to eachslice in the imaging volume to provide an initial classification ofgray and white matter that was then hand edited in coronal andtransverse views. The intraclass correlation coefficient, calculatedwith a two-way random-effects model (15) as a measure ofreliability of our segmentation procedures, was .98.
Choice of Template Brain. We applied a rigorous two-stepprocedure to select template brain most representative of ourcontrol sample (16). We first selected as a preliminary referencethe brain of a healthy participant who was representative of thecontrol sample by age, weight, and height. The brains of theother control participants were coregistered to this preliminarytemplate. Point correspondences on cortical surfaces were deter-mined, and we computed the distance from the template surfacefor each of the corresponding points on the surfaces of the brainsof all the other control participants. The brain for which all pointsacross the surface were closest to the average of least squaresdistances was selected as the final template. Brains then under-went a second coregistration to this template. We used a singletemplate rather than an averaged brain, because it has welldefined-tissue interfaces (e.g., cerebrospinal fluid/gray matter orgray/white matter). Averaging images for a template would blurthese boundaries, thereby increasing registration errors that couldcontribute to subtle group differences in morphology.
Morphological Maps of the Cerebral Surface. Detaileddescriptions and validation of our methods used to analyzemorphological features of the cerebral surface are providedelsewhere (16–18). Briefly, the random flips were first reversedto provide their correct left-right orientation. With a similaritytransformation on the basis of mutual information of gray scalevalues, each brain was coregistered to the template brain such
that the cerebral surfaces were moved to a close approximationof the template surface. We then applied to each brain a high-dimensional, nonlinear warping algorithm so that its gray scaleintensities matched those of the template brain point by pointacross the entire cerebrum (11,16–18) providing a point-wiselabeling of the correspondences of the cortical surfaces across allbrains in the sample. The high-dimensional, nonlinear warp wasthen reversed, bringing the labels for point correspondences ofthe cerebral surface back to the close approximation establishedby the similarity transformation.
Surface Distances/Local Volumes. Signed Euclidian distancesfrom corresponding points across the cerebral surfaces for eachparticipant to corresponding points on the template surface werecalculated and subjected to statistical modeling at each voxel. Thesedistances were positive for outward deformations (protrusions) andnegative for inward deformations (indentations) of the surface of eachparticipant relative to the template. Thus, indentations or protrusionsalong the surface were interpreted as representing greater or smallerlocal volumes, respectively, of brain tissue along those surfaces.
Cortical Thickness. We masked out the cortical mantle fromthe coregistered brain of each participant. A three-dimensionalmorphological operator then distance-transformed each brainwithout the cortex from the same coregistered brain containingthe cortex (19), calculating cortical thickness as the smallestdistance of each point on the cortical surface from the outermostsurface of white matter in the coregistered brain. Because thesethicknesses were scaled for whole brain volume (WBV), the valuesinherently accounted for general scaling effects and interindivid-ual differences in WBV.
Stroop InterferenceStroop interference, measured outside the scanner with the
standard format of the task (20) (Supplement 1), was used forcorrelation analyses with measures of surface morphology.Because the adult (3) and adolescent (4) fMRI participantsperformed different versions of the Simon task, those behavioralor fMRI data could not be used in these correlation analyses. Wetherefore used Stroop data, because the Stroop and Simon taskselicit similar patterns of frontostriatal activations during theengagement of self-regulatory control in healthy individuals (21).
Statistical AnalysesWe used general linear modeling to compare the participants
with and without BN in cortical morphology. Each imagingmeasure (Euclidian distances or cortical thickness) was subjectedto statistical modeling at each voxel of the surface of thetemplate brain with age as a covariate. The p values werecorrected for multiple comparisons with a false discovery rateof .05, color-coded and plotted for each voxel on the cerebralsurface. In exploratory analyses, we assessed the significance ofcorrelations of distances over the entire cerebral surface with BNsymptom severity in the BN group while covarying for age andillness duration and compared groups in their patterns ofcorrelations with age and with Stroop interference at each voxelacross the cerebral surface.
Results
ParticipantsAnalyses include data from 34 BN and 34 healthy participants,
including 16 BN and 16 healthy adolescents (# 19 years). All wereright-handed. The BN participants included five inpatients
2 BIOL PSYCHIATRY 2013;]:]]]–]]] R. Marsh et al.
www.sobp.org/journal
scanned within 1 month of admission and eight outpatients; theremaining BN participants were not seeking treatment (n ¼ 11) orno longer receiving treatment in our clinic (n ¼ 10), but all weresymptomatic. Six presented with subclinical BN, with !8 (2"/week)objective bulimic episodes (n ¼ 2), vomiting episodes (n ¼ 2),or objective bulimic episodes and vomiting episodes (n ¼ 2) overthe past 28 days before participation. None met criteria for majordepressive disorder or attention-deficit/hyperactivity disorder. Tenhad a prior diagnosis of anorexia nervosa. Twelve were takingselective serotonin reuptake inhibitors (SSRIs) at the time of scan(Table S1 in Supplement 1). All participants were postpubertal andmenstruating regularly.
Group Differences in Morphology of the Cerebral SurfaceThe WBV did not differ across the BN and control groups, either
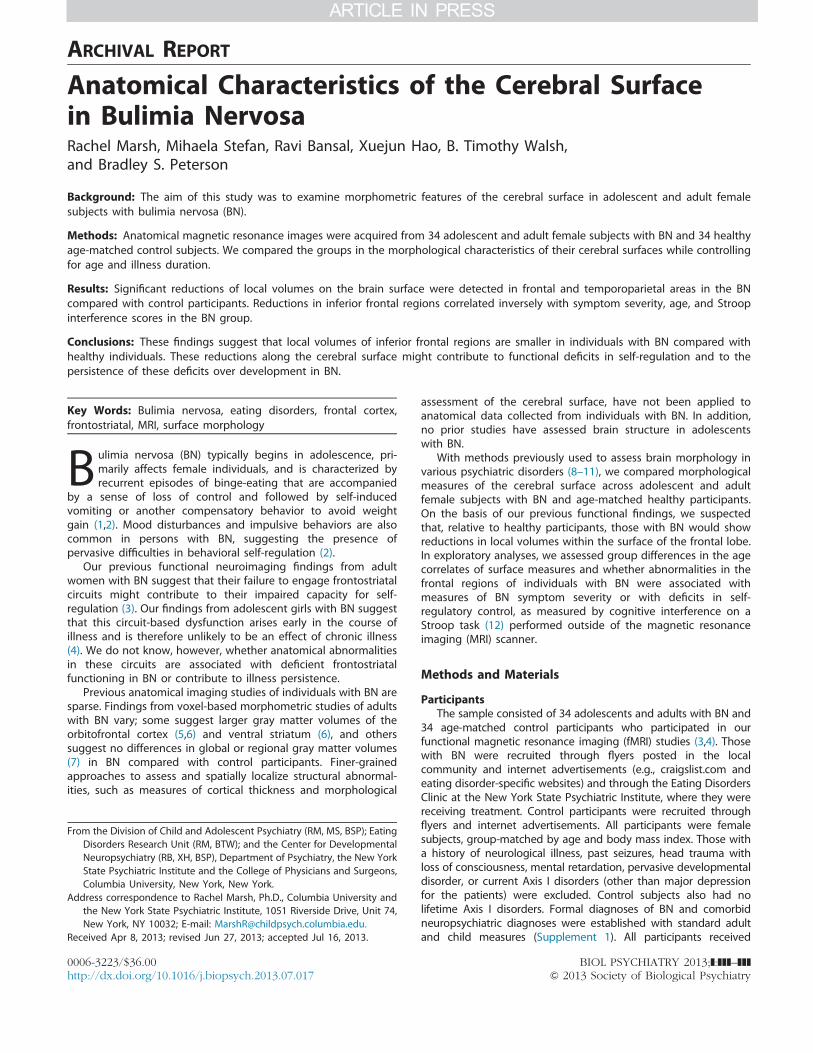
unadjusted (BN vs. control: 1291.7 " 131.8 vs. 1310 " 130.7 cm3,t66 ¼ #.57, p ¼ .65) or adjusted for age and BMI (1289.9 " 25.9 vs.1312 " 25.9 cm3, F1,64 ¼ .52, p ¼ .47). Nevertheless, the BN grouphad significant reductions in local volumes of bilateral middlefrontal (MFG) and precentral gyri (PreCG), right postcentral gyrus(PoCG), and lateral superior (SFG) and inferior frontal gyri (IFG) ofthe left hemisphere (Figure 1). Analyses of white matter demon-strated that these reductions on the cerebral surface of the frontallobe in the BN group derived primarily from reductions of under-lying white matter (Figure 2). Reductions were also detected intemporoparietal areas, including bilateral inferior temporal gyri,right superior parietal gyrus (SPG) and cuneus, as well as bilateralposterior cingulate cortices (PCC), left precuneus, and fusiformgyrus. In addition, enlargements were detected in bilateral middle/inferior occipital and lingual gyri and right inferior parietal lobule(IPL) in the BN versus control groups, deriving from enlargementsin underlying white matter (Figure 2).
Group Differences in Cortical Thickness. Scattered reduc-tions in cortical thickness in bilateral dorsal and lateral frontal,parietal, and posterotemporal cortices in the BN versus controlgroups (Figure S1 in Supplement 1) were consistent with thelocations of group differences in cortical morphology.
Correlations with Symptom Severity and Impulsivity.Within the BN group, we detected significant inverse associationsof cerebral surface morphology with log transformed (22)objective bulimic and vomiting episodes in bilateral IFG, PreCG,and PoCG (Figure 3; Figure S2 in Supplement 1). Scatterplots ofthese associations suggested greater reductions of these areas inthose who engaged in the most episodes within 28 days beforescanning. Inverse associations with participant ratings of theirpreoccupation with shape and weight in bilateral IFG, right PoCG,and left MFG (Figure S3 in Supplement 1) suggested greaterreductions in the most preoccupied BN participants. Impulsivity inthe BN group, measured with three items targeting impulsivity onthe attention-deficit/hyperactivity disorder rating scale, correlatedinversely with surface morphology in left IFG and medialtemporal gyrus (MTG) (Figure S4 in Supplement 1).
Effects of Age and Illness Duration. Significant diagnosis "age interactions on cortical surface morphology were detected inMFG and IFG of the left hemisphere and in the PoCG of the righthemisphere (Figure 4). Scatterplots of these interactions indicatedthat age correlated significantly and inversely with local volumereductions in the BN but not the control group in these brainareas. Diagnosis " age interactions were also detected in bilateralIPL such that age correlated inversely with reductions in thecontrol but not the BN group. Separate maps of age effects ineach group revealed that age correlated inversely with reductionsin right IFG and MFG in control subjects and in large expanses ofbilateral inferior frontotemporal regions in the BN group (FigureS5 in Supplement 1). Because age and illness duration weresignificantly intercorrelated in the BN group (r ¼ .89; p ¼ .001), wecontrolled for illness duration effects on surface morphology witha subgroup of 21 BN participants in whom age and illnessduration were uncorrelated (r ¼ .36; p ¼ .10) and a subgroupof 18 age-matched control subjects. Diagnosis " age interactionsremained in left IFG and MFG and were additionally detected inleft PreCG, MTG, superior temporal gyrus (STG), right IFG, as wellas right cingulate (CG) and left SFG (Figure S6 in Supplement 1)on the mesial surface; age correlated inversely with reductions in
Figure 1. Maps of group differences in morphological measures of the cerebral surface. The signed Euclidean distances between points on the surfaces ofthe cortex for each participant and corresponding points on a template brain were compared statistically between the bulimia nervosa (BN) and controlgroups with linear regression at each voxel on the surface while covarying for age. Warm colors indicate significantly larger distances (local enlargements,outward deformations) in the BN versus control group; cool colors (blue and purple) indicate reduced distances (local indentations, inward deformations)in the BN versus control group. The color bar indicates p values corrected for multiple comparisons with a false discovery rate of p ! .05. The BN groupbrains were significantly reduced bilaterally in medial frontal (MFG) and precentral gyri (PreCg), in superior (SFG) and inferior frontal gyri (IFG) of the lefthemisphere, the postcentral gyrus (PoCg) of the right hemisphere, and bilateral temporoparietal areas (p values ¼ .01–.0001). Cu, cuneus; FG, fusiformgyrus; IPL, inferior parietal lobule; ITG, inferior temporal gyrus; LG, lingual gyrus; OCC, occipital cortex; PCC, posterior cingulate cortex; PreCu, precuneus;SPG, superior parietal gyrus.
R. Marsh et al. BIOL PSYCHIATRY 2013;]:]]]–]]] 3
www.sobp.org/journal

the BN but not the control subgroup in these areas. Age alsocorrelated inversely with reductions in right IPL and positivelywith enlargements in right SFG in the BN but not the controlsubgroup (Figure S6 in Supplement 1). Illness duration in the BNsubgroup correlated inversely with reductions in right IFG,bilateral MFG, IPL, occipital cortices, and CG (Figure S7 inSupplement 1).
Interactions of Diagnosis " Stroop Interference. The BNand control groups performed similarly on the Stroop task (TableS1 in Supplement 1). Nevertheless, significant interactions ofdiagnosis " Stroop interference scores on surface morphologywere detected in the IFG, MTG, and STG on the lateral surface ofthe left hemisphere; Stroop interference correlated inversely withreductions in the BN but not the control group (Figure 5).
Medication and Comorbidity Effects. After including currentSSRI treatment as an independent variable in a separate linearregression, local reductions in bilateral frontal cortices in the BNgroup remained unchanged from those depicted in Figure 1(Figure S8 in Supplement 1), indicating that SSRI treatment didnot have an appreciable effect on our findings. Likewise, neithera history of anorexia (Figure S9 in Supplement 1) nor currentdepressive symptoms (Figure S10 in Supplement 1) contributedto our findings.
Discussion
Significant reductions in local volumes of the cerebral surface inindividuals with BN predominated in frontal and temporoparietal
Figure 2. Group differences in surface measures of white matter. Shown here are color-coded maps comparing surface distances of white matter at eachcorresponding voxel of the brain of each participant from the corresponding voxel of the white matter surface in the template brain. The pattern ofdifferences across groups is similar to the pattern of statistical significance of those differences depicted in the maps of p values comparing surfacemeasures on the cerebral surface across groups (Figure 1), particularly in frontal regions on the lateral surface. These analyses suggest that the observedregional reductions of the cerebral surface in the BN group derived primarily from reductions in underlying white matter. Abbreviations as in Figure 1.
Figure 3. Correlations of cerebral surface morphology with objective bulimic episodes in the BN group. Warm colors (red and yellow) indicate positivecorrelations, and cool colors (blue and purple) indicate inverse correlations between surface measures and objective bulimic episodes within the past 28days before magnetic resonance imaging scan. Logarithmic transformations were used to reduce excessive skewness in this frequency variable. Surfacedistances (in millimeters from the corresponding point of the template brain), adjusted for age and duration of illness, are plotted on the y axis, and logtransformed objective bulimic episodes are plotted on the x axis. The scatterplots show greater reductions (larger indentations) in bilateral IFG, PreCG, andPoCg with more severe symptoms. Abbreviations as in Figure 1.
4 BIOL PSYCHIATRY 2013;]:]]]–]]] R. Marsh et al.
www.sobp.org/journal
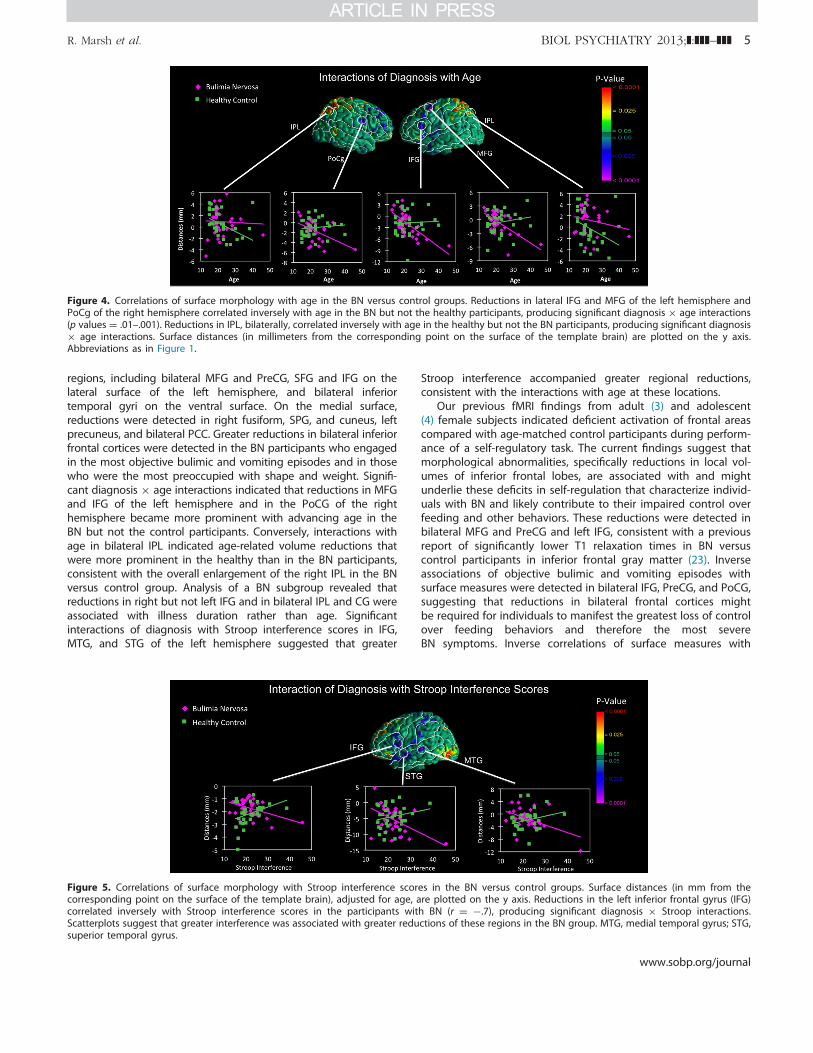
regions, including bilateral MFG and PreCG, SFG and IFG on thelateral surface of the left hemisphere, and bilateral inferiortemporal gyri on the ventral surface. On the medial surface,reductions were detected in right fusiform, SPG, and cuneus, leftprecuneus, and bilateral PCC. Greater reductions in bilateral inferiorfrontal cortices were detected in the BN participants who engagedin the most objective bulimic and vomiting episodes and in thosewho were the most preoccupied with shape and weight. Signifi-cant diagnosis " age interactions indicated that reductions in MFGand IFG of the left hemisphere and in the PoCG of the righthemisphere became more prominent with advancing age in theBN but not the control participants. Conversely, interactions withage in bilateral IPL indicated age-related volume reductions thatwere more prominent in the healthy than in the BN participants,consistent with the overall enlargement of the right IPL in the BNversus control group. Analysis of a BN subgroup revealed thatreductions in right but not left IFG and in bilateral IPL and CG wereassociated with illness duration rather than age. Significantinteractions of diagnosis with Stroop interference scores in IFG,MTG, and STG of the left hemisphere suggested that greater
Stroop interference accompanied greater regional reductions,consistent with the interactions with age at these locations.
Our previous fMRI findings from adult (3) and adolescent(4) female subjects indicated deficient activation of frontal areascompared with age-matched control participants during perform-ance of a self-regulatory task. The current findings suggest thatmorphological abnormalities, specifically reductions in local vol-umes of inferior frontal lobes, are associated with and mightunderlie these deficits in self-regulation that characterize individ-uals with BN and likely contribute to their impaired control overfeeding and other behaviors. These reductions were detected inbilateral MFG and PreCG and left IFG, consistent with a previousreport of significantly lower T1 relaxation times in BN versuscontrol participants in inferior frontal gray matter (23). Inverseassociations of objective bulimic and vomiting episodes withsurface measures were detected in bilateral IFG, PreCG, and PoCG,suggesting that reductions in bilateral frontal cortices mightbe required for individuals to manifest the greatest loss of controlover feeding behaviors and therefore the most severeBN symptoms. Inverse correlations of surface measures with
Figure 4. Correlations of surface morphology with age in the BN versus control groups. Reductions in lateral IFG and MFG of the left hemisphere andPoCg of the right hemisphere correlated inversely with age in the BN but not the healthy participants, producing significant diagnosis " age interactions(p values ¼ .01–.001). Reductions in IPL, bilaterally, correlated inversely with age in the healthy but not the BN participants, producing significant diagnosis" age interactions. Surface distances (in millimeters from the corresponding point on the surface of the template brain) are plotted on the y axis.Abbreviations as in Figure 1.
Figure 5. Correlations of surface morphology with Stroop interference scores in the BN versus control groups. Surface distances (in mm from thecorresponding point on the surface of the template brain), adjusted for age, are plotted on the y axis. Reductions in the left inferior frontal gyrus (IFG)correlated inversely with Stroop interference scores in the participants with BN (r ¼ #.7), producing significant diagnosis " Stroop interactions.Scatterplots suggest that greater interference was associated with greater reductions of these regions in the BN group. MTG, medial temporal gyrus; STG,superior temporal gyrus.
R. Marsh et al. BIOL PSYCHIATRY 2013;]:]]]–]]] 5
www.sobp.org/journal
participant ratings of their preoccupation with shape and weightwere detected in right PreCG, left MFG, and bilateral IFG,indicating the degree of reduction was related to the severityof the shape/weight concern characteristic of BN. The right IFGtypically activates during successful response inhibition in healthyindividuals (24–26) and is therefore implicated in supporting thecapacity for self-regulatory control. Individuals with BN, however,either deactivate (4) or activate IFG less than control participants(3) during a task of self-regulatory control. Although the relation-ship between structure and function is far from clear, we suspectthat both structural and functional deficits in this ventral (inferiorfrontal) attentional (27) and regulatory system are centrallyinvolved in the pathogenesis of BN.
We also detected volume reductions in left precuneus, rightcuneus, and SPG on the medial surface that derived primarilyfrom reductions in underlying white matter, consistent withrecent findings of reduced white matter in women with BN inright temporoparietal areas compared with control participants(5). Those findings were interpreted on the basis of insula-relatedbrain circuitry in eating disorders, given the fiber paths thatconnect temporal areas with the insula and PFC (28). We did notassess insular morphology, but insula circuit-based abnormalities—including white matter reductions in connected temporalregions—might contribute to altered self-perceptions (29,30) ofbody image in BN. Both precuneus (31) and PCC are implicated inself-awareness and mental imagery about the self, constitutingpart of the default mode network (DMN) of brain areas thatactivate during engagement in internally driven thoughts (32).We previously detected DMN deactivations in BN adolescentswhen performing a regulatory control task (4), a finding weattributed to their allocating attention to internally driventhoughts about eating or body image that preoccupy individualswith BN. Thus, volume reductions in these areas might contribute,in part, to excessive DMN deactivation during fMRI task perform-ance and the tendency of BN adolescents to attend to internallydriven thoughts. However, task-related deactivation of DMN isanalogous to its activation when engaged in internally driventhoughts, so such thoughts would likely produce activity-dependent hypertrophy rather than the reductions in precuneusand PCC we observed in the BN group. In addition, ratings ofpreoccupation with shape/weight did not correlate with reduc-tions in precuneus or PCC, a finding that would suggesthypoplasia rather than hypertrophy in those who engaged mostin internally driven thoughts about their bodies. Thus, unlike ourfindings of reductions in inferior frontal cortices, reductions inprecuneus and PCC are either unassociated with functionaldeficits in BN or, if associated, not detected herein.
Regional reductions of left MFG and IFG and right PoCGcorrelated inversely with age in the BN but not healthy partic-ipants (Figure 4). After controlling for illness duration in the BNgroup, these inverse age correlations remained in left IFG andMFG and were additionally detected in right IFG and CG, leftPreCG, SFG, MTG, and STG (Figure S6 in Supplement 1). Thesereductions became more prominent with age in the BN but notthe control group and might represent an abnormal develop-mental trajectory in BN, such as accelerated gray matter loss,axonal pruning, or reduced myelination. Illness duration wasassociated with reductions in bilateral occipital cortices and IPLand in right but not left IFG and CG. Reductions in left IFG, MTG,and STG correlated inversely with Stroop interference in the BNbut not the control group, suggesting that these reductionsmight have functional consequences for individuals with BN,contributing to their inability to self-regulate their feeding and
other behaviors. Stroop interference did not differ between theBN and control groups, consistent with previous behavioralfindings (33–35). Thus, our interpretation of these brain–behaviorassociations were not confounded by group differences inperformance (36). Right frontal activations during Stroop perform-ance increase over development in healthy individuals (25),consistent with the late maturation of frontal cortex (37) andright hemisphere dominance over attentional control (38).Abnormal maturation of left but not right frontal cortex, perhapsdue to reduced myelination, could therefore contribute to theinefficiency of these brain regions in the service of self-regulationover development in BN.
We previously speculated that deficient frontostriatal activa-tion in individuals with BN might contribute to their generalimpulsivity and inability to regulate feeding and other impulsivebehaviors (39,40) such as substance abuse (41) and self-harmbehaviors (42). Impulsivity correlated inversely with surfacemorphology in left IFG and PreCG and bilateral MFG (Figure S4in Supplement 1). Healthy individuals engage both right (24–26)and left (43) IFG during successful response inhibition on fMRImeasures of impulsivity in healthy individuals. Our fMRI findingssuggest that both adolescents and adults with BN fail to activateright IFG, but adolescents deactivate left IFG during successfulresponse inhibition. Perhaps functional and anatomical abnor-malities in left inferior frontal cortices arise early in the course ofBN and are associated with the greater impulsivity in BN versushealthy adolescents (44), consistent with the effects of illnessduration detected in right IFG. These effects were also detected inright MFG and CG (Figure S7 in Supplement 1), suggesting thatadditional reductions in right frontal regions might be due tochronic illness. Future longitudinal imaging studies of adolescentswith BN, beginning at illness onset, are required to furtherdisentangle the effects of age and illness duration on thestructural and functional maturation of frontal cortices in BN.
Magnetic resonance imaging cannot directly inform ourunderstanding of the cellular changes (e.g., synaptic pruning,myelination) that contribute to brain development. However, ouradditional analyses of white matter suggested that the reductionsin frontal brain volumes in the BN group derived primarily fromreductions in underlying white matter (i.e., the reductions infrontal volumes [Figure 1] were detected in the same locations asthose detected on white matter [Figure 2]). Healthy braindevelopment involves both increases in synaptic pruning andmyelination over adolescence and young adulthood (45). Greatersynaptic pruning over development in BN compared with healthyindividuals would manifest as greater reductions in frontal graymatter with increasing age in BN and more efficient processing.More axonal pruning or less myelination, in contrast, wouldcontribute to reductions in white matter with increasing age inBN and less efficient processing, consistent with fMRI findingsfrom these BN participants. Future longitudinal diffusion tensorimaging studies could confirm the presence of age-relatedreductions in white matter and offer an additional explanationfor impaired self-regulation during development in BN, becausemyelination is thought to enhance the speed of the transmissionof information and, hence, age-related improvements in cogni-tion (45).
Although the largest anatomical study and only study of themorphological features of the cerebral surface in individuals withBN to date, this study is limited nevertheless by a modest samplesize and cross-sectional design. In addition, our BN sample washeterogeneous in symptom severity, and participants were atdiffering stages of treatment. Moreover, we did not account for
6 BIOL PSYCHIATRY 2013;]:]]]–]]] R. Marsh et al.
www.sobp.org/journal
menstrual status, which can affect neural functioning in women(46), but we have no reason to suspect that menstrual statusdiffered systematically across the BN and control groups toconfound our findings.
Future longitudinal studies comparing brain development inBN and healthy adolescents, beginning at illness onset, arerequired to determine whether our cross-sectional findings ofage-related reductions in inferior frontal volumes representneurodevelopmental abnormalities in BN or effects of chronicillness on brain structure. Inclusion of a group of individuals withanorexia nervosa in such a study would allow assessment of howbrain maturation differs across eating disorders. Identification ofatypical neurodevelopmental trajectories in the structure/functionof inferior frontal cortices in BN would then warrant developmentof early interventions aimed at bolstering their functioning.Finally, future studies should analyze the surface morphology ofstriatal structures in BN to determine whether reductions orenlargements in the dorsolateral putamen, for example, couldcontribute to functional abnormalities in habit learning (47),thereby explaining why the binge-eating behaviors in BN tendto crystalize into maladaptive habits.
This work was supported in part by National Institute of MentalHealth grants K01-MH077652 and R01MH090062, grant from theNational Alliance for Research on Schizophrenia and Depression,and funding from the Sackler Institute for Developmental Psycho-biology, Columbia University.
Dr. Walsh receives research support from AstraZeneca andDr. Peterson receives investigator-initiated funding from Eli Lillyand Pfizer. All other authors report no biomedical financial interests.All authors report no potential conflicts of interest.
Supplementary material cited in this article is available online athttp://dx.doi.org/10.1016/j.biopsych.2013.07.017.
1. Walsh BT, Klein DA (2003): Eating disorders. Int Rev Psychiatry 15:205–216.
2. Kaye W, Strober M, Jimerson DC (2004): The neurobiology of eatingdisorders. In: Charney D, Nestler EJ, editors. The Neurobiology of MentalIllness. New York: Oxford Press, 1112–1128.
3. Marsh R, Steinglass JE, Gerber AJ, O’Leary KG, Walsh BT, Peterson BS(2009): Deficient activity in the neural systems that mediate self-regulatory control in bulimia nervosa. Arch Gen Psychiatry 66:1–13.
4. Marsh R, Horga G, Wang Z, Wang P, Klahr KW, Berner LA, et al. (2011):An FMRI study of self-regulatory control and conflict resolution inadolescents with bulimia nervosa. Am J Psychiatry 168:1210–1220.
5. Frank GK, Shott ME, Hagman JO, Mittal VA (2013): Alterations in brainstructures related to taste reward circuitry in ill and recoveredanorexia nervosa and in bulimia nervosa [published online ahead ofprint May 17]. Am J Psychiatry.
6. Schafer A, Vaitl D, Schienle A (2010): Regional grey matter volumeabnormalities in bulimia nervosa and binge-eating disorder. Neuro-image 50:639–643.
7. Joos A, Kloppel S, Hartmann A, Glauche V, Tuscher O, Perlov E, et al.(2010): Voxel-based morphometry in eating disorders: Correlation ofpsychopathology with grey matter volume. Psychiatry Res 182:146–151.
8. Bansal R, Staib LH, Laine AF, Hao X, Xu D, Liu J, et al. (2012):Anatomical brain images alone can accurately diagnose chronicneuropsychiatric illnesses. PLoS One 7:e50698.
9. Peterson BS, Warner V, Bansal R, Zhu H, Hao X, Liu J, et al. (2009):Cortical thinning in persons at increased familial risk for majordepression. Proc Natl Acad Sci U S A 106:6273–6278.
10. Sobel LJ, Bansal R, Maia TV, Sanchez J, Mazzone L, Durkin K, et al.(2010): Basal ganglia surface morphology and the effects of stimulantmedications in youth with attention deficit hyperactivity disorder. AmJ Psychiatry 167:977–986.
11. Peterson BS, Choi HA, Hao X, Amat JA, Zhu H, Whiteman R, et al.(2007): Morphologic features of the amygdala and hippocampus inchildren and adults with Tourette syndrome. Arch Gen Psychiatry 64:1281–1291.
12. Stroop JR (1935): Studies of interference in serial verbal reactions. JExp Psychology 18:643–662.
13. Sled JG, Zijdenbos AP, Evans AC (1998): A nonparametric method forautomatic correction of intensity nonuniformity in MRI data. IEEE TransMed Imaging 17:87–97.
14. Shattuck DW, Leahy RM (2002): BrainSuite: An automated corticalsurface identification tool. Med Image Anal 6:129–142.
15. Shrout PE, Fleiss JL (1979): Intraclass correlations: Uses in assessingrater reliability. Psychological Bulletin 86:420–428.
16. Rauh VA, Perera FP, Horton MK, Whyatt RM, Bansal R, Hao X, et al.(2012): Brain anomalies in children exposed prenatally to acommon organophosphate pesticide. Proc Natl Acad Sci U S A 109:7871–7876.
17. Bansal R, Staib LH, Whiteman R, Wang YM, Peterson BS (2005): ROC-based assessments of 3D cortical surface-matching algorithms. Neuro-image 24:150–162.
18. Plessen KJ, Bansal R, Zhu H, Whiteman R, Amat J, Quackenbush GA,et al. (2006): Hippocampus and amygdala morphology in attention-deficit/hyperactivity disorder. Arch Gen Psychiatry 63:795–807.
19. Haralick R, Shapiro L (1992): Computer and Robot Vision. Boston:Adison-Wesley Publishing Company, Chapter 5.
20. Golden CJ (1978): Stroop Color and Word Test: A Manual for Clinical andExperimental Uses. Wood Dale, IL: Stoelting.
21. Peterson BS, Kane MJ, Alexander GM, Lacadie C, Skudlarski P, LeungHC, et al. (2002): An event-related functional MRI study comparinginterference effects in the Simon and Stroop tasks. Brain Res CognBrain Res 13:427–440.
22. Walsh BT, Wilson GT, Loeb KL, Devlin MJ, Pike KM, Roose SP, et al.(1997): Medication and psychotherapy in the treatment of bulimianervosa. Am J Psychiatry 154:523–531.
23. Hoffman GW, Ellinwood EH Jr, Rockwell WJ, Herfkens RJ, Nishita JK,Guthrie LF (1990): Brain T1 measured by magnetic resonance imagingin bulimia. Biol Psychiatry 27:116–119.
24. Rubia K, Smith AB, Brammer MJ, Taylor E (2003): Right inferiorprefrontal cortex mediates response inhibition while mesial prefrontalcortex is responsible for error detection. Neuroimage 20:351–358.
25. Marsh R, Zhu H, Schultz RT, Quackenbush G, Royal J, Skudlarski P, et al.(2006): A developmental fMRI study of self-regulatory control. HumBrain Mapp 27:848–863.
26. Chambers CD, Garavan H, Bellgrove MA (2009): Insights into theneural basis of response inhibition from cognitive and clinical neuro-science. Neurosci Biobehav Rev 33:631–646.
27. Corbetta M, Shulman GL (2002): Control of goal-directed and stimulus-driven attention in the brain. Nat Rev Neurosci 3:201–215.
28. Kucyi A, Moayedi M, Weissman-Fogel I, Hodaie M, Davis KD (2012):Hemispheric asymmetry in white matter connectivity of the temporopar-ietal junction with the insula and prefrontal cortex. PLoS One 7:e35589.
29. Critchley HD, Wiens S, Rotshtein P, Ohman A, Dolan RJ (2004): Neuralsystems supporting interoceptive awareness. Nat Neurosci 7:189–195.
30. Craig AD (2009): How do you feel—now? The anterior insula andhuman awareness. Nat Rev Neurosci 10:59–70.
31. Cavanna AE, Trimble MR (2006): The precuneus: A review of itsfunctional anatomy and behavioural correlates. Brain 129:564–583.
32. Greicius MD, Krasnow B, Reiss AL, Menon V (2003): Functionalconnectivity in the resting brain: A network analysis of the defaultmode hypothesis. Proc Natl Acad Sci U S A 100:253–258.
33. Alvarez-Moya EM, Jimenez-Murcia S, Moragas L, Gomez-Pena M,Aymami MN, Ochoa C, et al. (2009): Executive functioning amongfemale pathological gambling and bulimia nervosa patients: prelimi-nary findings. J Int Neuropsychol Soc 15:302–306.
34. Brand M, Franke-Sievert C, Jacoby GE, Markowitsch HJ, Tuschen-CaffierB (2007): Neuropsychological correlates of decision making in patientswith bulimia nervosa. Neuropsychology 21:742–750.
35. Van den Eynde F, Guillaume S, Broadbent H, Stahl D, Campbell IC,Schmidt U, et al. (2011): Neurocognition in bulimic eating disorders: Asystematic review. Acta Psychiatr Scand 124:120–140.
36. Wilkinson D, Halligan P (2004): The relevance of behavioural mea-sures for functional-imaging studies of cognition. Nat Rev Neurosci 5:67–73.
R. Marsh et al. BIOL PSYCHIATRY 2013;]:]]]–]]] 7
www.sobp.org/journal

37. Gogtay N, Giedd JN, Lusk L, Hayashi KM, Greenstein D, Vaituzis AC,et al. (2004): Dynamic mapping of human cortical development duringchildhood through early adulthood. Proc Natl Acad Sci U S A 101:8174–8179.
38. Garavan H, Ross TJ, Stein EA (1999): Right hemispheric dominance ofinhibitory control: An event-related functional MRI study. Proc NatlAcad Sci U S A 96:8301–8306.
39. Kaye WH, Frank GK, Meltzer CC, Price JC, McConaha CW, Crossan PJ,et al. (2001): Altered serotonin 2A receptor activity in women whohave recovered from bulimia nervosa. Am J Psychiatry 158:1152–1155.
40. Tiihonen J, Keski-Rahkonen A, Lopponen M, Muhonen M, Kajander J,Allonen T, et al. (2004): Brain serotonin 1A receptor binding in bulimianervosa. Biol Psychiatry 55:871–873.
41. Holderness CC, Brooks-Gunn J, Warren MP (1994): Co-morbidity ofeating disorders and substance abuse review of the literature. Int J EatDisord 16:1–34.
42. Paul T, Schroeter K, Dahme B, Nutzinger DO (2002): Self-injuriousbehavior in women with eating disorders. Am J Psychiatry 159:408–411.
43. Swick D, Ashley V, Turken AU (2008): Left inferior frontal gyrus iscritical for response inhibition. BMC Neurosci 9:102.
44. Kaltiala-Heino R, Rissanen A, Rimpela M, Rantanen P (2003): Bulimiaand impulsive behaviour in middle adolescence. Psychother Psycho-som 72:26–33.
45. Marsh R, Gerber AJ, Peterson BS (2008): Neuroimaging studies ofnormal brain development and their relevance for understandingchildhood neuropsychiatric disorders. J Am Acad Child AdolescPsychiatry 47:1233–1251.
46. Dreher JC, Schmidt PJ, Kohn P, Furman D, Rubinow D, Berman KF(2007): Menstrual cycle phase modulates reward-related neuralfunction in women. Proc Natl Acad Sci U S A 104:2465–2470.
47. Packard MG, Knowlton BJ (2002): Learning and memory functions ofthe Basal Ganglia. Annu Rev Neurosci 25:563–593.
8 BIOL PSYCHIATRY 2013;]:]]]–]]] R. Marsh et al.
www.sobp.org/journal