analyzing soil water repellency phenomena
TRANSCRIPT
Analyzing soil water repellency phenomena
Vorgelegt von Diplom Ingenieur für technischen Umweltschutz
Karsten Täumer aus Berlin
Von der Fakultät VI der Technischen Universität Berlin
zur Erlangung des akademischen Grades Doktor der Ingenieurwissenschaften
Dr.-Ing.
genehmigte Dissertation
Promotionsausschuss: Vorsitzender: Prof. Dr. Dr. Berndt-Michael Wilke Berichter: Prof. Dr. Gerd Wessolek Berichter: Prof. Dr. Jörg Bachmann Tag der wissenschaftlichen Aussprache: 26.03.2007
Berlin 2007
D 83
Table of contents Preface ________________________________________________________ 11. Introduction_________________________________________________ 2
1.1 Impact of water repellency on water movement in soils _________________________2
1.2 Objectives of this thesis ____________________________________________________3
1.3 Study site Berlin Buch_____________________________________________________5
2. Part I - Determination of Repellency Distribution Using Soil Organic Matter and Water Content ________________________________________ 10
2.1 Abstract ___________________________________________________________________10
2.2 Introduction _______________________________________________________________10
2.3 Material and Methods _______________________________________________________122.3.1 Soil sampling __________________________________________________________________ 122.3.2 Laboratory measurements_________________________________________________________ 12
2.4 Results and Discussion _______________________________________________________132.4.1 Actual and potential water repellency________________________________________________ 132.4.2 Spatial distribution and preferential pathways _________________________________________ 152.4.3 Transition zone and influence of soil organic matter ____________________________________ 16
3. Part II - Seasonal dynamics of preferential flow in a water repellent soil203.1 Abstract ___________________________________________________________________20
3.2 Introduction _______________________________________________________________20
3.3 Materials and methods_______________________________________________________223.3.1 Soil sampling __________________________________________________________________ 223.3.2 TDR measurements _____________________________________________________________ 233.3.3 Specifying preferential flow from TDR measurements __________________________________ 253.3.4 Calculation of the ‘effective cross section’____________________________________________ 25
3.4 Results and Discussion _______________________________________________________283.4.1 Soil sampling - spatial distribution of the soil water content ______________________________ 283.4.2 TDR data______________________________________________________________________ 303.4.3 Heterogeneity __________________________________________________________________ 323.4.4 Predictions of preferential flow ____________________________________________________ 33
4. Part III - Stability of flow patterns in water repellent soils - conclusions of a time delayed double tracer experiment and TDR measurements ______ 36
4.1 Abstract _______________________________________________________________36
4.2 Introduction ____________________________________________________________37
4.3 Material and methods________________________________________________________394.3.2 Laboratory measurements_________________________________________________________ 394.3.3 Calculation of climate water balance and percolation rate ________________________________ 404.3.4 TDR measurements and effective cross section. _______________________________________ 414.3.5 Tracer application and soil sampling ________________________________________________ 41
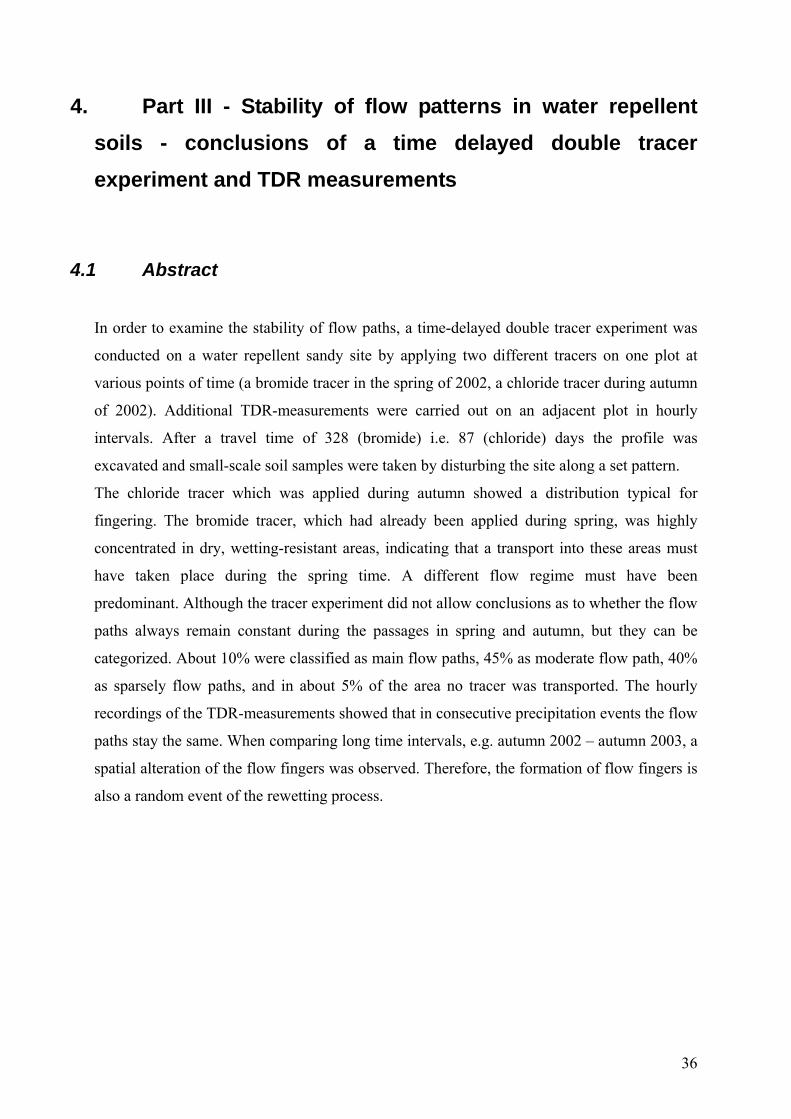
4.4 Results and discussion _______________________________________________________434.4.1 Climate water balance and percolation during the experiment_____________________________ 434.4.2 Results of TDR measurements, shift of flow paths _____________________________________ 444.4.3 Water content and water repellency _________________________________________________ 464.4.4 Tracer transport_________________________________________________________________ 47

5. Conclusions ________________________________________________ 545.1 Part I - Repellency and moisture_______________________________________________54
5.2 Part II - Appearance and vanishing of water repellency – the annual cycle____________56
5.3 Part III - Stability of flow pattern – shifting of flow fingers_________________________57
6. Synthesis and Outlook________________________________________ 59References ____________________________________________________ 62Acknowledgements______________________________________________ 68
Preface
In April 2001, the research project interurban was initiated. The project is a cooperative effort
of the Technical University of Berlin and the Free University of Berlin, combining the
departments of soil sciences, soil chemistry, water quality control, environmental chemistry,
microbiology, soil zoology, and applied geophysics. The project is sponsored by the German
Research Council (DFG) as research group 409, "Water and Organic Matter in Anthropogenic
Soils: Dynamics and Processes". This project was formed in order to study the dynamics of
water and materials at urban locations while giving special consideration to spatial
heterogeneity, organic soil substance, and soil-biological transformation processes.
The aim of the subproject “soil” is the analysis of the water flow and solute dynamics in
heterogeneous urban areas. One of the main objectives of the study at hand within the
framework of the project was to examine the soil physical and chemical characterisation of
the sites, including the analysis of the spatial distribution of the hydraulic functions (saturated
/ unsaturated conductivity), bulk density, as well as the availability of heavy metals and
nutrients, pH value, organic matter content, the desorption characteristics and water
repellency. In the case of concerted samplings, these parameters were provided for all sub-
projects and the experiments were complemented by the detailed chemical and biological
analysis of the other subprojects.
Another focal point of the study was the installation and maintenance of the measurement
areas at the research sites. These areas were equipped with automated TDR- devices and
tensiometers, providing continuous water content and tension readings, so that the water
movement through the soils could be observed with high spatial and temporal resolution.
Apart from the information about water and solute transport in the soils, we worked on the
improvement of non-destructive soil-physical and geophysical methods, such as GPR,
geoelectrics and NMR, making it possible to detect and observe small-scale rapid water
content changes in the soils. For this aim, these geophysical measurements (which are
commonly used on a bigger scale) were calibrated by the TDR- and gravimetric water content
measurements.
The two main research sites were the Tiergarten park in the centre of Berlin and the former
sewage fields at the northern city limit. The Tiergarten park is an example for a highly
frequented park and recreation area in an urban environment. The former sewage fields show
the rapid ecological adaptation processes due to land changes. This site is indicative for the
problems of intensive commercial use and pollution.
1
From the start of the project in April 2001 it became clear that our research sites show a very
interesting behaviour: water repellency. We detected sharply zoned moisture patterns in the
topsoil, easily visible by the dark colour of the moist and wettable soil and the light colour of
the dry and water repellent soil. Water repellency leads to time depending preferential flow
with large impact on the solute transport. The repellent parts of the soil remain dry also during
rainfall events and are excluded from the flow regime in the soil. This phenomenon drew my
attention and I tried to characterize the factors which influence the occurrence of water
repellency. The studies of this work were carried out on the research site Berlin Buch – a
former sewage farm land.
1. Introduction
1.1 Impact of water repellency on water movement in soils Water repellency is a wide spread phenomenon and numerous papers were published on its
hydrological impact and occurrence in the soil. Water repellent soils were reported all over
the world, e.g. in the Netherlands by Ritsema and Dekker (2003), in Spain by Moral Garcia et.
al (2003), in the USA and Columbia by Jaramillo et. al. (2000), in South Africa by Scott
(2000), in the United Kingdom by York and Cannaway (2000), and in Germany by Buczko et
al. (2005).
The water repellent spots at our research sites were found in the topsoil, mainly in the humus-
rich root zone at a depth of 10-30 cm. The soil in this layer is either wettable or strongly water
repellent. The wettable areas appear as dark spots, the water repellent areas as dry spots (Fig.
1.1). The water repellent soil regions are not accessible for water; they stay dry for long
periods. The rewetting process in these water repellent areas takes a few days or weeks. Thus,
the amount of water - accessible soil volume and, consequently, the plant-available water in
the root zone, which is already low in that sandy soil - is more restricted. Due to the texture
and water repellence of the topsoil, the rainfall infiltrates the soil in unstable wetting fronts,
bypasses most of the soil matrix in flow-fingers, and seeps into the deeper layers. Water
repellent soils have been associated with preferential flow decades ago (Jamison, 1945; Bond,
1964). Preferential flow paths create a spatial variability in soil moisture, effecting the plant
growth, solute transport and ground water recharge (Dekker and Ritsema, 1994).
2
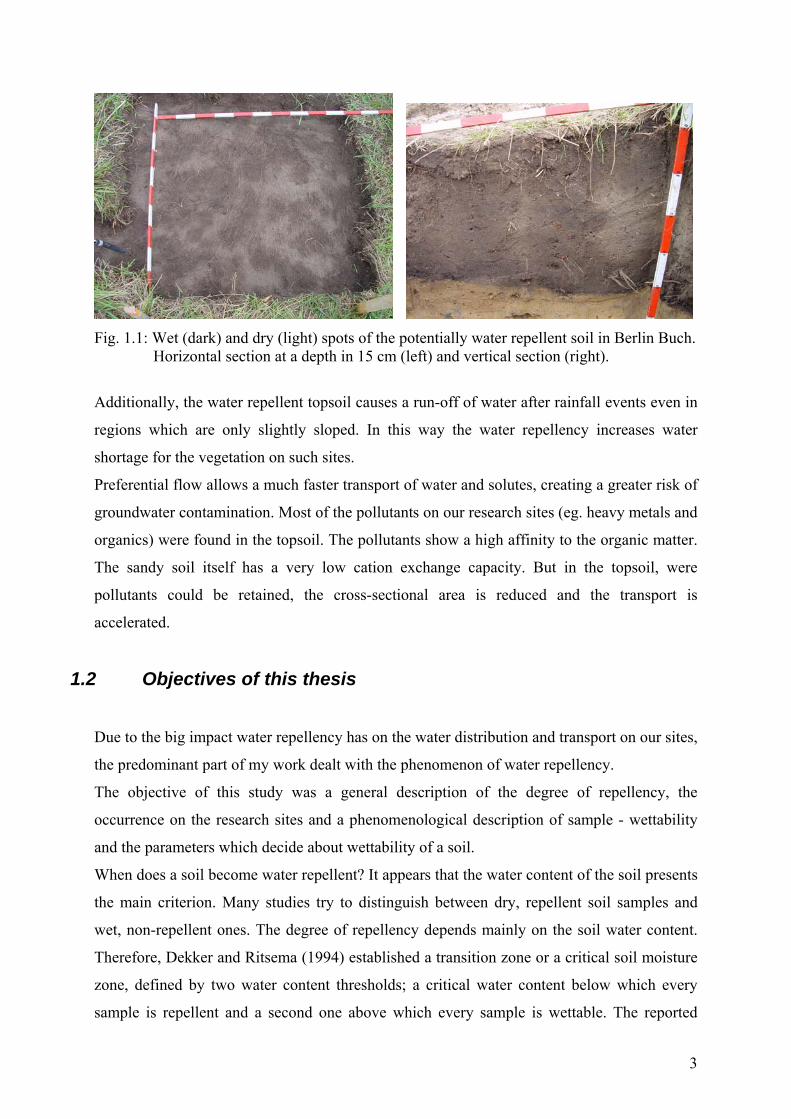
Fig. 1.1: Wet (dark) and dry (light) spots of the potentially water repellent soil in Berlin Buch.
Horizontal section at a depth in 15 cm (left) and vertical section (right).
Additionally, the water repellent topsoil causes a run-off of water after rainfall events even in
regions which are only slightly sloped. In this way the water repellency increases water
shortage for the vegetation on such sites.
Preferential flow allows a much faster transport of water and solutes, creating a greater risk of
groundwater contamination. Most of the pollutants on our research sites (eg. heavy metals and
organics) were found in the topsoil. The pollutants show a high affinity to the organic matter.
The sandy soil itself has a very low cation exchange capacity. But in the topsoil, were
pollutants could be retained, the cross-sectional area is reduced and the transport is
accelerated.
1.2 Objectives of this thesis
Due to the big impact water repellency has on the water distribution and transport on our sites,
the predominant part of my work dealt with the phenomenon of water repellency.
The objective of this study was a general description of the degree of repellency, the
occurrence on the research sites and a phenomenological description of sample - wettability
and the parameters which decide about wettability of a soil.
When does a soil become water repellent? It appears that the water content of the soil presents
the main criterion. Many studies try to distinguish between dry, repellent soil samples and
wet, non-repellent ones. The degree of repellency depends mainly on the soil water content.
Therefore, Dekker and Ritsema (1994) established a transition zone or a critical soil moisture
zone, defined by two water content thresholds; a critical water content below which every
sample is repellent and a second one above which every sample is wettable. The reported
3
water contents for these thresholds vary widely if different samples are analysed. Doerr and
Thomas (2003), for example, measured a transition zone of 0.14 to 0.22 g·g-1. Dekker et al.
(2003), Dekker et al. (2001) and Ziogas et al. (2003) found transition zones within a range of
0.05 to 0.06 cm·cm-1, if the soil was sampled in fine layers. The transition zone and its critical
water thresholds is an important parameter for flow and transport models of water repellent
soils (Ritsema and Dekker 2003). By measuring the actual water content of the soil samples,
these models use the transition zone i.e. the critical water content to predict the soil water
repellency. However, a differentiation between wettable and repellent samples using the
critical water contents leads to a high number of unclear or wrong cases.
The aim of my work was to improve the understanding of the transition zone in order to
achieve a distinct separation between repellent and wettable soil samples using the water
content as the cut-off criterion. For this aim, several thousand field-moist samples were taken
with high spatial resolution and analysed subsequently. In addition to the water content and
water repellency, the samples were analysed for other properties. The results are presented in
chapter 2 of this work.
Supplementary to the work on the transition zone, the dynamics of water repellency and its
hydrological impact on our research sites was of interest to us. To this end we have conducted
several samplings on our sites during different seasons and, consequently, at different actual
soil moistures. The aim was to quantify the seasonal dynamics of preferential flow under field
conditions. The ‘effective cross section’ is introduced as a new parameter to describe the area
share of the flow paths and the water repellent soil volume. The quantification of the
parameter’s seasonal variation allows the effect of water repellency to be included into
seasonal modeling of water and solute movement. For this purpose I compared the results of
a complex sampling campaign consisting of 32 single samplings at different seasons and
different locations on our research site with the moisture content readings of a TDR array
recording the soil moisture contents continuously at one site. The effective cross section was
determined for a cross sectional area in 20 cm depth by two different approaches: the visible
area share of the wettable soil in that depth (sampling approach) and the analysis of the TDR-
readings after rainfall events (TDR-approach). The results of this work are presented in
chapter 3.
In April 2002 we started to conduct a tracer experiment. One objective was to verify the
effective cross section approach and to collect information about the spatial alteration of flow
fingers. Based on the chemical characterization of the samples we took on our sites, we were
4
convinced that changes in the flow finger position must take place. No significant difference
in soil properties was measurable between wettable and water repellent samples.
A time delayed double tracer experiment was conducted in order to study the solute transport.
Two inorganic conservative tracer solutions were applied at two different times on the surface
of a 5 m² plot. The first tracer – a bromide tracer – was applied in April 2002. At that time –
just before the growing season - a soil reaches the highest saturation, the effective cross
section is at a maximum, the flow conditions can be assumed as nearly piston flow. In
October 2002 a second tracer - chloride - was applied on the same plot. In January 2003 the
samples were taken and the concentrations of the two tracers were analyzed. Although the
tracer experiment gave us no information about a possible shifting of flow fingers, the
dynamics of water repellency were ascertained and the soil regions of the tracer profile were
classified into main flow path, moderate flow path, sparsely flow path and no flow region. We
established a strong evidence for spatial alteration of flow fingers from the TDR readings
which were collected continuously at a neighbouring site. The hourly recordings of the TDR-
measurements showed that the flow paths remain stable in consecutive precipitation events.
When comparing long time intervals, e.g. autumn 2002 – autumn 2003, a spatial alteration of
the flow fingers was observed. The results of these experiments are presented in chapter 4.
1.3 Study site Berlin Buch
The two main research sites are the Tiergarten park in the centre of Berlin and the former
sewage fields at the northern city limit. The Tiergarten park is an example for an highly
frequented park and recreation area in the urban environment. The former sewage fields show
the rapid ecological adaptation processes due to land changes. This site is indicative for the
problems of an intensive commercial use and pollution. Since the 1990’s the sewage farm
land was investigated in different projects with participation of the dep. of soil science in
order to develop and preserve this contaminated site. Assessing the risks originating from this
site was the focus of the past projects. The amount and release of pollutants, esp. the release
of heavy metals by mineralization of organic matter and the transport into the ground water
were examined. Hoffmann (2002) measured rapid turnover processes of organic matter and an
increased leaching of heavy metals and nitrate. Small scale heterogeneities and the water
repellency on the site remained unsolved problems of recent studies. The following chapters
present results based on experiments and samplings on the site Berlin Buch.
5
General
The study site Berlin Buch is located at the northern city limit of Berlin (13°30’ western
longitude and 52°40’). The climate is mild-temperate with an annual average temperature of
approximately 9.3°C and an annual rainfall of 580mm. The rainfall is evenly distributed over
the year. During spring and summer the water uptake and the evapotranspiration lead to a
negative water balance – the soil dries out. In autumn and winter the water balance is positive
- a recharge of the soil pore water takes place. The site is part of the marl sediments ground
moraine of the ‘Barnim’ – a remnant of the Saalian glacial epoch in the Pleistocene, 230.000
– 110.000 years ago. The marl sediments are overlaid by fluvial sands of the Frankfurt stage
of the Weichselian glacial epoch, 15.000 years ago. The thickness of the fluvial sands on the
site ranges from 4 to 6 m. These fluvial sands dominate the soil-properties of the site.
History
In 1905 our research site became part of the approximately 13000 ha of sewage farm land
around Berlin. Untreated municipal and industrial wastewater was applied on the sewage
fields. During the first decades these sewage farms were used for agricultural production,
following the principle of a closed nutrient cycle proposed by Justus von Liebig. The fields
were irrigated through furrows and vegetables, fruits and pasture were cultivated. Later, rising
amounts of wastewater and the accumulation of pollutants such as heavy metals made it
necessary to infiltrate wastewater without taking agricultural targets into account. In the
1960’s the walls of the sewage fields basins were raised and up to 10000 mm·a-1 of waste
water were applied.
In 1985, when the wastewater treatment plant Schönerlinde was connected, the wastewater
application was stopped abruptly. The basin walls of the sewage fields were levelled and an
effort was made to afforest the site. Most of the trees died, mainly due to water shortage
during summer time, nutrient deficiencies and heavy metal contamination (Schlenther et al.,
1996).
6
Site properties
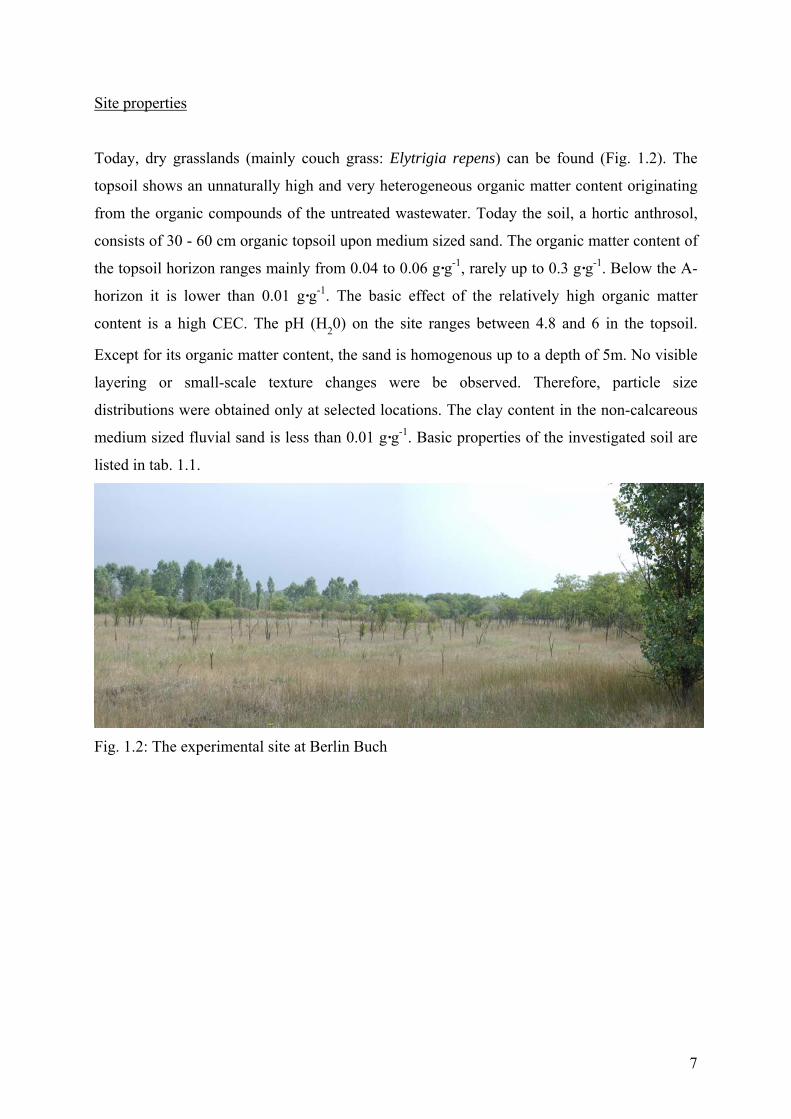
Today, dry grasslands (mainly couch grass: Elytrigia repens) can be found (Fig. 1.2). The
topsoil shows an unnaturally high and very heterogeneous organic matter content originating
from the organic compounds of the untreated wastewater. Today the soil, a hortic anthrosol,
consists of 30 - 60 cm organic topsoil upon medium sized sand. The organic matter content of
the topsoil horizon ranges mainly from 0.04 to 0.06 g·g-1, rarely up to 0.3 g·g-1. Below the A-
horizon it is lower than 0.01 g·g-1. The basic effect of the relatively high organic matter
content is a high CEC. The pH (H20) on the site ranges between 4.8 and 6 in the topsoil.
Except for its organic matter content, the sand is homogenous up to a depth of 5m. No visible
layering or small-scale texture changes were be observed. Therefore, particle size
distributions were obtained only at selected locations. The clay content in the non-calcareous
medium sized fluvial sand is less than 0.01 g·g-1. Basic properties of the investigated soil are
listed in tab. 1.1.
Fig. 1.2: The experimental site at Berlin Buch
7
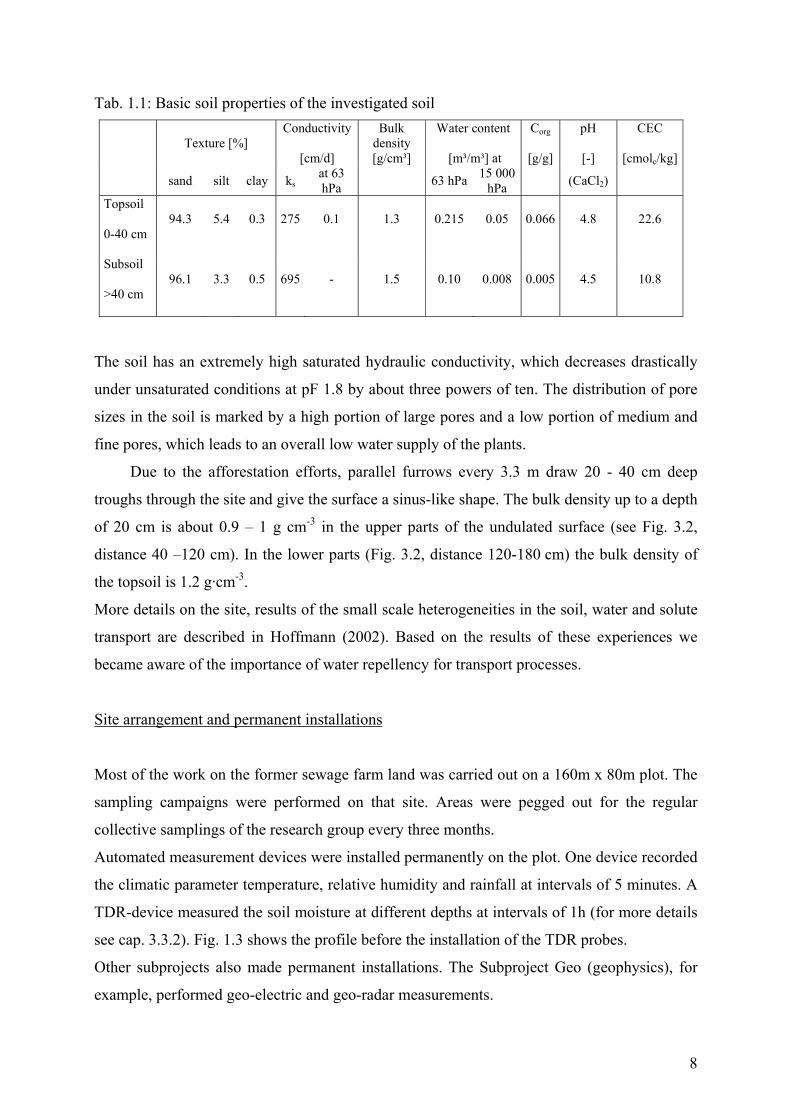
Tab. 1.1: Basic soil properties of the investigated soil
Texture [%] Conductivity
[cm/d]
Bulk density [g/cm³]
Water content
[m³/m³] at
Corg
[g/g]
pH
[-]
CEC
[cmolc/kg] sand silt clay ks
at 63 hPa 63 hPa 15 000
hPa (CaCl2)
Topsoil
0-40 cm 94.3 5.4 0.3 275 0.1 1.3 0.215 0.05 0.066 4.8 22.6
Subsoil
>40 cm 96.1 3.3 0.5 695 - 1.5 0.10 0.008 0.005 4.5 10.8
The soil has an extremely high saturated hydraulic conductivity, which decreases drastically
under unsaturated conditions at pF 1.8 by about three powers of ten. The distribution of pore
sizes in the soil is marked by a high portion of large pores and a low portion of medium and
fine pores, which leads to an overall low water supply of the plants.
Due to the afforestation efforts, parallel furrows every 3.3 m draw 20 - 40 cm deep
troughs through the site and give the surface a sinus-like shape. The bulk density up to a depth
of 20 cm is about 0.9 – 1 g cm-3 in the upper parts of the undulated surface (see Fig. 3.2,
distance 40 –120 cm). In the lower parts (Fig. 3.2, distance 120-180 cm) the bulk density of
the topsoil is 1.2 g·cm-3.
More details on the site, results of the small scale heterogeneities in the soil, water and solute
transport are described in Hoffmann (2002). Based on the results of these experiences we
became aware of the importance of water repellency for transport processes.
Site arrangement and permanent installations
Most of the work on the former sewage farm land was carried out on a 160m x 80m plot. The
sampling campaigns were performed on that site. Areas were pegged out for the regular
collective samplings of the research group every three months.
Automated measurement devices were installed permanently on the plot. One device recorded
the climatic parameter temperature, relative humidity and rainfall at intervals of 5 minutes. A
TDR-device measured the soil moisture at different depths at intervals of 1h (for more details
see cap. 3.3.2). Fig. 1.3 shows the profile before the installation of the TDR probes.
Other subprojects also made permanent installations. The Subproject Geo (geophysics), for
example, performed geo-electric and geo-radar measurements.
8
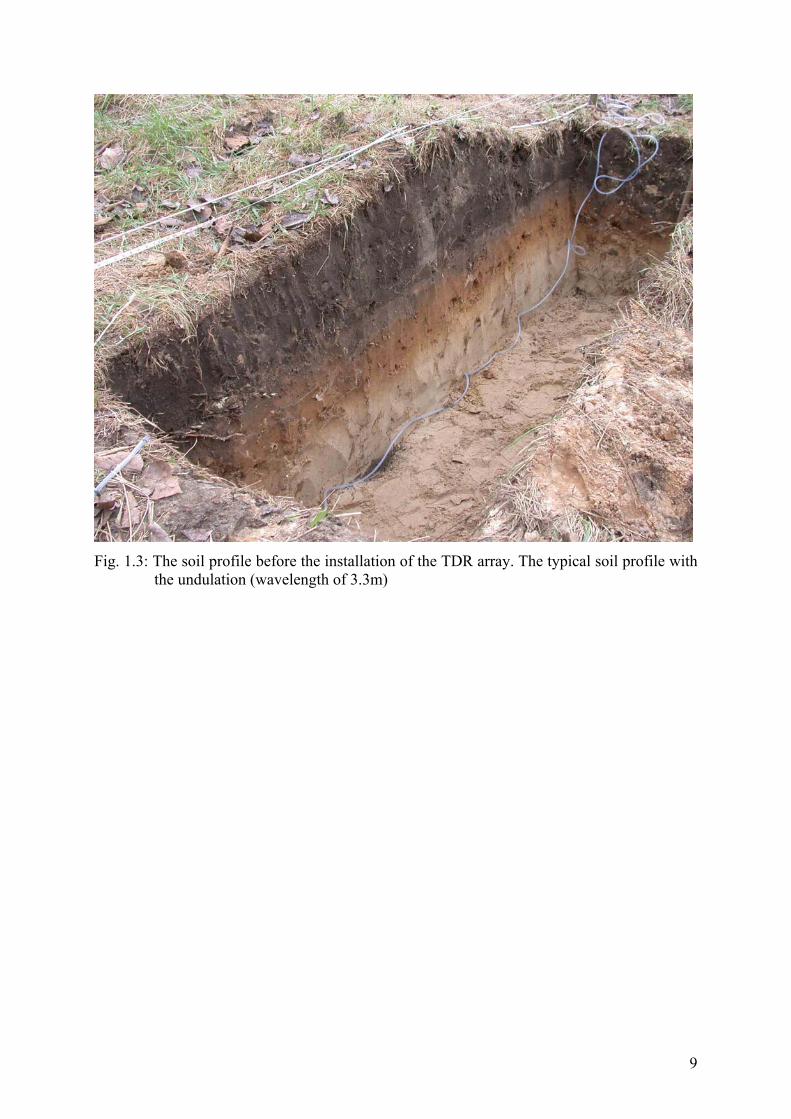
Fig. 1.3: The soil profile before the installation of the TDR array. The typical soil profile with
the undulation (wavelength of 3.3m)
9
2. Part I - Determination of Repellency Distribution Using Soil Organic Matter and Water Content
2.1 Abstract The aim of this study is to investigate the effect of soil moisture and soil organic matter
content on the water repellency of a former sewage field. A topsoil block (40x 80x 30 cm)
and a soil transect (300 cm x 100 cm) from a former wastewater infiltration site near Berlin
were sampled with a high spatial resolution for this purpose. Actual and potential water
repellency were measured using the Water Drop Penetration Time (WDPT) test. Gravimetric
water content and soil organic matter (SOM) were determined for each sample; a total of 864
soil samples were analysed. The investigations were carried out in January 2003. Water
repellency occurred in the top soil even during this winter period. The spatial distribution of
water content and water repellency clearly showed preferential flow paths. Water repellency
was measured in field moist samples (actual repellency) and in dried samples (potential
repellency). The transition zone for distinguishing between water repellent and wettable
regions was determined to be 0.15 g·g-1. Therefore, a calculation of the wettability by water
content alone is not possible. We suggest a new approach by calculating a so called ‘critical
water content’ (Θcrit) as a function of the amount of soil organic matter (SOM). The function
Θcrit (g·g-1)= 1.12 SOM (g·g-1) +0.037 g·g-1 leads to a better prediction of wettable and non
wettable soil regions for the entire soil profile. The distinction between these regions is
necessary for the calculation of the water and solute transport in a 2 or 3 dimensional numeric
model.
2.2 Introduction
Many studies have been conducted on the occurrence, importance and the hydrological impact
of water repellency in soils. Water repellency can be found in soils all over the world (Franco
et al. 2000, Scott 2000, Jarmillo et al. 2003, Doerr et al. 2003, Dekker et al. 1999). The
occurrence of preferential flow and fingering is one of the main impacts of water repellency.
In most cases the repellency is not permanent but vanishes during autumn and winter (Dekker
and Ritsema, 1994).
Most studies use the Water Drop Penetration Time (WDPT) test as a measure for the stability
of the repellency (Letey et al. 2003). It can be used on field moist samples for the actual
repellency or on dried samples for the potential repellency. With the aid of this test, dry
10
repellent soil samples can be separated from wet non-repellent ones. The degree of repellency
depends mainly on the soil water content. Dekker and Ritsema (1994) established a transition
zone or a critical soil moisture zone. This zone is defined by two water content thresholds.
The lower one determines a limit below which the soil is water repellent, the higher one
determines the water content above which the soil is wettable. Within this zone, the soil can
be wettable or water repellent. The reported water contents for these thresholds vary widely.
Doerr and Thomas (2003), for example, measured a transition zone of 0.14 to 0.22 g·g-1.
Dekker et al. (2003), Dekker et al. (2001) and Ziogas et al. (2003) found transition zones
within a range of 0.05 to 0.06 cm·cm-1, if the soil was sampled in fine layers. Ritsema and
Dekker (2003) pointed out that the critical water threshold is an important parameter for flow
and transport models of water repellent soils. It can be used to distinguish between water
repellent and wettable soil regimes.
There are some studies that deal with the spatial distribution of water repellency and
preferential flow paths. Ritsema et al. (1998) described the spatial variability of repellency,
water content, pH, and the concentrations of a Bromide-tracer. Gerke et al. (2001) found
hardly any spatial structures in mine soils, because different soil materials (severely repellent
as well as not repellent) occur in the same soil profile. In most cases, preferential flow paths
are visible and coincide with the measurements of actual water repellency. Moral Garcia et al.
(2003) describes the influence of organic matter on the degree of potential water repellency
for two sandy soils, a bare soil and a stand of pine trees. Samples with less than 0.06 g·g-1
SOM were slightly up to severely water repellent, samples with higher contents of organic
matter were severely to extremely repellent. Dekker and Ritsema (1994) did not find a
significant relation between the persistence of potential water repellency and the organic
matter content. The connection between critical water content and soil organic matter has not
been investigated until now.
This study examines the influence of soil organic matter on the critical water content. The aim
is to get a better description of the soil moisture regime, and to gain what is called a ‘critical
water content’ in order to predict water repellency in soils. Furthermore, the degree of water
repellency in the winter time is quantified and the relation between preferential flow paths and
potential water repellency is studied.
11
2.3 Material and Methods
2.3.1 Soil sampling
The soil samples were taken on January 22nd, 2003, along a 3 m transect down to a depth of
1m with a vertical resolution of 10 cm and a horizontal resolution of 6 cm. Close to the
transect, a topsoil monolith of 40x 80x 30 cm was sampled with a resolution of 5 x 5 cm at
depths of 15, 21 and 27 cm. The actual water repellency of the field moist disturbed samples
was measured. Afterwards, the gravimetric water content, amount of organic matter, and
potential water repellency were determined. A total of 864 soil samples, 480 for transect at 10
depths and 384 in the monolith, were investigated.
2.3.2 Laboratory measurements
The actual water repellency was determined with the Water Drop Penetration Time (WDPT)
test as described by several authors (e.g. Krammes and DeBano, 1965; Dekker and Jungerius,
1990). In order to establish the actual repellency, three drops of distilled water were placed on
the smoothed surface of a field moist soil sample using a standard glass pipette. The time that
elapsed before the drops were absorbed was measured. Subsequently, the potential water
repellency was tested at the same samples after drying at 35° C for two weeks. Dekker and
Ritsema (1994) described the potential water repellency as the most appropriate parameter for
comparing water repellency of soils, because differences in water content are eliminated.
A repellency index was applied allowing a quantitative description of the severity of water
repellency as described by Dekker and Jungerius (1990). Seven classes of repellency were
distinguished, ranging from wettable with WDPT less than 5 s to extremely water repellent
with WDPT of more than 6 h (see Tab.2.1).
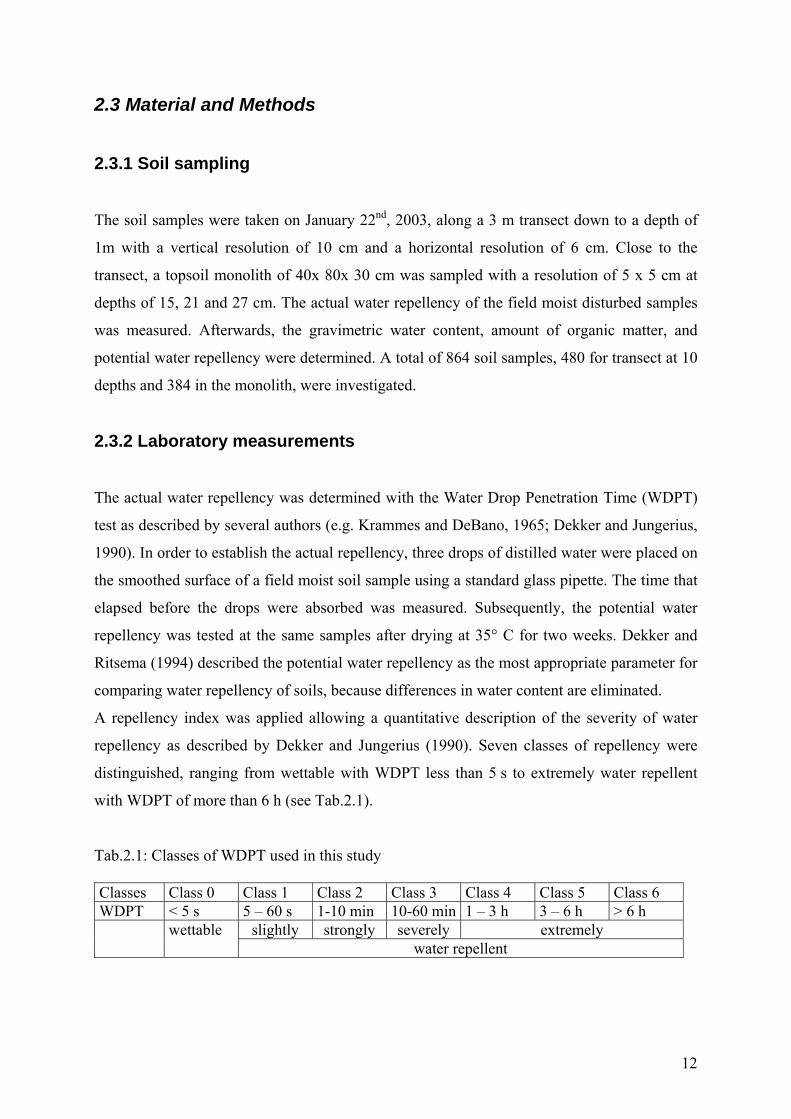
Tab.2.1: Classes of WDPT used in this study Classes Class 0 Class 1 Class 2 Class 3 Class 4 Class 5 Class 6 WDPT < 5 s 5 – 60 s 1-10 min 10-60 min 1 – 3 h 3 – 6 h > 6 h
slightly strongly severely extremely wettable water repellent
12
The water content of all samples was determined gravimetrically by drying at 105° C.
Afterwards the dry samples were used to measure the content of organic matter by igniting the
samples for 5h at 550°C. The difference between the dried and ignited samples was taken as
the organic matter content, since the samples are non - calcareous; the pH (H20) on that site
ranges from 4.8 to 6 (Hoffmann 2002).
2.4 Results and Discussion 2.4.1 Actual and potential water repellency
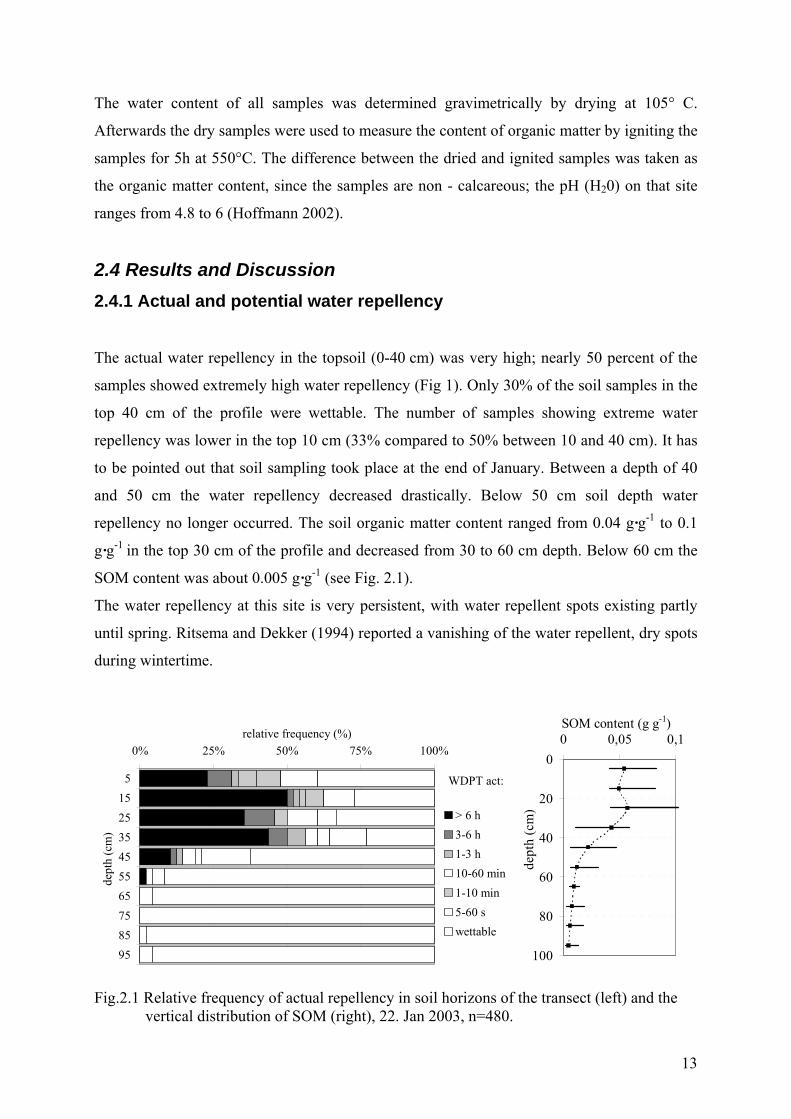
The actual water repellency in the topsoil (0-40 cm) was very high; nearly 50 percent of the
samples showed extremely high water repellency (Fig 1). Only 30% of the soil samples in the
top 40 cm of the profile were wettable. The number of samples showing extreme water
repellency was lower in the top 10 cm (33% compared to 50% between 10 and 40 cm). It has
to be pointed out that soil sampling took place at the end of January. Between a depth of 40
and 50 cm the water repellency decreased drastically. Below 50 cm soil depth water
repellency no longer occurred. The soil organic matter content ranged from 0.04 g·g-1 to 0.1
g·g-1 in the top 30 cm of the profile and decreased from 30 to 60 cm depth. Below 60 cm the
SOM content was about 0.005 g·g-1 (see Fig. 2.1).
The water repellency at this site is very persistent, with water repellent spots existing partly
until spring. Ritsema and Dekker (1994) reported a vanishing of the water repellent, dry spots
during wintertime.
WDPT act:
0% 25% 50% 75% 100%
5152535455565758595
dept
h (c
m)
relative frequency (%)
> 6 h3-6 h1-3 h10-60 min1-10 min5-60 swettable
0
20
40
60
80
100
0 0,05 0,SOM content (g g-1)
dept
h (c
m)
1
Fig.2.1 Relative frequency of actual repellency in soil horizons of the transect (left) and the
vertical distribution of SOM (right), 22. Jan 2003, n=480.
13
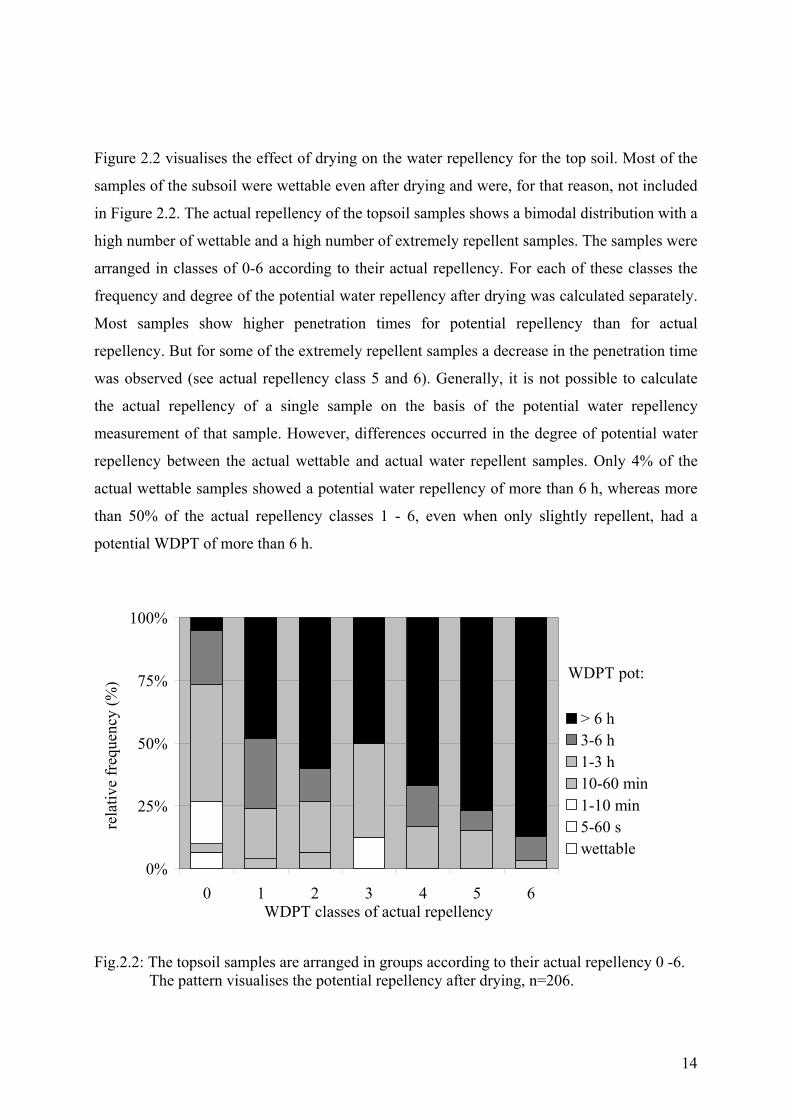
Figure 2.2 visualises the effect of drying on the water repellency for the top soil. Most of the
samples of the subsoil were wettable even after drying and were, for that reason, not included
in Figure 2.2. The actual repellency of the topsoil samples shows a bimodal distribution with a
high number of wettable and a high number of extremely repellent samples. The samples were
arranged in classes of 0-6 according to their actual repellency. For each of these classes the
frequency and degree of the potential water repellency after drying was calculated separately.
Most samples show higher penetration times for potential repellency than for actual
repellency. But for some of the extremely repellent samples a decrease in the penetration time
was observed (see actual repellency class 5 and 6). Generally, it is not possible to calculate
the actual repellency of a single sample on the basis of the potential water repellency
measurement of that sample. However, differences occurred in the degree of potential water
repellency between the actual wettable and actual water repellent samples. Only 4% of the
actual wettable samples showed a potential water repellency of more than 6 h, whereas more
than 50% of the actual repellency classes 1 - 6, even when only slightly repellent, had a
potential WDPT of more than 6 h.
WDPT pot:
0%
25%
50%
75%
100%
0 1 2 3 4 5 6WDPT classes of actual repellency
rela
tive
freq
uenc
y (%
)
> 6 h3-6 h1-3 h10-60 min1-10 min5-60 swettable
Fig.2.2: The topsoil samples are arranged in groups according to their actual repellency 0 -6.
The pattern visualises the potential repellency after drying, n=206.
14
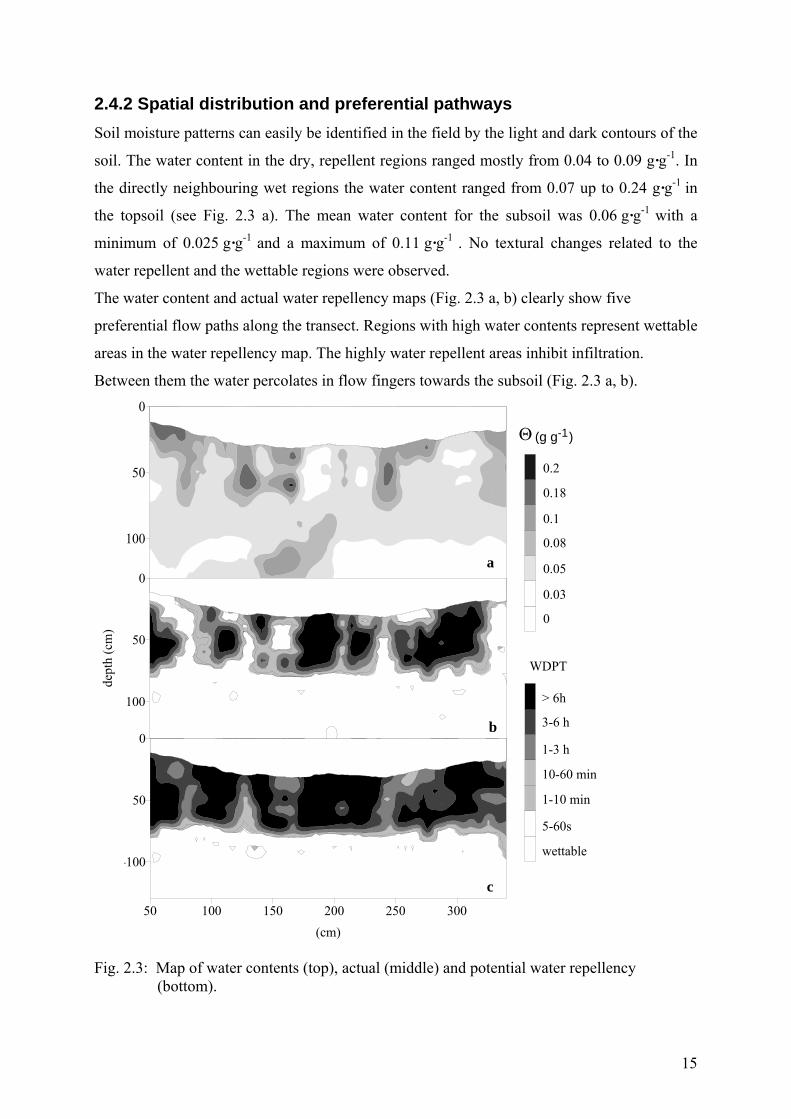
2.4.2 Spatial distribution and preferential pathways Soil moisture patterns can easily be identified in the field by the light and dark contours of the
soil. The water content in the dry, repellent regions ranged mostly from 0.04 to 0.09 g·g-1. In
the directly neighbouring wet regions the water content ranged from 0.07 up to 0.24 g·g-1 in
the topsoil (see Fig. 2.3 a). The mean water content for the subsoil was 0.06 g·g-1 with a
minimum of 0.025 g·g-1 and a maximum of 0.11 g·g-1 . No textural changes related to the
water repellent and the wettable regions were observed.
The water content and actual water repellency maps (Fig. 2.3 a, b) clearly show five
preferential flow paths along the transect. Regions with high water contents represent wettable
areas in the water repellency map. The highly water repellent areas inhibit infiltration.
Between them the water percolates in flow fingers towards the subsoil (Fig. 2.3 a, b).
-100
-50
0
0
3
5
8
10
14
20
50 100 150 200 250 300(cm)
-100
-50
0
-100
-50
0
dept
h (c
m)
0
6E-005
0.0007
0.007
0.04
0.1
0.3
0.2
0.18
0.1
0.08
0.05
0.03
0
wettable
> 6h
5-60s
1-10 min
10-60 min
1-3 h
3-6 h
WDPT
a
b
c
Θ (g g )-1
Fig. 2.3: Map of water contents (top), actual (middle) and potential water repellency
(bottom).
15
The flow paths are also visible in the map of the potential water repellency (Fig. 2.3 c). In the
regions between the flow paths the penetration times for the potential repellency are mostly
above 6 h. The penetration times within the flow paths are lower.
2.4.3 Transition zone and influence of soil organic matter
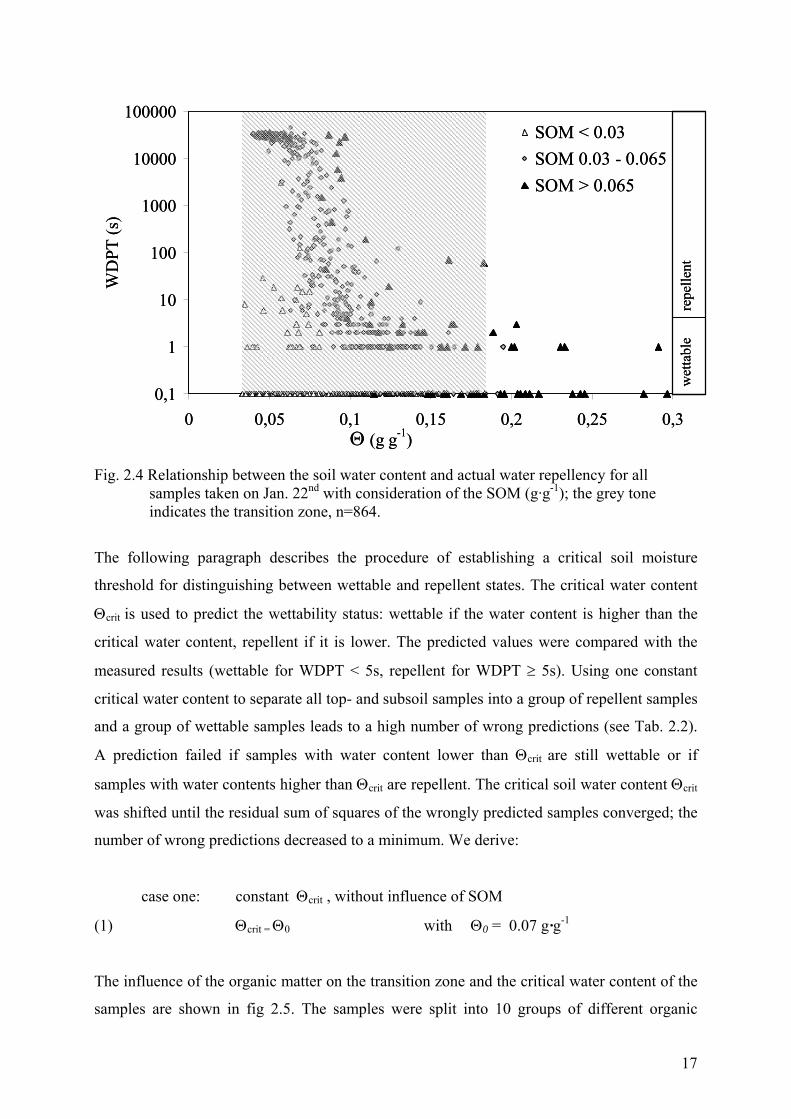
If the actual WDPT is plotted against the water content for a group of repellent and wettable
samples, the resulting figure is similar to fig. 2.4. Every point presents one field moist sample
with its water content and the associated penetration time. The water repellent samples can be
found at lower water contents with high penetration times and the wettable samples at higher
water contents and penetration times < 5 s. The transition zone is the water content range
where some samples repel while other samples are wettable. It is limited by the critical soil
water content below which a soil is water repellent and the content above which it is wettable
(Dekker et al. 2001, Ritsema et al. 2003). In some studies the transition zone shows wide
ranges of more than 0.2 cm·cm-1 (Doerr and Thomas 2003). Sometimes the zone is narrow
and shows ranges of less than 0.05 cm·cm-1. These sharply defined transitions appear when
samples were taken at thin, defined layers (Ziogas et al. 2003). The transition zones vary for
different depths (Ritsema and Dekker 1994, Dekker et al. 2001, Dekker et al. 2003).
Figure 2.4 shows the WDPT for actual repellency in dependence on the gravimetric water
content for the whole profile. Considering all samples, the transition zone ranges from 0.03
g·g-1 – the lowest water content of a wettable sample - up to 0.18 g·g-1- the highest water
content for a repellent sample. Most of the repellent samples show water contents between
0.04 and 0.1 g·g-1.
Samples with a SOM content higher than 0.065 g·g-1 were found to be still repellent at higher
water contents of 0.1 – 0.15 g·g-1. Wettable samples occur at water contents higher than 0.03
g·g-1. However, for wettable samples with an intermediate SOM content, the smallest water
content is 0.053, for samples with a SOM content >0.065 g·g-1 it is 0.098 g·g-1. The organic
matter content of the samples seems to influence the water content range where repellency
occurs. To prove the effect of organic matter on the wettability it is necessary to find a cut off
criterion – the critical water content.
16
0,1
1
10
100
1000
10000
100000
0 0,05 0,1 0,15 0,2 0,25 0,3Θ (g g-1)
WD
PT (s
)SOM < 0.03SOM 0.03 - 0.065SOM > 0.065
wet
tabl
ere
pelle
nt
0,1
1
10
100
1000
10000
100000
0 0,05 0,1 0,15 0,2 0,25 0,3Θ (g g-1)
WD
PT (s
)SOM < 0.03SOM 0.03 - 0.065SOM > 0.065
wet
tabl
ere
pelle
nt
Fig. 2.4 Relationship between the soil water content and actual water repellency for all
samples taken on Jan. 22nd with consideration of the SOM (g·g-1); the grey tone indicates the transition zone, n=864.
The following paragraph describes the procedure of establishing a critical soil moisture
threshold for distinguishing between wettable and repellent states. The critical water content
Θcrit is used to predict the wettability status: wettable if the water content is higher than the
critical water content, repellent if it is lower. The predicted values were compared with the
measured results (wettable for WDPT < 5s, repellent for WDPT ≥ 5s). Using one constant
critical water content to separate all top- and subsoil samples into a group of repellent samples
and a group of wettable samples leads to a high number of wrong predictions (see Tab. 2.2).
A prediction failed if samples with water content lower than Θcrit are still wettable or if
samples with water contents higher than Θcrit are repellent. The critical soil water content Θcrit
was shifted until the residual sum of squares of the wrongly predicted samples converged; the
number of wrong predictions decreased to a minimum. We derive:
case one: constant Θcrit , without influence of SOM
(1) Θcrit = Θ0 with Θ0 = 0.07 g·g-1
The influence of the organic matter on the transition zone and the critical water content of the
samples are shown in fig 2.5. The samples were split into 10 groups of different organic
17
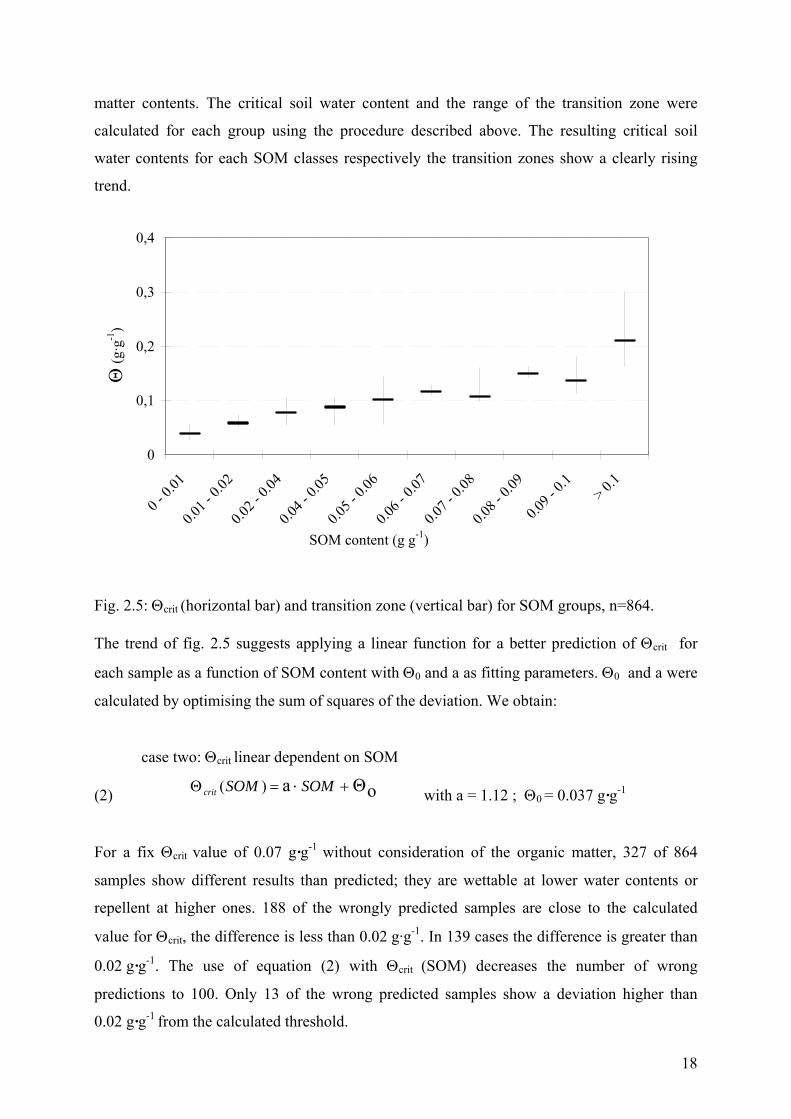
matter contents. The critical soil water content and the range of the transition zone were
calculated for each group using the procedure described above. The resulting critical soil
water contents for each SOM classes respectively the transition zones show a clearly rising
trend.
0
0,1
0,2
0,3
0,4
0 - 0.
01
0.01 -
0.02
0.02 -
0.04
0.04 -
0.05
0.05 -
0.06
0.06 -
0.07
0.07 -
0.08
0.08 -
0.09
0.09 -
0.1
> 0.1
SOM content (g g-1)
Θ (g
·g-1
)
Fig. 2.5: Θcrit (horizontal bar) and transition zone (vertical bar) for SOM groups, n=864. The trend of fig. 2.5 suggests applying a linear function for a better prediction of Θcrit for
each sample as a function of SOM content with Θ0 and a as fitting parameters. Θ0 and a were
calculated by optimising the sum of squares of the deviation. We obtain:
case two: Θcrit linear dependent on SOM
(2) oΘa)( +=Θ ⋅ SOMSOMcrit with a = 1.12 ; Θ0 = 0.037 g·g-1
For a fix Θcrit value of 0.07 g·g-1 without consideration of the organic matter, 327 of 864
samples show different results than predicted; they are wettable at lower water contents or
repellent at higher ones. 188 of the wrongly predicted samples are close to the calculated
value for Θcrit, the difference is less than 0.02 g·g-1. In 139 cases the difference is greater than
0.02 g·g-1. The use of equation (2) with Θcrit (SOM) decreases the number of wrong
predictions to 100. Only 13 of the wrong predicted samples show a deviation higher than
0.02 g·g-1 from the calculated threshold.
18
Tab. 2.2: Prediction of repellency by water content using a constant Θcrit for all samples (case 1) or an individual Θcrit for each sample as a function of the SOM content (case 2), n=864, 319 of them repellent.
Θcrit=f(SOM) Θcrit= const.
total number of wrong predictions 100 327
wrong predictions with a deviation > 1 Θm% 35 218
wrong predictions with a deviation > 2 Θm% 13 139
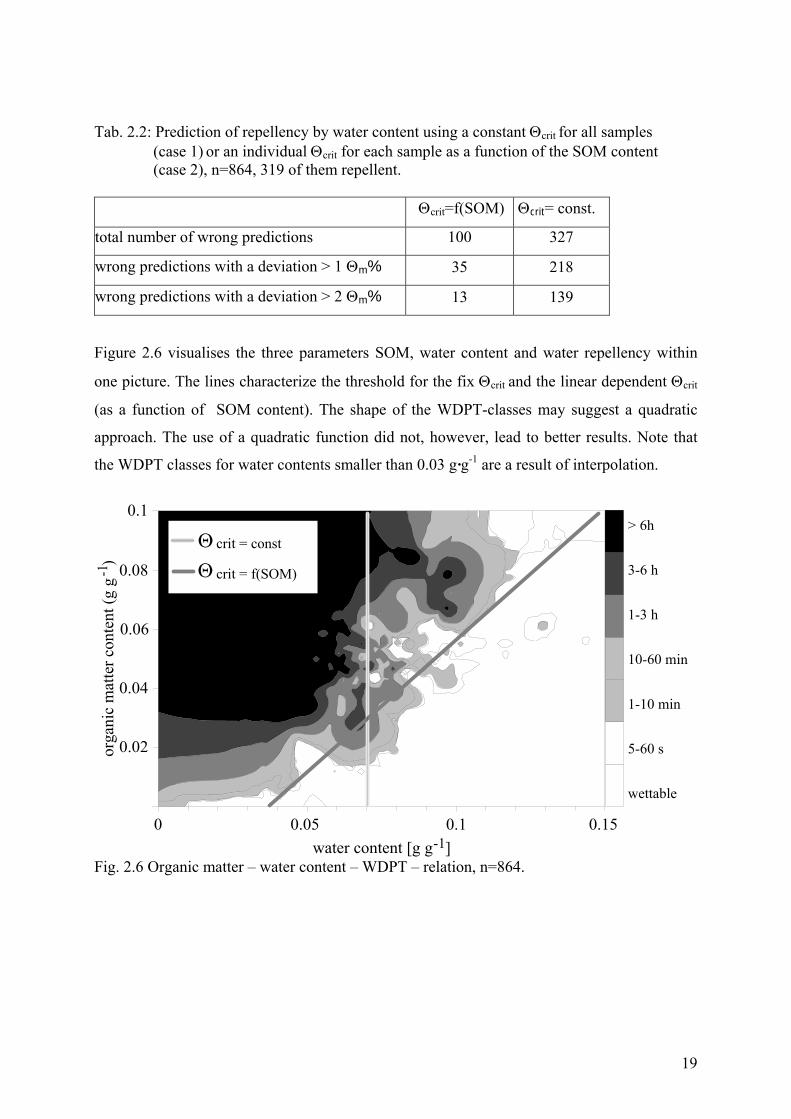
Figure 2.6 visualises the three parameters SOM, water content and water repellency within
one picture. The lines characterize the threshold for the fix Θcrit and the linear dependent Θcrit
(as a function of SOM content). The shape of the WDPT-classes may suggest a quadratic
approach. The use of a quadratic function did not, however, lead to better results. Note that
the WDPT classes for water contents smaller than 0.03 g·g-1 are a result of interpolation.
0 5 10water content [g g ]
0
2
4
6
8
10
orga
nic
mat
ter c
onte
nt (g
g
)
0
5
60
600
3600
10800
21600
> 6h
3-6 h
1-3 h
10-60 min
1-10 min
5-60 s
wettable
crit = const
crit = f(SOM)
ΘΘ
0 0.05 0.1 0.15-1
-1
0.1
0.02
0.04
0.06
0.08
Fig. 2.6 Organic matter – water content – WDPT – relation, n=864.
19
3. Part II - Seasonal dynamics of preferential flow in a water repellent soil
3.1 Abstract
The temporal dynamic of water repellency in soils has a strong influence on water flow and
the appearance of preferential flow paths at potentially water repellent sites. To quantify this
effect, field investigations were conducted at a sandy site near Berlin, Germany. A large
number of soil samples were collected at 32 different times over a 3-year period.
Additionally, a TDR-array with 63 probes measured water contents hourly along a transect of
130x60 cm. Based on these sampling campaigns, the area share of water repellent soil regions
was measured. Water content changes were observed with the TDR devices at a high spatial
and temporal resolution after several rainfall events. Heterogeneities in water content changes
were analyzed. To quantify the heterogeneity (i.e. the degree of preferential flow) we
proposed the use of an effective cross section, ECS, for water flow. This parameter was
calculated by fitting the beta function to the cumulative values of the water content change
over a horizontal cross section at a depth of 25 cm. Sampling and TDR measurements showed
similar seasonal dynamics of preferential flow, with the highest occurrence in summer and
early autumn and a maximum accessible soil volume in the spring. Preferential flow in the
winter month was enhanced not only by water repellency, but also by freezing and melting.
We also tried to calculate the effective cross section from climatic data. It was possible to
calculate the effective cross section using a linear relationship with the initial soil moisture at
10 cm depth, the duration and amount of precipitation, and the potential evapotranspiration
rate.
3.2 Introduction
Water repellency is a widespread phenomenon that can affect water flow in soils
significantly. Water repellency occurs on most continents and for a variety of land uses and
climatic conditions. Repellency can occur naturally, as reported by Dekker et al. (1999),
Harper and Gilkes (1994) and York and Canaway (2000), or can be affected by fire (Doerr et
al., 1996). Repellency may impact surface runoff significantly and can lead to reduced
wetting rates of dry soils. Water repellent soils tend to restrict water flow, creating fingerlike
20
wetting fronts, which leads to a reduction in plant-available water and limits solute transport
to relatively narrowed flow channels. Pollutants and nutrients consequently have shorter
residence times in the affected soil layers and move much faster through the vadose zone. The
effects can be observed as irregular moisture patterns or tracer distribution in the soil
(Ritsema and Dekker, 1998; Arbel et al., 2005), patchy growth of plants, or erosion in sloping
regions (Witter et al., 1991). Water repellency is not a permanent property. Soils become
water repellent when they desiccate during dry periods in the summer, with water repellency
often diminishing or vanishing when the soil becomes wet in the autumn or during wintertime
(Dekker and Ritsema, 1994).
The process of water repellency has been analyzed since the 1960s. Its spatial variability
and the creation of preferential flow paths in particular have recently received much attention.
For example, Wang et al. (2000) conducted infiltration experiments on water repellent and
wettable soils in the laboratory. They used the saturated hydraulic conductivity and an air
entry value of the matric potential as conditions for unstable infiltration fronts. Clothier et al.
(2000) studied infiltration experiments under unsaturated conditions in the laboratory and in
the field. They observed an increase in the infiltration rate after 100 min, after which the
water repellency broke down. Selker et al. (1992) derived the size of flow fingers from the
unsaturated hydraulic conductivity, the air entry value, and the flow rate. Wang et al. (1998)
reported finger diameters between 2 and 23 cm. An approach for calculating the finger size is
included in the one-dimensional model SWAP (van Dam et al., 1996). Most experiments
involved infiltration into dry soils. Glass et al. (1989) and Liu et al. (1993) found that the
distribution of water contents and flow paths was strongly influenced by earlier infiltrations
with fingered flow. Previous finger paths were preserved because of hysteresis in the soil
moisture retention.
Dekker and Ritsema (1994) established the concept of a transition zone, or a critical soil
moisture zone, to distinguish between water repellent and wettable conditions. The soil
becomes water repellent when the water content decreases below a certain critical value, and
it becomes wettable again when its water content exceeds another critical water content.
Water contents for these two thresholds have been found to vary widely for different soils
(Doerr and Thomas, 2003, Dekker et al., 2001, Ziogas et al., 2003). Täumer et al. (2005)
described the influence of soil organic matter content on the critical water content.
Doerr et al. (1996) determined the spatial variability of water repellency in forestry soils
in Portugal. Ritsema and Dekker (1998) analyzed the 3 dimensional distributions of water
repellency, bromide and pH values, while Dekker and Ritsema (2000) described the water
21
repellency of a clay soil. Using several sampling campaigns, they showed the high spatial
variability and temporal nature of water repellency.
Most field investigations of water repellency have been conducted on disturbed or
undisturbed soil samples. The disadvantage of this method is that it destroys the soil. Only
few investigations have used non-destructive methods. Ritsema et al. (1998) used an array of
TDR probes to demonstrate the occurrence of fingering after three rainfall events; however,
they did not determine seasonal changes in preferential flow.
Without information about the seasonal dynamics of preferential flow, water and solute
transport in a water repellent soil can not be fully described. Therefore, the objective of this
study is to quantify the seasonal dynamics of preferential flow under water repellent field
conditions. The ‘effective cross section’ is introduced as a new parameter to describe the area
share of the preferential flow paths and the water repellent soil volume. Quantifying seasonal
variations in this parameter allows the effects of water repellency to be included in the
seasonal simulations of water and solute movement.
3.3 Materials and methods 3.3.1 Soil sampling
From April 2001 to April 2004 about 3000 soil samples were taken at 32 different times, in
most cases as disturbed samples. The sampling positions were spread over a plot of 25 x 150
m. The TDR transect was also part of the plot. Soil samples were taken eight times with a
high spatial resolution along a transect or in a grid (10 x 10 or 5 x 5 cm). The samples allowed
an excellent description of the spatial variability of several soil properties. Special attention
was given to the area share, the degree of water repellency, and the water content at a depth of
approximately 20 - 30 cm depth. The actual water repellency was measured on field moist
samples using the Water Drop Penetration Time (WDPT) test as described by Krammes and
DeBano (1965). At the other 24 sampling times, the area share of the water repellent profile
was estimated from the visible pattern of lighter and darker color, associated with dry and wet
parts of the soil (Fig. 3.1). The area share was estimated directly from observations of the
profile or from photographs of the trench. The sampling data, especially the water content and
WDPT, were used to quantify the spatial variability. The spatial analyses of the water content
from the first sampling campaigns helped to determine the optimal setup for the TDR array.
22
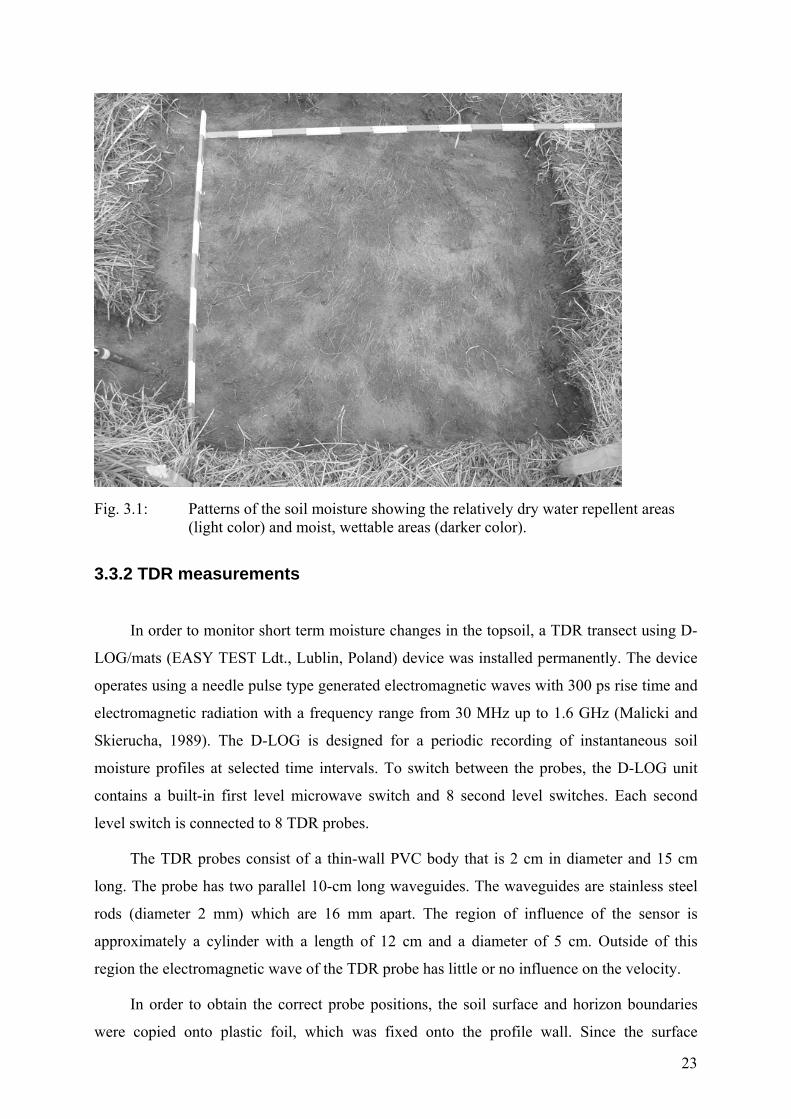
Fig. 3.1: Patterns of the soil moisture showing the relatively dry water repellent areas
(light color) and moist, wettable areas (darker color).
3.3.2 TDR measurements
In order to monitor short term moisture changes in the topsoil, a TDR transect using D-
LOG/mats (EASY TEST Ldt., Lublin, Poland) device was installed permanently. The device
operates using a needle pulse type generated electromagnetic waves with 300 ps rise time and
electromagnetic radiation with a frequency range from 30 MHz up to 1.6 GHz (Malicki and
Skierucha, 1989). The D-LOG is designed for a periodic recording of instantaneous soil
moisture profiles at selected time intervals. To switch between the probes, the D-LOG unit
contains a built-in first level microwave switch and 8 second level switches. Each second
level switch is connected to 8 TDR probes.
The TDR probes consist of a thin-wall PVC body that is 2 cm in diameter and 15 cm
long. The probe has two parallel 10-cm long waveguides. The waveguides are stainless steel
rods (diameter 2 mm) which are 16 mm apart. The region of influence of the sensor is
approximately a cylinder with a length of 12 cm and a diameter of 5 cm. Outside of this
region the electromagnetic wave of the TDR probe has little or no influence on the velocity.
In order to obtain the correct probe positions, the soil surface and horizon boundaries
were copied onto plastic foil, which was fixed onto the profile wall. Since the surface
23
undulated, a reference depth of zero was made to the smoothed soil surface. After removing
the foil with the topography of the profile, the 63 TDR probes were installed horizontally into
the profile wall through pilot bore holes of 15 cm. The TDR transect covered the complete
topsoil for a representative area, from the top of the elevation to the middle of the lower
profile range. In view of results of the spatial analyses, the probes were spaced at 10 cm in the
humus-rich topsoil. A smaller spacing could result in interactions between the single TDR
probes and lead to a higher disturbance of the surrounding soil. A larger spacing, on the other
hand, would not reflect the heterogeneities in water content changes. After the installation the
trench was refilled carefully with the original soil
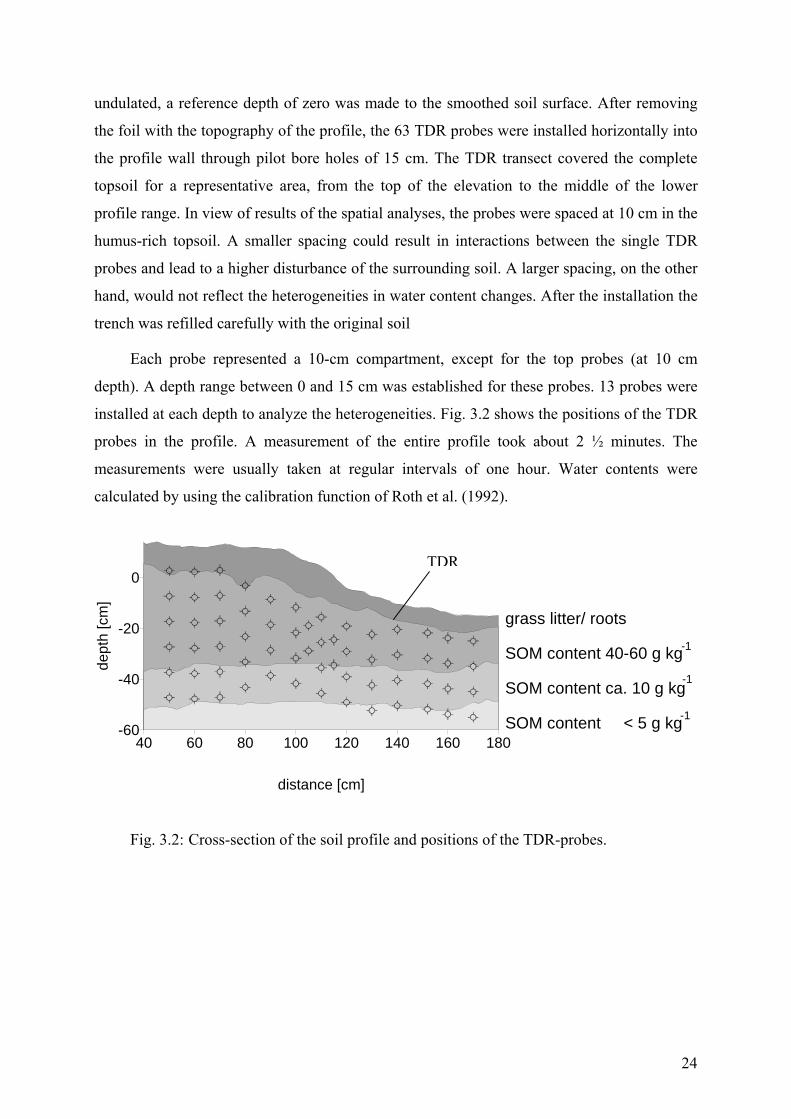
Each probe represented a 10-cm compartment, except for the top probes (at 10 cm
depth). A depth range between 0 and 15 cm was established for these probes. 13 probes were
installed at each depth to analyze the heterogeneities. Fig. 3.2 shows the positions of the TDR
probes in the profile. A measurement of the entire profile took about 2 ½ minutes. The
measurements were usually taken at regular intervals of one hour. Water contents were
calculated by using the calibration function of Roth et al. (1992).
40 60 80 100 120 140 160 180
distance [cm]
-60
-40
-20
0
dept
h [c
m]
grass litter/ roots
SOM content 40-60 g kg
SOM content ca. 10 g kg
SOM content < 5 g kg
-1
-1
-1
Fig. 3.2: Cross-section of the soil profile and positions of the TDR-probes.
TDR
24

3.3.3 Specifying preferential flow from TDR measurements
For water repellent soils, the area share of the flow paths is an important value reflecting the
preferential flow paths for water and solutes. The flow paths can be identified by determining
profile positions where the TDR readings show a high change in water content during single
rainfall events. An index for the degree of preferential flow is necessary to compare different
flow events. The index should be unambiguous for comparing and contrasting different
distributions of changes in the soil water. We used an approach based on the Beta function.
The standard Beta function (p) is defined by Bronstein and Semendjajew (1987) as
;10,0,0
;)1()()()(),;( 11
≤≤>>
−⋅ΓΓ+Γ
= −−
xfor
xxxp
ζαβαβαβα ζα
[1]
where G is the Gamma function (or Euler’s integral of the second kind) and a and z are free
parameters. The Beta function is defined over the interval [0, 1].
3.3.4 Calculation of the ‘effective cross section’
We point out that the effective cross section concept is only useful for finger flow in the
soil matrix, not for rapid flow through soil macropores. In the latter case, the TDR probes
would not be able to measure the water content changes. At our site we found that the flow
paths had typical dimensions in the range of decimeters. The TDR readings were examined
for single rainfall events. A typical rainfall event and the corresponding response in water
content changes for the whole soil profile is shown in Fig. 3.3. The water content change in
the soil was delayed after the rainfall. Small differences existed between the amount of
rainfall measured at this site and the amount of water recovery in the profile. Differences
could be caused by interception and by higher water contents in the top 10 cm, above the first
TDR probes.
25
0
2
4
6
8
0 5 10 15 20
time [h]
amou
nt o
f wat
er [
mm
].
water in profile (TDR)
cumulative rainfall
tmaxWC(16h)
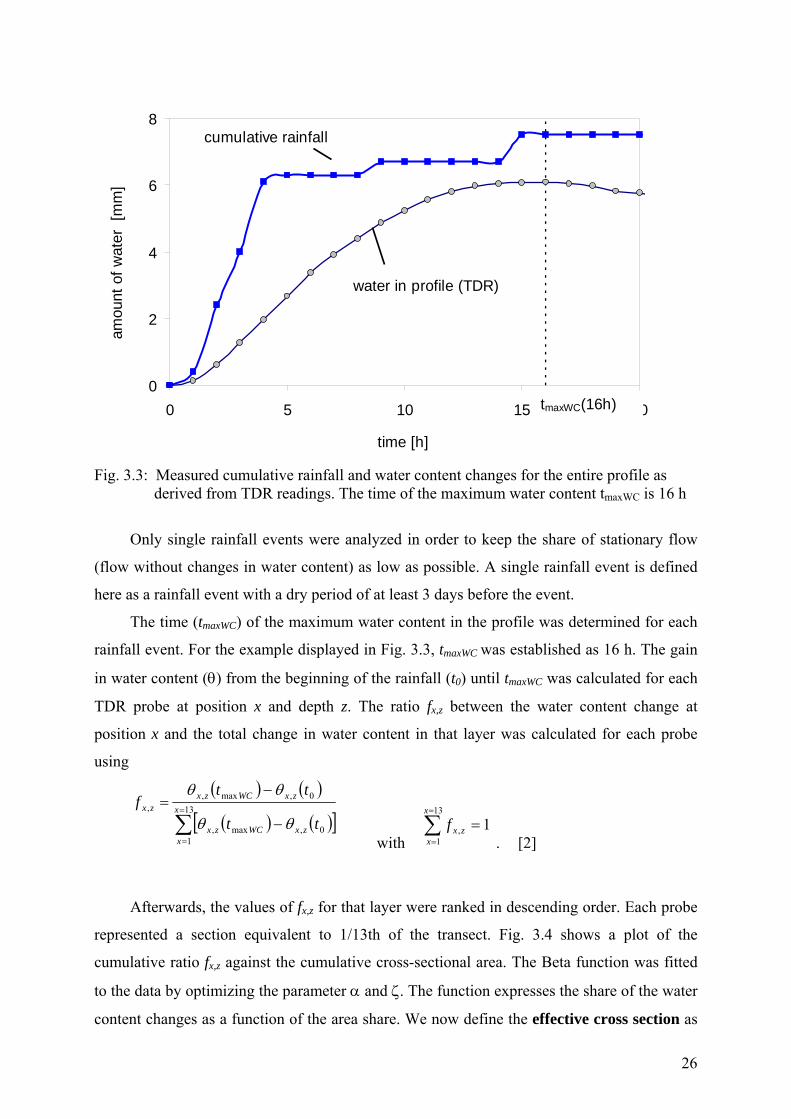
Fig. 3.3: Measured cumulative rainfall and water content changes for the entire profile as
derived from TDR readings. The time of the maximum water content tmaxWC is 16 h
Only single rainfall events were analyzed in order to keep the share of stationary flow
(flow without changes in water content) as low as possible. A single rainfall event is defined
here as a rainfall event with a dry period of at least 3 days before the event.
The time (tmaxWC) of the maximum water content in the profile was determined for each
rainfall event. For the example displayed in Fig. 3.3, tmaxWC was established as 16 h. The gain
in water content (θ) from the beginning of the rainfall (t0) until tmaxWC was calculated for each
TDR probe at position x and depth z. The ratio fx,z between the water content change at
position x and the total change in water content in that layer was calculated for each probe
using
( ) ( )
( ) ([ ])∑=
=
−
−= 13
10,max,
0,max,, x
xzxWCzx
zxWCzxzx
tt
ttf
θθ
θθ
with . [2]
1
13
1, =∑
=
=
x
xzxf
Afterwards, the values of fx,z for that layer were ranked in descending order. Each probe
represented a section equivalent to 1/13th of the transect. Fig. 3.4 shows a plot of the
cumulative ratio fx,z against the cumulative cross-sectional area. The Beta function was fitted
to the data by optimizing the parameter α and ζ. The function expresses the share of the water
content changes as a function of the area share. We now define the effective cross section as
26
that fraction of the total area that realizes 90% of water content change as measured by the
TDR probes at a certain depth. We used this value to quantify the heterogeneity in water flow
in the soil.
0
0.2
0.4
0.6
0.8
1
0 0.2 0.4 0.6 0.8 1fraction of cross-sectional area [m²/m²]
fract
ion
of to
tal w
ater
con
tent
cha
nge
[-]
a
bc
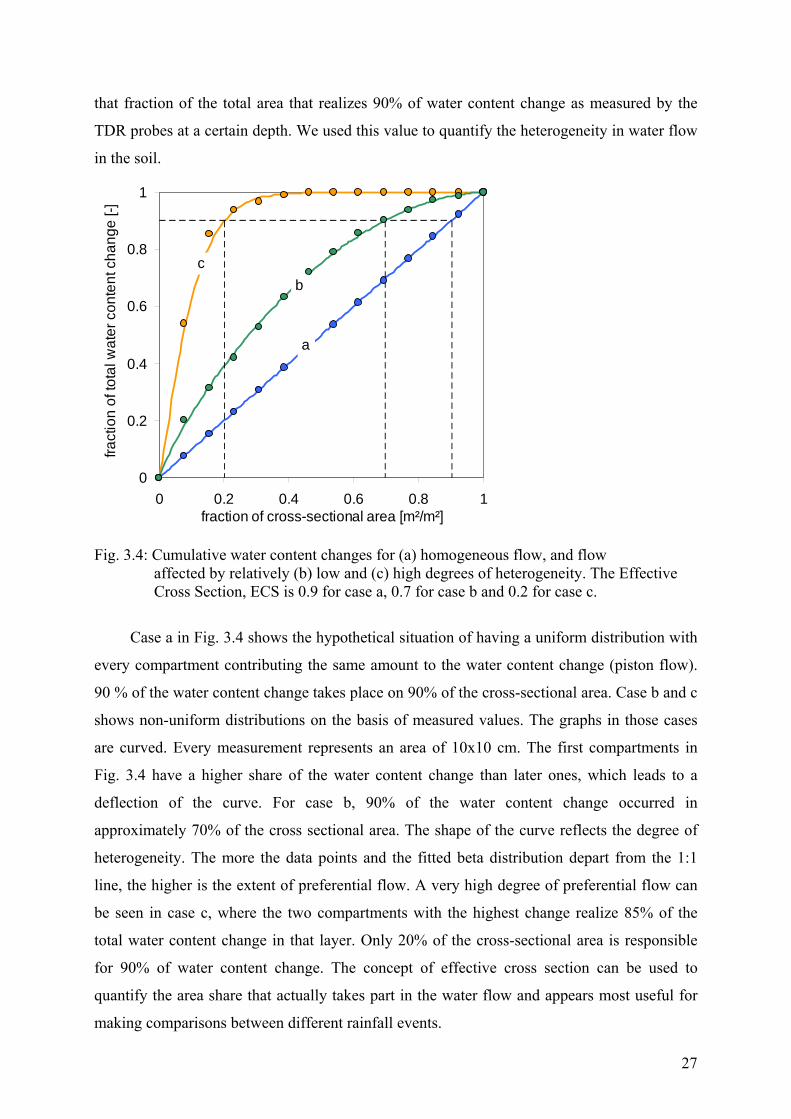
Fig. 3.4: Cumulative water content changes for (a) homogeneous flow, and flow
affected by relatively (b) low and (c) high degrees of heterogeneity. The Effective Cross Section, ECS is 0.9 for case a, 0.7 for case b and 0.2 for case c.
Case a in Fig. 3.4 shows the hypothetical situation of having a uniform distribution with
every compartment contributing the same amount to the water content change (piston flow).
90 % of the water content change takes place on 90% of the cross-sectional area. Case b and c
shows non-uniform distributions on the basis of measured values. The graphs in those cases
are curved. Every measurement represents an area of 10x10 cm. The first compartments in
Fig. 3.4 have a higher share of the water content change than later ones, which leads to a
deflection of the curve. For case b, 90% of the water content change occurred in
approximately 70% of the cross sectional area. The shape of the curve reflects the degree of
heterogeneity. The more the data points and the fitted beta distribution depart from the 1:1
line, the higher is the extent of preferential flow. A very high degree of preferential flow can
be seen in case c, where the two compartments with the highest change realize 85% of the
total water content change in that layer. Only 20% of the cross-sectional area is responsible
for 90% of water content change. The concept of effective cross section can be used to
quantify the area share that actually takes part in the water flow and appears most useful for
making comparisons between different rainfall events.
27
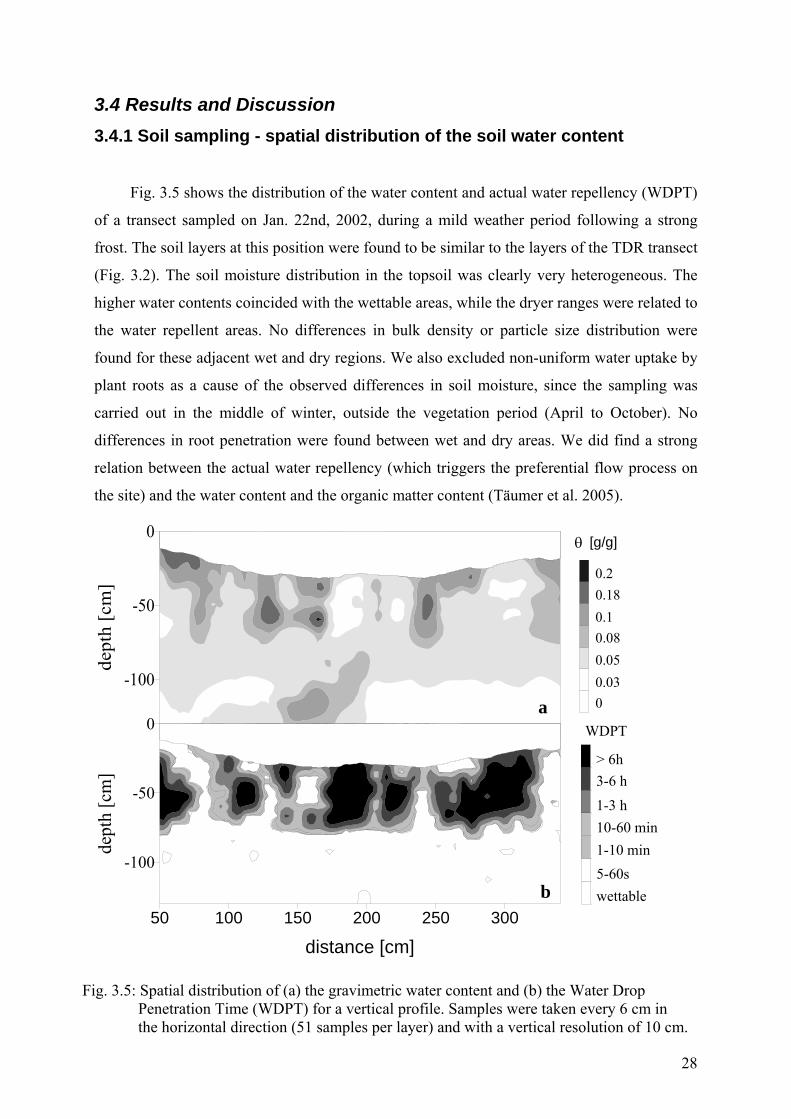
3.4 Results and Discussion 3.4.1 Soil sampling - spatial distribution of the soil water content
Fig. 3.5 shows the distribution of the water content and actual water repellency (WDPT)
of a transect sampled on Jan. 22nd, 2002, during a mild weather period following a strong
frost. The soil layers at this position were found to be similar to the layers of the TDR transect
(Fig. 3.2). The soil moisture distribution in the topsoil was clearly very heterogeneous. The
higher water contents coincided with the wettable areas, while the dryer ranges were related to
the water repellent areas. No differences in bulk density or particle size distribution were
found for these adjacent wet and dry regions. We also excluded non-uniform water uptake by
plant roots as a cause of the observed differences in soil moisture, since the sampling was
carried out in the middle of winter, outside the vegetation period (April to October). No
differences in root penetration were found between wet and dry areas. We did find a strong
relation between the actual water repellency (which triggers the preferential flow process on
the site) and the water content and the organic matter content (Täumer et al. 2005).
-100
-50
0
dept
h [c
m]
0
3
5
8
10
14
20
50 100 150 200 250 300
distance [cm]
-100
-50
0
dept
h [c
m]
0
6E-005
0.0007
0.007
0.04
0.1
0.3
0.20.180.10.080.050.030
wettable
> 6h
5-60s1-10 min10-60 min1-3 h
3-6 h
WDPTa
b
θ [g/g]
Fig. 3.5: Spatial distribution of (a) the gravimetric water content and (b) the Water Drop Penetration Time (WDPT) for a vertical profile. Samples were taken every 6 cm in the horizontal direction (51 samples per layer) and with a vertical resolution of 10 cm.
28
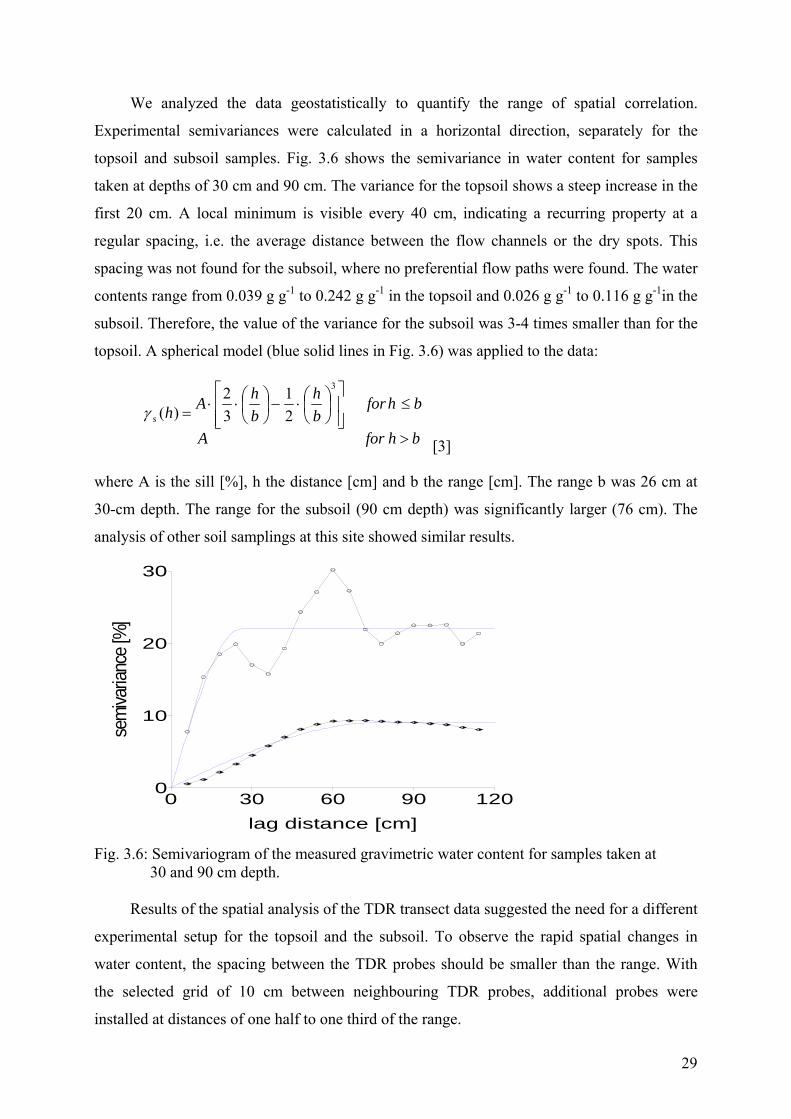
We analyzed the data geostatistically to quantify the range of spatial correlation.
Experimental semivariances were calculated in a horizontal direction, separately for the
topsoil and subsoil samples. Fig. 3.6 shows the semivariance in water content for samples
taken at depths of 30 cm and 90 cm. The variance for the topsoil shows a steep increase in the
first 20 cm. A local minimum is visible every 40 cm, indicating a recurring property at a
regular spacing, i.e. the average distance between the flow channels or the dry spots. This
spacing was not found for the subsoil, where no preferential flow paths were found. The water
contents range from 0.039 g g-1 to 0.242 g g-1 in the topsoil and 0.026 g g-1 to 0.116 g g-1in the
subsoil. Therefore, the value of the variance for the subsoil was 3-4 times smaller than for the
topsoil. A spherical model (blue solid lines in Fig. 3.6) was applied to the data:
bhforA
bhforbh
bhAhs
>
≤⎥⎥⎦
⎤
⎢⎢⎣
⎡⎟⎠⎞
⎜⎝⎛⋅−⎟
⎠⎞
⎜⎝⎛⋅⋅=
21
32
)(
3
γ
[3]
where A is the sill [%], h the distance [cm] and b the range [cm]. The range b was 26 cm at
30-cm depth. The range for the subsoil (90 cm depth) was significantly larger (76 cm). The
analysis of other soil samplings at this site showed similar results.
0 30 60 90 1lag distance [cm]
200
10
20
30
semi
varia
nce [
%]
Fig. 3.6: Semivariogram of the measured gravimetric water content for samples taken at
30 and 90 cm depth. Results of the spatial analysis of the TDR transect data suggested the need for a different
experimental setup for the topsoil and the subsoil. To observe the rapid spatial changes in
water content, the spacing between the TDR probes should be smaller than the range. With
the selected grid of 10 cm between neighbouring TDR probes, additional probes were
installed at distances of one half to one third of the range.
29
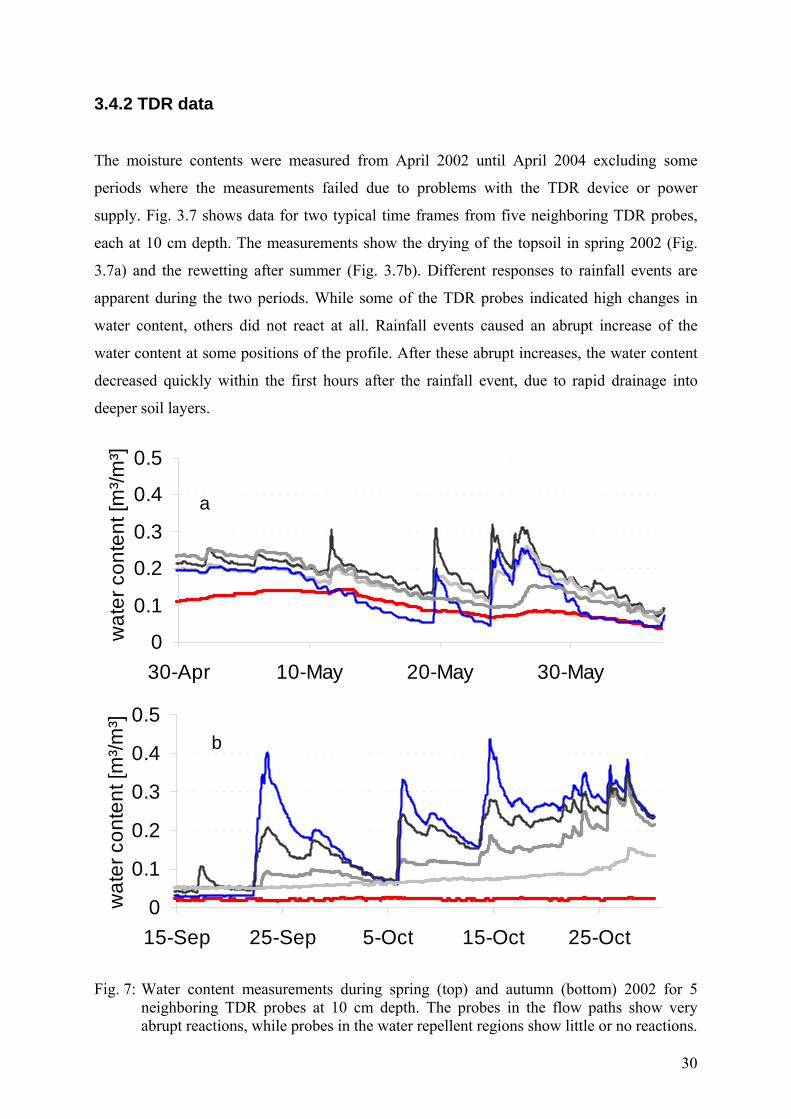
3.4.2 TDR data
The moisture contents were measured from April 2002 until April 2004 excluding some
periods where the measurements failed due to problems with the TDR device or power
supply. Fig. 3.7 shows data for two typical time frames from five neighboring TDR probes,
each at 10 cm depth. The measurements show the drying of the topsoil in spring 2002 (Fig.
3.7a) and the rewetting after summer (Fig. 3.7b). Different responses to rainfall events are
apparent during the two periods. While some of the TDR probes indicated high changes in
water content, others did not react at all. Rainfall events caused an abrupt increase of the
water content at some positions of the profile. After these abrupt increases, the water content
decreased quickly within the first hours after the rainfall event, due to rapid drainage into
deeper soil layers.
0
0.1
0.2
0.3
0.4
0.5
30-Apr 10-May 20-May 30-May
wat
er c
onte
nt [m
³/m³]
0
0.1
0.2
0.3
0.4
0.5
15-Sep 25-Sep 5-Oct 15-Oct 25-Oct
wat
er c
onte
nt [m
³/m³]
Fig. 7: Water content measurements during spring (top) and autumn (bottom) 2002 for 5
neighboring TDR probes at 10 cm depth. The probes in the flow paths show very abrupt reactions, while probes in the water repellent regions show little or no reactions.
a
b
30
In the springtime we observed a decrease in water content from the end of April to the
beginning of June. On average, the water content of the top soil layer decreased from 0.18
m³·m-³ to 0.06 m³·m-³ during that time. During rewetting in the fall, especially at the end of
September, large differences occurred in the TDR-readings between the different probes. At
the end of October more probes reacted than at the beginning of September. Water content at
several positions remained constant after the rainfall events, thereby indicating the water
repellent areas of the soil.
We also observed some diurnal variations in water content, especially during the dry periods
in May. Such diurnal changes in water content were caused by evapotranspiration during the
day and water redistribution during the night. Temperature effects may also have been present
(Stoffregen, 1998; Parlange et al., 1998).
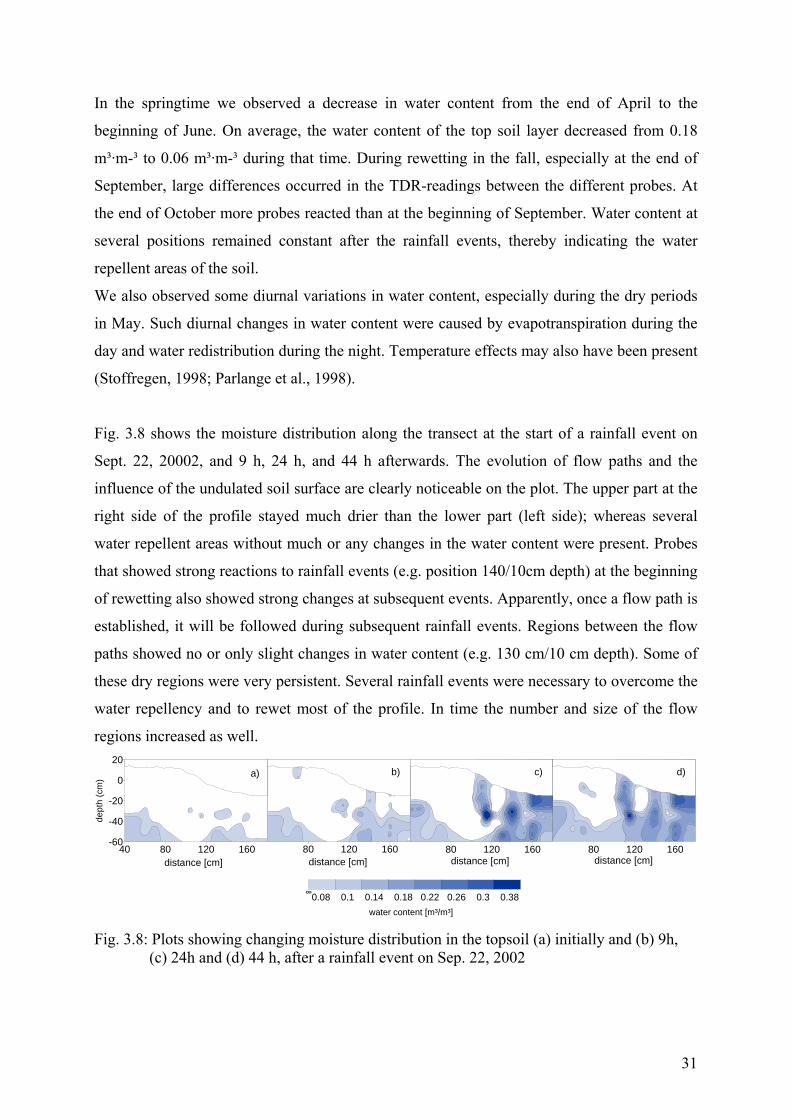
Fig. 3.8 shows the moisture distribution along the transect at the start of a rainfall event on
Sept. 22, 20002, and 9 h, 24 h, and 44 h afterwards. The evolution of flow paths and the
influence of the undulated soil surface are clearly noticeable on the plot. The upper part at the
right side of the profile stayed much drier than the lower part (left side); whereas several
water repellent areas without much or any changes in the water content were present. Probes
that showed strong reactions to rainfall events (e.g. position 140/10cm depth) at the beginning
of rewetting also showed strong changes at subsequent events. Apparently, once a flow path is
established, it will be followed during subsequent rainfall events. Regions between the flow
paths showed no or only slight changes in water content (e.g. 130 cm/10 cm depth). Some of
these dry regions were very persistent. Several rainfall events were necessary to overcome the
water repellency and to rewet most of the profile. In time the number and size of the flow
regions increased as well.
40 80 120 160-60
-40
-20
0
20
dept
h (c
m)
80 120 160 80 120 160 80 120 160
a) b) c) d)
water content [m³/m³]0.08 0.1 0.14 0.18 0.22 0.26 0.3 0.38
distance [cm] distance [cm] distance [cm]distance [cm]
Fig. 3.8: Plots showing changing moisture distribution in the topsoil (a) initially and (b) 9h,
(c) 24h and (d) 44 h, after a rainfall event on Sep. 22, 2002
31
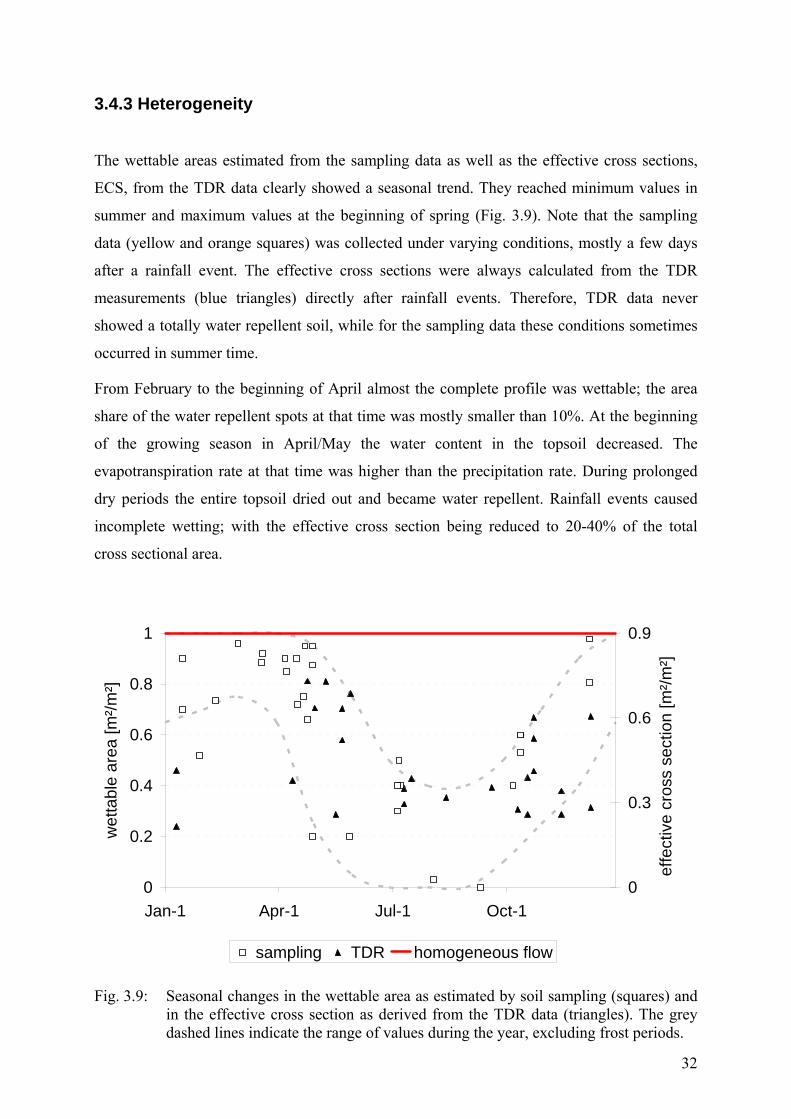
3.4.3 Heterogeneity
The wettable areas estimated from the sampling data as well as the effective cross sections,
ECS, from the TDR data clearly showed a seasonal trend. They reached minimum values in
summer and maximum values at the beginning of spring (Fig. 3.9). Note that the sampling
data (yellow and orange squares) was collected under varying conditions, mostly a few days
after a rainfall event. The effective cross sections were always calculated from the TDR
measurements (blue triangles) directly after rainfall events. Therefore, TDR data never
showed a totally water repellent soil, while for the sampling data these conditions sometimes
occurred in summer time.
From February to the beginning of April almost the complete profile was wettable; the area
share of the water repellent spots at that time was mostly smaller than 10%. At the beginning
of the growing season in April/May the water content in the topsoil decreased. The
evapotranspiration rate at that time was higher than the precipitation rate. During prolonged
dry periods the entire topsoil dried out and became water repellent. Rainfall events caused
incomplete wetting; with the effective cross section being reduced to 20-40% of the total
cross sectional area.
0
0.2
0.4
0.6
0.8
1
Jan-1 Apr-1 Jul-1 Oct-1
wet
tabl
e ar
ea [m
²/m²]
0
0.3
0.6
0.9
effe
ctiv
e cr
oss
sect
ion
[m²/m
²]
sampling TDR homogeneous flow
Fig. 3.9: Seasonal changes in the wettable area as estimated by soil sampling (squares) and
in the effective cross section as derived from the TDR data (triangles). The grey dashed lines indicate the range of values during the year, excluding frost periods.
32
With decreasing water demand by the plants and lower temperatures in the fall the soil water
balance slowly became positive. This caused a rewetting of the soil and hence an increase of
the effective cross section. Especially at the beginning of May, the TDR data and sampling
results showed an extremely high variability. The variability was caused by the variation in
the climatic conditions. The year 2002 (820 mm annual precipitation) was unusually wet,
while 2003 (410 mm) was very dry, especially during the first part from February to June.
Values of the TDR measurements in January were influenced considerably by the occurrence
of frost. Sealing of the soil surface due to frozen parts caused runoff and preferential flow
when the snow melted. Frozen water has a much lower dielectric constant than liquid water.
Therefore, the time at which the soil thaws can be detected by the TDR measurements.
Differences in the melting time between neighboring profile positions at the same depth were
observed for several hours up to two days. In the soil sampling, on the other hand, this effect
cannot be detected by measuring the water repellent area share.
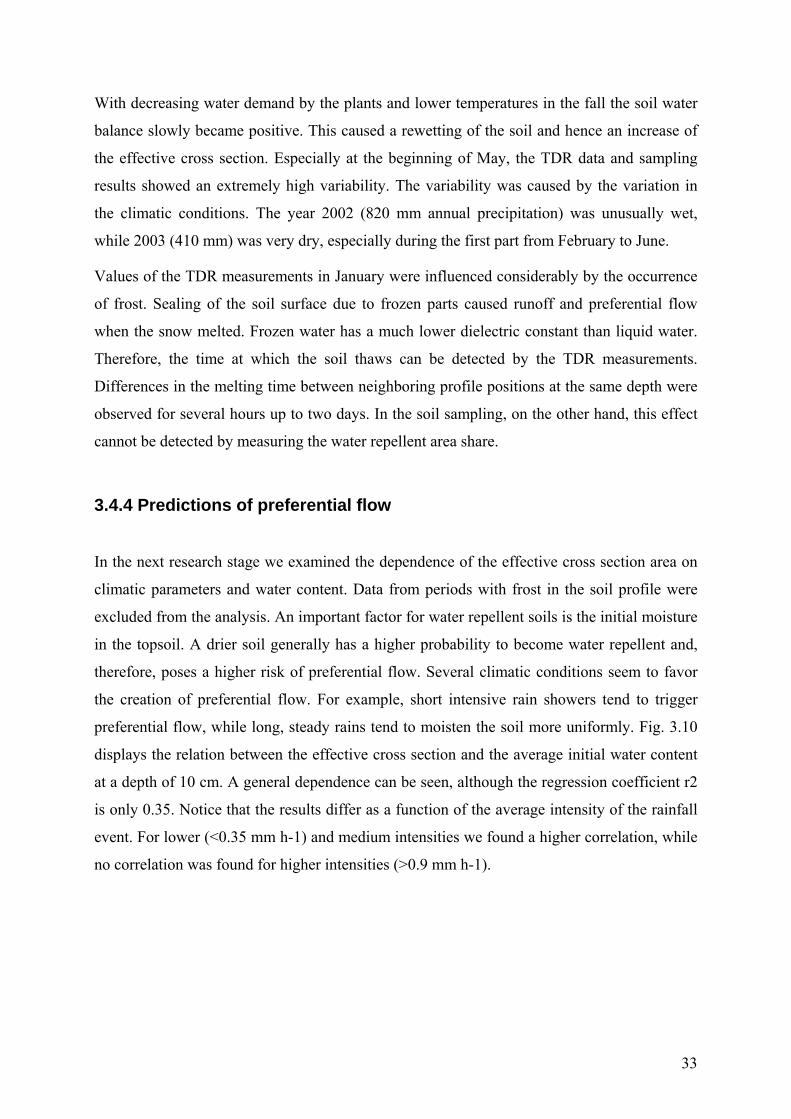
3.4.4 Predictions of preferential flow
In the next research stage we examined the dependence of the effective cross section area on
climatic parameters and water content. Data from periods with frost in the soil profile were
excluded from the analysis. An important factor for water repellent soils is the initial moisture
in the topsoil. A drier soil generally has a higher probability to become water repellent and,
therefore, poses a higher risk of preferential flow. Several climatic conditions seem to favor
the creation of preferential flow. For example, short intensive rain showers tend to trigger
preferential flow, while long, steady rains tend to moisten the soil more uniformly. Fig. 3.10
displays the relation between the effective cross section and the average initial water content
at a depth of 10 cm. A general dependence can be seen, although the regression coefficient r2
is only 0.35. Notice that the results differ as a function of the average intensity of the rainfall
event. For lower (<0.35 mm h-1) and medium intensities we found a higher correlation, while
no correlation was found for higher intensities (>0.9 mm h-1).
33
0.0
0.2
0.4
0.6
0.8
0.00 0.05 0.10 0.15initial soil moisture [m³/m³]
lowmediumhigh
average rainfall intensities:
effe
ctiv
e cr
oss
sect
ion
[m²/m
²]
Fig. 3.10: Effective cross section and initial soil moisture at 10 cm depth for relatively
low (squares), medium (circles) and high (triangle) average rainfall intensities.
The effective cross section calculated from the TDR data was found to be a function of
several parameters. We examined several empirical correlations to predict the effective cross
section using results of 20 rainfall events during one year. The factors we used in the
prediction were the initial water content at 10 cm depth, the amount, intensity and duration of
rainfall, the potential evaporation rate and the climatic water balance (precipitation minus
potential evapotranspiration) for different periods before the rainfall events. Different
functional dependences (linear, quadratic, power function, hyperbolic) were tested. To this
end, the sum of square roots between calculated and measured effective cross sections were
optimized by using a numerical solver.
The initial soil moisture at a depth of 10 cm (at the beginning of the rainfall event) was found
to have the greatest influence on the occurrence of preferential flow. Good results were
achieved using the linear relationship
ECS = 3.9*θ10 -0.24*I+ 0.0020*Ep+0.0072 * R [4]
where ECS is the effective cross section (m2·m-2), θ10 is the average initial water content at
10 cm (m³·m-³), I is the average intensity of a particular rainfall event (mm·h-1), Ep is the
potential evaporation over a 24-d period (mm) and R is the rainfall amount (mm).
34
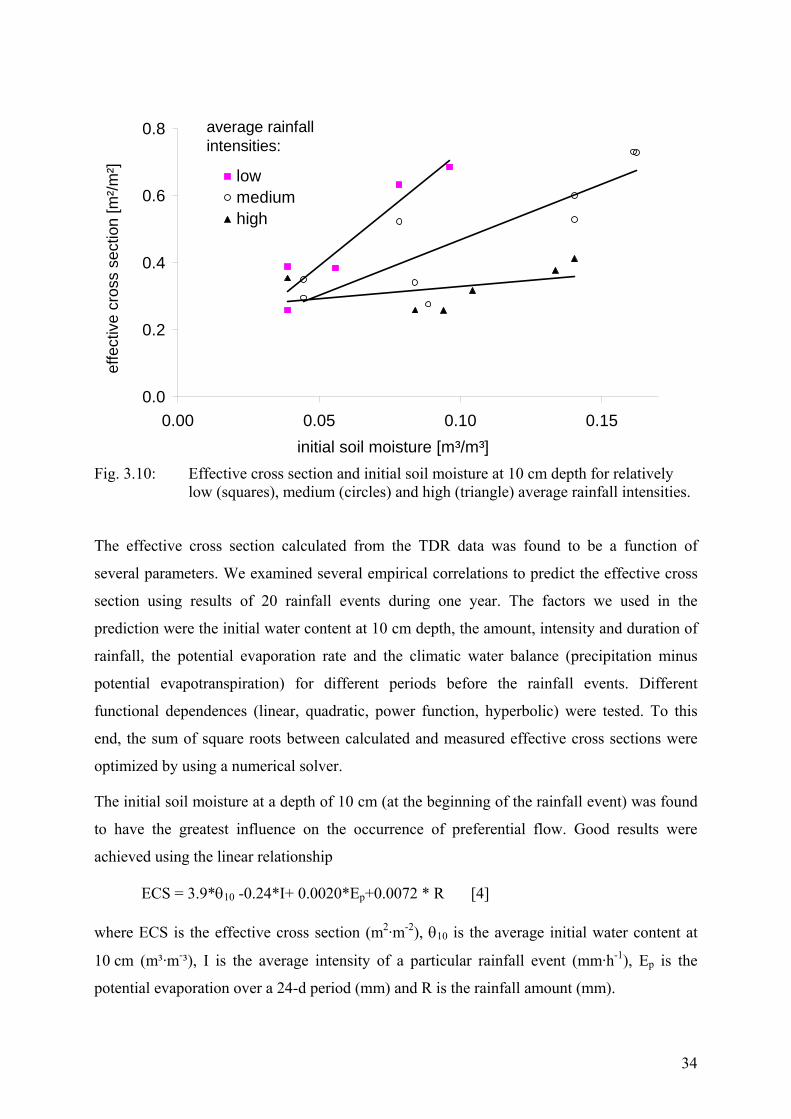
Fig. 3.11 shows a comparison between the effective cross sections calculated from TDR
measurements and the predicted values from Eq. [4]. The use of quadratic equations gave
only slightly better results, while hyperbolic or power functions produced worse results.
0
0.2
0.4
0.6
0.8
1
Apr-1 Jul-1 Sep-1 Dec-1
effe
ctiv
e cr
oss
sect
ion
[m²/m
²]
calculatedpredicteddeviation
average deviation: 7%
homogeneous soil: 0.9
Fig. 3.11: Values of the effective cross section, ECS, calculated from TDR measurements, and predicted values with Eq. [4].
35
4. Part III - Stability of flow patterns in water repellent soils - conclusions of a time delayed double tracer experiment and TDR measurements
4.1 Abstract
In order to examine the stability of flow paths, a time-delayed double tracer experiment was
conducted on a water repellent sandy site by applying two different tracers on one plot at
various points of time (a bromide tracer in the spring of 2002, a chloride tracer during autumn
of 2002). Additional TDR-measurements were carried out on an adjacent plot in hourly
intervals. After a travel time of 328 (bromide) i.e. 87 (chloride) days the profile was
excavated and small-scale soil samples were taken by disturbing the site along a set pattern.
The chloride tracer which was applied during autumn showed a distribution typical for
fingering. The bromide tracer, which had already been applied during spring, was highly
concentrated in dry, wetting-resistant areas, indicating that a transport into these areas must
have taken place during the spring time. A different flow regime must have been
predominant. Although the tracer experiment did not allow conclusions as to whether the flow
paths always remain constant during the passages in spring and autumn, but they can be
categorized. About 10% were classified as main flow paths, 45% as moderate flow path, 40%
as sparsely flow paths, and in about 5% of the area no tracer was transported. The hourly
recordings of the TDR-measurements showed that in consecutive precipitation events the flow
paths stay the same. When comparing long time intervals, e.g. autumn 2002 – autumn 2003, a
spatial alteration of the flow fingers was observed. Therefore, the formation of flow fingers is
also a random event of the rewetting process.
36
4.2 Introduction
Water repellency is a widespread phenomenon that can have a significant effect on
water flow in soils. It is not a permanent property. Soils become water repellent when they
desiccate during dry periods in the summer, with water repellency often diminishing or
vanishing when the soil becomes wet in the autumn or during wintertime (Dekker and
Ritsema, 1994; Greifenhagen et al., 2006). The fact that water prefers the same flow paths
after consecutive precipitation events is well described in literature and in our own
experiments. Glass et al. (1989) and Liu et al. (1993) found that the distribution of water
contents and flow paths was strongly influenced by earlier infiltrations with fingered flow.
Previous finger paths were preserved because of hysteresis in the soil moisture retention. Soil
seems to have some sort of memory for flow paths. However, it has not been examined as yet
if these flow paths remain stable or if they vary during the seasons. Täumer et al. (2006)
showed that the tendency towards preferential flow takes a clear seasonal course. The
resulting effective cross sections vary: high effective cross section – the infiltration is
homogenously distributed, low effective cross section – only certain regions of the soil
participate in the flow events (Fig 4.1). The seasonal course is caused by climatic factors and
by plant growth i.e. water uptake of roots. The best parameter to reflect the tendency toward
preferential flow is the amount of water available in the upper soil. It is typical that a
sufficient water supply during the winter months results in a low tendency towards
preferential flow. Dryness during the summer period, on the other hand, encourages a high
development of preferential flow. The water demand of the vegetation during autumn and
winter is low and the evaporation amounts to 15-0% of the total annual evaporation (Renger
and Wessolek, 2000), so that flow paths do not dry out completely and can be used again for
the next event. Dry patches in the soil are gradually moistened. Ritsema et al. (1998) used an
array of TDR probes to demonstrate the occurrence of fingering after three rainfall events;
however, they did not determine seasonal changes in preferential flow.
Various tracer experiments have been carried out in soil science to mark preferential flow
paths. Conservative tracers like bromide and chloride have been used as well as dye or
fluorescence tracers. One disadvantage of dye tracers is the temporal decay of the tracer.
Therefore, most of the shorter experiments with irrigation have been carried out using dye
tracers (Vanderborght et al., 2002; Forrer et al., 2000), while in long term experiments
inorganic anions like bromide or chloride predominate (Dyck, 2003; Kohne et al., 2005;
Hammel et al., 1999). Bromide is the most suitable tracer in the group of inorganic anions
37
(Flury and Wai, 2003), because of its low concentration in natural soils. Ritsema and Dekker
(1998) and Arbel et al. (2005) conducted tracer experiments to mark preferential flow paths in
water repellent soils.
Multi-tracer experiments were used in several studies (Kung et al., 2000; Kasteel et al., 2003;
Wang et al., 2002; Koschinski et al., 2006). Hangen et al. (2005) applied a tracer cocktail
consisting of bromide, terbuthylazine, and deuterium to the soil surface of a potentially water
repellent lime soil and subjected it to natural infiltration. Tracer concentrations in drainage
waters were analyzed for a period of about 10 months. They determined a sectional drainage
area in 110 cm depth of 71% in spring and 35% in autumn. The results for bromide and
deuterium were comparable, the absence of terbuthylazine indicates the absence of rapid flow
in the soil. Several authors showed that bromide is adsorbed slightly in the soil (Brooks et al.,
1998; Clay et al., 2004). Until now, time delayed double tracer experiments in order to mark
the flow path at different seasons had not been conducted on water repellent soils.
The aim of our study was to detect preferential flow paths during different seasons. For this
purpose we performed a double tracer experiment using bromide in early spring and chloride
in autumn. The bromide is intended to mark the areas of flow paths during spring and summer
time, the chloride those of autumn. Excavations during the dry summer periods showed that
the complete soil was dry and extremely resistant to wetting. Differences in the inhibition of
the wetting, caused by earlier flow paths, or in the moisture levels could not be determined
(Täumer et al., 2005). According to these experiences, the memory for certain flow paths i.e.
patterns did not outlast the summer. Should a change in flow paths occur, it will not happen
during consecutive precipitation events during winter or spring but during the rewetting
period in autumn. This hypothesis holds true only if the soil dries out completely in the
summer and the “flow path memory” has been deleted. In order to test the hypothesis, a study
was carried out with two different tracers (bromide and chloride) that were applied at different
points of time. The bromide tracer was applied twice during spring with the aim of recording
the old flow regime. The second tracer (chloride) was applied once after the first precipitation
events in autumn. According to our hypothesis, new flow paths can only be formed during
this season and this rewetting phase if there were dry phases during the summer.
38
0
20
40
60
80pr
ecip
. wee
kly
(mm
)
Fig. 4.1: Weekly rainfall during the experiment and effective cross section (measured by TDR (■) and soil sampling ( )) during the tracer experiment.
4.3 Material and methods
4.3.2 Laboratory measurements
Actual water repellency was determined with the Water Drop Penetration Time (WDPT) test
as described by several authors (e.g. Krammes and DeBano, 1965; Dekker and Jungerius,
1990). In order to establish the actual repellency, three drops of distilled water were placed on
the smoothened surface of a field moist soil sample using a standard glass pipette. The time
that elapsed before the drops were absorbed was measured. The potential water repellency of
the same samples was also tested after drying them at 35° C for two weeks. Dekker and
Ritsema (1994) described the potential water repellency as the most appropriate parameter for
comparing water repellency of soils, because differences in water content are eliminated.
A repellency index was applied allowing a quantitative description of the severity of water
repellency as described by Dekker and Jungerius (1990). Seven classes of repellency were
0
0.2
0.4
0.6
0.8
1
03/02 04/02 05/02 06/02 07/02 08/02 09/02 10/02 11/02 12/02 01/03date (month/year)
effe
ctiv
e cr
oss
sect
ion
(m2 /m
2 )
39
distinguished, ranging from wettable with a WDPT of less than 5 s to extremely water
repellent with a WDPT of more than 6 h (see tab 4.1).
Tab. 4.1: Classes of WDPT used in this study Classes Class 0 Class 1 Class 2 Class 3 Class 4 Class 5 Class 6 WDPT < 5 s 5 – 60 s 1-10 min 10-60 min 1 – 3 h 3 – 6 h > 6 h
slightly strongly severely extremely wettable water repellent
The water content of all samples was determined gravimetrically by drying them at 105° C.
Afterwards, the dry samples were used to measure the content of organic matter by igniting
the samples for 5h at 550°C. The difference between the dried and ignited samples was taken
as the organic matter content, since the samples are non-calcareous.
30 g of air dried soil were shaken for 2 hours with 50 ml distilled water. The concentration of
the tracer elements chloride and bromide was measured with a liquid chromatograph Dionex
DX-120.
4.3.3 Calculation of climate water balance and percolation rate
In order to reach a better understanding of the tracer transport, the climate water balance
(precipitation minus potential evapotranspiration) and soil water flow quantities during the
experiment were estimated roughly using a simple 1d-numerical simulation model without
considering water repellency or hysteresis. The climate data was taken from the nearest
climate station in Berlin Tegel, which is about 5 km away from the tracer site. The climate
water balance and net infiltration rates were calculated on a daily basis. The necessary water
retention and unsaturated hydraulic conductivity functions were derived by fitting the
measured hydraulic data according to Mualem (1976) and van Genuchten (1980). The
potential evapotranspiration was calculated using the FAO Penman-Montheith grass reference
formula (Allen, 2000), the actual evapotranspiration following a modified approach of
Rijtema (1968). The difference between measured cumulative precipitation and actual
evapotranspiration was used to calculate net infiltration for the periods after tracer application.
To get a first impression about the traveling depths of the bromide and chloride center of
mass, the piston flow concept was used by dividing the percolation rate by the cumulative soil
water content from a matric potential of pF 1.8.
40
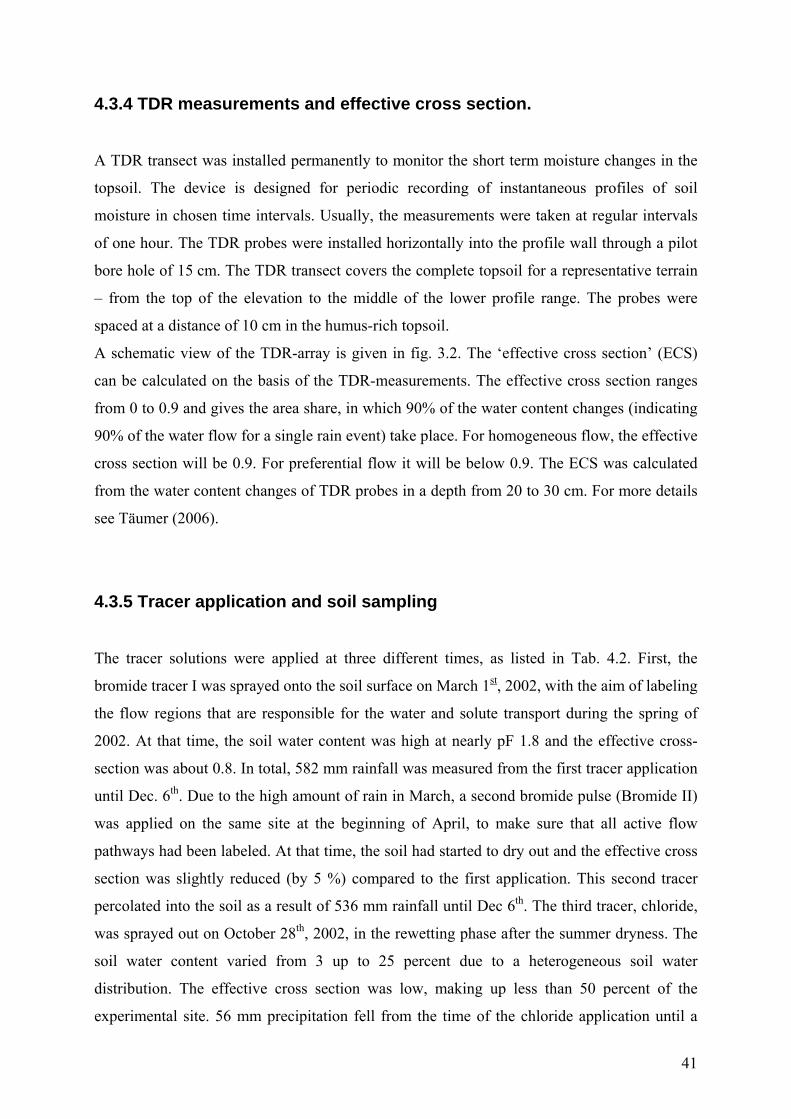
41
4.3.4 TDR measurements and effective cross section.
A TDR transect was installed permanently to monitor the short term moisture changes in the
topsoil. The device is designed for periodic recording of instantaneous profiles of soil
moisture in chosen time intervals. Usually, the measurements were taken at regular intervals
of one hour. The TDR probes were installed horizontally into the profile wall through a pilot
bore hole of 15 cm. The TDR transect covers the complete topsoil for a representative terrain
– from the top of the elevation to the middle of the lower profile range. The probes were
spaced at a distance of 10 cm in the humus-rich topsoil.
A schematic view of the TDR-array is given in fig. 3.2. The ‘effective cross section’ (ECS)
can be calculated on the basis of the TDR-measurements. The effective cross section ranges
from 0 to 0.9 and gives the area share, in which 90% of the water content changes (indicating
90% of the water flow for a single rain event) take place. For homogeneous flow, the effective
cross section will be 0.9. For preferential flow it will be below 0.9. The ECS was calculated
from the water content changes of TDR probes in a depth from 20 to 30 cm. For more details
see Täumer (2006).
4.3.5 Tracer application and soil sampling
The tracer solutions were applied at three different times, as listed in Tab. 4.2. First, the
bromide tracer I was sprayed onto the soil surface on March 1st, 2002, with the aim of labeling
the flow regions that are responsible for the water and solute transport during the spring of
2002. At that time, the soil water content was high at nearly pF 1.8 and the effective cross-
section was about 0.8. In total, 582 mm rainfall was measured from the first tracer application
until Dec. 6th. Due to the high amount of rain in March, a second bromide pulse (Bromide II)
was applied on the same site at the beginning of April, to make sure that all active flow
pathways had been labeled. At that time, the soil had started to dry out and the effective cross
section was slightly reduced (by 5 %) compared to the first application. This second tracer
percolated into the soil as a result of 536 mm rainfall until Dec 6th. The third tracer, chloride,
was sprayed out on October 28th, 2002, in the rewetting phase after the summer dryness. The
soil water content varied from 3 up to 25 percent due to a heterogeneous soil water
distribution. The effective cross section was low, making up less than 50 percent of the
experimental site. 56 mm precipitation fell from the time of the chloride application until a
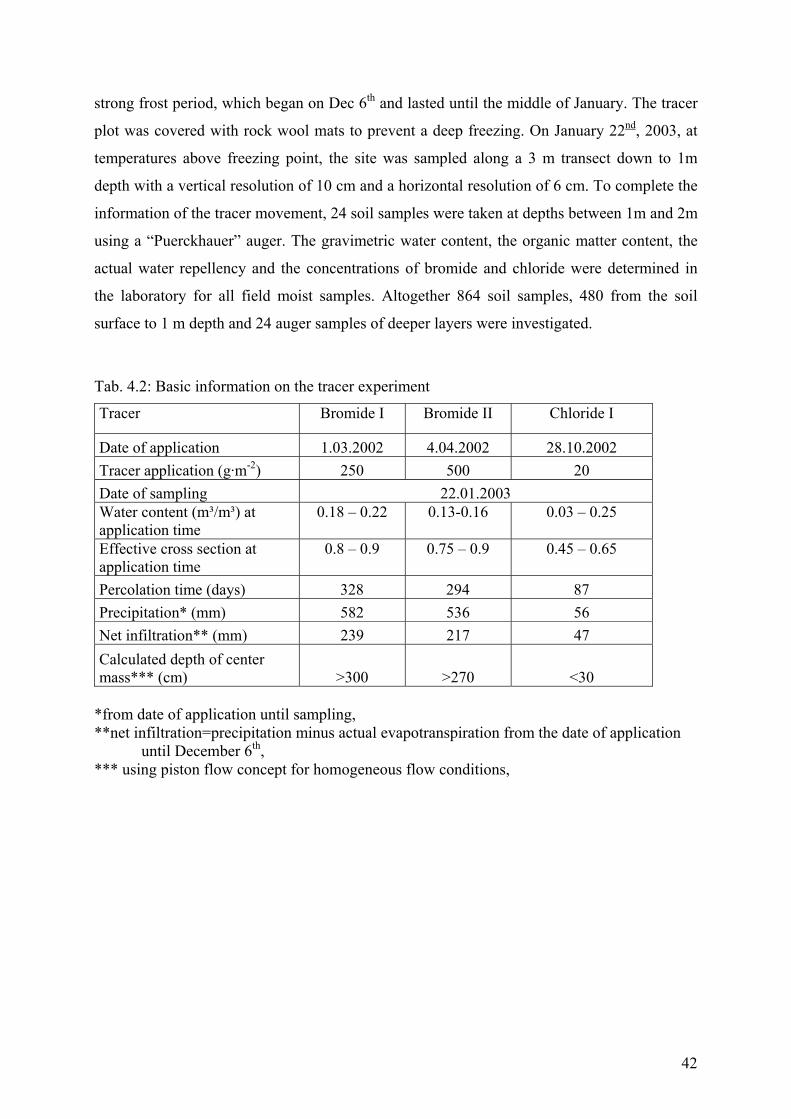
42
strong frost period, which began on Dec 6th and lasted until the middle of January. The tracer
plot was covered with rock wool mats to prevent a deep freezing. On January 22nd, 2003, at
temperatures above freezing point, the site was sampled along a 3 m transect down to 1m
depth with a vertical resolution of 10 cm and a horizontal resolution of 6 cm. To complete the
information of the tracer movement, 24 soil samples were taken at depths between 1m and 2m
using a “Puerckhauer” auger. The gravimetric water content, the organic matter content, the
actual water repellency and the concentrations of bromide and chloride were determined in
the laboratory for all field moist samples. Altogether 864 soil samples, 480 from the soil
surface to 1 m depth and 24 auger samples of deeper layers were investigated.
Tab. 4.2: Basic information on the tracer experiment
Tracer Bromide I Bromide II Chloride I
Date of application 1.03.2002 4.04.2002 28.10.2002 Tracer application (g·m-2) 250 500 20 Date of sampling 22.01.2003 Water content (m³/m³) at application time
0.18 – 0.22 0.13-0.16 0.03 – 0.25
Effective cross section at application time
0.8 – 0.9 0.75 – 0.9 0.45 – 0.65
Percolation time (days) 328 294 87 Precipitation* (mm) 582 536 56 Net infiltration** (mm) 239 217 47 Calculated depth of center mass*** (cm) >300 >270 <30
*from date of application until sampling, **net infiltration=precipitation minus actual evapotranspiration from the date of application
until December 6th, *** using piston flow concept for homogeneous flow conditions,
43
4.4 Results and discussion
4.4.1 Climate water balance and percolation during the experiment
On the whole, the year 2002 can be described as moist and warm, with a mean temperature of
10.3°C and a precipitation 821mm (annual weather report of the Humboldt University,
Berlin). The month of August was particularly wet, with 120mm rainfall being recorded at the
measuring site, which is about twice as much as the annual average. Starting in October,
2002, all values for the climatic water balance were positive, so that the profile was gradually
rewetted. Fig 4.2 shows the climate water balance and the cumulative net infiltration. The
results of the daily climate measurements were integrated into values per week in order to
obtain the climate water balance (bars). The cumulative net infiltration was calculated from
the daily precipitation and the actual evaporation as shown in chapter 2.3.
The grey areas mark a strong frost period. The dotted lines at the beginning of March and
April indicate the application of bromide. The dotted line at the end of October shows the
chloride application. It can be observed that almost no drainage occurred after the end of
April. In the summer months there is usually no percolation, with August representing an
exception due to extremely heavy precipitation. Starting in October, sinking evaporation rates
led to positive water balance values, and percolation occurred again.
-60
-40
-20
0
20
40
60
Mar. 02 Apr. 02 May. 02 Jun. 02 Aug. 02 Sep. 02 Oct. 02 Nov. 02 Dec. 02 Jan. 03
clim
atic
wat
er b
alan
ce (
mm
)
0
50
100
150
200
250
300
net i
nfilt
ratio
n cu
mm
. (m
m)cwb
net inf.
Fig. 4.2: Weekly climate water balance (cwb=rainfall minus potential evapotranspiration) and
cumulative net infiltration during the tracer experiment. The dotted lines indicate the tracer applications. The frost period is shaded grey, sampling is indicated by the thick black line.
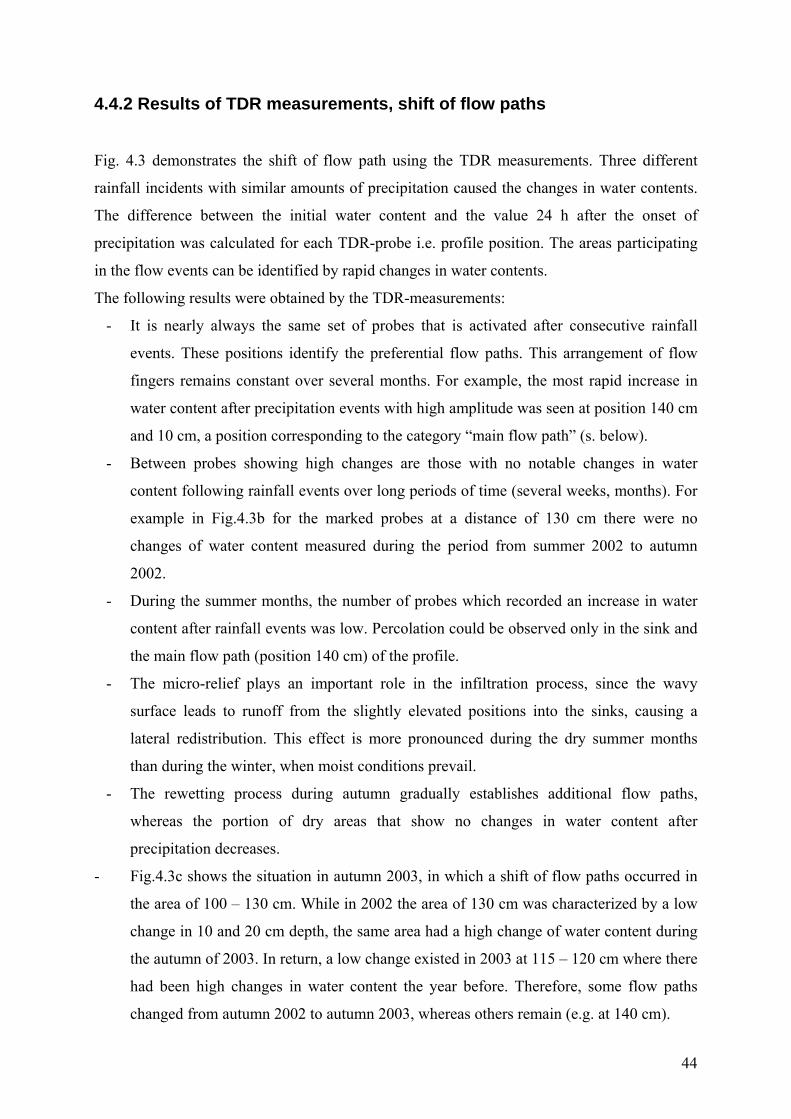
44
4.4.2 Results of TDR measurements, shift of flow paths
Fig. 4.3 demonstrates the shift of flow path using the TDR measurements. Three different
rainfall incidents with similar amounts of precipitation caused the changes in water contents.
The difference between the initial water content and the value 24 h after the onset of
precipitation was calculated for each TDR-probe i.e. profile position. The areas participating
in the flow events can be identified by rapid changes in water contents.
The following results were obtained by the TDR-measurements:
- It is nearly always the same set of probes that is activated after consecutive rainfall
events. These positions identify the preferential flow paths. This arrangement of flow
fingers remains constant over several months. For example, the most rapid increase in
water content after precipitation events with high amplitude was seen at position 140 cm
and 10 cm, a position corresponding to the category “main flow path” (s. below).
- Between probes showing high changes are those with no notable changes in water
content following rainfall events over long periods of time (several weeks, months). For
example in Fig.4.3b for the marked probes at a distance of 130 cm there were no
changes of water content measured during the period from summer 2002 to autumn
2002.
- During the summer months, the number of probes which recorded an increase in water
content after rainfall events was low. Percolation could be observed only in the sink and
the main flow path (position 140 cm) of the profile.
- The micro-relief plays an important role in the infiltration process, since the wavy
surface leads to runoff from the slightly elevated positions into the sinks, causing a
lateral redistribution. This effect is more pronounced during the dry summer months
than during the winter, when moist conditions prevail.
- The rewetting process during autumn gradually establishes additional flow paths,
whereas the portion of dry areas that show no changes in water content after
precipitation decreases.
- Fig.4.3c shows the situation in autumn 2003, in which a shift of flow paths occurred in
the area of 100 – 130 cm. While in 2002 the area of 130 cm was characterized by a low
change in 10 and 20 cm depth, the same area had a high change of water content during
the autumn of 2003. In return, a low change existed in 2003 at 115 – 120 cm where there
had been high changes in water content the year before. Therefore, some flow paths
changed from autumn 2002 to autumn 2003, whereas others remain (e.g. at 140 cm).
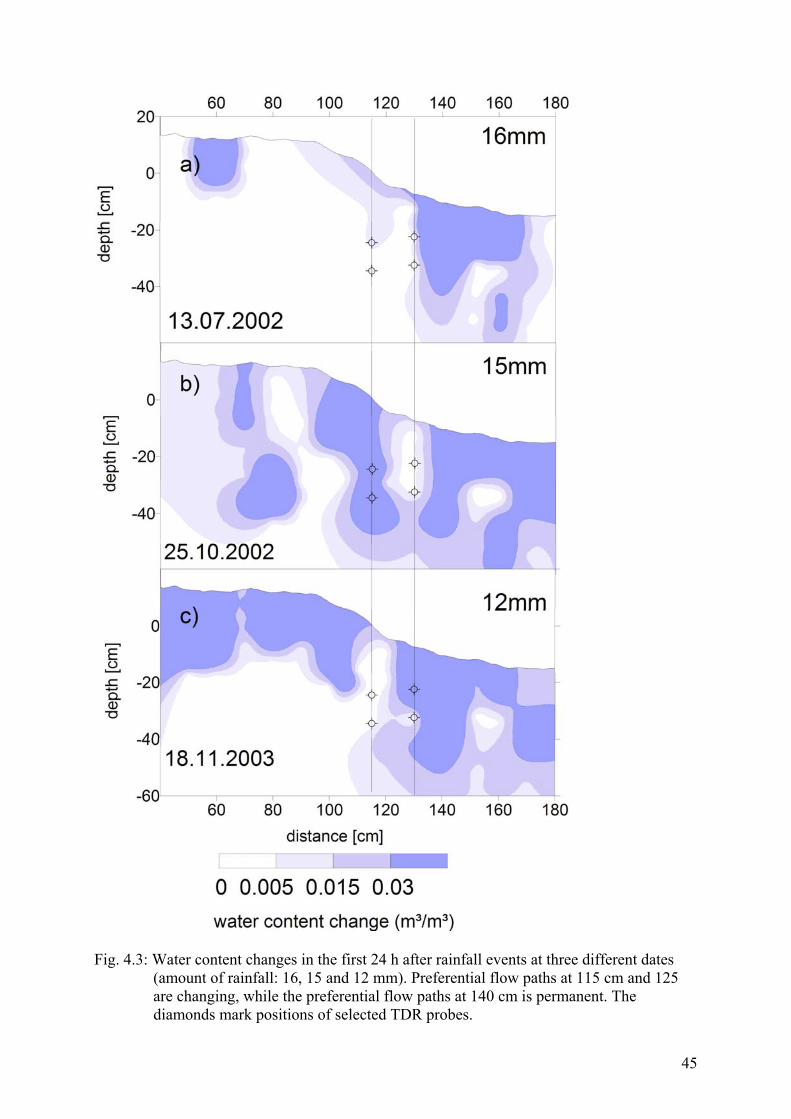
45
Fig. 4.3: Water content changes in the first 24 h after rainfall events at three different dates
(amount of rainfall: 16, 15 and 12 mm). Preferential flow paths at 115 cm and 125 are changing, while the preferential flow paths at 140 cm is permanent. The diamonds mark positions of selected TDR probes.
46
4.4.3 Water content and water repellency
The results of the excavations in January 2003 showed the water contents and actual water
repellency distribution at the time of the sampling. The profile showed a clear pattern of light
(=dry) and dark (=moist) areas. At the time of the sampling, 51% of the samples at depths
from 10cm to 30 cm were classified as extremely water repellent. The percentage of wettable
soil was at a low 26%. The water content of the top soil varied between 0.04g g-1 and 0.24g g-
1. The areas with high water contents in Fig.4.4a correspond to the wettable areas in Fig.4.4b.
Almost all samples taken from the subsoil were wettable. There were 7 regions with extreme
WDPT times of more than three hours. On the other hand, there were seven wettable regions
in the topsoil, indicating the flow paths. It has to be taken into account that the figure only
displays a two-dimensional plane of a three dimensional soil.
-100
-50
0
0
3
5
8
10
14
20
-100
-50
0
0
0.2
0.18
0.1
0.08
0.05
0.03
0
wettable
> 6h
5-60s
1-10 min
10-60 min
1-3 h
3-6 h
WDPT
a
b
Θ (g g )-1
dept
h (c
m)
Fig. 4.4: Soil water distribution (top) and actual water repellency (bottom) at the date of sampling
47
4.4.4 Tracer transport
Chloride distribution
Even though the chloride tracer was applied at the end of October and the cumulative net
infiltration amounted to only 47 mm (Fig.4.5), increased levels of chloride concentrations
were found up to a depth of 200 cm in about 85% of the samples. The total recovery rate of
chloride was 99%, the background concentration was about 3 µg·kg-1. The distribution is
determined mainly by the preferential flow paths in autumn due to water repellency. The three
following observations are typical for the chloride distribution:
- Large areas of the topsoil show no increased chloride concentrations. These areas
correspond to the water repellent areas or lie directly below these areas (see Fig.4.5).
- The bulk of chloride is found at a depth between 100 and 200 cm, with a very large
uninterrupted spot between the transect position 120 and 220 at a depth of 1 to 2 m.
The recovery rates in this area were distinctly above 100%. The maximum of the
chloride concentration is at a depth of 1.20 m below the soil surface, which is far
lower than the calculations of a piston flow concept (s. Fig.4.5).
- The positions with high water contents in the top soil also have a high chloride
concentration (Fig.4.4 and Fig.4.5). This shows that these areas participate in the flow
events in autumn.
Bromide distribution
First of all it has to be pointed out that bromide was found in 99 percent of all samples. The
background concentration was ~0.7 mg·kg-1. In 95 percent the concentration was higher than
5 g·kg-1.
In general, the bromide distribution in Fig.4.5 shows three concentration characteristics:
(i) a relatively low overall concentration,
(ii) spots with high bromide concentrations in the topsoil and
(iii) fingers in between with low bromide values.
The recovery rate of bromide refers to the sum of the applied tracers (bromide I and II).
However, it is not possible to determine if a pattern is caused by the first or by the second
bromide pulse. With values between 5 and 25% the recovery rate is low. We assume that the
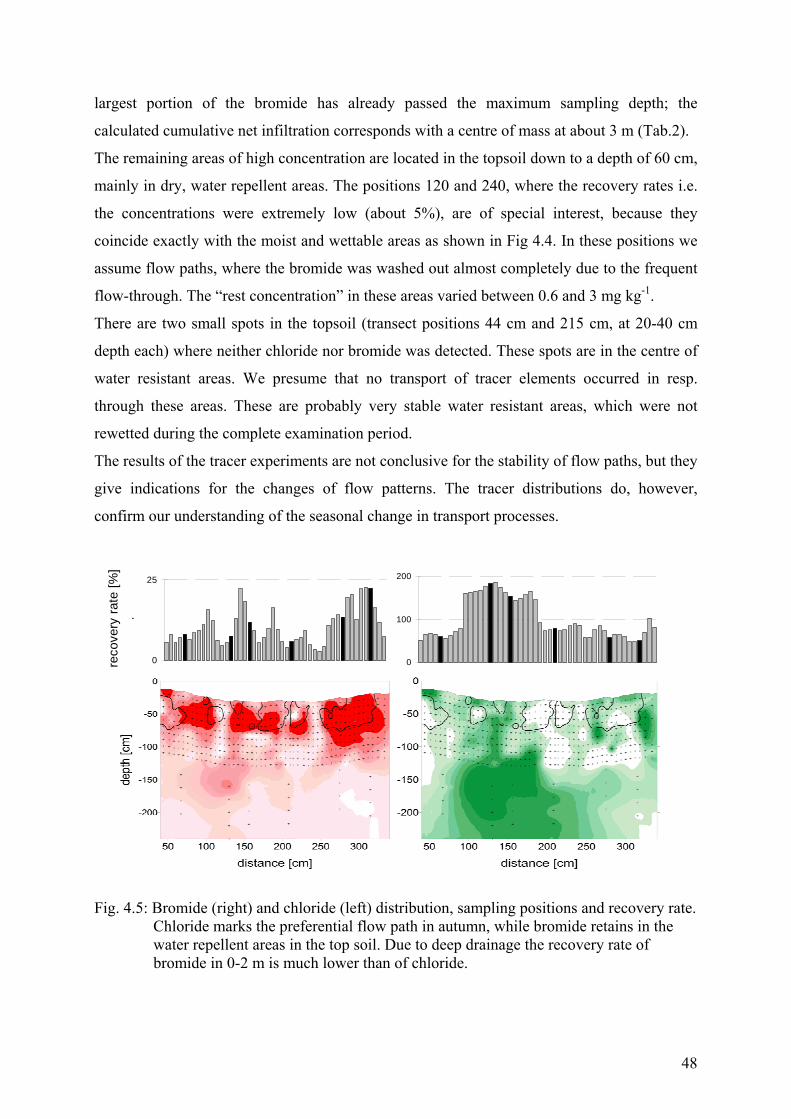
48
largest portion of the bromide has already passed the maximum sampling depth; the
calculated cumulative net infiltration corresponds with a centre of mass at about 3 m (Tab.2).
The remaining areas of high concentration are located in the topsoil down to a depth of 60 cm,
mainly in dry, water repellent areas. The positions 120 and 240, where the recovery rates i.e.
the concentrations were extremely low (about 5%), are of special interest, because they
coincide exactly with the moist and wettable areas as shown in Fig 4.4. In these positions we
assume flow paths, where the bromide was washed out almost completely due to the frequent
flow-through. The “rest concentration” in these areas varied between 0.6 and 3 mg kg-1.
There are two small spots in the topsoil (transect positions 44 cm and 215 cm, at 20-40 cm
depth each) where neither chloride nor bromide was detected. These spots are in the centre of
water resistant areas. We presume that no transport of tracer elements occurred in resp.
through these areas. These are probably very stable water resistant areas, which were not
rewetted during the complete examination period.
The results of the tracer experiments are not conclusive for the stability of flow paths, but they
give indications for the changes of flow patterns. The tracer distributions do, however,
confirm our understanding of the seasonal change in transport processes.
0
100
200
0
25
reco
very
rate
[%]
.
0
100
200
0
25
reco
very
rate
[%]
.
Fig. 4.5: Bromide (right) and chloride (left) distribution, sampling positions and recovery rate. Chloride marks the preferential flow path in autumn, while bromide retains in the water repellent areas in the top soil. Due to deep drainage the recovery rate of bromide in 0-2 m is much lower than of chloride.
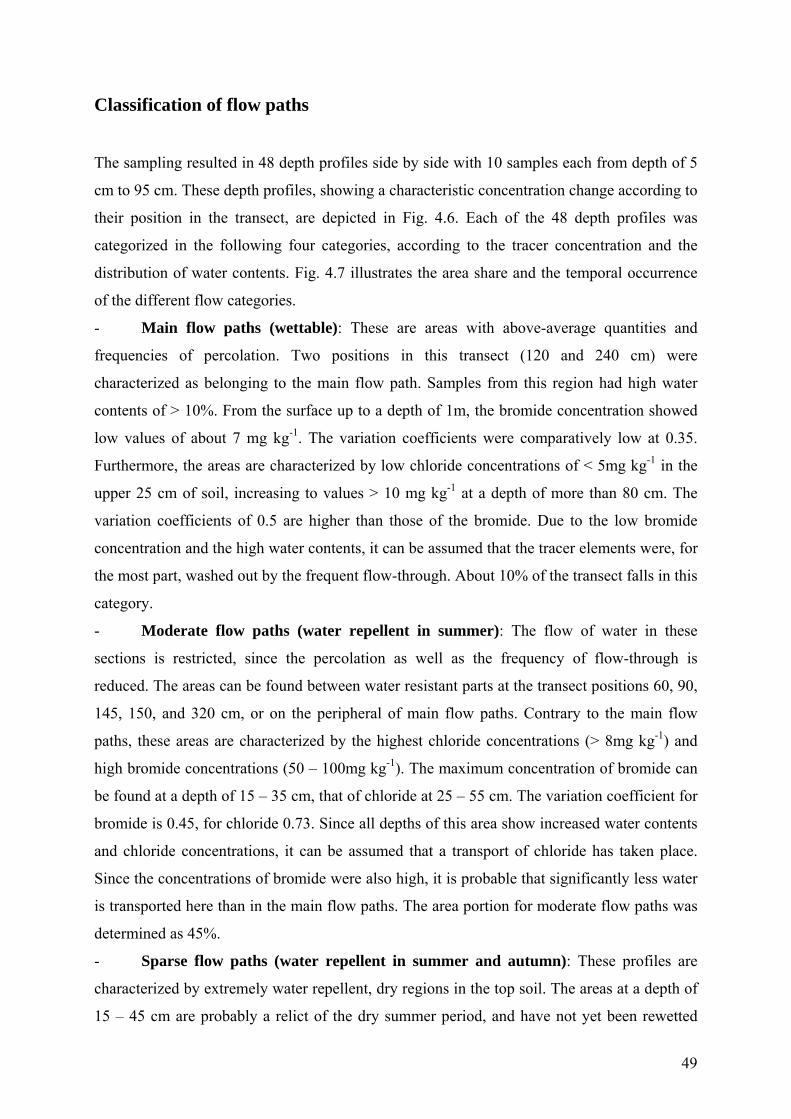
49
Classification of flow paths
The sampling resulted in 48 depth profiles side by side with 10 samples each from depth of 5
cm to 95 cm. These depth profiles, showing a characteristic concentration change according to
their position in the transect, are depicted in Fig. 4.6. Each of the 48 depth profiles was
categorized in the following four categories, according to the tracer concentration and the
distribution of water contents. Fig. 4.7 illustrates the area share and the temporal occurrence
of the different flow categories.
- Main flow paths (wettable): These are areas with above-average quantities and
frequencies of percolation. Two positions in this transect (120 and 240 cm) were
characterized as belonging to the main flow path. Samples from this region had high water
contents of > 10%. From the surface up to a depth of 1m, the bromide concentration showed
low values of about 7 mg kg-1. The variation coefficients were comparatively low at 0.35.
Furthermore, the areas are characterized by low chloride concentrations of < 5mg kg-1 in the
upper 25 cm of soil, increasing to values > 10 mg kg-1 at a depth of more than 80 cm. The
variation coefficients of 0.5 are higher than those of the bromide. Due to the low bromide
concentration and the high water contents, it can be assumed that the tracer elements were, for
the most part, washed out by the frequent flow-through. About 10% of the transect falls in this
category.
- Moderate flow paths (water repellent in summer): The flow of water in these
sections is restricted, since the percolation as well as the frequency of flow-through is
reduced. The areas can be found between water resistant parts at the transect positions 60, 90,
145, 150, and 320 cm, or on the peripheral of main flow paths. Contrary to the main flow
paths, these areas are characterized by the highest chloride concentrations (> 8mg kg-1) and
high bromide concentrations (50 – 100mg kg-1). The maximum concentration of bromide can
be found at a depth of 15 – 35 cm, that of chloride at 25 – 55 cm. The variation coefficient for
bromide is 0.45, for chloride 0.73. Since all depths of this area show increased water contents
and chloride concentrations, it can be assumed that a transport of chloride has taken place.
Since the concentrations of bromide were also high, it is probable that significantly less water
is transported here than in the main flow paths. The area portion for moderate flow paths was
determined as 45%.
- Sparse flow paths (water repellent in summer and autumn): These profiles are
characterized by extremely water repellent, dry regions in the top soil. The areas at a depth of
15 – 45 cm are probably a relict of the dry summer period, and have not yet been rewetted
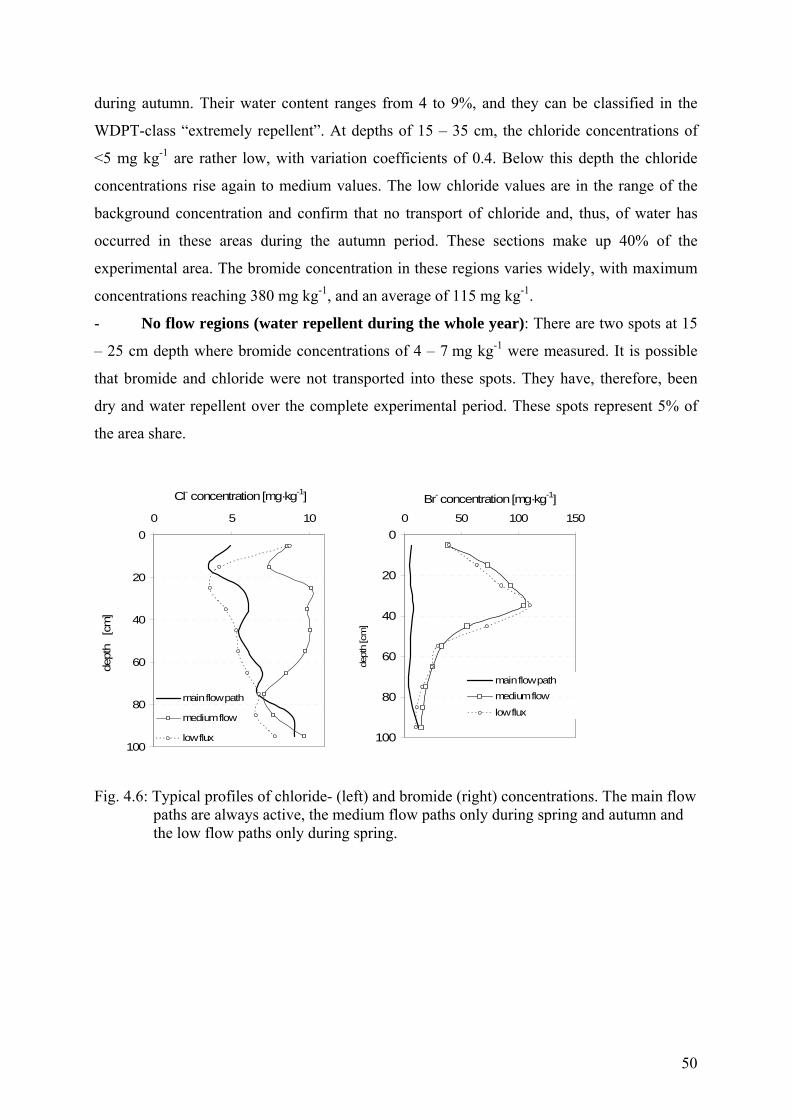
50
during autumn. Their water content ranges from 4 to 9%, and they can be classified in the
WDPT-class “extremely repellent”. At depths of 15 – 35 cm, the chloride concentrations of
<5 mg kg-1 are rather low, with variation coefficients of 0.4. Below this depth the chloride
concentrations rise again to medium values. The low chloride values are in the range of the
background concentration and confirm that no transport of chloride and, thus, of water has
occurred in these areas during the autumn period. These sections make up 40% of the
experimental area. The bromide concentration in these regions varies widely, with maximum
concentrations reaching 380 mg kg-1, and an average of 115 mg kg-1.
- No flow regions (water repellent during the whole year): There are two spots at 15
– 25 cm depth where bromide concentrations of 4 – 7 mg kg-1 were measured. It is possible
that bromide and chloride were not transported into these spots. They have, therefore, been
dry and water repellent over the complete experimental period. These spots represent 5% of
the area share.
0
20
40
60
80
100
0 5 10
Cl- concentration [mg·kg-1]
dept
h [
cm]
main flow path
medium flow
low flux
0
20
40
60
80
100
0 50 100 150
Br- concentration [mg·kg-1]
dept
h [c
m]
main flow pathmedium flow
low flux
Fig. 4.6: Typical profiles of chloride- (left) and bromide (right) concentrations. The main flow paths are always active, the medium flow paths only during spring and autumn and the low flow paths only during spring.
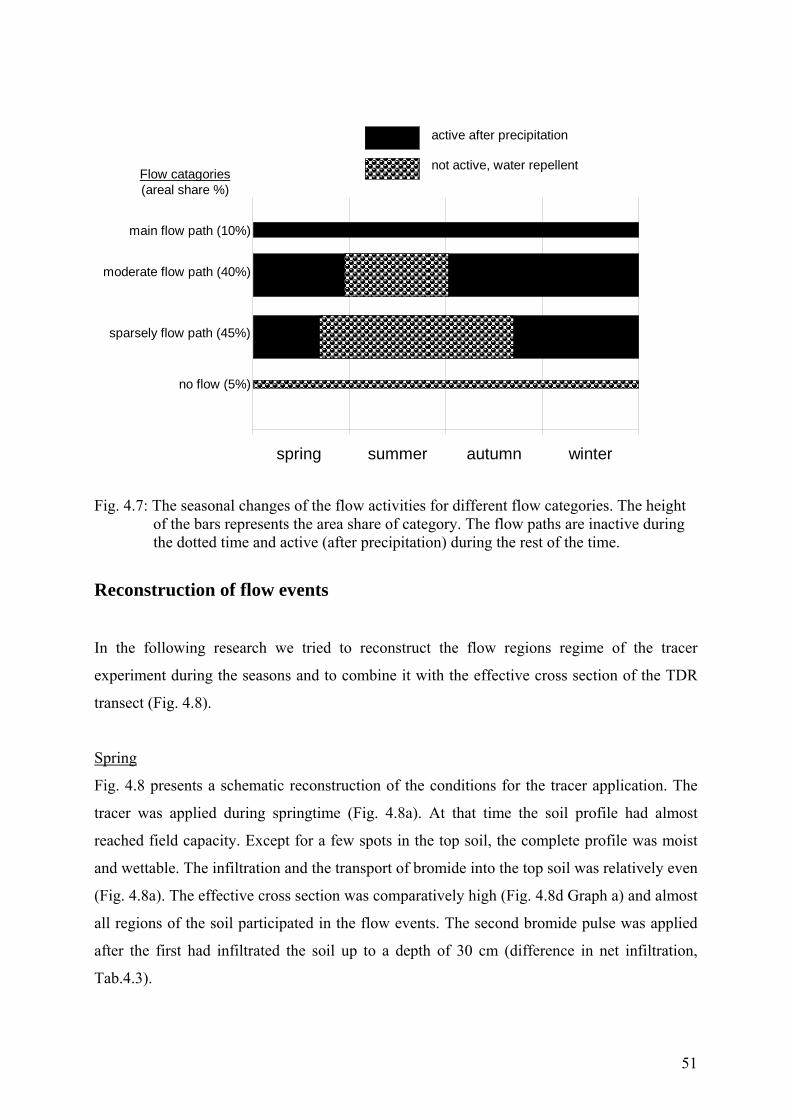
51
spring summer autumn winter
main flow path (10%)
no flow (5%)
moderate flow path (40%)
sparsely flow path (45%)
active after precipitation
not active, water repellentFlow catagories(areal share %)
Fig. 4.7: The seasonal changes of the flow activities for different flow categories. The height of the bars represents the area share of category. The flow paths are inactive during
the dotted time and active (after precipitation) during the rest of the time.
Reconstruction of flow events
In the following research we tried to reconstruct the flow regions regime of the tracer
experiment during the seasons and to combine it with the effective cross section of the TDR
transect (Fig. 4.8).
Spring
Fig. 4.8 presents a schematic reconstruction of the conditions for the tracer application. The
tracer was applied during springtime (Fig. 4.8a). At that time the soil profile had almost
reached field capacity. Except for a few spots in the top soil, the complete profile was moist
and wettable. The infiltration and the transport of bromide into the top soil was relatively even
(Fig. 4.8a). The effective cross section was comparatively high (Fig. 4.8d Graph a) and almost
all regions of the soil participated in the flow events. The second bromide pulse was applied
after the first had infiltrated the soil up to a depth of 30 cm (difference in net infiltration,
Tab.4.3).
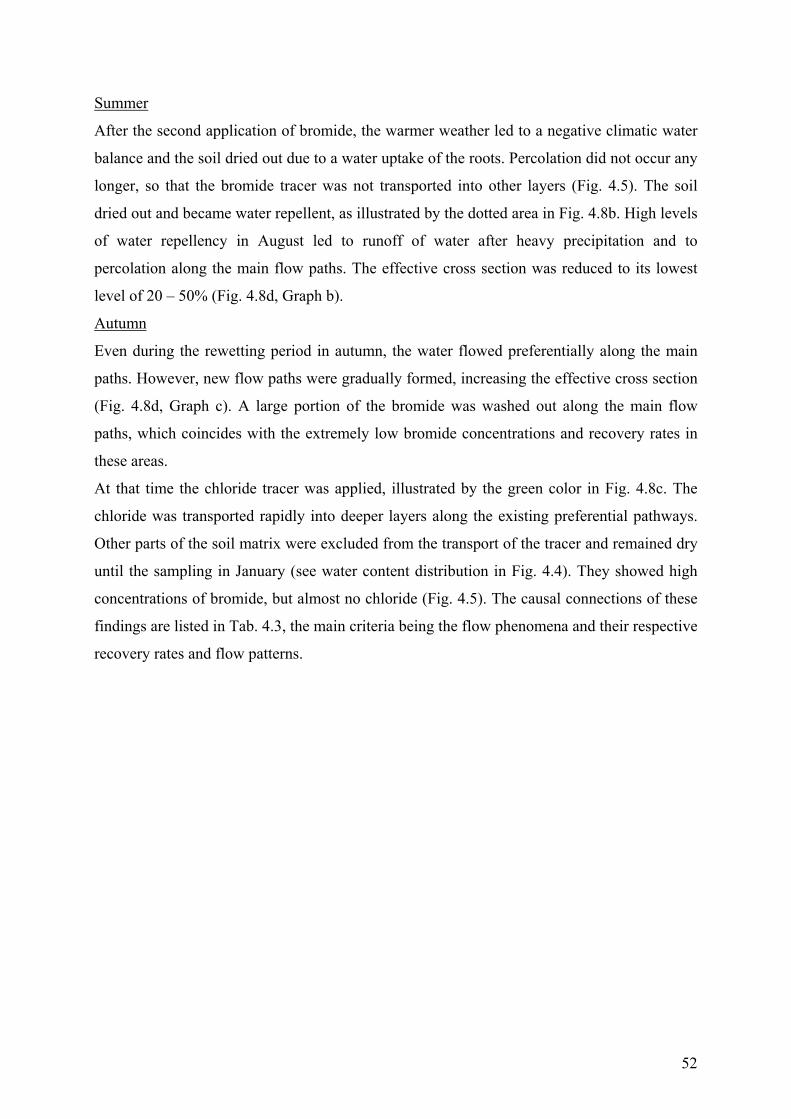
52
Summer
After the second application of bromide, the warmer weather led to a negative climatic water
balance and the soil dried out due to a water uptake of the roots. Percolation did not occur any
longer, so that the bromide tracer was not transported into other layers (Fig. 4.5). The soil
dried out and became water repellent, as illustrated by the dotted area in Fig. 4.8b. High levels
of water repellency in August led to runoff of water after heavy precipitation and to
percolation along the main flow paths. The effective cross section was reduced to its lowest
level of 20 – 50% (Fig. 4.8d, Graph b).
Autumn
Even during the rewetting period in autumn, the water flowed preferentially along the main
paths. However, new flow paths were gradually formed, increasing the effective cross section
(Fig. 4.8d, Graph c). A large portion of the bromide was washed out along the main flow
paths, which coincides with the extremely low bromide concentrations and recovery rates in
these areas.
At that time the chloride tracer was applied, illustrated by the green color in Fig. 4.8c. The
chloride was transported rapidly into deeper layers along the existing preferential pathways.
Other parts of the soil matrix were excluded from the transport of the tracer and remained dry
until the sampling in January (see water content distribution in Fig. 4.4). They showed high
concentrations of bromide, but almost no chloride (Fig. 4.5). The causal connections of these
findings are listed in Tab. 4.3, the main criteria being the flow phenomena and their respective
recovery rates and flow patterns.
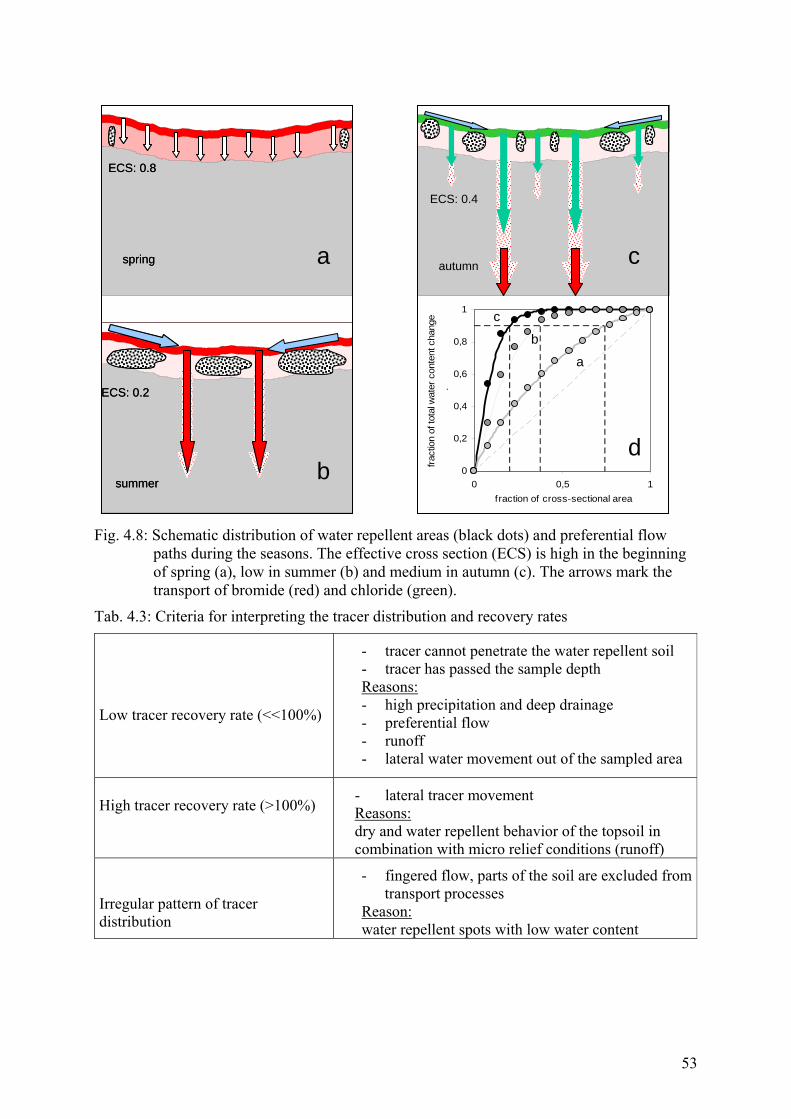
53
0
0,2
0,4
0,6
0,8
1
0 0,5 1fraction of cross-sectional area
fract
ion
of to
tal w
ater
con
tent
cha
nge
.
a c
summer
ECS: 0.8
ECS: 0.2
spring
d
autumn
ECS: 0.4
b
b
c
a
a c
0
0,2
0,4
0,6
0,8
1
0 0,5 1fraction of cross-sectional area
fract
ion
of to
tal w
ater
con
tent
cha
nge
.
a c
summer
ECS: 0.8
ECS: 0.2
spring
summer
ECS: 0.8
ECS: 0.2
spring
d
autumn
ECS: 0.4
b
b
c
a
a c
Fig. 4.8: Schematic distribution of water repellent areas (black dots) and preferential flow
paths during the seasons. The effective cross section (ECS) is high in the beginning of spring (a), low in summer (b) and medium in autumn (c). The arrows mark the transport of bromide (red) and chloride (green).
Tab. 4.3: Criteria for interpreting the tracer distribution and recovery rates
Low tracer recovery rate (<<100%)
- tracer cannot penetrate the water repellent soil - tracer has passed the sample depth Reasons: - high precipitation and deep drainage - preferential flow - runoff - lateral water movement out of the sampled area
High tracer recovery rate (>100%) - lateral tracer movement
Reasons: dry and water repellent behavior of the topsoil in combination with micro relief conditions (runoff)
Irregular pattern of tracer distribution
- fingered flow, parts of the soil are excluded from transport processes
Reason: water repellent spots with low water content
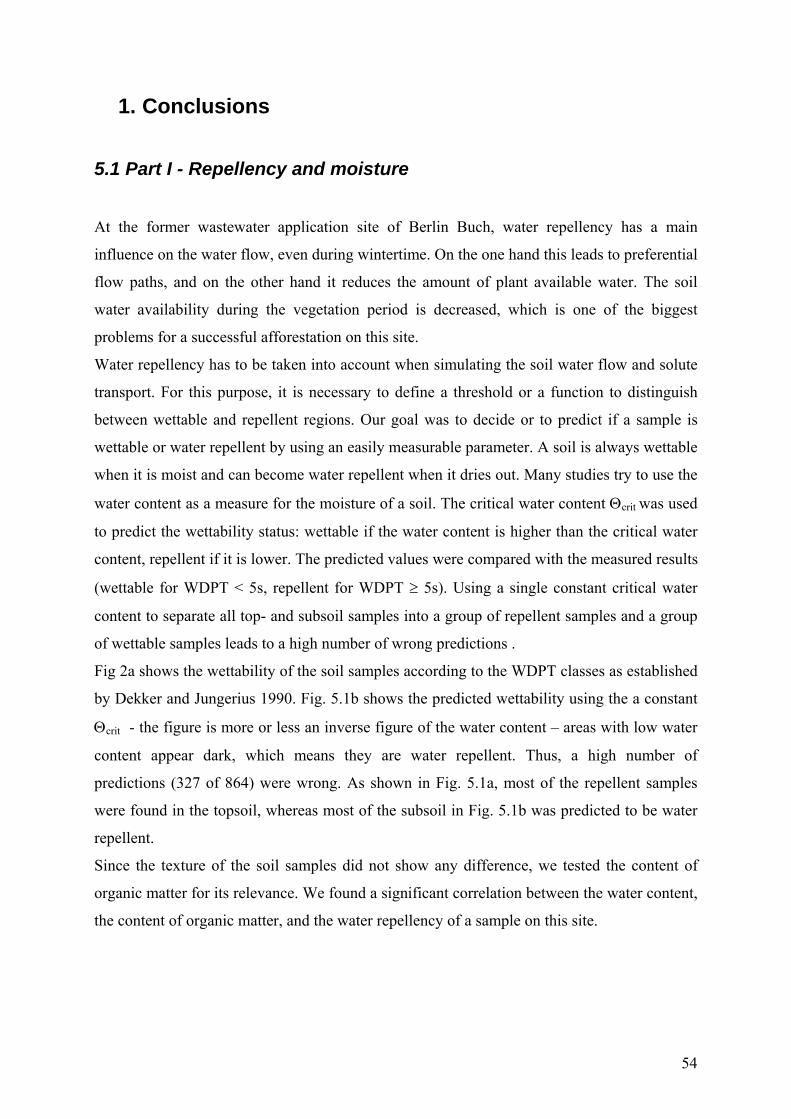
54
1. Conclusions
5.1 Part I - Repellency and moisture
At the former wastewater application site of Berlin Buch, water repellency has a main
influence on the water flow, even during wintertime. On the one hand this leads to preferential
flow paths, and on the other hand it reduces the amount of plant available water. The soil
water availability during the vegetation period is decreased, which is one of the biggest
problems for a successful afforestation on this site.
Water repellency has to be taken into account when simulating the soil water flow and solute
transport. For this purpose, it is necessary to define a threshold or a function to distinguish
between wettable and repellent regions. Our goal was to decide or to predict if a sample is
wettable or water repellent by using an easily measurable parameter. A soil is always wettable
when it is moist and can become water repellent when it dries out. Many studies try to use the
water content as a measure for the moisture of a soil. The critical water content Θcrit was used
to predict the wettability status: wettable if the water content is higher than the critical water
content, repellent if it is lower. The predicted values were compared with the measured results
(wettable for WDPT < 5s, repellent for WDPT ≥ 5s). Using a single constant critical water
content to separate all top- and subsoil samples into a group of repellent samples and a group
of wettable samples leads to a high number of wrong predictions .
Fig 2a shows the wettability of the soil samples according to the WDPT classes as established
by Dekker and Jungerius 1990. Fig. 5.1b shows the predicted wettability using the a constant
Θcrit - the figure is more or less an inverse figure of the water content – areas with low water
content appear dark, which means they are water repellent. Thus, a high number of
predictions (327 of 864) were wrong. As shown in Fig. 5.1a, most of the repellent samples
were found in the topsoil, whereas most of the subsoil in Fig. 5.1b was predicted to be water
repellent.
Since the texture of the soil samples did not show any difference, we tested the content of
organic matter for its relevance. We found a significant correlation between the water content,
the content of organic matter, and the water repellency of a sample on this site.
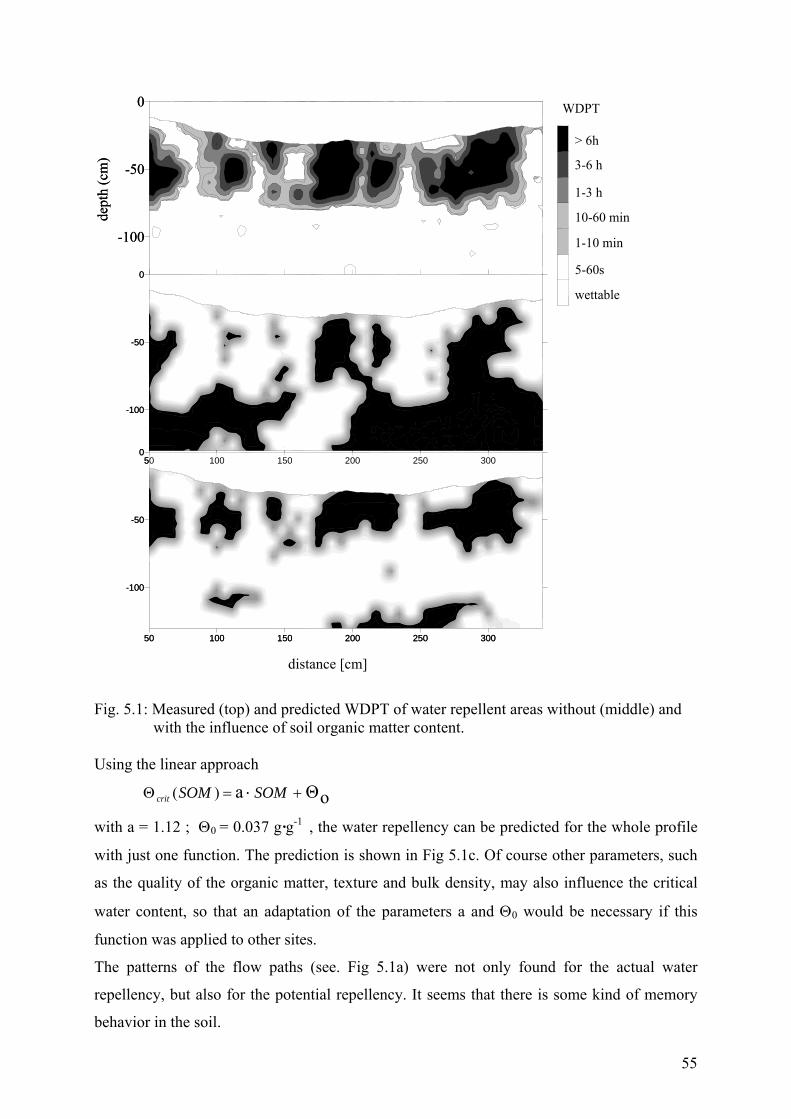
55
-100
-50
0de
pth
(cm
)
0
5.78703704E-005
0.0006944444444
0.006944444444
0.0416666666667
0.125
0.25
wettable
> 6h
5-60s
1-10 min
1-3 h
3-6 h
50 100 150 200 250 300
-100
-50
050 100 150 200 250 300
-100
-50
0
0
6E-005
0.0007
0.007
0.04
0.1
0.3
wettable
> 6h
5-60s
1-10 min
10-60 min
1-3 h
3-6 h
WDPT
-100
-50
0de
pth
(cm
)
0
5.78703704E-005
0.0006944444444
0.006944444444
0.0416666666667
0.125
0.25
wettable
> 6h
5-60s
1-10 min
1-3 h
3-6 h
50 100 150 200 250 300
-100
-50
050 100 150 200 250 300
-100
-50
0
0
6E-005
0.0007
0.007
0.04
0.1
0.3
wettable
> 6h
5-60s
1-10 min
10-60 min
1-3 h
3-6 h
WDPT
distance [cm]
Fig. 5.1: Measured (top) and predicted WDPT of water repellent areas without (middle) and with the influence of soil organic matter content.
Using the linear approach
oΘa)( +=Θ ⋅ SOMSOMcrit with a = 1.12 ; Θ0 = 0.037 g·g-1 , the water repellency can be predicted for the whole profile
with just one function. The prediction is shown in Fig 5.1c. Of course other parameters, such
as the quality of the organic matter, texture and bulk density, may also influence the critical
water content, so that an adaptation of the parameters a and Θ0 would be necessary if this
function was applied to other sites.
The patterns of the flow paths (see. Fig 5.1a) were not only found for the actual water
repellency, but also for the potential repellency. It seems that there is some kind of memory
behavior in the soil.
56
5.2 Part II - Appearance and vanishing of water repellency – the
annual cycle
As described above, one of the main impacts of water repellency is the reduction of the water
accessible soil volume. Water infiltration, as a consequence of precipitation events, results in
unstable wetting fronts – the water infiltrates in flow fingers. The soil between these fingers
remains dry and water repellent. Many excavations in the past years gave indications for this
flow phenomenon. Looking from the top into a 20cm deep pit we saw irregular moisture
patterns on a horizontal cross section, marked clearly by dark structures of the wettable and
moist flow fingers and light structures of the dry and water repellent soil in between (see Fig.
3.2). The structures show a typical size of 10-20 cm. The samplings on this site were carried
out at 32 different dates from April 2001 to April 2004. As a result we found a clear trend: in
summer the area share of the water repellent spots was very high (>60%), after dry periods at
the end of summer the whole profile was water repellent. During winter the water repellent
spots seemed to disappear. Only single spots were found at the end of the winter with an area
share of approximately 10%.
The samplings were complemented by the operation of an automated TDR-device on the
same site. The question was if it is possible to see the effect of water repellency in the
moisture readings of the TDR-device. The device measured the volumetric water content
hourly with 64 probes which were installed permanently at regular distances in a soil profile /
in a vertical array (for more details see cap. 3.3). After rainfall events, the water content in the
soil profile increased. In order to compare the different rainfall events an index was
introduced - the effective cross section (ECS). The effective cross section is the area share of
a horizontal cross sectional area which realizes 90% of water content change after rainfall
events at that depth. In the case of absolutely homogeneous flow the effective cross section
would be 0.9, whereas in the case of preferential flow it would be smaller (for the exact
procedure see cap. 3.3 ff). We calculated the ECS for a depth of 20 cm in order to obtain
values comparable to the area share of the wettable soil which was obtained by soil sampling.
The results confirm the seasonal trend. The ECS indicated preferential flow in summer with
values <0.4 and a nearly uniform infiltration at the end of winter with values of about 0.8.
Fig. 3.9 compares the results of the wettable cross sectional area of the soil sampling and the
calculated ECS from the TDR readings. Both approaches agree with the seasonal trend. Only
the results for the wintertime show a discrepancy between the two approaches. This
discrepancy is caused by frost, which also triggers preferential flow as seen in the TDR data.
57
ECS provides a useful quantitative measure of the extent of preferential flow during the
seasons. This parameter can also be used for comparing numerical models and measurements
for heterogeneous water flow. It was possible to calculate ECS using the average water
content and climatic parameter. The average water content was found to have the strongest
influence on the effective cross section. While the concept of effective cross section itself
could be transferred to other sites, the parameters of Eq. [4] are limited to the examined site.
The equation may be used in numerical models to predict the effective cross section for
different climatic conditions. Our results are based on data from one year. Measurements
during subsequent years may be needed. The use of the effective cross section as such and in
numerical models may improve the current possibilities of estimating the amount of plant-
available water and contaminant transport at particular sites.
5.3 Part III - Stability of flow pattern – shifting of flow fingers
Seasonal changes of the effective cross section have a great influence on transport events in
the soil. During the winter months until spring (Jan. – April), an even distribution of moisture
and percolation prevails and only few parts of the soil remain water repellent. This is
contrasted by the effect of fingering, which is predominant during the summer months and
autumn.
The formation of flow paths after a complete drying up of the top soil is random, but once a
flow path is established it remains more or less stable until the next summer. During the
rewetting phase new fingers might be added, which gradually grow wider in the course of the
winter until the flow conditions can be described as piston flow.
According to our measurements, the established flow paths are used preferentially for the
subsequent water transport. Consecutive rainfall events form similar patterns of dry and moist
areas in the soil, so that the position of the dry spots i.e. flow paths remain the same. Over
longer time periods (several months, years) these patterns change slowly. The flow paths
“grow” under the moist winter conditions, and the dry spots become smaller and are rewetted
to a large extent. Consequently, almost the entire soil can participate in the flow events.
During the vegetation period, the soil dries out successively and becomes water repellent. The
precipitated water infiltrates the soil preferentially along flow fingers. If the dry periods in the
summer are prolonged, the complete top soil becomes water repellent, so that the water has to
58
find new flow paths through the repellent material. On the basis of the TDR-data, a change
i.e. shift in flow paths was substantiated. A dry spot, for example, which was registered
during the complete experimental phase of 2002, changed into a flow path after the summer
dryness.
The varying distribution of the bromide and chloride tracer makes it clear that different flow
regimes predominated at the time of the tracer transport. Thus, a more or less consistent
transport of bromide took place during spring, whereas the continuing desiccation and the
negative water balance led to water repellency and preferential flow paths in the top soil,
which stopped the bromide transport. The bromide was held in the dry, water repellent areas,
while the water flowed past on preferential paths. During autumn the tendency towards
preferential flow was high, so that the applied chloride tracer infiltrated the soil along the flow
paths and was, therefore, transported quickly into deeper layers.
The TDR-readings affirm the existence of main flow paths showing high changes of water
contents after each precipitation. These areas correlated with the tracer transect. The frequent
water flow in these areas led to a washing out of the bromide tracer and a transport of chloride
into depths larger than 1m. The chloride tracer did not flow into the water repellent areas.
The temporal change of the preferential flow complicates the numerical modeling of the
contaminant discharge out of the areas. Since the exact position of the flow fingers under the
same boundary conditions is random, whereas the seasonal course of the effective flow cross
section shows a distinct calculable trend, it is possible to implement these processes in a
model.
59
2. Synthesis and Outlook The study at hand deals with three main aspects describing the phenomenon of soil water
repellency and its impacts on the transport of water and solutes:
• distribution and arrangement of water repellent spots in the topsoil,
• water repellency – a dynamic property,
• stability of flow patterns
- Distribution and arrangement of water repellent spots in the topsoil: The water
repellent areas in the topsoil show a characteristic distribution pattern with respect to
size and arrangement, often described as „leopard’s skin“ in scientific literature. Even
though the water repellent areas have an irregular structure, they show similar sizes of
10 to 15 cm (see Fig 4.6). The distribution i.e. expression of these water repellent
areas depends first of all on the soil moisture. In this context, the wettability was
described relatively well by combining the parameters water content and organic
matter content.
- water repellency – a dynamic property: On the basis of a large number of samplings
and quasi-continuous water content measurements using TDR-devices, it was
established that these moisture patterns and, thus, the fingering phenomenon have no
statistic significance for the transport processes in the soil. There is rather a seasonal
course of appearance and disappearance of these areas as well as a water– and solute
transport which is at times more preferential (summer) and at other times more
homogenous (end of winter). Consequently, a parameter was derived describing the
tendency towards preferential flow – the effective cross section. Based on this
parameter was the attempt to derive this tendency towards preferential flow from
easily measurable or generally available data. The following values seemed
favourable:
• θ10 - average initial water content at 10 cm (m³·m-³)
• I - average intensity of a particular rainfall event (mm·h-1)
• Ep - potential evaporation over a 24-d period (mm)
• R - rainfall amount (mm)
Good results were achieved using the linear relationship:
ECS = 3.9*θ10 -0.24*I+ 0.0020*Ep+0.0072 * R
The average deviation was 7%.
60
The impacts of the dynamic flow processes on the solute transport were confirmed
by a time delayed double tracer experiment. For this purpose, two tracer solutions
were applied to the same plot, so that information on the solute transport at
different points of time was gained. About 10% of the cross sectional area of the
plot were classified as main flow paths, 45% as moderate flow path, 40% as
sparsely flow paths, and at about 5% of the area no tracer was transported.
We also established that unstable temperatures during winter, causing a freezing
and thawing of the soil, lead to preferential flow on a similar scale (ECS) as during
the summer months. These effects are, however, more difficult to quantify and
require higher technical demands due to the unfavourable weather conditions.
- Stability of flow patterns: The formation of flow paths after a complete drying up of
the top soil is random, but once a flow path is established it remains more or less
stable until the next summer. During the rewetting phase new fingers might be added,
which gradually grow wider in the course of the winter until the flow conditions can
be described as piston flow.
The results of the laboratory and field experiments formed the basis for a better incorporation
of these processes into numerical models and for a long-term modeling of the water and solute
transport on our research areas. Fundamental concepts were considered and practical
parameters developed which can be used for a consideration of fingering in these models. It
seems possible to derive these dynamic parameters from easily determinable external
conditions (marginal conditions).
This can lead to an improvement of existing models. The concept of the critical water content
can be implemented in 2 or 3 dimensional numerical model. The concept of the Effective
Cross Section makes it possible to validate the model. For one dimensional models, stream
flow tubes or mobile/immobile water can lead to better predictions of plant available water or
graoundwater recharge. The concept of mobile/immobile water depending on the water
content is already implemented in the model SWAT (van Dam et al., 1996, Ritsema et al.
2005).
The experiments showed, the effects described above can also be observed on those areas of
the Tiergarten Park which tend to be water repellent. It still remains difficult to transfer the
locally obtained results to other areas without having information on its tendency towards

61
water repellency. Although the climatic influences mentioned above are a necessary factor for
the development of water repellency, they alone cannot explain its emergence.
Water repellency has been of rising interest in the past years, posing the question of whether it
is a new type of soil alteration due to changing land use, immissions situation (nano particles)
or climatic factors, and will, therefore, become more important in the future, or whether it is a
natural soil property that has always existed.
The search for the inner causes of water repellency will require research on the quality of
humus, plant and soil animal exudates, and microbiotic processes, including their interactions.
The subprojects HUMUS, MIKRO and FAUNA provide the first interesting results.
In order to regionalize the results, it will be necessary to find methods for transferring these
results onto larger areas. It might be possible to use noninvasive geophysical methods to
determine the water distribution, water dynamics and other important structural parameters.
Perhaps it could be of help to use remote sensing techniques for detecting areas at risk and
determining the effects of a regional water regime quicker and more effectively.
62
References Allen, R.G. (2000). Using the FAO-56 dual crop coefficient method over an irrigated region
as part of an evapotranspiration intercomparison study. Journal of Hydrology
229, 27-41.
Arbel, Y., A. Yair, S.U. Oz. 2005. Effect of topography and water repellent layer on the non-
uniform development of planted trees in a sandy arid area. J. Arid Environ. 60,
67-81.
Bond, R.D. 1964. The influence of the microflora on the physical properties of soils. Field
studies on water repellent sands. Aust. J. Soil Res. 2:123-131.
Bronstein, I.N., K.A. Semendajajew. 1987. Taschenbuch der Mathematik. 23. Auflage. Harri
Deutsch, Frankfurt.
Brooks, S., Taylor, D., and Jardine, P. (1998). Thermodynamics of bromide exchange on
ferrihydrite: implications for bromide transport. Soil Sci Soc Am J 62, 1275-
1279.
Buczko, U., Bens, O., Hüttl, R.F. (2005): Variabilty of soil water repellency in sandy forest
soils with different stand structure under Scots pine (Pinus sylvestris) and beech
(Fagus sylvatica).Geoderma, 126, 317-336
Clay, D. E., Zheng, Z., Liu, Z., Clay, S. A., and Trooien, T. P. (2004). Bromide and Nitrate
Movement through Undisturbed Soil Columns. J Environ Qual 33, 338-342.
Clothier, B.E., I. Vogeler, G.N. Magesan. 2000. The breakdown of water repellency and
solute transport through a hydrophobic soil. J. Hydrol. 231–232 255–264.
Curran, P. 1988; The semivariogram in remote sensing: an introduction, Remote Sens. Env.,
24, pp. 493-507.
Dekker, L.W. and C.J. Ritsema. 1994. How water moves in a water repellent sandy soil 1.
Potential and actual water repellency Water Resour. Res. 30, 2507-2517.
Dekker, L.W. and C.J. Ritsema. 2000. Wetting patterns and moisture variability in water
repellent Dutch soils. J Hydrol. 231/232, 148-164.
Dekker, L.W., and P.D. Jungerius (1990). Water repellency in the dunes with special
reference to the Netherlands. Catena Suppl. 18, 173– 183.
Dekker, L.W., C.J. Ritsema, O. Wendroth, N. Jarvis, K. Oostindie, W. Pohl, M. Larsson and
J.P. Gaudet. 1999. Moisture distributions and wetting rates of soils at
experimental fields in the Netherlands, France, Sweden and Germany. J. Hydrol.,
215, 4-22.
63
Dekker, L.W., Ritsema, C.J. and Oostindie, K., 2003. Water repellency in dunes along the
duch coast, In ‘Soil Water Repellency – Occurrence, Consequences and
Amelioration’. (Eds CJ Ritsema, LW Dekker) Elsevier Amsterdam, 2003, 99-
113.
Dekker, L.W., S.H. Doerr, K. Oostindie, A.K. Ziogas, C.J. Ritsema. 2001. Water repellency
and critical soil water content in a dune sand. Soil Sci. Soc. Am. J.65, 1667-
1674.
Doerr, S.H. and Thomas, A.D., 2003. Soil moisture : a controlling factor in water repellency?
In ‘Soil Water Repellency – Occurrence, Consequences and Amelioration’. (Eds
CJ Ritsema, LW Dekker) Elsevier Amsterdam, 2003, 137-151.
Doerr, S.H., R.A. Shakesby, R.P.D. Walsh. 1996. Soil hydrophobicity variations with depth
and particle size fraction in burned and unburned Eucalyptus globulus and Pinus
pinaster forest terrain in the Águeda basin, Portugal. Catena, 27 (1), 25-47.
Dyck, M. F., Kachanoski, R. G., and de Jong, E. (2003). Long-term Movement of a Chloride
Tracer under Transient, Semi-Arid Conditions. Soil Sci Soc Am J 67, 471-477.
Flury, M., and Wai, N. N. (2003). Dyes as tracers for vadose zone hydrology. Rev. Geophys.
41, 1002.
Forrer, I., Papritz, A., Kasteel, R., Fluhler, H., and Luca, D. (2000). Quantifying dye tracers in
soil profiles by image processing. European Journal of Soil Science 51, 313-322.
Franco, C.M.M., Clarke, P.J., Tate, M.E. and Oades, J.M., 2000. Hydrophobic properties and
chemical characterisation of natural water repellent materials in Australian
sands. J Hydrol. 231-323, 47-58.
Genuchten M.Th.van (1980). A closed-form equation for predicting the hydraulic
conductivity of unsaturated soils. Soil Sci Soc Am J 44, 892-898.
Gerke, H.H., Hangen, E., Schaaf, W. and Hüttl, R. F., 2001. Spatial variability of potential
water repellency in a lignitic mine soil afforested with Pinus nigra, Geoderma
102, 255-274.
Glass, R. J., T. S. Steenhuis,, J. Y. Parlange. 1989. Wetting front instability, 2, Experimental
determination of relationships between system parameters and two dimensional
unstable flow field behavior in initially dry porous media, Wat. Resour. Res., 25,
1195–1207.
Greiffenhagen, A., Wessolek, G., Facklam, M., Renger, M., and Stoffregen, H. (2006).
Hydraulic functions and water repellency of forest floor horizons on sandy soils.
Geoderma 132, 182-195.
64
Hammel, K., Gross, J., Wessolek, G., and Roth, K. (1999). Two-dimensional simulation of
bromide transport in a heterogeneous field soil with transient unsaturated flow.
European Journal of Soil Science 50, 633-647.
Hangen, E., H.H. Gerke, H. H., Schaaf, W., and Hüttl, R. F. (2005). Assessment of
preferential flow processes in a forest-reclaimed lignitic mine soil by multicell
sampling of drainage water and three tracers. Journal of Hydrology 303, 16-37.
Harper, R.J. and R.J. Gilkes. 1994. Soil attributes related to water repellency and utility of soil
survey for predicting its occurrence, Aust. J. Soil Res., 32, 1109-1124.
Hoffmann, C., 2002. Schwermetallmobilität und Risikopotentiale der Rieselfeldböden Berlin
Buch, Bodenökologie und Bodengenese 35, Doctoral thesis, TU Berlin.
Jamison, V.C. 1945. The penetration of irrigation and rain water into sandy soil of Central
Florida. Soil Sci. Soc. Amer. Proc. 10:25-29.
Jaramillo, D.F., Dekker, L.W., Ritsema, C.J. and Hendrickx, J.M.H., 2000. Occurrence of soil
water repellency in arid and humid climates. J. Hydrol. 231-232, 105-111.
Kasteel, R., Burkhardt, M., Giesa, S., and Vereecken, H. (2003). Characterization of Field
Tracer Transport Using High-Resolution Images. Vadose Zone J. 4, 101-111.
Kohne, J. M., and Gerke, H. H. (2005). Spatial and Temporal Dynamics of Preferential
Bromide Movement towards a Tile Drain. Vadose Zone J 4, 79-88.
Koszinski, S., Quisenberry, V., Rogasik, H., and Wendroth, O. (2006). Spatial variation of
tracer distribution in a structured clay field soil. Journal of Plant Nutrition and
Soil Science 169, 25-37.
Krammes, J.S. and L.F. DeBano. 1965. Soil wettability: a neglected factor in watershed
management. Wat. Resour. Res. 1, 283-286.
Kung, K.-J. S., Kladivko, E. J., Gish, T. J., Steenhuis, T. S., Bubenzer, G., and Helling, C. S.
(2000). Quantifying Preferential Flow by Breakthrough of Sequentially Applied
Tracers: Silt Loam Soil. Soil Sci Soc Am J 64, 1296-1304.
Letey, J., Carillo, M.L.K. and Pang, X.P., 2003. Characterizing the degree of repellency, In
‘Soil Water Repellency – Occurrence, Consequences and Amelioration’. (Eds CJ
Ritsema, LW Dekker) Elsevier Amsterdam, 2003, 51-57.
Liu, Y., B.R. Biereck, J.S. Selker, T.S. Steenhuis, J.Y. Parlange. 1993. High intensity X-ray
and tensiometry measurements in rapidly changing preferential flow fields. Soil
Sci. Soc. Am. J. 57 (5), 1188-1192.
Lu, J., and Wu, L. (2003). Visualizing Bromide and Iodide Water Tracer in Soil Profiles by
Spray Methods. . J. Environ. Qual. 32, 363-367.
65
Malicki, M. and W.Skierucha. 1989. A manually controlled tdr soil moisture meter operating
with 300 ps rise-time needle pulse, Irrig. Sci., 10, 153-163.
Moral Garcia, F.J., Dekker, L.W., Oostindie, K. and Ritsema, C.J., 2003. Soil water
repellency in the Natural Park of Donana, southern Spain, In ‘Soil Water
Repellency – Occurrence, Consequences and Amelioration’. (Eds CJ Ritsema,
LW Dekker) Elsevier Amsterdam, 2003, 121-127.
Mualem Y.(1976). A new model for predicting the hydraulic conductivity of unsaturated
porous media. Wat. Resour. Res., 12, No.3:513-522.
Parlange, M.B., A.T. Cahill, D.R. Nielsen, J.W. Hopmans, O. Wendroth. 1998. Review of
heat and water movement in field soils. Soil Tillage Res. 47, 5-10.
Renger M., G. Wessolek (2000). Influence of groundwater depth and available soil water on
evapotranspiration and plant growth. International Agrophysics, 14, 127-134
Rijtema, P. E. 1965. An analysis of actual evapotranspiration. Agricultural Research Report
859, 107pp. Wageningen: PUDOC.
Ritsema, C. and L.W. Dekker. 1998. Three-dimensional patterns of moisture, water
repellency, bromide and pH in a sandy soil, J. Contam. Hydrol. 31, 295-313.
Ritsema, C. J. and Dekker, L.W., 2003. Soil Water Repellency: Occurrence, Consequences
and Amelioration. Elsevier, 352pp.
Ritsema, C. J. and Dekker, L.W., 2003. Wetting patterns in water repellent Dutch soils, In
‘Soil Water Repellency – Occurrence, Consequences and Amelioration’. (Eds CJ
Ritsema, LW Dekker) Elsevier Amsterdam, 2003, 151-166.
Ritsema, C.J. and Dekker, L.W., 1994. How water moves in a water repellent sandy soil. 2.
Dynamics of fingered flow. Water Resour. Res. 30, 2519-2531.
Ritsema, C.J. and Dekker, L.W., 1998. Three-dimensional patterns of moisture, water
repellency, bromide and pH in a sandy soil. J. Contaminant Hydrol. 31, 295–
313.
Ritsema, C.J., Dekker, L.W. and Heijs, A.W.J., 1997. Three-dimensional fingered flow
patterns in a water repellent sandy field soil. Soil Sci. 162, 79-90.
Ritsema, C.J., L.W. Dekker, J.L. Nieber, T.S. Steenhuis. 1998. Modeling and field evidence
of finger formation and recurrence in a water repellent sandy soil. Wat. Resour.
Res., 34 (10), 555–567.
Ritsema, C.J., J.C. van Dam, L.W. Dekker, K. Oostindie. 2005. A new approach to simulate
preferential flow and transport in water repellent poros media: Model structure
and validation. Austr. J. of soil Res. 43, 361-369.
66
Rooij, G. H. de, 2000. Modelling fingered flow of water in soils owing to wetting front
instability: a review. J. Hydrol. 231-232, 277-294.
Roth, C.H., M.A. Malicki, R. Plagge. 1992. Empirical evaluation of the relationship between
soil dielectric constant and volumetric water content as the basis for calibrating
soil moisture measurements by TDR. Soil Sci. 43, 1-13.
Schlenther, L., B. Marschner, C. Hoffmann and M. Renger. 1996. Ursachen mangelnder
Anwuchserfolge bei der Aufforstung der Rieselfelder in Berlin-Buch -
bodenkundliche Aspekte. (German with English abstract), Verh. Ges. Ökol. 25,
349-359.
Scott, D. F., 2000. Soil wettability in forested catchments in South Africa, as measured by
different methods and as affected by vegetation cover and soil characteristics. J.
Hydrol. 231-232, 87-104.
Selker, J.S., Steenhuis, T.S. and Parlange, J.Y., 1992. Fingered flow in two dimensions: 2.
predicting finger moisture profile. Water Resour. Res. 28, 2523-2528.
Stoffregen H. 1998. Hydraulische Eigenschaften deponiespezifischer Materialien unter
Berücksichtigung von Temperaturänderungen (German with English abstract).
Ph. D. diss. TU Berlin, Germany.
Täumer, K., H. Stoffregen, G. Wessolek. 2005. Determination of repellency distribution using
soil organic matter and water content. Geoderma, 125, 107-115.
Täumer, K., H. Stoffregen, G. Wessolek. 2005. Seasonal dynamics of preferential flow in a
water repellent soil. Vadose Zone J., 5, 405-411.
Van Dam, J.C., J.H.M. Wösten, A. Nemes. 1996. Unsaturated soil water movement in
hysteretic and water repellent field soils. J. Hydrol. 184, 153-173.
Vanderborght, J., Gahwiller, P., and Fluhler, H. (2002). Identification of Transport Processes
in Soil Cores Using Fluorescent Tracers. Soil Sci Soc Am J 66, 774-787.
Wang, Z., J. Feyen, D.E. Elrick. 1998. Prediction of fingering in porous media. Wat Resour.
Res. 34 (9) 2183-2190.
Wang, Z., Lu, J., Wu, L., Harter, T., and Jury, W. A. (2002). Visualizing Preferential Flow
Paths using Ammonium Carbonate and a pH Indicator. Soil Sci Soc Am J 66,
347-351.
Wang, Z., Q. J. Wu, L. Wu, C. J. Ritsema, L. W. Dekker, J. U. Feyen. 2000. Effects of soil
water repellency on infiltration rate and flow instability. J. Hydrol. 231-232,
265-276.
67
Webster, R. and M. A. Oliver. 2001. Geostatistics for Environmental Scientists. John Wiley &
Sons, Ltd, Chichester, England.
Witter, J.V., P.D. Jungerius, M.J. Ten Harkel. 1991. Modelling water erosion and the impact
of water repellency. Catena 18, 115-124.
York, C. A. and P.M. Canaway. 2000. Water repellent soils as they occur on UK golf greens
J. Hydrol. 231-232, 126-133.
Ziogas, A.K., Dekker, L.W., Oostindie, K. and Ritsema, C.J., 2003. Soil water repellency in
north eastern Greece, In ‘Soil Water Repellency – Occurrence, Consequences
and Amelioration’. (Eds CJ Ritsema, LW Dekker) Elsevier Amsterdam, 2003,
127-137.
Ziogas, A. K., L.W. Dekker, K. Oostindie and C.J. Ritsema. 2003. Soil water repellency in
notheastern Greece, In: Ritsema, C.J., L.W.Dekker (ed) Soil Water Repellency –
Occurrence, Consequences and Amelioration. Elsevier, Amsterdam.

68
Acknowledgements First of all I want to thank Prof. Dr. Gerd Wessolek for supervising this thesis. He gave me
the freedom to develop my own concepts, but was a hard critic and advisor whenever it was
necessary. Beside the professional work, he was a mentor in personal questions and was
always interested in developing a sustainable life perspective for his ‘fosterlings’. I am
thankful to Prof. Dr. Jörg Bachmann for being the co-examiner.
I also want to thank Verena Marggraff and my parents and all my friends for their patience
and support during the period I was working on this thesis.
Many other people helped me during this study. One of the names which must appear first is:
Stoffregen. Heiner was my closest colleague in the Interurban project. He is a nearly
inexhaustible spring of ideas and physical knowledge, a conscientious manuscript reader and
became a good friend as well. Conny probably knows this work best. Beside managing the
Stoffregen clan and pushing her own progression, she gave her best to smooth out my
linguistic capers again and again.
I thank Helena Schmieschek, Michael Facklam-Moniak, Andreas Greiffenhagen, Kai
Schwärzel and Christian Hoffmann. Not only for their practical help and their good ideas but
also for their part in creating that special ‘Bodenkundefeeling’ at our institute.
I would like to apologize to the laboratory staff, especially to Claudia Kuntz, for flooding the
institute and occupying the fridges with thousands of samples.
I am very grateful to Olaf Zeuschner for the support and the permission to conduct my
experiments on the sewage farm land of Berlin Buch. He gave me his best man – Björn
Wieringer to build the roofing on the plot for the difficult water supply and to solve many
other little problems at this site.
Even though none of the results from the research site in the Tiergarten park are presented in
this study it played an important role for the research group. Thanks to the staff of the
‘Grünflächenamt’ especially to Mr. Götte who gave me the permission to plow the park and
build in some pitfalls for the visitors.
Lastly, I want to thank all my co-workers in the Interurban project and all the other members
of the soil science institute which are not named, and German Reserch Foundation for
financial support of that interesting and challenging work in the research group Interurban.