analyzing socio-economic phenomena using physics ii ...sitabhra/meetings/school10/sitabhra... ·...
TRANSCRIPT

Analyzing SocioAnalyzing Socio--Economic Phenomena Economic Phenomena using Physicsusing Physics
II. Financial Markets: CrossII. Financial Markets: Cross--correlations correlations
SitabhraSitabhra SinhaSinhaIMScIMSc ChennaiChennai

Risk management•• Important element of risk management : Estimation of Important element of risk management : Estimation of correlations between price movements of different stocks.correlations between price movements of different stocks.
•• Probability of large losses by a certain portfolio dominated byProbability of large losses by a certain portfolio dominated bycorrelated moves of its constituents.correlated moves of its constituents.
Average return RAverage return RPP = = ΣΣii ppii RRiippii:: amount of capital invested , amount of capital invested , RRii: expected return: expected returnRisk Risk σσPP
22 = = ΣΣi,ji,j ppii CCijij ppjjC: covariance matrixC: covariance matrix
•• Optimal portfolio minimizes risk for a given value of ROptimal portfolio minimizes risk for a given value of RPP: a linear : a linear problem involving inversion of Cproblem involving inversion of C•• Composition of least risky portfolio has large weight on Composition of least risky portfolio has large weight on eigenvectors of C with smallest eigenvectors of C with smallest eigenvalueseigenvaluesProblemProblem: Empirical determination of C from finite time series: Empirical determination of C from finite time series

How random are financial correlation matrices ?
MarkowitzMarkowitz portfolio optimization portfolio optimization scheme based on historical scheme based on historical determination of C not adequate determination of C not adequate since the lowest since the lowest eigenvalueseigenvalues are are dominated by noise !dominated by noise !
Comparison of Comparison of eigenvalueeigenvalue distribution distribution of C with purely random matrix : of C with purely random matrix : Deviation only for the largest few Deviation only for the largest few eigenvalueseigenvalues!!
Small time series Small time series ⇒⇒ Measurement noiseMeasurement noiseSmallest Smallest eigenvalueseigenvalues of correlation matrix most sensitive to this of correlation matrix most sensitive to this noise noise –– the corresponding eigenvectors precisely the ones that the corresponding eigenvectors precisely the ones that determine the least risky portfolio!determine the least risky portfolio!

QuestionQuestion
How to reconstruct the interaction between How to reconstruct the interaction between different elements of the market from the different elements of the market from the data about individual price movements ?data about individual price movements ?

The Market The Market ≡≡ Complex SystemComplex System
External InformationExternal Information(News breaks)(News breaks)
Mar
ket
Mar
ket
Indi
cato
rs
Indi
cato
rs
(Indi
ces)
(Indi
ces)
Market activity Market activity ≡≡Interaction Interaction between agentsbetween agents
Too complicated description

Is simpler description possible ?Is simpler description possible ?
External InformationExternal Information(News breaks)(News breaks)
Mar
ket
Mar
ket
Indi
cato
rs
Indi
cato
rs
(Indi
ces)
(Indi
ces)
All agents buy/sell stocks

""Brownian motionBrownian motion""
External InformationExternal Information(News breaks)(News breaks)
Mar
ket
Mar
ket
Indi
cato
rs
Indi
cato
rs
(Indi
ces)
(Indi
ces)
Effective interaction between stocks
Co-moving groups of stocks ≡Business Sectors

The Market seen as a System of The Market seen as a System of Interacting StocksInteracting Stocks
External InformationExternal Information(News breaks)(News breaks)
Mar
ket
Mar
ket
Indi
cato
rs
Indi
cato
rs
(Indi
ces)
(Indi
ces)
Kim & Jeong, PRE (2005)

Questions, Questions, QuestionsQuestions, Questions, Questions•• Can the structure of a market be empirically determined ? Can the structure of a market be empirically determined ?
Correlated movement of stocksCorrelated movement of stocks
•• But But …… why do emerging markets appear to be more correlated why do emerging markets appear to be more correlated than developed ones ? than developed ones ? NonNon--interacting stocks responding to interacting stocks responding to same external signals can appear same external signals can appear moremore correlatedcorrelated
•• What is the interaction structure of emerging markets ? What is the interaction structure of emerging markets ? The Indian marketThe Indian market
•• What role do interactions (visWhat role do interactions (vis--àà--vis overall market effects) play vis overall market effects) play in determining observed statistical properties of markets ? in determining observed statistical properties of markets ? CrossCross--correlation of price fluctuations within/between sectorscorrelation of price fluctuations within/between sectors
•• Can markets having similar statistical properties have very Can markets having similar statistical properties have very different internal structure ? different internal structure ? NYSE and NSENYSE and NSE

In the Indian marketIn the Indian marketall stocks are, on the whole, all stocks are, on the whole, remarkably correlated in their remarkably correlated in their price movements !price movements !
In the NYSEIn the NYSEstocks movements stocks movements dondon’’t seem to be as t seem to be as correlated as NSE !correlated as NSE !

Question: Question: Can we make a quantitative comparison of the Can we make a quantitative comparison of the degree of correlated stock movement in the degree of correlated stock movement in the two markets ?two markets ?
Answer: Answer: Yes, by spectral analysis of the correlation Yes, by spectral analysis of the correlation matrixmatrix
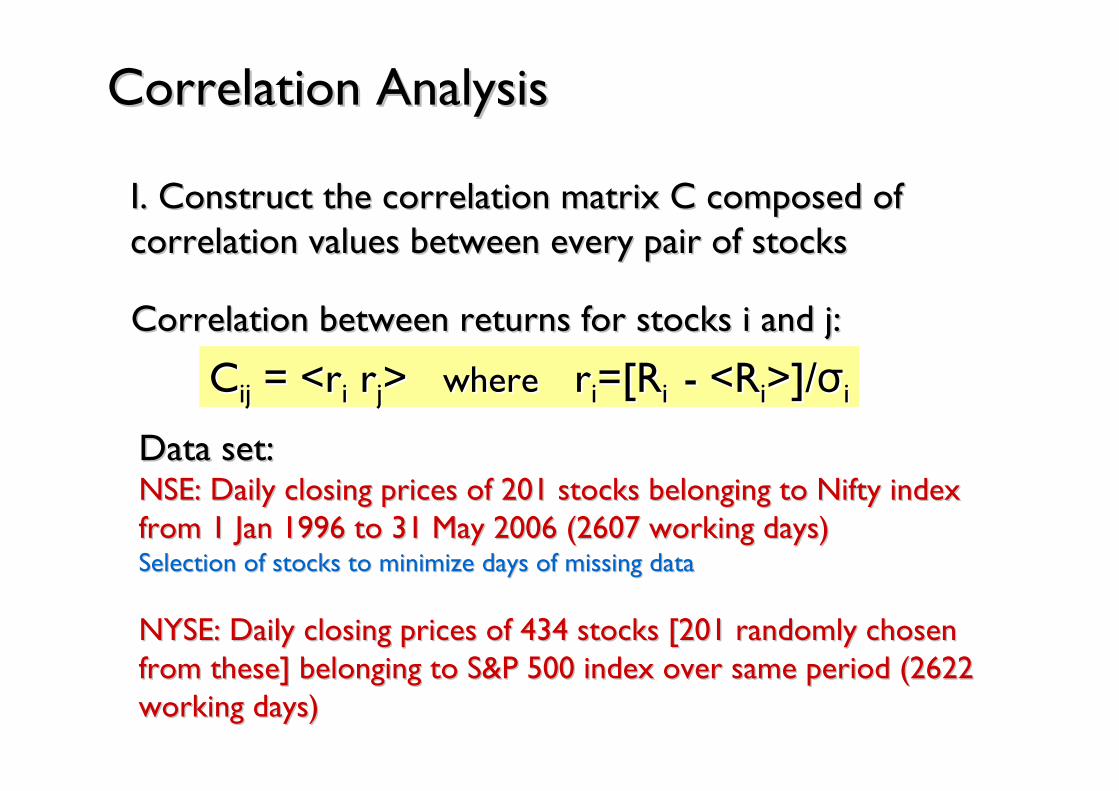
CCijij = <= <rrii rrjj> > wherewhere rrii=[=[RRii -- <<RRii>]/>]/σσii
Correlation AnalysisCorrelation Analysis
I. Construct the correlation matrix C composed of I. Construct the correlation matrix C composed of correlation values between every pair of stocks correlation values between every pair of stocks
Data set:Data set:NSE: Daily closing prices of 201 stocks belonging to Nifty indexNSE: Daily closing prices of 201 stocks belonging to Nifty indexfrom 1 Jan 1996 to 31 May 2006 (2607 working days)from 1 Jan 1996 to 31 May 2006 (2607 working days)Selection of stocks to minimize days of missing dataSelection of stocks to minimize days of missing data
NYSE: Daily closing prices of 434 stocks [201 randomly chosen NYSE: Daily closing prices of 434 stocks [201 randomly chosen from these] belonging to S&P 500 index over same period (2622 from these] belonging to S&P 500 index over same period (2622 working days)working days)
Correlation between returns for stocks i and j:Correlation between returns for stocks i and j:

Correlation MatrixCorrelation MatrixThe stocks in the NSE are on average more correlated !The stocks in the NSE are on average more correlated !
<C> = 0.22<C> = 0.22
<C> = 0.19<C> = 0.19

Minimum Minimum Spanning Spanning Tree for Tree for the Indian the Indian MarketMarket
Connect all N nodes of Connect all N nodes of a networks with Na networks with N--1 1 links such that the total links such that the total sum of distances sum of distances between every pair of between every pair of nodes is a minimumnodes is a minimum
ddijij = = √√22(1(1--CCijij))
Colors indicate Colors indicate different market sectorsdifferent market sectors
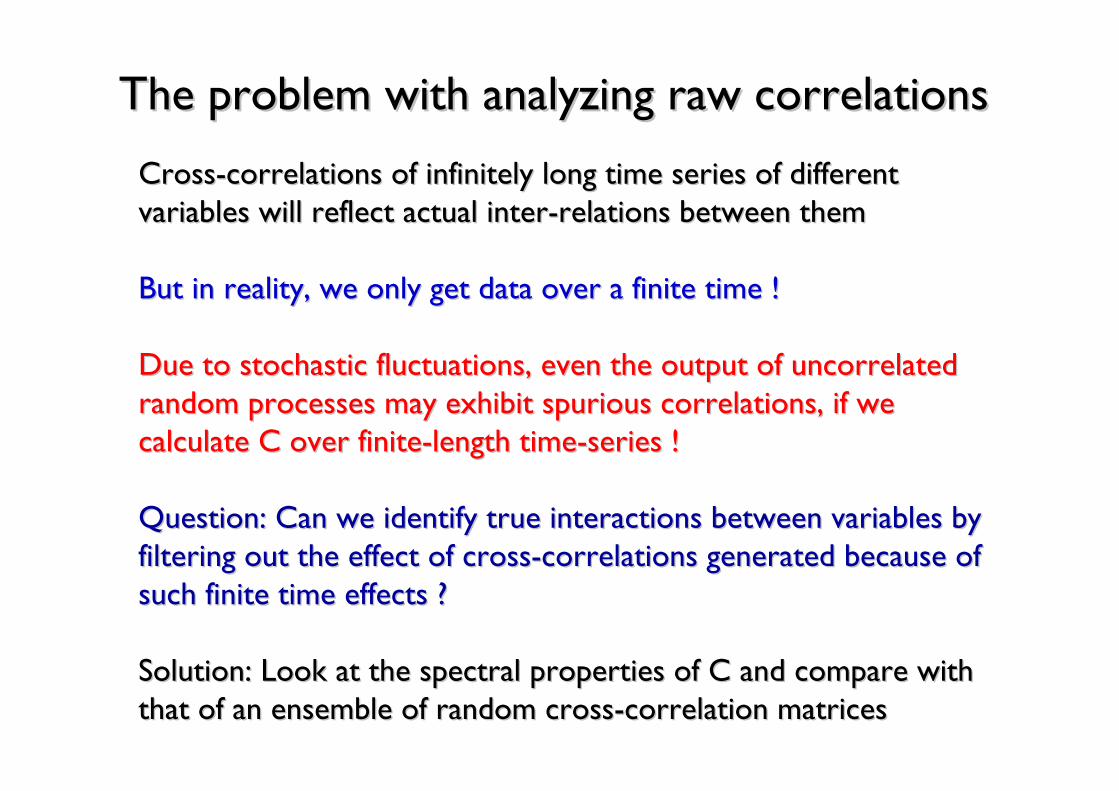
The problem with analyzing raw correlationsThe problem with analyzing raw correlations
CrossCross--correlations of infinitely long time series of different correlations of infinitely long time series of different variables will reflect actual intervariables will reflect actual inter--relations between themrelations between them
But in reality, we only get data over a finite time !But in reality, we only get data over a finite time !
Due to stochastic fluctuations, even the output of uncorrelated Due to stochastic fluctuations, even the output of uncorrelated random processes may exhibit spurious correlations, if we random processes may exhibit spurious correlations, if we calculate C over finitecalculate C over finite--length timelength time--series !series !
Question: Can we identify true interactions between variables byQuestion: Can we identify true interactions between variables byfiltering out the effect of crossfiltering out the effect of cross--correlations generated because of correlations generated because of such finite time effects ?such finite time effects ?
Solution: Look at the spectral properties of C and compare with Solution: Look at the spectral properties of C and compare with that of an ensemble of random crossthat of an ensemble of random cross--correlation matricescorrelation matrices
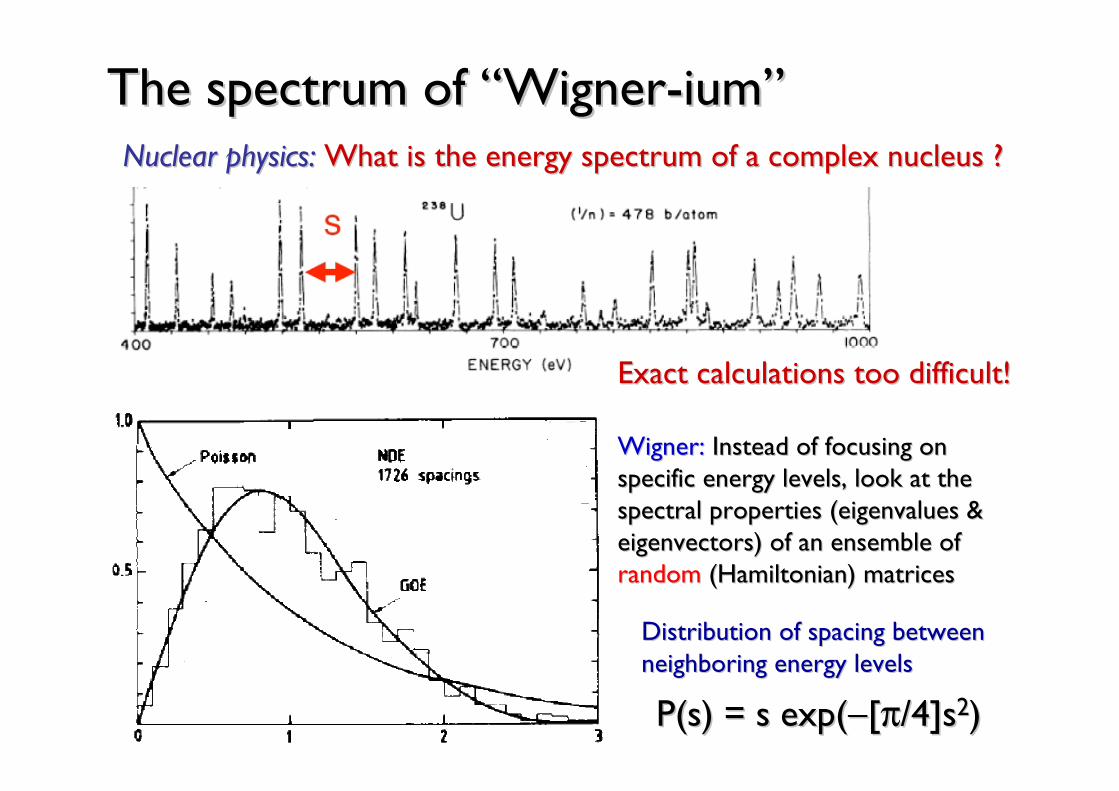
P(sP(s) = s exp() = s exp(−−[[ππ/4]s/4]s22))
Distribution of spacing between Distribution of spacing between neighboring energy levelsneighboring energy levels
The spectrum of The spectrum of ““WignerWigner--iumium””Nuclear physics:Nuclear physics: What is the energy spectrum of a complex nucleus ?What is the energy spectrum of a complex nucleus ?
Exact calculations too difficult!Exact calculations too difficult!
WignerWigner:: Instead of focusing on Instead of focusing on specific energy levels, look at the specific energy levels, look at the spectral properties (spectral properties (eigenvalueseigenvalues & & eigenvectors) of an ensemble of eigenvectors) of an ensemble of randomrandom (Hamiltonian) matrices(Hamiltonian) matrices

II. Obtain II. Obtain eigenvalueseigenvalues of the correlation matrixof the correlation matrix
P ( P ( λλ) = [Q/2) = [Q/2ππ] ] √√ [([(λλmaxmax -- λλ) () (λλ -- λλminmin)] where Q = T/N )] where Q = T/N λλ
If all stocks are uncorrelated, C will be a random (If all stocks are uncorrelated, C will be a random (WishartWishart) matrix with) matrix with
Q = 12.97Q = 12.97
Bounds of random Bounds of random distrndistrn : : λλmaxmax = [1+(1/= [1+(1/√√Q)]Q)]22 andand λλminmin= [1= [1--(1/(1/√√Q)]Q)]22
Random bulk (theoretical)Random bulk (theoretical)
A small fraction of A small fraction of eigenvalueseigenvalues (~ 3%) (~ 3%) deviate from deviate from random behaviorrandom behavior
The largest The largest eigenvalueeigenvalue is is more than 28 times larger more than 28 times larger than the predicted max. than the predicted max. random boundrandom bound+ a few + a few ““intermediateintermediate””eigenvalueseigenvalues
Randomly shuffled surrogateRandomly shuffled surrogate

Random nature of the smaller Random nature of the smaller eigenvalueseigenvaluesLet us observe the distribution of eigenvector components of Let us observe the distribution of eigenvector components of the the eigenvalueseigenvalues
Component distrn for 3 eigenectors in bulk predicted by RMT
λmax
GaussianGaussian
For random matrices generated from uncorrelated timeFor random matrices generated from uncorrelated time--series, series, distrndistrn of eigenvector components follow Porterof eigenvector components follow Porter--Thomas Thomas distrndistrn: :
P ( u ) = (1/P ( u ) = (1/√√22ππ) exp () exp (−−uu22/2)/2)
Fits empirical data for Fits empirical data for eigenvalueseigenvalues belonging to belonging to bulk, but largest bulk, but largest eigenvalueseigenvaluesdeviate significantly !deviate significantly !

LetLet’’s compare the two marketss compare the two markets
•• The largest The largest eigenvalueeigenvalue is slightly higher in NSEis slightly higher in NSEConsistent with the observation of more correlation in NSEConsistent with the observation of more correlation in NSE
•• The number of intermediate The number of intermediate eigenvalueseigenvalues (between (between λλmaxmax and the and the random bulk) is lower for NSErandom bulk) is lower for NSE
Suggests relative absence of distinct structure of interactionsSuggests relative absence of distinct structure of interactions
Q = 12.97Q = 12.97 Q = 13.04Q = 13.04
Random bulkRandom bulk Random bulkRandom bulk

Deviating Deviating eigenvalueseigenvalues Information about Information about interaction structure of the marketinteraction structure of the market
Let us look at the eigenvectors Let us look at the eigenvectors uu of the largest few of the largest few eigenvalueseigenvalues
BUSI
NES
S SE
CT
OR
S
Aut
o
Fina
ncia
lT
ech
Ener
gy
Basi
c -
Mat
eria
lsC
onG
oods
Con
Dis
cre
Indu
stri
al
IT-T
elec
omSe
rvic
esPh
arm
aM
isc
All stocks contribute All stocks contribute (almost) uniformly to (almost) uniformly to largestlargest eigenvalueeigenvalue
Market modeMarket modeCommon component affecting Common component affecting all stocks with same biasall stocks with same bias
Intermediate Intermediate eigenvalueseigenvaluesshould reflect group should reflect group structure in market if structure in market if eigenvectors are eigenvectors are localizedlocalized
In NSE, no straightforward In NSE, no straightforward interpretation in terms of sectorsinterpretation in terms of sectors
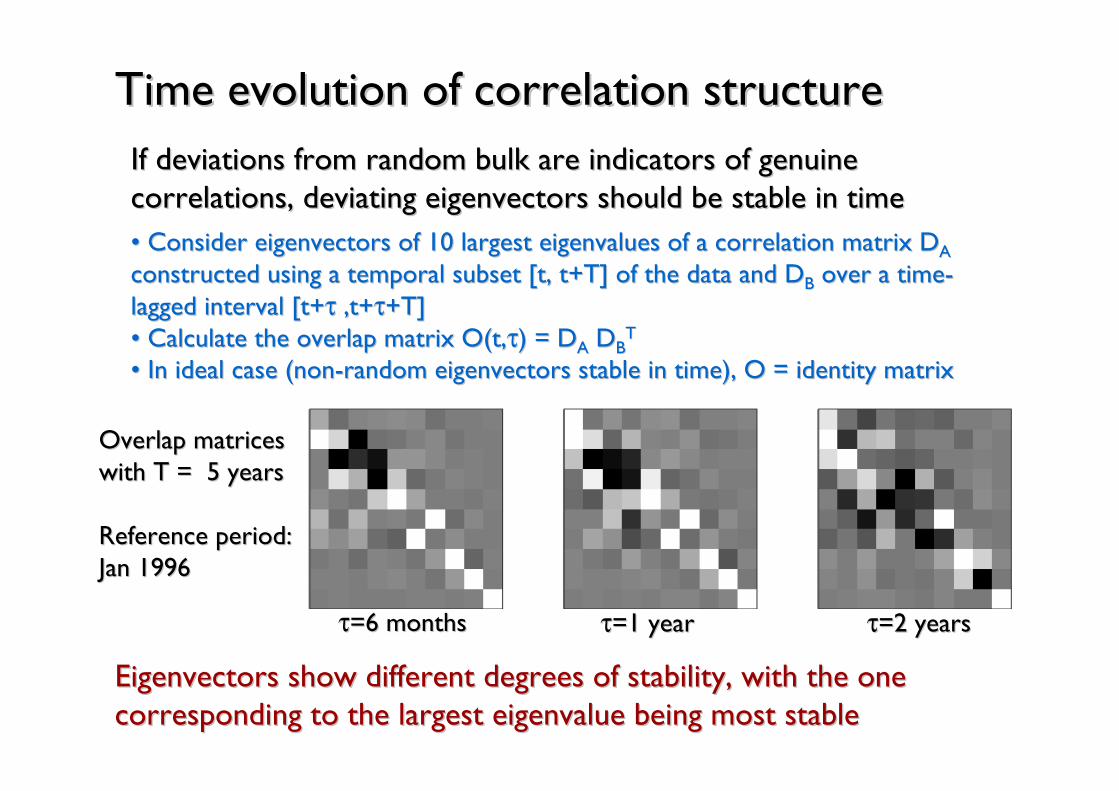
Time evolution of correlation structureTime evolution of correlation structureIf deviations from random bulk are indicators of genuine If deviations from random bulk are indicators of genuine correlations, deviating eigenvectors should be stable in timecorrelations, deviating eigenvectors should be stable in time•• Consider eigenvectors of 10 largest Consider eigenvectors of 10 largest eigenvalueseigenvalues of a correlation matrix Dof a correlation matrix DAA
constructed using a temporal subset [t, constructed using a temporal subset [t, t+Tt+T] of the data and D] of the data and DBB over a timeover a time--lagged interval [t+lagged interval [t+ττ ,,t+t+ττ+T+T]]•• Calculate the overlap matrix Calculate the overlap matrix O(tO(t,,ττ) = D) = DAA DDBB
TT
•• In ideal case (nonIn ideal case (non--random eigenvectors stable in time), O = identity matrixrandom eigenvectors stable in time), O = identity matrix
Overlap matrices Overlap matrices with T = 5 years with T = 5 years
Reference period: Reference period: Jan 1996Jan 1996
ττ=6 months=6 months ττ=1 year=1 year ττ=2 years=2 years
Eigenvectors show different degrees of stability, with the one Eigenvectors show different degrees of stability, with the one corresponding to the largest corresponding to the largest eigenvalueeigenvalue being most stable being most stable

Time evolution of the maximal Time evolution of the maximal eigenvalueeigenvalue of of correlation matrix : A window into volatilitycorrelation matrix : A window into volatility

Temporal evolution of composition of eigenvector Temporal evolution of composition of eigenvector corresponding to the largest corresponding to the largest eigenvalueeigenvalueAllows us to identify the prime movers & shakers of the NSE !Allows us to identify the prime movers & shakers of the NSE !Analysis: divide time series into overlapping windows of length Analysis: divide time series into overlapping windows of length T = 6 monthsT = 6 months
50 stocks having 50 stocks having biggest contribution biggest contribution to eigenvector to eigenvector corresponding to corresponding to largest largest eigenvalueeigenvalueover the period over the period JanJan’’9696--MayMay’’0606
Note 5 Note 5 TatagroupTatagroupcompanies & companies & 3 Reliance group 3 Reliance group companiescompanies

AnalyseAnalyse the composition of eigenvectors for detecting localization: we the composition of eigenvectors for detecting localization: we look atlook at
Inverse Participation RatioInverse Participation RatioFor the For the jthjth eigenvector eigenvector IIjj = = ΣΣi=1,i=1,……,N,N [u[uijij]]44, , uuii: : eigvectoreigvector componentscomponents
•• If all components are equal (If all components are equal (uuii =1/=1/√√N), as for N), as for λλ00 I=1/NI=1/N•• Dominant contribution of a single componentDominant contribution of a single component (u(u11=1 & =1 & uuii=0, i=2,=0, i=2,……,N) ,N) I = 1I = 1
3/N3/N
•• I inversely related to number of I inversely related to number of significantly contributing significantly contributing eigvectoreigvector components [stocks]components [stocks]
••For eigenvectors of rand For eigenvectors of rand corrcorrmatrix matrix I=3/N [seen in the I=3/N [seen in the random bulk]random bulk]
•• I > 3/N for most deviating I > 3/N for most deviating eigenvectorseigenvectors LocalizationLocalization
•• But much less significant in NSE But much less significant in NSE compared to NYSEcompared to NYSE
Random bulkRandom bulk
DeviatingDeviating

C = C C = C marketmarket + C + C sectorsector + C + C random random
= = λλ00 uu00TT uu00 + + ΣΣ i=1,i=1,……,,NNgroupgroup
λλii uuiiTT uuii + + ΣΣ i=Ni=Ngroupgroup+1,+1,……,N,N--11 λλii uuii
TT uuii
Expanding correlation matrix as C = Expanding correlation matrix as C = ΣΣ ii λλ ii u u iiTT u u ii
However However ……
largest largest eigenmodeeigenmode ((marketmarket) dominates all intra) dominates all intra--group correlations (if existing).group correlations (if existing).
⇒⇒ no straightforward detection of significantly related groups ofno straightforward detection of significantly related groups of stocks.stocks.
For this purpose, useFor this purpose, use
Matrix Decomposition TechniqueMatrix Decomposition TechniqueAim:Aim: removing the effect of (i) market mode & (ii) random noiseremoving the effect of (i) market mode & (ii) random noise
Allows decomposition of C into contributions due to Allows decomposition of C into contributions due to •• marketmarket, common for all stocks, common for all stocks•• groupsgroups of coof co--moving stocks (identified with various business sectors) moving stocks (identified with various business sectors) •• randomrandom, idiosyncratic effects for each stock, idiosyncratic effects for each stock
Largest Largest eigenvalueeigenvalue Intermediate Intermediate eigenvalueseigenvalues Random bulk Random bulk eigenvalueseigenvalues

Filtered correlation matricesFiltered correlation matrices
NNgroupgroup = 5= 5 NNgroupgroup = 10= 10
By visual inspection of intermediate By visual inspection of intermediate eigenvalueseigenvalues for NSE, we choose for NSE, we choose NNgroupgroup = 5= 5No No signficantsignficant error from choice error from choice variations of variations of NNgroupgroup due to due to eigenvalueseigenvalues closest to closest to random bulk random bulk has lowest contribution to has lowest contribution to CCsectorsector
NYSE: sector correlations as strong as market effectsNYSE: sector correlations as strong as market effects⇒⇒ Distinct groups of interacting stocks (business sectors)Distinct groups of interacting stocks (business sectors)⇒⇒ No such case in NSE, sector contribution weakNo such case in NSE, sector contribution weak

Reconstructing the stock interaction networkReconstructing the stock interaction network
NSE has much smaller fraction of significantly interacting stockNSE has much smaller fraction of significantly interacting stockssHard to segregate into groups having distinct sector identityHard to segregate into groups having distinct sector identity
But can we show this explicitly ?But can we show this explicitly ?
Method:Method: Use the sector correlation matrix Use the sector correlation matrix CCsectorsector to generate an to generate an adjacency matrix A, such that adjacency matrix A, such that •• AAijij = 1 if = 1 if CCijij
sectorsector > > CCcutoffcutoff•• AAijij = 0 otherwise= 0 otherwise Depending on choice of Depending on choice of CCcutoffcutoff
we get different numbers of clusters we get different numbers of clusters •• CCcutoffcutoff smallsmall all stocks are all stocks are connected in a giant clusterconnected in a giant cluster•• CCcutoffcutoff large large all stocks are isolated all stocks are isolated nodesnodes•• Largest number of distinct clusters Largest number of distinct clusters (=3) generated for (=3) generated for CCcutoffcutoff ~ 0.1~ 0.1

Comparing Market StructuresComparing Market Structures
INFOTECHINFOTECHPHARMAPHARMA
PETROPETRO
NYSE
NSE

Factor ModelsFactor Models
SoSo…… very few distinct groups of covery few distinct groups of co--moving stocks can be moving stocks can be identified in NSE compared to NSEidentified in NSE compared to NSE
•• But are these results too specific (i.e., valid only for NSE) ?But are these results too specific (i.e., valid only for NSE) ?•• Does the lack of group structure always get reflected in the Does the lack of group structure always get reflected in the eigenvalueeigenvalue distrndistrn of the market correlation matrix ?of the market correlation matrix ?•• LetLet’’s generate a random ensemble of returns with market s generate a random ensemble of returns with market internal structure that is specified by us & examine their spectinternal structure that is specified by us & examine their spectral ral propertiespropertiesFor this, we useFor this, we use
Return of Return of iithth stock, r stock, r iikk ( t ) = ( t ) = ββ ii m ( t ) + m ( t ) + γγ ii
kk ξξ kk ( t ) + ( t ) + σσ ii ηη ii ( t )( t )MarketMarket SectorSector RandomRandom
subject to the condition : subject to the condition : ββ ii22 + (+ (γγ ii
kk))22 + + σσ ii22 = 1= 1
Gaussian (0,1)Gaussian (0,1)
Independent model parameters:Independent model parameters: relative strengths of sector effect relative strengths of sector effect ((γγ) & random effect () & random effect (σσ), and the number of sectors (M)), and the number of sectors (M)

λλ00 = N = N ββ 22 ,, λλ11 = = SSmaxmax (1 (1 -- ββ) ) 22 = = SSmaxmax [1[1--√√(1(1--γγ 22--σσ 22)])]22
Simulation results with N = 200, M = 10Simulation results with N = 200, M = 10
where where SSmaxmax : size of largest sector (=20): size of largest sector (=20)
•• Increase of largest Increase of largest eigenvalueeigenvalue with increasing market effectwith increasing market effect•• Decrease of 2Decrease of 2ndnd largest largest eigenvalueeigenvalue with dominance of market effect with dominance of market effect ⇒⇒ intermediate intermediate eigenvalueseigenvalues occur closer to random bulk (since Q=constant)occur closer to random bulk (since Q=constant)•• If sectors are of same size, intermediate If sectors are of same size, intermediate eigenvalueseigenvalues cluster togethercluster together
•• for different sized sectors, they are spaced apart for different sized sectors, they are spaced apart •• Consistent with empirical NSE data; holds for Consistent with empirical NSE data; holds for γγ & & σσ distributed over a rangedistributed over a range

ConclusionsConclusionsA detailed study of internal structure (network of stock A detailed study of internal structure (network of stock
interactions) of an emerging marketinteractions) of an emerging market•• Supports the notion that emerging markets are more correlated Supports the notion that emerging markets are more correlated than developing ones than developing ones implication for portfolio diversification implication for portfolio diversification (risk reduction) for investing in such markets(risk reduction) for investing in such markets
Reason for correlation: Reason for correlation: •• Lack of distinct sector identity, relative absence of groups of Lack of distinct sector identity, relative absence of groups of coco--moving stocksmoving stocks•• Market effects dominate, systems tends to move as a Market effects dominate, systems tends to move as a homogeneous entity to information shocks (e.g., news breaks)homogeneous entity to information shocks (e.g., news breaks)•• Hypothesis: Gradual emergence of sectors as market maturesHypothesis: Gradual emergence of sectors as market matures
Implication for observed statistical properties of marketsImplication for observed statistical properties of markets•• Universality of Universality of ““inverse cubicinverse cubic”” law law ⇒⇒ Price fluctuation Price fluctuation distrndistrnmay be explained as the response behavior of a may be explained as the response behavior of a singlesingle entity entity (no need to consider complex internal structure of the market)(no need to consider complex internal structure of the market)