analyzing on-road emissions of light-duty vehicles with portable
TRANSCRIPT
EUR 24697 EN - 2011
Analyzing on-road emissions of light-duty vehicles with Portable Emission Measurement Systems (PEMS)
Martin Weiss, Pierre Bonnel, Rudolf Hummel, Urbano Manfredi, Rinaldo Colombo, Gaston Lanappe, Philippe Le Lijour, Mirco Sculati

The mission of the JRC-IE is to provide support to Community policies related to both nuclear and non-nuclear energy in order to ensure sustainable, secure and efficient energy production, distribution and use. European Commission Joint Research Centre Institute for Energy Contact information Address: Sustainable Transport Unit, Via Enrico Fermi 2749, TP 230, 21010 Ispra, Italy E-mail: [email protected]; [email protected] Tel.: +39-0332-78-6649; +39-0332-78-5301 Fax: +39-0332-78-6328 http://ie.jrc.ec.europa.eu/ http://www.jrc.ec.europa.eu/ Legal Notice Neither the European Commission nor any person acting on behalf of the Commission is responsible for the use which might be made of this publication.
Europe Direct is a service to help you find answers to your questions about the European Union
Freephone number (*):
00 800 6 7 8 9 10 11 (*) Certain mobile telephone operators do not allow access to 00 800 numbers or these calls may be billed.
Additional information on the European Union is available on the Internet and can be accessed through the Europa server http://europa.eu/ JRC 62639 EUR 24697 EN ISBN 978-92-79-19072-8 ISSN 1018-5593 doi:10.2788/23820 Luxembourg: Publications Office of the European Union © European Union, 2011 Reproduction is authorised provided the source is acknowledged Printed in Italy

Executive summary
iii
Executive summary Emissions testing in the laboratory forms an essential part of the European type approval procedure for light-duty vehicles. The approach yields reproducible and comparable emissions data and provides clear design criteria for vehicles that have to comply with applicable emission limits. Although emission limits have become increasingly stringent in the past decade, road transport remains the most important source of urban air pollution in Europe with respect to NOX (nitrogen oxides) and CO (carbon monoxide). Several studies have indicated that in particular on-road NOX emissions of light-duty diesel vehicles might substantially exceed emission levels as identified during emissions testing in the laboratory. Still, a comprehensive analysis of on-road emissions of light-duty diesel and gasoline vehicles is unavailable to date.
This report addresses the existing knowledge gaps by using Portable Emission Measurement Systems (PEMS) to analyze the on-road emissions of 12 light-duty diesel and gasoline vehicles that comply with Euro 3-5 emission limits and comprise small and midsize passenger cars, two transporters, and a minivan. The selected vehicles where tested on four test routes, representing rural, urban, uphill/downhill, and motorway driving.
The PEMS results indicate that average NOX emissions of diesel vehicles (0.93 ± 0.39 g/km), including Euro 5 diesel vehicles (0.62 ± 0.19 g/km), substantially exceed respective Euro 3-5 emission limits. The observed deviations range from a factor of 4-7 for average NOX emissions over entire test routes up to a factor of 14 for NOX emissions of individual averaging windows. By comparison, on-road NOX emissions of gasoline vehicles as well as CO and THC (total hydrocarbon) emissions of both diesel and gasoline vehicles generally stay within Euro 3-5 emission limits. The share of NO2 (nitrogen dioxide) in the total NOX emissions reaches 60% for diesel vehicles but is substantially lower for gasoline vehicles (0-30%). The tested light-duty diesel and gasoline vehicles emit during on-road testing on average 189 ± 51 g CO2/km (grams carbon dioxide per kilometre) and 162 ± 29 g CO2/km, respectively, thereby exceeding the CO2 emissions as specified during laboratory testing by on average 21 ± 9%. The magnitude of on-road emissions varies depending on vehicle type, operation mode, route characteristics, and ambient conditions. Cold-start emissions of both diesel and gasoline vehicles span over a wide value range; NOX emissions exceed Euro 3-5 emission limits by a factor 2-14, CO emissions often exceed emission limits, and THC emissions are both below and above Euro 3-5 emission limits.
The PEMS equipment is reliable and provides accurate emission measurements. PEMS are able to verify the proper operation of emission control technologies under a wide variety of normal operating conditions and suitable for testing emissions of novel fuel/engine/after-treatment/powertrain technologies (e.g., parallel/serial (plug-in) hybrid vehicles. PEMS analyses, including the presented results, may also be useful for updating current transport emission models and inventories. The PEMS procedure for light-duty vehicles is, however, relatively new and requires further refinement before being applied at large scale. Future PEMS applications may particularly focus on polluting driving modes such as cold start at very low temperatures and driving at very high speed as it occurs on the German Autobahn. The findings of this report indicate that the current laboratory emissions testing fails to capture the wide range of potential on-road emissions. A promising remedy for this problem may be attained by supplementing laboratory emissions testing with complementary test procedures such as PEMS on-road emissions testing. This report provides a first step into that direction, thereby contributing to a more comprehensive EU policy that assures compliance of light-duty vehicles with emission limits under normal conditions of use.

Contents
v
Contents
Executive summary ........................................................................................................................... iii
Contents .............................................................................................................................................. v
List of tables...................................................................................................................................... vii
List of figures ..................................................................................................................................... ix
List of abbreviations and units ......................................................................................................... xi
1 Introduction.................................................................................................................................. 1
2 Background.................................................................................................................................. 3 2.1 The current status of European light-duty vehicle emissions legislation ............................... 3 2.2 The test procedure for light-duty vehicle emissions within the EU ........................................ 5 2.3 Current developments in on-road emissions testing with PEMS........................................... 7
3 Methodology ................................................................................................................................ 9 3.1 Test vehicles ......................................................................................................................... 9 3.2 PEMS test routes .................................................................................................................. 9 3.3 PEMS equipment and test protocol..................................................................................... 14 3.4 Data collection and analysis................................................................................................ 18
4 Results........................................................................................................................................ 23 4.1 Average on-road emissions of light-duty vehicles ............................................................... 23 4.2 On-road NOX emissions of Euro 5 light-duty vehicles ......................................................... 31 4.3 Cold start emissions ............................................................................................................ 39
5 Discussion.................................................................................................................................. 43 5.1 Data analysis and results .................................................................................................... 43 5.2 Potentials of PEMS-based emission test procedures ......................................................... 46
6 Conclusions ............................................................................................................................... 47
7 References ................................................................................................................................. 49


List of tables
vii
List of tables Table 1: Currently applicable Euro 5 emission limits for light-duty vehicles of category M1 .......... 4 Table 2: Comparison the key characteristics of selected driving cycles......................................... 6 Table 3: Specifications of test vehicles......................................................................................... 10 Table 4: Characteristics of PEMS test routes............................................................................... 11 Table 5: Overview of parameters measured with PEMS.............................................................. 15


List of figures
ix
List of figures Figure 1: Speed profile of the New European Driving Cycle (NEDC).............................................. 5 Figure 2: Topographic map of the PEMS test routes..................................................................... 11 Figure 3: Altitude profiles of PEMS test routes.............................................................................. 12 Figure 4: Typical speed distributions of PEMS test routes in comparison to the NEDC................ 12 Figure 5: The relative positive acceleration of sub-trips composing the four PEMS
test routes and the NEDC .............................................................................................. 14 Figure 6: Schematic overview of PEMS and auxiliary components............................................... 15 Figure 7: Comparison of emissions as measured with PEMS and standard
laboratory equipment...................................................................................................... 17 Figure 8: Demonstrating the installation of the PEMS in a light-duty vehicle ................................ 18 Figure 9: Example of the averaging window method for NOX emissions....................................... 20 Figure 10: Schematic overview of the procedure to determine the duration of an
averaging window with the CO2 mass-based method .................................................... 20 Figure 11: Average NOX emissions on the PEMS test routes and during NEDC testing
in the laboratory.............................................................................................................. 24 Figure 12: Average NOX emissions on the PEMS test routes and during NEDC testing
in the laboratory expressed as deviation ratio ................................................................ 24 Figure 13: Average NO2 emissions on the PEMS test routes ......................................................... 25 Figure 14: Average NO2 emissions on the PEMS test routes expressed as percentage
of average NOX emissions.............................................................................................. 26 Figure 15: Average CO emissions on the PEMS test routes and during NEDC testing
in the laboratory.............................................................................................................. 27 Figure 16: Average CO emissions on the PEMS test routes and during NEDC testing
in the laboratory expressed as deviation ratio ................................................................ 27 Figure 17: Average THC emissions on the PEMS test routes and during NEDC testing
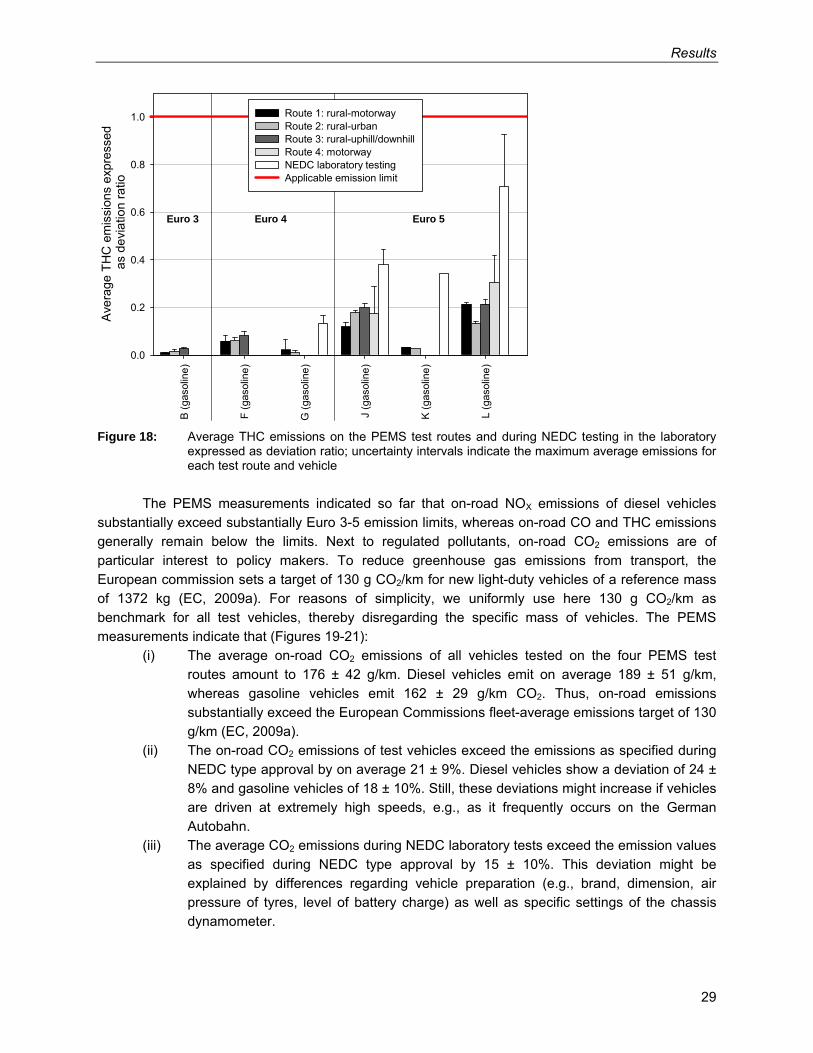
in the laboratory.............................................................................................................. 28 Figure 18: Average THC emissions on the PEMS test routes and during NEDC testing
in the laboratory expressed as deviation ratio ................................................................ 29 Figure 19: Average CO2 emissions on the PEMS test routes and during NEDC testing
in the laboratory.............................................................................................................. 30 Figure 20: Deviation of average CO2 emissions on the PEMS test routes and during NEDC
testing in the laboratory expressed percentage of the established emission target of 130 g CO2/km................................................................................................... 30
Figure 21: Deviation of average CO2 emissions on the PEMS test routes and during NEDC testing in the laboratory expressed percentage of the NEDC type approval emissions......................................................................................................... 31
Figure 22: Averaging window NOX emissions of EURO 5 diesel Vehicle H .................................... 32 Figure 23: Averaging window NOX emissions of EURO 5 diesel Vehicle I...................................... 32 Figure 24: Averaging window NOX emissions of EURO 5 diesel Vehicle H expressed
as deviation ratio ............................................................................................................ 33 Figure 25: Averaging window NOX emissions of EURO 5 diesel Vehicle I expressed
as deviation ratio ............................................................................................................ 33 Figure 26: Averaging window NOX emissions of Euro 5 gasoline vehicles ..................................... 35 Figure 27: Comparison of the averaging window NOX emissions of Euro 3-5 diesel vehicles
on the four PEMS test routes ......................................................................................... 37

List of figures
x
Figure 28: Comparison of the averaging window NOX emissions of Euro 3-5 gasoline vehicles on the four PEMS test routes ......................................................................................... 38
Figure 29: Average cold-start emissions and initial idling periods of light-duty vehicles ................. 39 Figure 30: Average cold-start emissions expressed as deviation ratio and initial idling periods
of light-duty vehicles....................................................................................................... 39 Figure 31: Cold start exhaust pollutant concentrations of Euro 5 diesel Vehicle H ......................... 41 Figure 32: Cold start exhaust pollutant concentrations of Euro 5 gasoline Vehicle L...................... 42 Figure 33: Cumulative frequency distribution of averaging window NOX emissions of
Vehicle L expressed as deviation ratio and conformity factor ........................................ 44 Figure 34: Cumulative frequency distribution of averaging window NOX emissions of Vehicle L
on test Route 1 expressed as deviation ration and conformity factor............................. 45

List of abbreviations and units
xi
List of abbreviations and units ARTEMIS - Assessment and Reliability of Transport Emission Models and
Inventory Systems oC - Degree Celsius CLA - Chemi-luminescence Analyser CO - Carbon monoxide CO2 - Carbon dioxide CVS - Constant Volume Sampler DG ENTR - Directorate General Enterprise and Industry DPF - Diesel Particle Filter ECE - United Nations Economic Commission for Europe ECU - Engine Control Unit EFM - Exhaust Flow Meter e.g. - Exempli gratia, example given EU - European Union EUDC - Extra Urban Driving Cycle FTP - Federal Test Procedure g - Gram GPS - Global Positioning System HFID - Heated Flame Ionization Detector i.e. - Id est, that is JRC - Joint Research Centre JTC - Japanese Test Cycle Kg - Kilogram km - Kilometre kW - Kilowatt m - Metre MVEG - Motor Vehicle Emissions Group NDIR - Non-Dispersive Infrared Sensor NDUV - Non-Dispersive Ultraviolet Analyzer NEDC - New European Driving Cycle Nm - Newton meter NMHC - Non-methane hydro carbons No. - Number NO - Nitrogen monoxide NOX - Nitrogen oxides NTE - Mot-to-exceed OCE - Off-cycle emissions PEMS - Portable Emission Measurement Systems PM - Particulate matter PM10 - Particulate matter with an aerodynamic diameter of 10 micrometers or less ppm - Parts per million ppt - Parts per thousand RPA - Relative Positive Acceleration

List of abbreviations and units
xii
rpm - Repetitions per minute s - Second THC - Total hydrocarbons USA - United States of America

Introduction
1
1 Introduction Emissions testing in the laboratory forms an essential part of the type approval procedure for light-duty vehicles within the European Union. Emissions testing follows a predefined procedure that consists of a specified driving cycle as well as prescribed test conditions at which vehicles are tested on a chassis dynamometer (EC, 2007a,2008). This approach yields verifiable and comparable data on emissions and fuel consumption and provides clear design criteria for light-duty vehicles, which have to comply with currently applicable emission limits.
Although emission limits have become increasingly stringent in the past decade, road transport remains the most important source of NOX (nitrogen oxides) and CO (carbon monoxide) emissions by 2008, contributing 41% and 34%, respectively to the total emissions of these pollutants within the European Union (EEA, 2010). In particular, urban air pollution continues to persist at high levels, with 16% and 26% of EU’s urban population being exposed to higher NO2 (nitrogen dioxide) and PM10 (particulate matter of 10 micrometers or less) concentrations than specified by applicable air quality standards (EEA, 2009). Persisting air quality problems have triggered several policy responses that are targeted at emissions of light-duty vehicles:
(i) The introduction of more stringent emission limits for light-duty vehicles with Euro 5b in 2011 and Euro 6 in 2014 (EC, 2007a,2008).
(ii) The replacement of the currently applied New European Driving Cycle (NEDC) by a world-wide harmonized driving cycle in 2014 (EC, 2009a).
(iii) Potentially, the implementation of supplementary measures for verifying vehicles’ emissions outside of the emissions testing with a single standardized driving cycle in 2014.
Particular concerns arise because emissions testing with the NEDC under laboratory
conditions might not represent the actual on-road emissions of light-duty vehicles with sufficient accuracy. Several studies have indicated that specifically on-road NOX emissions of light-duty diesel vehicles might substantially exceed Euro 2-4 emission limits (Pelkmans and Debal, 2006; Hausberger and Blassnegger, 2006; Vojtisek-Lom, 2009). Yet, comprehensive analysis of on-road emissions of light-duty diesel and gasoline vehicles that comply with Euro 3-5 is still unavailable.
This report addresses the existing knowledge gaps by using Portable Emission Measurement Systems (PEMS) to analyze the on-road emissions of 12 light-duty diesel and gasoline vehicles. The selected vehicles include small and midsize passenger cars as well as transporters and a minivan. The analysis contributes further to a knowledge base on real-world driving patterns within the European Union.
The results might assist the design of a road map for developing a suitable on-road emissions test procedure that could supplement the world-wide harmonized driving cycle in the European type approval of Euro 6 vehicles by 2014 (EC, 2007a). The report thereby contributes to a comprehensive EU environmental and industrial policy that assures compliance of light-duty vehicles with emission limits under normal conditions of use.

Section 1
2
This report continues by presenting principal background information on the European emissions legislation as well as on laboratory emissions testing and PEMS (Section 2). Afterwards, Section 3 presents the research methodology and Section 4 provides the results of the PEMS analyses. The report finishes with a discussion (Section 5) and conclusions (Section 6).

Background
3
2 Background This section sets the stage for the later analyses by presenting information on (i) the status of emission legislation within the European Union with respect to light-duty vehicles, (ii) the official procedure to test emissions of light-duty vehicles, and (iii) the current developments in the on-road emissions testing with PEMS.
2.1 The current status of European light-duty vehicle emissions legislation Emissions testing as part of the type approval procedure for light-duty vehicles is regulated within the European Union by the Co-decision regulation No. 715/2007 of 20 June 2007 (EC, 2007a) and the Comitology regulation No. 692/2008 of 18 July 2008 (EC, 2008). These regulations refer to vehicles of:
(i) categories M1 and M2 - passenger vehicles comprising no more than eight seats in addition to the driver’s seat and having a maximum mass not exceeding 5 tonnes
(ii) categories N1 and N2 - vehicles used for the carriage of goods and having a maximum mass exceeding not exceeding 12 tonnes
Vehicles of these categories currently have to comply, with the exception of a few vehicle
types used for special purposes, with Euro 5 emission limits of the following pollutants (Table 1): (i) total hydro carbons (THC) (ii) non-methane hydro carbons (NMHC) (iii) nitrogen oxides (NOX) (iv) carbon monoxide (CO) (v) particulate matter (PM) in the case of diesel engines and gasoline direct injection
engines
The European emission legislation includes additional provisions, such as requirements for low temperature emission tests at -7°C for gasoline vehicles, which have to comply with limits of 15 g/km for CO and 1.8 g/km for HC, measured over the urban part of the NEDC (EC, 2001). Carbon dioxide emissions are currently unrestricted at the level of individual vehicles. The European Commission, however, defines a target for the fleet-average CO2 emissions of new passenger cars of 130 g CO2/km for a reverence car mass of 1372 kg (EC, 2009a).

Section 2
4
Table 1: Currently applicable Euro 5 emission limits for light-duty vehicles of category M1 (EC, 2007a)
Pollutant Emission limits for vehicles with spark ignition engines in mg/km
Emission limits for vehicles with compression ignition engines in mg/km
THC 100 - NMHC 68 - NOX 60 180 HC+NOX - 230 CO 1000 500 PM 5.0/4.51 5.0/4.51
- not regulated 1 The emission limit of 5.0 mg/km refers to Euro 5a, which is relevant for category M1 vehicles since
September 2009. The emission limit of 4.5 mg/km refers to Euro 5b, which will be relevant for category M1 vehicles from January 2011 onwards.
In view of the introduction of more stringent Euro 6 emission limits in 2014, Regulation
715/2007 (EC, 2007a) contains provisions that should assure compliance of vehicles with applicable emission limits during both type approval and on-road driving under normal conditions of use1:
(i) Recital (15) requests the Commission to investigate the use of PEMS and so-called not-to-exceed regulatory concepts in the context of the revision of the NEDC.
(ii) Article 4(2) requires that manufacturer ensure an effective limitation of emissions pursuant to this Regulation, throughout the normal life of the vehicles under normal conditions of use.
(iii) Article 5(2) in conjunction with the definition in Article 3(10) prohibits the use of defeat devices under conditions that are likely to occur during normal vehicle operation, if these conditions are not substantially included in the test procedures for verifying emissions2.
(iv) Article 14(3) requires the European Commission to keep reviewing procedures, tests, and requirements used to measure emissions. If reviews identify that provisions are no longer adequate or, in particular, do not reflect on-road emissions from real-world driving, the provisions should be adapted accordingly through the Comitology procedure.
The compliance of light-duty vehicles with applicable emission limits is verified by emissions
testing on the chassis dynamometer in the laboratory. The next section describes in greater detail the key characteristics of the driving cycle, i.e., the NEDC that is currently used for standard laboratory emission tests within the European Union.
1 Normal conditions of use might also include particularly polluting driving pattern such as driving at very high speeds, as it is frequently observed on the German autobahn, engine cold start at very low temperatures, or idling in congested traffic that may cause a cool down of after-treatment devices. 2 Defeat devices are elements of design that sensor certain ambient and vehicle parameters for the purpose of influencing the operation of any part of the emission control systems, resulting in a reduced effectiveness of emission control technologies.

Background
5
2.2 The test procedure for light-duty vehicle emissions within the EU Emissions testing as part of the type-approval process for light-duty vehicles has to balance two criteria:
(i) quantifying as far as possible vehicle emissions under real-world driving conditions (ii) assuring reproducibility and comparability of emission measurements The testing of emissions and fuel consumption of light-duty vehicles takes place in the
laboratory on chassis dynamometers. The details of the test procedure are described by Directive 98/69/EC (EC, 1998) and its further amendments.
Before the emissions test, vehicles have to soak for at least 6 hours at a test temperature of 20-30°C. Emissions are then measured while vehicles follow the speed profile of the New European Driving Cycle (NEDC). The entire NEDC consists of four repeated ECE-15 driving cycles of 195s duration each and one extra-urban driving cycle (EUDC) of 400s duration (Figure 1).
Time in s0 200 400 600 800 1000
Spe
ed in
km
/h
0
20
40
60
80
100
120ECE-15
driving cycleEUDC
driving cycle
Figure 1: Speed profile of the New European Driving Cycle (NEDC)
The four ECE-15 cycles represent urban driving conditions that are characterized by low vehicle speed, low engine load, and low exhaust gas temperature. By contrast, the EUDC in the second part of the NEDC accounts for extra-urban and high speed driving modes up to a maximum speed of 120 km/h. The entire NEDC covers a distance of 11,007 m in a time period of 1180 s and at an average speed of 34 km/h. An initial idling period has been eliminated in the NEDC, thus emissions sampling begins with the start of the engine. Emissions are typically sampled with a Constant Volume Sampler (CVS) and expressed as averages over the entire test cycle in grams per kilometre [g/km] for each of the regulated pollutants (see Table 1).
The main characteristics of the NEDC in comparison to other certification cycles, i.e., the US FTP-75 driving cycle and the Japanese JTC cycle as well as the ARTEMIS urban driving cycle are provided in Table 2. The NEDC was developed to assure comparability and reproducibility of vehicle emissions that have been tested at standard conditions. Such an approach to emissions testing

Section 2
6
comes inevitable with limitations regarding the ability to reproduce actual on-road emissions. Criticism of the NEDC refers in particular to its smooth acceleration profile (André and Pronello, 1997) that requires only a very narrow range of possible engine operation points (Kageson, 1998). Table 2: Comparison the key characteristics of selected driving cycles NEDC ECE-15 US FTP-75 JTC 10-15 mode Region EU EU USA Japan Trip duration [s] 1180 780 1874 660 Trip distance [km] 11.007 4.052 17.77 4.16 Average speed [km/h] 33.6 18.7 34.1 22.7 Maximum speed [km/h] 120 50 91 70 Share [%] - Idling 24 30 19 32 - low speed >0≤50 km/h 55 70 60 49 - medium speed >50-90 km/h 14 0 19 19 - high speed >90 km/h 7 0 2 0
Table 2 (continued): Comparison the key characteristics of selected driving cycles ARTEMIS urban ARTEMIS rural ARTEMIS motorway1 Region EU EU EU Trip duration [s] 920 1081 1067 Trip distance [km] 4.47 17.27 28.74 (29.55) Average speed [km/h] 17.5 57.5 97.0 (99.7) Maximum speed [km/h] 58 112 132 (150) Share [%] - Idling 29 3 2 (2) - low speed >0≤50 km/h 69 31 15 (15) - medium speed >50-90 km/h 2 59 13 (13) - high speed >90 km/h 0 7 70 (70)
1 Values in parentheses indicate the 150 km/h specification of the ARTEMIS motorway driving cycle.
The NEDC only insufficiently represents on-road driving pattern that are characterized by low speed and high torque operation, steep and dynamic transient velocities, and driving at very high-speed. It is hence likely that vehicles comply with applicable emission limits during NEDC testing although they might show substantially higher pollutant emission levels alongside with elevated fuel consumption and CO2 emissions on the road (André, 1996; Hausberger and Blassnegger, 2006; Pelkmans and Debal, 2006; Tzirakis et al., 2006). These limitations have been acknowledged by the European Commission and triggered the current research activities around the implementation of Euro 6 by 2014, including the development of (i) a more representative and internationally harmonized driving cycle as well as (ii) a supplemental off-cycle emissions test procedure for assessing the on-road emissions of light-duty vehicles for type approval (EC, 2009c).

Background
7
2.3 Current developments in on-road emissions testing with PEMS On-road emissions testing with PEMS has been so far mainly developed to evaluate the in-service conformity of EURO V and EURO VI engines of heavy-duty vehicles (EUR, 2006a,b,c; Bonnel and Kubelt, 2010). Emissions testing of heavy-duty vehicles as part of the type approval procedure is specified by Regulation (EC) No. 595/2009 of the European Parliament and of the Council (EC, 2009b). This regulation defines rules for the in-service conformity of vehicles and the durability of emission control devices. In particular, EC (2009b) suggests (i) considering the application of portable emission measurement systems (PEMS) for verifying the in-service conformity of heavy-duty vehicles and (ii) introducing supplemental procedures to control on-road (so-called off-cycle) emissions.
Verifying the in-service conformity of heavy-duty vehicles typically requires to remove the engine from the vehicle and to test its emissions in dedicated engine test cells. Such an approach is, however, very impractical and expensive. Therefore, it has been proposed to develop a protocol for in-service conformity checking of heavy-duty vehicles based on PEMS. The European Commission (DG ENTR in co-operation with DG JRC) launched in January 2004 a co-operative research programme to study PEMS applications for heavy-duty vehicles within the European Union. The experimental activities started in August 2004 and resulted in a successful application of PEMS to heavy-duty vehicles (Bonnel and Kubelt, 2010). Following the success of the EU-PEMS project, the European Commission announced the intention to launch a manufacturer-run pilot programme at the 97th Motor Vehicle Emissions Group (MVEG) Meeting on 1 December 2005. The main purpose of the programme was to evaluate the PEMS-based technical and administrative procedures for a larger range of technologies and in statistically more significant numbers. The PEMS pilot programme was started in autumn 2006; the outcome of the programme is expected to provide further insight on the potentials to introduce in-service conformity provisions based on PEMS in the European type-approval legislation for heavy-duty vehicles.
Based on their successful application to heavy-duty vehicles, PEMS might potentially also be applicable to light-duty vehicles as supplemental measure to ensure that vehicle emissions are appropriately controlled outside standardized laboratory conditions (EC, 2007a. The JRC initiated a first PEMS test campaign to obtain insights into the suitability of PEMS for emissions testing of Euro 3-4 light-duty vehicles in 2007 based on an Administrative Arrangement with DG ENTR (EC, 2007c). The PEMS testing of Euro 5 vehicles in 2009 and 2010 was then commissioned by the recent Administrative Arrangement No. SI2.552273 between the JRC and DG ENTR (EC, 2009c). The aim of this Administrative Arrangement was in particular to obtain on-road emission values for a range of Euro 5 vehicles and thereby supporting the development of suitable off-cycle emission test procedures that might supplement the standard laboratory emission test of Euro 6 vehicles from 2014 onward. The results of both test campaigns are documented in the present report, which continues in the next section by explaining in greater detail the methodology used for the PEMS test campaign of light-duty vehicles.

8

Methodology
9
3 Methodology The methodology section contains four parts: the first part provides an overview of test vehicles; the second part presents the routes used for PEMS testing; the third part explains PEMS equipment and test protocol; the fourth part explains data processing and data analysis.
3.1 Test vehicles The analysis presented in this report includes passenger cars, i.e., vehicles of category M1, for which the currently applicable emission limits are provided in Table 1. The PEMS test fleet consists of 12 light-duty vehicles, comprising 5 gasoline vehicles, 1 gasoline-hybrid vehicle, and 6 diesel vehicles. Nine vehicles represent small and compact passenger cars, one vehicle is a minivan, and two vehicles represent small transporters. All test vehicles belong to category M1 of the European type approval classification (EC, 2007b), are sold on the European market, and passed type approval based on Euro 3-5 emission limits (Table 3). The second phase of the PEMS test campaign in the years 2009 and 2010 focused in particular on Euro 5 vehicles with the aim of complementing the data generated for Euro 3 and Euro 4 vehicles during the first project phase between 2007 and 2008.
3.2 PEMS test routes The PEMS test campaign started with the testing of Vehicles A and C on local routes, including trips from Ispra to Milan as well as in down-town Milan. Based on the results of these tests, four defined routes were developed (Table 4, Figure 2), which later served as standard test routes for all subsequent PEMS tests of Vehicles B and D-L. The characteristics of these four test routes reflect as far as possible the diversity of normal on-road driving in Europe and include:
(i) Route 1: Ispra-Milan-Ispra; representing a mix of rural and motorway driving (ii) Route 2: Ispra-Varese-Ispra; representing a mix of rural and urban driving (iii) Route 3: Ispra-Sacro Monte-Ispra; representing a mix of rural and severe uphill-
downhill driving with an elevation difference of around 800 m (iv) Route 4: Motorway; representing high-speed driving at speeds of up to 130 km/h
Figures 3 and 4 provide an overview of altitude profiles and the typical speed distributions of
the four test routes.

Section 3
10 Table 3: Specifications of test vehicles
Vehicle Vehicle category Model year
Mileage at test start [km]
Fuel Engine capacity [ccm]
Maximum engine power [kW]
Mass of CO2 emitted during standard NEDC testing [g/km] / [cumulative kg]
Emission treatment technology
Applicable emission limit
A M1 (small transporter) 2007 20,743 diesel 1997 69 182 / 2.00 oxidation catalyst,
no DPF Euro 3, Class II
B M1 (minivan) 2007 13,831 gasoline 1798 88 169 / 1.86 3-way catalyst Euro 3
C M1 (small transporter) 2007/8 ~20,000 diesel 2461 96 218 / 2.40 oxidation catalyst,
no DPF Euro 4, Class II
D M1 (small passenger car) 2007 ~800 diesel 1461 50 120 / 1.32 oxidation catalyst,
no DPF Euro 4
E M1 (compact passenger car) 2004 ~100,000 diesel 1896 77 140 / 1.54 oxidation catalyst;
no DPF Euro 4
F M1 (small passenger car) 2007 16,996 gasoline 1149 55 139 / 1.53 3-way catalyst Euro 4
G M1 (compact passenger car) 2007 1,023 gasoline-
hybrid 1497 57* 104 / 1.14 3-way catalyst Euro 4
H M1 (compact passenger car) 2009 3,408 diesel 1598 88 129 / 1.42 oxidation catalyst,
DPF Euro 5
I M1 (compact passenger car) 2009 4,667 diesel 1995 130 128 / 1.41 oxidation catalyst,
DPF Euro 5
J M1 (compact passenger car) 2009 ~5,000 gasoline 1595 75 166 / 1.83 3-way catalyst Euro 5
K M1 (small passenger car) 2009 -10,000 gasoline 1242 51 119 / 1.31 3-way catalyst Euro 5
L M1 (small passenger car) 2010 1,909 gasoline 1242 44 127 / 1.40 3-way catalyst Euro 5
1 gasoline engine only

Methodology
11
Table 4: Characteristics of PEMS test routes Test route Section Distance [km] Typical average speed [km/h]
rural 35 50 motorway 100 90 Route 1 Total 135 65 rural 51 40 urban 10 25 Route 2 Total 61 35 rural 50 45 uphill-downhill 10 30 Route 3 Total 60 40 rural 37 39 motorway 95 108 Route 4 Total 132 71
Figure 2: Topographic map of the PEMS test routes
Section 3
12
Time in s1000 3000 5000 70000 2000 4000 6000 8000
Alti
tude
in m
eter
abo
ve s
ea le
vel
200
400
600
800
1000
1200
Route 1: rural-motorwayRoute 2: rural-urbanRoute 3: rural-uphill/downhillRoute 4: motorway
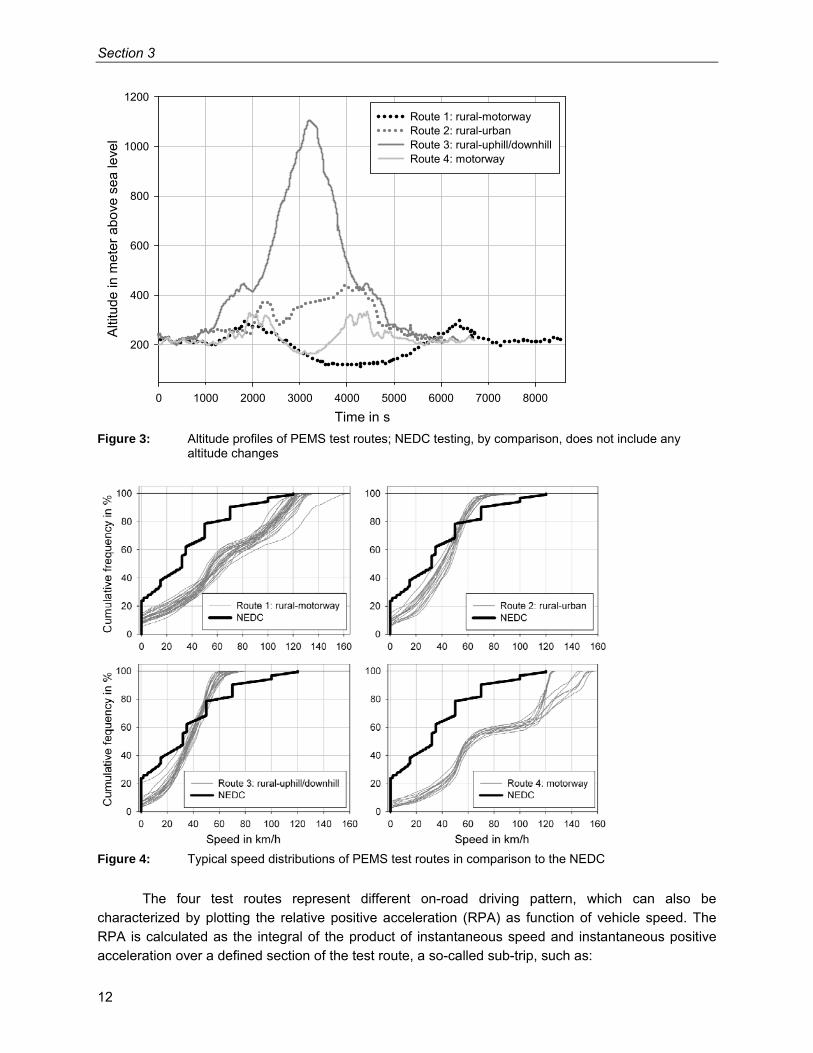
Figure 3: Altitude profiles of PEMS test routes; NEDC testing, by comparison, does not include any
altitude changes
Figure 4: Typical speed distributions of PEMS test routes in comparison to the NEDC
The four test routes represent different on-road driving pattern, which can also be characterized by plotting the relative positive acceleration (RPA) as function of vehicle speed. The RPA is calculated as the integral of the product of instantaneous speed and instantaneous positive acceleration over a defined section of the test route, a so-called sub-trip, such as:

Methodology
13
j
t
ii
x
dtavRPA
j
∫ ×= 0
)( (Equation 1)
where: tj = time
xj = distance of sub-trip j νi = speed during each increment i ai = instantaneous positive acceleration during each increment i contained
in the sub-trip j A sub-trip is defined here as any part of the test route, in which the vehicle speed is at least 2
km/h for a period of at least 5 seconds. Individual sup-trips are separated from each other by periods of idling or very slow motion in congested traffic. The length and number of sub-trips contained in a PEMS test depends on the route characteristics and the traffic situation and might show substantial variability both between and within individual test routes. Thus, sub-trips may differ substantially in their length. The maximum achievable RPA is directly related the vehicle power. Additional factors affecting the magnitude and distribution of RPA values such as: (i) the drivers’ behaviour and driving style, (ii) climatic and ambient conditions, as well as (iii) traffic and road conditions. The distribution of RPA values allows comparing the characteristics of different routes and may be used as criterion to standardize on-road PEMS emissions testing.
The RPA values of the individual PEMS test routes show distinct pattern that differ from the ones of the NEDC (Figure 5). In particular Routes 1 and 4 include a larger share of high-speed driving than the NEDC. Vehicle testing on the four test routes covers furthermore a substantially larger range of the RPA-speed spectrum than does the conventional NEDC testing. Low RPA values in the range of 0.1-0.4 m/s2 at velocities of 0-50 km/h represent the majority of driving conditions on our four PEMS test routes. Still extreme conditions exist such as RPA values above 1 m/s2 at low speeds or relatively low RPA at high speeds in the range of 120-130 km/h occur; these driving conditions are not covered by the NEDC.
Overall, Route 1 with a mix of rural and motorway driving seem to capture best the potentially large variability of on-road driving conditions. Still, driving on identical routes can lead to considerable variability in the RPA-speed trace depending on vehicle type as well as road and traffic conditions. The overview in Figure 5 clearly indicates the shortcomings of the NEDC: it completely excludes driving at low velocities and medium too high acceleration (RPA >0.2 m/s2) as well as at high velocities and low acceleration. The ongoing development of a world-wide harmonized driving cycle addresses parts these shortcomings; the new driving cycle well be implemented in the European Union by 2014 with the introduction of Euro 6 emission limits.

Section 3
14
Figure 5: The relative positive acceleration of sub-trips composing the four PEMS test routes and the
NEDC
Regardless, also the driving on the four PEMS test routs has one particular limitation: It is not able to reproduce driving at very high speeds (i.e., >140 km/h) as it frequently occurs on the German Autobahn. This limitation is relevant because Germany presents the largest vehicle market in Europe and operates an Autobahn network of more than 12,000 km, which accounts for one third of all vehicle-kilometres driven in Germany. Large parts of the Autobahn are free of a speed limit. In 1995, the average vehicle speed on the Autobahn was 134 km/h (Pander, 2007) and thereby higher than the speed limit enforced in all other European countries3.
3.3 PEMS equipment and test protocol For the emissions testing of light-duty vehicles, a Semtech-DS PEMS from Sensors Inc. was used. This equipment is commercially available and consists of a tail-pipe attachment, heated exhaust lines, a Pitot tube for measuring the exhaust mass flow and temperature, exhaust gas analyzers, a data logger to the vehicle network, a GPS, sensors for ambient temperature and humidity, and exhaust pipelines (Figure 6). The mass of the PEMS systems including an external battery for power supply amounts to 80 kg and is thereby equivalent to the mass of a passenger. PEMS accounts at maximum for 9 % of the mass of tested vehicles. Although the mass of the PEMS equipment might not substantially affect the test results, it may introduce a bias into the emission measurements. This bias may, however, allow reproducing on-road emissions of with more than one person in the vehicle.

Methodology
15
Figure 6: Schematic overview of PEMS and auxiliary components (courtesy Sensors Inc.)
PEMS measures the exhaust gas concentrations of the regulated pollutants THC, CO, and NOX, as well as of CO2 and NO emissions, the exhaust mass flow and the exhaust temperature. The complete set of parameters measured with PEMS during on-road emission tests, as well as the corresponding measurement technique, is provided in Table 5. Total hydrocarbons, CO, and CO2 emissions are measured by a non-dispersive infrared sensor (NDIR). Nitrogen monoxide is measured by an electrochemical cell; NOX is then inferred from the NO data. Particulate matter (PM) is excluded from this analysis.
Table 5: Overview of parameters measured with PEMS Category Parameter Measurement technique
THC NDIR (analyzer) CO NDIR (analyzer) CO2 NDIR (analyzer) NOX Electrochemical cell (analyzer) Exhaust flow rate EFM
Exhaust gas pollutants
Exhaust temperature EFM temperature sensor Vehicle speed GPS Vehicle position and altitude GPS Acceleration GPS
Vehicle characteristics
Distance travelled GPS Elevation GPS Ambient humidity Humidity sensor Ambient temperature Temperature sensor
Ambient conditions
Ambient pressure Pressure sensor To measure the exhaust mass flow and exhaust temperature, the Semtech-DS uses an
exhaust mass flow meter (EFM) equipped with differential pressure devices and thermocouples. The EFM has an accuracy of at least ± 3.0% at a resolution of 0.003 m3/min and an exhaust temperature range from ambient to 550 ºC. The random error of PEMS measurements typically accounts for 2-3% of the measured value. The accuracy of PEMS has been verified against laboratory equipment by 3 Italy and Poland present exceptions: The speed limit on three-lane (six lanes in two directions) highways in Italy may be 150 km/h if indicated. The speed limit on highways in Poland will be 140 km/h from 2011 onward.

Section 3
16
Rubino et al., (2007a). The verification tests were conducted on a 48 inches chassis dynamometer (MAHA, maximum power 150 kW, maximum velocity 200 km/h, and inertia of 454-4500 kg) over the NEDC. A Horiba MEXA-7400HTR-LE was used as reference for measuring NOX, CO, HC, and CO2 emissions. The NOX emissions were measured using a chemiluminescence analyser (CLA; the total hydrocarbons emissions were measured by a heated flame ionization detector (FID), CO and CO2 were determined by non-dispersive infra-red analyses. The CVS flow rate was set at 6 m3/min. The gaseous emissions were measured during the emission tests according to the current European type-approval protocol. Good agreement was found between the emissions as measured with PEMS and the reference test cell analyzers (Horiba) as shown in Figure 7 (see also EPA, 2008; Rubino et al., 2007a,b). The deviations between both PEMS and laboratory equipment are negligible with respect to the findings of this report.
The test protocol of the Semtech-DS PEMS for measuring on-road emissions of light-duty vehicles was adapted in two points from the one developed for heavy-duty vehicles (EUR, 2006c):
(i) The emissions were measured directly from cold start, including cranking. (ii) The vehicle conditioning (e.g., the vehicle temperature) was monitored before, during,
and after the test. The main components of the Semtech-DS PEMS (i.e., pumps, electronic equipment, and
analysers) were installed in the cabin of the vehicle, which avoids contamination, excessive vibrations, and heating of the equipment. The exhaust mass flow meters were attached to the vehicle’s tailpipe; GPS and weather station were installed outside of the vehicle (Figure 8). The power for the analytical equipment was supplied by an external battery. This reduces the interference of PEMS with the engine operation and allows PEMS testing for up to 2.5 hours; the battery, nevertheless, introduces additional weight to the PEMS equipment. PEMS has been proven to yield reliable emission measurements in previous test campaigns for heavy-duty and light-duty vehicles (EUR, 2006a,b; Rubino et al., 2007a; Bonnel and Kubelt, 2010).

Methodology
17
0
20000
40000
60000
80000
0 100 200 300 400 500 600
Wet_
CO
2 [
pp
m]
PEMS LABORATORY
0
800
1600
2400
3200
0 100 200 300 400 500 600
Wet_
CO
[ppm
]
0
150
300
450
600
0 100 200 300 400 500 600
Wet_
NO
x [
pp
m]
0
100
200
300
400
0 100 200 300 400 500 600
Wet_
TH
C [
ppm
]
0
100
200
300
400
0 100 200 300 400 500 600
Exh
_Flo
w [
kg/h
]
Figure 7: Comparison of emissions as measured with PEMS and standard laboratory equipment

Section 3
18
(i) EFM
(ii) PEMS installation
(iii) PEMS main unit
(iv) external battery
Figure 8: Demonstrating the installation of PEMS in a light-duty vehicle
3.4 Data collection and analysis 3.4.1 Complementary data supply and emission tests In addition to PEMS testing, the emissions of Vehicles A, D, and G-L were determined based on NEDC testing in the laboratory. All laboratory tests were conducted on a 48 inches (118 cm) chassis dynamometer produced by MAHA. A Horiba MEXA-7400HTR-LE was used as standard laboratory equipment for measuring THC, CO, HC, NOX, and CO2 emissions (see also Section 3.3). The vehicles that were tested based on the NEDC generally complied in the laboratory with the applicable emission limits.
For Vehicles B, C, E, and F no such NEDC tests were performed because in the early phase of the PEMS test campaign attention was predominantly paid on the reliability and completeness of PEMS measurements, rather than on establishing on-road emission values of light-duty vehicles in comparison to laboratory tests. The PEMS tests of the various vehicles were complemented as far as possible by vehicle data such as engine fuel rate [g/s], engine speed [rpm], or engine torque [Nm] obtained from the Engine Control Unit (ECU) via a data logger.

Methodology
19
3.4.2 Data analysis During the actual PEMS testing, each vehicle started from the JRC in Ispra (Italy) and returned to the JRC for technical checks, calibration, and data download. PEMS measures emissions with a time resolution of one second. Recorded emissions data were uploaded together with data from the PEMS’s GPS system into EMROAD©, which is an Excel® tool developed by the JRC for analyzing and evaluating PEMS data (Kubelt and Bonnel, 2007). PEMS records uniformly NOX emissions, which are uncorrected for ambient humidity and intake air temperature. This approach is justified by the aim of this project, i.e., to report on-road emissions as they occur under real-world driving conditions.
EMROAD© calculates first average emissions for the entire test route, expressed as grams per kilometre. EMROAD© also presents emissions in alternative metrics, e.g., as function of time or emitted CO2 mass. These metrics will, however, not be discussed in detail because emission limits for light-duty vehicles are uniformly defined by EU legislation as distance-specific values in grams per kilometre (EC, 2007a).
To enable a more detailed analysis of emissions, EMROAD© allows calculating emission averages for individual averaging windows that represent sub-trips of a test route. This method is generally referred to as the averaging window method and represents an established methodology that will be used for the official emissions testing and characterization of Euro VI heavy-duty vehicles (EC, 2010). The method reduces fluctuations in the second-by-second emissions data and enables a more detailed understanding of emission variability in comparison to route averages. The principle approach is as follows: Pollutant emissions are averaged over intervals of a predefined duration. These intervals are referred to here as averaging windows. The duration of an averaging window is determined in the case of heavy-duty vehicles by a predefined quantity of work the vehicle’s engine has performed until a certain point. This reference metrics is chosen because emission limits for heavy-duty vehicles are defined as work-specific quantities. In the case of heavy-duty vehicles both work-based averaging windows and applicable emission limits are therefore directly linked to an actual engine parameter (Kubelt and Bonnel, 2007; Bonnel and Kubelt, 2010; EC, 2010). In the case of light-duty vehicles emission limits are defined as distance-specific values (see Table 1). In line with the definition of emission limits (EC, 2007a), we chose in this report the distance travelled by the vehicle [km] as reference parameter to determine the length of an averaging window4. To make reference to the NEDC laboratory testing, the duration of a window is determined precisely as the distance travelled until the vehicle has emitted a cumulative mass of CO2 that is equivalent to the CO2 mass emitted during NEDC testing (see Table 3, column 8 from the left; Figures 9 and 10). This approach assures comparability of the distance-specific averaging window emissions with the Euro 3-5 emission limits. It is important to note that the CO2 mass emitted presents a constant but the distance travelled by the vehicle may vary depending on the actual driving conditions. The averaging windows move at time increments equal to the data sampling period, i.e., one second. The distance d travelled during any averaging window is determined by:
12 sss −= , when (Equation 2)
)()()()( 12,12 22222smsmmsmsdm COCOrefCOCOCO −≤<−Δ− (Equation 3)
4 The duration of averaging windows is generally longer than the one of sub-trips (see Section 3.2). On exception presents motorway driving, which typically is not interrupted by vehicle stops. Under such conditions, sub-trips might be extremely long, thus exceeding the length of an averaging window by several factors.

Section 3
20
where: refCOm ,2 = total reference CO2 mass [kg] determined during the NEDC test
)( 12smCO ; )( 22
smCO = total CO2 mass [kg] emitted until distance s1 and s2
Δs = distance travelled during the time increment of the sampling period of one second (Figure 10)
Distance in km0 20 40 60 80 100 120
Cum
ulat
ive
CO
2 em
issi
ons
in k
g an
d in
stan
tane
ous
NO
X em
issi
ons
in g
/km
0
5
10
15
20
Ave
ragi
ng w
indo
w N
OX
emis
sion
s in
g/k
m
0.00
0.02
0.04
0.06
0.08
0.10
0.12
0.14
Cumulative CO2 emissionsNOX emissionsAveraging window NOX emissions
Duration of the first averaging window
Figure 9: Example of the averaging window method for NOX emissions; the first average is calculated
once the vehicle has travelled a distance at which it has emitted a cumulative mass of CO2 equivalent to the cumulative CO2 mass emitted during a standard NEDC test; all consecutive windows move in increments of the sampling period, i.e., one second assuring that the cumulative CO2 emissions match the reference CO2 mass
Cumulative CO2 emissions in kg
Pol
luta
nt e
mis
sion
s in
gm
(s2)
m(s
1)
mCO2(s2)mCO2
(s1) mCO2(t2- s)
mpo
lluta
nt
mCO2(s2) - mCO2
(s1) > mCO2,ref
mCO2(d2- s) - mCO2
(d1) < mCO2,ref
Figure 10: Schematic overview of the procedure to determine the duration of an averaging window with
the CO2 mass-based method

Methodology
21
The CO2 mass is calculated per window by integrating, i.e., adding the instantaneous CO2
emissions measured with PEMS. In order to obtain a sufficient amount of data that can be used for analysis, a vehicle should emit during PEMS on-road testing at least a cumulative CO2 mass that is equal to the cumulative CO2 mass emitted during NEDC testing. For example, the first averaging window for Vehicle A (see Table 3) ends at a distance at which the vehicle has emitted cumulative CO2 emissions of 2.00 kg; likewise, the averaging window for vehicle B (see Table 3) covers a distance equivalent to the cumulative CO2 emissions of 1.86 kg. The averaging window method generally takes all measurements into account, thereby smoothing emissions data and reducing the interference of measurement spikes.
The applied averaging window method implies a peculiarity that deserves attention: The averaging window method gives unequal weight to emissions data because individual data points have different probabilities of belonging to a certain window. In particular emissions data obtained in the middle of a test procedure might be part of multiple windows where as emissions data in the beginning or at the end of an emissions test might be part of only one or a few averaging windows. This shortcoming is relevant for cold start emissions that are contained only in a few averaging windows, thus being underrepresented in the sample of averaging window emissions. We consider this problem minor with respect to the general findings of this report, in particular because cold-start emissions are specifically addressed in a separate section.
In line with Euro 3-5 emission limits, this report presents emissions uniformly in grams of per kilometre [g/km]. The presented uncertainty intervals for the route-specific average emissions indicate the maximum emissions measured over an entire test route. This approach is justified because for future emissions legislation it may be most relevant to obtain insight into the maximum level of emissions that might occur during on-road driving rather than into the overall variability of on-road emissions.
Next to presenting distance-specific emissions, also dimensionless deviation ratios (DR) are calculated. Deviation ratios present an indicator for the deviation between actual on-road emissions and the Euro 3-5 emission limits. The deviation ratio for each individual averaging window and each individual pollutant is defined as:
C
I
DRDRDR = (Equation 4)
where DRI = in-use deviation ratio
DRC = certification deviation ratio Both parameters are defined as:
)()( 12 tstsm
DRI −= (Equation 5)
NEDC
LC s
mDR = (Equation 6)

Section 3
22
where: m = the mass of the respective pollutant emitted during one averaging window [g/window]
s(t2)-s(t1) = the actual distance travelled by the vehicle during each individual averaging window [km/window]
mL = the mass of the respective pollutant emitted during one NEDC driving cycle according to the Euro 3-5 emission limits [g]
sNEDC = the reference distance of the NEDC driving cycle, i.e., 11.007 km
The reference pollutant mass of mL differs depending on the applicable emission limit. The deviation ratios are calculated by using the travel distance as reference because emission limits for light-duty vehicles are defined as distance-specific values. The deviation ratios therefore differ from the so-called conformity factors that are used to characterize on-road emissions of heavy-duty vehicles by using engine work as reference quantity. The differences between both indicators and potential impacts on our results are discussed in Section 5.1.
To analyze the emission performance of vehicles under cold-start conditions, emissions during the first 300 seconds of each PEMS test were analyzed separately. During the cold start period, the various test routes differ in their characteristics only marginally from each other. Therefore, individual test routes were not differentiated. Instead average and maximum cold start emissions were calculated by combining the cold start sections of all test routes. The report continues with presenting the results of the on-road emissions testing with PEMS.

Results
23
4 Results This section presents the results of the PEMS test campaign for 12 gasoline and diesel vehicles that comply with Euro 3-5 emission limits. Special attention is paid to on-road emissions of Euro 5 vehicles because these vehicles are the most modern among the test vehicles and have to comply during NEDC testing with the currently enforced emission limits. This section continues by presenting on-road emissions for each vehicle as averages over the entire test routes (Section 4.1). Based on these results, Section 4.2 focuses in greater detail on NOX emissions of Euro 5 vehicles, addressing in particular:
(i) the on-road emissions of Euro 5 vehicles in comparison to Euro 5 emission limits (ii) on-road emissions of Euro 5 vehicles in comparison to Euro 3 and Euro 4 vehicles Section 4.3 presents cold start emissions, i.e., emissions occurring during the first 300
seconds of the PEMS tests.
4.1 Average on-road emissions of light-duty vehicles This section presents average emissions of NOX, THC, CO, and CO2 for the various light-duty vehicles and test routes. The average emissions are presented for each pollutant with two metrics as (i) distance-specific emissions [g/km] and (ii) dimensionless deviation ratios. The variability of emissions is indicated by error bars that present the maximum emissions measured for a vehicle on the various test routes. The PEMS results on NOX emissions in Figures 11 and 12 show that:
(i) On-road NOX emissions of gasoline vehicles generally stay within Euro 3-5 emission limits whereas NOX emissions of diesel vehicles substantially exceed Euro 3-5 emission limits up to a factor of 4-7.
(ii) On-road NOX emissions show a relatively small decline from Euro 3 to Euro 5 diesel vehicles. This decline is substantially smaller than the stringency of Euro 3 to Euro 5 emission limits would suggest.
(iii) PEMS results suggest that there is no decline in the on-road NOX emissions of Euro 3 towards Euro 5 gasoline vehicles.
(iv) On-road NOX emissions are highest during extreme uphill-downhill driving and during driving on the Motorway at high velocities. This finding might be explained by insufficient exhaust gas recirculation at high engine loads during uphill and high-speed driving as well as decreased catalyst efficiency at cold start or during cool-down while down-hill driving and idling.
(v) The error intervals indicate substantial variability in the on-road NOX emissions even if vehicles are driven on identical routes and thus under supposedly similar load pattern and driving conditions. This finding indicates the relatively high variability of on-road vehicle operating conditions.
(vi) In particular diesel Vehicles A and H fail to meet the Euro 3 and Euro 5 emission limits, respectively when tested with the NEDC; this finding might be partially attributed to deviations in chassis dynamometer settings and vehicle characteristics from type approval conditions.

Section 4
24
A (d
iese
l)*
B (g
asol
ine)
C (d
iese
l)*
D (d
iese
l)
E (d
iese
l)
F (g
asol
ine)
G (g
asol
ine)
H (d
iese
l)
I (di
esel
)
J (g
asol
ine)
K (g
asol
ine)
L (g
asol
ine)
Ave
rage
NO
X em
issi
ons
in g
/km
0.25
0.75
1.25
1.75
2.25
0.00
0.50
1.00
1.50
2.00
2.50
Euro 3 Euro 4 Euro 5
Route 1: rural-motorwayRoute 2: rural-urbanRoute 3: rural-uphill/downhillRoute 4: motorwayNEDC laboratory testingApplicable emission limit
Figure 11: Average NOX emissions on the PEMS test routes and during NEDC testing in the laboratory;
uncertainty intervals indicate the maximum average emissions for each test and vehicle; * the rural-motorway cycle for Vehicles A and C (see Table 3) includes a combination of the two test cycles Ispra-Milan-Ispra and Milan-urban
A (d
iese
l)*
B (g
asol
ine)
C (d
iese
l)*
D (d
iese
l)
E (d
iese
l)
F (g
asol
ine)
G (g
asol
ine)
H (d
iese
l)
I (di
esel
)
J (g
asol
ine)
K (g
asol
ine)
L (g
asol
ine)
Ave
rage
NO
X em
issi
ons
expr
esse
d as
dev
iatio
n ra
tio
1
3
5
7
0
2
4
6
Euro 3 Euro 4 Euro 5
Route 1: rural-motorwayRoute 2: rural-urbanRoute 3: rural-uphill/downhillRoute 4: motorwayNEDC laboratory testingApplicable emission limit
Figure 12: Average NOX emissions on the PEMS test routes and during NEDC testing in the laboratory
expressed as deviation ratio; uncertainty intervals indicate the maximum average emissions for each test route and vehicle; * the rural-motorway (Milan) cycle for Vehicles A and C (see Table 3) includes a combination of the two test cycles Ispra-Milan-Ispra and Milan-urban
In summary, the PEMS results indicate that the increasing stringency of Euro 3 to Euro 5
emission limits did not lead to a substantial decline in the off-cycle on-road NOX emissions of light-duty diesel vehicles. On-road NOX emissions of current Euro 5 light-duty diesel vehicles might exceed

Results
25
emission limits by up to a factor of four, depending on driving conditions. These results confirm earlier findings by Pelkmans and Debal (2006) and Vojtisek-Lom et al. (2009), who reported that NOX emissions during off-cycle and on-road driving of five light-duty diesel vehicles substantially exceeded both Euro 3-4 emission limits. Overall, the results indicate that the standardized NEDC testing is clearly limited in capturing the diversity of emissions as they occur during on-road driving and may not fulfil the requirements defined by Regulation 715/2007 EC (2007a).
Of the total NOX emissions, NO2 is of particular interest because of its direct adverse environmental and health effects. The PEMS measurements indicate that:
(i) NO2 emissions of gasoline vehicles are negligible in comparison to the emissions of diesel vehicles (Figures 13 and 14).
(ii) The share of NO2 in the total NOX emissions is substantially higher for diesel than for gasoline vehicles.
(iii) NO2 might reach a share of up to 60% in the total NOX emissions of diesel vehicles; the results do not allow drawing conclusions on whether this share increased from Euro 3 to Euro 5 vehicles.
A (d
iese
l)*
B (g
asol
ine)
C (d
iese
l)*
D (d
iese
l)
E (d
iese
l)
F (g
asol
ine)
G (g
asol
ine)
H (d
iese
l)
I (di
esel
)
J (g
asol
ine)
K (g
asol
ine)
L (g
asol
ine)
Ave
rage
NO
2 em
issi
ons
in g
/km
0.0
0.2
0.4
0.6
0.8
1.0
1.2
Route 1: rural-motorwayRoute 2: rural-urbanRoute 3: rural-uphill/downhillRoute 4: motorway
Euro 3 Euro 4 Euro 5
Figure 13: Average NO2 emissions on the PEMS test routes; uncertainty intervals indicate the maximum
average emissions for each test and vehicle; NO2 was not measured during NEDC testing; * the rural-motorway cycle for Vehicles A and C (see Table 3) includes a combination of the two test cycles Ispra-Milan-Ispra and Milan-urban

Section 4
26
A (d
iese
l)*
B (g
asol
ine)
C (d
iese
l)*
D (d
iese
l)
E (d
iese
l)
F (g
asol
ine)
G (g
asol
ine)
H (d
iese
l)
I (di
esel
)
J (g
asol
ine)
K (g
asol
ine)
L (g
asol
ine)
Ave
rage
NO
2 em
issi
ons
in p
erce
nt
of N
OX
emis
sion
s
0
20
40
60
80
Euro 3 Euro 4 Euro 5
Route 1: rural-motorwayRoute 2: rural-urbanRoute 3: rural-uphill/downhillRoute 4: motorway
Figure 14: Average NO2 emissions on the PEMS test routes expressed as percentage of average NOX
emissions; uncertainty intervals indicate the maximum average emissions for each test and vehicle; NO2 was not measured during NEDC testing; * the rural-motorway cycle for Vehicles A and C (see Table 3) includes a combination of the two test cycles Ispra-Milan-Ispra and Milan-urban
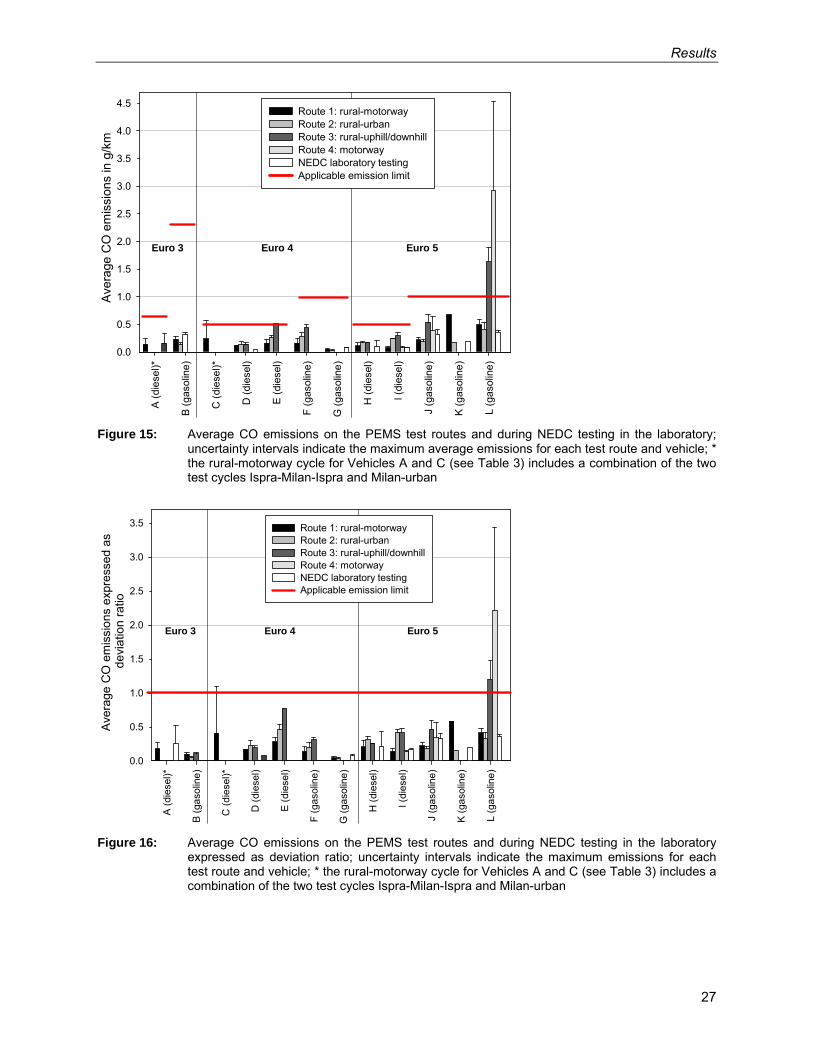
In contrast to the on-road NOX emissions, both on-road CO and THC emissions generally stay
below Euro 3-5 emission limits. Figures 15 and 16 indicate that: (i) On-road CO emissions of both diesel and gasoline vehicles generally stay below Euro
3-5 emission limits. (ii) The results do not allow identifying a trend towards lower CO emissions from Euro 3 to
Euro 5 diesel and gasoline vehicles. (iii) The Euro 5 gasoline vehicle L shows exceptionally high emissions during extreme
uphill-downhill as well as high-speed driving. The high CO emissions are associated with elevated THC emissions (see below) and high catalyst temperatures of up to 400 oC. The insufficient oxidation of carbon monoxide during uphill and high-speed driving points to insufficient catalytic conversion and requires further analyses.
Results
27
A (d
iese
l)*
B (g
asol
ine)
C (d
iese
l)*
D (d
iese
l)
E (d
iese
l)
F (g
asol
ine)
G (g
asol
ine)
H (d
iese
l)
I (di
esel
)
J (g
asol
ine)
K (g
asol
ine)
L (g
asol
ine)
Ave
rage
CO
em
issi
ons
in g
/km
0.5
1.5
2.5
3.5
4.5
0.0
1.0
2.0
3.0
4.0
Euro 3 Euro 4 Euro 5
Route 1: rural-motorwayRoute 2: rural-urbanRoute 3: rural-uphill/downhillRoute 4: motorwayNEDC laboratory testingApplicable emission limit
Figure 15: Average CO emissions on the PEMS test routes and during NEDC testing in the laboratory;
uncertainty intervals indicate the maximum average emissions for each test route and vehicle; * the rural-motorway cycle for Vehicles A and C (see Table 3) includes a combination of the two test cycles Ispra-Milan-Ispra and Milan-urban
A (d
iese
l)*
B (g
asol
ine)
C (d
iese
l)*
D (d
iese
l)
E (d
iese
l)
F (g
asol
ine)
G (g
asol
ine)
H (d
iese
l)
I (di
esel
)
J (g
asol
ine)
K (g
asol
ine)
L (g
asol
ine)
Ave
rage
CO
em
issi
ons
expr
esse
d as
de
viat
ion
ratio
0.5
1.5
2.5
3.5
0.0
1.0
2.0
3.0
Euro 3 Euro 4 Euro 5
Route 1: rural-motorwayRoute 2: rural-urbanRoute 3: rural-uphill/downhillRoute 4: motorwayNEDC laboratory testingApplicable emission limit
Figure 16: Average CO emissions on the PEMS test routes and during NEDC testing in the laboratory
expressed as deviation ratio; uncertainty intervals indicate the maximum emissions for each test route and vehicle; * the rural-motorway cycle for Vehicles A and C (see Table 3) includes a combination of the two test cycles Ispra-Milan-Ispra and Milan-urban

Section 4
28
The THC emissions of all diesel and gasoline vehicles remain below Euro 3-5 emission limits during the PEMS test campaign. The results can be summarized as follows (Figures 17 and 18):
(i) THC emissions of diesel and gasoline vehicles remain far below Euro 3-5 emission limits.
(ii) THC emissions generally increase from Euro 3 to Euro 5 gasoline vehicles both in absolute terms and as percentage of Euro 3-5 emission limits.
(iii) THC emissions of diesel and gasoline vehicles are generally higher during NEDC testing than they are on the road.
(iv) The Euro 5 gasoline Vehicle L shows higher THC emissions than all other test vehicles; the elevated emissions are associated with catalyst temperatures of up to 400 OC, suggesting low catalytic conversion rates.
A (d
iese
l)*
B (g
asol
ine)
C (d
iese
l)*
D (d
iese
l)
E (d
iese
l)
F (g
asol
ine)
G (g
asol
ine)
H (d
iese
l)
I (di
esel
)
J (g
asol
ine)
K (g
asol
ine)
L (g
asol
ine)
Ave
rage
TH
C e
mis
sion
s in
g/k
m
0.00
0.05
0.10
0.15
0.20
Euro 3 Euro 4 Euro 5
Route 1: rural-motorwayRoute 2: rural-urbanRoute 3: rural-uphill/downhillRoute 4: motorwayNEDC laboratory testingApplicable emission limit
Figure 17: Average THC emissions on the PEMS test routes and during NEDC testing in the laboratory;
uncertainty intervals indicate the maximum average emissions for each test route and vehicle; * the rural-motorway cycle for Vehicles A and C (see Table 3) includes a combination of the two test cycles Ispra-Milan-Ispra and Milan-urban
Results
29
B (g
asol
ine)
F (g
asol
ine)
G (g
asol
ine)
J (g
asol
ine)
K (g
asol
ine)
L (g
asol
ine)
Ave
rage
TH
C e
mis
sion
s ex
pres
sed
as d
evia
tion
ratio
0.0
0.2
0.4
0.6
0.8
1.0
Euro 3 Euro 4 Euro 5
Route 1: rural-motorwayRoute 2: rural-urbanRoute 3: rural-uphill/downhillRoute 4: motorwayNEDC laboratory testingApplicable emission limit
Figure 18: Average THC emissions on the PEMS test routes and during NEDC testing in the laboratory
expressed as deviation ratio; uncertainty intervals indicate the maximum average emissions for each test route and vehicle
The PEMS measurements indicated so far that on-road NOX emissions of diesel vehicles
substantially exceed substantially Euro 3-5 emission limits, whereas on-road CO and THC emissions generally remain below the limits. Next to regulated pollutants, on-road CO2 emissions are of particular interest to policy makers. To reduce greenhouse gas emissions from transport, the European commission sets a target of 130 g CO2/km for new light-duty vehicles of a reference mass of 1372 kg (EC, 2009a). For reasons of simplicity, we uniformly use here 130 g CO2/km as benchmark for all test vehicles, thereby disregarding the specific mass of vehicles. The PEMS measurements indicate that (Figures 19-21):
(i) The average on-road CO2 emissions of all vehicles tested on the four PEMS test routes amount to 176 ± 42 g/km. Diesel vehicles emit on average 189 ± 51 g/km, whereas gasoline vehicles emit 162 ± 29 g/km CO2. Thus, on-road emissions substantially exceed the European Commissions fleet-average emissions target of 130 g/km (EC, 2009a).
(ii) The on-road CO2 emissions of test vehicles exceed the emissions as specified during NEDC type approval by on average 21 ± 9%. Diesel vehicles show a deviation of 24 ± 8% and gasoline vehicles of 18 ± 10%. Still, these deviations might increase if vehicles are driven at extremely high speeds, e.g., as it frequently occurs on the German Autobahn.
(iii) The average CO2 emissions during NEDC laboratory tests exceed the emission values as specified during NEDC type approval by 15 ± 10%. This deviation might be explained by differences regarding vehicle preparation (e.g., brand, dimension, air pressure of tyres, level of battery charge) as well as specific settings of the chassis dynamometer.

Section 4
30
A (d
iese
l)*
B (g
asol
ine)
C (d
iese
l)*
D (d
iese
l)
E (d
iese
l)
F (g
asol
ine)
G (g
asol
ine)
H (d
iese
l)
I (di
esel
)
J (g
asol
ine)
K (g
asol
ine)
L (g
asol
ine)
Ave
rage
CO
2 em
issi
ons
in g
/km
50
150
250
350
0
100
200
300
400
Euro 3 Euro 4
Euro 5
Route 1: rural-motorwayRoute 2: rural-urbanRoute 3: rural-uphill/downhillRoute 4: motorwayNEDC laboratory testingNEDC type approvalEmission target
Figure 19: Average CO2 emissions on the PEMS test routes and during NEDC testing in the laboratory;
uncertainty intervals indicate the maximum average emissions for each test route and vehicle; * the rural-motorway cycle for Vehicles A and C (see Table 3) includes a combination of the two test cycles Ispra-Milan-Ispra and Milan-urban
A (d
iese
l)*
B (g
asol
ine)
C (d
iese
l)*
D (d
iese
l)
E (d
iese
l)
F (g
asol
ine)
G (g
asol
ine)
H (d
iese
l)
I (di
esel
)
J (g
asol
ine)
K (g
asol
ine)
L (g
asol
ine)
Ave
rage
CO
2 em
issi
ons
as p
erce
ntag
e of
the
130
g/km
em
issi
on ta
rget
0
50
100
150
200
250
300
Euro 3 Euro 4
Euro 5
Route 1: rural-motorwayRoute 2: rural-urbanRoute 3: rural-uphill/downhillRoute 4: motorwayNEDC laboratory testNEDC type approvalEmission target
Figure 20: Deviation of average CO2 emissions on the PEMS test routes and during NEDC testing in the
laboratory expressed percentage of the established emission target of 130 g CO2/km; uncertainty intervals indicate the maximum average emissions for each test route and vehicle; * the rural-motorway cycle for Vehicles A and C (see Table 3) includes a combination of the two test cycles Ispra-Milan-Ispra and Milan-urban

Results
31
A (d
iese
l)*
B (g
asol
ine)
C (d
iese
l)*
D (d
iese
l)
E (d
iese
l)
F (g
asol
ine)
G (g
asol
ine)
H (d
iese
l)
I (di
esel
)
J (g
asol
ine)
K (g
asol
ine)
L (g
asol
ine)
Ave
rage
CO
2 em
issi
ons
as p
erce
ntag
e of
N
ED
C ty
pe a
ppro
val e
mis
sion
s
0
50
100
150
200
250
Euro 3 Euro 4
Euro 5
Route 1: rural-motorwayRoute 2: rural-urbanRoute 3: rural-uphill/downhillRoute 4: motorwayNEDC laboratory testingNEDC type approval
Figure 21: Deviation of average CO2 emissions on the PEMS test routes and during NEDC testing in the
laboratory expressed percentage of the NEDC type approval emissions; uncertainty intervals indicate the maximum average emissions for each test route and vehicle; * the rural-motorway cycle for Vehicles A and C (see Table 3) includes a combination of the two test cycles Ispra-Milan-Ispra and Milan-urban
The report presented so far on-road emissions as averages over entire test routes. The next
section analyzes in greater detail the on-road NOX emissions of Euro 5 vehicles by making use of the averaging window calculations.
4.2 On-road NOX emissions of Euro 5 light-duty vehicles 4.2.1 On-road NOX emissions of Euro 5 vehicles versus Euro 5 emission limits The results of the previous section indicate that on-road NOX emissions of Euro 5 diesel vehicles may substantially exceed the Euro 5 emission limit. This section analyzes now in greater detail the NOX emissions of Euro 5 vehicles with the averaging window method (see Section 3.4.2 for methodological details). The analysis shows that for almost any driving conditions the two tested Euro 5 diesel vehicles emit more NOX than specified by the Euro 5 limit of 0.18g/km (Figures 22-25). The key findings are:
(i) NOX emissions of all averaging windows exceed the Euro 5 emission limit in the case of Vehicle H; up to 20% of all averaging windows for Vehicle I show lower NOX emissions than specified by the Euro 5 emission limit, depending on the route driven.
(ii) Uphill/downhill driving of Route 3 is associated with particularly high NOX emissions; the NOX emissions of all averaging windows for both vehicles exceed the Euro 5 emission limit on this test route; roughly 20% of the window emissions exceed the Euro 5 limit by more than 8 times. This finding points to fuel consumption, i.e., engine load as critical parameter determining the NOX emissions of diesel vehicles.
(iii) The NOX emissions show considerable variability; this variability is, however, larger between different test routes than between individual tests on identical test routes.

Section 4
32
Figure 22: Averaging window NOX emissions of EURO 5 diesel Vehicle H
Figure 23: Averaging window NOX emissions of EURO 5 diesel Vehicle I

Results
33
Figure 24: Averaging window NOX emissions of EURO 5 diesel Vehicle H expressed as deviation ratio
Figure 25: Averaging window NOX emissions of EURO 5 diesel Vehicle I expressed as deviation ratio
In conclusion, the results indicate that the magnitude of NOX emissions depends on the
vehicle velocity and operation mode but substantially exceeds under almost all on-road driving conditions the Euro 5 emission limit. This finding presents a sharp contrast to Euro 5 gasoline vehicles, for which NOX emission remain for most of the averaging windows below the Euro 5 limit of 0.06 g/km (Figure 26). The key findings for Euro 5 gasoline vehicles are:
(i) NOX emissions remain for the majority of averaging windows below the Euro 5 emission limit.
(ii) Even on the very severe Route 3, at maximum 40% of the averaging windows exceed the Euro 5 emission limit (Vehicle L). However, NOX emissions of a very few averaging windows might exceed the limit by more than three times under these driving conditions.

Section 4
34
(iii) Particularly high NOX emissions occur at velocities higher than 120 km/h, under extreme uphill/downhill driving, during the cold-start phase, and during idling in urban driving. This finding points to fuel consumption (i.e., engine load) as well as catalyst temperature (which is low during cold start and might decline during long downhill and idling passages) as critical parameters for NOX emissions. This finding further indicates, which driving pattern should be critically considered during type approval to achieve an effective reduction of on-road NOX emissions.
(iv) The high NOX emissions during low-velocity driving on Routes 1 and 2 are likely to be caused by both cold start and long idling periods. In the latter case, the catalyst cools down while the engine produces emissions although the vehicle’s velocity is zero.
Caution is, however, required before drawing conclusions about the high emission levels of
Euro 5 gasoline vehicles on Routes 1 and 2. Additional evaluation in Section 4.2.3 shall explore to which extent idling actually explains high NOX emissions at low velocity and whether alternative metrics for data analysis should be employed to correct for the bias introduced by idling operation into the results.

Results
35
Figure 26: Averaging window NOX emissions of Euro 5 gasoline vehicles; results given for only one
randomly selected PEMS test for each vehicle and test route
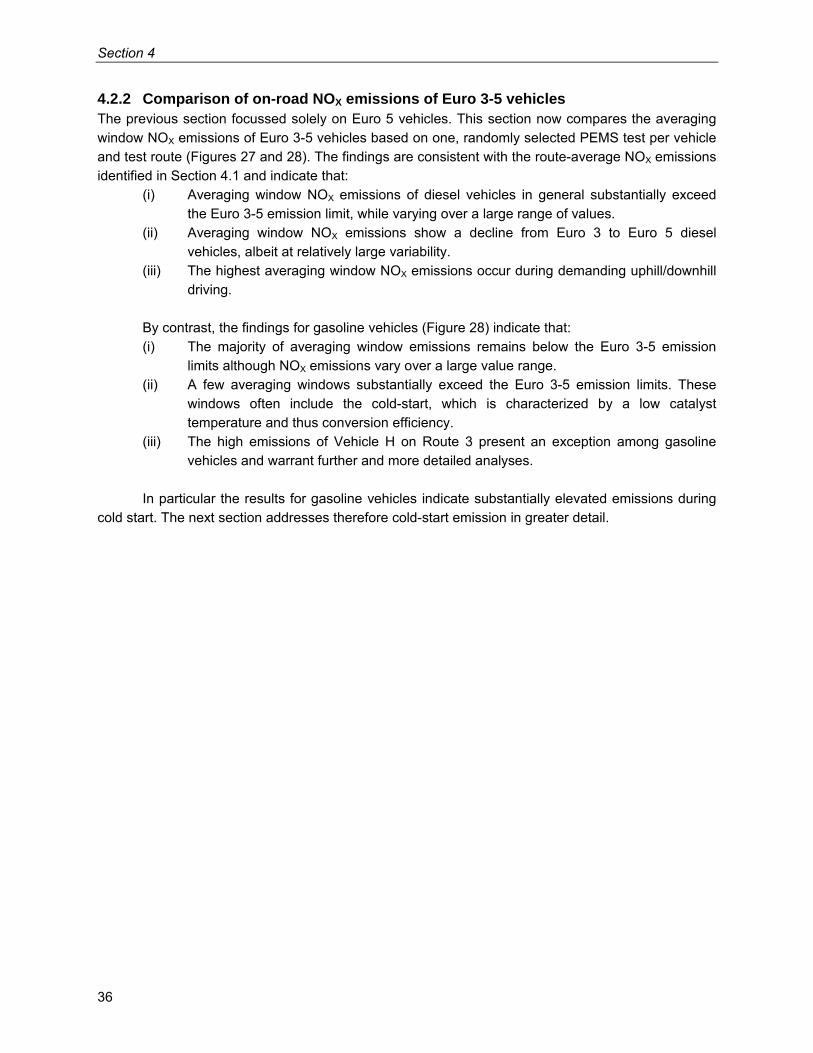
Section 4
36
4.2.2 Comparison of on-road NOX emissions of Euro 3-5 vehicles The previous section focussed solely on Euro 5 vehicles. This section now compares the averaging window NOX emissions of Euro 3-5 vehicles based on one, randomly selected PEMS test per vehicle and test route (Figures 27 and 28). The findings are consistent with the route-average NOX emissions identified in Section 4.1 and indicate that:
(i) Averaging window NOX emissions of diesel vehicles in general substantially exceed the Euro 3-5 emission limit, while varying over a large range of values.
(ii) Averaging window NOX emissions show a decline from Euro 3 to Euro 5 diesel vehicles, albeit at relatively large variability.
(iii) The highest averaging window NOX emissions occur during demanding uphill/downhill driving.
By contrast, the findings for gasoline vehicles (Figure 28) indicate that: (i) The majority of averaging window emissions remains below the Euro 3-5 emission
limits although NOX emissions vary over a large value range. (ii) A few averaging windows substantially exceed the Euro 3-5 emission limits. These
windows often include the cold-start, which is characterized by a low catalyst temperature and thus conversion efficiency.
(iii) The high emissions of Vehicle H on Route 3 present an exception among gasoline vehicles and warrant further and more detailed analyses.
In particular the results for gasoline vehicles indicate substantially elevated emissions during
cold start. The next section addresses therefore cold-start emission in greater detail.
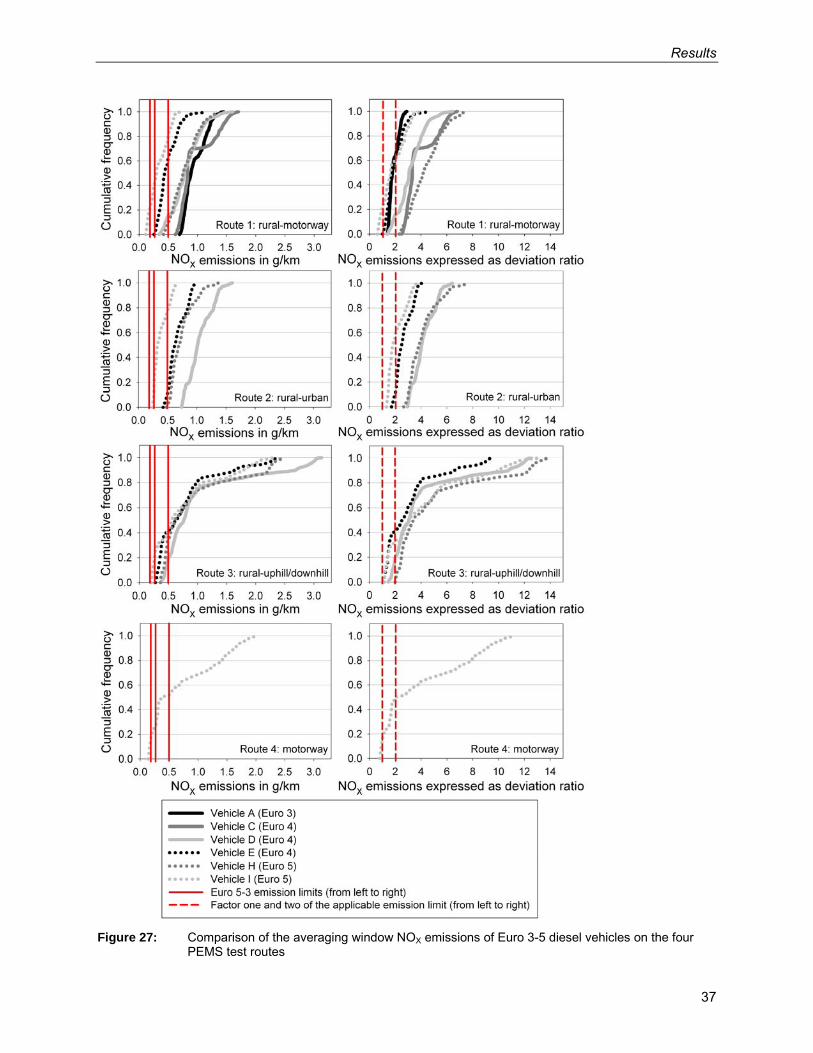
Results
37
Figure 27: Comparison of the averaging window NOX emissions of Euro 3-5 diesel vehicles on the four
PEMS test routes

Section 4
38
Figure 28: Comparison of the averaging window NOX emissions of Euro 3-5 gasoline vehicles on the four
PEMS test routes

Results
39
4.3 Cold start emissions Low catalyst temperatures typically limit the effectiveness of the catalytic conversions during cold start. Cold start emissions are of particular interest because these generally occur in urban areas and might substantially exceed average on-road emissions levels. The analysis of cold-start emissions focuses on the first 300 seconds of each PEMS emissions test. The various test routes were not differentiated because driving conditions are relative similar during this initial time period for all test routes. Cold-start emissions are presented in the following for each light-duty vehicle individually as averages over all four test routes (Figures 29 and 30).
A (d
iese
l)*-0
B (g
asol
ine)
-6
C (d
iese
l)*-0
D (d
iese
l)-9
E (d
iese
l)-10
F (g
asol
ine)
-7
G (g
asol
ine)
-4
H (d
iese
l)-8
I (di
esel
)-12
J (g
asol
ine)
-15
K (g
asol
ine)
-2
L (g
asol
ine)
-14
Col
d-st
art e
mis
sion
s in
g/k
m
0
2
4
6
8
10
12
-250-225
-175-150-125
-75-50-25
255075
125150
-200
-100
0
100
Euro 3 Euro 4 Euro 5
Initi
al id
ling
perio
d in
s
NOX emissionsCO emissionsTHC emissionsAverage duration of initial idling period
Figure 29: Average cold-start emissions and initial idling periods of light-duty vehicles; numbers below the
x-axis indicate the amount of individual PEMS tests included in this analysis; uncertainty intervals indicate the maximum cold-start emissions identified for each respective vehicle; * Vehicles A and C (see Table 3) are excluded because the driving distance during the cold-start period could not be retrieved from the GPS system
A (d
iese
l)*-0
B (g
asol
ine)
-6
C (d
iese
l)*-0
D (d
iese
l)-9
E (d
iese
l)-10
F (g
asol
ine)
-7
G (g
asol
ine)
-4
H (d
iese
l)-8
I (di
esel
)-12
J (g
asol
ine)
-15
K (g
asol
ine)
-2
L (g
asol
ine)
-14
Col
d-st
art e
mis
sion
s ex
pres
sed
as
devi
atio
n ra
tio
1
3
5
7
9
11
13
0
2
4
6
8
10
12
14
-250-225
-175-150-125
-75-50-25
255075
125150
-200
-100
0
100
Euro 3 Euro 4 Euro 5
Initi
al id
ling
perio
d in
s
NOX emissionsCO emissionsTHC emissionsAverage duration of initial idling period
Figure 30: Average cold-start emissions expressed as deviation ratio and initial idling periods of light-duty
vehicles; numbers below the x-axis indicate the amount of individual PEMS tests included in this analysis; uncertainty intervals indicate the maximum cold-start emissions identified for each respective vehicle; * Vehicles A and C (see Table 3) are excluded because the driving distance during the cold-start period could not be retrieved from the GPS system

Section 4
40
The results presented in Figures 29 and 30 can be summarized as follows: (i) The data do not indicate a trend towards lower cold-start emissions from Euro 3 to
Euro 5 diesel and gasoline vehicles. (ii) Cold-start emissions of both diesel and gasoline vehicles generally exceed Euro 3-5
emission limits. Cold-start NOX emissions are always higher than the Euro 3-5 limits; CO emissions often exceed the emission limits; THC emissions are both below and above the Euro 3-5 limits.
(iii) Cold-start emissions are slightly higher than the average on-road emissions in the case of NOX but substantially exceed the average on-road emissions in the case of CO and THC.
(iv) Cold-start emissions of individual vehicles span over a relative large value range. This suggests that environmental conditions (e.g., lower or higher ambient temperatures) in combination with changing driving pattern (e.g., longer or shorter idling periods) might substantially affect the results. In particular the duration of initial idling periods might have a substantial effect on the distance-specific cold-start emissions. More detailed analysis is warranted to quantify the magnitude of this effect on the results presented in Figures 29 and 30.
More detailed insights into cold-start emission pattern can be obtained by plotting both
emissions and tailpipe temperature as function of time (Figures 31 and 32). The examples of diesel Vehicle H and gasoline Vehicle L indicate that pollutant concentrations in the exhaust are often particularly high directly after the start of the engine. At this point, exhaust and catalyst temperatures are particularly low, causing a low efficiency in the oxidation of CO and THC. The NOX concentrations in the exhaust of diesel Vehicle H show large fluctuations but no obvious temperature dependency in the cold start phase. This finding results from the absence of catalytic NOX oxidation in the emissions treatment system. By contrast, NOX concentrations in the exhaust of gasoline Vehicle L decline directly after engine start. This finding points again to the temperature-dependent efficiency of three-way catalysts in gasoline vehicles.

Results
41
Route 1: Ispra-Milan-Ispra:
Time in s0 500 1000 1500 2000
Tem
pera
ture
in d
egre
es C
0
50
100
150
200
250
300
350
0
200
400
600
800
1000
1200
TemperatureNOx concentration
Time in s0 500 1000 1500 2000
0
200
400
600
800
1000TemperatureTHC concentration
Time in s0 500 1000 1500 2000
Con
cent
ratio
n in
ppm
0
2000
4000
10000
12000
14000TemperatureCO concentration
Route 2: Ispra-Varese-Ispra:
Time in s0 500 1000 1500 2000
Tem
pera
ture
in d
egre
es C
0
20
40
60
80
100
120
140
0
200
400
600
800
1000
1200
TemperatureNOx concentration
Time in s0 500 1000 1500 2000
0
50
100
150
200
250
TemperatureTHC concentration
Time in s0 500 1000 1500 2000
Con
cent
ratio
n in
ppm
0
2000
4000
6000
8000
10000TemperatureCO concentration
Route 3: Ispra-Sacro Monte-Ispra:
Time in s0 500 1000 1500 2000
Tem
pera
ture
in d
egre
es C
020406080
100120140160180
0
200
400
600
800
1000
1200
TemperatureNOx concentration
Time in s0 500 1000 1500 2000
0
50
100
150
200
TemperatureTHC concentration
Time in s0 500 1000 1500 2000
Con
cent
ratio
n in
ppm
0
2000
4000
6000
8000
10000TemperatureCO concentration
Figure 31: Cold start exhaust pollutant concentrations of Euro 5 diesel Vehicle H

Section 4
42
Route 1: Ispra-Milan-Ispra:
Time in s0 500 1000 1500 2000
Tem
pera
ture
in d
egre
es C
0
50
100
150
200
250
300
350
0
500
1000
1500
2000
2500
TemperatureNOx concentration
Time in s0 500 1000 1500 2000
0
200
400
600
800
1000
1200TemperatureTHC concentration
Time in s0 500 1000 1500 2000
Con
cent
ratio
n in
ppm
0
10000
20000
30000
40000
50000TemperatureCO concentration
Route 2: Ispra-Varese-Ispra:
Time in s0 500 1000 1500 2000
Tem
pera
ture
in d
egre
es C
0
50
100
150
200
250
0
200
400
600
800
1000
1200
TemperatureNOx concentration
Time in s0 500 1000 1500 2000
0
200
400
600
800
1000
1200TemperatureTHC concentration
Time in s0 500 1000 1500 2000
Con
cent
ratio
n in
ppm
0
10000
20000
30000
40000
50000TemperatureCO concentration
Route 2: Ispra-Sacro Monte-Ispra:
Time in s0 500 1000 1500 2000
Tem
pera
ture
in d
egre
es C
406080
100120140160180200220240260
0
500
1000
1500
2000
2500
TemperatureNOx concentration
Time in s0 500 1000 1500 2000
0
200
400
600
800
1000
1200TemperatureTHC concentration
Time in s0 500 1000 1500 2000
Con
cent
ratio
n in
ppm
0
10000
20000
30000
40000
50000TemperatureCO concentration
Route 4: High speed driving:
Time in s0 500 1000 1500 2000
Tem
pera
ture
in d
egre
es C
0
50
100
150
200
250
300
350
0
200
400
600
800
1000
1200
TemperatureNOx concentration
Time in s0 500 1000 1500 2000
0
200
400
600
800
1000
1200TemperatureTHC concentration
Time in s0 500 1000 1500 2000
Con
cent
ratio
n in
ppm
0
10000
20000
30000TemperatureCO concentration
Figure 32: Cold start exhaust pollutant concentrations of Euro 5 gasoline Vehicle L

Discussion
43
5 Discussion
5.1 Data analysis and results The on-road PEMS measurements indicate that in particular on-road NOX emissions of light-duty diesel vehicles substantially exceed the Euro 3-5 emission limits, whereas on-road CO and THC emissions generally remain below the Euro 3-5 emission limits. These findings can be regarded as reliable and robust. Interpreting the deviation ratios of averaging window emissions, however, deserves special attention because this parameter differs from the so-called conformity factor that is used to characterize emissions of heavy duty vehicles (EC, 2010). First we reiterate the methodology for calculating both deviation ratios and conformity factors. Afterward, a comparison of deviation ratios and conformity factors calculated as a sample case for the averaging window emissions of one selected light-duty vehicle is presented.
Section 3.4.2 describes in detail the methodology for calculating deviation ratios. Conformity factors are calculated based on a similar method, with the exception that now engine work is used as reference quantity instead of travel distance as it is the case for deviation ratios (see Section 3.4.2). This approach is chosen to assure consistency with both the method used to define the duration of averaging windows and the definition of emission limits for heavy-duty vehicles (Bonnel and Kubelt, 2010; EC, 2009b, 2010).
To analyze the differences between the two parameters, also conformity factors for one light duty vehicle were calculated as a sample case. For this calculation, we approximate engine work by the CO2 mass emitted. Per definition, the cumulative CO2 mass emitted during one averaging window equals the cumulative CO2 mass emitted during a standard NEDC test. Therefore, the conformity factor simplifies in this sensitivity analysis to the quotient of measured averaging window emissions and the respective Euro 5 emission limit (see also Equations 3-5 in Section 3.4.2):
L
NEDCCO
L
COCO
C
I
mm
mm
tmtmm
CFCF
CF =−
==
;
12
2
22)()(
,if (Equation 7)
NEDCCOCOCO mtmtm ;12 222)()( =− (Equation 8)
where: CF = conformity factor
CFI = in-use conformity factor CFC = certification conformity factor m = mass of emissions; indices having the same meaning as in
Equations 3-5
Based on this calculation, it is now possible to understand the difference between deviation ratio and conformity factor: In the case of the deviation ration, the distance driven by a vehicle on the road most likely differs from the distance of the NEDC cycle, even if the CO2 masses on-road and during NEDC testing are identical. For example, if a vehicle is driven on the challenging uphill/downhill Route 3, it might consume more fuel, thus emit more CO2 than under NEDC condition,

Section 5
44
and thus travelling a shorter distance until it has emitted a CO2 mass equivalent to the one emitted during NEDC testing. In such a case, the deviation ratio increases by the fraction of window distance to NEDC distance. Consequently, it is precisely this fraction between window distance and NEDC distance that represents the difference between deviation ratio and conformity factor. Since the measured on-road fuel consumption and the associated CO2 emissions exceed the CO2 emissions during NEDC testing by on average 21 ± 9% (see Section 4.1) it can be expected that the deviation ratio generally exceeds the conformity factor. Figure 33 indicates that this is indeed the case in our sample analysis for Vehicle L.
Figure 33: Cumulative frequency distribution of averaging window NOX emissions of Vehicle L expressed
as deviation ratio and conformity factor
By focusing in detail on Route 1, the data furthermore indicate that both deviation ratio and conformity factor of averaging window NOX emissions show a positively skewed distribution (Figure 34). The peak of the frequency distribution of deviation ratios is located at 0.37, whereas the peak of the distribution of conformity factors is located at 0.28. A similar pattern can also be expected for other vehicles and pollutant emissions. This finding indicates that the majority of emissions are slightly lower than the average, while for a minority averaging windows, emissions are substantially elevated.
The distinct properties of deviation ratio and conformity factor suggest that both parameters should serve slightly different purposes:
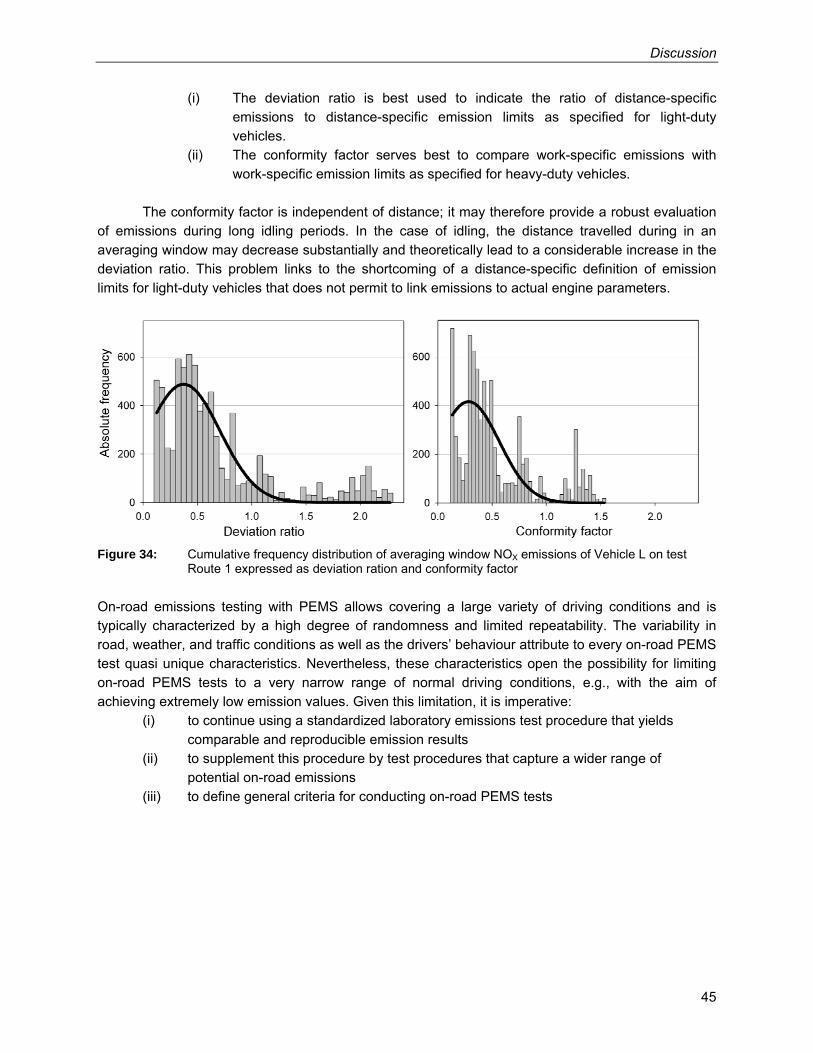
Discussion
45
(i) The deviation ratio is best used to indicate the ratio of distance-specific emissions to distance-specific emission limits as specified for light-duty vehicles.
(ii) The conformity factor serves best to compare work-specific emissions with work-specific emission limits as specified for heavy-duty vehicles.
The conformity factor is independent of distance; it may therefore provide a robust evaluation
of emissions during long idling periods. In the case of idling, the distance travelled during in an averaging window may decrease substantially and theoretically lead to a considerable increase in the deviation ratio. This problem links to the shortcoming of a distance-specific definition of emission limits for light-duty vehicles that does not permit to link emissions to actual engine parameters.
Figure 34: Cumulative frequency distribution of averaging window NOX emissions of Vehicle L on test
Route 1 expressed as deviation ration and conformity factor On-road emissions testing with PEMS allows covering a large variety of driving conditions and is typically characterized by a high degree of randomness and limited repeatability. The variability in road, weather, and traffic conditions as well as the drivers’ behaviour attribute to every on-road PEMS test quasi unique characteristics. Nevertheless, these characteristics open the possibility for limiting on-road PEMS tests to a very narrow range of normal driving conditions, e.g., with the aim of achieving extremely low emission values. Given this limitation, it is imperative: (i) to continue using a standardized laboratory emissions test procedure that yields comparable and reproducible emission results (ii) to supplement this procedure by test procedures that capture a wider range of potential on-road emissions (iii) to define general criteria for conducting on-road PEMS tests

Section 5
46
5.2 Potentials of PEMS-based emission test procedures The present test campaign revealed the strengths and weaknesses of PEMS. In view of developing supplementary emission test procedures for light-duty vehicles, these can be summarized as follows:
Strengths: (i) PEMS measures real emissions from actual on-road driving. (ii) PEMS can assure the proper design and operation of emission control technologies as
well as the vehicle’s energy consumption under a wide variety of normal operating conditions.
(iii) PEMS is suitable to test emissions from novel engine/after-treatment/powertrain technologies (e.g., parallel/serial (plug-in) hybrids or electric vehicles) as well as from alternative fuels.
(iv) PEMS provides measurements that can serve as basis for not-to-exceed emission limits, i.e., emission levels that should not be exceeded, regardless of driving and ambient conditions.
Weaknesses: (i) PEMS generally allow only to a very limited extent to reproduce and compare
individual test results due to the variability of on-road ambient and driving conditions. (ii) PEMS allow only to a limited extent to reproduce cold start emissions. (iii) The power consumption of PEMS is typically supplied by auxiliary batteries in order
not to interfere with the vehicle operation. However, the weight of batteries and analytical equipment of approximately 80 kg may introduce a bias in emission measurements, especially if conducted for small vehicles equipped with small engines. Potentials for weight reductions of the equipment exist as technological improvements of the test equipment are very likely (both in terms modularity and size).
Several practical considerations might support or limit the application of PEMS: (i) PEMS allows for relatively long test campaigns of 2 hours duration. (ii) PEMS test procedures and equipment has been developed for testing the in-service
conformity of heavy-duty vehicles and non-road machinery and has been proven to be reliable also for light-duty vehicles.
(iii) The modular composition of PEMS allows for limiting the emissions screening to an absolute minimum. For instance, the THC measurements with an FID analyser (which has high power consumption and requires a hydrogen/helium mixture) could be abolished because the correct functioning of oxidation and three-way catalysts can also be verified by analysing CO emissions only. Such an approach would reduce the weigh of the PEMS equipment substantially.
(iv) PEMS testing requires no detailed prescription of driving and ambient conditions; a prescription of key-features of test routes (e.g., percentage of driving in city, motorway, test duration, road slope, drivers’ behaviour) is, nevertheless, recommended to assure that PEMS testing covers as far as possible the large spectrum of driving conditions as it occurs during normal conditions of vehicle use.

Conclusions
47
6 Conclusions This report analyzes the on-road emissions of twelve light-duty diesel and gasoline vehicles by using Portable Emission Measurement Systems (PEMS). The analyses were conducted for Euro 3-5 light-duty vehicles in the period between 2007 and 2010 on four test routes comprising rural, urban, uphill/downhill, and motorway driving.
The average NOX emissions of all tested diesel vehicles over the entire test routes amount to 0.93 ± 0.39 g/km; the average NOX emissions of the tested Euro 5 diesel vehicles reach 0.62 ± 0.19 g/km. These results indicate that NOX emissions of light-duty diesel vehicles substantially exceed the Euro 3-5 emission limits: by a factor of 4-7 as averages over entire test routes and up to a factor of 14 for individual averaging windows. The increasing stringency of European emission limits has, thus, not resulted in an equivalent reduction of on-road NOX emissions of light-duty diesel vehicles. By comparison, on-road NOX emissions of gasoline vehicles as well as CO and THC emissions of diesel and gasoline vehicles generally stay within Euro 3-5 emission limits. The share of NO2 in the total NOX emissions reaches 60% for diesel vehicles but only 0-30% for gasoline vehicles. The tested light-duty diesel and gasoline vehicles emit on average 189 ± 51 g CO2/km (grams of carbon dioxide per kilometre) and 162 ± 29 g CO2/km, respectively during on-road testing, thereby exceeding the CO2 levels as specified during NEDC testing of the respective vehicles by on average 21 ± 9%. The magnitude of all pollutant emissions varies depending on vehicle, operation mode, route characteristics, and ambient conditions. Cold-start emissions of both diesel and gasoline vehicles span over a large value range; NOX emissions exceed Euro 3-5 emission limits by a factor 2-14, CO emissions often exceed the Euro 3-5 limits, and THC emissions are both below and above the limits.
In conclusion, the PEMS results indicate that on-road NOX emissions of light-duty diesel vehicles differ substantially between laboratory NEDC testing and actual on-road driving. While the standardized laboratory NEDC emissions testing yields comparable and reproducible results, the procedure may fail to capture the potential range of on-road emissions. To solve this shortcoming, Regulation 715/2007 (EC, 2007a) envisages supplementing the standard laboratory emissions testing with suitable complementary test procedures. Such complementary procedures may then also address particularly polluting driving modes, which cannot be simulated in the laboratory such as (i) extreme high speed driving as it frequently occurs on the German Autobahn and (ii) vehicle operations associated with relatively low or high temperatures of the aftertreatment systems. Without covering such a wide range of normal operating conditions, a reduction of on-road emissions, and specifically NOX emissions, may remain punctual.
The PEMS equipment is able to provide reliable and accurate on-road emission measurements for light-duty vehicles, even for vehicles that will be certified according to future emissions standards. This makes PEMS a suitable tool for identifying and updating emission factors of air pollution models. Furthermore, PEMS may be used as supplemental emission test procedure next to standardized laboratory emission tests. The strengths of PEMS include the ability to detect the proper operation of emission control technologies under a wide variety of normal operating conditions, in particular during high-speed driving at speeds above130 km/h as it frequently occurs on the German Autobahn. PEMS also allows testing emissions from novel fuel/engine/after-treatment/powertrain technologies (e.g., parallel/serial (plug-in) hybrid vehicles. Such analyses have not been conducted yet but are envisaged for the future. A major limitation of PEMS refers to its relatively high weight (PEMS unit, EFM, mounting devices, power supply), which may reach 80 kg

Section 6
48
(i.e., equal to 1 person). As technological improvements of the test equipment are very likely (in terms modularity and size) the weight of the equipment could be reduced substantially in the future. In conclusion, the present test campaign has resulted in the successful application of PEMS for light-duty vehicles. The results of this test campaign indicate that on-road emissions might exceed substantially emission levels as identified during type approval in the laboratory.
The applied averaging window method, which has been implemented to check emissions of heavy-duty engines (EC, 2010), offers a simple and straightforward way to average and analyze emissions data of light-duty vehicles. Based on this method, appropriate indicators could be developed to evaluate whether an averaging window (or any other data sub-set) can be classified as extreme (as opposed to normal) driving conditions. Such analysis could address specific driving situations, for instance cold start, steep road grades, or aggressive high-speed driving.
Future research should address not-to-exceed regulatory concepts and alternative metrics for defining emission limits: the current approach that expresses emission limits as distance-specific quantities is problematic because it lacks a reference to actual engine parameters and only insufficiently accounts for the large variability of on-road driving conditions that may include long idling periods in congested traffic.

References
49
7 References André, M. (1996): Driving cycles development: Characterization of the methods. SAE Technical paper
SAE 961112. André, M., Pronello, C. (1997): Relative influence of acceleration and speed on emissions under
actual driving conditions. International Journal of Engine Design 18, pp. 340-353. Bonnel, P., Kubelt, J. (2010): Heavy-duty engines conformity testing based on PEMS - Lessons
learned from the European pilot program. EUR Draft report. EC-JRC. Ispra, Italy. EC (1998): Directive 98/69/EC of the European Parliament and of the Council of 13 October 1998
relating to measures to be taken against air pollution by emissions from motor vehicles and amending Council Directive 70/220/EEC. Official Journal L 350, pp. 1-57.
EC (2001): Directive 2001/100/EC of the European Parliament and of the Council of 7 December 2001 amending Council Directive 70/220/EEC on the approximation of the laws of the Member States on measures to be taken against air pollution by emissions from motor vehicles. Official Journal L 16, pp. 32-34.
EC (2007a): Regulation (EC) No. 715/2007 of the European Parliament and of the Council of 20 June 2007on type approval of motor vehicles with respect to emissions from light passenger and commercial vehicles (Euro 5 and Euro 6) and on access to vehicle repair and maintenance information. EC – European Commission. Official Journal of the European Union L 171, pp. 1-16.
EC (2007b): Commission Directive 2007/37/EC of 21 June 2007 amending Annexes I and III to Council Directive 70/156/EEC on the approximation of the laws of the Member States relating to the type approval of motor vehicles and their trailers. Official Journal of the European Union L161/60. EC – European Commission.
EC (2007c): Administrative arrangement No. 070501/2005/413194/MAR/C1 on mobile measurement of pollutant emissions and fuel consumption of road vehicles in real-world driving situations using Portable Emission Measurement Systems (PEMS); JRC REF N° 28555-2005-08 A1CO ISP.
EC (2008): Commission Regulation (EC) No. 692/2008 of 18 July 2008 implementing and amending Regulation (EC) No 715/2007 of the European Parliament and of the Council on type-approval of motor vehicles with respect to emissions from light passenger and commercial vehicles (Euro 5 and Euro 6) and on access to vehicle repair and maintenance information. EC – European Commission. Official Journal of the European Union L 199, pp. 1-135.
EC (2009a): Regulation (EC) No. 443/2009 of the European Parliament and of the Council of 23 April 2009 setting emission performance standards for new passenger cars as part of the Community’s integrated approach to reduce CO2 emissions from light-duty vehicles. EC – European Commission. Official Journal of the European Union L 140, pp. 1-15.
EC (2009b): Regulation (EC) No. 595/2009 of the European Parliament and of the Council of 18 June 2009 on type-approval of motor vehicles and engines with respect to emissions from heavy duty vehicles (Euro VI) and on access to vehicle repair and maintenance information and amending Regulation (EC) No 715/2007 and Directive 2007/46/EC and repealing Directives 80/1269/EEC, 2005/55/EC and 2005/78/EC. Official Journal of the European Union L 1888, pp. 1-13.

Section 7
50
EC (2009c): Administrative arrangement No. SI2.552273 between the Enterprise and Industry Directorate-Gneral and the Joint Research Centre regarding “Scientific/technical support to the preparation and implementation of light-duty vehicle emission legislation”. JRC Ref. No. 31603-2009-12 NFP ISP.
EC (2010): Draft of Commission Regulation on implementing and amending Regulation (EC) No 595/2009 of the European Parliament and of the Council on type-approval of motor vehicles and engines with respect to emissions from heavy duty vehicles (Euro VI) and on access to vehicle repair and maintenance information. Forthcoming.
EEA (2009): Exceedance of air quality limit values in urban areas (CSI 004) - Assessment published Dec 2009. EEA – European Environmental Agency. Source: http://www.eea.europa.eu/data-and-maps/indicators/exceedance-of-air-quality-limit-1/exceedance-of-air-quality-limit-1. Accessed: 11 October 2010.
EEA (2010): European Union emission inventory report 1990–2008 under the UNECE convention on Long-range Transboundary Air Pollution (LRTAP). EEA Technical report No 7/2010. EEA – European Environmental Agency. Copenhagen, Denmark.
EPA (2008): Determination of PEMS measurement allowances for gaseous emissions regulated under the heavy-duty diesel engine in-use testing program. Revised Final Report. EPA420-R-08-005. EPA – United States Environmental Protection Agency. Arlington, USA.
EUR (2006a): European project on portable emissions measurement systems: "EU-PEMS" project: Status and Activity Report 2004-2005, January 2006, EUR Report EUR 22143 EN.
EUR (2006b): European project on portable emissions measurement systems: "EU-PEMS" project: Task 3 Report: Evaluation of pass-fail methods, Draft EUR Report.
EUR (2006c): European project on portable emissions measurement systems: "EU-PEMS" project – Guide for the preparation and the execution on heavy-duty vehicles, version 2, EUR Report EUR 22280 EN.
Hausberger S., Blassnegger J. (2006): Sackgasse oder Zukunft? Das motorische Potenzial beim Diesel. AK Veranstaltung “Welche Zukunft hat der Diesel”. Vienna, Austria.
Kageson P. (1998): Cycle-beating and the EU test cycle for cars. European Federation for Transport and Environment. Brussels, Belgium.
Kubelt, J., Bonnel, P. (2007): Portable emission measurements (PEMS) - Data evaluation and post-processing manual for the data evaluation software EMROAD - Version 4.00. EUR Draft report. EC-JRC. Ispra, Italy.
Pander, J. (2007): Fehlentwicklung Auto. Spiegel Online. Source: www.spiegel.de/auto/aktuell/ 0,1518,485013,00.html. Accessed: 15 December 2010.
Pelkmans, L., Debal, P. (2006): Comparison of on-road emissions with emissions measured on chassis dynamometer test cycles. Transportation Research Part D 11, pp. 233-241.
Rubino, L., Bonnel, P., Hummel, R., Krasenbrink, A., Manfredi, U (2007a): Mobile measurement of pollutant emissions and fuel consumption of road vehicles in real-world driving situations using portable emission measurement systems (PEMS). Administrative Arrangement # N° 070501/2005/413194/MAR/C1. JRC REF N° 28555-2005-08 A1CO ISP. European Commission – Joint Research Centre. Ispra, Italy.
Rubino, L., Bonnel, P., Hummel, R., Krasenbrink, A., Manfredi, U., de Santi, G. (2007b): On-road emissions and fuel economy of light duty vehicles using PEMS: chase-testing experiment. SAE International Journal of Fuels and Lubricants 1, pp. 1454-1468.

References
51
Tzirakis, E., Pitsas, K., Zannikos, F., Stournas, S. (2006): Vehicle emissions and driving cycles: Comparision of the Athens driving cycle (ADC) with ECE-15 and European driving cycle (EDC). Global NEST Journal 8, pp. 282-290.
Vojtisek-Lom, M., Fenkl, M., Dufek, M., Mareš, J. (2009): Off-cycle, real-world emissions of modern light duty diesel vehicles. SAE 2009-24-0148.

52
European Commission EUR 24697 EN – Joint Research Centre – Institute for Environment and Sustainability Title: Analyzing on-road emissions of light-duty vehicles with Portable Emission Measurement Systems (PEMS) Author(s): Martin Weiss, Pierre Bonnel, Rudolf Hummel, Urbano Manfredi, Rinaldo Colombo, Gaston Lanappe, Philippe Le Lijour, Mirco Sculati Luxembourg: Publications Office of the European Union 2011 – 55 pp. – 21 x 29.7 cm EUR – Scientific and Technical Research series – ISSN 1018-5593 ISBN 978-92-79-19072-8 doi:10.2788/23820 Acknowledgements The authors are grateful to Lauretta Rubino, Juliana Stropp, Julien Gaffuri, and Alessio Provenza for their scientific contributions and comments. Sensors Inc. is acknowledged for their technical support of the PEMS emission measurements. The authors thank DG Enterprise and Industry and DG Environment for commenting earlier drafts of this report.

53
How to obtain EU publications Our priced publications are available from EU Bookshop (http://bookshop.europa.eu), where you can place an order with the sales agent of your choice. The Publications Office has a worldwide network of sales agents. You can obtain their contact details by sending a fax to (352) 29 29-42758.

54
The mission of the JRC is to provide customer-driven scientific and technical support for the conception, development, implementation and monitoring of EU policies. As a service of the European Commission, the JRC functions as a reference centre of science and technology for the Union. Close to the policy-making process, it serves the common interest of the Member States, while being independent of special interests, whether private or national.
LN
-BA
-24697-EN-C