analytical tool adoption level: a case study based on … yang... · analytical tool adoption...
TRANSCRIPT

Analytical tool adoption level: A case study based on an evidential reasoning approach.
Igor Barahona Torres* Research Fellow. Cátedras CONACYT. Av. Insurgentes Sur 1582, Crédito Constructor. Delegación Benito Juárez México City, México. 03940. Tel: +52 55 5322-7700. Email: [email protected] * Corresponding author Alex Riba Statistical Services Centre, University of Reading, Harry Pitt Building, Whiteknights Road, Reading RG6 6FN, UK. Tel: +44 (0)118 378 7936 E-mail: [email protected]
Jian-Bo Yang Decision and Cognitive Sciences Research Centre, Alliance Manchester Business School, The University of Manchester, Manchester M15 6PB, UK. Tel: +44 (0)161 306 3427 (Ext: 63427) E-mail: [email protected]
Abstract: Adoption of Analytical Tools (AAT) represents a conjunction of data analysis, information technology and quantitative models used to predict trends and behaviours, reduce risks and make more robust decisions. This study proposes a hierarchical framework to investigate how analytical tools are adopted in companies. The framework consists of four constructs: management supported by data analysis, data-based competitive advantages, systems thinking and communication with outside actors. Data was collected from a range of companies in different sectors, with information received from 255 decision makers on the analytical practices in their companies. The collected data was then processed and analysed through the use of an evidential reasoning algorithm. The results were discussed regarding the adoption of analytical tools such as overall performance and distributed assessments. Sensitivity analysis was conducted. Finally guidelines were offered for stakeholders interested in expanding analytical capabilities in their organizations.
Keywords: Business Analytics; Evidential Reasoning; Decision Analysis; Analytical Tools; Measuring Analytical Performance.

Biographical notes: Igor Barahona is a graduate of the Tecnologico de Monterrey Business Administration program. He earned his Master’s Degree in Quality Systems from the same university, and a Doctoral Degree in Statistics and Operations Research from the Technical University of Catalonia. He was a visiting researcher at the Manchester Business School and has been a guest lecturer of various courses, all related to the application of statistical methods in business administration, in different universities in México. He is currently research fellow of the Cátedras CONACYT program.
Alex Riba joined the Statistical Services Centre in July 2014. He is an engineer with more than 20 years of experience teaching statistics and conducting research at the Universitat Politecnica de Catalunya, Barcelona Tech. He has worked as a statistician on projects in a wide range of fields: engineering, business, medicine, epidemiology, forest fires, commerce, manufacturing, quality control, sports and linguistics. He is particularly interested in processes that let data be self evident: design of data collection plans, analyzing and communicating results in a meaningful way to non-statisticians. Since joining the SSC he has been involved in survey sampling projects requiring digital data collection, the design of analysis plans and in assessing and improving eLearning courses. Professor Yang has been conducting research, over the last 30 years, in the areas of multiple criteria decision analysis using both quantitative and qualitative information with uncertainties, hybrid decision methodologies using techniques from both operational research and artificial intelligence, multiple objective optimisation, linear and non-linear programming, intelligent decision support systems, and dynamic system modelling, simulation and control of engineering and management systems. The current application areas cover design decision-making, quality management, risk and safety assessment, supply chain management and environmental management. Professor Yang was given the Science and Technology Award for Young Scientists and Engineers by the China Association for Science and Technology in 1988, and Research Fellowships by British Council and the Alexander von Humboldt Foundation of Germany in the early 1990s. He is a fellow of the UK Operational Research Society

1
1. Introduction
Business applications such as enterprise resources planning (ERP) and point of sale (POS), among others, generate more data today than during any other period in history. This is now the age of big data. According to Lynch (2008), this has revolutionized how contemporary stakeholders make decisions. Similarly, Davenport & Harris (2007) and Davenport (2014) affirmed that most modern industries offer similar products and use comparable technology. As such, in contrast to 20 years ago, today high-performance business processes are among the last remaining points of differentiation. Many typical sources for a competitive advantage through differentiation are no longer available. Patented technologies are now rapidly imitated and breakthrough innovations for products or services have shorter life cycles. The current trend is for increased application of the Internet, analytical tools and computers to different corporate areas such as human resources, marketing, operations, manufacturing and finance. Merigó & Gil-Lafuente (2010), Rousseau (2006), Barahona, Cavazos & Yang (2014), and Marco‐Almagro & Tort-Martorell (2012) provided convincing evidence that decisions based on data analysis are more likely to be correct than those based on intuition alone.
For the purposes of this research, an analytical tool is a mathematical, statistical or quantitative method that, in combination with information technology, can be applied to extract relevant information from data and makes more robust decisions based on quantitative evidence. Similarly, the aim of analytical tools in business management is to assist stakeholders in making better-informed decisions, optimization of limited resources and to increase efficiency. Although most contemporary companies use various analytical tools and have implemented different types of business intelligence applications, each company might adopt analytical tools according to its size, economic activity or requirements.
The general objective for this paper is to provide a framework, which considers contributions in two ways. Whereas the first implies the use of an evidential reasoning algorithm to investigate the key drivers that expand the use of analytical tools, the second consists of a novel application of this algorithm in the field of business analytics. Three specific objectives were also settled.
• Operationalize theoretical concepts in the current literature to measure analytical tool adoption level in an organization.
• Apply an evidential reasoning algorithm to extract relevant conclusions from attributes that most contribute to an increase in analytical tool adoption level in an organization.
• Provide guidelines to anyone interested in expanding the use of analytical tools.
The next section provides a conceptual framework for the adoption of analytical tools, and also explains a set of key drivers that cause an expansion of their use. Section three presents a broad description of the evidential reasoning approach, followed by a case study. In section four, guidelines are provided to anyone interested in expanding the use of analytical tools. Due to limitations of space the guidelines are not explained in detail, but they are enriched with resources from the literature. Finally, a discussion and future research directions are presented in the concluding section.

2
2. Measuring analytical tool adoption level
There are several scales used to measure an organization’s analytical capabilities. Davenport & Harris (2007) introduced a five-level scale in which the lowest level refers to organizations with no analytical skills, which are also called analytically ignorant. In contrast, the highest level of the scale relates to organizations where the use of analytical tools represents a competitive advantage. Powell & Dent-Micallef (1997) investigated the impact of information technology systems on company performance through the introduction of a five-level scale. Tallon, Kraemer & Gurbaxani (2000) investigated a seven-level scale to measure the impact of business intelligence applications on the overall performance of a company. Gardner (2004) introduced a five-level scale to measure the maturity level of an organization’s processes. The lowest level of this scale refers to processes that are unpredictable and uncontrollable, while the highest level is related to optimized processes. It is beyond the objectives of this research to discuss these reviewed scales in detail. Instead, in the following paragraphs, we focus on digging deeper into our review of the literature.
In addition to the previously mentioned scales, the concepts proposed by Davenport, Harris & Morrison (2010), Deming (2000), Hoerl & Snee (2012), Wang & Strong (1996), Sila & Ebrahimpour (2003), Checkland (1999), Perry-Smith & Shalley (2003), Locke et al. (1990), and Burby & Atchison (2007) were also investigated as they relate to expanding the use of analytical tools. For instance, these authors highlighted the importance of senior management support in order to increase the use of analytical tools. Similarly, the concept of systems thinking is critical for expanding data analysis, and therefore should also be considered. Our review of the literature identified four key concepts that are considered to have a strong influence on expanding the use of analytical tools. The first is related to the degree of support from senior management regarding the use of analytical tools, identified as MS-DA. The second is focused on the extent that analytical tools help to create competitive advantages, identified as DB-CA. The third is related to the degree of systems thinking among all staff, marked as SYS. The last one refers to the extent that communication is efficient and fluent with actors outside the company, marked as COM-OUT (see Figure 1).
Figure 1. Conceptual framework for analytical tool adoption level
Having identified our key drivers, our next task was to investigate how they relate. That is, the novel contribution of this research consists of linking these four concepts into a conceptual model in order to later operationalize them. An additional contribution of this research, as an output of our operationalization process, is a diagnostic tool that is available to anyone interested in measuring the use of analytical tools in organizations (see Appendix B).
2.1. Management support of data analysis
There is plenty of research validating the importance of senior management support for achieving goals. Senior management support is a common factor in projects of different scope, activity, size or location. Hoerl & Snee (2012) stated that some common manifestations of management support include removing obstacles, allocating financial and technical resources, encouraging all staff involved in the project, and sharing a vision of success. Deming (2000) identified important signals of senior management support. These include ample access to technical, financial and human resources, assistance with solving problems and finding solutions, leadership by example and by

3
demonstrating a passion for making decisions based on analytical approaches, and encouraging the staff by pushing forward all the analytical initiatives.
2.2. Data-based competitive advantage
According to Davenport, Harris & Morrison (2010), a company must master the use of analytical tools if it expects to create competitive advantages based on data analysis. With this concern, it is clear that high quality data is mandatory for developing data-based competitive advantages. Accessibility, interpretability and accuracy are also critical features of high-quality data. Security and relevancy should also be included for a complete definition of high-quality data. According to Wang & Strong (1996) data must reflect some fundamental features in order to be considered of high quality. A complete definition of high-quality data would include 15 features, clustered as intrinsic, contextual, degree of accessibility and the capacity of being represented. The data must have these features if a company expects to use it to create competitive advantages.
2.3. Systems thinking
Checkland (1999) defined a system as any entity composed of interrelated parts that are able to cooperate in order to reach a common purpose. Four generic properties can be observed in any system: emergence, hierarchy, communication and control. A system is able to reach its goals by taking control of its components once a deviation is detected in any of the previously settled parameters. Senge & Sterman (1992) discussed some characteristics of successful “systems thinkers”. For example, they help others see “the big picture”, they focus less on day-to-day events and more on underlying trends and forces of chance, and they are able to conceive of a holistic approach for the organization and its environment. According to Senge & Sterman (1992) the core concept behind systems thinking is the capacity to “See interrelationships, not things; and Processes, Not Snapshots”. Sharing a vision of success and distinguishing static complexity from dynamic complexity are relevant contributions to the field of systems thinking and positively impact the adoption of analytical tools.
2.4. Communication with actors outside the company
Marco‐Almagro & Tort-Martorell (2012) affirmed that the creation of competitive advantages through the adoption of analytical tools requires efficient teamwork and constant communication with customers, shareholders, suppliers and members of a society. In order to share data, information and knowledge with external actors, the company should begin by reinforcing the channels of communication available. Turner et al. (2014) mentioned different alternatives that are available to contemporary companies in order to improve communication with customers and suppliers. In this respect, the emergence of wireless media devices, such as smart-phones, tablets and laptops has made it easier to share data and information. These devices have radically changed modern business environments and the way companies communicate with their stakeholders. It is clear that organizations should master the use of new information technologies, and thereby improve communication with outside actors through the analysis of data, especially if they expect to gain leadership in their industries.

4
3. Methodology
According to Xu & Yang (2003) several methods of Multi Criteria Decision Analysis (MCDA) have emerged over the last 30 years, such as the Multi Attribute Utility Theory (MAUT) and Multiple Attribute Value Theory (MAVT). A traditional MCDA problem is typically modelled using a decision matrix, where each alternative is assigned a single value rather than a range of possible values. In contrast with traditional methods, the evidential reasoning (ER) algorithm describes MCDA problems by using belief decision matrices. These features are explained in depth in the following paragraphs.
Yang & Singh (1994) stated that the ER approach is different from conventional MCDA methods in that it uses evidence-based reasoning to reach a decision. One of the most important contributions of the ER approach is its capacity to describe a scenario using a belief structure, in which each alternative is assessed by a vector of paired elements. The paired elements are the evaluation grades and their associated degree of belief. The belief matrix allows the generation of a more informed model, and decision makers are not forced to aggregate their decision information into a unique value. Xu & Yang (2003) affirmed that incorporating the Dempster-Shafer (Shafer, 1976) theory in the ER algorithm allows the distributive information contained in a belief decision matrix to be aggregated, in order to produce more rational and consistent results. Yang & Singh (1994) and Yang & Sen (1994) stated that the Dempster-Shafer theory is a suitable tool to cope with belief-decisions matrices because it is able to provide a powerful combination rule and reasonable requirements for applying the rule. Yang (2001) proposed rule and utility-based information techniques that allow for the transformation of various sets of evaluations into a unique set; and consequently both types of criteria, quantitative and qualitative, can be assessed in a consistent and reliable way. Yang & Xu (2002) discussed an important feature of ER, related with its non-linearity. Basically the ER approach uses a non-linear process for aggregating attributes. The nonlinearity is given by the weights of criteria and the way each attribute is assessed.
In summary, Yang & Singh (1994) affirmed that ER has proven to be a consistent and reliable MCDA method because it is able to deal with problems that cannot be solved through the use of traditional methods. For instance, consider the following situations:
• Large number of attributes in hierarchical order
• Large number of alternatives
• Uncertainties
• Mixture of quantitative and qualitative information
• Incomplete or missing information.
To illustrate how the ER algorithm works, consider the following situation. We are interested in evaluating analytical tool adoption level, with five degrees defined as below:
� = ���, ��, �, �, ���.
= { Worst, Poor, Average, Good, Excellent }.

5
K number of alternatives are defined, Oj (j=1,...,K) with M being the number of attributes and Ai
(j=1,...,M). If H=5 was previously defined, then the assessment of attribute A1 for alternative O1 is denoted by S(A1(O1)). The belief structure is expressed as follows:
��������� = ����,�, ���, ���,�, ���, ��,�, ��, ��,�, ��, ���,�, �����1� Where 1 ≥ βn,1 ≥ 0, (for n=1,...,5) denotes the degree of belief that attribute A1 is assessed at evaluation grade Hn . In addition, S(A1(O1)) shows that attribute A1 is assessed to grade Hn with a degree of belief βn,1×100% (n=1,...,5) for alternative O1.
It is inaccurate to have∑ ��,� � 1���� . Moreover, S(A1(O1)) is considered as a complete distributed
assessment if ∑ ��,� = 1���� or incomplete if ∑ ��,� � 1���� . According to Yang (2001) the ER approach is able to cope with both complete and incomplete assessments. The ER approach applies the above techniques (utility-based theory and Dempster-Shafer theory) to aggregate belief structures. In other words, instead of aggregating a single average value for each attribute, the ER approach allows us to aggregate belief structures, thereby producing more informative results. This feature was relevant when we analysed the 17 attributes for analytical tool adoption level, as is shown in the following paragraphs.
To illustrate how the ER approach aggregates belief structures, consider ωi as the relative weight of
attribute Ai which is normalized, so that 1 ≥ ωi ≥ 0 and ∑ ��� �� where L is the total number of attributes. If the first assessment is given by equation (1), then the second is yielded by the following expression.
��������� = ����,�, ���, ���,�, ���, ��,�, ��, ��,�, ��, ���,�, �����2� At this point the challenge is to aggregate the two assessments S(A1(O1)) and S(A2(O1)) with respect to the same alternative O1. The result of this aggregation is denoted as S(A1(O1)) S(A2(O1)).Considering that S(A1(O1)) and S(A2(O1)) are both complete, the probability mass that is related to each belief structure is defined as follows:
mn,1= ω1βn,1 (n=1,...,5) and "#,� = 1 $ �� ∑ ��,����� = 1 $ ��
mn,2 = ω2βn,2 (n=1,...,5) and "#,� = 1 $ �� ∑ ��,����� = 1 $ ��
where each mn,j (j=1,2) is referred to as a basic probability mass and each mH,j (j=1,2) is the
remaining belief for attribute j unassigned to any Hn (n=1,...,5). The basic probability masses are aggregated by applying the ER algorithm, in order to generate a combined probability mass, presented below: "�,%� &�� = '%� &���"�,%� �"�, &� ( "�,%� �"#, &� ( "#,%� �"�, &��,
(n=1,...,N)
"#,%� &�� = '%� &��"#,%� �"#, &�
⊕
6
Where
'%� &�� =)***+1 $ ,,"-,%� �
.
/��/0-
.
-��"/, &�
122234�
)3(
(i=1,2,...,L-1)
Although only two assessments are explained here, the algorithm can be repeated until three or more assessments are aggregated. The βn (n=1,...,N) obtained, which represents the combined degree of belief, is stated as:
�� = 56,7�8��459:,7�8� (n=1,...,5)
βn denotes the degree of belief to which criteria L are assessed to grade Hn. These final combined probability masses are independent of the order of aggregation of individual assessments. Therefore, the combined assessment for alternative O1 is given in the following expression, and represents the aggregated assessments of (1) and (2).
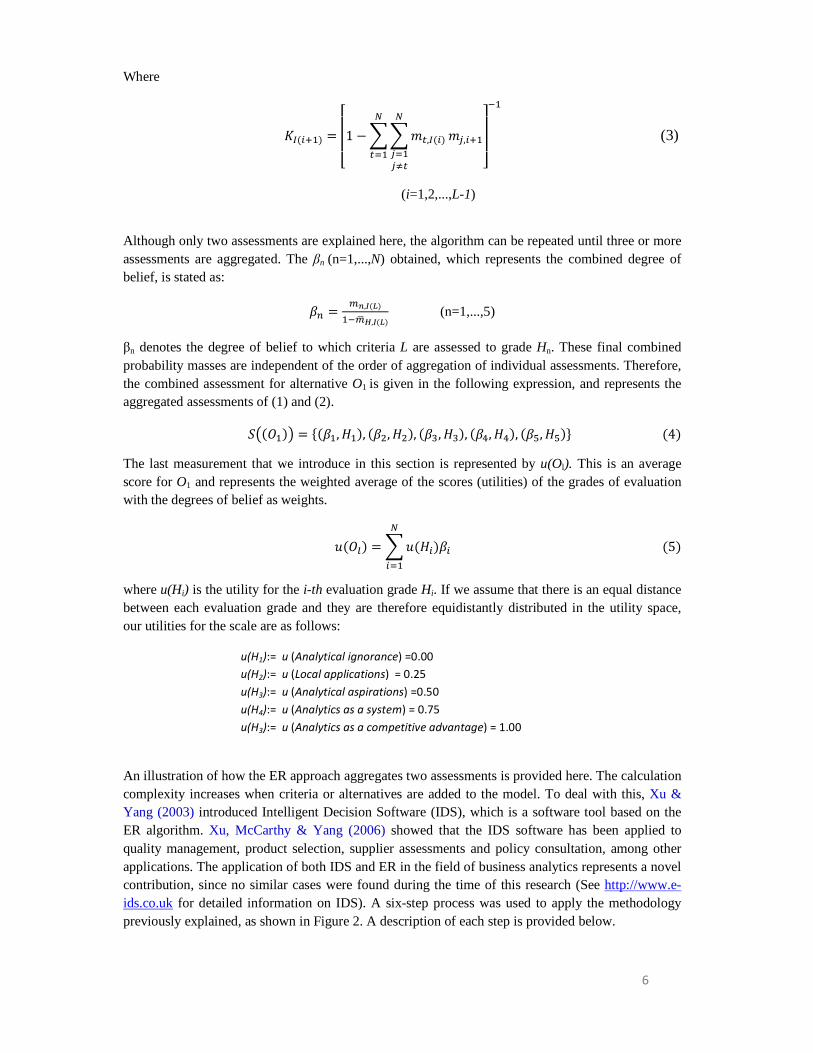
������� = ����, ���, ���, ���, ��, ��, ��, ��, ���, �����4� The last measurement that we introduce in this section is represented by u(Ol). This is an average score for O1 and represents the weighted average of the scores (utilities) of the grades of evaluation with the degrees of belief as weights.
<��=� = ,<�� �� .
���5�
where u(Hi) is the utility for the i-th evaluation grade Hi. If we assume that there is an equal distance between each evaluation grade and they are therefore equidistantly distributed in the utility space, our utilities for the scale are as follows:
u(H1):= u (Analytical ignorance) =0.00
u(H2):= u (Local applications) = 0.25
u(H3):= u (Analytical aspirations) =0.50
u(H4):= u (Analytics as a system) = 0.75
u(H3):= u (Analytics as a competitive advantage) = 1.00
An illustration of how the ER approach aggregates two assessments is provided here. The calculation complexity increases when criteria or alternatives are added to the model. To deal with this, Xu & Yang (2003) introduced Intelligent Decision Software (IDS), which is a software tool based on the ER algorithm. Xu, McCarthy & Yang (2006) showed that the IDS software has been applied to quality management, product selection, supplier assessments and policy consultation, among other applications. The application of both IDS and ER in the field of business analytics represents a novel contribution, since no similar cases were found during the time of this research (See http://www.e-ids.co.uk for detailed information on IDS). A six-step process was used to apply the methodology previously explained, as shown in Figure 2. A description of each step is provided below.

7
Figure 2. Six-step implementation process for the ER algorithm
3.1. Data collection
For ten months, from February to December 2012, we asked for appointments with managing directors, quality managers and information technology managers. After scheduling a date and time, we followed up with an interview. A total of 255 Decision Makers (DMs) provided us with information on the use of analytical tools in their companies. They were asked to rate the items shown in Appendix B using a linguistic scale with 5 levels {Worst, Poor, Average, Good, Excellent}. The DMs were also asked about the size of their companies according to the classification established by the U.S. government Small Business Administration, as shown in Table 1 (see http://www.sba.gov/content/small-business-size-standards for more information on business size classification).
Table 1. Classification of business size by number of employees
The 255 DMs who participated in the study were classified as: 117 from micro companies, 83 from small companies, and 26 and 29 from medium and large companies, respectively. No replies were received from enterprise companies. Using the 255 responses as input data, we proceeded to shape our model as follows.
3.2. Model definition
The model consists of three levels. The top level assesses the overall performance per type of company. This highest level of the model is the level of adoption of analytical tools. Four constructs are assessed at the middle level: data-based competitive advantage, senior management support for data analysis, systems thinking and communication with external actors. The third level is reserved for the bottom attributes (see Figure 1 for a visual representation of the model). 3.3. Relate father and bottom attributes
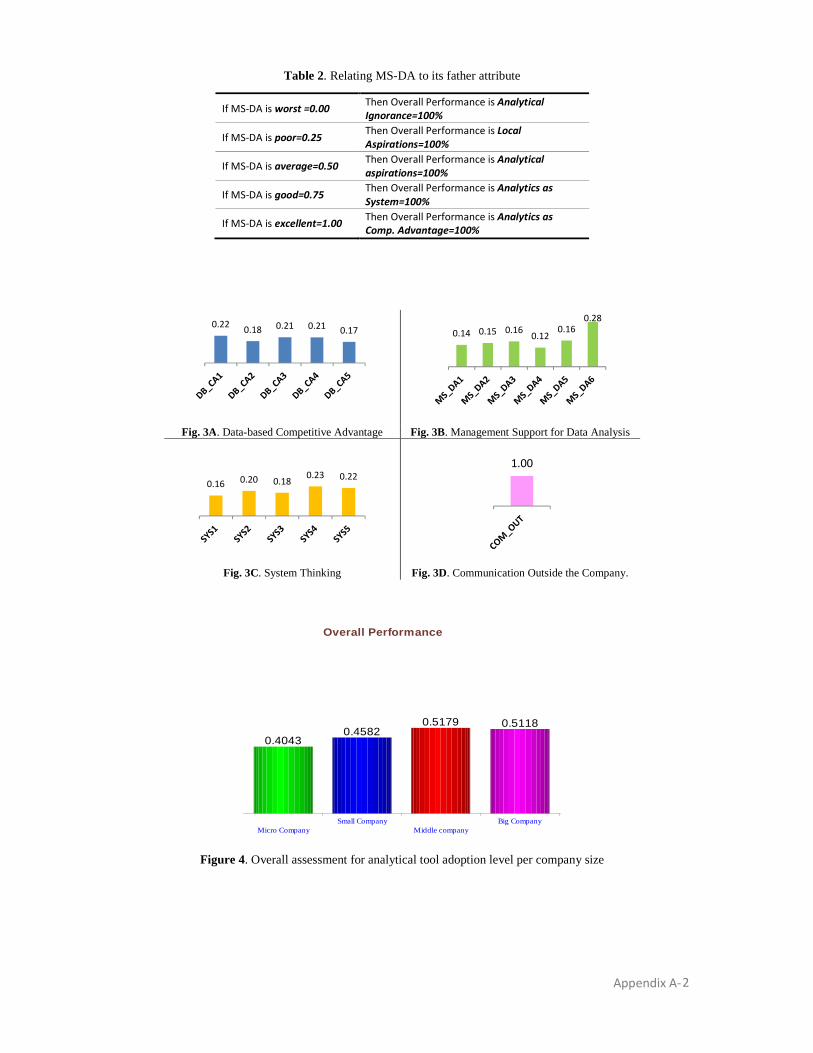
According Yang (2001) a quantitative relationship must be established between parent and bottom attributes, as part of building a framework. This framework also defines how the grades of lower-level attributes are converted to their parents’ grades. In this case, the overall performance is given by the four mid-level attributes. More specifically, if SYS is assessed using 5 bottom-level attributes (from SYS1 to SYS5), then these must be related to the overall performance. Similarly, if MS-DA is assessed by 6 bottom-level attributes (MS-DA1 to MS-DA6), then the challenge is to relate these values to overall model performance. These can be related to father attributes in two ways: based on rules, and based on utilities. Here we apply the rule-based approach. To illustrate this, consider the following case. If a particular decision maker (DM) gives a grade of “Worst” to one attribute, then the overall performance is equal to 0 (Analytical Ignorance 100%). Likewise, if a DM gives a grade of “Excellent” to one attribute, then the overall performance is equal to 1.0 (Analytics as competitive advantage 100%).

8
Table 2. Relating MS-DA to its father attribute
Similar to Table 2, a total of five attributes were related for DB-CA, another five were related to SYS, and one attribute was related to COM-OUT. Consequently the overall performance of the model was related to the 17 bottom-level attributes. The next task was to assign a weight to each attribute. 3.4. Assigning weights
The weight of one attribute is its relative importance with respect to the remaining attributes. Although the attributes can be part of the same framework, they might have a different weight. The weight of the attribute should be related directly to its importance inside the framework. Consider the following example. If senior management support has bigger impact on the adoption of new analytical tools, then it should have a heavier weight in the framework. A weight was calculated for each attribute by applying this logic. The algorithm proposed by Xu, McCarthy & Yang (2006) for assigning weights was implemented. First, we calculated the mean for each attribute by including all its responses. The higher the mean, the heavier the weight in the framework. A total of 17 means were obtained with the relative weight calculated for each using a normalized scale from 0 to 1. DB-CA1 was the most important of the attributes clustered on the construct data-based competitive advantage. This attribute refers to whether managers comprehend the benefits of the use of analytical tools for creating competitive advantages. In terms of management support of data analysis, MS-DA6 was the most important attribute, referring to the degree of support given to data analysis when investigating how competitors are evolving. The most important attribute for systems thinking was SYS4, which refers to whether there is a teamwork culture in the company. Communication outside the company has only one attribute, so its weight is equal to 1.0 (see Figures 3A to 3D).
Fig. 3A. Data-based Competitive Advantage Fig. 3B. Management Support for Data Analysis Fig. 3C. System Thinking Fig. 3D. Communication Outside the Company
3.5. Assigning degree of belief
According to Yang (2001) and Yang & Xu (2002), the degree of belief represents the strength with which an answer is believed to be true. Degrees of belief are subjective probabilities associated with assessment grades. One important advantage of their use is that they can break a single value into two or more associated probabilities. The use of degree of belief produces more informative results, as we demonstrate below. To assign degrees of belief, the grades of our linguistic scale were associated with numerical values. For instance, if the mean for SYS4 was equal to 3.80, the challenge is to ascertain to what extent SYS4 is equal to {(‘Worst’, 0), (‘Poor’, 0), (‘Average’, 0.40), (‘Good’, 0.60), (‘Excellent’=0)}. We defined the function ?: A1,5B ∈ ℝ → F ∈ A0,1B�, which transforms the mean of each attribute into a vector of five components.

9
Given any H̅ ∈ A1,5B the th-i component of g(H̅) is expressed as:
?�H̅� =JKLKM 0NH̅O � P � QH̅RH̅ $ QH̅RifP = NH̅ONH̅O $ H̅ifP = QH̅R
(i=1...5)
According to formula (6), if the mean for MS-DA6 is equal to H̅=4.09, then this will be transformed into a vector of five components, which results in the following belief structure: {(‘Worst’, 0), (‘Poor’, 0), (‘Average’, 0), (‘Good’, 0.98), (‘Excellent’, 0.08)}. The implementation of (6) in our 17 bottom-level attributes gave the same number of belief structures that were incorporated in our framework.
3.6. Assessment calculations
The model assessment is divided into three parts. First, overall performance was calculated. Secondly, the distributed assessment for each type of company was obtained. Finally, sensitivity tests were performed.
3.6.1. Overall performance
The four company sizes were assessed according to their level of adoption of analytical tools. Mid-sized companies were only slightly more analytical than large companies. In contrast, micro companies were the least analytically oriented. Small companies were in the third position (see Figure 4).
Figure 4. Overall assessment for analytical tool adoption level per company size
3.6.2. Distributed assessments
A distributed assessment allows us to compare the investigated attributes. This comparison generates more insightful information of how they impact each alternative of the framework. The following figures show the distributed assessments for each company size (see Figures 5A-5D).
Fig. 5A. Distributed assessment for a micro company Fig. 5B. Distributed assessment for a small company Fig. 5C. Distributed assessment for a mid-sized company Fig. 5D. Distributed assessment for a large company
Mid-sized companies obtained the highest assessment for level 5, “Analytical tools as a competitive advantage”, equal to 0.96%. This group also had the largest number of companies at Level 3, “Analytical aspirations”, equal to 76.41%. We consider that mid-sized companies may be the type of company most analytically oriented. In contrast, two findings would lead us to believe that micro-companies might be the least analytically oriented. The largest group of companies at level 1 “Analytical Ignorance” (1.71%) are micro-companies. This group also had the largest number of companies at level 2 “Local focus”.
)6(

10
Regarding the assessments of our four constructs (or key drivers for expanding the use of analytical tools), distributed assessments for each of these were calculated. For the COM-OUT construct, which refers to external company communication, we found that micro companies were evaluated as “poor”=91%, while large companies were evaluated as “average”=61.2% and “good”=38.8%. From this perspective, there is a direct relationship between company size, external communication, and analytical tool adoption level. The larger a company, the better the communication with external actors. Similarly, the larger a company, the better its use of analytical tools. Next we analysed the construct with reference to the use of data to create competitive advantages, identified as DB-CA. Here, micro-companies were evaluated as “poor”=40.6% and “average”=43.9%, demonstrating a lack of high standards regarding data quality. In contrast, mid-size companies were evaluated as “average”=81.25% and “good”=17.4%, while large companies were assessed as “average”=86.68% and “good”=11.96% for this attribute. The SYS construct refers to the company’s use of systems thinking. In this regard mid-sized companies obtained the highest evaluation with “average”=70.50% and “good”=25.27%, followed by small companies with values of “average”=86.54% and “good”=8.87%. In contrast, large companies were assessed as “poor”=30.27% and “average”=51.80% for this attribute. Given this, features related with sharing the mission and vision statements and promoting a data-driven culture among the staff were the most developed by both mid-sized and small companies.
The last construct refers to senior management support for data analysis (MS-DA). In this case, mid-sized companies obtained the highest assessment with values of “average”=37.88%, “good”=22.75% and “excellent”=5.69%, followed by large companies which were “average”=57.54%, and “good”=14.19%. In comparison, micro companies received the lowest evaluation with “worst”=9.1% and “poor”= 62%. From this perspective, we believe that features related to senior management support are more developed in mid-sized companies.
3.6.3. Sensitivity test
The sensitivity analysis is the last part of the model assessment. Basically, a sensitivity test investigates how a change in an attribute weight could impact overall performance. To dig deeper into this concept, consider the following explanation. First, we assume that the four attributes of our model are normalized, so the sum is equal to 1. Later, the weight (w3) of one is changed from 0 to 1, while the other three remain unchanged; that is, w1= w2= w4=(1-w3)/3. This analysis lets us measure how an attribute changes as a result of a change in another. Figure 6 shows the sensitivity analysis for SYS.
Figure 6. Sensitivity test for systems thinking
According to Figure 6, changes in the weight of systems thinking (SYS) will have the largest impact on micro-companies. Moreover, if the weight of SYS is closer to zero, then the average score for micro-companies has the largest reduction. In contrast, mid-sized companies are the least sensitive to weight changes (indicated as a red line in Figure 6). Note that the red line, which represents mid-sized companies, is almost horizontal and maintains the same average score while the weight of SYS

11
changes. When the weight of SYS is small, differences among average scores are larger. As the weight of SYS increases, differences among the attributes go to zero.
A second sensitivity analysis is provided in order to investigate how changes in the weight of external company communication (COM-OUT) affect the average scores of the model. Again we are assuming that the weight COM-OUT is changing from 0 to 1 while the other three remain equal (see Figure 7).
Figure 7. Sensitivity test for communication outside the company
According to Figure 7, micro-companies are the most sensitive to changes in COM-OUT. Small companies, however, are less sensitive to changes in weight. Note that the blue line, which represents small companies, is almost horizontal. This is interpreted as a complete lack of sensitivity to weight changes. It is also interesting to observe that for values of COM-OUT closer to 1, the differences in average scores increases. This is inverse in comparison with systems thinking.
Two sensitivity tests (one for DB-CA and other for MS-DA) were omitted. These were also calculated, but there were no relevant sensitivities found. Finally, the opposite effect of the attributes SYS and COM-OUT are remarkable. When SYS values approach 1, differences in average scores are larger. However, the effect for COM-OUT is exactly the opposite.
4. Practical guidelines for stakeholders 4.1. Data-based competitive advantages
The first guideline relates to developing data-based competitive advantages. In this respect, micro-companies are advised to incorporate information technologies into their most important processes in order to improve tasks involving data gathering, handling and analysis. The greatest concern for these companies is improving data quality. That is, high-quality data should trigger a “chain reaction effect”, which yields more accurate analysis, and consequently, valuable information for better informed decisions. The ultimate goal will always be to improve products and services by making more robust decisions based on data analysis. If the company is able to successfully create innovative products or services that satisfy customer expectations, then this will form the foundation for creating competitive advantages based on data analysis. We recommend that our readers consult resources such as Merigó & Gil-Lafuente, (2010), Rousseau (2006) and Marco‐Almagro & Tort‐Martorell (2012). These authors provide simple and practical guidelines on improving data management, and consequently, the development of competitive advantages. 4.2. Management support of data analysis
In this subsection, we direct our attention to management support of data analysis. Senior managers of micro-companies are advised to allocate financial, technical and human resources in order to improve processes such as data acquisition, storing, debugging and analysis. Basically, senior managers are responsible for building a data-driven culture within the company. In order to successfully achieve this, leaders should provide exhaustive training to all staff. Defining a mission and vision statement is also of strategic importance, which clearly defines the desired status of the

12
company with respect to the use of data. Working plans should be introduced by senior managers, based on these mission and vision statements. Numerical goals for describing progress made in such areas as data quality, degree of knowledge of the staff and amount of financial resources allocated to analytical projects, should be included in these plans. It is at this point that the famous quote “plan your word and work your plan” makes sense. Upper management should also be the main promoter for implementing new analytical initiatives. They should demonstrate their commitment to these analytical initiatives by giving public talks about the progress of the projects and by eliminating obstacles. Unfortunately, space limitations make it impossible for us to give exhaustive guidelines. However, many resources and tools to improve management support for data analysis can be found in Brynjolfsson, Hitt, & Kim (2011), Sharma, Mithas, & Kankanhalli, (2014), Santiago Rivera & Shanks (2015) and Lee et al. (2014). The reader may find the tools, methodologies and processes proposed by these authors helpful. 4.3. Systems thinking
Implementing a systems-thinking strategy in one company implies a fundamentally different course of action than that of a conservative point of view. Traditional management is focused on the importance of separating the whole, which could be a process, functional area or task, into smaller pieces. In contrast, systems thinking prioritizes the study of interactions among the elements that are part of the system. According to Vickers (1983) the perspective of systems thinking makes it possible to tackle complex problems. Situations in which systems thinking has proven its efficiency include, among others, assisting large organizations to realize “the big picture” for a particular challenge, detection and elimination of negative recursive circles, and solving situations where corrective actions affect the environment surrounding the situation itself, either the natural environment or the competitive scenario. Some references are provided to adopt a systems thinking perspective in a company. First, the concepts proposed by Deming (2000) will help the reader to understand the role of shareholders, customers, suppliers, employees, the community and the environment in successfully adopting new analytical projects. Similarly, Senge & Sterman (1992) states that understanding interactions among elements of the company and roles of the staff is vital in order to overcome resistance to change. In the case of the study made by Özbayrak, Papadopoulou & Akgun (2007), concepts of dynamic systems are implemented to optimise the performance of supply chains. This resource is advised in order to understand the network as a whole and to analyse the interactions between the components of the system.
4.4. Communication with outside actors
With regard to communication outside the company, mid-sized companies received the lowest evaluation. Consequently, working on improving their information technologies will have positive results. Efforts should first be oriented towards better data analysis thru Customer Relationship Management (CRM) systems. Secondly, data from Supply-Chain Management (SCM) systems should be fully exploited. The ideal scenario is to achieve a complete integration of both of these systems. Whereas CRM embraces aspects that deal with prospects and customers, including call centres, sales force, marketing campaigns and post-sales support, SCM manages activities such as storage, manufacturing and assembling materials from one supplier to another. Managers should

13
keep in mind that the challenge will always be to improve communications with actors outside the company through a complete integration of information technologies. Similarly, data coming from the front and the back of the company should be analysed holistically in order to strengthen communications with clients and suppliers. In terms of further exploiting communications systems, authors such as Payne & Frow (2005), Reinartz, Krafft, & Hoyer (2004), Bolívar-Ramos, García-Morales & García-Sánchez (2012) and Khodakarami & Chan (2014) provide helpful methodologies and practical advice.
5. Discussion
In this research, an evidential reasoning approach was applied to investigate analytical tool adoption level in four types of companies. First, we described the contemporary scenario of business analytics and a formal definition for analytical tools is then given within the context of management. Section two provided a conceptual framework designed to measure analytical tool adoption level. This framework consists of four key drivers: data-based competitive advantages, management support of data analysis, systems thinking and communications with outside actors. A broad explanation of the evidential reasoning approach was provided in section three, followed by the results obtained from a case study.
At this point, it is important to highlight that our results are intended to be more illustrative than convincing. That is, the purpose of this research was to demonstrate the versatility of the evidential reasoning approach and its capacity to crossover different disciplines, rather than to throw compelling evidence on the adoption of analytical tools. Even though our results are limited in scope and relevance, a compilation of guidelines was provided in section four with the aim of assisting stakeholders interested in expanding the use of analytical tools in their companies. Due to space limitations, guidelines are not explained in detail, but they are enriched by insights from the literature. Considering that more than 78% of the responders were micro- and small companies, it is clear that additional research is needed to complement our findings. A follow-up paper will be prepared that focuses on the special features of these types of companies. In addition, the analytical tools most commonly used by companies will be investigated in greater depth. More detailed information will be included in the upcoming paper about responders in order to obtain complementary conclusions.
In conclusion, the complete framework considers contributions in two ways: one methodological, involving the use of the evidential reasoning approach to investigate the key drivers that produce an expansion on the use of analytical tools; and the other illustrative, providing a novel application of the evidential reasoning approach in the field of business analytics. This type of multi-criteria decision analysis has been widely applied in different fields, such as quality management, social sciences, risk and safety analysis, and government policy consultation, among others. At the time of this research, however, this is the first application of evidential reasoning in the field of business analytics.

14
6. References
Barahona, I., Cavazos, J., & Yang, J. B. (2014). Modelling the level of adoption of analytical tools. An implementation of multi-criteria evidential reasoning. International Journal of Supply and Operations Management, 1(2), 129-151.
Bolívar-Ramos, M. T., García-Morales, V. J., & García-Sánchez, E. (2012). Technological distinctive competencies and organizational learning: Effects on organizational innovation to improve firm performance. Journal of Engineering & Technology Management, 29(3), 331-357. doi:10.1016/j.jengtecman.2012.03.006
Brynjolfsson, E., Hitt, L. M., & Kim, H. H. (2011). Strength in numbers: How does data-driven decision making affect firm performance? Available at SSRN 1819486.
Burby, J., & Atchison, S. (2007). Actionable web analytics: using data to make smart business decisions. Indianapolis, IN: Sybex.
Checkland, P. (1999). Systems thinking. Rethinking management information systems, 45-56.
Davenport, T. (2014). Big data at work: dispelling the myths, uncovering the opportunities: Harvard Business Review Press.
Davenport, T. H., & Harris, J. G. (2007). Competing on analytics: the new science of winning. Boston MA: Harvard Business Press.
Davenport, T. H., Harris, J. G., & Morison, R. (2010). Analytics at work: smarter decisions, better results. Boston, MA: Harvard Business Press.
Deming, W. E. (2000). Out of the Crisis: MIT press.
Gardner, R. (2004). The Process-focused Organization: A Transition Strategy for Success: ASQ Quality Press.
Hoerl, R., & Snee, R. D. (2012). Statistical thinking: improving business performance (Vol. 58): John Wiley & Sons.
Khodakarami, F., & Chan, Y. E. (2014). Exploring the role of customer relationship management (CRM) systems in customer knowledge creation. Information & Management, 51(1), 27-42.
Lee, J., Elbashir, M. Z., Mahama, H., & Sutton, S. G. (2014). Enablers of top management team support for integrated management control systems innovations. International Journal of Accounting Information Systems, 15(1), 1-25.
Locke, E. A., Latham, G. P., Smith, K. J., Wood, R. E., & Bandura, A. (1990). A theory of goal setting & task performance (Vol. 21): Prentice Hall Englewood Cliffs, NJ.
Lynch, C. (2008). Big data: How do your data grow? Nature, 455(7209), 28-29.
Marco‐Almagro, L., & Tort‐Martorell, X. (2012). Statistical methods in kansei engineering: a case of statistical engineering. Quality and Reliability Engineering International, 28(5), 563-573. doi:10.1002/qre.1434
15
Merigó, J. M., & Gil-Lafuente, A. M. (2010). New decision-making techniques and their application in the selection of financial products. Information Sciences, 180(11), 2085-2094.
Payne, A., & Frow, P. (2005). A strategic framework for customer relationship management. Journal of marketing, 69(4), 167-176.
Perry-Smith, J. E., & Shalley, C. E. (2003). The social side of creativity: A static and dynamic social network perspective. Academy of Management Review, 28(1), 89-106.
Powell, T. C., & Dent-Micallef, A. (1997). Information technology as competitive advantage: The role of human, business, and technology resources. Strategic Management Journal, 18(5), 375-405. doi:10.1002/(sici)1097-0266(199705)18:5<375::aid-smj876>3.0.co;2-7
Reinartz, W., Krafft, M., & Hoyer, W. D. (2004). The customer relationship management process: Its measurement and impact on performance. Journal of marketing research, 41(3), 293-305.
Rousseau, D. M. (2006). Is there such a thing as" evidence-based management"? Academy of Management Review, 31(2), 256-269.
Saaty, T. L. (1986). Axiomatic foundation of the analytic hierarchy process. Management science, 32(7), 841-855.
Santiago Rivera, D., & Shanks, G. (2015). A Dashboard to Support Management of Business Analytics Capabilities. Journal of Decision Systems, 24(1), 73-86.
Senge, P. M., & Sterman, J. D. (1992). Systems thinking and organizational learning - acting locally and thinking globally in the organization of the future. European Journal of Operational Research, 59(1), 137-150. doi:10.1016/0377-2217(92)90011-w
Shafer, G. (1976). A Mathematical Theory of Evidence. Sheffield UK: Princeton University Press.
Sharma, R., Mithas, S., & Kankanhalli, A. (2014). Transforming decision-making processes: a research agenda for understanding the impact of business analytics on organisations. European Journal of Information Systems, 23(4), 433-441.
Sila, I., & Ebrahimpour, M. (2003). Examination and comparison of the critical factors of total quality management (TQM) across countries. International Journal of Production Research, 41(2), 235-268. doi:10.1080/0020754021000022212
Tallon, P. P., Kraemer, K. L., & Gurbaxani, V. (2000). Executives' perceptions of the business value of information technology: A process-oriented approach. Journal of Management Information Systems, 16(4), 145-173. doi:10.1.1.126.6163
Turner, V., Gantz, J. F., Reinsel, D., & Minton, S. (2014). The Digital Universe of Opportunities: Rich Data and the Increasing Value of the Internet of Things. 9. Retrieved from www.idc.com website: http://idcdocserv.com/1678
Vickers, G. (1983). Human systems are different: Paul Chapman Pub.

16
Wang, R. Y., & Strong, D. M. (1996). Beyond accuracy: What data quality means to data consumers. Journal of management information systems, 5-33.
Xu, D.-L., McCarthy, G., & Yang, J.-B. (2006). Intelligent decision system and its application in business innovation self assessment. Decision Support Systems, 42(2), 664-673. doi:10.1016/j.dss.2005.03.004
Xu, D. L., & Yang, J. B. (2003). Intelligent decision system for self‐assessment. Journal of Multi‐Criteria Decision Analysis, 12(1), 43-60.
Yang, J.-B., & Sen, P. (1994). A general multi-level evaluation process for hybrid MADM with uncertainty. Systems, Man and Cybernetics, IEEE Transactions on, 24(10), 1458-1473.
Yang, J.-B., & Singh, M. G. (1994). An evidential reasoning approach for multiple-attribute decision making with uncertainty. Systems, Man and Cybernetics, IEEE Transactions on, 24(1), 1-18.
Yang, J.-B., & Xu, D.-L. (2002). Nonlinear information aggregation via evidential reasoning in multiattribute decision analysis under uncertainty. Systems, Man and Cybernetics, Part A: Systems and Humans, IEEE Transactions on, 32(3), 376-393.
Yang, J. B. (2001). Rule and utility based evidential reasoning approach for multiattribute decision analysis under uncertainties. European Journal of Operational Research, 131(1), 31-61. doi:10.1016/s0377-2217(99)00441-5
Özbayrak, M., Papadopoulou, T. C., & Akgun, M. (2007). Systems dynamics modelling of a manufacturing supply chain system. Simulation Modelling Practice and Theory, 15(10), 1338-1355. doi: http://dx.doi.org/10.1016/j.simpat.2007.09.007

Appendix A-
1
Appendix A. Figures
Figure 1. Conceptual framework for analytical tool adoption level
Figure 2. Six-step implementation process for the ER algorithm
Table 1. Classification of business size by number of employees
Company
size.
Number of
employees.
Number of
responses.
Micro. 1-6 117 Small. <250 83
Medium. <500 26 Large. <1000 29
Enterprise. 1001 or more 0 Total 255
Model definition3.2
Relate father and
bottom attributes3.3
Assigning weights3.4
Assigning degree of
belief3.5
Calculate assessments3.6
Conclusions
Data collection3.1
3.6.3. Sensitivity test
3.6.1. Overall performance
Transform means-values to degree of
belief
3.6.2. Distributed assessments
Appendix A-
2
Table 2. Relating MS-DA to its father attribute
If MS-DA is worst =0.00 Then Overall Performance is Analytical
Ignorance=100%
If MS-DA is poor=0.25 Then Overall Performance is Local
Aspirations=100%
If MS-DA is average=0.50 Then Overall Performance is Analytical
aspirations=100%
If MS-DA is good=0.75 Then Overall Performance is Analytics as
System=100%
If MS-DA is excellent=1.00 Then Overall Performance is Analytics as
Comp. Advantage=100%
Fig. 3A. Data-based Competitive Advantage Fig. 3B. Management Support for Data Analysis
Fig. 3C. System Thinking Fig. 3D. Communication Outside the Company.
Figure 4. Overall assessment for analytical tool adoption level per company size
0.220.18 0.21 0.21
0.17 0.14 0.15 0.160.12
0.16
0.28
0.160.20 0.18
0.23 0.22
1.00
Micro CompanySmall Company
Middle companyBig Company
Overall PerformanceOverall Performance
0.40430.4582
0.5179 0.5118

Appendix A-
3
L1 L2 L3 L4 L5 L1 L2 L3 L4 L5
Fig. 5A. Distributed assessment for a micro company Fig. 5B. Distributed assessment for a small company
L1 L2 L3 L4 L5 L1 L2 L3 L4 L5
Fig. 5C. Distributed assessment for a mid-sized company Fig. 5D. Distributed assessment for a large company
Figure 6. Sensitivity test for systems thinking
Micro CompanyMicro Company
1.71%
53.78%
25.99%18.11%
0.41%
Small CompanySmall Company
0.27%
24.22%
67.78%
7.39%0.33%
Middle companyMiddle company
0.24%8.34%
76.41%
14.05%
0.96%
Big CompanyBig Company
0.00%
12.97%
69.36%
17.67%
0.00%
Micro Company Small CompanyMiddle company Big Company
0%10%20%30%
40%50%60%
70%80%90%
100%
0.00
0.10
0.20
0.30
0.40
0.50
0.60
0.70
0.80
0.90
1.00
Ave
rag
e sc
ore
Average scores for the Overall PerformanceAverage scores for the Overall Performance
Weight of Systematic Thinking
Giv
en w
eig
ht

Appendix A-
4
Figure 7. Sensitivity test for communication outside the company
Micro Company Small CompanyMiddle company Big Company
0%
20%
40%
60%
80%
100%
0.00
0.10
0.20
0.30
0.40
0.50
0.60
0.70
0.80
0.90
1.00
Ave
rag
e sc
ore
Average scores for the Overall PerformanceAverage scores for the Overall Performance
Weight of Communication Outside the company
Giv
en w
eig
ht

Appendix B-1
Appendix B. Operationalization of the constructs.
Code ITEMS Supportive literature.
DB-CA1 The degree of comprehension of the benefits on the use of analytical tools for creating competitive advantages.
Marco‐Almagro &Tort-Martorell
(2012)
DB-CA2 To the extent on that the analytical tools are used for improving products and services.
Hoerl & Snee (2010) and
Gardner (2004)
DB-CA3 To the extent on that the analytical tools are supporting the competitive advantage of the business.
Hoerl & Snee (2012)
DB-CA4 The degree of importance of analytical tools for decision makers of the company.
Deming (2000)
DB-CA5 To the extent on what the work environment is suitable for using analytical tools.
Deming (2000) and Wang & Strong
(1996).
MS-DA1 The level of training provided to staff members about the use of analytical tools.
Deming (2000) Marco‐Almagro &
Tort-Martorell, (2012)
MS-DA2 To the extent on that, the new knowledge about the analytical tools is applied and implemented.
Davenport, & Harris (2007)
MS-DA3 To the extent on that, there are documented processes for data collection, manipulation and analysis.
Sila & Ebrahimpour (2003)
MS-DA4 To the extent on that a budget for analytical projects is available.
Wang & Strong (1996)
MS-DA5 To the extent on that the technological resources for implementing analytical projects are available.
Burby & Atchison (2007)
MS-DA6 The level of use of data analysis for investigating how competitors are evolving.
Davenport, Harris & Morrison (2010)
SYS1 To the extent on that the efforts for increasing the use of analytical tools are appreciated and recognized.
Ozbayrak, Papadopoulou & Akgun (2007)
SYS2 The extent on that the mission and vision statements are understood by all staff members.
Deming (2000)
SYS3 To the extent on that the organizational culture stimulates the use of analytical tools.
Checkland (1999)
SYS4 At your company, is there a teamwork culture? Senge & Sterman
(1992)
SYS5 The work environment encourages all staff members to use analytical tools.
Davenport, Harris & Morrison (2010)
COM-OUT To the extent on that the communications with actors outside the company are a priority.
Perry-Smith & Shalley (2003)