analyst meet presentation · 2016-08-05 · analyst meet presentation standalone financial results...
TRANSCRIPT

1
Analyst Meet PresentationStandalone Financial Results
Quarter Ended 31 Dec 2011
2
Agenda
Business Environment
Performance Overview
Projects Update

3
Agenda
Business Environment
Performance Overview
Projects Update

4
Global economic conditions remain a concern withEurozone facing difficult credit conditions and fiscal policyuncertainty
US economic data shows marginal but continuous growthdespite significant headwinds
Reconstruction spend in Japan spurring growth
Asian economies face slow down but Chinese and Indianeconomies will still outperform
Global economic growth in 2012 will be moderate compared to 2011.
Global economy

5
12
0.5 12
4.6
11
8.3
11
4.4
11
3.1
11
2.3 11
7.4
11
4.6
11
6.2
12
8.1
11
8.4
12
9.9
12
6.7
13
0.0
12
7.7
12
7.3
12
4.3
12
2.9
12
4.0
11
5.5
68%
72%
76%
80%
84%
88%
90
100
110
120
130
Ap
r-1
0M
ay-
10
Jun
-10
Jul-1
0A
ug
-10
Sep
-10
Oct
-10
Nov
-10
Dec
-10
Jan-
11
Feb
-11
Ma
r-1
1A
pr-
11
Ma
y-1
1Ju
n-1
1Ju
l-11
Au
g-1
1Se
p-1
1O
ct-1
1N
ov-1
1
World crude steel production (million tonnes)Capacity Utilisation (%)
300
450
600
750
900
1050
1200
Ap
r-08
Jul-
08
Oct
-08
Jan
-09
Ap
r-09
Jul-
09
Oct
-09
Jan
-10
Ap
r-10
Jul-
10
Oct
-10
Jan
-11
Ap
r-11
Jul-
11
Oct
-11
Jan
-12
HR
C p
rice
s
N.America domestic FOB US Midwest mill
Europe import CIF S.European port
Russia Black Sea export FOB
China export FOB Shanghai
Global steel scenario
Source: World Steel, SBB, JSW Steel
Apparent steel demand growth in 2HCY11 has been lower compared to 1HCY11
Prices corrected in Oct-Dec 2011 driven by gradual de-stocking
Capacity utilization has fallen below 75% pointing to supply side correction
Crude steel production is down ~150 Mn tonnes on an annualized basis in Nov 2011from its peak in June 2011
Global steel prices are showing improvement.

6
6
10
14
18
22
Jan
-09
Ap
r-0
9
Jul-
09
Oct
-09
Jan
-10
Apr
-10
Jul-
10
Oct
-10
Jan
-11
Ap
r-1
1
Jul-
11
Oct
-11
Re-stocking season
Inventories in the warehouses of 25 major cities
24.9
23
.8
24.9
25
.0 25
.4 25
.8
25
.6
25
.4
25
.0
24.9
24.9
24
.5
Jan
/No
v'1
0
Jan/
Dec
'10
Jan
/Feb
'11
Jan
/Ma
r'1
1
Jan
/Ap
r'1
1
Jan
/May
'11
Jan
/Ju
n'1
1
Jan
/Ju
l'11
Jan/
Aug
'11
Jan/
Sep'
11
Jan
/Oct
'11
Jan
/Nov
'11
Urban Fixed assets investment (% YoY) 4
7.3 48
.7
48
.4
55
.1
47
.4
54
.9 56
.3
55
.8
55.5
54.7
54.2
51
.5
50.5
46
.7
47
.5
48.850.0
58.1 58.4
48.4
49.7
40
44
48
52
56
60
Oct
-10
Nov
-10
Dec
-10
Jan
-11
Feb
-11
Mar
-11
Ap
r-1
1
May
-11
Jun
-11
Jul-1
1
Aug
-11
Sep
-11
Oct
-11
Nov
-11
Dec
-11
Apparent Steel ConsumptionFinished Steel Production
China: moderate growth, seasonal re-stocking
Source: Mysteel, World Steel Association, JSW Steel
(All figures are in Mn tonnes)
Cumulative FAI growth has been below 25% but still remains significant
Steel production in Dec 2011 has fallen below Dec 2010 levels indicating exit of highcost capacities and lower apparent steel demand
Gradual monetary policy loosening will ensure moderate growth in 2012
Seasonal re-stocking should result in improved demand in 4QFY12.

7
215 22
8
223 24
3
370
325
328
313
310
308
303
303
265
242
225
220
150
200
250
300
350
Oct
-10
No
v-10
De
c-10
Jan
-11
Feb
-11
Mar
-11
Ap
r-11
May
-11
Jun
-11
Jul-
11
Au
g-11
Sep
-11
Oct
-11
No
v-11
De
c-11
Jan
-12
Australian Spot HCC FOB HCC Contract FOB
120
140
160
180
200
03-J
an-1
1
31-J
an-1
1
28-F
eb
-11
28-M
ar-1
1
25-A
pr-
11
23-M
ay-1
1
20-J
un
-11
18-J
ul-
11
15-A
ug-
11
12-S
ep
-11
10-O
ct-1
1
07-N
ov-
11
05-D
ec-
11
02-J
an-1
2
Indian Iron Ore 63% Fe dry -China CFR
Downward pressure on coking coal prices, volatility in iron ore prices
Source: SBB, Platts, JSW Steel
(All figures are in USD/tonne)
HCC prices dropped to $280-285/t for 3QFY12contracts but 3QFY12 steel margins would besofter due to lag effect of raw material prices.
However HCC prices have come down to ~$230-235/t for 4QFY12 contracts and spot prices havecorrected sharply to ~$220/t in Jan2012
Iron ore spot prices, after falling to $126/t levelin Oct 2011 end, are currently hovering around$145/t
Iron ore prices have improved due to marginalre-stocking by Chinese players but upside iscapped with reduced steel capacity utilization
Margins to improve in 4QFY12

8
48.750.9
9M
Apparent Finished Steel
Consumption*
4.4%
15.6
16.8
3Q
FY11 FY12
7.7%
45.7
49.0
9M
FY11 FY12
7.1%
Finished Steel Production*
15.716.1
3Q
2.4%
India: steel consumption rebounds in 3QFY12
*Netted off for double counting effect
Apparent finished steel consumption* growthwas low in 1HFY12, however it rebound in3QFY12 and grew by 7.7%
Finished steel production* growth corrected in3QFY12 and increased by only 2.4%
Steel prices remained flat in 3QFY12 vs. 2QFY12,and have increased in Jan 2012
Domestic steel prices are at import parity
Steel demand growth is expected to be around 5% in FY12.
Current account deficit has widened to 3.7% in 2QFY12 and fiscal deficit is expected to riseto ~5-5.5% for FY12
High inflation coupled with higher interest rates and policy reforms delay has affectedgrowth
However HSBC India composite output PMI data suggests that activities in both themanufacturing and services sectors rebounded in Dec 2011

9
Business Environment
Performance Overview
Projects Update

10
Key highlights
Steel for Ball Bearing for FAG Schaeffler India
Steel for transmission component for Heavy Commercial Vehicles forTata Motors
New product
approvals
Highest ever crude steel production in a quarter 1.94 Mn tonnes
Highest ever sales volume in a quarter 1.91 Mn tonnes
Production/sales
Total 11.4Mn tonnes of iron ore was sold out of 16.8Mn tonnes ofiron ore offered for bidding in e-auctions till Dec 2011 end
The company purchased 7.1Mn tonnes of iron ore in e-auctions andreceived 52% of it till Dec 2011 end
Iron ore update

11
0.282
0.3700.345
3QFY11 3QFY12 2QFY12
Rolled : Long
1.249
1.3871.299
3QFY11 3QFY12 2QFY12
Rolled : Flat
1.636
1.939
1.738
3QFY11 3QFY12 2QFY12
Crude Steel
YoY % QoQ %
11% 7%
Production – 3QFY12
All figures are in Mn tonnes
YoY % QoQ %
31% 7%
YoY % QoQ %
19% 12%

12
0.855
1.057
9MFY11 9MFY12
Rolled : Long
4.78
5.362
9MFY11 9MFY12Crude Steel
Production – 9MFY12
All figures are in Mn tonnes
3.6133.872
9MFY11 9MFY12Rolled : Flat
YoY %
12%
YoY %
7%
YoY %
24%

13
0.4330.415 0.416
3QFY11 3QFY12 2QFY12
Value Added
1.593
1.908 1.882
3QFY11 3QFY12 2QFY12
Total Sales
Saleable steel sales – 3QFY12
All figures are in Mn tonnes
1.2401.442 1.467
3QFY11 3QFY12 2QFY12
Rolled : Flat
YoY % QoQ %
20% 1%YoY % QoQ %
16% -2%
YoY %
-4%
QoQ %
0%
0.077
0.104
0.076
3QFY11 3QFY12 2QFY12
Semis
YoY % QoQ %
36% 36%
0.276
0.3620.339
3QFY11 3QFY12 2QFY12
Rolled : Long
YoY % QoQ %
31% 7%

14
3.314
4.193
9MFY11 9MFY12
Rolled : Flat
1.231 1.232
9MFY11 9MFY12
Value Added
4.367
5.505
9MFY11 9MFY12
Total Sales
Saleable Steel Sales – 9MFY12
All figures are in Mn tonnes
0.2700.319
9MFY11 9MFY12
Semis
0.783
0.993
9MFY11 9MFY12
Rolled : Long
YoY %
26% YoY %
27%
YoY %
0%
YoY %
27%
YoY %
18%
15
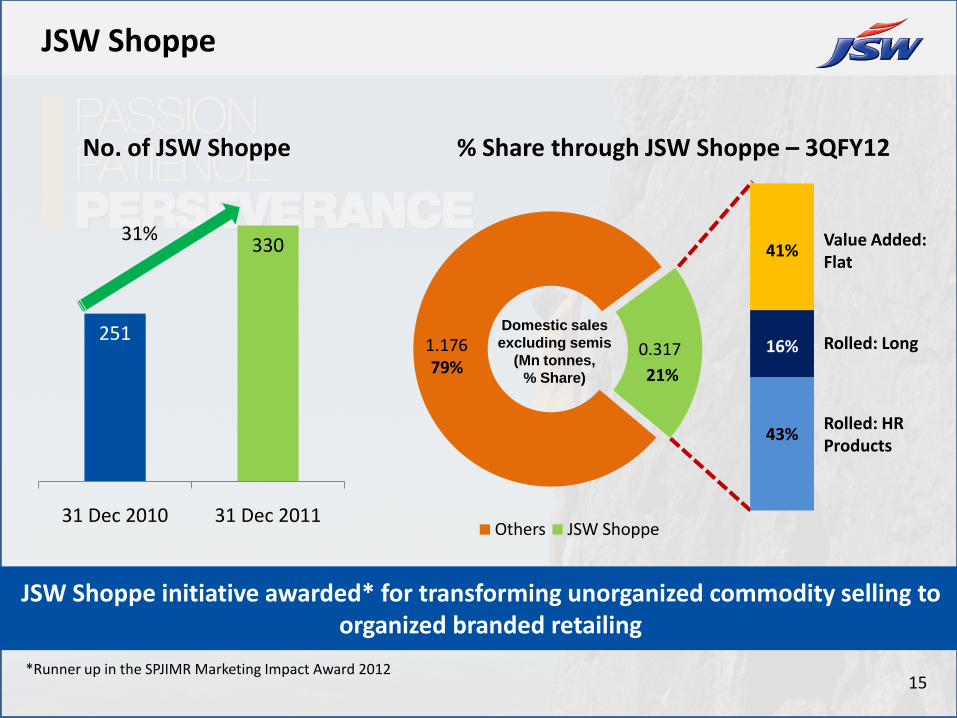
1.176 0.317
Others JSW Shoppe
JSW Shoppe
*Runner up in the SPJIMR Marketing Impact Award 2012
Rolled: Long
Rolled: HR Products
43%
Domestic sales
excluding semis
(Mn tonnes,
% Share)
Value Added: Flat
79% 21%
41%
43%
16%
% Share through JSW Shoppe – 3QFY12
251
330
31 Dec 2010 31 Dec 2011
31%
No. of JSW Shoppe
JSW Shoppe initiative awarded* for transforming unorganized commodity selling to organized branded retailing

16
Financials (standalone)
Particulars 3QFY12 3QFY11 Growth 9MFY12 9MFY11 Growth
Gross Sales 8,498 6,286 35% 24,367 17,516 39%
Net Sales 7,860 5,771 36% 22,549 16,131 40%
EBITDA 1,253 1,008 24% 3,969 3,198 24%
EBITDA (` per tonne) 6,568 6,328 7,210 7,324
Net Finance Charges 282 132 114% 713 542 31%
Depreciation 444 346 28% 1,236 996 24%
Exceptional Items 500 NIL 985 NIL
Profit Before Tax 27 530 -95% 1,035 1,660 -38%
Tax (141) 147 161 482 -67%
Profit after Tax 168 382 -56% 874 1,178 -26%
` Crores

17
1,008
1,253 189
827
(677) (20)(66) (8)
EBITDA3QFY11
Volume NSR Cost Mix Others FX impact EBITDA3QFY12
EBITDA movement – standalone
` Crores

18
12,106
13,504
2,315
(1,081)
513
(349)
Net Total Debt
as on Sep'11
New Loan Taken Repayments Forex Loss Movement in FD /
MF
Net Total Debt
as on Dec'11
Net debt movement – standalone
Cash & cash equivalent – ` 2,201 Crores
` Crores

19
Particulars 3QFY12 3QFY11
EBITDA Margin 15.9% 17.4%
PAT Margin 2.1% 6.6%
Diluted EPS (`) 7.18* 16.97*
ROCE 8.8% 9.2%
* Not Annualized
Financial ratios – standalone
Particulars 31.12.2011 30.09.2011
Net Total Debt/Equity (x) 0.75 0.68
Net Total Debt/EBITDA (x) 2.41 2.25

20
Business Environment
Performance Overview
Projects Update

21
Projects summary
Alamatti Project :
171 km water pipe line from Alamatti Dam to Vijayanagar works
Commissioned in Nov 2011
Slurry Pipe Line Project:
A part of Beneficiation-2 Project
Commissioned in Dec 2011
ParticularsExpected
Completion
CPP – IV (300MWcaptive thermal power plant) FY12 end
HSM – 2 phase II Sep 2012
Beneficiation plant– II (3modules out of 7 already commissioned)
Sep 2012
Cold Rolling Mill – 2 FY14 end
10 MTPA to 12 MTPA expansion FY14 end
Projects under implementation
Projects commissioned during 3QFY12

22
Projects Update
^ Commissioned
* Work under progress
Alamatti Dam^ Slurry Pipeline^
CPP -IV (300 MW)* Cold Rolling Mill -2 (Phase 1)*

23
New projects
Project Coke Oven Plant Pellet Plant CRM Mill
Capacity 1 MTPA 4 MTPA 0.8 MTPA
Project Cost ` 975 Crores ` 835 Crores ` 330 Crores
Environmental Clearances
In Place In process In process
Implementation period
Dec 201321 months
from zero date18 months
from zero date
Benefit to JSW Ispat
Assured availability of good quality coke
Improved productivity
Assured supplies of pellets
Reduce dependence on a few large customers
Benefit to JSW Steel
25% return on investment
25% return on investment
Larger share of value-added downstream market
Setting up cost reduction and integration projects for JSW Ispat in a SPV named Amba RiverCoke Limited (a wholly owned subsidiary of JSW Steel)
Total cost of projects: ` 2,140 Crores

24
Forward looking and cautionary statement
Certain statements in this report concerning our future growth prospects are forward looking statements,which involve a number of risks, and uncertainties that could cause actual results to differ materially fromthose in such forward looking statements. The risk and uncertainties relating to these statements include,but are not limited to risks and uncertainties regarding fluctuations in earnings, our ability to managegrowth, intense competition within Steel industry including those factors which may affect our costadvantage, wage increases in India, our ability to attract and retain highly skilled professionals, time andcost overruns on fixed-price, fixed-time frame contracts, our ability to commission mines withincontemplated time and costs, our ability to raise the finance within time and cost client concentration,restrictions on immigration, our ability to manage our internal operations, reduced demand for steel, ourability to successfully complete and integrate potential acquisitions, liability for damages on our servicecontracts, the success of the companies in which the Company has made strategic investments, withdrawalof fiscal/governmental incentives, impact of regulatory measures, political instability, legal restrictions onraising capital or acquiring companies outside India, unauthorized use of our intellectual property andgeneral economic conditions affecting our industry. The company does not undertake to update anyforward looking statements that may be made from time to time by or on behalf of the company.

25
Thank you