analysis of travel behavior array pattern from the
TRANSCRIPT
ANALYSIS OF TRAVEL BEHAVIOR ARRAY PATTERN FROM THE PERSPECTIVE OF TRANSPORTATION POLICIES
Kohachi YAMANE Director Nishi-Nihon Business Headquarters Fukuyama Consultant Co., 5-1 Noborimachi, Nakaku, Hiroshima City, 730-0016 Japan Fax: +81-82-502-8804 E-mail: [email protected]
Akimasa FUJIWARA Professor Transportation Engineering Laboratory, IDEC, Hiroshima University, Kagamiyama 1-5-1, Higashi-Hiroshima, 739-8529 Japan Fax: +81-82-424-6921 E-mail: [email protected]
Junyi ZHANG Associate Professor Transportation Engineering Laboratory, IDEC, Hiroshima University, Kagamiyama 1-5-1, Higashi-Hiroshima, 739-8529 Japan Fax: +81-82-424-6919 E-mail: [email protected]
Abstract: From the perspective of transportation policies, this study first proposes a new indicator, called “travel behavior array pattern (TRAP)”. TRAP is defined based on trip information arranged in the order of occurrence in the context of the widely used person-trip data. Empirical analysis using the data collected at a local Japanese city, shows that the purpose-based TRAPs vary with household attributes and urban structure, and individual attributes and accessibility of transit systems affect the TRAPs based on the sequences of representative travel modes. It is further found that the TRAPs related to transportation nodes are mainly determined by the operation frequencies of main transit systems. Finally, the effectiveness of TRAP is confirmed from the perspective of the policies related to the compactness of urban structure, the elderly society and the efficient use of existing transportation infrastructures. Key Words: Policy analysis, travel behavior array pattern (TRAP), compactness of urban
structure, the elderly society, transportation nodes, a local Japanese city
1. INTRODUCTION In Japan, main purpose of traditional urban transportation planning was to make a master plan of artery transportation networks in the future (about 20 years). However, nowadays, Japan is facing the unprecedented challenges from rapid progress of elderly society and potential reduction of total population, women’s participation in labor market, uplift of environmental attitude, and energy issues. Accordingly, it is necessary to deal with the following new urban issues, especially in local Japanese cities.
1) It is not arguable that total population in Japan will decrease in the future. Due to the steady progress of such trend, the compactness of urban structure is becoming a more and more important alternative in choice set of policies. Accordingly, transportation systems are urgently required to support such transformation of urban structure.
2) To secure mobility of elderly people in the future, it is necessary to move existing car-dependent transportation systems toward transit-centered systems. It is expected that
realization of transit-centered systems can also improve the level of urban sustainability. 3) Financial difficulty in the future suggests the importance of making efficient use of
existing transportation infrastructures. Under the above-mentioned population trend, it can be easily imagined that policies supporting transformation of urban structure and efficient use of existing infrastructures could largely influence people’s travel behavior from various aspects (e.g., trip generation, travel time, mode choice and activity participation). On the other hand, travel behavior is a derived demand from activity participation (Hagerstrand, 1970). In this sense, to understand people’s travel behavior under the new policies, activity-based approach seems promising. It has been widely examined in academic fields. One can also find some increasing number of applications in real world (Vovsha et al, 2004) in recent years. However, because of its complexity, for example, traditional person-trip survey has been dominating in transportation planning in Japan. One serious disadvantage of the approach based on person-trip data (e.g., four-step estimation procedure) is that it only deals with representative travel modes and main access/egress modes. As a result, a lot of useful information about transfer behavior across different transportation networks is lost. However, there might exist some unintended effects of transportation policies, for example, 1) park-and-ride schemes are intended to attract car users to use public transport for a section of their journey, but the unintended effect is to encourage public transport users to transfer to car instead; 2) traffic bans are intended to improve town center street environments, but the unintended effect is to discourage shoppers and reduce commercial success (Goodwin, 2003). Such unintended effects cannot properly measured by using only representative travel modes and main access/egress modes. To make full use of the widely used person-trip data in Japan, this study attempts to propose a new concept, called travel behavior array pattern (TRAP). TRAP is defined as a series of travel behavior chains with temporal sequence. It is expected that TRAP can overcome the shortcomings of trip-based approach and simplifies the activity-based approach. This paper is therefore organized as follows. Section 2 first emphasizes importance of travel pattern analysis based on the discussion about issues in existing travel behavior analysis approaches, and contemporary requirements about urban and transportation planning. Section 3 defines the TRAP. Following that, Section 4 derives the representative TRAPs based on a person trip data collected in a local Japanese city, and then describes their characteristics. Section 5 empirically examines the influential factors of the derived patterns and also discusses the policy implications. The paper is finally concluded in section 6 and some future research and policy issues are also mentioned. 2. IMPORTANCE OF TRAVEL PATTERN ANALYSIS 2.1 Issues of Existing Travel Behavior Analysis Approaches To make an integrated plan of transit systems and road networks in the future (about 20 years), person-trip survey has been widely applied in Japan, since it was first conducted in Hiroshima Metropolitan Area in 1967. By the time of December 2003, totally, 104 person-trip surveys were already carried out in 54 cities with the population of 500,000 and more. Four-step estimation procedure uses such data and only focuses on the analysis of trip based on the information about representative travel modes.
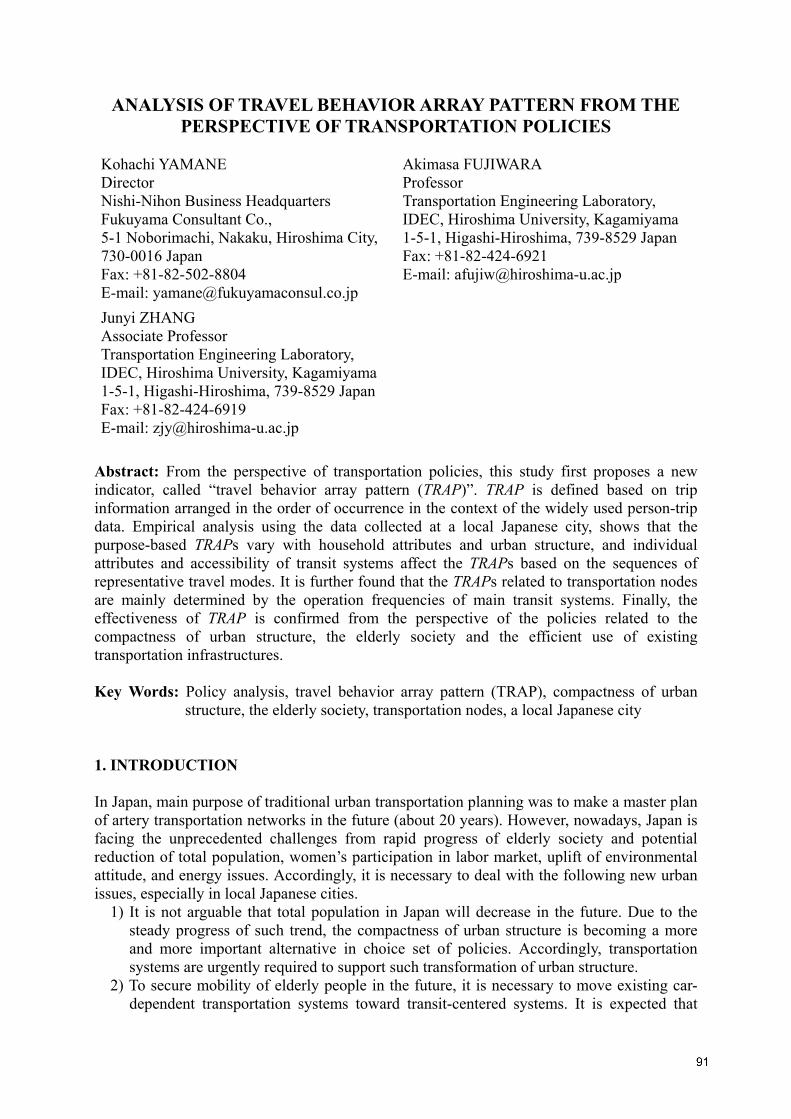
On the other hand, nowadays, since artery transportation networks have been largely improved and socio-economic environments in Japan have also grown maturely, it becomes necessary to shift transportation policies toward efficient use of existing infrastructures (e.g., transportation demand management) from the perspectives of tackling new policy challenges, such as environmental and energy issues at global level, and mobility issues of elderly people at local level. To propose and evaluate effective transportation policies that meet such contemporary requirements, the limitations of trip-based approach are obvious because it cannot clarify why travel is derived. For example, trip-based approach cannot evaluate influence of working hour system on travel choice behavior and activity participation before and after work, influence of the preceding activities on current travel mode choice, and influence of time schedules of transit systems on travel mode choice in a whole day. To properly evaluate such change in travel behavior, it is necessary to investigate the inter-dependencies among different activities/trips over the course of a day. Change of travel behavior can be also observed during transformation period from contemporary urban structure to compact structure, which is environmentally friendly. For example, trips might be increased due to the reduced travel time under compact urban structure. In addition, progress of elderly society will affect not only the elderly behaviors themselves, but also the behaviors of other members within the same households. Such behavioral change can also take place due to the improved service levels of transit systems, especially transportation nodes. To properly understand the mechanisms of travel behavior, the activity-based approach was proposed to reflect the fact that travel is a derived demand from activity participation over time and across space (Hagerstrand, 1970; Jones et al, 1983; Jones, 1990). For example, such activity-based survey was already conducted as a supplementary survey at the fourth person-trip survey in Osaka-Kobe-Kyoto metropolitan area in 2000. The survey includes the entire information of individual's activity and travel linkages on three consecutive days and examines the time use patterns on non-workdays (Nishii et al, 2004). Considering that currently, there are still some practical issues related to usability of activity-based approach (e.g., strict requirements of time-space information about travel/activity behavior, and available software), it seems important to propose some other alternative operational approaches by making satisfactory use of existing person-trip data source. Importance of such new alternative approaches is first discussed from the perspective of transportation policies. 2.2 Contemporary Requirements about the Compactness of Urban Structure Compact city was first proposed as a sustainable urban planning concept in Europe to tackle the globally environmental issues. Especially in local Japanese cities, the concept of compact city has been positioned as an indispensable and multi-faceted planning tool to vitalize the activities at city centers, to prevent the breakdown of communities, to mitigate traffic congestion levels and to reduce the commuting trips with long travel time. To this end, promotion of residence in city centers and effective control of development at suburbs are the indispensable alternatives in the choice set of policies. It is expected that compact city will affect travel behavior in the following ways. This is conceptually described in Figures 1 and 2.
1) Residing in city centers can considerably reduce travel time from home to work place. As a result, the available time for performing discretionary activities will increase. Such discretionary activities might include personal hobbies and cultural activities, and the shared activities with household members.
2) Reduction in travel time and distance with respect to long trips might cause the increase in short trips.
3) Reduction in travel time from home to work place might bring about the modal shift
from car to transit systems and/or other slow travel modes such as walk and bicycles. 4) Under current urban structure, traffic flows are mainly concentrating at one direction
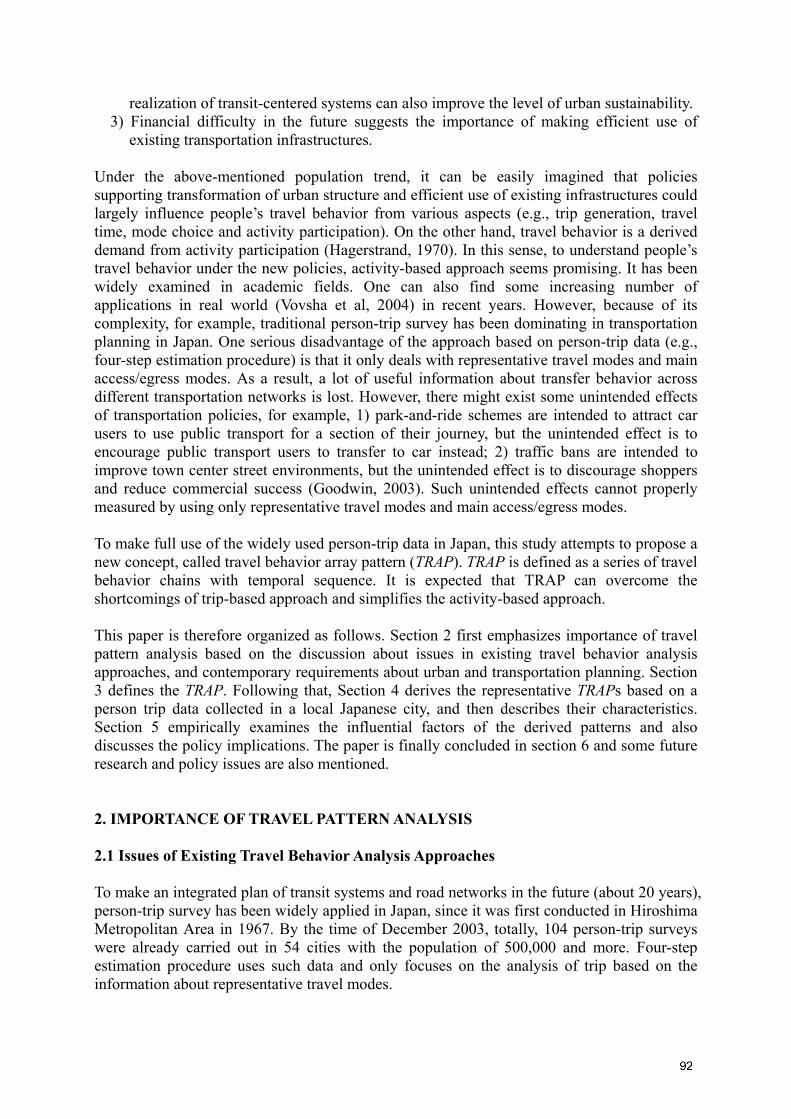
during rush hour in the morning. Such travel pattern might shift to the trips that are made more frequently within short distance at various directions during the evening period. This is a new policy challenge under the compact urban structure (see Figure 2).
a) Travel behavior under current urban structure
To work
To home
Home
Store
SchoolSpace
Time
Cultural salon
Work Place
b) Travel behavior under compact urban structure
Home
Store
School
Space
Cultural salon
To home
Shopping
Deliver/pick-upWork Place
PersonalBusiness
To work
Time
To home
Personal Business
Figure 1. Change of Travel Behavior Under Compact Urban Structure
Time
Space
City center Suburbs
Target time period and area in the plan
Target time period and area in the plan
Time
Space
Target time periodand area in the plan
SuburbsCity
center
Figure 2. Conceptual Description of Urban Transportation Planning Under Compact Structure 2.3 Contemporary Requirements of the Elderly Society The average rate of elderly people in Japan was 17.3% in 2000. This is a high rate even comparing with the one in European and North American countries. The corresponding rates in large Japanese cities (e.g., Tokyo, Osaka and Nagoya) are not so high because of the inflow
a) Current Urban Structure b) Compact Urban Structure
of young people from local cities. In contrast, such rate reaches about 20% in some local cities with the population of about 200,000. Such trend will be further accelerated due to the progress of medical technologies and women’s participation in labor market. This calls for urgent measures taken from not only transportation systems, but also other social systems. Characteristics of the elderly people’s travel behavior can be summarized as follows:
1) Comparing with the non-elderly people, work hours of the elderly people are basically short. It is consequently much more flexible for the elderly people to perform various activities over time and across space.
2) Due to the decline of perceptual and physical abilities, mobility of the elderly people highly relies on either the use of transit systems or the delivering/picking-up by other household members. The frequencies of driving a car by themselves are low, travel distance is also short and travel speed is not high either.
3) For the households with single elderly member or elderly couples, some of trips might not be revealed because of poor access to transportation systems.
4) For the households with both elderly and non-elderly members, the non-elderly members’ activity participation and travel behavior might be different from the one in a household without the elderly members.
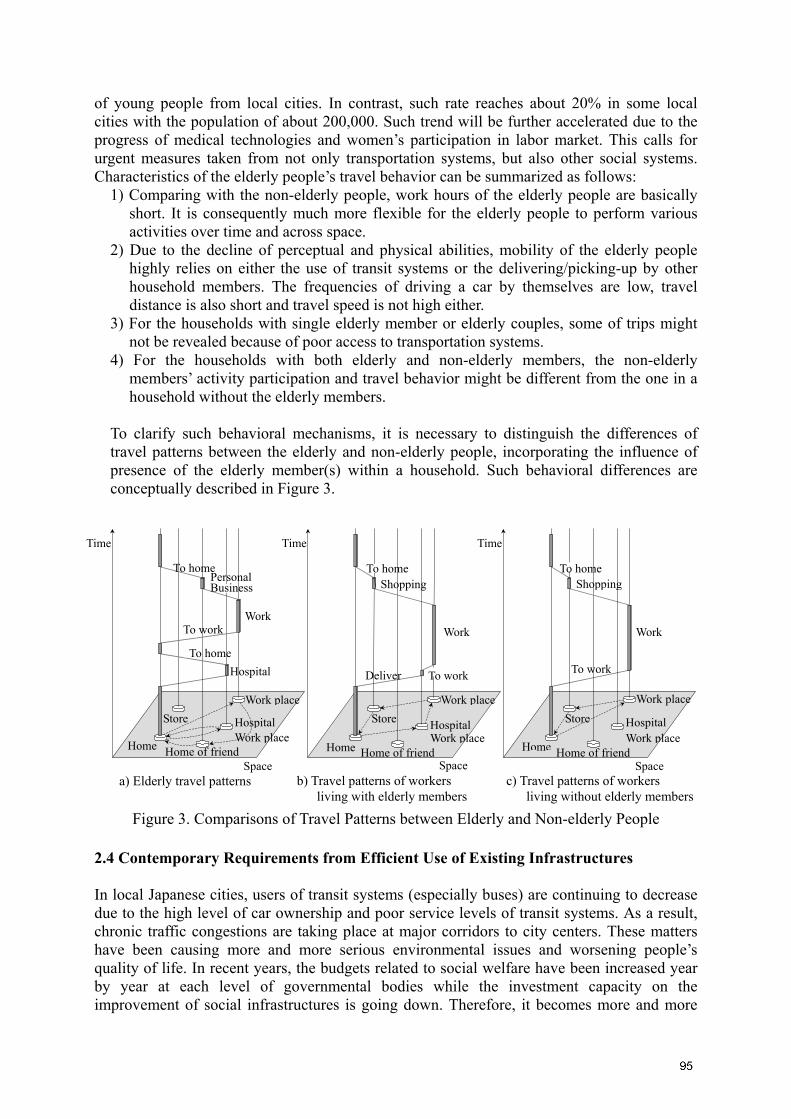
To clarify such behavioral mechanisms, it is necessary to distinguish the differences of travel patterns between the elderly and non-elderly people, incorporating the influence of presence of the elderly member(s) within a household. Such behavioral differences are conceptually described in Figure 3.
Figure 3. Comparisons of Travel Patterns between Elderly and Non-elderly People 2.4 Contemporary Requirements from Efficient Use of Existing Infrastructures In local Japanese cities, users of transit systems (especially buses) are continuing to decrease due to the high level of car ownership and poor service levels of transit systems. As a result, chronic traffic congestions are taking place at major corridors to city centers. These matters have been causing more and more serious environmental issues and worsening people’s quality of life. In recent years, the budgets related to social welfare have been increased year by year at each level of governmental bodies while the investment capacity on the improvement of social infrastructures is going down. Therefore, it becomes more and more
c) Travel patterns of workers living without elderly members
b) Travel patterns of workers living with elderly members
a) Elderly travel patterns
Home
Store
Home of friend Space
Work place
HospitalWork place
To work
To home Shopping
Home
Store
Space
Time
Work place
Hospital Work place
Hospital
To home
To home
To work
Personal Business
Home
Store
Home of friend Space
Work place
HospitalWork place
To work
To home Shopping
Deliver
Time Time
Home of friend
Work Work Work

important to implement “soft-type” countermeasures such as efficient use of existing transit systems and other TDM measures, rather than “hard-type” measures such as the new construction of road networks. In order to encourage the use of transit systems, it is necessary to make clear the issues related to the improvement of transit systems based on the analysis of relationships between service levels and activity participation. Furthermore, improvement of transportation nodes will influence not only the trip-making behavior directly related to the nodes, but also the activity scheduling behavior across the whole day in some cases (see Figure 4). In other words, analysis using traditional trip-based approach might result in the misleading conclusions, suggesting the importance of applying the concept of TRAP.
Space
Bus operation period
Home
Store
Time
Workplace
Bus stop
Bus
Train Walk
BusWalk
Train Bus
Improvement of transfer convenience
Station Station
Space
Bus operation period
Home
Store
Station
Time
Workplace
Station Bus stop
Extension of business hours
Bus
Train Walk
Bus Walk
Train Taxi
a) To adjust business hours of access mode b) To improve transfer convenience
Figure 4. Influence of Improving Transportation Nodes on Travel Behavior
3. DEFINITION OF TRAVEL BEHAVIOR ARRAY PATTERN (TRAP) To make policy decisions and evaluate their effects, it is necessary to understand the mechanisms of travel behavior. However, travel behavior usually includes several interrelated dimensions such as activity generation, choice of travel modes and departure time etc. Accordingly, it is difficult to explain travel behavior from one single aspect. Traditionally, trip-based approach analyzes travel behavior based on the following four steps: trip generation/attraction, distribution, modal split and assignment. Such four-step models are established based on only representative travel modes and main access/egress modes, and consequently ignore a lot of information about transfer behavior and sequential dependencies among different choice dimensions. Therefore, trip-based approach cannot satisfactorily meet the requirements from transformation of urban structure, change of population structure, and efficient use of existing infrastructures. At the same time, it is also clear that information included in the person-trip data has not been fully used. The aforementioned behavioral considerations and policy requirements suggest that it is necessary to simultaneously deal with various travel behavior aspects (e.g., trip generation, purpose, travel mode choice and time period) included in the person-trip data as a whole. On the other hand, it is well recognized that activity participation determines travel behavior and
at the same time activity decisions are clearly influenced by available time and monetary constraints, capability constraint (physical constraints: e.g., minimum number of hours to sleep and eat and maximum travel speed), coupling constraint (e.g., schedule of co-workers influences the scheduling of a joint meeting), authority constraint (e.g., the opening hours of stores) and so on (Arentze and Timmermans, 2000). Especially, activity-scheduling behavior generally imposes strict timing and sequential constraints on some activities and trips, and consequently these activities and trips might be only performed at the designated time periods and places (Zhang et al, 2005). These matters suggest that the resultant trip sequence over the course of a day, which information is available in person-trip data, does not take place by chance, but seems inevitable to some extent. Thus, even though there is no detailed information about activity decisions in the person-trip data, it might be possible to make use of trip sequence information to indirectly reflect the influence of activity decisions. To this end, this study proposes a new concept, i.e., travel behavior array pattern (TRAP). TRAP is a travel pattern defined based on trip information arranged in the order of occurrence in the context of person-trip data. Person-trip data is usually collected by asking respondents to report their trip-making behaviors in the course of a designated day, including origins and destinations, trip purposes, travel modes, departure and arrival times, transfer stations and/or bus stops, parking places and fares etc. All these information and/or their combinations could be used to derive the TRAPs. Since TRAP is defined based on the widely applied person-trip data, it does not need additional information and does not rely on complicated models either. TRAP is also suitable to data-mining analysis in transportation and it can be used to find out not only the average behavior patterns, but also some representative/distinctive patterns. Therefore, the derived TRAPs might be used as a new analysis tool to overcome not only the shortcomings of trip-based approach, but also the complexity of activity-based approach. Based on the above consideration, this paper attempts to represent the proposed TRAP from the following three aspects: compactness of urban structure, elderly society and efficient use of existing transportation infrastructures.
1) Purpose-based TRAP: it is defined based on the sequential combinations of trip purposes, the corresponding activity durations and frequencies etc, and will be used to conduct the analysis about compactness of urban structure.
2) Mode-based TRAP: it is defined using the sequential information about choices of different travel modes, such as mode chaining and departure time etc. It is useful to analyze the behavioral change under the elderly society.
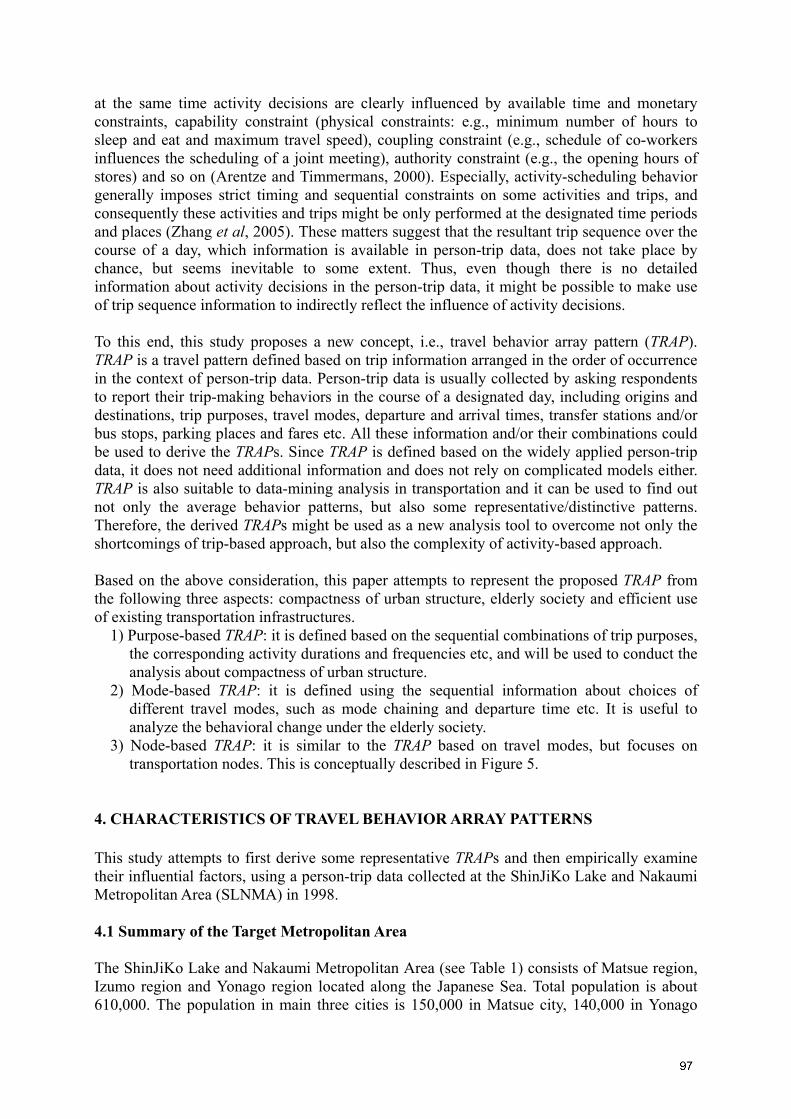
3) Node-based TRAP: it is similar to the TRAP based on travel modes, but focuses on transportation nodes. This is conceptually described in Figure 5.
4. CHARACTERISTICS OF TRAVEL BEHAVIOR ARRAY PATTERNS This study attempts to first derive some representative TRAPs and then empirically examine their influential factors, using a person-trip data collected at the ShinJiKo Lake and Nakaumi Metropolitan Area (SLNMA) in 1998. 4.1 Summary of the Target Metropolitan Area The ShinJiKo Lake and Nakaumi Metropolitan Area (see Table 1) consists of Matsue region, Izumo region and Yonago region located along the Japanese Sea. Total population is about 610,000. The population in main three cities is 150,000 in Matsue city, 140,000 in Yonago
city and 90,000 in Izumo city. The rate of elderly people reaches 20.5% at the metropolitan area, three points higher than the average rate in Japan.
Cultural school
Daily activities
Walk
Bus
Train
TRAP
To workplace
Home
Store
Child’s school
Space
Time
Workplac
To home Shopping
To home
Deliver& Pickup
Personal business
Node- basedSpace
Bus operation period
Home
Store
Station
WorkplaceStation
Bus
Train Walk
Improvement of transfer convenience
Behavior at transportation nodes
To homeShopping
PersonalBusiness
Toworkplace
To home
Purpose-based
TrainCarCar
Mode-based
Bus
Train
WalkBus
<TRAP>
PersonalBusiness
Walking
Walking
Walking
Bus
Train
Walking
Train
BusWaiting time
Waiting time
Waiting time
Waiting time
Time
TRAP TRAP
Figure 5. Conceptual Descriptions of Node-based TRAP
2.51
2.40
2.56
16.0 7.0 25.0 10.0 42.0
14.8 6.8 26.7 11.5 40.1
16.0 7.0 19.4 19.2 38.4
To school
To workplace
Personal Business
Work To home
18.9
2.8
31.4 22.3 24.5
25.5
2.4
33.1 16.7 21.3
1.3
1.4
67.4 14.2 15.6
TrainBus Car Two-wheeler
walking
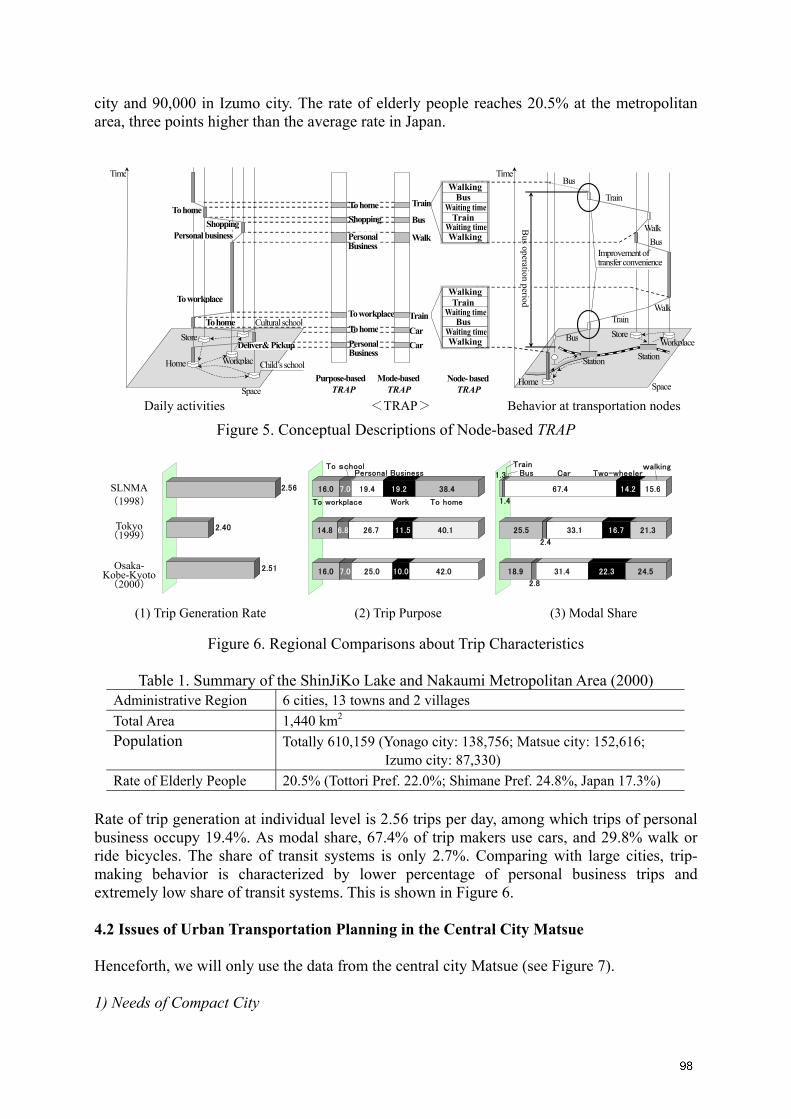
Figure 6. Regional Comparisons about Trip Characteristics
Table 1. Summary of the ShinJiKo Lake and Nakaumi Metropolitan Area (2000) Administrative Region 6 cities, 13 towns and 2 villages Total Area 1,440 km2 Population Totally 610,159 (Yonago city: 138,756; Matsue city: 152,616;
Izumo city: 87,330) Rate of Elderly People 20.5% (Tottori Pref. 22.0%; Shimane Pref. 24.8%, Japan 17.3%)
Rate of trip generation at individual level is 2.56 trips per day, among which trips of personal business occupy 19.4%. As modal share, 67.4% of trip makers use cars, and 29.8% walk or ride bicycles. The share of transit systems is only 2.7%. Comparing with large cities, trip-making behavior is characterized by lower percentage of personal business trips and extremely low share of transit systems. This is shown in Figure 6. 4.2 Issues of Urban Transportation Planning in the Central City Matsue Henceforth, we will only use the data from the central city Matsue (see Figure 7). 1) Needs of Compact City
(1) Trip Generation Rate (2) Trip Purpose (3) Modal Share
SLNMA (1998)
Osaka-
Kobe-Kyoto (2000)
Tokyo
(1999)
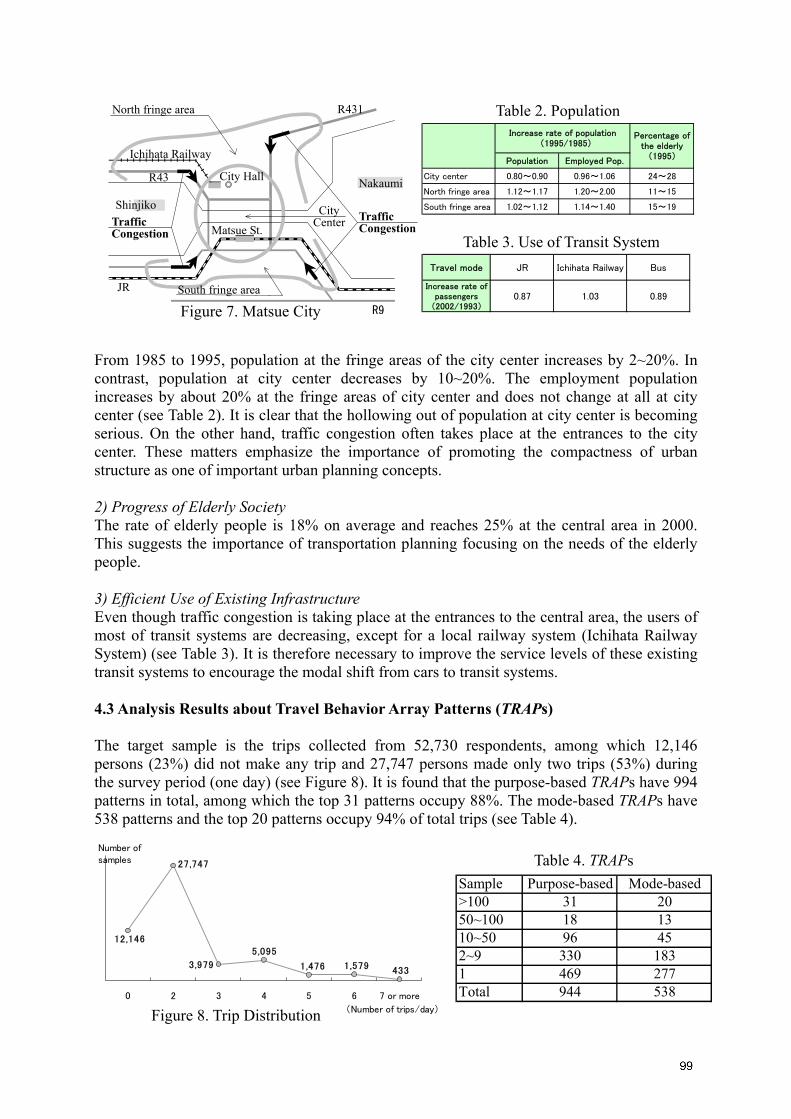
From 1985 to 1995, population at the fringe areas of the city center increases by 2~20%. In contrast, population at city center decreases by 10~20%. The employment population increases by about 20% at the fringe areas of city center and does not change at all at city center (see Table 2). It is clear that the hollowing out of population at city center is becoming serious. On the other hand, traffic congestion often takes place at the entrances to the city center. These matters emphasize the importance of promoting the compactness of urban structure as one of important urban planning concepts. 2) Progress of Elderly Society The rate of elderly people is 18% on average and reaches 25% at the central area in 2000. This suggests the importance of transportation planning focusing on the needs of the elderly people. 3) Efficient Use of Existing Infrastructure Even though traffic congestion is taking place at the entrances to the central area, the users of most of transit systems are decreasing, except for a local railway system (Ichihata Railway System) (see Table 3). It is therefore necessary to improve the service levels of these existing transit systems to encourage the modal shift from cars to transit systems. 4.3 Analysis Results about Travel Behavior Array Patterns (TRAPs) The target sample is the trips collected from 52,730 respondents, among which 12,146 persons (23%) did not make any trip and 27,747 persons made only two trips (53%) during the survey period (one day) (see Figure 8). It is found that the purpose-based TRAPs have 994 patterns in total, among which the top 31 patterns occupy 88%. The mode-based TRAPs have 538 patterns and the top 20 patterns occupy 94% of total trips (see Table 4).
Table 4. TRAPs
Figure 8. Trip Distribution
4331,5791,476
5,095
3,979
27,747
12,146
0 2 3 4 5 6 7 or more
(Number of trips/day)
Number ofsamples
Sample Purpose-based Mode-based>100 31 2050~100 18 1310~50 96 452~9 330 1831 469 277Total 944 538
Table 2. Population
Table 3. Use of Transit System
Traffic Congestion
Nakaumi
Ichihata Railway
JR
Shinjiko
Matsue St.
R9
R43
R431
City Hall
Traffic Congestion
South fringe area
North fringe area
CityCenter
Figure 7. Matsue City
Population Employed Pop.
City center 0.80~0.90 0.96~1.06 24~28
North fringe area 1.12~1.17 1.20~2.00 11~15
South fringe area 1.02~1.12 1.14~1.40 15~19
Increase rate of population (1995/1985)
Percentage ofthe elderly
(1995)
Travel mode JR Ichihata Railway Bus
Increase rate ofpassengers
(2002/1993)0.87 1.03 0.89
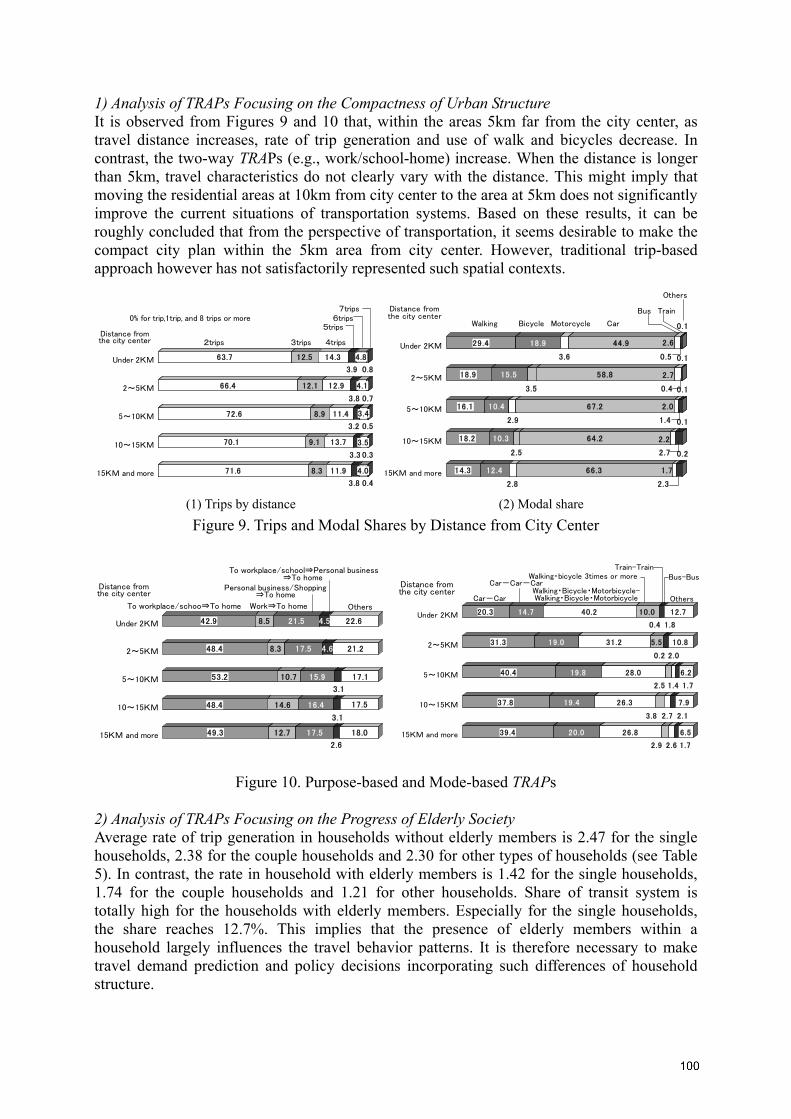
1) Analysis of TRAPs Focusing on the Compactness of Urban Structure It is observed from Figures 9 and 10 that, within the areas 5km far from the city center, as travel distance increases, rate of trip generation and use of walk and bicycles decrease. In contrast, the two-way TRAPs (e.g., work/school-home) increase. When the distance is longer than 5km, travel characteristics do not clearly vary with the distance. This might imply that moving the residential areas at 10km from city center to the area at 5km does not significantly improve the current situations of transportation systems. Based on these results, it can be roughly concluded that from the perspective of transportation, it seems desirable to make the compact city plan within the 5km area from city center. However, traditional trip-based approach however has not satisfactorily represented such spatial contexts.
Figure 9. Trips and Modal Shares by Distance from City Center
Figure 10. Purpose-based and Mode-based TRAPs 2) Analysis of TRAPs Focusing on the Progress of Elderly Society Average rate of trip generation in households without elderly members is 2.47 for the single households, 2.38 for the couple households and 2.30 for other types of households (see Table 5). In contrast, the rate in household with elderly members is 1.42 for the single households, 1.74 for the couple households and 1.21 for other households. Share of transit system is totally high for the households with elderly members. Especially for the single households, the share reaches 12.7%. This implies that the presence of elderly members within a household largely influences the travel behavior patterns. It is therefore necessary to make travel demand prediction and policy decisions incorporating such differences of household structure.
(1) Trips by distance (2) Modal share
71.6 8.3 11.9
3.8
4.0
0.4
70.1 9.1 13.7
3.3
3.5
0.3
72.6 8.9 11.4
3.2
3.4
0.5
66.4 12.1 12.9
3.8
4.1
0.7
63.7 12.5 14.3
3.9
4.8
0.8Under 2KM
2~5KM
5~10KM
10~15KM
15KM and more
Distance from3trips
7trips
5trips
2trips
0% for trip,1trip, and 8 trips or more
4tripsthe city center
6trips
14.3 12.4
2.8
66.3 1.7
2.3
0.2
18.2 10.3
2.5
64.2 2.2
2.7
0.1
16.1 10.4
2.9
67.2 2.0
1.4
0.1
18.9 15.5
3.5
58.8 2.7
0.4
0.1
29.4 18.9
3.6
44.9 2.6
0.5
0.1
Under 2KM
2~5KM
5~10KM
10~15KM
15KM and more
Walking
Others
Train
Bicycle Motorcycle Car
BusDistance fromthe city center
49.3 12.7 17.5
2.6
18.0
48.4 14.6 16.4
3.1
17.5
53.2 10.7 15.9
3.1
17.1
48.4 8.3 17.5 4.6 21.2
42.9 8.5 21.5 4.5 22.6Under 2KM
2~5KM
5~10KM
10~15KM
15KM and more
To workplace/schoo⇒To home Work⇒To home Others
Distance fromthe city center ⇒To home
Personal business/Shopping
To workplace/school⇒Personal business⇒To home
39.4 20.0 26.8
2.9 2.6 1.7
6.5
37.8 19.4 26.3
3.8 2.7 2.1
7.9
40.4 19.8 28.0
2.5 1.4 1.7
6.2
31.3 19.0 31.2 5.5
0.2 2.0
10.8
20.3 14.7 40.2 10.0
0.4 1.8
12.7Under 2KM
2~5KM
5~10KM
10~15KM
15KM and more
Car-Car
Car-Car-CarWalking・bicycle 3times or more
Train-Train
Others
Bus-BusDistance fromthe city center Walking・Bicycle・Motorbicycle-
Walking・Bicycle・Motorbicycle

Table 5. Travel Behavior Patterns and Household Type (1) Rate of trip generation (Trips/day) (2) Share of transit system (%)
Average Single HH. Couple HH. Other HH. Average Single HH. Couple HH. Other HH.Householdwithout the 2.33 2.47 2.38 2.30 Household
without the 3.10 3.40 3.80 2.90
Household withthe elderly 1.45 1.42 1.74 1.21 Household with
the elderly 6.50 12.70 5.70 4.50
Figure 11 shows the differences of the derived TRAPs according to difference household structures. For the households with only elderly members, the percentage of purpose-based TRAPs with personal business to home is more than 50%, and the share of mode-based TRAPs with the combinations of walk, bicycle and transit system are high at the level of 45%. On the other hand, for the households living with elderly members, the share of personal business-home TRAPs is clearly higher than the households without elderly members, and the mode-based TRAPs mainly depend on car traffic. This might be caused by the fact that within this kind of households, other members need to deliver and/or pick up the elderly members. Traditional trip-based analysis only describes such differences caused by the progress of elderly society, at best by segmenting the population by age. The household structure has not been satisfactorily reflected in the analysis.
Figure 11. Purpose-based TRAP and Mode-based TRAP by Household Type
3) Analysis of TRAPs Focusing on Efficient Use of Existing Infrastructures Here, analysis is conducted with respect to only transfer trips related to railway system (Figure 12). Main access modes are walk, bicycle and car and main egress modes are walk, bicycle and bus. Egress travel time is slightly longer than the access time. In addition, it is found that among 35% of TRAPs, access and egress travel times exceed 30% of total travel time. This suggests the potential issues of these access and egress systems. Especially, access bus travel time is about 31 minutes on average. This is considerably longer than the egress bus travel time and access car travel time. This might be caused by the low driving speed of buses and longer waiting time at railway station due to the gap between bus and railway timetable. As for mode choice models with access/egress travel modes, nested logit model has been mainly adopted. However, when access and egress systems become complex, only main access/egress modes are usually selected. This loses a lot of information about actual resistance of using transit system. TRAP related to transportation nodes can overcome this shortcoming. 5. INFLUENTIAL FACTORS OF TRAVEL BEHAVIOR ARRAY PATTERNS The factors shown in Table 6 are used to explain the derived TRAPs, including individual attributes and household attributes, urban structure and service levels of transit systems.
(1) Purpose-based TRAP (2) Mode-based TRAP
21.0 15.3 35.4 10.8
0.6 3.6
13.3
36.6 19.6 28.8
3.4 2.1 2.1
7.5
34.5 18.7 30.2 4.9
1.1 1.6
9.1Household withoutthe elderly
Household with theelderly
Household with onlythe elderly
Car-Car Car-Car-Car
Train-Train
Others
Bus-Bus
Walking・bicycle・Two-wheelerWalking・bicycle・Two-wheeler-
Walking・bicycle,3times or more
5.2 12.3 53.7
0.2
28.7
47.8 13.4 18.6
2.7
17.6
54.0 9.2 13.0 4.5 19.3Household withoutthe elderly
Household with theelderly
Household with onlythe elderly
To workplace/school⇒To home OthersWork⇒To home
Personal business/Shopping⇒To home
To workplace/school⇒Personal business⇒To home
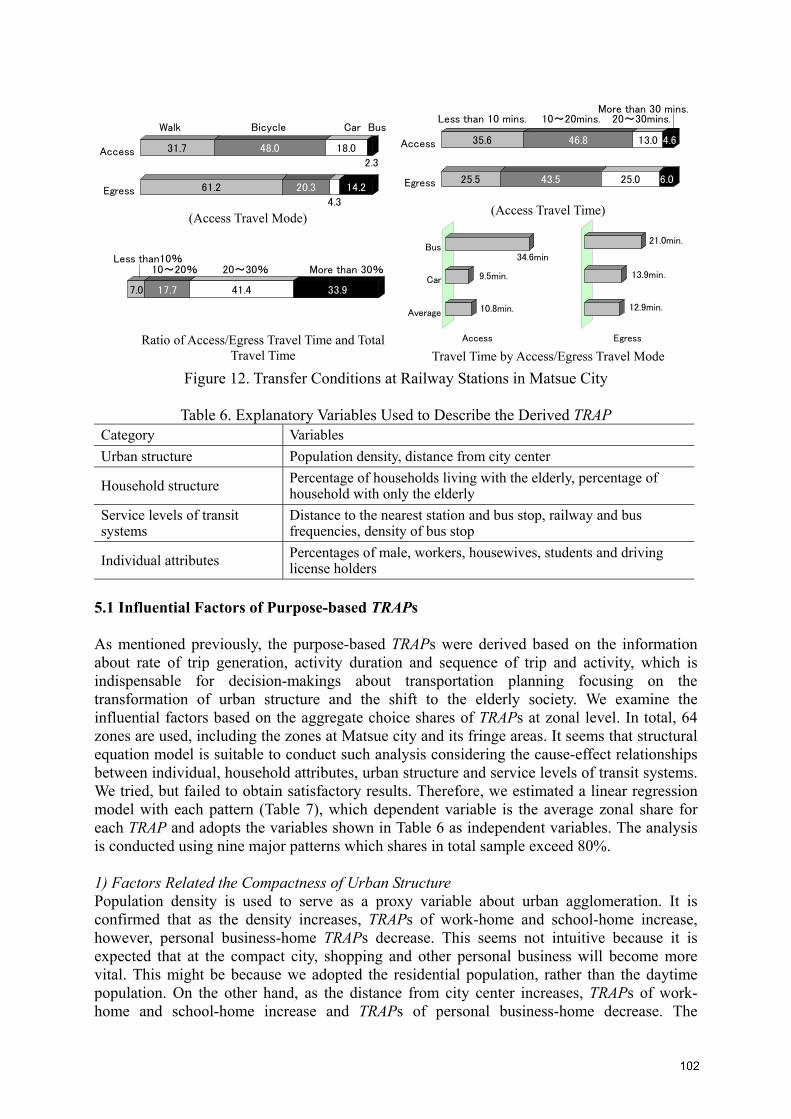
Figure 12. Transfer Conditions at Railway Stations in Matsue City
Table 6. Explanatory Variables Used to Describe the Derived TRAP Category Variables Urban structure Population density, distance from city center
Household structure Percentage of households living with the elderly, percentage of household with only the elderly
Service levels of transit systems
Distance to the nearest station and bus stop, railway and bus frequencies, density of bus stop
Individual attributes Percentages of male, workers, housewives, students and driving license holders
5.1 Influential Factors of Purpose-based TRAPs As mentioned previously, the purpose-based TRAPs were derived based on the information about rate of trip generation, activity duration and sequence of trip and activity, which is indispensable for decision-makings about transportation planning focusing on the transformation of urban structure and the shift to the elderly society. We examine the influential factors based on the aggregate choice shares of TRAPs at zonal level. In total, 64 zones are used, including the zones at Matsue city and its fringe areas. It seems that structural equation model is suitable to conduct such analysis considering the cause-effect relationships between individual, household attributes, urban structure and service levels of transit systems. We tried, but failed to obtain satisfactory results. Therefore, we estimated a linear regression model with each pattern (Table 7), which dependent variable is the average zonal share for each TRAP and adopts the variables shown in Table 6 as independent variables. The analysis is conducted using nine major patterns which shares in total sample exceed 80%. 1) Factors Related the Compactness of Urban Structure Population density is used to serve as a proxy variable about urban agglomeration. It is confirmed that as the density increases, TRAPs of work-home and school-home increase, however, personal business-home TRAPs decrease. This seems not intuitive because it is expected that at the compact city, shopping and other personal business will become more vital. This might be because we adopted the residential population, rather than the daytime population. On the other hand, as the distance from city center increases, TRAPs of work-home and school-home increase and TRAPs of personal business-home decrease. The
Bus
Car
Average
Access
34.6min
9.5min.
10.8min.
Bus
Car
Average
Egress
13.9min.
12.9min.
21.0min.
(Access Travel Mode)
Ratio of Access/Egress Travel Time and Total Travel Time
(Access Travel Time)
Travel Time by Access/Egress Travel Mode
7.0 17.7 41.4 33.9
Less than10%10~20% 20~30% More than 30%
61.2 20.3
4.3
14.2
31.7 48.0 18.0
2.3Access
Egress
Walk Bicycle Car Bus
25.5 43.5 25.0 6.0
35.6 46.8 13.0 4.6Access
Egress
Less than 10 mins. 20~30mins.More than 30 mins.
10~20mins.

statistical significance is also high. This implies that the adopted distance variable is suitable to the travel behavior caused by the compactness of urban structure.
Table 7. Regression Analysis Results for the Derived TRAPs
Explanatory variables To workplace⇒To home
To school⇒To home
Personalbusiness⇒To home
Shopping⇒To home
Work⇒To home
To workplace⇒Shopping
⇒To home
To workplace⇒Work
⇒To home
To school⇒To home,
Personal business⇒To home
Personalbusiness・Work・
To home
-4.081 0.002 0.224 -0.129 0.280 0.238 0.043 -0.022 0.198(-6.095) (0.039) (5.549) (-2.462) (4.378) (8.163) (1.061) (-1.046) (6.428)-0.166 0.006 0.073 -0.074 0.155 0.009 -0.013 0.000 -0.006
(-9.031) (0.571) (7.754) (-6.044) (10.439) (1.262) (-1.425) (-0.071) (-0.828)0.339 -0.278 -0.170 -0.095 0.258 0.039 0.048 -0.024 -0.053
(6.608) (-9.722) (-6.496) (-2.773) (6.207) (2.052) (1.822) (-1.760) (-2.672)-0.049 -0.371 -0.075 0.014 0.319 -0.061 -0.135 0.036 -0.095
(-0.527) (-7.124) (-1.572) (0.222) (4.208) (-1.777) (-2.806) (1.444) (-2.612)0.489 0.456 -0.057 -0.162 -0.149 -0.201 -0.024 0.013 0.056
(4.551) (7.620) (-1.034) (-2.263) (-1.713) (-5.077) (-0.439) (0.460) (1.325)0.007 -0.004 0.002 0.003 -0.004 -0.003 0.001 0.000 0.001
(5.796) (-5.960) (3.822) (3.506) (-4.346) (-6.026) (1.334) (-0.802) (1.962)0.235 -0.091 0.034 -0.052 -0.228 -0.031 0.070 0.004 0.035
(4.044) (-2.803) (1.160) (-1.343) (-4.827) (-1.447) (2.349) (0.250) (1.561)0.230 0.183 0.019 -0.206 0.263 0.052 -0.142 -0.086 0.055
(1.960) (2.808) (0.317) (-2.644) (2.766) (1.194) (-2.355) (-2.716) (1.200)0.001 0.000 0.000 0.000 0.000 0.000 0.000 0.000 0.000
(3.005) (2.637) (-3.289) (-0.028) (-0.770) (0.396) (-1.139) (-0.312) (1.449)0.002 0.001 -0.001 0.001 0.001 -0.001 -0.001 0.000 0.000
(3.061) (1.802) (-4.009) (1.949) (1.831) (-3.554) (-2.950) (-1.000) (0.171)0.006 0.002 -0.002 0.010 0.005 -0.006 -0.003 -0.003 0.002
(1.068) (0.751) (-0.747) (2.516) (1.067) (-3.041) (-1.112) (-1.890) (1.021)0.002 -0.001 -0.001 -0.002 0.003 -0.001 -0.001 0.001 0.001
(1.028) (0.927) (-1.317) (-1.889) (2.009) (-0.985) (-1.420) (1.222) (0.988)0.000 -0.001 0.000 0.001 0.001 0.000 0.000 0.000 0.000
(-0.369) (-1.838) (0.009) (1.089) (1.054) (-0.966) (-1.023) (-0.706) (-0.758)Bus frequency 0.005 -0.005 0.003 0.004 0.000 -0.003 -0.004 0.001 -0.003(times/day) (1.560) (-2.815) (1.894) (1.746) (0.130) (-2.213) (-2.560) (1.688) (-2.155)
-0.005 -0.294 -0.121 -0.015 0.022 -0.117 0.111 -0.031 0.098(-0.061) (-5.925) (-2.667) (-0.255) (0.303) (-3.552) (2.418) (-1.301) (2.813)
Density of bus stops(/ha)
Distance to the nearest busstop (km)
Distance to the nearest trainstation(km)
Train frequency(times/day)
Distance to city center (km)
Percenatge of housewives
Percenatge of students
Average age
Percenatge of driver's licenseholders
Percenatge of work force
Percenatge of male
Population density(persons/ha)
percentage of household withonly the elderly
Percentage of householdsliving with the elderly
2) Factors Related to the Elderly Society The increase in the number of households with elderly members results in the decrease of TRAPs of work-home, shopping-home and the increase of TRAPs of personal business-home, business-home, and personal business/shopping-home. Under the progress of the elderly society, the employment rate will fall and time spent for discretionary activities will increase, time attending hospitals will also increase. Considering these matters, the estimation results are logical. The increase of business-home TRAPs might be caused by the fact that the self-employed and peasant rates are high. As a whole, most of the relevant variables are statistically significant. 3) Factors Related to Service Level of Transit Systems Comparing with railway systems, service levels of buses significantly influences the choices of most TRAPs, except for work-home, and business-home. Railway systems only affect the TRAPs of school-home, shopping-home and business-home. 4) Influences of Individual Attributes The positive influence of individual attributes on the TRAP choice is observed with respect to worker and students. The increase in shopping-home TRAPs and decrease in personal-shopping TRAPs suggests that the housewives mainly perform the allocated shopping activities rather than personal business. This reflects the actual activity patterns. The increase of license holders leads to the increase of work-home, work-busines-home TRAPs. This is consistent with the observation that most of workers have driving licenses.
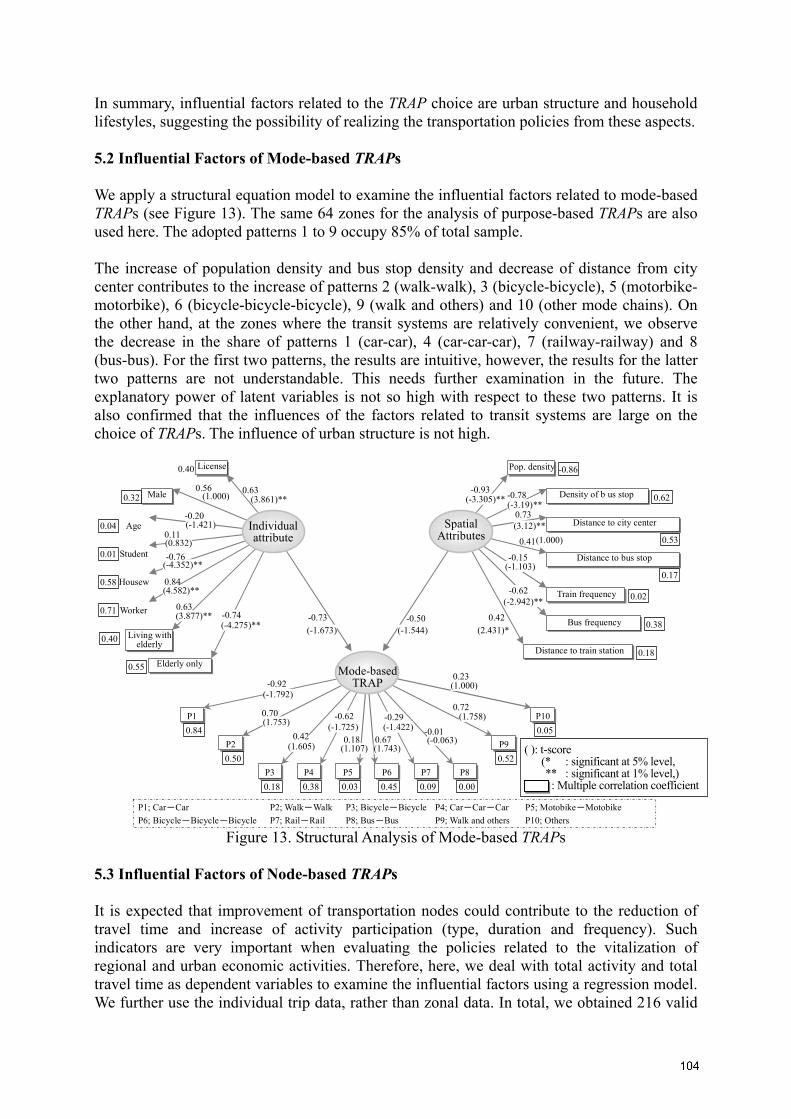
In summary, influential factors related to the TRAP choice are urban structure and household lifestyles, suggesting the possibility of realizing the transportation policies from these aspects. 5.2 Influential Factors of Mode-based TRAPs We apply a structural equation model to examine the influential factors related to mode-based TRAPs (see Figure 13). The same 64 zones for the analysis of purpose-based TRAPs are also used here. The adopted patterns 1 to 9 occupy 85% of total sample. The increase of population density and bus stop density and decrease of distance from city center contributes to the increase of patterns 2 (walk-walk), 3 (bicycle-bicycle), 5 (motorbike-motorbike), 6 (bicycle-bicycle-bicycle), 9 (walk and others) and 10 (other mode chains). On the other hand, at the zones where the transit systems are relatively convenient, we observe the decrease in the share of patterns 1 (car-car), 4 (car-car-car), 7 (railway-railway) and 8 (bus-bus). For the first two patterns, the results are intuitive, however, the results for the latter two patterns are not understandable. This needs further examination in the future. The explanatory power of latent variables is not so high with respect to these two patterns. It is also confirmed that the influences of the factors related to transit systems are large on the choice of TRAPs. The influence of urban structure is not high.
Male
Age
Student
Housew
Worker
Elderly only
P1
P2
P3 P4 P5 P6 P7 P8
P9
P10
Mode-based TRAP
0.84
0.50
0.18 0.38 0.03 0.45 0.09 0.00
0.52
0.05
License
Living with elderly
0.40
0.32
0.04
0.01
0.58
0.71
0.40
0.55
Pop. density
Density of b us stop
Distance to city center
Distance to bus stop
Train frequency
Bus frequency
Distance to train station
Individual attribute
Spatial Attributes
-0.86
0.62
0.53
0.17
0.02
0.38
0.18
P1; Car-Car P6; Bicycle-Bicycle-Bicycle
P2; Walk-WalkP7; Rail-Rail
P3; Bicycle-BicycleP8; Bus-Bus
P4; Car-Car-CarP9; Walk and others
P5; Motobike-Motobike P10; Others
(3.861)** (1.000)
(-1.421)
(0.832)
(-4.352)**
(4.582)**
(3.877)** (-4.275)** (-1.673)
(-1.792)
(1.753)
(1.605)
(-1.725)
(1.107) (1.743)
(-1.422)
(-1.544)
(-0.063)
(1.758)
(1.000)
(2.431)*
(-2.942)**
(-1.103)
(1.000) (3.12)**
(-3.19)**(-3.305)**
-0.92
0.70
0.42
-0.62
0.18 0.67
-0.29-0.01
0.63 0.56
-0.76
0.84
0.63 -0.74 -0.73 -0.50
0.73
0.41
-0.15
-0.62
0.42
-0.20
0.11
0.72
0.23
-0.78-0.93
Figure 13. Structural Analysis of Mode-based TRAPs
5.3 Influential Factors of Node-based TRAPs It is expected that improvement of transportation nodes could contribute to the reduction of travel time and increase of activity participation (type, duration and frequency). Such indicators are very important when evaluating the policies related to the vitalization of regional and urban economic activities. Therefore, here, we deal with total activity and total travel time as dependent variables to examine the influential factors using a regression model. We further use the individual trip data, rather than zonal data. In total, we obtained 216 valid
( ): t-score (* : significant at 5% level,
** : significant at 1% level,) : Multiple correlation coefficient
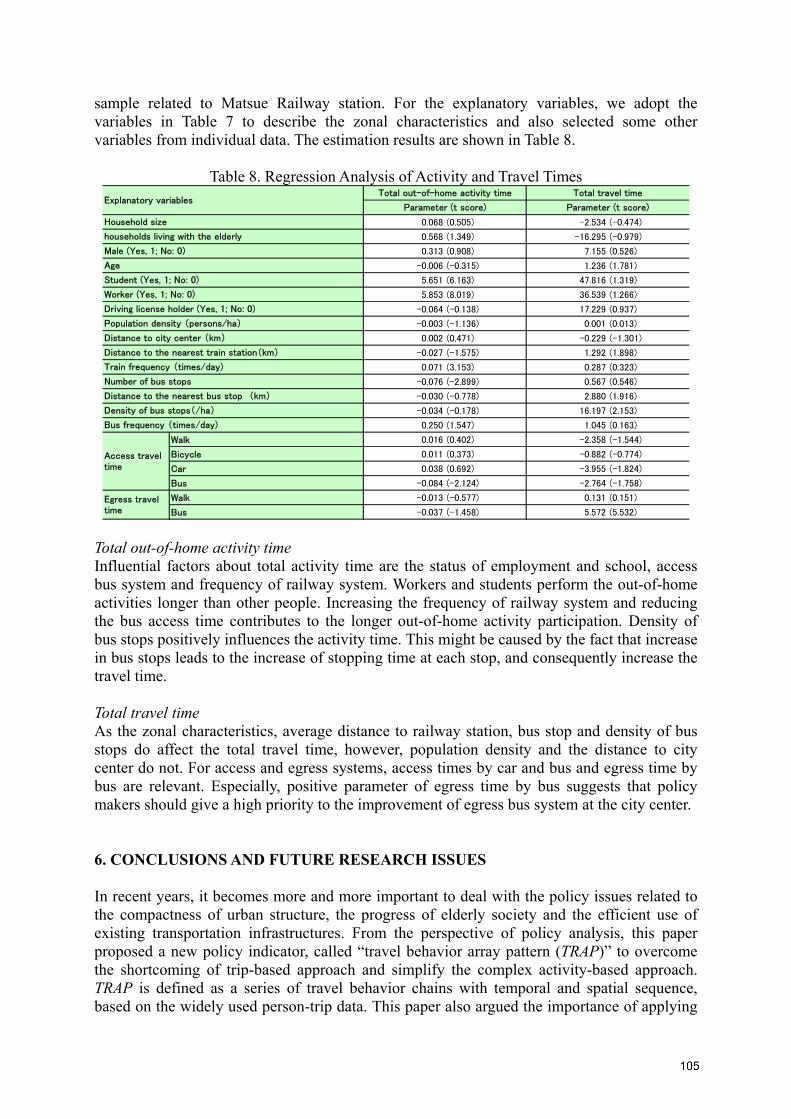
sample related to Matsue Railway station. For the explanatory variables, we adopt the variables in Table 7 to describe the zonal characteristics and also selected some other variables from individual data. The estimation results are shown in Table 8.
Table 8. Regression Analysis of Activity and Travel Times
0.068 (0.505) -2.534 (-0.474)
0.568 (1.349) -16.295 (-0.979)
0.313 (0.908) 7.155 (0.526)
-0.006 (-0.315) 1.236 (1.781)
5.651 (6.163) 47.816 (1.319)
5.853 (8.019) 36.539 (1.266)
-0.064 (-0.138) 17.229 (0.937)
-0.003 (-1.136) 0.001 (0.013)
0.002 (0.471) -0.229 (-1.301)
-0.027 (-1.575) 1.292 (1.898)
0.071 (3.153) 0.287 (0.323)
-0.076 (-2.899) 0.567 (0.546)
-0.030 (-0.778) 2.880 (1.916)
-0.034 (-0.178) 16.197 (2.153)
0.250 (1.547) 1.045 (0.163)
Walk 0.016 (0.402) -2.358 (-1.544)
Bicycle 0.011 (0.373) -0.882 (-0.774)
Car 0.038 (0.692) -3.955 (-1.824)
Bus -0.084 (-2.124) -2.764 (-1.758)
Walk -0.013 (-0.577) 0.131 (0.151)
Bus -0.037 (-1.458) 5.572 (5.532)
Parameter (t score) Parameter (t score)
Driving license holder (Yes, 1; No: 0)
Bus frequency (times/day)
Explanatory variables
Train frequency (times/day)
Access traveltime
Worker (Yes, 1; No: 0)
Population density (persons/ha)
Distance to city center (km)
Distance to the nearest train station(km)
Density of bus stops(/ha)
Egress traveltime
Total out-of-home activity time Total travel time
Number of bus stops
Distance to the nearest bus stop (km)
Household size
households living with the elderly
Male (Yes, 1; No: 0)
Age
Student (Yes, 1; No: 0)
Total out-of-home activity time Influential factors about total activity time are the status of employment and school, access bus system and frequency of railway system. Workers and students perform the out-of-home activities longer than other people. Increasing the frequency of railway system and reducing the bus access time contributes to the longer out-of-home activity participation. Density of bus stops positively influences the activity time. This might be caused by the fact that increase in bus stops leads to the increase of stopping time at each stop, and consequently increase the travel time. Total travel time As the zonal characteristics, average distance to railway station, bus stop and density of bus stops do affect the total travel time, however, population density and the distance to city center do not. For access and egress systems, access times by car and bus and egress time by bus are relevant. Especially, positive parameter of egress time by bus suggests that policy makers should give a high priority to the improvement of egress bus system at the city center. 6. CONCLUSIONS AND FUTURE RESEARCH ISSUES In recent years, it becomes more and more important to deal with the policy issues related to the compactness of urban structure, the progress of elderly society and the efficient use of existing transportation infrastructures. From the perspective of policy analysis, this paper proposed a new policy indicator, called “travel behavior array pattern (TRAP)” to overcome the shortcoming of trip-based approach and simplify the complex activity-based approach. TRAP is defined as a series of travel behavior chains with temporal and spatial sequence, based on the widely used person-trip data. This paper also argued the importance of applying
the concept of TRAP to deal with contemporary urban planning issues, from both behavioral aspects and policy perspective. A case study based on a person trip data collected in a local Japanese city was conducted. Empirically analysis showed that the purpose-based TRAPs vary with household lifestyles (especially the presence of elderly members) and urban structure, individual attributes and the accessibility of transit systems affect the TRAPs based on the chains of representative travel modes. It was further found that the TRAPs related to transportation nodes are mainly determined by the operation frequencies of main transportation systems. Finally, the effectiveness of TRAP is confirmed from the perspective of the policies related to the compactness of urban structure, the elderly society and the efficient use of existing transportation infrastructures. However, this study only examined the concept of TRAPs based on purpose array, and array of representative travel modes with sequence. To make effective policy decisions, one needs to understand if people’s behavior will be influenced by the new policies, what kinds of trip makers will respond to the new policies and how their behavior will change under the new policies. Therefore, it is necessary to further incorporate the information about activity duration for the detailed episodes, timing, and activity frequency and so on over time and across space in the future.
REFERENCES a) Books and Books chapters
Arentze, T., and Timmermans, H. (2000) Albatross: A Learning Based Transportation Oriented Simulation System, European Institute of Retailing and Services Studies, Chapter 1. Goodwin, P. (2003) Unintended Effects of Policies, Handbook of Transport and the Environment, Hensher, D.A. and Button, K.J. (eds.), London, Chapter 33. Jones, P.M. (1990) Developments in Dynamic and Activity-Based Approaches to Travel Analysis, Avebury, Aldershot, England. Jones, P.M., Dix, M.C., Clarke, M.I. and Heggie, I.G. (1983) Understanding Travel Behaviour, Gower, Aldershot.
b) Journal papers Hagerstrand, T. (1970) What about people in regional sciences? Papers of the Regional Science Association, Vol.10, 7-21. Zhang, J., Fujiwara, A. and Ishikawa, N. (2005) Developing a new activity-trip scheduling model based on utility of timing incorporating timing constraints, censored timing and sequential correlation, Paper presented at the 84th Annual Meeting of the Transportation Research Board, Washington DC, January 9-13 (CD-ROM).
c) Other documents Nishii, K., Sasaki, K., Kitamura, R. and Kondo, K. (2004) Recent Developments in Activity Based Survey and Analysis in Japan: A Review and Perspective. Paper presented at the Conference on Activity-based Analysis, Maastricht, The Netherlands, May 28-31. Vovsha, P., Bradley, M., and Bowman, J.L. (2004) Activity-based travel forecasting models in the United States: Progress since 1995 and Prospects for the Future. Paper presented at the Conference on Activity-based Analysis, Maastricht, The Netherlands, May 28-31.