analysis of transportation behavior and its reduction
TRANSCRIPT
Analysis of Transportation Behavior and its Reduction Strategies in Cities: A Case Study on Chengdu MICE transportation
Qing-Guo HUANG1, Qi-Hui ZHANG2, Li HUANG3* Business School of Sichuan University1
School of Tourism, Sichuan University, Chengdu 610065, China2
[email protected], [email protected] *Corresponding author
Keywords: MICE transportation, Carbon emission characteristics, Scenario analysis, Emission reduction measure
Abstract. Global warming has been closely associated with vehicle choices of tourists. 96.3% of environment stress of international conference is owing to transport emissions of attendees. But studies on MICE transportation are concentrated on that air transport emissions of participants have an impact on environment, vehicle choices of attendees are ignored. Taking Chengdu as an example, the paper conducted researches on carbon dioxide emission characteristics of MICE in cities, by employing transport carbon emissions measurement on the basis of low-carbon economic theory. Moreover, in the paper, the following results were found: 38.84% of the attendees tended to take public transport and the left 49.24% the private transport, carbon dioxide emission from the 38.84% was only 7% of that from the 49.24%; the attending frequency was closely related to transport choice for attendees; There are differences in which attendees chose vehicles between Chengdu portal, hotels and exhibition venues. Above all, combining with scenario analysis, the transport carbon dioxide emission strategies in Chengdu were concluded to enrich the field of researches about MICE transportation carbon emissions.
Introduction Global warming has been closely associated with vehicle choices of tourists. Sabine et alcalculated the intensity of greenhouse gas emissions of tourism sector in the Swiss and found that greenhouse gas emissions intensity of tourism sector is four times higher than the average of all sectors, and air travel sector carbon emissions accounted for 80%. In recent years, the rapid development of international conferences and exhibitions characterized by large-scale business travelers' movement has increased the environmental pressure and transport pressure of the convention or exhibition cities. Hischier believed that 96.3% of the environmental pressure on the international conference comes from the transport carbon emissions of the participants. Therefore, the impact of MICE transportation on the environment has become a new field of academia. However, researches on MICE transportation is mainly focused on the environmental impact of emissions from air transport and the reduction measures (Hischier, 2002; Sabine, 2009), while ignoring that the bunching effect caused by daily attendees may bring large environmental pressure to the city of transport congestion and the increase of carbon emissions.
This study takes Chengdu where the MICE industry is rapidly developed for an example, and explores the impact of the attendees’ behaviors of choosing transport vehicles on urban carbon emissions from a micro perspective as well as public transport measures to reduce carbon emissions, to enrich the field of researches about MICE transportation carbon emissions.
Literature Review Domestic research on low-carbon exhibition has not yet started, while foreign researches about MICE transportation carbon emissions focused on low-carbon researches about air transport. Hischier et al showed that 96.3% of the pressure on international conferences came from the
3rd Annual International Conference on Management, Economics and Social Development (ICMESD 2017)
Copyright © 2017, the Authors. Published by Atlantis Press. This is an open access article under the CC BY-NC license (http://creativecommons.org/licenses/by-nc/4.0/).
Advances in Economics, Business and Management Research, volume 21
297

transport of the participants, while the printing materials and conference bags or other matters required by the conferences only caused 3.7% of the environmental pressure. That the transport of international conference causes great pressure on the environment has confirmed in many studies. Hall said that due to the increase of passengers, the airport capacity has to expand rapidly, and the CO2may aggravate the greenhouse effect at high altitudes, therefore, traveling by plane is the factor causing the carbon emissions grow fastest. Based on the enormous environmental pressure of aviation carbon emissions, Orsi proposed that decentralized meeting places to minimize the total distance to the destination may reduce the total amount of carbon emissions Vlad et al had found that compared to meetings with only one destination, increasing the meeting destinations can reduce carbon emissions by 37% to 50%, and this research focused on how to connect multi-destination meetings through information exchange technology (ICT).
Different ways of transport differ in carbon emissions. Duffy et al took UK(England) as an example and found that in accordance with greenhouse gas emissions caused by the different ways of transport, it is thecar, bus, bicycle and walking arranging from high to low. Chinese researchers Weiqi Yao et al (2010) found that in accordance with the per capita carbon emissions caused by the main transport ways, it is the private car, taxi, subway, bus ranging from high to low based on the investigation on customers and employees of IKEA in Shanghai and Shenzhen. To reduce the environmental impact of transport, Eriksson (2008) proposed to reduce the use of private cars by improving public transport, collecting tolls, raising parking fees, etc.; Bureau (2011) proposed that reducing fares and increasing transport speed is an effective policy of urban public transport in Paris. Famous foreign convention or exhibition cities will take public transport as the main way of transport, such as during the large-scale exhibition in the Neue Messe München in Germany, the bus accounted for 60 to 70%.
The calculation of carbon emissions is the basis for carbon reduction. There are three main types of carbon emission measurement methods that are widely used: input-output method, life-cycle method and energy consumption method. Natalia used the input-output method and found that 60% of the total energy consumption in Hawaii is caused by tourists. Nae-Wen Kuo analyzed the average carbon footprint of tourists in Penghu Island in Taiwan by life-cycle method, and concluded that the CO2 emissions of per tourist on the island were 109 kg. Becken used the energy consumption method, taking New Zealand as an example, analyzed the energy consumption and greenhouse gas emissions of international tourists traveling by plane and found that the energy consumption of international tourists traveled by air is as high as 27.8 PJ in New Zealand, accounting for about 6% of the total energy consumption. Yifan Wang (2011) calculated that carbon emissions of motor vehicles from 2006 to 2010 in Chengdu are growing approximate linearly[12]. Above surveys of transport carbon emissions provide a reliable data support for subsequent researches.
In summary, domestic and foreign researchers had studied in the aspects ofair transport carbon emissions, the comparison of carbon emissions between different ways of transport and the carbon emissions caused by the travels come to the tourist destinations, but lack carbon emissions research about convention or exhibition cities. In recent years, China's exhibition industry grows at an annual rate of 20%, since holding conference and exhibition has an aggravated environmental impact on the exhibition city, discussing the measures of reducing the environmental pressure as well as the development of exhibition industry is of great significance to the development of the convention or exhibition city.
Methods Research Methods This paper investigated the characteristics of the urban transport behavior of the participants, and measured the contribution of the behavior of choosing transport to the carbon emissions of the convention or exhibition city based on the energy consumption method. According to the researches of Becken and Lin and Henttu et al on the carbon emissions, this paper determined the factor of
Advances in Economics, Business and Management Research, volume 21
298
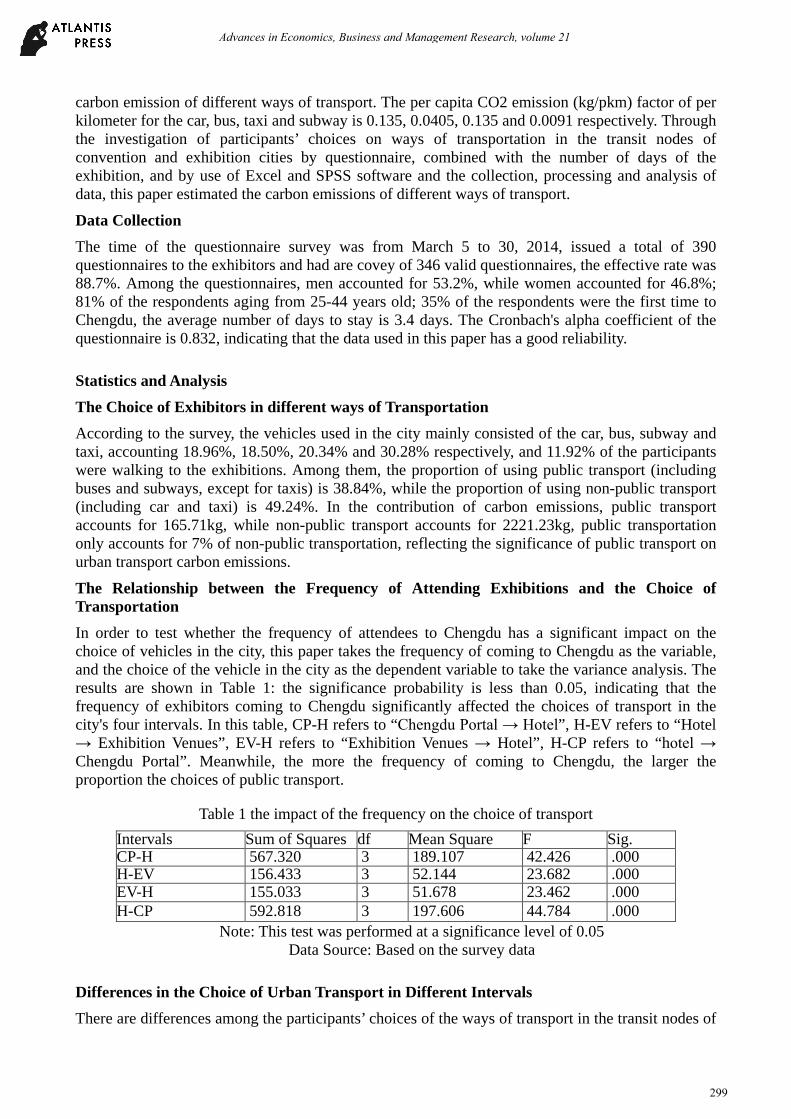
carbon emission of different ways of transport. The per capita CO2 emission (kg/pkm) factor of per kilometer for the car, bus, taxi and subway is 0.135, 0.0405, 0.135 and 0.0091 respectively. Through the investigation of participants’ choices on ways of transportation in the transit nodes of convention and exhibition cities by questionnaire, combined with the number of days of the exhibition, and by use of Excel and SPSS software and the collection, processing and analysis of data, this paper estimated the carbon emissions of different ways of transport.
Data Collection The time of the questionnaire survey was from March 5 to 30, 2014, issued a total of 390 questionnaires to the exhibitors and had are covey of 346 valid questionnaires, the effective rate was 88.7%. Among the questionnaires, men accounted for 53.2%, while women accounted for 46.8%; 81% of the respondents aging from 25-44 years old; 35% of the respondents were the first time to Chengdu, the average number of days to stay is 3.4 days. The Cronbach's alpha coefficient of the questionnaire is 0.832, indicating that the data used in this paper has a good reliability.
Statistics and Analysis The Choice of Exhibitors in different ways of Transportation According to the survey, the vehicles used in the city mainly consisted of the car, bus, subway and taxi, accounting 18.96%, 18.50%, 20.34% and 30.28% respectively, and 11.92% of the participants were walking to the exhibitions. Among them, the proportion of using public transport (including buses and subways, except for taxis) is 38.84%, while the proportion of using non-public transport (including car and taxi) is 49.24%. In the contribution of carbon emissions, public transport accounts for 165.71kg, while non-public transport accounts for 2221.23kg, public transportation only accounts for 7% of non-public transportation, reflecting the significance of public transport on urban transport carbon emissions.
The Relationship between the Frequency of Attending Exhibitions and the Choice of Transportation In order to test whether the frequency of attendees to Chengdu has a significant impact on the choice of vehicles in the city, this paper takes the frequency of coming to Chengdu as the variable, and the choice of the vehicle in the city as the dependent variable to take the variance analysis. The results are shown in Table 1: the significance probability is less than 0.05, indicating that the frequency of exhibitors coming to Chengdu significantly affected the choices of transport in the city's four intervals. In this table, CP-H refers to “Chengdu Portal → Hotel”, H-EV refers to “Hotel → Exhibition Venues”, EV-H refers to “Exhibition Venues → Hotel”, H-CP refers to “hotel → Chengdu Portal”. Meanwhile, the more the frequency of coming to Chengdu, the larger the proportion the choices of public transport.
Table 1 the impact of the frequency on the choice of transport Intervals Sum of Squares df Mean Square F Sig. CP-H 567.320 3 189.107 42.426 .000 H-EV 156.433 3 52.144 23.682 .000 EV-H 155.033 3 51.678 23.462 .000 H-CP 592.818 3 197.606 44.784 .000
Note: This test was performed at a significance level of 0.05 Data Source: Based on the survey data
Differences in the Choice of Urban Transport in Different Intervals There are differences among the participants’ choices of the ways of transport in the transit nodes of
Advances in Economics, Business and Management Research, volume 21
299

Chengdu among Chengdu portal, hotel and exhibition venues. But from the whole point of view, about half of the participants tend to choose the taxi or carwhich with a high coefficient of CO2 emission and accounting for a high proportion of the city's total transport carbon emissions, see Table 2.
Table 2 the way of transport between different urban transport nodes
intervals car bus subway taxi walking CP-H 17.50% 22.40% 14.60% 45.50% 0 H-EV 20.20% 16.20% 24.20% 22.50% 16.90% EV-H 20.20% 16.20% 24.20% 22.30% 17.10% H-CP 16.90% 21.40% 14.90% 46.80% 0
Data Source: Based on the survey data
Conclusion and Suggestion Vlek divided public transport policiesinto hardware measures designed to change the transport environment and software measures designed to create personal consciousness. The "push" policy aimed at reducing the use of the private car, such as prohibiting the private cars in the city center and raising fuel taxes and tolls; “Pull” policy is designed to optimize personal travel options, such as improving the quality of public transport, improving riding or walking facilities and providing real-time and effective information.
China's annual consumption of business travel is more than 2.4 billion US dollars.Business travel is a high-end market of tourism, as the budget constraints of the business tourists are higher than normal tourists, they prefer to choose convenient and comfortable ways likecar and taxi in their business activities. To optimize the choice of public transport during the exhibition, we need to adopt the "pull" policy.
(1) optimizing the public transport planning of the exhibition venues. In Germany where the exhibition industry is well developed, the government attaches great importance to provide supplementary services to transportation of the exhibition venues. The main entrances and exits of the exhibition venues are connected with the subway stations. During the exhibitions, by adding the shuttle bus connecting the airport, railway station, there is a significant effect of the “pull” power of public transportation. Chengdu can increase the special bus lines, and establish direct buses in the portals, the hotels and exhibition venues, which can not only facilitate the participants, but also can relieve the city transport congestion and reduce transport carbon emissions.
(2) increasing information services about public transport. This survey found that the higher the frequency of coming to Chengdu, the higher the frequency of using public transport. The familiarity of participants with the city, especially the understanding level of the public transport will influence the behavior of their choices. By producing the maps and instructions of taking buses and giving to the participants through the hotel, or hanging in the official website of the exhibition, the participants coming to Chengdu for the first time can easily choose the bus to travel.
(3) providing some preferences of public transport. Some literature has proposed some urban public transport policies to reduce CO2 emissions, such as by increasing the capacity rate of public transport. Potter et al pointed out that the UK had implemented a green transport incentive scheme since 1998; Nuworsoo found that the low-income groups and young people were more inclined to use and transfer public transport when the basic fares is lowered. The convention or exhibition city can provide preferential policies of public transport, such as participants with relevant documents can use the public transport freely, which can promote the choices of using public transport. During the Candy & Wine Trade Fair, the Chengdu Bureau of Expo provides participants with free subway services, producing significant effects.
Advances in Economics, Business and Management Research, volume 21
300

Future Research Direction This paper only took the participants as the objects and analyzed the total amount of transport carbon emissions and the characteristics during the exhibition and explored the relevant emission reduction measures. In future researches, researchers can take the participating audience into the scope of the study, so that the researches about MICE transportation carbon emissions can be more comprehensive and objective.
References
[1]Bureau B, Glachant M. Distributional effects of public transport policies in the Paris Region [J]. Transport Policy, 2011, (18) 745–754.
[2]Duffy A, Crawford R. The effects of physical activity on greenhouse gas emissions for common transport modes in European countries [J]. Transportation Research, 2013, (19):13–19.
[3]Eriksson L, Garvill J, Nordlund A.M. Acceptability of single and combined transport policy measures:The importance of environmental and policy specific beliefs[J]. Transportation Research, 2008, (42):1117–1128.
[4]Hischier R, Hilty L. Environmental impacts of an international conference[J]. Environmental Impact Assessment Review, 2002, (22):543–557..
[5]Hall E. Alternative futures for academic conferences: a response to Bonnett[J]. Area, 2007, 1(39):125-129.
[6]Henttu V, Hilmola O P. Hinterland operations of sea ports do matter: Dry port usage effects on transportation costs and CO2 emissions [J]. Transportation Research Part E, 2013, (55):23–42.
[7]McKercher B, Prideaux B, Cheung C, et al. Achieving voluntary reductions in the carbon footprint of tourism and climate change [J]. Journal of Sustainable Tourism, 2010, 18(3): 297-317.
[8]Lin T P. Carbon dioxide emissions from transport in Taiwan’s national parks[J]. Tourism Management, 2010, 31: 285–290.
[9]Orsi F. Cutting the carbon emission of international conferences: is decentralization an option? [J]. Journal of Transport Geography, 2012, (24): 462-466.
[10]Vlad C C, Hilty L M, Birtel M. Effects of Internet-based multiple-site conferences on greenhouse: gas emissions[J]. Telematics and Informatics, 2012, 29: 362-374.
Advances in Economics, Business and Management Research, volume 21
301