analysis of the sales and incomes between different
TRANSCRIPT
157
Original scientific paper
EP 2017 (64) 1 (157-170)
Economics of Agriculture 1/2017UDC: 658.817:338.432
ANALYSIS OF THE SALES AND INCOMES BETWEEN DIFFERENT CATEGORIES OF AGRICULTURAL PRODUCTS
ANALYSIS OF THE SALES AND INCOMES BETWEEN DIFFERENT CATEGORIES OF AGRICULTURAL PRODUCTS
Predrag Vukadinović1, Aleksandar Damnjanović2, Ljiljana Dimitrijević3
Abstract
In this paper, dynamic analysis of the sale and income four different categories of agricultural products on the Republic of Serbia was described. Differentiating incomes by sales points, all of mentioned agricultural categories was stratified and observed as two separate time series. A comparative statistical analysis and correlation structure of their dynamics was investigated. For this purpose, various statistical methods, based on the time series analysis, was used. This analysis has been shown a high correlation between the incomes of the same, as well as different categories of agricultural products. Therefore, this study should indicate in which direction and to what sectors of agricultural production should be to move more intensive budgetary support.
Key words: agricultural production, time series analysis, comparison, correlation.
JEL: Q13, Q14,Q18, M31.
Introduction
The incomes from the sale of agricultural products are generally achieved through two main sales channels: direct selling in the market via the farmers’ market and through the purchase and sale via retail channels organized as a supermarket and other retail outlets. Generated revenues depend on the amount of sales of agricultural products and their prices. The price is affected by many factors that are manifested as the costs of production. These factors in Serbia are also influenced by the state which gives financial support to agriculture in different ways. The level of these costs varies depending on the manner of farm production and the size of the agricultural holding where the production takes place. Those may be smaller agricultural holdings owned by natural persons and larger agricultural holdings owned by legal entities
1 Predrag Vukadinović Ph.D., Associate Professor, Singidunum University, Danijelova Street no. 32, 11000 Belgrade, Serbia, Phone: +381 11 309 3374, E-mail: [email protected]
2 Aleksandar Damnjanović Ph.D., Associate Professor, Faculty for Economics “Dositej”, Nusiceva Street no. 12a, 11000 Belgrade, Serbia, Phone: +381 64 00 28 388, E-mail: [email protected]
3 Ljiljana Dimitrijević Ph.D., Assistant Professor, Faculty of Business Economics and Entrepreneurship, Mitropolita Petra Street no. 8, 11000 Belgrade, Serbia, Phone: +381 11 27 62 194, E-mail: [email protected]

158 EP 2017 (64) 1 (157-170)
Predrag Vukadinović, Aleksandar Damnjanović, Ljiljana Dimitrijević
that are engaged in agriculture and entrepreneurs. Individual agricultural holdings have far less economic power in relation to the holdings owned by legal entities or entrepreneurs.
Agricultural production, food industry and sales channels of agricultural products, represent the entirety of a process that, and in the light of current economic changes, are gaining global significance. The impact of globalization as a world process, has not bypassed the agri-food industry where concentration occured at all stages of the food chain (Lovre et al., 2011). The expansion of supermarket chains has also taken on global proportions. In China only, “supermarket revolution” is spreading faster than anywhere else in the world. Annual sale in supermarkets is growing by 30-40% annually, which is 2-3 times faster than in any other developing country (Hu et al., 2004). However, in some parts of the world (New Zealand), a reverse phenomenon happened. In spite of increasing industrialization in the production and sale of agricultural products, which led to market dominance of global corporations, in recent years there has been a “counter-revolution” in the retail of food by means of reoccurrence of farmers’ market (Guthrie et al., 2006). The market cannot exist without the seller and the buyer; this also applies to the market of agricultural products. Direct sales to customers takes place at the farmers’ market, so farmers use this sales channel as the best available channel of sales in the market (Brown, 2002). In response to the increasing competition in the market of agricultural products, new forms of vertical integration are emerging, followed by the agricultural agreement and faster introduction of new technologies (Tomek, Robinson, 2014). Economic incentives for the emergence of new vertical integrations and contracts are greater bargaining power, reduced costs, reduce risk, ensuring of an adequate market entry, improved management, improved market position and development of new quality standards (Codron et al., 2004). An interesting model of market strategy is found in the paper (Brown, Miller, 2008) stating the Community Supported Agriculture as a strategy that results in a situation in which consumers buy “shares” in a farm before planting, and in return, receive a part of the agricultural products that are available every week. These “shares” usually cost several hundred dollars and provide them with the right to get fresh products.
Serbia has begun with the opening of certain chapters in the European Union (EU) accession negotiation process. In the area of agriculture, the EU adopted Common Agriculture Policy (CAP). In the process of harmonization of the agricultural policy with the CAP, Serbia adopted the Strategy for Agriculture and Rural Development of the Republic of Serbia for the period 2014-2024 (hereinafter the Strategy). At the macroeconomic level, the agricultural share in the Gross Domestic Product is about 10% on average, annually. The Republic of Serbia allocates to agriculture one part of the budget for subventions, with the intention of thereby influencing the development of agriculture. However, certain analyses for the period 2005-2013 (Jović et al., 2015) indicate that there is no clear link between subventions and newly added value. The share of agriculture in total employment is over 20%. The foreign trade balance of agriculture is in surplus. The main resource of agricultural production, land, occupies an area of 5,069,000 hectares. Most of this land is used by agricultural holdings - according to the census from 2012, there are 631,522 agricultural holdings in Serbia. The average size of land used per holding is 5.4 ha. In the structure of agricultural holdings, 99.6% belong to natural persons that use 82% of the area. The remaining 0.4% are legal entities that use 16% of

159EP 2017 (64) 1 (157-170)
ANALYSIS OF THE SALES AND INCOMES BETWEEN DIFFERENT CATEGORIES OF AGRICULTURAL PRODUCTS
the area with an average agricultural holding size of 250 ha. The participation of individual farms and their symbolic organizing in cooperatives is dominant, as well as the low level of merchantability and intensity of production (Pejanović 2009). The low technological level of agricultural holdings exposes them to the risk of the influence of atmospheric conditions, flooding and other risks. Therefore, insurance would have a significant role in the prevention of these risks. The new regulation in line with the Solvency II Directive EC/2515/06 will mean greater security for farmers in respect of compensation in case of manufacturing risks (Njegomir et al., 2014). Agricultural production in fruit, vegetable and poultry is increasing, while the decline is observed in dairy production. The reduction in the number of dairy cows by 34% certainly contributed to this situation. Modern and advanced business conditions of farmers should lead them to think strategically, while being focused on more efficient associating in cooperatives, which should facilitate their participation in the market. The performance on the market is accompanied by many problems, mostly by jeopardizing of the competition due to the behaviour of those participants who abuse their position in the market. Therefore, the question is whether the state has mechanisms to subject this unfair market behaviour to sanctions (Milanović et al., 2009). In relation to the land as the most important resource of agriculture, there are certain, still unsolved, problems. In addition to the small size of the private agricultural holdings, there is a problem of fragmentation of plots since land consolidation was not carried out fully (the average number of plots per agricultural holding is six). Overall economic strength of a family holding is 5,939 euros, and if this indicator is observed according to the structure of holdings, then the average economic strength of a family holding is 4,990 euros, while the average economic power of a holding owned by a legal entity or an entrepreneur is 204,755 euros (Paraušić, Cvijanovic, 2012). In addition to direct production support measures, structural measures and rural development measures and other measures, little attention is paid to innovative procedures and environmental protection, which may be used for obtaining valuable resources to be used in agriculture. One of them is the treatment of wastewater and correct treatment of sludge that is produced after wastewater treatment, which after processing has valuable agronomic properties. Such usage of sludge in agriculture is in accordance with Directive 68/278/EEC (Piukovic-Babičković et al., 2016). The field of ecology and environmental protection (especially water), when it comes to the consumption of mineral fertilizers, was not treated appropriately. There is a profound adverse impact on the environment due to inadequate law enforcement and infrastructure deficiencies in the field of ecology (Roljević et al., 2012).
Research in this study is aimed is aimed at assessing the degree of correlation between the revenues earned through the purchase and sale via supermarkets and other retail outlets in relation to the revenues from the sale of agricultural products to the farmers’ market. The research covered four sectors of agricultural production in Serbia: fruit, vegetable, poultry and dairy. Products from these four sectors of agricultural production constitute 31.2% of agricultural production in Serbia (Statistical Yearbook of Serbia, 2016). The results of the research showed that there is a high degree, and in some cases, very high degree of correlation between the researched revenues. The significance of the obtained results is that they are connected with financing (budget support) of agricultural production by the state. Using

160 EP 2017 (64) 1 (157-170)
Predrag Vukadinović, Aleksandar Damnjanović, Ljiljana Dimitrijević
the example of selected types of agricultural products, it has been pointed out towards what sectors of agricultural production the flows of funding from the state (agrarian) budget should be more intensely directed to.
Methodology
The main aim of this work is investigation of dynamics and the correlation structure between incomes of different agricultural products, according to kind of product, as well as by their sale points. For this purpose, the agricultural products are classified into four different categories:
A. Fruit and grape;
B. Vegetables;
C. Chicken and eggs;
D. Milk and milk products.
On the other hand, the dynamics of sales and incomes from all the above categories of agricultural products was stratified based on two types of sales points:
1. Sale and purchase of agricultural products-Sector A (SA-abbreviation of the author);
2. Sale of agricultural products on farmers’ markets-Sector B (SB-abbreviation of the author).
In view of their theoretical design, all of statistical methods that we use in our research can be classified into following three groups:
1. Contemporary analysis of the dynamics of incomes (or other quantitative indicators) in the agricultural sector show relatively stable changes (Chattopadhyay, 2001; Roy, Bezbaruah, 2002). Therefore, their long-term development tendencies here
is described by the function of exponential trend 1ˆ .xt oy b b= ⋅ In addition, for
all the above-mentioned series of agricultural categories has been calculated the corresponding coefficient of determination:
( )
( )∑
∑
=
=
−
−= N
ii
N
ii
yy
yyR
1
2
1
2
2
ˆ
where N is number of observations, i.e., the length of observed series (yi), and y is the mean values. As it is well-known, this coefficient represents the relative
measure of fitting the trend line with the empirical data, i.e., the level of the explained variability in corresponding theoretical (trend) model. It takes values between 0 and 1, where higher values of R2 indicate to higher quality of fitting. Finally, estimated values of the parameter b1 in the exponentially trend function indicates to the degree of change (increase) of observed time series. Based on it, it can be defined the so-

161EP 2017 (64) 1 (157-170)
ANALYSIS OF THE SALES AND INCOMES BETWEEN DIFFERENT CATEGORIES OF AGRICULTURAL PRODUCTS
called Exponential Growth Rate (EGR):
( )1 100.r b= − ⋅
This indicator describes the average relative growth of the time series during observed period.
2. In the second part of our statistical analysis, we tested the significance of the means and variability equality in SA and SB time series, for all four afore-mentioned categories of agricultural products. For this purpose, we used three different kind of statistical testing:
(i). Student’s (t) test compares the averages (means) of the two data series, and shows to significance of their differences. It is an usually used in the cases of “small” samples, and gives a decision of accepting or rejecting the null hypothesis of the mean values equality (Hazewinkel, 2001);
(ii). Mann-Whitney’s (U) test is a nonparametric test of the null hypothesis that the medians of two data series are equal. This is non-parametric test, based on the ranks of the data (Lehmann, 2006). Mann-Whitney’s test is nearly efficient as the Student’s test, but in contrast to it, does not require the assumption of normal distributions.
(iii). Fisher’s (F) test is a statistical test in which the null hypothesis assumes that two normal populations have the same variance. The test statistic is the ratio of two sample variances and, aditionally, this test can be used to comparison of two variances (Markowski & Markowski, 1990).
3. At last, correlation between different series can be precisely determined using well-known, Pearson’s product moment correlation coefficients (r),
The coefficient r is a quantitative measure of dependence and correlation between certain agriculutral categories (labeled as x, y). It takes a value of -1 to 1, depending on the direction and the strength of correlation between x and y. If r > 0 there is a direct correlation, while for r < 0 correlation is inverse. In order to qualitative determination the strength of the correlation, we use the following interpretation of r, i.e. its absolute value |r|:
• 0.0 – 0.7: Weak correlation;
• 0.7 – 0.8: Emphasized correlation;
• 0.8 – 0.9: High correlation;
• 0.9 – 1.0: Very high correlation.

162 EP 2017 (64) 1 (157-170)
Predrag Vukadinović, Aleksandar Damnjanović, Ljiljana Dimitrijević
In addition, the dynamic and correlation’s structure of the incomes between the same agricultural categories, in comparison to their sales point (SA and SB series) was investigated, using regression analysis. In that way, a functional form that more precisely describes the dependence of these two kind of series was obtained.
Results and discussion
In this section, dynamic and correlational statistical analysis of income of agricultural products is investigated. Quantitative indicators of incomes realized through sale of agricultural products in the period 2009-2015, in percentages, are shown in Table 1.
Table 1. Incomes of agricultural products, stratified by market places (in percentages).
Year A. Fruit and grape B. Vegetable C. Poultry and eggs D. Milk and milk products
SA SB SA SB SA SB SA SB2009 55.94 44.06 22.50 77.50 36.90 63.10 80.47 19.532010 62.63 37.37 21.16 78.84 37.43 62.57 79.44 20.562011 59.87 40.13 27.22 72.78 39.04 60.96 81.12 18.882012 61.61 38.39 22.65 77.35 32.10 67.90 81.39 18.612013 64.52 35.48 24.83 75.17 51.13 48.87 80.19 19.812014 64.33 35.67 30.27 69.73 49.20 50.80 82.78 17.222015 72.89 27.11 33.96 66.04 57.53 42.47 82.18 17.82
Source: Statistical Office of the Republic of Serbia - Statistical Yearbook of Serbia, 2010-2016.
Presented data, grouped in the form of time series, indicate to percentage growth of the SA-series in total incomes. On the other hand, the decrease in percentage share of SB-series in total incomes in the market can be seen, in all kinds of agricultural products. In category A can be seen that the series increases from 55.94% in 2009 to 72.89% in 2015. In the same category, SB-series has a drop in percentage share of total revenues with 44.06% in 2009 to 27.11% in 2015. Exception is 2011, where there was a temporary pause in growth of SA-series and a temporary recovery of SB-series. Category B contains an identical changes in percentages of SA-series and SB-series. Reark that the SA-series grows with 22.50% in 2009 to 33.96% in 2015, while SB-series has a drop of percentage of the total incomes with 77.50% in 2009 to 66.04% in 2015. The exceptions are 2010 and 2012 in which there is a temporary decrease of SA-series, and a temporary increase of SB-series. Category C contains the most interesting changes. It is apparent significant change in the percentage share of the income earned in the market with the SB-series. This change is manifested by SA-series from the initial 36.90% in 2009, rising to 57.53% in 2015. In this way, it takes dominance in relation to the SB-series, which decreases from 63.10% in 2009 to 42.47% in 2015. In this change, two moments are important. In 2012, the value of SA decreases from 39.04% to 32.10%, while SB increases from 60.69% in 2011 to 67.90% in 2012. The dramatic shift is taking place in 2013 when the SA achieved significant growth with 32.10% in 2012 to 51.13% in 2013. On the other hand, SB decreases from 67.90% in 2012 to 48.87% in 2013. In this year, SA-series, in the comparision to SB-series, takes dominance on the market. Finally, category D indicates the smallest fluctuations. SA-series is constantly growing with minimal changes, from 80.47%

163EP 2017 (64) 1 (157-170)
ANALYSIS OF THE SALES AND INCOMES BETWEEN DIFFERENT CATEGORIES OF AGRICULTURAL PRODUCTS
in 2009 to 82.18% in 2015, while SB-series down from 19.53% in 2009 to 17.82% in 2015. The exception is 2010, when there was a minimal decrease in SA and minimal growth SB. Their dynamics in the mentioned period, expressed in millions of dinars, is also graphically illustrated (Figure 1).
Figure 1. Income dynamic of the agricultural categories in period 2009-2015 (106 RSD).
Source: Statistical Office of the Republic of Serbia - Statistical Yearbook of Serbia, 2010-2016;
Note: Computation in Excel: Damnjanović, Vukadinović, 2017.
Let us point that all of observed time series, i.e., incomes realized from the sale of agricultural products, shows the growth which, in the most cases, can be expressed with exponential trend. For this purpose, in Figure 1 are plotted the appropriate trend lines, along with the estimated values of the coefficient of determination (R2). Remark that, in the most of observed time series, estimated values of the coefficients of determination are significantly high. This means that dynamics of realized incomes can be explained according the appropriate models of exponential trend.
Chart of the dynamics of category A shows the value of income generated by years of the time series generated from the sale of fruits and grapes. In the reporting period, income grew continuously. In 2009, revenues amounted to 6,191 million RSD, while in 2015 this income

164 EP 2017 (64) 1 (157-170)
Predrag Vukadinović, Aleksandar Damnjanović, Ljiljana Dimitrijević
amounted to 2.0344 million RSD. During this period, there was a significant change in income growth. Until 2014, income had a balanced growth and amounted to RSD 11,194 million, and in 2015 there was a very high growth in these revenues to 20,344 million RSD. Line of the exponential trend is growing, and indicates further revenue growth. The coefficient of determination (R2 = 0.8629) is high, so that the representativeness of the model is satisfactory. More precisely, 86.29% change is explained by this model, i.e. exponential trend shows a high degree of reliability. On the other hand, changes in SB-series are evenly and without major fluctuations. Income from sales in green markets grew by 4,876 million dinars in 2009 to 7,568 million dinars in 2015. Balanced growth is confirmed by the coefficient of determination (R2 = 0.9129), which indicates a very high representativeness of the models. According to obtained exponential trends, it can be seen much faster growth in revenues of the SA-series compared to SB-series, so it can be predicted that the differences in actual revenues in the future will be more pronounced. Series of
Category B are characterized by the dominance of realized revenues of the SB-series, in relation to the SA-series. Incomes of the SB-series increased from 6,399 million dinars in 2009 to 10,790 million dinars in 2015. The exponential trend line indicates the further growth of Incomee. The coefficient of determination (R2 = 0.9525) is very high, what indicates that the 95.25% variability can be explained by this model. In the case of SB-Series incoomes grew to 1,858 million dinars in 2009 to 5,549 million dinars in 2015. The exponential trend line indicates the further growth of revenue. The coefficient of determination (R2 = 0.9155) is very high, and it indicates a very high degree reliability of trend lines. The obtained exponential trends of both series can be seen that the growth in incomes of SA faster than SB revenues.
Category C is the most interesting. Line revenues show two quite different trends in revenues per year in the observed series. Annual changes of growth revenue SB are smooth and without larger fluctuations. This income grew to 3,526 million dinars in 2,009 to 4725 million dinars in 2015. On the other hand SA revenues shows significant changes in revenue trends. After growth in 2011 of 2,459 million dinars, it comes to decline in revenue in 2012 at 2,001 million dinars. In 2013 there is a significant change in the growth of revenue so that the revenue from 2012 to 2,001 million dinars increased to 4,663 million. This year (2013) comes to a change in dominance between the income earned from the SB. Revenue growth SA assumes dominance in comparision to the SB, and in the period 2014-2015, it is significantly exceed income SB. SB exponential trend line shows a further increase in revenue. The coefficient of determination (R2 = 0.8462) is high, what indicates high reliability of trend line. SA trend line also indicates to the revenue growth. The coefficient of determination (R2 = 0.8972) is high and exhibits high reliability of the trend line, also. Looking at the trend lines of SA and SB incomes, it can be concluded that both lines showed revenue growth, but trend line of SA-series shows significantly faster growth in revenue compared to revenue growth SB-series.
Finally, in category D is indicative the dominance of SA incomes. The trend line shows steady growth in SA incomes from 15,707 million dinars in 2009 to 26,528 million dinars in 2015. The coefficient of determination (R2 = 0.9513) indicates the very high
165EP 2017 (64) 1 (157-170)
ANALYSIS OF THE SALES AND INCOMES BETWEEN DIFFERENT CATEGORIES OF AGRICULTURAL PRODUCTS
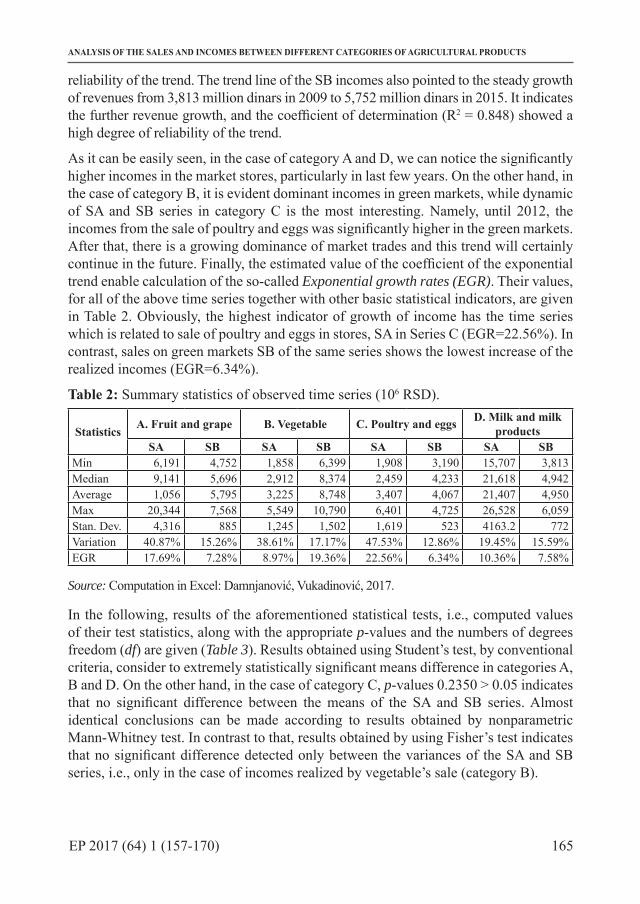
reliability of the trend. The trend line of the SB incomes also pointed to the steady growth of revenues from 3,813 million dinars in 2009 to 5,752 million dinars in 2015. It indicates the further revenue growth, and the coefficient of determination (R2 = 0.848) showed a high degree of reliability of the trend.
As it can be easily seen, in the case of category A and D, we can notice the significantly higher incomes in the market stores, particularly in last few years. On the other hand, in the case of category B, it is evident dominant incomes in green markets, while dynamic of SA and SB series in category C is the most interesting. Namely, until 2012, the incomes from the sale of poultry and eggs was significantly higher in the green markets. After that, there is a growing dominance of market trades and this trend will certainly continue in the future. Finally, the estimated value of the coefficient of the exponential trend enable calculation of the so-called Exponential growth rates (EGR). Their values, for all of the above time series together with other basic statistical indicators, are given in Table 2. Obviously, the highest indicator of growth of income has the time series which is related to sale of poultry and eggs in stores, SA in Series C (EGR=22.56%). In contrast, sales on green markets SB of the same series shows the lowest increase of the realized incomes (EGR=6.34%).
Table 2: Summary statistics of observed time series (106 RSD).
Statistics A. Fruit and grape B. Vegetable C. Poultry and eggs D. Milk and milk products
SA SB SA SB SA SB SA SBMin 6,191 4,752 1,858 6,399 1,908 3,190 15,707 3,813Median 9,141 5,696 2,912 8,374 2,459 4,233 21,618 4,942Average 1,056 5,795 3,225 8,748 3,407 4,067 21,407 4,950Max 20,344 7,568 5,549 10,790 6,401 4,725 26,528 6,059Stan. Dev. 4,316 885 1,245 1,502 1,619 523 4163.2 772Variation 40.87% 15.26% 38.61% 17.17% 47.53% 12.86% 19.45% 15.59%EGR 17.69% 7.28% 8.97% 19.36% 22.56% 6.34% 10.36% 7.58%
Source: Computation in Excel: Damnjanović, Vukadinović, 2017.
In the following, results of the aforementioned statistical tests, i.e., computed values of their test statistics, along with the appropriate p-values and the numbers of degrees freedom (df) are given (Table 3). Results obtained using Student’s test, by conventional criteria, consider to extremely statistically significant means difference in categories A, B and D. On the other hand, in the case of category C, p-values 0.2350 > 0.05 indicates that no significant difference between the means of the SA and SB series. Almost identical conclusions can be made according to results obtained by nonparametric Mann-Whitney test. In contrast to that, results obtained by using Fisher’s test indicates that no significant difference detected only between the variances of the SA and SB series, i.e., only in the case of incomes realized by vegetable’s sale (category B).

166 EP 2017 (64) 1 (157-170)
Predrag Vukadinović, Aleksandar Damnjanović, Ljiljana Dimitrijević
Table 3: Results of statistical testing of observed time series.
Test A. Fruit and grape B. Vegetable C. Poultry
and eggs
D. Milk and milk products
StudentStatistic 3.35 -6.93 -1.32 11.69p-values 153E-02** < 1.E-04** 0.2350 < 1.E-04**
df 6 6 6 6
Mann-Whitney
Statistic 2 0 17 0p-values 4.96E-03** 2.14E-02** 0.3735 2.14E-02**
df 6 6 6 6
FisherStatistic 23.81 1.46 9.58 29.09p-values 6.16E-02** 0.3287 7.29E-02** 3.49E-04**
df 12 12 12 12Source: Computation in programing language “R”: Damnjanović, Vukadinović, 2017.
Finally, in the third part of our research, it has been investigated the distribution and the correlation structure of the aforementioned time series. For this purpose, in the first step, it was analyzed the significance and the differences between the incomes of dynamic agricultural categories, in comparison to their sales point. In Figure 2 is shown these dependences, along with the appropriate regression lines. It is obvious that in the most of observed agricultural categories there exists a significantly high correlation (in category A, especially). The only exception is incomes from the sale of poultry and eggs (category C), where the estimated value of the coefficient of determination, and consequently, the so-called Pearson linear coefficient of correlation (R2), is not very high. The determination coefficient of the series in category A is the largest (91.49%) and at the same time, it shows to a very high degree of correlation. In category B degree of determination is high and amounts to 81.02%. Category C has a somewhat lowest level of determination which is equal 67.92%. Finally, SA and SB series in category D show a high degree of correlation, equal 88.19%.
Therefore, we analyzed more precisely the relationship between the different series using the Pearson’s product moment correlation coefficients. Table 4 illustrates the overall with the statistical significance of .001. When considering the same agricultural categories, it is confirmed the earlier observed highest correlation between SA and SB in category A, where Pearson’s product moment correlation coefficients is equal r = 0.9565. After that, it follows the cross-correlation between different categories: SA in category B with SB in category A, which is approximately equal 95%. Let us remark that all of the others estimated values of the Pearson’s correlation coefficients are relative high (the lowest value is greater than 70%). Cross-correlation computed using Pearson’s product moment correlation coefficients shows the highest degree between SA and SB series in category A, which is equal 95.65%. Degree of correlation between SA and SB series in category B is also very high and is equal 90.01%. In the category C correlation is high and is equal 82.41%, while in category D is very high and is equal 93.91% .

167EP 2017 (64) 1 (157-170)
ANALYSIS OF THE SALES AND INCOMES BETWEEN DIFFERENT CATEGORIES OF AGRICULTURAL PRODUCTS
Figure 2. Regression between the same agricultural categories, stratified by sales points.
Source: Computation in Excel: Damnjanović, Vukadinović, 2017.
Table 4. Correlation coefficients between agricultural categories.
Correlation A. B. C. D.
SA SB SA SB SA SB SA SB
A.SA 1.0000 SB 0.9565 1.0000
B.SA 0.9157 0.9502 1.0000 SB 0.8278 0.8918 0.9001 1.0000
C.SA 0.9117 0.9319 0.9375 0.9026 1.0000 SB 0.7508 0.9063 0.8403 0.8877 0.8241 1.0000
D.SA 0.7765 0.9048 0.8875 0.9645 0.8643 0.9728 1.0000 SB 0.7166 0.8238 0.7611 0.9415 0.8369 0.8991 0.9391 1.0000
Source: Computation in programing language “R”: Damnjanović, Vukadinović, 2017.
168 EP 2017 (64) 1 (157-170)
Predrag Vukadinović, Aleksandar Damnjanović, Ljiljana Dimitrijević
Conclusion
The revenues generated from the sale of agricultural products are dominant in organized retail channels in the case of the revenues from the sale of fruit, and milk and dairy products. When it comes to the revenues from the sale of poultry and eggs, these revenues have become dominant since 2013. Until this year, the markets were able to deliver higher revenues. In the case of vegetables, the dominance of the revenues generated from sales in markets is apparent. Sales revenues in both sales channels for all four types of agricultural products show a trend of further growth and an expected generating of higher revenues in the future. Exponential growth rates (EGR) show that the highest growth rate belongs to the revenues generated from the sale of poultry and eggs in the retail channel, while the lowest belongs to the sale of poultry and eggs at the markets. Revenues from other types of products are of lower but more stable EGR. The established degree of correlation of revenues is high in the case of revenues from the sale of vegetables and milk and milk products, and it is very high in the case of revenues from the sale of fruit. The lowest correlation was found for the revenues from the sale of poultry and eggs. A more precise correlation was determined using Pearson’s product moment correlation coefficients. Cross-correlation, showed that the greatest degree of correlation comes from the revenues generated from the sale of fruit (very high = 95.65%), followed by revenues from the sale of milk and dairy products (very high = 93.91%), followed by the degree of correlation of revenues generated from the sale of vegetables (very high = 90.01) and the lowest degree of correlation of revenues generated from the sale of poultry and eggs (high = 84.41%). The obtained results show a high or very high degree of correlation of the researched revenues. These results may indicate to the agrarian policy makers, that the financing of the production of the researched types of agricultural products, can improve the efficiency and productivity of agricultural production in the sectors of fruit and vegetables, poultry and dairy. More intensive financing of these sectors will accelerate the trend of revenue growth of agricultural producers, stabilize their income, which will make them less dependent on all forms of borrowing, and will create a space for them to finance their own development. We should not ignore the fact that the number of small individual agricultural holdings is very large or the share of the employed persons in agriculture in the total number of employees in Serbia. If the researched sectors of agricultural production would be more intensely funded, a space for new work places would be opened, as well as the development through investments coming from own resources much more than before. The way would be paved for new technologies and knowledge, which would reduce production costs, the prices would be more competitive and farmers would be less dependent on subventions and other forms of budget support.
Literature
1. Babicković, B.P., Vojinović, Z., Vukadinović, P. (2016): Innovative wastewater treatment as a prerequisite for the use of sludge in agriculture. Ekonomika Poljoprivrede, Naučno društvo agrarnih ekonomista Balkana, vol. 63, no. 2, pp. 471-484, Beograd.
2. Brown, A. (2002): Farmers’ market research 1940–2000: An inventory and review. American Journal of Alternative Agriculture, Cambridge University, vol. 17, no. 4, pp.
169EP 2017 (64) 1 (157-170)
ANALYSIS OF THE SALES AND INCOMES BETWEEN DIFFERENT CATEGORIES OF AGRICULTURAL PRODUCTS
167-176, New York.3. Brown, C., Miller, S. (2008): The impacts of local markets: a review of research on farmers
markets and community supported agriculture (CSA). American Journal of Agricultural Economics, Cambridge University, vol. 90, no. 5, pp. 1298-1302, New York.
4. Chattopadhyay, A. (2001): Growth, Stability and Equity in Agriculture – A Quatitative Analysis (ISBN 81-7022-923-5). Concept Publishing Company, New Delhi, India.
5. Guthrie, J., Guthrie, A., Lawson, R., Cameron, A. (2006): Farmers’ markets: the small business counter-revolution in food production and retailing. British Food Journal, Emerald Publishing Limited, vol. 108, no. 7, pp. 560-573, Bingley, United Kingdom.
6. Hazewinkel, M., ed. (2001): Student test, in: Encyclopedia of Mathematics (ISBN 978-1-55608-010-4). Springer, Cham, Switzerland.
7. Hu, D., Reardon, T., Rozelle, S., Timmer, P., Wang, H. (2004): The emergence of supermarkets with Chinese characteristics: challenges and opportunities for China’s agricultural development. Development Policy Review, John Wiley & Sons, vol. 22, no. 5, pp. 557-586, Atrium, UK.
8. Jovic, L., Kosanovic, N., Vukadinovic, P. (2015): Analysis of subventions for agriculture in republic of serbia and republic of srpska. Ekonomika Poljoprivrede, Naučno društvo agrarnih ekonomista Balkana, vol. 62, no. 4, p. 963, Beograd.
9. Lehmann, E. L. (2006): Nonparametrics: Statistical Methods Based on Ranks. (ISBN 978-0-387-35212-1): Springer, New York.
10. Lovre, K., Gajić, M., Kresoja, M. (2011): Globalizacija i održivi razvoj poljoprivrede. Tematski zbornik: Agrarna i ruralna politika u srbiji nužnost ubrzanja reformi, 2011, Beograd, Društvo agrarnih ekonomista Srbije, pp. 1-10.
11. Markowski, C.A., Markowski, E. P. (1990): Conditions for the Effectiveness of a Preliminary Test of Variance. The American Statistician, Taylor & Francis, vol. 44, no. 4, pp. 322–326, Abingdon, UK.
12. Milanović, M., Mihailović, B., Paraušić, V. (2009): Elementi konkurencije i strukturne tipologije agrarnog tržišta u Srbiji. Ekonomika poljoprivrede, Naučno društvo agrarnih ekonomista Balkana, vol. 56, no. 4, pp. 317-324, Beograd.
13. Njegomir, V., Tepavac, R., Obradović, M. (2014): Upravljanje i poslovanje osiguravajućih društava u uslovima Solventnost II direktive. Ekonomika poljoprivrede, Naučno društvo agrarnih ekonomista Balkana, vol. 61, no. 3, pp. 587-601, Beograd.
14. Paraušić, V., Cvijanović, D. (2012): Ekonomska veličina poljoprivrednih gazdinstava u Srbiji i preporuka mera za njihovo osnaživanje. Zbornik radova -Završna konferencija Primena podataka popisa Poljoprivrede, 28-30. maj 2014.godine, Subotica, Republički zavod za Statistiku, pp. 25-42.
15. Pejanović, R. (2009): Razvojni problemi poljoprivrede Republike Srbije. Agroekonomika, Poljoprivredni fakultet u Novom Sadu, 2009 no. 41-42, pp. 5-23.
16. Roy, N., Bezbaruah, M. P. (2002): Agricultural growth and regional economic development – A Study of Barrak Walley (ISBN 9788170998457). Mittal Publications,

170 EP 2017 (64) 1 (157-170)
Predrag Vukadinović, Aleksandar Damnjanović, Ljiljana Dimitrijević
New Delhi, India.17. Roljević, S., Nikolić, A., Tepavac, R. (2012): The Consumption of Mineral Fertilizers and
Water Resources’ Quality in the European Union and the Republic of Serbia. Economics of Agriculture, Balkan Scientific Association of Agrarian Economists vol. 59, no. 1, pp. 139-146 Belgrade.
18. Službeni glasnik Republike Srbije (2014): Strategija poljoprivrede i ruralnog razvoja republike Srbije za period 2014-2024. godine, Poljoprivreda, Beograd.
19. Tomek, W. G., Robinson, K.L. (1990): Agricultural product prices (ISBN 9780801424519). Cornell University Press, Ithaca, New York, USA.
20. Volk, T., Erjavec, E., Mortensen, K., FAO/United Nations (2015):Poljoprivredna politika i evropske integracije u jugoistočnoj Evropi (ISBN 978-608-4760-18-4), Budimpešta, Mađarska.
ANALIZA PRODAJE I PRIHODA RAZLIČITIH KATEGORIJA POLJOPRIVREDNIH PROIZVODA
Predrag Vukadinović4, Aleksandar Damnjanović5, Ljiljana Dimitrijević6
Abstrakt
U ovom radu je opisana dinamička analiza prodaje i prihoda četiri različite kategorije poljoprivrednih proizvoda na teritoriji Republike Srbije. Diferencijacijom prihoda po prodajnim mestima, sve navedene kategorije su stratifikovane i posmatrane kao dve različite vremenske serije. Komparativna statistička analiza i korelaciona struktura njihovih dinamika je ispitana. U tu svrhu korišćene su različite statističke metode, zasnovane na analizi vremenskih serija. Ova analiza je pokazala visoku korelaciju između prihoda istih, kao i različitih kategorija poljoprivrednih proizvoda. Stoga, ovo istraživanje treba da ukaže u kom smeru i ka kojim sektorima poljoprivredne proizvodnje treba da se kreće intezivnija budžetska podrška.
Ključne reči: poljoprivredna proizvodnja, analiza vremenskih serija, komparacija, korelacija.
4 Vanredni profesor, dr Predrag Vukadinović, Univerzitet Singidunum, Danijelova Ulica br. 32, 11000 Beograd, Srbija, Telefon: +381 11 309 3374, E-mail: [email protected]
5 Vanredni profesor, dr Aleksandar Damnjanović , Fakulet za ekonomiju “Dositej”, Nusiceva Ulica br. 12a, 11000 Beograd, Srbija, Telefon: +381 64 00 28 388, E-mail: [email protected]
6 Docent, dr Ljiljana Dimitrijević, Visoka skola za poslovnu ekonomiju i preduzetnistvo, Ulica Mitropolita Petra br. 8, 11000 Beograd, Srbija, Telefon: +381 11 27 62 194, E-mail: [email protected]

Economics of Agriculture, Year 64, No. 1 (1-404) 2017, Belgrade
UDC 338.43:63 ISSN 0352-3462
ECONOMICS OF AGRICULTURE
CONTENT
1. Željko Anđelković, Aleksandra Dragin, Sanja Božić, Kristina Košić EMOTIONAL EXHAUSTION AND JOB SATISFACTION OF TOUR GUIDES IN RURAL AREAS 11
2. Sanja Đukić, Danica Glavaš-Trbić, Nikola Banjac MANAGEMENT PROBLEMS OF RURAL DEVELOPMENT IN FRUŠKA GORA 27
3. Ivana Ilić, Bojan Krstić, Sonja Jovanović ENVIRONMENTAL PERFORMANCES OF AGRICULTURE IN THE EUROPEAN UNION COUNTRIES 41
4. Nataša Kljajić, Jonel Subić, Zorica Sredojević PROFITABILITY OF RASPBERRY PRODUCTION ON HOLDINGS IN THE TERRITORY OF ARILJE 57
5. Aleksandar Maksimović, Zoran Grgić, Ferhat Ćejvanović MULTI-ATTRIBUTE ANALYSIS OF ORCHARD ACCORDING TO THE INTEGRATED PRODUCTION CONCEPT 69
6. Ozrislava Milinković, Branislav Jakić, Slobodan Vuksanović, Dragana Macura, Milica Šelmić MULTI- CRITERIA DECISION BASED APPROACH TO SELECTING THE TYPE OF INDUSTRIAL HALLS USED IN FOOD INDUSTRY 81
7. Gordana Nikić, Ljubiša Stamatović, Azra Sućeska EMOTIONAL COMPETENCIES AND PERSONALITY TRAITS OF MANAGERS IN MODERN AGROBUSINESS 97
8. Vladimir Obradović, Nemanja Karapavlović FINANCIAL REPORTING OF COMPREHENSIVE INCOME IN THE FOOD AND BEVERAGE SECTOR IN THE REPUBLIC OF SERBIA 113
Economics of Agriculture, Year 64, No. 1 (1-404) 2017, Belgrade
9. Aleksandar Ostojić, Nebojša Savić, Željko Vaško CONSUMER ATTITUDES ON BUYING FISH IN BANJA LUKA 129
10. Radivoj Prodanović, Boris Kuzman, David Jovović, Lazar Ozegović MARKET AND TRADE OF ORGANIC FRUITS IN SERBIA 141
11. Predrag Vukadinović, Aleksandar Damnjanović, Ljiljana Dimitrijević ANALYSIS OF THE SALES AND INCOMES BETWEEN DIFFERENT CATEGORIES OF AGRICULTURAL PRODUCTS 157
12. Jugoslav Aničić, Svetlana Vukotić, Goran Maksimović THE POSSIBILITIES AND LIMITATIONS OF ENTREPRENEURSHIP DEVELOPMENT IN AGRICULTURE IN SERBIA 171
13. Željko Bjelajac, Marijana Dukić – Mijatović, Joko Dragojlović FOOD SAFETY AS ONE OF THE MAIN SAFETY P REOCCUPATIONS OF A MODERN MAN 191
14. Milan Bradić, Ljiljana Kosar, Lukrecija Djeri, Svetlana Vukosav, Vuk Garača ECO-LABELLING OF ACCOMMODATION FACILITIES AND ITS PERCEPTION BY RURAL TOURISTS: CASE STUDY OF VOJVODINA 205
15. Vaso Jegdić, Iva Škrbić, Srđan Milošević MODELS OF ENTREPRENURSHIP DEVELOPMENT IN RURAL TOURISM DESTINATIONS IN VOJVODINA 221
16. Duško Kuzović MUSEUM OF VERNACULAR ARCHITECTURE OF WESTERN SERBIA - Representative curtilages of the area surrounding middle course of the river Drina and Podgorina 239
17. Branko Mihailović, Zoran Simonović, Nikola Ćurčić AGRICULTURAL RESOURCES AND DEVELOPMENT PRIORITIES OF THE MUNICIPALITY OF STARA PAZOVA 259
18. Radmilo Nikolić, Aleksandra Fedajev, Vidoje Stefanović, Silvana Ilić THE AGRICULTURE SECTOR IN WESTERN BALKANS – SOME CHARACTERISTICS OF DEVELOPMENT 275
19. Vladimir Njegomir, Rajko Tepavac, Nenad Ivanišević ALTERNATIVE SOURCES OF FINANCING ENTREPRENEURIAL UNDERTAKINGS IN AGRICULTURE 295

Economics of Agriculture, Year 64, No. 1 (1-404) 2017, Belgrade
20. Daniela Nuševa, Kristina Mijić, Dejan Jakšić THE PERFORMANCES OF COFFEE PROCESSORS AND COFFEE MARKET IN THE REPUBLIC OF SERBIA 307
21. Svetlana Roljević Nikolić, Predrag Vuković, Biljana Grujić MEASURES TO SUPPORT THE DEVELOPMENT OF ORGANIC FARMING IN THE EU AND SERBIA 323
22. ŽeljkoVojinović, Vera Zelenović, DragoCvijanović PROGRAM OF STATE SUPPORT TO AGRICULTURAL CREDITING 339
23. Nikola Vuksanović, Dragan Tešanović, Bojana Kalenjuk, Milijanko Portić, Marija Knežević SOCIO-DEMOGRAPHIC CHARACTERISTICS AS DETERMINANTS OF DIFFERENCES IN PERCEPTION OF LOCAL GASTRONOMY 359