analysis of the influence of adhesion on limit forces
TRANSCRIPT

5The Archives of Automotive Engineering – Archiwum Motoryzacji Vol. 80, No. 2, 2018
Article citation info:Brukalski M, Wasiewski A, Renski A. Analysis of the influence of adhesion on limit forces transferred between wheels and road. The Archives of Automotive Engineering – Archiwum Motoryzacji. 2018; 80(2): 5-18. http://dx.doi.org/10.14669/AM.VOL80.ART1
ANALYSIS OF THE INFLUENCE OF ADHESION ON LIMIT FORCES
TRANSFERRED BETWEEN WHEELS AND ROAD
ANALIZA WPŁYWU PRZYCZEPNOŚCI PRZYLGOWEJ NA GRANICZNE SIŁY
NA KOŁACH POJAZDU
MATEUSZ BRUKALSKI1, ANDRZEJ WĄSIEWSKI2, ANDRZEJ REŃSKI3 Warsaw University of Technology
Summary
Active safety is one of the most important factors determining the development of modern automobiles. Current vehicles are getting more and more safe, at the same time ensuring better performance. Road conditions during ride are varied and changing, just as the distribution of mass on vehicle axles depending on load distribution may change. A typical passenger car has four wheels, by means of which longitudinal and lateral forces are transferred to the road. In this article, the influence of the kind of surface and weather conditions on limit forces on vehicle wheels is shown. For this purpose, Dynamic Square Method was used (DSM). It allows to establish maximum longitudinal forces on vehicle wheels for a given lateral acceleration. DSM ensures acquiring characteristics in the form of isolines with constant values of lateral acceleration obtained for specific values of longitudinal forces on road wheels. Characteristics are within a field limited by a square, hence the
1 Warsaw University of Technology, Faculty of Automotive and Construction Machinery Engineering, Institute of Vehicles, Section of Automobiles, ul. Narbutta 84, 02-524 Warsaw; e-mail: [email protected]
2 Warsaw University of Technology, Faculty of Automotive and Construction Machinery Engineering, Institute of Vehicles, Section of Automobiles, ul. Narbutta 84, 02-524 Warsaw; e-mail: [email protected]
3 Warsaw University of Technology, Faculty of Automotive and Construction Machinery Engineering, Institute of Vehicles, Section of Automobiles, ul. Narbutta 84, 02-524 Warsaw; e-mail: [email protected]

6 The Archives of Automotive Engineering – Archiwum Motoryzacji Vol. 80, No. 2, 2018
name of the method. Analyzing the obtained characteristics, one can determine how changing the value of adhesion coefficient influences values of longitudinal forces on vehicle wheels.
Keywords: vehicle dynamics, longitudinal and lateral forces, adhesion forces, longitudinal and lateral acceleration, distribution of driving force, Dynamic Square Method
Streszczenie
Bezpieczeństwo czynne jest jednym z najważniejszych czynników decydujących o rozwoju współ-czesnych samochodów. Obecne pojazdy są coraz bezpieczniejsze, ale także zapewniają coraz lepsze osiągi. Warunki drogowe występujące podczas jazdy są często różne i zmienne, podobnie jak zmieniać się może rozkład masy na osie pojazdu w zależności od rozłożenia ładunku. Typowy samochód osobowy ma cztery koła, za pomocą których przenoszone są na drogę siły wzdłużne i poprzeczne. W niniejszym artykule pokazano wpływ rodzaju nawierzchni i warunków atmosfe-rycznych na graniczne siły na kołach pojazdu. Do tego celu wykorzystano metodę Dynamic Square Method (DSM). Pozwala ona na wyznaczenie maksymalnych sił wzdłużnych na kołach pojazdu dla danego przyspieszenia poprzecznego. Metoda DSM zapewnia uzyskanie charakterystyk w postaci izolinii o stałych wartościach przyspieszeń poprzecznych uzyskiwanych dla konkretnych wartości sił wzdłużnych na kołach jezdnych. Charakterystyki mieszczą się w polu ograniczonym czworoką-tem, od którego prawdopodobnie wywodzi się nazwa metody. Analizując uzyskane charakterystyki można określić, jaki wpływ na wartości sił wzdłużnych na kołach pojazdu ma zmiana wartości współ-czynnika przyczepności przylgowej.
Słowa kluczowe: dynamika pojazdu, siły wzdłużne i poprzeczne, siły przyczepności, przyspieszenie
wzdłużne i poprzeczne, rozdział siły napędowej, Dynamic Square Method
1. Introduction
One of the key factors influencing active safety of vehicle movement is wheel adhesion to the road, and thus the possibility to transfer tangential forces by means of the wheels. Wheel adhesion to the road derives, on the one hand, from the kind of surface and its con-dition, on the other hand, from properties of tires, characterized by adhesion coefficient. Modern vehicles are equipped with a number of systems regulating these forces. The first of these systems was, introduced in the 1980’s, Anti-Lock Braking System (ABS), and then Anti Slip Regulation (ASR) or Traction Control System (TCS). In the mid 90’s of the previ-ous century, vehicle designers developed an even more sophisticated system – Electronic Stability Program (ESP). These systems, in which regulation of wheel skidding takes place thanks to the proper control of the braking system, significantly improved the driving safe-ty and the vehicle travel comfort, especially on the roads with low adhesion coefficient.
In the mid 90’s of the previous century, the next step was to introduce TV – torque vector-ing, which varies the torque to each wheel. It has significant influence, on the one hand, on the improvement of safety, and on the other hand, on better performance. In control of the driving force distribution, Dynamic Square Method is used.
A passenger car has four wheels. Longitudinal and lateral forces, affecting a vehicle in a given moment are significant. Thus, an important aspect is to establish maximum values of these forces and to verify whether adhesion forces are enough to take over these forces, or not.

7The Archives of Automotive Engineering – Archiwum Motoryzacji Vol. 80, No. 2, 2018
DSM enables establishing maximum longitudinal forces, possible to be transferred by par-ticular wheels (axles) of a vehicle, with assumed values of lateral acceleration [1, 3]. The dependence among longitudinal forces affecting particular axles is shown by means of level graphs. Based on these characteristics, it is possible to determine what maximum longitudinal forces, and for what lateral acceleration, a given axle may transfer.
Dynamic Square Method was described in detail in article [1], and [2] shows the applica-tion of this method to analyze the influence of vehicle parameters on limit forces on road wheels. However, this article will present how limit forces on wheels are influenced by the kind of surface and weather conditions (more specifically – adhesion coefficient), in which the vehicle rides. The analysis was performed for a few kinds of surface, characterized by different values of adhesion coefficients.
2. Dynamic Square Method
Dynamic Square Method (DSM) was first mentioned in 1995. It was used by Mitsubishi engineers – M. Kato, K. Isoda and H. Yuasa [3]. It was later used to devise a system of driv-ing force distribution to vehicle wheels [6, 7 and 8], which in 1996 was applied in a vehicle model of this company. DSM is also used in publications of M. Klomp [4, 5]. As mentioned earlier, the algorithm of DSM operation was described in [1].
In this study, the possibilities of Dynamic Square Method algorithm are shown, on the example of a two-wheel vehicle model [1]. The focus was on studying the influence of adhesion coefficient on limit forces on vehicle wheels. The analyses for the surface with identical adhesion coefficient of front wheel axle μmf and rear wheel axle μmr (μmf = μmr) were conducted, as well as for cases where the coefficient is different for the front axle and the rear axle. The latter case may render e.g. a ride on a slippery surface (oil spill, icing, etc.).
The characteristics of limit forces on wheels was performed for a model vehicle, equipped with a four-wheel drive, with parameters shown in Table 2.1 and for the case where the adhesion coefficient for the front axle μmf and the rear axle μmf is different (μmf ≠ μmr).
Table. 2.1. Specifications of the model vehicle
Vehicle mass m [kg] 1450
Mass on the front axle m1 [kg] 870
Mass on the rear axle m2 [kg] 580
Wheelbase l12 [m] 2.65
Distance of the front axle from the center of mass l1 [m] 1.06
Distance of the rear axle from the center of mass l2 [m] 1.59
Height of the center of mass h [m] 0.53
Table 2.2 shows the ranges of longitudinal forces on wheels of the front (rear) axle Fx1(2). Positive values of these longitudinal forces Fx1(2) show driving forces Fn1(2), whereas nega-tive values of longitudinal forces Fx1(2) relate to braking forces Fh1(2). The values were cho-sen like this, in order to use the assumed adhesion.

8 The Archives of Automotive Engineering – Archiwum Motoryzacji Vol. 80, No. 2, 2018
Table. 2.2. The assumed ranges of driving forces and braking forces for the model vehicle
Driving force on the front wheels Fn1 [N] (0; 12 000)
Braking force on the front wheels Fh1 [N] (–12 000; 0)
Driving force on the rear wheels Fn2 [N] (0; 12 000)
Braking force on the rear wheels Fh2 [N] (–7000; 0)
The starting point for calculations using DSM is initial assumption of values of longitudinal forces on vehicle wheels. Based on this, longitudinal acceleration is established, as well as changes in vertical pressures affecting wheels of the front axle and the rear axle. Thanks to this, it is possible to establish adhesion force of each of the axles. If the force is great enough, it will be possible to transfer also the lateral force, which will enable the curvilinear motion of the vehicle. However, if the adhesion force is smaller than the assumed longitudi-nal force, the longitudinal force with such a value will not be achieved. Based on the estab-lished lateral force, the lateral acceleration for the front axle and the rear axle is calculated. The smaller value is chosen. Each pair of forces (which may be realized), corresponding to the given lateral acceleration, constitutes one point on the characteristics. Graphs made by means of Dynamic Square Method consist of thousands of points, which correspond to maximum total values obtained with a given maximum lateral acceleration. The points cor-responding to identical values of lateral acceleration are linked to create level graphs.
The graph of limit forces on wheels made according to the specifications of the model ve-hicle (Tables 2.1 and 2.2), and assuming identical adhesion coefficient of wheels od front and rear axles μmf = μmr = 1.0, was shown in Fig 2.1.
Fig. 2.1. Limit forces on wheels established using DSM for the model vehicle (h/l12 = 0.2; μmf = μmr = 1.0; m1/m2 = 1.5) [2]
9The Archives of Automotive Engineering – Archiwum Motoryzacji Vol. 80, No. 2, 2018
Characteristics obtained using DSM (Fig. 2.1) allows to establish the maximum values of longitudinal forces on vehicle wheels Fx1(2) and the values of lateral acceleration ay cor-responding to them.
Lines angled by 45° towards axis of ordinates correspond to the constants of the total value of longitudinal force on both axles. The maximum total value of driving forces on both axles is then obtained when the lateral acceleration ay equals zero, and the longitudinal acceleration is maximum (ax ≈ 9.8 m/s2). Values of driving forces for particular axles may be read from the graph (Fig. 2.1), projecting a given point on characteristics envelope onto the axis of ordinates and the axis of abscissae of the characteristics. In an analogical way the maximum total value of braking forces on both axles may be estimated. It is obtained, when lateral acceleration ay equals zero, and deceleration is maximum (ax ≈ 9.8 m/s2).
For the data assumed in Tables 2.1 and 2.2 for the point of characteristics corresponding to the maximum total value of driving forces on both axles (the upper corner in the posi-tive quarter of the coordinate system), using DSM, the following values of driving forces were obtained: for the front wheels Fn1 ≈ 5700 N and for the rear wheels Fn2 ≈ 8500 N. For the point of characteristics corresponding to the maximum total value of forces on both axles in case of braking (the bottom corner in the negative quarter of the coordinate sys-tem), using DSM, the following values of braking forces were obtained: for the front wheels Fh1 ≈ –11 400 N and for the rear wheels Fh2 ≈ – 2800 N.
3. The influence of adhesion coefficient and mass distribution on axles
In this point, the influence of adhesion coefficient µm on values of limit longitudinal forces on vehicle wheels Fx1(2) will be presented. Furthermore, in case of different value of adhe-sion coefficient of front and rear axle wheels, the influence of mass distribution on axles m1/m2 was also considered.
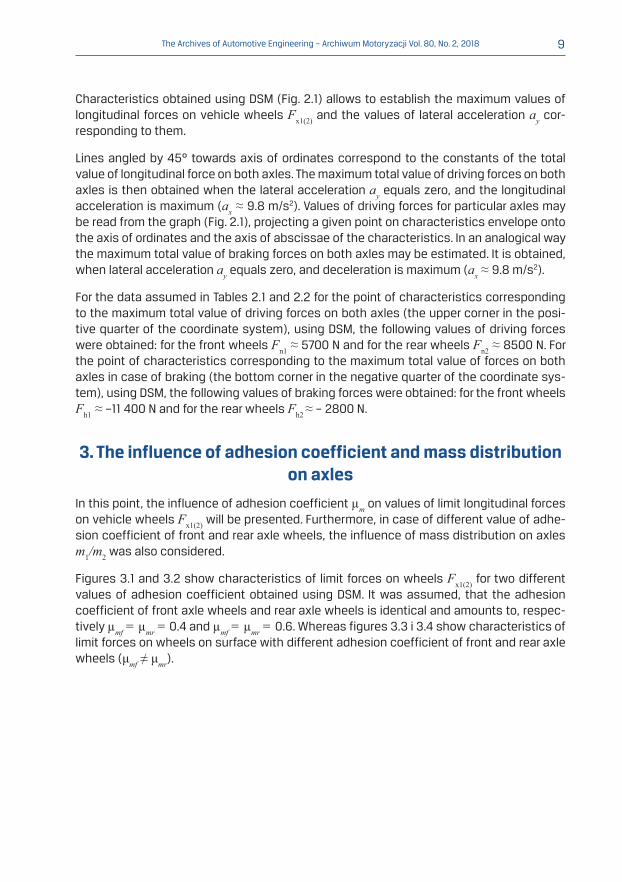
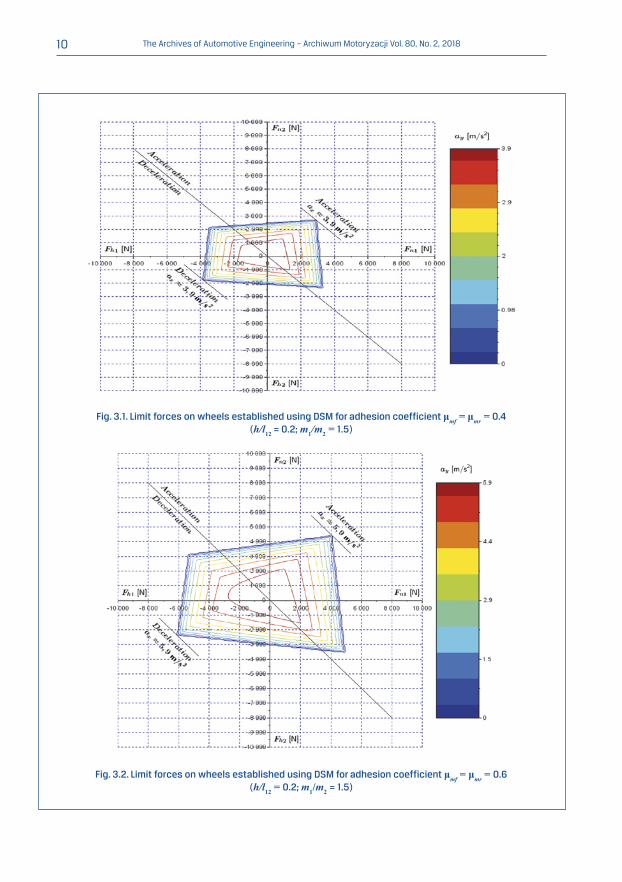
Figures 3.1 and 3.2 show characteristics of limit forces on wheels Fx1(2) for two different values of adhesion coefficient obtained using DSM. It was assumed, that the adhesion coefficient of front axle wheels and rear axle wheels is identical and amounts to, respec-tively µmf = µmr = 0.4 and µmf = µmr = 0.6. Whereas figures 3.3 i 3.4 show characteristics of limit forces on wheels on surface with different adhesion coefficient of front and rear axle wheels (μmf ≠ μmr).
10 The Archives of Automotive Engineering – Archiwum Motoryzacji Vol. 80, No. 2, 2018
Fig. 3.1. Limit forces on wheels established using DSM for adhesion coefficient μmf = μmr = 0.4 (h/l12 = 0.2; m1/m2 = 1.5)
Fig. 3.2. Limit forces on wheels established using DSM for adhesion coefficient μmf = μmr = 0.6 (h/l12 = 0.2; m1/m2 = 1.5)

11The Archives of Automotive Engineering – Archiwum Motoryzacji Vol. 80, No. 2, 2018
Table 3.1 shows the most important values obtained from characteristics of limit forces on road wheels for the earlier mentioned values of adhesion coefficient.
Table. 3.1. Overview of the most important values obtained from characteristics of limit forces on wheels for different values of an identical adhesion coefficient of front and rear axle wheels and assuming mass distribution m1/m2 = 1.5
Adhesion coefficient of the wheels μmf = μmr = 1.0 μmf = μmr = 0.6 μmf = μmr = 0.4
Total driving force on the front wheels1 Fn1 [N]
5700(100%)
4450(–22%)
2900(–49%)
Total driving force on the rear wheels1 Fn2 [N]
8500(100%)
4100(–52%)
2750(–68%)
Maximum longitudinal acceleration ax [m/s2]
9.8(100%)
5.9(–40%)
3.9(–60%)
Total braking force on the front wheels2 Fh1 [N]
–11 400(100%)
–6200(–46%)
–3850(–66%)
Total braking force on the rear wheels2 Fh2 [N]
–2800(100%)
–2350(–16%)
–1800(–36%)
Maximum deceleration ax [m/s2]
9.8(100%)
5.9(–40%)
3.9(–60%)
Maximum lateral acceleration ay [m/s2]
9.8(100%)
5.9(–40%)
3.9(–60%)
Decreasing adhesion coefficient of front and rear axle wheels from μmf = μmr = 1.0 to μmf = μmr = 0.6, and then to μmf = μmr = 0.4 results in the decrease of values such as: to-tal driving force on front and rear wheels, maximum longitudinal acceleration, total brak-ing force on front and rear wheel, maximum deceleration, maximum lateral acceleration. It is worth mentioning that decreasing forces is not proportional to decreasing adhesion coefficient. Values expressed in percentage shown in Figure 3.1 indicate increase (+) or decrease (-) of these values in relation to corresponding values for the model vehicle rid-ing on the surface with homogenous adhesion coefficient of front and rear axle wheels μmf = μmr = 1.0 (assumed as 100%).
Figures 3.3 and 3.4 show the influence of surface with different adhesion coefficient of front and rear axle wheels on obtained limit forces on vehicle wheels. Figure 3.3 shows values of limit forces on vehicle road wheels in the situation where adhesion coefficient of rear axle wheels is greater than adhesion coefficient of front axle wheels (μmf = 0.4 and μmr = 1.0). Whereas Figure 3.4 shows values of limit forces on vehicle wheels in the situ-ation where, adhesion coefficient of front wheels is greater than adhesion coefficient of rear wheels (μmf = 1.0 and μmr = 0.4).
1 Driving forces in the point of characteristics, in which maximum possible longitudinal acceleration is achieved.2 Braking forces in the point of characteristics, in which maximum possible deceleration is achieved.

12 The Archives of Automotive Engineering – Archiwum Motoryzacji Vol. 80, No. 2, 2018
Fig. 3.3. Limit forces on wheels established using DSM for different values of adhesion coefficient on the front axle μmf = 0.4 and the rear axle μmr = 1.0 (h/l12 = 0.2; m1/m2 = 1.5)
Fig. 3.4. Limit forces on wheels established using DSM for different values of adhesion coefficient on the front axle μmf = 1.0 and the rear axle μmr = 0.4 (h/l12 = 0.2; m1/m2 = 1.5)
13The Archives of Automotive Engineering – Archiwum Motoryzacji Vol. 80, No. 2, 2018
It was also studied how limit coefficient forces Fµ1(2) on front and rear axle wheels change, in case of surface with different adhesion coefficient of wheels of a given axle µmf(r), if the distribution of mass on axles changes.3
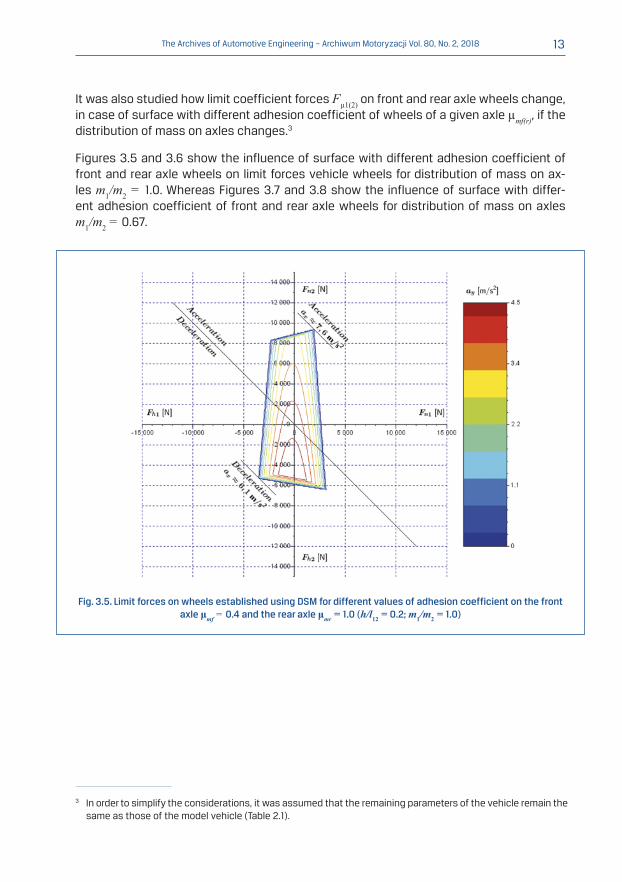
Figures 3.5 and 3.6 show the influence of surface with different adhesion coefficient of front and rear axle wheels on limit forces vehicle wheels for distribution of mass on ax-les m1/m2 = 1.0. Whereas Figures 3.7 and 3.8 show the influence of surface with differ-ent adhesion coefficient of front and rear axle wheels for distribution of mass on axles m1/m2 = 0.67.
Fig. 3.5. Limit forces on wheels established using DSM for different values of adhesion coefficient on the front axle μmf = 0.4 and the rear axle μmr = 1.0 (h/l12 = 0.2; m1/m2 = 1.0)
3 In order to simplify the considerations, it was assumed that the remaining parameters of the vehicle remain the same as those of the model vehicle (Table 2.1).
14 The Archives of Automotive Engineering – Archiwum Motoryzacji Vol. 80, No. 2, 2018
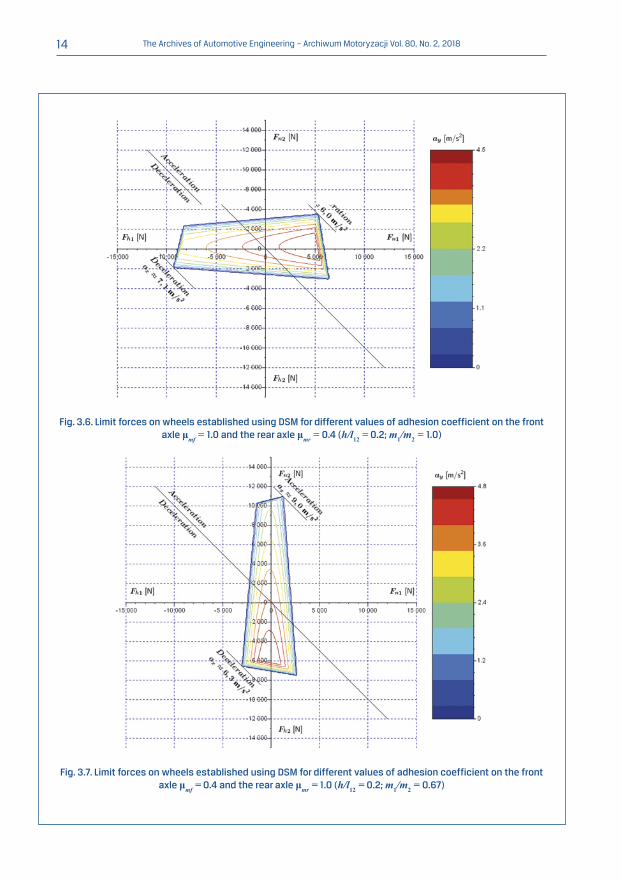
Fig. 3.6. Limit forces on wheels established using DSM for different values of adhesion coefficient on the front axle μmf = 1.0 and the rear axle μmr = 0.4 (h/l12 = 0.2; m1/m2 = 1.0)
Fig. 3.7. Limit forces on wheels established using DSM for different values of adhesion coefficient on the front axle μmf = 0.4 and the rear axle μmr = 1.0 (h/l12 = 0.2; m1/m2 = 0.67)

15The Archives of Automotive Engineering – Archiwum Motoryzacji Vol. 80, No. 2, 2018
Fig. 3.8. Limit forces on wheels established using DSM for different values of adhesion coefficient on the front axle μmf = 1.0 and the rear axle μmr = 0.4 (h/l12 = 0.2; m1/m2 = 0.67)
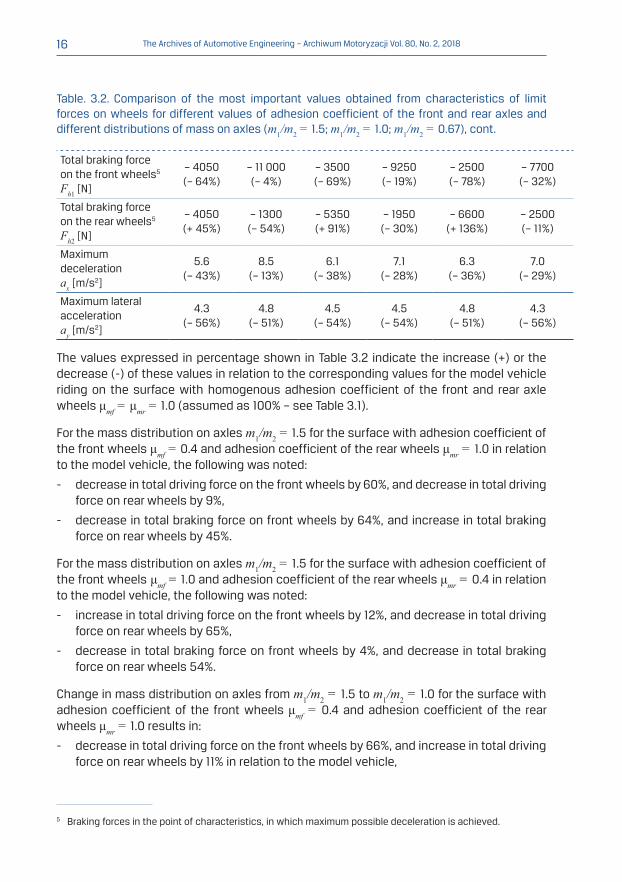
Table. 3.2. Comparison of the most important values obtained from characteristics of limit forces on wheels for different values of adhesion coefficient of the front and rear axles and different distributions of mass on axles (m1/m2 = 1.5; m1/m2 = 1.0; m1/m2 = 0.67)
Adhesion coefficient of the wheels
μmf = 0.4μmr = 1.0(m1/m2 =
1.5)
μmf = 1.0μmr = 0.4(m1/m2 =
1.5)
μmf = 0.4μmr = 1.0(m1/m2 =
1.0)
μmf =1.0μmr = 0.4(m1/m2 =
1.0)
μmf = 0.4μmr = 1.0(m1/m2 =
0.67)
μmf = 1.0μmr = 0.4(m1/m2 =
0.67)
Total driving force on the front wheels4 Fn1 [N]
2300(– 60%)
6400(+ 12%)
1950(– 66%)
5200(– 9%)
2200(– 61%)
4050(– 29%)
Total driving force on the rear wheels4 Fn2 [N]
7700(– 9%)
3000(– 65%)
9450(+ 11%)
3500(– 59%)
10 900(+ 28%)
4000(– 53%)
Maximum longitudinal acceleration ax [m/s2]
6.9(– 30%)
6.5(– 34%)
7.6(– 22%)
6.0(– 39%)
9.0(– 8%)
5.6(– 43%)
4 Driving forces in the point of characteristics, in which maximum possible longitudinal acceleration is achieved.
16 The Archives of Automotive Engineering – Archiwum Motoryzacji Vol. 80, No. 2, 2018
Total braking force on the front wheels5 Fh1 [N]
– 4050(– 64%)
– 11 000(– 4%)
– 3500(– 69%)
– 9250(– 19%)
– 2500(– 78%)
– 7700(– 32%)
Total braking force on the rear wheels5 Fh2 [N]
– 4050(+ 45%)
– 1300(– 54%)
– 5350(+ 91%)
– 1950(– 30%)
– 6600(+ 136%)
– 2500(– 11%)
Maximum deceleration ax [m/s2]
5.6(– 43%)
8.5(– 13%)
6.1(– 38%)
7.1(– 28%)
6.3(– 36%)
7.0(– 29%)
Maximum lateral acceleration ay [m/s2]
4.3(– 56%)
4.8(– 51%)
4.5(– 54%)
4.5(– 54%)
4.8(– 51%)
4.3(– 56%)
The values expressed in percentage shown in Table 3.2 indicate the increase (+) or the decrease (-) of these values in relation to the corresponding values for the model vehicle riding on the surface with homogenous adhesion coefficient of the front and rear axle wheels μmf = μmr = 1.0 (assumed as 100% – see Table 3.1).
For the mass distribution on axles m1/m2 = 1.5 for the surface with adhesion coefficient of the front wheels μmf = 0.4 and adhesion coefficient of the rear wheels μmr = 1.0 in relation to the model vehicle, the following was noted:
- decrease in total driving force on the front wheels by 60%, and decrease in total driving force on rear wheels by 9%,
- decrease in total braking force on front wheels by 64%, and increase in total braking force on rear wheels by 45%.
For the mass distribution on axles m1/m2 = 1.5 for the surface with adhesion coefficient of the front wheels μmf = 1.0 and adhesion coefficient of the rear wheels μmr = 0.4 in relation to the model vehicle, the following was noted:
- increase in total driving force on the front wheels by 12%, and decrease in total driving force on rear wheels by 65%,
- decrease in total braking force on front wheels by 4%, and decrease in total braking force on rear wheels 54%.
Change in mass distribution on axles from m1/m2 = 1.5 to m1/m2 = 1.0 for the surface with adhesion coefficient of the front wheels μmf = 0.4 and adhesion coefficient of the rear wheels μmr = 1.0 results in:
- decrease in total driving force on the front wheels by 66%, and increase in total driving force on rear wheels by 11% in relation to the model vehicle,
Table. 3.2. Comparison of the most important values obtained from characteristics of limit forces on wheels for different values of adhesion coefficient of the front and rear axles and different distributions of mass on axles (m1/m2 = 1.5; m1/m2 = 1.0; m1/m2 = 0.67), cont.
5 Braking forces in the point of characteristics, in which maximum possible deceleration is achieved.

17The Archives of Automotive Engineering – Archiwum Motoryzacji Vol. 80, No. 2, 2018
- decrease in total braking force on front wheels by 69%, and increase in total braking force on rear wheels by 91% in relation to the model vehicle.
Change in mass distribution on axles from m1/m2 = 1.5 to m1/m2 = 1.0 for the surface with adhesion coefficient of the front wheels μmf = 1.0 and adhesion coefficient of the rear wheels μmr = 0.4 results in:
- decrease in total driving force on the front wheels by 9%, and decrease in total driving force on rear wheels by 59% in relation to the model vehicle,
- decrease in total braking force on front wheels by 19%, and decrease in total braking force on rear wheels by 30% in relation to the model vehicle.
Change in mass distribution on axles from m1/m2 = 1.5 to m1/m2 = 0.67 for the surface with adhesion coefficient of the front wheels μmf = 0.4 and adhesion coefficient of the rear wheels μmr = 1.0 results in:
- decrease in total force on the front wheels by 61%, and increase in total driving force on rear wheels by 28% in relation to the model vehicle,
- decrease in total braking force on front wheels by 78%, and increase in total braking force on rear wheels by 136% in relation to the model vehicle.
Change in mass distribution on axles from m1/m2 = 1.5 to m1/m2 = 0.67 for the surface with adhesion coefficient of the front wheels μmf = 1.0 and adhesion coefficient of the rear wheels μmr = 0.4 results in:
- decrease in total driving force on the front wheels by 29%, and decrease in total driving force on rear wheels by 53% in relation to the model vehicle,
- decrease in total braking force on front wheels by 32%, and decrease in total braking force on rear wheels by 11% in relation to the model vehicle.
4. Summary
In this article, the influence of adhesion coefficient on limit forces on vehicle wheels was presented, using Dynamic Square Method (DSM). Characteristics of limit longitudi-nal forces on wheels for given values of lateral acceleration, for three different values of adhesion coefficient of the front and rear axle wheels (μmf = μmr = 1.0; μmf = μmr = 0.4; μmf = μmr = 0.6), were performed. The identical adhesion of wheels of both axles was as-sumed. Furthermore, the influence of the surface with different adhesion coefficient of the front and rear axle wheels on obtained limit forces on vehicle wheels, with constant mass distribution on axles, was shown. In the study, the adhesion coefficient of the front wheels was being decreased to the value of μmf = 0.4, while keeping the adhesion coef-ficient of the rear wheels at μmr = 1.0, and next the adhesion coefficient of the rear wheels was being decreased to the value of μmr = 0.4, while keeping the adhesion coefficient of the front wheels at μmf = 1.0. The obtained results were related to the model vehicle riding on a homogenous surface with identical adhesion coefficient of front and rear axle wheels μmf = μmr = 1.0. The influence of vehicle mass distribution on limit forces on wheels, for the case where adhesion coefficient of front and rear axle wheels is different, was also presented.
18 The Archives of Automotive Engineering – Archiwum Motoryzacji Vol. 80, No. 2, 2018
The conducted analysis confirms the significant influence of adhesion coefficient of wheels and distribution of mass on axles on values of limit longitudinal forces on wheels, and applying DSM allows to establish quantitative dependencies. The results of calcula-tions (analyses) performed in this manner may prove useful while designing active safety systems.
The full text of the article is available in Polish online on the website http://archiwummotoryzacji.pl.
Tekst artykułu w polskiej wersji językowej dostępny jest na stronie http://archiwummotoryzacji.pl.
5. References[1] Brukalski M. Introduction to dynamic square method. Zeszyty Naukowe Instytutu Pojazdów. 2015; 3(103):
29-35.
[2] Brukalski M. The analysis of the impact of selected vehicle parameters on the limit forces on the vehicle's drive wheels. The Archives of Automotive Engineering – Archiwum Motoryzacji. 2017; 2(76): 5-16.
[3] Kato M, Isoda K, Yuasa H: Study on vehicle dynamics in marginal condition using dynamic square method. SAE Technical Paper. 1995; no 9531020: 69-74.
[4] Klomp M. Passenger Car All-Wheel Drive Systems Analysis. Degree Project University of Trollhättan/Uddevalla. Sweden: 2004.
[5] Klomp M. On Drive Force Distribution and Road Vehicle Handling-A Study of Understeer and Lateral Grip. Chalmers University of Technology. Sweden: 2007.
[6] Sawase K, Ushiroda Y, Inoue K. Effect of the Right-and-left Torque Vectoring System in Various Types of Drivetrain. SAE Technical Paper. 2007; 2007-01-3645: 1-8. doi:10.4271/2007-01-3645.
[7] Sawase K, Ushiroda Y. Improvement of Vehicle Dynamics by Right-and-Left Torque Vectoring System in Various Drivetrains. Mitsubishi Motors Technical Review. 2008; no 20: 14-20.
[8] Ushiroda Y, Sawase K, Takahashi N, Suzuki K, Manabe K. Development of Super AYC. Technical Review. 2003; no 15: 73-76.

19The Archives of Automotive Engineering – Archiwum Motoryzacji Vol. 80, No. 2, 2018
Article citation info:Chlopek Z, Strzalkowska K. Research on the impact of automotive sources on the immission of specific size fractions of particulate matter in a street canyon. The Archives of Automotive Engineering – Archiwum Motoryzacji. 2018; 80(2): 19-35. http://dx.doi.org/10.14669/AM.VOL80.ART2
RESEARCH ON THE IMPACT OF AUTOMOTIVE SOURCES
ON THE IMMISSION OF SPECIFIC SIZE FRACTIONS OF PARTICULATE MATTER
IN A STREET CANYON
BADANIA WPŁYWU ŹRÓDEŁ MOTORYZACYJNYCH NA IMISJĘ FRAKCJI
WYMIAROWYCH CZĄSTEK STAŁYCH W KANIONIE ULICZNYM
ZDZISŁAW CHŁOPEK1, KATARZYNA STRZAŁKOWSKA2
Warsaw University of TechnologyAutomotive Industry Institute (PIMOT)
Summary
The article presents results of empirical survey of the immission of specific size fractions of particulate matter as well as carbon monoxide and nitrogen oxides in the street canyon area in Warsaw in a summer month. The data characterizing the weather conditions and motor vehicle traffic intensity, collected during the survey, were also examined. The data subjected to the analysis included measurement results obtained from the “Warszawa-Komunikacyjna” Air Quality Monitoring Station in Warsaw at Aleja Niepodległości 227/233 and results of measurements carried out at the same place
1 Warsaw University of Technology, Faculty of Automotive and Construction Machinery Engineering, Institute of Vehicles, ul. Narbutta 84, 02-524 Warszawa, Poland; e-mail: [email protected]
2 Automotive Industry Institute (PIMOT), Material Testing Laboratory, ul. Jagiellońska 55, 01-301 Warszawa, Poland; e-mail: [email protected]
20 The Archives of Automotive Engineering – Archiwum Motoryzacji Vol. 80, No. 2, 2018
by PIMOT with the use of a TSI dust meter. The immission of the PM10, PM2.5, and PM1 particulate matter fractions was examined. It was found that automotive sources exerted a marked impact on the immission of various particulate matter size fractions, especially fine dusts. The correlational interdependence between the immission of particulate matter PM10 and the immission of nitrogen dioxide and carbon monoxide was also studied, based on results of measurements carried out at the Air Quality Monitoring Station. The correlation was found to be weak, probably because of the measurement method used. The correlational examination of the immission of individual particulate matter size fractions, based on measurement results obtained with using a dust meter, showed the correlation to be very strong. In general, pollutant emission from motor vehicles was found to have a considerable impact on the particulate matter immission in the street canyon area, especially on the immission of fine dust fractions.
Keywords: pollutant immission, particulate matter, motorization, street canyon
Streszczenie
W artykule przedstawiono wyniki badań empirycznych imisji frakcji wymiarowych pyłów oraz tlenku węgla i tlenków azotu w okolicach kanionu ulicznego w Warszawie w miesiącu letnim. Badano rów-nież wyniki charakteryzujące warunki atmosferyczne oraz natężenie ruchu samochodów. Do analizy wykorzystano wyniki badań, wykonywanych na stacji nadzorowania jakości powietrza Warszawa-Komunikacyjna przy Al. Niepodległości 227/233, oraz przeprowadzanych przy użyciu pyłomierza fir-my TSI. Badano imisję frakcji wymiarowych cząstek stałych: PM10, PM2.5 i PM1. Stwierdzono wyraźny wpływ źródeł motoryzacyjnych na imisję frakcji wymiarowych pyłów, szczególnie pyłów drobnych. Badano również zależność korelacyjną imisji zanieczyszczeń cząstek stałych PM10 oraz dwutlen-ku azotu i tlenku węgla – na podstawie wyników badań na stacji nadzorowania jakości powietrza. Stwierdzono słabą korelację, co wynikało prawdopodobnie z zastosowanej metodyki pomiarów. Badania korelacyjne imisji frakcji wymiarowych cząstek stałych, wykonane na podstawie wyników badań wykonanych przy użyciu pyłomierza, wykazały bardzo silną korelację. Ogólnie stwierdzo-no istotny wpływ emisji zanieczyszczeń z pojazdów samochodowych na imisję cząstek stałych w kanionie ulicznym, szczególnie na imisje drobnych frakcji wymiarowych pyłów.
Słowa kluczowe: imisja zanieczyszczeń, cząstki stałe, motoryzacja, kanion uliczny
1. Introduction
The pollution of atmospheric air is a very serious problem, especially in large urban ag-glomerations. The pollutants may be both gaseous and particulate. Dust is defined as the dispersed phase of a two-phase system consisting of a solid body, i.e. small solid parti-cles, suspended in gaseous dispersion medium. In general, dust is a mixture of particulate matter suspended in atmospheric air [5–9, 11, 15, 16].
The particulate matter may be categorized in respect of the equivalent particle size, which depends on the aerodynamic equivalent diameter (AED) of the particle. The following par-ticulate matter fractions are usually discerned [1–5, 7, 8, 10, 11, 15–17]:
– TSP (total suspended particles), with AED below 300 µm,
– fine dust PM10, with AED below 10 µm,
– fine dust PM2.5, suspended particulate matter with AED below 2.5 µm,
21The Archives of Automotive Engineering – Archiwum Motoryzacji Vol. 80, No. 2, 2018
– dust PM1, with AED below 1 µm, taken into consideration at the testing of internal com-bustion engines.
Particulate pollutants have a considerable impact on human health. This impact depends on particle size, shape, and chemical composition. The dust most dangerous to human health is the fine-grained particulate matter because it reaches the deepest portions of the human respiratory system, where it accumulates and, in a part, is absorbed. Moreover, the finest dusts penetrate into the cardiovascular system and thus, they may spread all over the organism; in particular, they may reach the brain [5, 7–9, 12, 13, 15, 16].
2. Methods of the research
The research was undertaken to assess the impact of automotive sources of pollutant emission on the values of immission of individual particulate matter size fractions in the atmospheric air in the street canyon in the Warsaw urban agglomeration.
The models of immission (I) of particulate matter PM2.5 and PM1 are built in accordance with the functional similarity criterion [1–3, 7, 8], with using the definitions of individual dust categories. The set of dusts with AED below 2.5 µm, i.e. PM2.5, is treated as a subset of the set of particulate matter with AED below 10 µm (PM10) and the particulate matter PM1 constitutes a subset of the set defined as PM2.5. The immission of particulate matter PM2.5 is modelled as linearly dependent on the immission of the PM10 dust [1–3, 5, 10, 14]:
Particulate pollutants have a considerable impact on human health. This impact depends on particle size, shape, and chemical composition. The dust most dangerous to human health is the fine-grained particulate matter because it reaches the deepest portions of the human respiratory system, where it accumulates and, in a part, is absorbed. Moreover, the finest dusts penetrate into the cardiovascular system and thus, they may spread all over the organism; in particular, they may reach the brain [5, 7–9,12, 13, 15, 16].
2. Methods of the research
The research was undertaken to assess the impact of automotive sources of pollutant emission on the values of immission of individual particulate matter size fractions in the atmospheric air in the street canyon in the Warsaw urban agglomeration.
The models of immission (I) of particulate matter PM2.5 and PM1 are built in accordance with the functional similarity criterion [1–3, 7, 8], with using the definitions of individual dust categories. The set of dusts with AED below 2.5 μm, i.e. PM2.5, is treated as a subset of the set of particulate matter with AED below 10 μm (PM10) and the particulate matter PM1 constitutes a subset of the set defined as PM2.5. The immission of particulate matter PM2.5 is modelled as linearly dependenton the immission of the PM10 dust [1–3, 5, 10, 14]:
10PM10PM5.2PM5.2PM IkI ⋅= − (1)
where kPM2.5-PM10 – coefficient of the model of immission of the PM2.5 dust (kPM2.5-PM10 ∈ <0;1>).
The immission of particulate matter PM1 is modelled as linearly dependent on the PM2.5 immission [1, 3, 10, 14]:
5.2PM5.2PM1PM1PM IkI ⋅= − (2)
where kPM1-PM2.5 – coefficient of the model of immission of the PM1 dust (kPM1-PM2.5 ∈ <0;1>).
The PM1 dust is also a subset of the PM10 particulate matter; therefore, its immission may also be modelled as linearly dependent on the immission of the PM10 dust [1, 3, 10, 14]:
10PM10PM1PM1PM IkI ⋅= − (3)
where kPM1-PM10 – coefficient of the model of immission of the PM1 dust (kPM1-PM10 ∈ <0;1>).
The models of immission of particulate matter PM2.5 and PM1 are identified by determining the model coefficients based on results of empirical measurements [1, 3, 10, 14].
The models of immission of the PM10 particulate matter are also built in accordance with the functional similarity criterion.They include models of immission of the particulate matter with AED below 10 μm where these immission is treated as linearly dependent on the immission of nitrogen oxides (or nitrogen dioxide in some of the said models) or on the immission of carbon monoxide [3, 10, 14]:
xNONOx1NOx010PM IaaI ⋅+= (4)
CO1CO0COPM10 IaaI ⋅+= (5)
The measuring stand was located at the “Warszawa-Komunikacyjna” Air Quality Monitoring Station operating within the State Environmental Monitoring. The Station is owned by the Provincial Inspectorate of Environmental Protection (WIOŚ) and located in Warsaw at Aleja Niepodległości 227/233 (Station code: PL0140A), in an urban area, commercial and residential zone. The Station has been situated immediately at the western carriageway of Aleja Niepodległości (leading towards the Ursynów district) [14]. The immission of the following pollutants and the following meteorological characteristics of the atmospheric air are measured at the said Station:– nitrogen dioxide,– carbon monoxide,– suspended particulate matter PM10,– suspended particulate matter PM2.5,– benzene,– 1,2-xylene,– methylbenzene,– 1,3-xylene 1,4-xylene,– ethylbenzene,– relative humidity,– air temperature.
where kPM2.5-PM10 – coefficient of the model of immission of the PM2.5 dust (kPM2.5-PM10 <0;1>).
The immission of particulate matter PM1 is modelled as linearly dependent on the PM2.5 immission [1, 3, 10, 14]:
Particulate pollutants have a considerable impact on human health. This impact depends on particle size, shape, and chemical composition. The dust most dangerous to human health is the fine-grained particulate matter because it reaches the deepest portions of the human respiratory system, where it accumulates and, in a part, is absorbed. Moreover, the finest dusts penetrate into the cardiovascular system and thus, they may spread all over the organism; in particular, they may reach the brain [5, 7–9,12, 13, 15, 16].
2. Methods of the research
The research was undertaken to assess the impact of automotive sources of pollutant emission on the values of immission of individual particulate matter size fractions in the atmospheric air in the street canyon in the Warsaw urban agglomeration.
The models of immission (I) of particulate matter PM2.5 and PM1 are built in accordance with the functional similarity criterion [1–3, 7, 8], with using the definitions of individual dust categories. The set of dusts with AED below 2.5 μm, i.e. PM2.5, is treated as a subset of the set of particulate matter with AED below 10 μm (PM10) and the particulate matter PM1 constitutes a subset of the set defined as PM2.5. The immission of particulate matter PM2.5 is modelled as linearly dependenton the immission of the PM10 dust [1–3, 5, 10, 14]:
10PM10PM5.2PM5.2PM IkI ⋅= − (1)
where kPM2.5-PM10 – coefficient of the model of immission of the PM2.5 dust (kPM2.5-PM10 ∈ <0;1>).
The immission of particulate matter PM1 is modelled as linearly dependent on the PM2.5 immission [1, 3, 10, 14]:
5.2PM5.2PM1PM1PM IkI ⋅= − (2)
where kPM1-PM2.5 – coefficient of the model of immission of the PM1 dust (kPM1-PM2.5 ∈ <0;1>).
The PM1 dust is also a subset of the PM10 particulate matter; therefore, its immission may also be modelled as linearly dependent on the immission of the PM10 dust [1, 3, 10, 14]:
10PM10PM1PM1PM IkI ⋅= − (3)
where kPM1-PM10 – coefficient of the model of immission of the PM1 dust (kPM1-PM10 ∈ <0;1>).
The models of immission of particulate matter PM2.5 and PM1 are identified by determining the model coefficients based on results of empirical measurements [1, 3, 10, 14].
The models of immission of the PM10 particulate matter are also built in accordance with the functional similarity criterion.They include models of immission of the particulate matter with AED below 10 μm where these immission is treated as linearly dependent on the immission of nitrogen oxides (or nitrogen dioxide in some of the said models) or on the immission of carbon monoxide [3, 10, 14]:
xNONOx1NOx010PM IaaI ⋅+= (4)
CO1CO0COPM10 IaaI ⋅+= (5)
The measuring stand was located at the “Warszawa-Komunikacyjna” Air Quality Monitoring Station operating within the State Environmental Monitoring. The Station is owned by the Provincial Inspectorate of Environmental Protection (WIOŚ) and located in Warsaw at Aleja Niepodległości 227/233 (Station code: PL0140A), in an urban area, commercial and residential zone. The Station has been situated immediately at the western carriageway of Aleja Niepodległości (leading towards the Ursynów district) [14]. The immission of the following pollutants and the following meteorological characteristics of the atmospheric air are measured at the said Station:– nitrogen dioxide,– carbon monoxide,– suspended particulate matter PM10,– suspended particulate matter PM2.5,– benzene,– 1,2-xylene,– methylbenzene,– 1,3-xylene 1,4-xylene,– ethylbenzene,– relative humidity,– air temperature.
where kPM1-PM2.5 – coefficient of the model of immission of the PM1 dust (kPM1-PM2.5 <0;1>).
The PM1 dust is also a subset of the PM10 particulate matter; therefore, its immission may also be modelled as linearly dependent on the immission of the PM10 dust [1, 3, 10, 14]:
Particulate pollutants have a considerable impact on human health. This impact depends on particle size, shape, and chemical composition. The dust most dangerous to human health is the fine-grained particulate matter because it reaches the deepest portions of the human respiratory system, where it accumulates and, in a part, is absorbed. Moreover, the finest dusts penetrate into the cardiovascular system and thus, they may spread all over the organism; in particular, they may reach the brain [5, 7–9,12, 13, 15, 16].
2. Methods of the research
The research was undertaken to assess the impact of automotive sources of pollutant emission on the values of immission of individual particulate matter size fractions in the atmospheric air in the street canyon in the Warsaw urban agglomeration.
The models of immission (I) of particulate matter PM2.5 and PM1 are built in accordance with the functional similarity criterion [1–3, 7, 8], with using the definitions of individual dust categories. The set of dusts with AED below 2.5 μm, i.e. PM2.5, is treated as a subset of the set of particulate matter with AED below 10 μm (PM10) and the particulate matter PM1 constitutes a subset of the set defined as PM2.5. The immission of particulate matter PM2.5 is modelled as linearly dependenton the immission of the PM10 dust [1–3, 5, 10, 14]:
10PM10PM5.2PM5.2PM IkI ⋅= − (1)
where kPM2.5-PM10 – coefficient of the model of immission of the PM2.5 dust (kPM2.5-PM10 ∈ <0;1>).
The immission of particulate matter PM1 is modelled as linearly dependent on the PM2.5 immission [1, 3, 10, 14]:
5.2PM5.2PM1PM1PM IkI ⋅= − (2)
where kPM1-PM2.5 – coefficient of the model of immission of the PM1 dust (kPM1-PM2.5 ∈ <0;1>).
The PM1 dust is also a subset of the PM10 particulate matter; therefore, its immission may also be modelled as linearly dependent on the immission of the PM10 dust [1, 3, 10, 14]:
10PM10PM1PM1PM IkI ⋅= − (3)
where kPM1-PM10 – coefficient of the model of immission of the PM1 dust (kPM1-PM10 ∈ <0;1>).
The models of immission of particulate matter PM2.5 and PM1 are identified by determining the model coefficients based on results of empirical measurements [1, 3, 10, 14].
The models of immission of the PM10 particulate matter are also built in accordance with the functional similarity criterion.They include models of immission of the particulate matter with AED below 10 μm where these immission is treated as linearly dependent on the immission of nitrogen oxides (or nitrogen dioxide in some of the said models) or on the immission of carbon monoxide [3, 10, 14]:
xNONOx1NOx010PM IaaI ⋅+= (4)
CO1CO0COPM10 IaaI ⋅+= (5)
The measuring stand was located at the “Warszawa-Komunikacyjna” Air Quality Monitoring Station operating within the State Environmental Monitoring. The Station is owned by the Provincial Inspectorate of Environmental Protection (WIOŚ) and located in Warsaw at Aleja Niepodległości 227/233 (Station code: PL0140A), in an urban area, commercial and residential zone. The Station has been situated immediately at the western carriageway of Aleja Niepodległości (leading towards the Ursynów district) [14]. The immission of the following pollutants and the following meteorological characteristics of the atmospheric air are measured at the said Station:– nitrogen dioxide,– carbon monoxide,– suspended particulate matter PM10,– suspended particulate matter PM2.5,– benzene,– 1,2-xylene,– methylbenzene,– 1,3-xylene 1,4-xylene,– ethylbenzene,– relative humidity,– air temperature.
where kPM1-PM10 – coefficient of the model of immission of the PM1 dust (kPM1-PM10 <0;1>).
The models of immission of particulate matter PM2.5 and PM1 are identified by determining the model coefficients based on results of empirical measurements [1, 3, 10, 14].
The models of immission of the PM10 particulate matter are also built in accordance with the functional similarity criterion. They include models of immission of the particulate mat-ter with AED below 10 µm where these immission is treated as linearly dependent on the immission of nitrogen oxides (or nitrogen dioxide in some of the said models) or on the immission of carbon monoxide [3, 10, 14]:
22 The Archives of Automotive Engineering – Archiwum Motoryzacji Vol. 80, No. 2, 2018
Particulate pollutants have a considerable impact on human health. This impact depends on particle size, shape, and chemical composition. The dust most dangerous to human health is the fine-grained particulate matter because it reaches the deepest portions of the human respiratory system, where it accumulates and, in a part, is absorbed. Moreover, the finest dusts penetrate into the cardiovascular system and thus, they may spread all over the organism; in particular, they may reach the brain [5, 7–9,12, 13, 15, 16].
2. Methods of the research
The research was undertaken to assess the impact of automotive sources of pollutant emission on the values of immission of individual particulate matter size fractions in the atmospheric air in the street canyon in the Warsaw urban agglomeration.
The models of immission (I) of particulate matter PM2.5 and PM1 are built in accordance with the functional similarity criterion [1–3, 7, 8], with using the definitions of individual dust categories. The set of dusts with AED below 2.5 μm, i.e. PM2.5, is treated as a subset of the set of particulate matter with AED below 10 μm (PM10) and the particulate matter PM1 constitutes a subset of the set defined as PM2.5. The immission of particulate matter PM2.5 is modelled as linearly dependenton the immission of the PM10 dust [1–3, 5, 10, 14]:
10PM10PM5.2PM5.2PM IkI ⋅= − (1)
where kPM2.5-PM10 – coefficient of the model of immission of the PM2.5 dust (kPM2.5-PM10 ∈ <0;1>).
The immission of particulate matter PM1 is modelled as linearly dependent on the PM2.5 immission [1, 3, 10, 14]:
5.2PM5.2PM1PM1PM IkI ⋅= − (2)
where kPM1-PM2.5 – coefficient of the model of immission of the PM1 dust (kPM1-PM2.5 ∈ <0;1>).
The PM1 dust is also a subset of the PM10 particulate matter; therefore, its immission may also be modelled as linearly dependent on the immission of the PM10 dust [1, 3, 10, 14]:
10PM10PM1PM1PM IkI ⋅= − (3)
where kPM1-PM10 – coefficient of the model of immission of the PM1 dust (kPM1-PM10 ∈ <0;1>).
The models of immission of particulate matter PM2.5 and PM1 are identified by determining the model coefficients based on results of empirical measurements [1, 3, 10, 14].
The models of immission of the PM10 particulate matter are also built in accordance with the functional similarity criterion.They include models of immission of the particulate matter with AED below 10 μm where these immission is treated as linearly dependent on the immission of nitrogen oxides (or nitrogen dioxide in some of the said models) or on the immission of carbon monoxide [3, 10, 14]:
xNONOx1NOx010PM IaaI ⋅+= (4)
CO1CO0COPM10 IaaI ⋅+= (5)
The measuring stand was located at the “Warszawa-Komunikacyjna” Air Quality Monitoring Station operating within the State Environmental Monitoring. The Station is owned by the Provincial Inspectorate of Environmental Protection (WIOŚ) and located in Warsaw at Aleja Niepodległości 227/233 (Station code: PL0140A), in an urban area, commercial and residential zone. The Station has been situated immediately at the western carriageway of Aleja Niepodległości (leading towards the Ursynów district) [14]. The immission of the following pollutants and the following meteorological characteristics of the atmospheric air are measured at the said Station:– nitrogen dioxide,– carbon monoxide,– suspended particulate matter PM10,– suspended particulate matter PM2.5,– benzene,– 1,2-xylene,– methylbenzene,– 1,3-xylene 1,4-xylene,– ethylbenzene,– relative humidity,– air temperature.
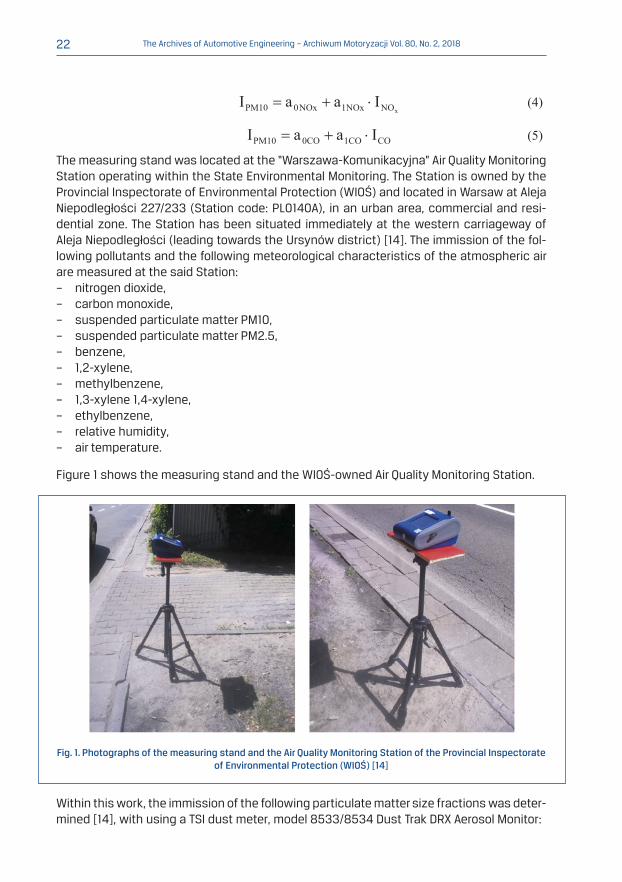
The measuring stand was located at the “Warszawa-Komunikacyjna” Air Quality Monitoring Station operating within the State Environmental Monitoring. The Station is owned by the Provincial Inspectorate of Environmental Protection (WIOŚ) and located in Warsaw at Aleja Niepodległości 227/233 (Station code: PL0140A), in an urban area, commercial and resi-dential zone. The Station has been situated immediately at the western carriageway of Aleja Niepodległości (leading towards the Ursynów district) [14]. The immission of the fol-lowing pollutants and the following meteorological characteristics of the atmospheric air are measured at the said Station:– nitrogen dioxide,– carbon monoxide,– suspended particulate matter PM10,– suspended particulate matter PM2.5,– benzene,– 1,2-xylene,– methylbenzene,– 1,3-xylene 1,4-xylene,– ethylbenzene,– relative humidity,– air temperature.
Figure 1 shows the measuring stand and the WIOŚ-owned Air Quality Monitoring Station.
Fig. 1. Photographs of the measuring stand and the Air Quality Monitoring Station of the Provincial Inspectorate of Environmental Protection (WIOŚ) [14]
Within this work, the immission of the following particulate matter size fractions was deter-mined [14], with using a TSI dust meter, model 8533/8534 Dust Trak DRX Aerosol Monitor:
23The Archives of Automotive Engineering – Archiwum Motoryzacji Vol. 80, No. 2, 2018
– TSP (total suspended particles), i.e. a mixture of particulate matter with equivalent par-ticle size below 300 µm,
– particulate matter PM10 (airborne dust), i.e. particulate matter with equivalent particle size below 10 µm,
– particulate matter PM2.5 (fine dust), i.e. particulate matter with equivalent particle size below 2.5 µm,
– particulate matter PM1 (dust practically invisible to the naked eye), i.e. particulate mat-ter with equivalent particle size below 1 µm.
The particulate matter immission was measured once per minute; then, the measurement results were averaged for a one-hour period. The scope of the survey also included meas-urements of motor vehicle traffic intensity, with discerning small vehicles (i.e. passenger cars – PC), large vehicles (which included light commercial vehicles – LCV, heavy duty ve-hicles – HDV, and buses – B), and motorcycles –Mc. The motor vehicle traffic intensity was determined by observations carried out during the pollutant immission measurements. Moreover, current weather conditions, i.e. ambient temperature, air humidity, wind velocity, and precipitations, were monitored [14].
The place of carrying out the measurements was chosen on purpose because the meas-urement results obtained from the Air Quality Monitoring Station were also analysed [14].
3. Results of empirical measurements
The measurements were carried out in July 2016. In this article, only selected measure-ment results have been presented, obtained on 5 July 2016 [14].
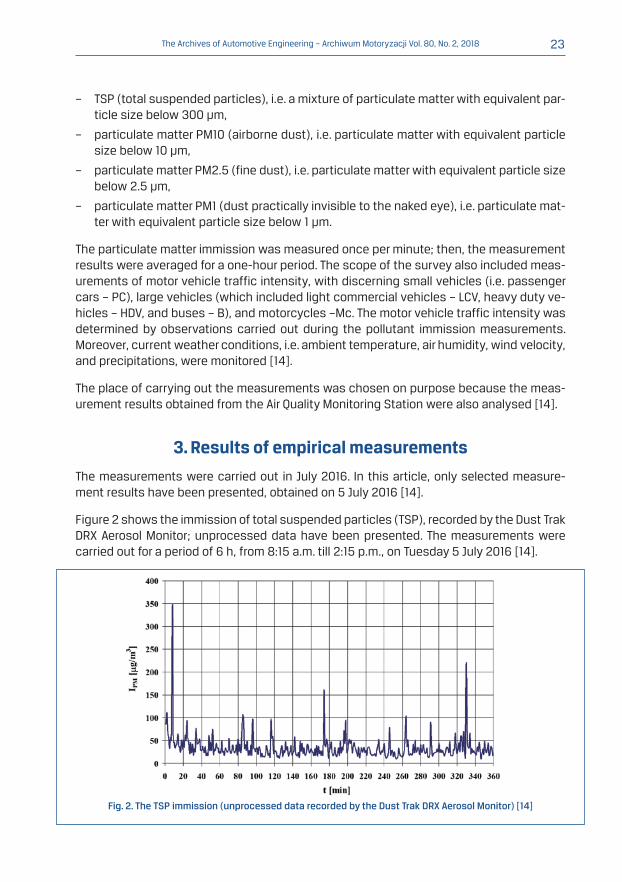
Figure 2 shows the immission of total suspended particles (TSP), recorded by the Dust Trak DRX Aerosol Monitor; unprocessed data have been presented. The measurements were carried out for a period of 6 h, from 8:15 a.m. till 2:15 p.m., on Tuesday 5 July 2016 [14].
Fig. 2. The TSP immission (unprocessed data recorded by the Dust Trak DRX Aerosol Monitor) [14]

24 The Archives of Automotive Engineering – Archiwum Motoryzacji Vol. 80, No. 2, 2018
Figure 3 shows the TSP immission, recorded by the Dust Trak DRX Aerosol Monitor; the data were then smoothed by 1st-order and 2nd-order non-recursive filters for the share of high-frequency noise in the signal to be reduced [14]:
where: x – input signal,
y – signal processed by the 1st-order filter,
z – signal processed by the 2nd-order filter (in relation to the input signal),
n – successive number of a signal sample.
Fig. 3. The TSP immission (data recorded by the Dust Trak DRX Aerosol Monitor and smoothed by filtration) [14]
At the beginning of the measuring period, an increased value of the TSP immission was ob-served, which might be explained by minor traffic congestions that occurred at that time. The cyclic growths and drops in the TSP immission were caused by changing traffic lights at the intersection of Aleja Niepodległości with ulica Nowowiejska. In the curve shown in figure 3, smoothed with using the 1st-order and 2nd-order non-recursive filters, the cyclic growths and drops in the TSP immission are already not so conspicuous. The marked local peaks, such as the one around the 175th minute of the measuring period, were caused by the passage of a delivery motor vehicle that emitted a considerable amount of exhaust gases [14].
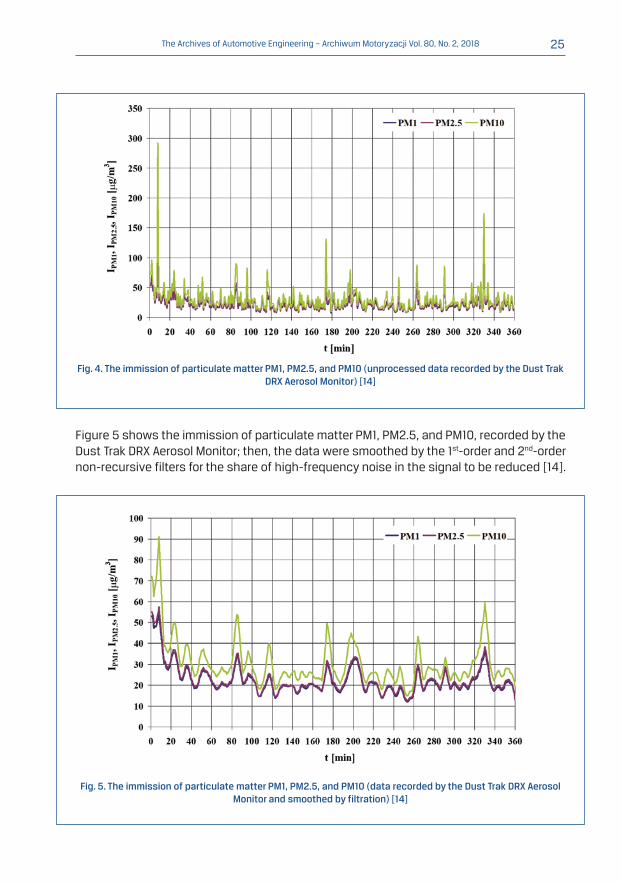
Figure 4 shows the immission of particulate matter PM1, PM2.5, and PM10, recorded by the Dust Trak DRX Aerosol Monitor; unprocessed data have been presented [14].
25The Archives of Automotive Engineering – Archiwum Motoryzacji Vol. 80, No. 2, 2018
Fig. 4. The immission of particulate matter PM1, PM2.5, and PM10 (unprocessed data recorded by the Dust Trak DRX Aerosol Monitor) [14]
Figure 5 shows the immission of particulate matter PM1, PM2.5, and PM10, recorded by the Dust Trak DRX Aerosol Monitor; then, the data were smoothed by the 1st-order and 2nd-order non-recursive filters for the share of high-frequency noise in the signal to be reduced [14].
Fig. 5. The immission of particulate matter PM1, PM2.5, and PM10 (data recorded by the Dust Trak DRX Aerosol Monitor and smoothed by filtration) [14]
26 The Archives of Automotive Engineering – Archiwum Motoryzacji Vol. 80, No. 2, 2018
The immission of particulate matter PM1 and PM2.5 was found to be close to each other. The particulate matter coming from automotive sources chiefly consists of fine-grained material, i.e. the PM1 and PM2.5 dust. The immission of particulate matter PM10 was addi-tionally affected by the secondary stirring up of dust from road surface and reserved track tramway. Such a phenomenon could actually be seen to occur during the measurements [14].
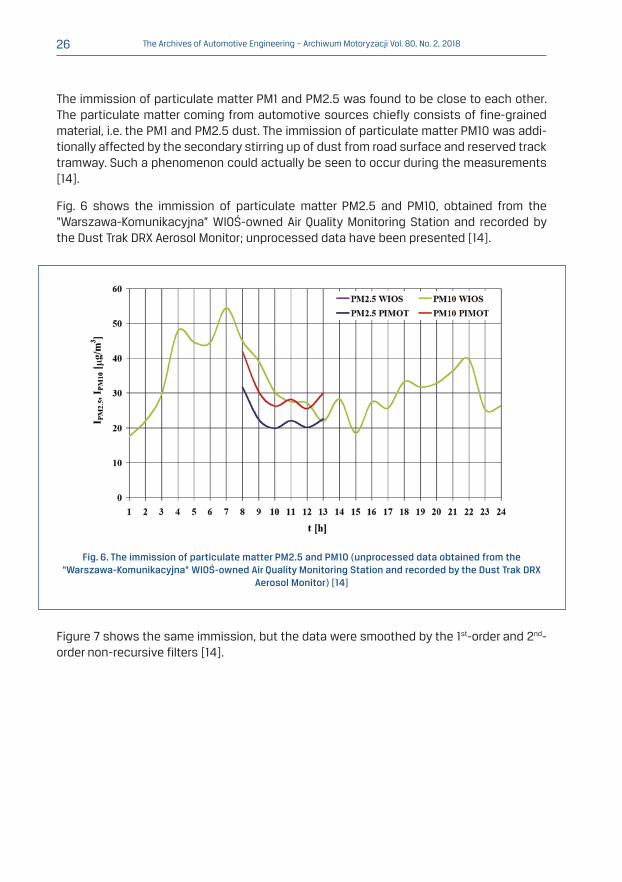
Fig. 6 shows the immission of particulate matter PM2.5 and PM10, obtained from the “Warszawa-Komunikacyjna” WIOŚ-owned Air Quality Monitoring Station and recorded by the Dust Trak DRX Aerosol Monitor; unprocessed data have been presented [14].
Fig. 6. The immission of particulate matter PM2.5 and PM10 (unprocessed data obtained from the “Warszawa-Komunikacyjna” WIOŚ-owned Air Quality Monitoring Station and recorded by the Dust Trak DRX
Aerosol Monitor) [14]
Figure 7 shows the same immission, but the data were smoothed by the 1st-order and 2nd-order non-recursive filters [14].

27The Archives of Automotive Engineering – Archiwum Motoryzacji Vol. 80, No. 2, 2018
Fig. 7. The immission of particulate matter PM2.5, and PM10 (data obtained from the “Warszawa-Komunikacyjna” WIOŚ-owned Air Quality Monitoring Station and recorded by the Dust Trak DRX Aerosol Monitor;
the data were smoothed by filtration) [14]
The results of measurements of the PM10 immission, obtained from the Air Quality Monitoring Station and recorded by the dust meter, do not significantly differ from each other. Conversely, big differences can be seen in the case of particulate matter PM2.5. The reasons for such a finding are difficult for identifying; undoubtedly, however, the very low PM2.5 immission in comparison with the immission of the PM10 dust as reported by the Air Quality Monitoring Station is not typical for the pollutants emitted from automotive sources. For such pollutants, the very fine dust predominates in the whole set of particu-late matter [1–3, 5, 7, 8, 10], as it can be seen in the measurement results obtained from the Dust Trak DRX Aerosol Monitor.
Raised PM2.5 and PM10 immission was observed in the morning rush hours; moreover, they were higher again between 8 p.m. and 10 p.m., i.e. after the evening rush hours.
The scope of the survey also included the observation of current weather conditions such as ambient temperature, air humidity, wind velocity, and precipitations. The air temperature and humidity measurement results were obtained from the “Warszawa-Komunikacyjna” WIOŚ-owned Air Quality Monitoring Station. The wind velocity was measured with using a TSI thermal anemometer model 9535 VelociCalc [14].
The results of measurements of temperature (T) and relative humidity (w) of the ambient air have been presented in figure 8.

28 The Archives of Automotive Engineering – Archiwum Motoryzacji Vol. 80, No. 2, 2018
Fig. 8. The temperature (T) and relative humidity (w) of the ambient air (data obtained from the “Warszawa-Komunikacyjna” WIOŚ-owned Air Quality Monitoring Station) [14]
On the day when the measurements were carried out, the ambient temperature was within a range of (13 ÷ 24) °C and the relative humidity varied between 26% and 70%. The average temperature and humidity values did not exceed 20 °C and 45%, respectively. The air tem-perature and humidity on that day did not have a considerable impact on the particulate matter immission values [14].
The results of measurement of wind velocity and ambient air temperature have been pre-sented in table. Unfortunately, the measurements were not continuously carried out be-cause of limited capabilities of the test equipment available [14].
Table. Wind velocity and ambient air temperature [14]
TimeWind
velocityAir
temperatureTime
Wind velocity
Air temperature
h:min:s m/s °C h:min:s m/s °C
08:16:58 1.67 23.6 11:05:32 0.95 28.7
08:17:13 1.6 23 11:05:58 0.17 28.7
08:17:28 0.89 22.8 11:21:00 0.59 32
08:17:55 0.97 22.6 11:21:25 0.66 30.7
08:18:10 1.12 22.3 11:21:48 1.59 27.7
09:24:05 1.53 25.8 11:22:29 0.55 25.7
09:24:20 0.57 24.7 12:04:05 1.08 27.5
09:24:38 0.82 24.1 12:04:26 0.66 26.7
29The Archives of Automotive Engineering – Archiwum Motoryzacji Vol. 80, No. 2, 2018
09:24:54 0.65 24 13:16:16 0.63 26.5
11:04:16 0.49 28.4 13:16:50 0.32 26.3
11:04:31 1.69 28.6 13:17:07 0.78 26.2
11:04:47 1.33 28.7 14:04:13 1.33 25.9
11:05:02 1.31 28.7 14:04:31 0.74 25.4
11:05:16 0.76 28.7 08:19:52 0.52 23.1
The average wind velocity was about 0.68 m/s and the wind velocity range was 1.52 m/s. The average air temperature was 27.7 °C and the air temperature range was 9.7 °C. Based on the previous experience gained in the research on particulate matter immission, an as-sumption may be made that on that day, neither the wind velocity nor the air temperature had any considerable impact on the particulate matter immission values [14].
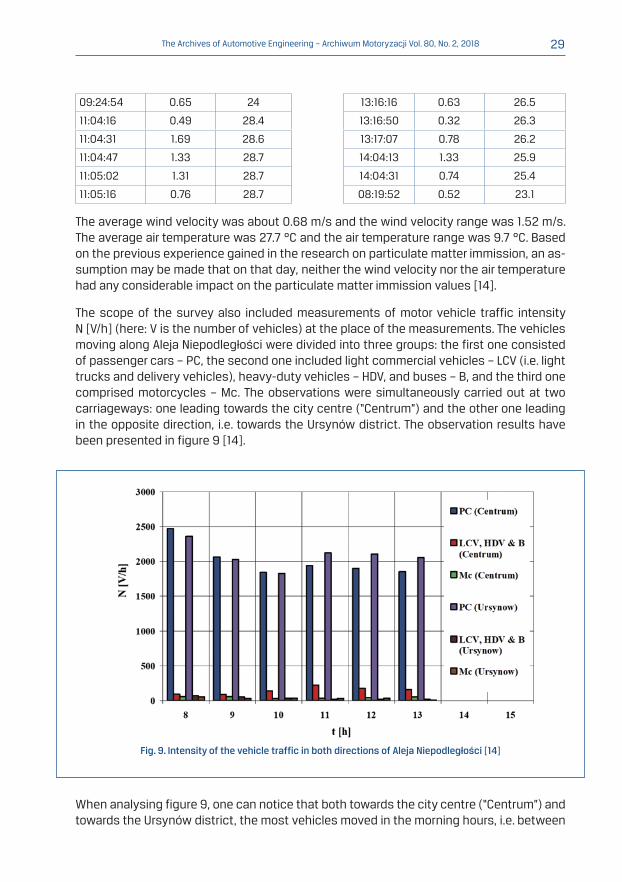
The scope of the survey also included measurements of motor vehicle traffic intensity N [V/h] (here: V is the number of vehicles) at the place of the measurements. The vehicles moving along Aleja Niepodległości were divided into three groups: the first one consisted of passenger cars – PC, the second one included light commercial vehicles – LCV (i.e. light trucks and delivery vehicles), heavy-duty vehicles – HDV, and buses – B, and the third one comprised motorcycles – Mc. The observations were simultaneously carried out at two carriageways: one leading towards the city centre (“Centrum”) and the other one leading in the opposite direction, i.e. towards the Ursynów district. The observation results have been presented in figure 9 [14].
Fig. 9. Intensity of the vehicle traffic in both directions of Aleja Niepodległości [14]
When analysing figure 9, one can notice that both towards the city centre (“Centrum”) and towards the Ursynów district, the most vehicles moved in the morning hours, i.e. between
30 The Archives of Automotive Engineering – Archiwum Motoryzacji Vol. 80, No. 2, 2018
8 a.m. and 9 a.m. The particulate matter immission also reached the highest values during the first hours of carrying out the measurements. This shows that the particulate matter present in the atmosphere in that area was chiefly emitted from motor vehicle traffic [14].
4. Examination of the correlation between the immission of particulate matter PM10 and the immission of nitrogen
dioxide and carbon monoxide
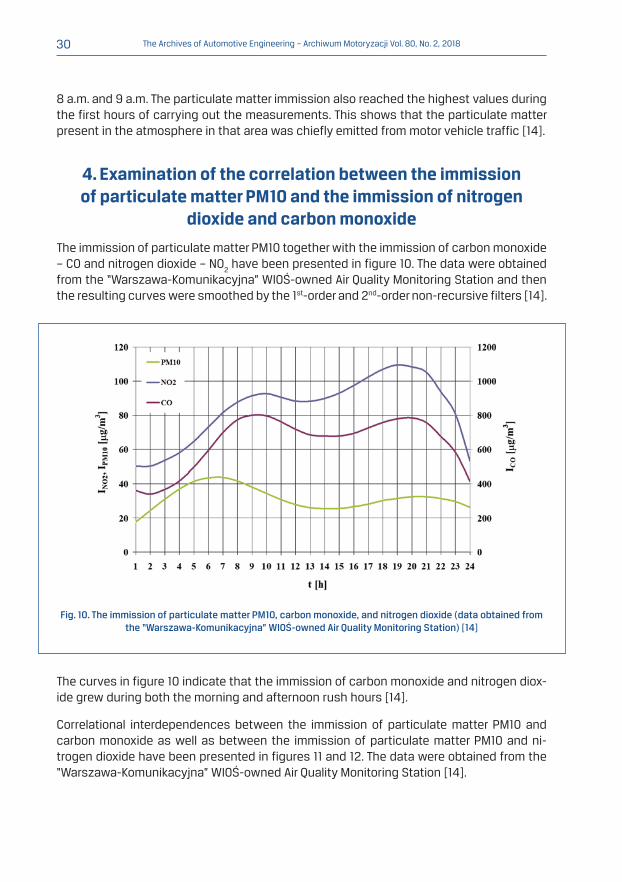
The immission of particulate matter PM10 together with the immission of carbon monoxide – CO and nitrogen dioxide – NO
2 have been presented in figure 10. The data were obtained
from the “Warszawa-Komunikacyjna” WIOŚ-owned Air Quality Monitoring Station and then the resulting curves were smoothed by the 1st-order and 2nd-order non-recursive filters [14].
Fig. 10. The immission of particulate matter PM10, carbon monoxide, and nitrogen dioxide (data obtained from the “Warszawa-Komunikacyjna” WIOŚ-owned Air Quality Monitoring Station) [14]
The curves in figure 10 indicate that the immission of carbon monoxide and nitrogen diox-ide grew during both the morning and afternoon rush hours [14].
Correlational interdependences between the immission of particulate matter PM10 and carbon monoxide as well as between the immission of particulate matter PM10 and ni-trogen dioxide have been presented in figures 11 and 12. The data were obtained from the “Warszawa-Komunikacyjna” WIOŚ-owned Air Quality Monitoring Station [14].

31The Archives of Automotive Engineering – Archiwum Motoryzacji Vol. 80, No. 2, 2018
Fig. 11. Correlational interdependence between the immission of particulate matter PM10 and carbon monoxide (data obtained from the “Warszawa-Komunikacyjna” WIOŚ-owned Air Quality Monitoring Station) [14]
Fig. 12. Correlational interdependence between the immission of particulate matter PM10 and nitrogen dioxide (data obtained from the “Warszawa-Komunikacyjna” WIOŚ-owned Air Quality Monitoring Station) [14]
An analysis of the results presented in figures 11 and 12 did not reveal any considerable correlation between the immission of particulate matter PM10 and carbon monoxide: the value of the coefficient of determination was R2 = 0.07. No correlation was observed, ei-ther, between the immission of particulate matter PM10 and nitrogen dioxide: in this case, the value of the coefficient of determination was R2 = 0.01 [14].
32 The Archives of Automotive Engineering – Archiwum Motoryzacji Vol. 80, No. 2, 2018
These results of the correlational examination of the immission of particulate matter PM10 and the immission of nitrogen dioxide and carbon monoxide, showing the correlation to be weak, may be explained by random errors caused by significant dispersion of the pollut-ants in the samples taken for measurements as well as by insufficient observation time.
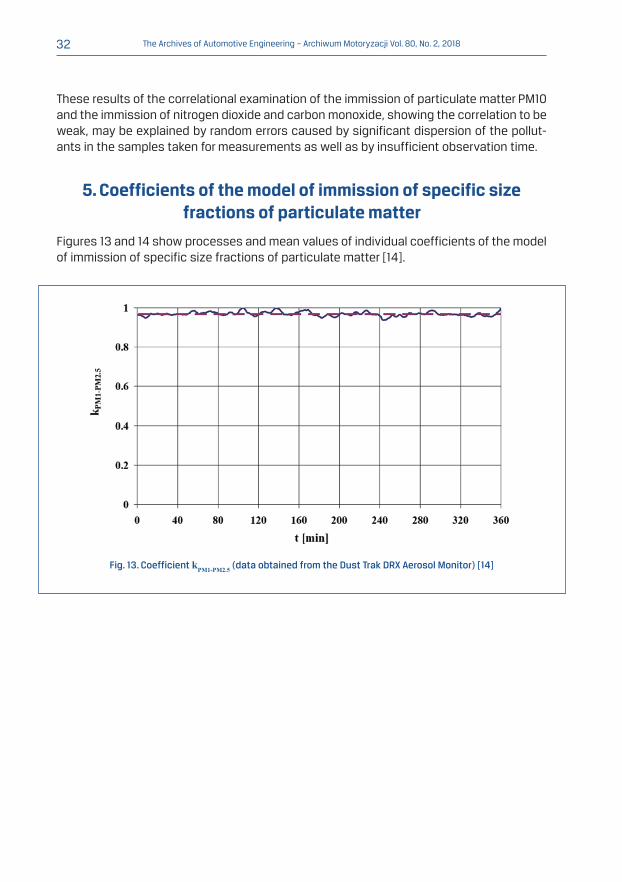
5. Coefficients of the model of immission of specific size fractions of particulate matter
Figures 13 and 14 show processes and mean values of individual coefficients of the model of immission of specific size fractions of particulate matter [14].
Fig. 13. Coefficient kPM1-PM2.5 (data obtained from the Dust Trak DRX Aerosol Monitor) [14]

33The Archives of Automotive Engineering – Archiwum Motoryzacji Vol. 80, No. 2, 2018
Fig. 14. Coefficient kPM2.5-PM10 (data obtained from the Dust Trak DRX Aerosol Monitor) [14]
An analysis of the curves in figures 13 and 14 indicated that the mean value of the coef-ficient for the model of immission of particulate matter PM1 was high, exceeding 0.95 (data obtained from the Dust Trak DRX Aerosol Monitor). For the model of immission of particulate matter PM2.5, the mean value of the coefficient exceeded 0.75 (data obtained from the Dust Trak DRX Aerosol Monitor) [14].
6. Recapitulation
The research was undertaken to assess the impact of automotive sources of pollutant emission on the values of immission of individual particulate matter size fractions in the atmospheric air in the street canyon in the Warsaw urban agglomeration [14].
The time of carrying out the measurements, i.e. summer season, was chosen on purpose because the air pollution by heating sources is then lower, thanks to which the impact of automotive sources on atmospheric pollution could be presented in a more selective way.
An analysis of the research results has made it possible to ascertain that the immission of particulate matter increases with growing intensity of motor vehicle traffic. It can be seen from the measurement results obtained from the Dust Trak DRX Aerosol Monitor how significant impact is exerted by automotive sources on the values of immission of such pollutants in the atmosphere. Particularly conspicuous were both the cyclic growths and drops in the particulate matter immission resulting from changes in traffic lights’ signals and the temporary immission peaks caused by the passage of motor vehicles that emitted a considerable amount of exhaust gases, which could be observed during the measure-ments [14].

34 The Archives of Automotive Engineering – Archiwum Motoryzacji Vol. 80, No. 2, 2018
Regrettably, the impact of automotive sources on the values of immission of individual particulate matter size fractions in the atmospheric air could only be roughly estimated on the grounds of the measurements carried out, chiefly because of too short a time of the measurements, but also due to the fact that the measurements were carried out in sum-mer season, when the traffic intensity is reduced [14].
To sum up: the intensity and type of motor vehicle traffic close to air quality monitoring stations should be examined systematically; moreover, the impact of weather conditions on the pollutant immission measurement results should be analysed as well.
In spite of a limited scope of the research carried out, a statement may be made on these grounds that the automotive sources have a significant impact on the air quality in the sur-roundings and, in consequence, on the health of inhabitants of urban agglomerations [14].
The full text of the article is available in Polish online on the website http://archiwummotoryzacji.pl.
Tekst artykułu w polskiej wersji językowej dostępny jest na stronie http://archiwummotoryzacji.pl.
References[1] Chłopek Z. Testing of hazards to the environment caused by particulate matter during use of vehicles.
Eksploatacja i Niezawodnosc – Maintenance and Reliability. 2012; 2: 160–170.
[2] Chłopek Z. Ocena stanu zagrożenia środowiska przez cząstki stałe PM2,5 ze źródeł transportu drogowego (Evaluation of the state of threat to the environment by the PM2,5 particulates from the road transport sources). Proceedings of the Institute of Vehicles / Warsaw University of Technology. 2011; 82 (1): 101–110.
[3] Chłopek Z. Modelowanie emisji cząstek stałych PM10 ze źródeł motoryzacyjnych do celów oceny oddziaływania transportu drogowego na środowisko (Modelling of the emission of particulate matter PM10 from automotive sources for the purposes of environmental impact assessment of road transport). Report of research project No. N N509 083637 sponsored by the Ministry of Science and Higher Education, Warszawa 2012.
[4] Chłopek Z, Jakubowski A. A study of the particulate matter emission from the braking systems of motor vehi-cles. Eksploatacja i Niezawodnosc – Maintenance and Reliability. 2009; 4: 45–52.
[5] Chłopek Z, Skibiński F. Wprowadzenie w tematykę emisji cząstek stałych PM2,5 powodowanych transportem samochodowym (Introduction to the subject of the particulate matter emission PM2,5, from the road trans-port). Transport Samochodowy – Motor Transport. 2010; 3: 73–87.
[6] Chłopek Z, Suchocka K. Analiza przepisów ochrony środowiska przed emisją cząstek stałych w aspekcie ruchu samochodowego (The analysis of environmental protection regulations against particulate matter emission in terms of traffic). Proceedings of the Institute of Vehicles / Warsaw University of Technology. 2014; 97 (1): 21–32.
[7] Chłopek Z, Suchocka K. Modelowanie emisji i imisji frakcji wymiarowych cząstek stałych związanych z ruchem samochodowym (The modeling of emission and immission of particulate matter size fraction re-lated to vehicle traffic). Proceedings of the Institute of Vehicles / Warsaw University of Technology. 2014; 97 (1): 5–20.
[8] Chłopek Z, Suchocka K. Risks posed by particulate matter to the human health and environment near trans-port routes. The Archives of Automotive Engineering – Archiwum Motoryzacji. 2014; 63 (1): 3–24 and 109–129.
35The Archives of Automotive Engineering – Archiwum Motoryzacji Vol. 80, No. 2, 2018
[9] Chłopek Z, Suchocka K, Dudek M, Jakubowski A. Hazards posed by polycyclic aromatic hydrocarbons con-tained in the dusts emitted from motor vehicle braking systems. Archives of Environmental Protection. 2016; 42 (3): 3–10.
[10] Chłopek Z, Szczepański T. Ocena zagrożenia środowiska cząstkami stałymi ze źródeł cywilizacyjnych (Environmental risk assessment of particulate matter from civilization sources). Inżynieria Ekologiczna. 2012; 30.
[11] Juda-Rezler K. Oddziaływanie zanieczyszczeń powietrza na środowisko (Environmental impact of air pol-lutants). Oficyna Wydawnicza Politechniki Warszawskiej (Publishing House of the Warsaw University of Technology). Warszawa 2000.
[12] Siemiński M. Środowiskowe zagrożenia zdrowia (Environmental health risk). Wydawnictwo Naukowe PWN. Warszawa 2001.
[13] Sroczyński J. Wpływ zanieczyszczeń powietrza atmosferycznego na zdrowie ludzi (The impact of atmos-pheric air pollution on human health). Ossolineum Publishing House at the Polish Academy of Sciences. Wrocław 1989.
[14] Strzałkowska K. Sprawozdanie z zadania nr DDS-117-BLM Badania wpływu źródeł motoryzacyjnych na wartość imisji frakcji wymiarowych cząstek stałych w aglomeracji warszawskiej (Report of Project No DDS-117-BLM “Research on the impact of automotive sources on the values of immission of specific particulate matter size fractions in the Warsaw urban agglomeration”). Warszawa 2016.
[15] Suchocka K. Modelowanie imisji cząstek stałych PM2.5 ze źródeł motoryzacyjnych (Modelling of the im-mission of particulate matter PM2.5 from automotive sources). Engineer’s (Bachelor’s) graduation work. Warszawa 2012.
[16] Suchocka K. Modelowanie imisji frakcji wymiarowych cząstek stałych ze względu na oddziaływanie moto-ryzacji na środowisko (Modelling of the immission of specific particulate matter size fractions in respect of the environmental impact of motorization). Master’s graduation work. Warszawa 2013.
[17] Żegota M. Modelowanie emisji cząstek stałych PM10 z pojazdów samochodowych (Modelling of the emis-sion of particulate matter PM10 from motor vehicles). Doctoral dissertation. Warsaw University of Technology 2006.