university of groningen bacterial interaction forces in ... · bacterial interaction forces in...
TRANSCRIPT

University of Groningen
Bacterial interaction forces in adhesion dynamicsBoks, Niels
IMPORTANT NOTE: You are advised to consult the publisher's version (publisher's PDF) if you wish to cite fromit. Please check the document version below.
Document VersionPublisher's PDF, also known as Version of record
Publication date:2009
Link to publication in University of Groningen/UMCG research database
Citation for published version (APA):Boks, N. P. (2009). Bacterial interaction forces in adhesion dynamics Groningen: s.n.
CopyrightOther than for strictly personal use, it is not permitted to download or to forward/distribute the text or part of it without the consent of theauthor(s) and/or copyright holder(s), unless the work is under an open content license (like Creative Commons).
Take-down policyIf you believe that this document breaches copyright please contact us providing details, and we will remove access to the work immediatelyand investigate your claim.
Downloaded from the University of Groningen/UMCG research database (Pure): http://www.rug.nl/research/portal. For technical reasons thenumber of authors shown on this cover page is limited to 10 maximum.
Download date: 30-08-2018

Bacterial interaction forces in adhesion dynamics

Copyright © 2008 by N.P. Boks All rights reserved. No part of this publication may be reproduced or transmitted in any form or by any means without permission of the author and the publisher holding the copyright of the published articles. Printed by Gildeprint drukkerijen b.v., Enschede ISBN: 978-90-367-3638-1 (printed version) ISBN: 978-90-367-3667-1 (electronic version) Cover: Fluorescence image of staphylococci attached to a tipless AFM-cantilever. Using a LIVE/DEAD Baclight viability stain (Molecular Probes Europe BV, Leiden, The Netherlands), bacteria appear red when they are dead and green when they are still alive. Omslag: Fluorescentie opname van staphylococci die aan een tiploze AFM-cantilever zijn geplakt. Met behulp van een LIVE/DEAD Baclight viability kleuring (Molecular Probes Europe BV, Leiden, The Netherlands) kleuren dode bacteriën rood en levende bacteriën groen.

Bacterial interaction forces in adhesion dynamics
Proefschrift
ter verkrijging van het doctoraat in de Medische Wetenschappen
aan de Rijksuniversiteit Groningen op gezag van de
Rector Magnificus, Dr. F. Zwarts, in het openbaar te verdedigen op
woensdag 14 januari 2009 om 16.15 uur
door
Niels Peter Boks geboren op 3 april 1979
te Apeldoorn

Promotores: Prof. dr. ir. H.J. Busscher Prof. dr. ir. W. Norde
Prof. dr. H.C. van der Mei Beoordelingscommissie: Prof. dr. Y. Ren Prof. dr. ir. M. Cohen-Stuart Prof. dr. ir. M. van Loosdrecht

Paranimfen: Anika Embrechts
Eefje Engels
Voor Froukje Visser - de Vries * 08-12-1906
† 24-03-1995

CONTENTS
Chapter 1 General introduction 1
Chapter 2 Forces involved in bacterial adhesion to hydrophilic
and hydrophobic surfaces
9
Chapter 3 Residence time dependent desorption of Staphylococcus epidermidis from hydrophilic and hydrophobic substrata
45
Chapter 4 Mobile and immobile adhesion of staphylococcal strains to hydrophilic and hydrophobic surfaces
57
Chapter 5 Bond-strengthening in staphylococcal adhesion to hydrophilic and hydrophobic surfaces using AFM
77
Chapter 6 Fibronectin interactions with Staphylococcus aureus with and without fibronectin-binding proteins and their role in adhesion and desorption
95
Chapter 7 General discussion
121
Summary
131
Samenvatting
137
Dankwoord
145
Curriculum vitae 150


CHAPTER 1
GENERAL INTRODUCTION
Chapter 1
2
Microbial adhesion
Adhesion of micro-organisms to surfaces and their subsequent growth into a
biofilm is a problem occurring in many fields of application. Bacterial biofilms
on pipes and heat exchangers in industry result in high costs when equipment
has to be cleaned or replaced [1,2]. In medicine, biofilms on biomedical
materials (like prosthetic implants or urinary catheters) lead to infections,
causing expensive treatments and enormous discomfort, and sometimes even
death of a patient [3-5]. In order to prevent these problems, it is important to
know more about microbial affinity for substratum surfaces, which governs the
first step in biofilm formation. Microbial affinity can be expressed in terms of
initial adhesion rate [6-8], deposition (or collision) efficiency [9] or in number
of adhering bacterial cells after a few hours [8]. However, none of these
parameters provide information on the adhesion strength between a micro-
organism and substratum surface.
The strength of microbial adhesion to substratum surfaces, is at least
equally important if not more so than data on numbers of adhering organisms. In
medicine bacterial desorption from one location may lead to an infection
elsewhere in the body. An example of the importance of bacterial adsorption
and desorption is found in the daily use of contact lenses. Wearing contact
lenses increases the risk of microbial keratitis (i.e. inflammation of the cornea)
[10]. Bacterial adhesion to contact lenses occurs during manual handling while
putting the lens onto the eye, but also during storage in a lens box [11]. Once the
contact lens is placed on the epithelium of the cornea, bacterial desorption from
the lens surfaces occurs and bacteria may adhere to the epithelium, with the
possibility to cause microbial keratitis.

General introduction
3
Adhesion forces
In literature, adhesion strengths between bacteria and surfaces are calculated
theoretically using the (extended-) DLVO theory (named after Derjaguin,
Landau, Verwey and Overbeek) [12-14] or measured e.g. by using centrifugal
force assays [15], laser tweezers [16-18] or total internal reflection microscopy
related techniques [19-22]. Most frequently used however, are atomic force
microscopy (AFM) [23-25] and fluid flow devices [26-29]. Because the flow
profile in these devices is well controlled [30], they are suitable to determine the
shear rate to prevent adhesion of bacteria or to detach adhering bacteria. These
shear rates provide an averaged adhesion force for a bacterial population.
Conversely, in AFM adhesion forces are probed directly between a substratum
surface and an individual bacterial cell.
As can be seen from Table 1, the magnitude of the force range estimated
for microbial interaction forces with substratum surfaces is greatly dependent on
the method used. For example, predicting interaction forces using the DLVO-
theory result in the weakest forces, while AFM yields forces that are up to 105
times stronger. It is unclear why these different techniques each yield their own
class of force values.
Table 1. Average force ranges for the interaction of micro-organisms with substratum
surfaces reported in the literature and obtained with different techniques.
Method of force measurement Force range (N) References
Fluid flow devices 10-13 – 10-11 [26,31]
Air bubble detachment 10-9 – 10-7 [32-34]
AFM 10-10 – 10-9 [35-38]
DLVO 10-14 – 10-10 [12,39,40]

Chapter 1
4
In conclusion, commonly accepted, well documented data on microbial
adhesion forces do not exist, because different methods yield widely varying
results and in many cases studies do not contain enough strains to warrant
generally valid conclusions [41].
Aim of this thesis
The main aim of this thesis is to develop an understanding of the reason(s) why
different techniques yield different ranges for microbial interaction forces with
substratum surfaces. To achieve this aim, adhesion forces, together with data on
adhesion dynamics, will be systematically obtained on hydrophobic and
hydrophilic surfaces for a wide variety of bacterial strains and using different
techniques.
References 1. Videla, H.A. (2002), Prevention and control of biocorrosion, Int Biodeter Biodegr 49,
259 - 270.
2. Visser, J. and Jeurnink, T.J.M. (1997), Fouling of heat exchangers in the dairy
industry, Exp Therm Fluid Sci 14, 407 - 424.
3. Dankert, J., Hogt, A.H. and Feijen, J. (1986), Biomedical polymers - Bacterial
adhesion, colonization, and infection, Crit Rev Biocompat 2, 219 - 301.
4. Harris, L.G. and Richards, R.G. (2006), Staphylococci and implant surfaces: A
review, Injury 37, 3 - 14.

General introduction
5
5. Schierholz, J.M. and Beuth, J. (2001), Implant infections: A haven for opportunistic
bacteria, J Hosp Inf 49, 87 - 93.
6. Gallardo-Moreno, A.M., Gonzalez-Martin, M.L., Bruque, J.M. and Perez-Giraldo,
C. (2004), The adhesion strength of Candida parapsilosis to glass and silicone as a
function of hydrophobicity, roughness and cell morphology, Colloids and Surface A
249, 99 - 103.
7. Van Merode, A.E.J., Duval, J.F.L., Van der Mei, H.C., Busscher, H.J. and Krom,
B.P. (2008), Increased adhesion of Enterococcus faecalis strains with bimodal
electrophoretic mobility distributions, Colloids Surface B 64, 302 - 306.
8. Roosjen, A., Kaper, H.J., Van der Mei, H.C., Norde, W. and Busscher, H.J. (2003),
Inhibition of adhesion of yeasts and bacteria by poly(ethylene oxide)-brushes on glass
in a parallel plate flow chamber, Microbiol-Sgm 149, 3239 - 3246.
9. Cail, T.L. and Hochella, M.F. (2005), the effects of solution chemistry on the sticking
efficiencies of viable enterococcus faecalis: an atomic force microscopy and modeling
study, Geochim Cosmochim Ac 69, 2959 - 2969.
10. Bourcier, T., Thomas, F., Borderie, V., Chaumeil, C. and Laroche, L. (2003),
Bacterial keratitis: Predisposing factors, clinical and microbiological review of 300
cases, Brit J Ophthalmol 87, 834 - 838.
11. Vermeltfoort, P.B.J., van Kooten, T.G., Bruinsma, G.M., Hooymans, A.M.M., Van
der Mei, H.C. and Busscher, H.J. (2005), Bacterial transmission from contact lenses
to porcine corneas: An ex vivo study, Invest Ophth Vis Sci 46, 2042 - 2046.
12. Sharma, P.K. and Rao, K.H. (2003), Adhesion of Paenibacillus polymyxa on
chalcopyrite and pyrite: Surface thermodynamics and extended DLVO theory, Colloids
Surface B 29, 21 - 38.
13. Vijayalakshmi, S.P. and Raichur, A.M. (2003), The utility of Bacillus subtilis as a
bioflocculant for fine coal, Colloids Surface B 29, 265 - 275.

Chapter 1
6
14. Walker, S.L., Redman, J.A. and Elimelech, M. (2004), Role of cell surface
lipopolysaccharides in Escherichia coli K12 adhesion and transport, Langmuir 20,
7736 - 7746.
15. Prakobphol, A., Burdsal, C.A. and Fisher, S.J. (1995), Quantifying the strength of
bacterial adhesive interactions with salivary glycoproteins, J Dent Res 74, 1212 - 1218.
16. Fallman, E., Schedin, S., Jass, J., Andersson, M., Uhlin, B.E. and Axner, O. (2004),
Optical tweezers based force measurement system for quantitating binding interactions:
system design and application for the study of bacterial adhesion, Bios Bioelectron 19,
1429 - 1437.
17. Maier, B., Koomey, M. and Sheetz, M.P. (2004), A force-dependent switch reverses
type IV pilus retraction, P Natl Acad Sci USA 101, 10961 - 10966.
18. Liang, M.N., Smith, S.P., Metallo, S.J., Choi, I.S., Prentiss, M. and Whitesides,
G.M. (2000), Measuring the forces involved in polyvalent adhesion of uropathogenic
Escherichia coli to mannose-presenting surfaces, P Natl Acad Sci USA 97,
13092 - 13096.
19. Clapp, A.R., Ruta, A.G. and Dickinson, R.B. (1999), Three-dimensional optical
trapping and evanescent wave light scattering for direct measurement of long range
forces between a colloidal particle and a surface, Rev Sci Instrum 70, 2627 - 2636.
20. Sharp, J.M., Clapp, A.R. and Dickinson, R.B. (2003), Measurement of long-range
forces on a single yeast cell using a gradient optical trap and evanescent wave light
scattering, Colloids Surface B 27, 355 - 364.
21. Geggier, P. and Fuhr, G. (1999), A time-resolved total internal reflection aqueous
fluorescence (TIRAF) microscope for the investigation of cell adhesion dynamics, Appl
Phys A-Mater 68, 505 - 513.
22. Prieve, D.C. (1999), Measurement of colloidal forces with TIRM, Adv Coll Int Sci 82,
93 - 125.

General introduction
7
23. Bowen, W.R., Hilal, N., Lovitt, R.W. and Wright, C.J. (1999), Characterisation of
membrane surfaces: direct measurement of biological adhesion using an atomic force
microscope, J Membrane Sci 154, 205 - 212.
24. Van der Aa, B.C. and Dufrene, Y.F. (2002), In situ characterization of bacterial
extracellular polymeric substances by AFM, Colloids Surface B 23, 173 - 182.
25. Razatos, A., Ong, Y.L., Boulay, F., Elbert, D.L., Hubbell, J.A., Sharma, M.M. and
Georgiou, G. (2000), Force measurements between bacteria and poly(ethylene glycol)-
coated surfaces, Langmuir 16, 9155 - 9158.
26. Rutter, P.R. and Vincent, B. (1988), Attachment mechanisms in the surface growth of
microorganisms. In: Physiological models in microbiology. Bazin, M. J. and Prosser, J.
I. (Eds.), Boca Raton, Florida:CRC Press, Inc. pp 87 - 107.
27. Owens, N.F., Gingell, D. and Rutter, P.R. (1987), Inhibition of cell-adhesion by a
synthetic-polymer adsorbed to glass shown under defined hydrodynamic stress, J Cell
Sci 87, 667 - 675.
28. Thomas, W.E., Nilsson, L.M., Forero, M., Sokurenko, E.V. and Vogel, V. (2004),
Shear-dependent 'stick-and-roll' adhesion of type 1 fimbriated Escherichia coli, Mol
Microbiol 53, 1545 - 1557.
29. Duddridge, J.E., Kent, C.A. and Laws, J.F. (1982), Effect of surface shear-stress on
the attachment of Pseudomonas fluorescens to stainless-steel under defined flow
conditions, Biotechnol Bioeng 24, 153 - 164.
30. Busscher, H.J. and Van der Mei, H.C. (2006), Microbial adhesion in flow
displacement systems, Clin Microbiol Rev 19, 127 - 141.
31. Shive, M.S., Hasan, S.M. and Anderson, J.M. (1999), Shear stress effects on bacterial
adhesion, leukocyte adhesion, and leukocyte oxidative capacity on a polyetherurethane,
J Biomed Mater Res 46, 511 - 519.
32. Gomez-Suarez, C., Busscher, H.J. and Van der Mei, H.C. (2001), Analysis of
bacterial detachment from substratum surfaces by the passage of air-liquid interfaces,
Appl Environ Microb 67, 2531 - 2537.

Chapter 1
8
33. Roosjen, A., Busscher, H.J., Norde, W. and Van der Mei, H.C. (2006), Bacterial
factors influencing adhesion of Pseudomonas aeruginosa strains to a poly(ethylene
oxide) brush, Microbiol-Sgm 152, 2673 - 2682.
34. Noordmans, J., Wit, P.J., Van der Mei, H.C. and Busscher, H.J. (1997), Detachment
of polystyrene particles from collector surfaces by surface tension forces induced by air-
bubble passage through a parallel plate flow chamber, J Adhes Sci Technol 11,
957 - 969.
35. Camesano, T.A. and Logan, B.E. (2000), Probing bacterial electrosteric interactions
using atomic force microscopy, Environ Sci Technol 34, 3354 - 3362.
36. Dufrene, Y.F., Boonaert, C.J.P., Gerin, P.A., Asther, M. and Rouxhet, P.G. (1999),
Direct probing of the surface ultrastructure and molecular interactions of dormant and
germinating spores of Phanerochaete chrysosporium, J Bacteriol 181, 5350 - 5354.
37. Fang, H.H.P., Chan, K.Y. and Xu, L.C. (2000), Quantification of bacterial adhesion
forces using atomic force microscopy (AFM), J Microbiol Meth 40, 89 - 97.
38. Emerson, R.J. and Camesano, T.A. (2004), Nanoscale investigation of pathogenic
microbial adhesion to a biomaterial, Appl Environ Microb 70, 6012 - 6022.
39. Busalmen, J.P. and de Sanchez, S.R. (2001), Adhesion of Pseudomonas fluorescens
(ATCC 17552) to nonpolarized and polarized thin films of gold, Appl Environ Microb
67, 3188 - 3194.
40. Jacobs, A., Lafolie, F., Herry, J.M. and Debroux, M. (2007), Kinetic adhesion of
bacterial cells to sand: Cell surface properties and adhesion rate, Colloids Surface B 59,
35 - 45.
41. Bakker, D.P., Postmus, B.R., Busscher, H.J. and Van der Mei, H.C. (2004),
Bacterial strains isolated from different niches can exhibit different patterns of adhesion
to substrata, Appl Environ Microb 70, 3758 - 3760.

CHAPTER 2
FORCES INVOLVED IN BACTERIAL ADHESION TO
HYDROPHILIC AND HYDROPHOBIC SURFACES
Parts of this chapter are reproduced with permission of the Society of General
Microbiology from : Boks, N.P., Norde, W., Van der Mei, H.C. and Busscher, H.J. (2008),
Microbiology 154, 3122-3133.

Chapter 2
10
Abstract
Using a parallel plate flow chamber, the hydrodynamic shear forces to prevent
bacterial adhesion (Fprev) and to detach adhering bacteria (Fdet) were evaluated
for hydrophilic glass, hydrophobic, dimethyldichlorosilane (DDS)-coated glass
and six different bacterial strains, in order to test the following three hypotheses:
1. A strong hydrodynamic shear force to prevent adhesion relates to a strong
hydrodynamic shear force to detach an adhering organism.
2. A weak hydrodynamic shear force to detach adhering bacteria implies that
more bacteria will be stimulated to detach by a passing air-liquid interface
through the flow chamber.
3. DLVO interactions determine the characteristic hydrodynamic shear
forces to prevent adhesion and to detach adhering micro-organisms as
well as the detachment induced by a passing air-liquid interface.
Fprev varied from 0.03 to 0.70 pN, while Fdet varied between 0.31 to over 19.64
pN, suggesting that after initial contact, strengthening of the bond occurs.
Generally, it was more difficult to detach bacteria from DDS-coated glass than
from hydrophilic glass, which was confirmed by air-bubble detachment studies.
Calculated attractive forces based on the DLVO theory (FDLVO) towards the
secondary interaction minimum were higher on glass than on DDS-coated glass.
In general, all three hypotheses had to be rejected, showing that it is of
importance to distinguish between forces acting parallel (hydrodynamic shear)
and perpendicular (DLVO, air-liquid interface passages) to the substratum
surface.

Forces involved in bacterial adhesion
11
Introduction
Microbial adhesion and subsequent biofilm formation occur in many fields of
industrial and medical applications, such as on ship hulls, heat exchanger plates,
food packaging materials and biomaterials implants, including urinary catheters,
contact lenses, and vascular grafts [1-3]. Common in most applications is the
deposition of micro-organisms to a surface from a flowing suspension. This
implies that a variety of forces act on depositing and already adhering
organisms. Deposition is mainly governed by Brownian motion, sedimentation
and hydrodynamic forces, while actual adhesion of micro-organisms to a
substratum surface is mediated by Lifshitz-Van der Waals, electrostatic, acid-
base and hydrophobic interaction forces [4].
Fluid flow is an important factor in microbial deposition [5]. An increase
in fluid flow velocity will in a first instance, yield increased microbial transport
towards a substratum surface (convective-diffusion), but at the same time causes
an increase in hydrodynamic detachment forces. Shear is the dominant effect of
fluid flow and can be well controlled in experimental systems, like on rotating
disks, at stagnation points and in parallel plate flow chambers. In principle, two
critical shear rates can be distinguished based on current literature (see Table 1):
a critical shear rate to prevent adhesion and a critical shear rate to stimulate
detachment of already adhering organisms. Both critical shear rates vary from
strain to strain and also depend on the substratum material involved. The shear
rates and, hence, the shear forces, required to stimulate detachment are generally
higher than the shear rates to prevent adhesion.
Detachment can also be invoked by allowing an air-bubble to pass over
adhering bacteria. The passage of an air-liquid interface is accompanied by a
perpendicularly oriented force of around 10-7 N, which is much higher than the
hydrodynamic shear forces acting parallel to a substratum surface. Yet, a

Cha
pter
2
4Tab
le 1
. Sum
mar
y of
inte
ract
ion
forc
es b
etw
een
bact
eria
and
subs
tratu
m su
rfac
es, t
oget
her w
ith th
e m
etho
d ap
plie
d.
Stra
in
Subs
trat
um
Forc
e (p
N)
Met
hod
Ref
eren
ce
Esch
eric
hia
coli
prot
ein
coat
ings
0.
2
[6]
Stap
hylo
cocc
us e
pide
rmid
is
seve
ral b
iom
ater
ials
1.
2 –
1.4
Hyd
rody
nam
ic fo
rce
[7-9
] St
aphy
loco
ccus
aur
eus
Col
lage
n 0.
4 to
pre
vent
adh
esio
n [1
0]
Pseu
dom
onas
fluo
resc
ens
stai
nles
s ste
el
9.2
– 12
.3
[1
1]
Stre
ptoc
occu
s san
guis
G
lass
22
.0
[1
2]
Baci
llus c
ereu
s gl
ass a
nd si
licon
ized
gla
ss
43.1
– 8
0.1
[1
2]
Esch
eric
hia
coli
hydr
opho
bic
subs
trate
s 3.
1 –
4.6
[1
3]
Stap
hylo
cocc
us e
pide
rmid
is
mod
ified
PV
C
0.1
– 1.
2 H
ydro
dyna
mic
forc
e [1
4]
Stap
hylo
cocc
us a
ureu
s C
olla
gen
>>3.
9 to
det
ach
adhe
ring
[1
5]
Pseu
dom
onas
fluo
resc
ens
stai
nles
s ste
el
18.5
ba
cter
ia
[11]
M
ix o
f Gra
m p
ositi
ve c
occi
gl
ass,
silic
oniz
ed g
lass
and
stee
l 20
.4 –
42.
4
[12]
Es
cher
ichi
a co
li Q
uartz
0.
3 –
2.4
[1
6]
Stap
hylo
cocc
us e
pide
rmid
is
PMM
A
11.1
[17]
Ps
eudo
mon
as fl
uore
scen
s G
old
32.1
– 5
7.9
[1
8]
Baci
llus c
ereu
s Sa
nd
0.03
D
LVO
cal
cula
tion
[19]
Ba
cillu
s sub
tilus
C
oal
0.09
[20]
Ba
cillu
s sub
tilus
Sa
nd
0.03
[19]
Pa
enib
acill
us p
olym
yxa
Pyrit
e –
chal
copy
rite
170
– 56
0
[21]
Sp
hing
omon
as p
auci
mob
ilis
Gla
ss
0.07
– 0
.7
[2
2]
Esch
eric
hia
coli
silic
on su
rfac
es
7400
– 2
2800
[23]
Es
cher
ichi
a co
li si
licon
nitr
ide
tip
400
– 21
00
Ato
mic
For
ce
[24]
St
aphy
loco
ccus
epi
derm
idis
si
licon
nitr
ide
tip
2000
M
icro
scop
e [2
5]
Spor
es o
f Bac
illus
myo
cide
s hy
drop
hobi
cally
coa
ted
glas
s 74
00 –
495
00
[2
6]
Esch
eric
hia
coli
gala
bios
e-fu
nctio
naliz
ed b
eads
50
– 1
00
[2
7]
Stap
hylo
cocc
us e
pide
rmid
is
fibro
nect
in c
oatin
gs
18
Opt
ical
Tw
eeze
rs
[28]
St
aphy
loco
ccus
aur
eus
fibro
nect
in c
oatin
gs
15 –
26
[2
9]
Hyd
rody
nam
ic fo
rces
are
cal
cula
ted
usin
g F
= η σ
Ap,
in w
hich
η th
e ab
solu
te v
isco
sity
of w
ater
and
Ap t
he a
rea
of th
e pa
rticl
e ex
pose
d to
shea
r. C
occi
wer
e as
sum
ed to
hav
e a
radi
us o
f 0.
5 μm
, whi
le ro
d-sh
aped
bac
teria
wer
e ap
prox
imat
ed b
y sp
here
s w
ith e
qual
vol
ume,
usi
ng 0
.7 μ
m a
s ra
dius
. DLV
O-f
orce
s are
take
n as
the
attra
ctiv
e fo
rce
tow
ards
the
pred
icte
d se
cond
ary
min
imum
in th
e to
tal i
nter
actio
n en
ergy
cur
ves.
Chapter 2
12

Forces involved in bacterial adhesion
13
passing air-liquid interface does not cause complete bacterial detachment for all
combinations of strains and substratum surfaces.
Gomez-Suarez et al. [30] investigated detachment of several bacterial
strains from hydrophilic and hydrophobic surfaces by a passing air-bubble.
Depending on the strain involved, the presence of a conditioning film and the
velocity of the air-bubble, detachment ranged from 0 to 90%. Although air-
bubble induced detachment is relatively easy to measure, it only yields an
extremely rough estimate of a detachment force threshold and it cannot be used
to estimate the actual binding strength.
Perpendicularly oriented interaction forces can be measured more
directly, for instance using atomic force microscopy (AFM) or optical tweezers.
As can be seen in Table 1, forces obtained using these techniques, differ in
orders of magnitude. Forces measured with optical tweezers remain in the pN
range, while AFM yields stronger forces than any other method, which are
generally in the nN range.
Another, often used approach for assessing adhesion strength is the
(extended) DLVO theory (named after Derjaguin, Landau, Verwey and
Overbeek). In the DLVO theory the binding strength between colloidal particles,
such as micro-organisms, and substratum surfaces may be calculated on the
basis of Lifshitz-Van der Waals, (acid-base and) electrical double layer
interactions. Usually, also the theoretical values provide a distinct class of force
values, that cannot be easily matched with experimental values, as reported in
the literature.
From Table 1, it is obvious that throughout the literature different types of
forces may be distinguished for every strain-substratum combination.
Furthermore, conclusions on bacterial adhesion mechanisms are often based
on not more than two strains [31]. Comparing all reported data is further
complicated by the fact that different suspending media are used to determine

Chapter 2
14
adhesion parameters on different substrata. It is currently unclear why different
methods to evaluate bacterial binding forces yield distinct classes of force values
that often differ by orders of magnitude. The aim of our research is to gain more
insight in the relevance of the different bacterial interaction force indicators,
including theoretically predicted interaction forces from the DLVO-theory, and
their mutual relationships. To this end, the following hypotheses were tested:
1. A strong hydrodynamic shear force to prevent adhesion relates to a strong
hydrodynamic shear force to detach an adhering organism.
2. A weak hydrodynamic shear force to detach adhering bacteria implies that
more bacteria will be stimulated to detach by a passing air-liquid interface
through the flow chamber.
3. DLVO interactions determine the characteristic hydrodynamic shear
forces to prevent adhesion and to detach adhering micro-organisms as
well as the detachment induced by a passing air-liquid interface.
To test these hypotheses, the critical shear force to prevent bacterial adhesion
and to stimulate detachment of adhering bacteria are determined. Hydrophilic
glass and hydrophobic, dimethyldichlorosilane-coated, glass are employed as
substrata. To allow for more general conclusions to be drawn, six widely
different bacterial strains are included. In addition, theoretical DLVO interaction
forces, as calculated from measured zeta potentials and contact angles are
determined. Furthermore, the detachment force threshold is evaluated for
detachment caused by a passing air-liquid interface.

Forces involved in bacterial adhesion
15
Materials and Methods
Bacterial strains and culture conditions. Staphylococcus epidermidis ATCC
35983, S. epidermidis HBH2 169, Pseudomonas aeruginosa D1, P. aeruginosa
KEI 1025 were cultured aerobically from blood agar plates in 10 ml Tryptone
Soya Broth (OXOID, Basingstoke, England) for 24 h at 37 ºC. Raoultella
terrigena ATCC 33527 was precultured aerobically from nutrient agar (Nutrient
Broth, OXOID) in 10 ml nutrient broth for 24 h at 37 ºC. Streptococcus
thermophilus ATCC 19258 was precultured from a frozen stock in 10 ml M17
broth for 24 h at 37 ºC. After 24 h, precultures were used to inoculate 200 ml
main cultures, which were grown for 16 h under similar conditions as the
corresponding precultures. S. epidermidis and P. aeruginosa strains were
harvested by centrifugation for 5 min at 6500 x g, while R. terrigena and S.
thermophilus were harvested at 10000 x g. All strains were washed twice with
10 mM potassium phosphate buffer at pH 7 and resuspended in the same buffer.
To break bacterial chains or clusters, sonication at 30 W (Vibra Cell model 375,
Sonics and Materials Inc., Danbury, CT, USA) was carried out for
staphylococcal (3 times 10 s) and streptococcal (2 times 10 s) suspensions, while
cooling in an ice/water bath. Subsequently, bacteria were resuspended to a
concentration of 3 x 10⁸ cells ml-1. In the calculations discussed below, the cocci
were assumed to have a radius of 0.5 μm. Rod-shaped P. aeruginosa (2.5 μm x
0.9 μm) and R. terrigena (3.2 μm x 1.4 μm) were approximated as spheres with
equal volume, using a radius of 0.6 μm and 0.9 μm, respectively as they adhere
in different orientations, i.e. “end-on” and “side-on”.
Substratum surfaces. Glass slides were sonicated during 3 min in 2% RBS35
(Omnilabo International BV, The Netherlands) followed by thorough rinsing
with tap water, demineralised water, methanol, tap water and finally

Chapter 2
16
demineralised water again to obtain a hydrophilic surface. After washing, the
slides were either directly used or dried for 4 h at 80 ºC prior to applying a
hydrophobic coating. To obtain a hydrophobic surface, the dried glass slides
were submerged during 15 min in a solution of dimethyldichlorosilane (DDS,
Merck, Germany) in trichloroethylene (0.05 w/v %) and washed with
trichloroethylene, methanol and ultrapure water. Prepared slides were stored for
no longer than 3 days at room temperature and rinsed with 10 mM potassium
phosphate buffer before use.
Bacterial adhesion in the parallel plate flow chamber. The parallel plate flow
chamber (PPFC) and image analysis have been described previously [32]. The
flow chamber used in this study has a length of 175 mm, a depth of 0.75 mm
and a width of 17 mm. Prior to use, the flow chamber was washed with 2%
Extran (Merck, Germany) and rinsed thoroughly with tap water and
demineralised water before mounting a clean substratum surface in the PPFC.
Subsequently, the flow chamber was installed between two communicating
vessels and the system was filled with 10 mM potassium phosphate buffer while
care was taken to remove all air-bubbles. When the PPFC was positioned under
the microscope, the vessels containing bacterial suspension were positioned at
different heights to create a flow. The difference in fluid levels was maintained
by a roller-pump to ensure a circulating pulse free flow throughout the duration
of an entire experiment. Deposition of bacteria was monitored with a phase
contrast microscope (Olympus HB-2) equipped with a 40x ultra long working
distance objective (Olympus ULWD-CD Plan 40 PL) which was connected to a
CCD-MXRi camera (Basler A101F, Basler AG, Germany). Images were
obtained by summation of 15 consecutive images (time interval 0.25 s) in order
to enhance the signal to noise ratio and eliminate moving bacteria from analysis.
Analysis of the images was done using proprietary software based on the Matlab
Image processing Toolkit (The MathWorks, MA, USA)).

Forces involved in bacterial adhesion
17
Shear rate dependent adhesion. The bacterial suspension was allowed to flow
through the flow chamber during 1 h at flow rates (Q) of 1, 5, 10, 19, 57, 77, 105
and 153 ml min-1 which corresponds to shear rates (σ) of 10, 50, 100, 200, 600,
800, 1100 and 1600 s-1. Under these conditions the flow is laminar and bacterial
transport occurs by convective-diffusion. Adhesion is monitored on both the top
(negative contribution of sedimentation) and bottom (positive contribution of
sedimentation) plate of the PPFC. For each shear rate, the number of bacteria
adhering per unit area was recorded as a function of time. Adhesion was then
expressed in initial deposition rates j0 (cm-2 s-1), while at the end of each
experiment an air-bubble was passed through the flow chamber to stimulate
detachment (only evaluated for the bottom plate).
Initial deposition rates for the top and bottom plate were averaged and expressed
as deposition efficiencies by normalization with respect to the Von
Smoluchowski-Levich (SL) theoretical upper limit for deposition in the parallel
plate flow chamber. The SL upper limit for bacterial deposition is an
approximate solution of the convective-diffusion equation and assumes perfect
sink conditions at the substratum surface (i.e. every particle that arrives at the
surface actually adheres) in the absence of sedimentation. The theoretical upper
limit for deposition is given by [33]:
31
*0 9
289.0 ⎥⎦
⎤⎢⎣⎡ ⋅= ∞
xbPe
rcDj (1)
in which D∞ is the diffusion coefficient of the particles (taken 3.1 x 10⁻¹³ m2 s-1
for micron-sized bacteria [34]), c the concentration of bacteria in suspension, r
the bacterial radius, x the longitudinal distance from the flow chamber entrance,
b the half-depth of the PPFC and Pe the dimensionless Péclet number. This
latter is defined as:

Chapter 2
18
∞
=Dwb
QrPe 3
3
43 (2)
in which Q is the applied flow rate and w the width of the flow chamber
Detachment induced by a passing air-liquid interface. Following the deposi-
tion measurement, an air-liquid interface was introduced by passing an air-
bubble through the flow chamber, which is accompanied by a perpendicularly
oriented detachment force equal to [35]:
sw,bw, ΘΘ
cos2
sin2 2max ⎟⎠
⎞⎜⎝
⎛⋅⋅= lvrF γπγ for Θw,s < 90 (3)
sw,bw, ΘΘ
cos2
sin2 2max ⎟⎠
⎞⎜⎝
⎛ +⋅⋅−=
πγπγ lvrF for Θw,s > 90 (4)
in which γlv represents the interfacial surface tension of the liquid and vapour,
Θw,b and Θw,s denote the bacterial- and substratum-water contact angles,
respectively.
Shear rate dependent detachment of adhering bacteria. The flow system was
filled and positioned as described before. Bacteria were resuspended in
potassium phosphate buffer to a high concentration of 7.5 x 10⁸ cells ml-1 to
accelerate deposition and allowed to adhere to the collector surface at a shear
rate of 25 s-1. After 20 min, flow was switched to fresh buffer without bacteria at
25 s-1 to wash out the bacterial suspension for 30 min, after which the shear rate
was increased to either 250, 1000, 3000, 6650 or 7320 s-1 for 30 min. The
number of bacteria that remained adhering was enumerated after each step.
Forces involved in bacterial adhesion
19
Surface characterization. To determine the zeta potentials of the substrata,
streaming potentials were measured in 10 mM phosphate buffer at pH 7.
Collector surfaces were mounted in a homemade parallel plate flow chamber,
separated by a 0.1 mm Teflon spacer. A platinum electrode was placed at either
end of the chamber. Streaming potentials were measured at 10 different
pressures ranging from 5 x 10³ to 20 x 103 Pa. Each pressure was applied during
10 s in both directions. Zeta potentials were deduced by linear least squares
fitting from the pressure dependent streaming potentials [36].
For bacterial zeta potentials, bacteria were washed with demineralised water and
resuspended in 10 mM potassium phosphate buffer at pH 7 to a concentration of
1 x 10⁸ cells ml-1. The electrophoretic mobilities of these suspensions were
measured at 150 V using a Lazer Zee Meter 501 (PenKem, USA). The
electrophoretic mobilities were converted to apparent zeta potentials assuming
the Helmholtz-Von Smoluchowski approximation holds, which is appropriate
considering the high value for κ r (i.e. ≈ 150) in the systems used (N.B. κ
denotes the reciprocal Debeye length which is directly related to the ionic
strength [37]).
To calculate surface free energies of the substratum and bacterial cell surfaces,
sessile drop contact angles were measured with water, formamide, α-
bromonaphthalene and methylene iodide. In order to measure contact angles
with liquids on bacteria, bacterial lawns were prepared by depositing bacteria
from suspension in demineralised water on cellulose acetate membrane filters
(Millipore, pore diameter 0.45 μm) under negative pressure until approximately
50 layers were stacked. Subsequently, filters were fixed on a sample holder and
left to dry until “plateau contact angles” could be measured, i.e. water contact
angles that remained stable over time for 30–60 min. All contact angles were
measured in triplicate, implying separate substrata and different bacterial

Chapter 2
20
cultures. Measured contact angles were converted into surface free energies
using:
lv
pluslv
plussv
lv
lvsv
lv
LWlv
LWsv
γγγ
γγγ
γγγ 222
1cos +++−=minusminus
Θ (5)
in which γLWsv is the Lifshitz-Van der Waals component of the surface free
energy of the surface of interest (i.e. substratum surface or bacterial lawn) and γlv
is the surface free energy of the liquid vapour interface. The acid-base
component of the surface free energies was separated into an electron donor
(γminussv) and electron acceptor (γplus
sv) parameter, according to: plussvsv
ABs γγγ minus2= (6)
Interaction forces using the extended DLVO theory. In the extended DLVO
theory, the interaction energy is divided in a Lifshitz-Van der Waals, acid-base
and electrostatic contribution, while accounting for their distance dependencies.
The Lifshitz-Van der Waals contribution can be derived by first calculating the
Lifshitz-Van der Waals component of the free energy of adhesion of a bacterium
to a substratum surface, which reads at contact [38]:
( )( )LWlv
LWsv
LWlv
LWbv
LWslbG γγγγ −−−=Δ 2 (7)
Equation 7 can be used to calculate the Hamaker constant A according to [39]: 2012 dGA LW
slb ⋅⋅Δ= π (8)
where d0 denotes the minimal separation distance (0.157 nm [40]) and ΔGLWslb is
obtained from thermodynamic analysis [38]. Lifshitz-Van der Waals attractive
interaction energies (ΔGLW) were subsequently calculated as a function of
distance assuming a sphere-plane geometry using [39]:
( )( ) ⎥
⎦
⎤⎢⎣
⎡⎟⎠⎞
⎜⎝⎛ +
−++
−=Δd
rdrddrdrAdG LW 2ln)2
26
)( (9)
Forces involved in bacterial adhesion
21
in which d denotes the separation distance. The acid-base component, ΔGABslb,
can be calculated from [38]:
( ) ( ) ( )( ) ( ) ( )⎥⎥⎦
⎤
⎢⎢
⎣
⎡
−⋅−−−
⋅−−−⋅−=Δ
minusminusplusplusminusminus
pluspluminusminusplusplus
lvsvlvsvlvbv
lvs
bvsvbvsvbvABslbG
γγγγγγ
γγγγγγ2 (10)
in which the subscript “s” denotes the substratum surface and “b” the bacterial
cell surface.
Using Equation 10, the distance dependence of the acid-base interaction
energies (ΔGAB) can then be calculated according to [39]:
⎟⎠⎞
⎜⎝⎛ −
Δ⋅⋅=Δλ
λπdd
GrdG ABslb
AB 0exp2)( (11)
in which λ denotes the correlation length of molecules in the liquid medium
(estimated to be 0.6 nm [39]).
Distance dependent electrostatic interaction energies (ΔGEL) were calculated
using [41]:
( ) ( )( ) ( )[ ]
⎭⎬⎫
⎩⎨⎧
−−+⎥⎦
⎤⎢⎣
⎡−−−+
++=Δ d
ddrdG
sb
sbsb
EL κκκ
φφφφ
φφπεε 2exp1lnexp1exp1ln
2)( 22
220 (12)
in which εε0 denotes the dielectric permittivity of the medium (i.e. water), φb and
φs the surface (zeta) potentials of the bacterial cell surface and collector surface
and κ the reciprocal Debye length.
Summation and differentiation with respect to distance of these three
components lead to the total DLVO-interaction energy and interaction force,
respectively, as a function of separation distance. All DLVO interaction forces
reported in this chapter represent the maximal attractive force towards the
secondary interaction minimum, which was present in all bacterium-substratum
systems investigated.
Chapter 2
22
Results
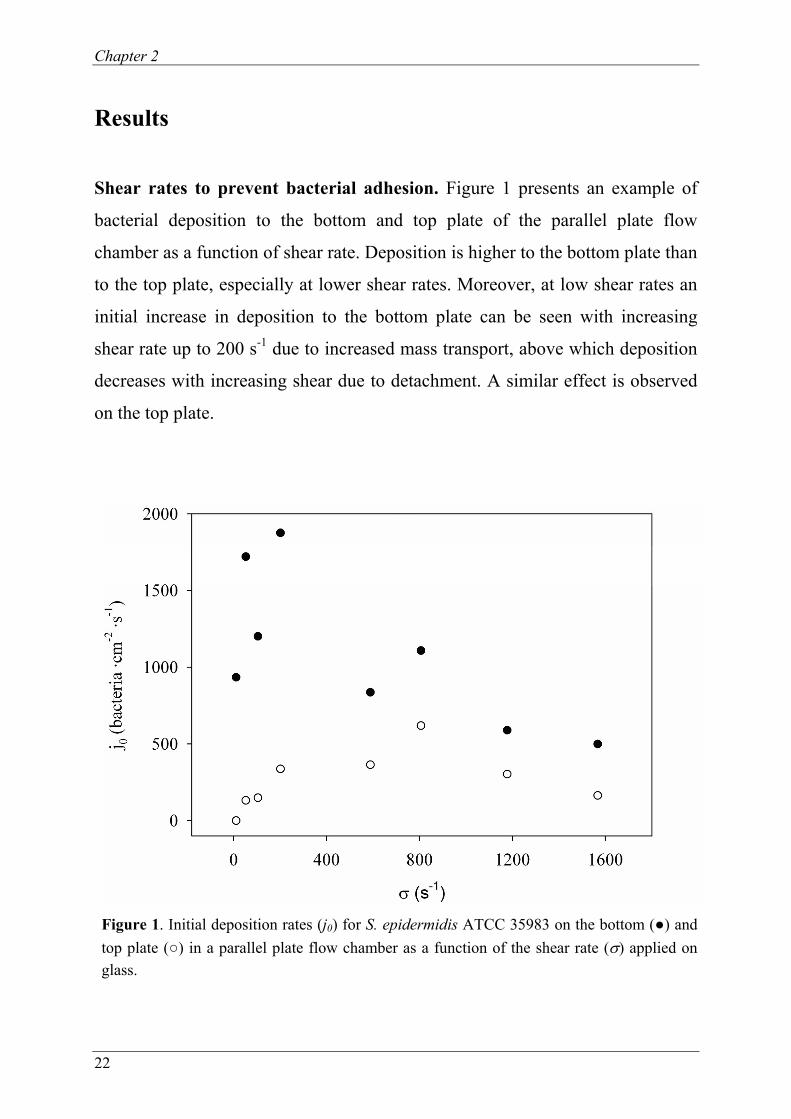
Shear rates to prevent bacterial adhesion. Figure 1 presents an example of
bacterial deposition to the bottom and top plate of the parallel plate flow
chamber as a function of shear rate. Deposition is higher to the bottom plate than
to the top plate, especially at lower shear rates. Moreover, at low shear rates an
initial increase in deposition to the bottom plate can be seen with increasing
shear rate up to 200 s-1 due to increased mass transport, above which deposition
decreases with increasing shear due to detachment. A similar effect is observed
on the top plate.
Figure 1. Initial deposition rates (j0) for S. epidermidis ATCC 35983 on the bottom (●) and top plate (○) in a parallel plate flow chamber as a function of the shear rate (σ) applied on glass.

Forces involved in bacterial adhesion
23
The influence of sedimentation on mass transport can be eliminated by
averaging bottom and top plate depositions. Figure 2 shows the deposition
efficiencies (α) in the absence of sedimentation, as calculated from averaged
initial deposition rates and the theoretical upper limit for deposition (Eq. 1) as a
function of shear rate. From Figure 2, critical shear rates to prevent adhesion
(σprev) were deduced using
⎪⎭
⎪⎬⎫
⎪⎩
⎪⎨⎧−⋅=
prevσσαα exp0 (13)
with α0 the extrapolated deposition efficiency in absence of shear. Subsequently,
values for σprev were expressed in shear forces using
ipi AF ση ⋅⋅= (14)
in which η is the absolute viscosity of the buffer (1 x 10⁻³ Pa s) and Ap is the area
of the adhering bacterium subject to shear flow. Furthermore, subscript “i”
denotes the type of hydrodynamic force calculated: prev for the hydrodynamic
force to prevent adhesion and det for the hydrodynamic force to detach adhering
micro-organisms. Hydrodynamic shear forces to prevent adhesion (Fprev) are
listed in Table 2. All values for Fprev remain in the low pN range and are
influenced by the substratum surface, although not consistently higher on any of
the two surfaces. Depending on the strain used, the difference between Fprev on
glass and DDS-coated glass can be as large as a factor 6.

Chapter 2
24
Figure 2. Bacterial deposition efficiency (α) in the absence of a mass transport contribution
from sedimentation as a function of the shear rate (σ) applied on glass (●) and DDS-coated
glass (○) for the six different bacterial strains included. Black and grey lines represent the
fits of equation 13 to the datapoints on glass and DDS-coated glass, respectively.

Forces involved in bacterial adhesion
25
Table 2. Critical shear forces to prevent (Fprev) bacterial adhesion and to detach (Fdet) adhering bacteria from a hydrophilic (glass) and hydrophobic (DDS-coated) substratum, as derived for different bacterial strains, together with the theoretically calculated DLVO interaction forces. Reported uncertainties are based on the standard error of the predicted fitting curve. Fprev (pN) Fdet (pN) FDLVO (pN)
Bacterial
strain
Glass DDS Glass DDS Glass DDS
S. epidermidis HBH2 169
0.13 ± 0.06 0.40 ± 0.12 0.31 ± 0.03 5.52 ± 0.09 0.08 0.05
S. epidermidis ATCC 35983
0.57 ± 0.22 0.10 ± 0.03 5.39 ± 0.19 >5.75* 0.05 0.03
R. terrigena ATCC 33527
0.10 ± 0.00 0.11 ± 0.01 > 19.64* 14.30 ± 2.45 0.10 0.06
S. thermophilus ATCC 19258
0.12 ± 0.34 0.03 ± 0.01 0.55 ± 0.05 0.68 ± 0.04 0.00 0.00
P. aeruginosa D1
0.06 ± 0.02 0.04 ± 0.01 0 3.41 ± 1.00 0.05 0.03
P. aeruginosa KEI 1025
0.24 ± 0.02 0.70 ± 0.28 4.53 ± 0.82 9.93 ± 0.03 0.08 0.05
* No detachment could be stimulated within the shear rates applied and the value indicated denotes the highest shear applied.
Shear rates to remove adhering bacteria. Figure 3 presents the detachment of
bacteria from glass and DDS as a function of the shear rate applied, expressed as
the fraction (f) of bacteria removed from the substratum surface. For a given
shear rate, f is defined as the number of removed bacteria after 30 min exposure
to that shear divided by the number of adhering bacteria before application of
the shear. From the plots in Figure 3 critical shear rates to detach adhering
bacteria (σdet) were derived, defined as the shear rate at which 63% of the
adhering bacteria had detached. Subsequently, these shear rates were expressed
in detachment forces (Fdet) using Equation 14, and their values are listed in

Chapter 2
26
Table 2. In most cases, bacteria are more readily detached from glass than from
DDS-coated glass. All forces remain in the pN range, but are an order of
magnitude larger than Fprev. Note that the critical detachment level could not be
reached within the range of shear rates possible in our experimental set-up for S.
epidermidis ATCC 35983 on DDS-coated glass and for R. terrigena ATCC
33527 on glass.
Air-bubble induced bacterial detachment. Table 3 summarizes the effect of
an air-bubble passing over the adhering bacteria. At first sight, binding affinity
on DDS-coated glass seems to be less than on hydrophilic glass, as judged from
air-bubble-induced detachment. However, on DDS-coated glass, the force
exerted by an air-liquid interface on adhering bacteria is calculated to be up to
five times larger than on glass. For the two Staphylococcus epidermidis strains
and R. terrigena, this results in higher detachment percentages from DDS-coated
glass. In contrast, the percentages detached from glass and DDS-coated glass,
respectively, are for the pseudomonas strains and S. thermophilus not
significantly different. It should be noted that detachment by a passing air-
bubble does not give any indication of the magnitude of the interaction forces.
For example, for the staphylococcal strains and R. terrigena on glass, it cannot
be established at which force detachment would be stimulated to a larger extent.
Air-bubble detachment studies are indecisive here with respect to binding
strength information. However, for the pseudomonas strains and S. thermophilus
it is clear that, even though the exerted force on DDS-coated glass is stronger,
detachment percentages are not higher. Results for these strains suggest stronger
interaction forces with the hydrophobic DDS-coated glass.

Forces involved in bacterial adhesion
27
Figure 3. Shear-induced detachment, expressed as the fraction (f) of bacteria that are removed, as a function of the shear rate (σ) applied for glass (●) and DDS-coated glass (○) after 30 min of flow.
Surface characterization and calculation of theoretical interaction forces.
Measured contact angles, together with the surface free energy components of
the wetting liquids used, are listed in Table 4. All bacteria have a surface
hydrophilicity comparable to the one of glass, as judged from the water contact
angles. DDS-coated glass is significantly more hydrophobic.

Chapter 2
28
Table 3. Number of adhering bacteria on the bottom plate of the parallel plate flow chamber after 1 h of flow (N1h, averaged over adhesion experiments at σ = 10, 50, 100 and 200 s-1; n=1 for each shear rate), detachment percentages from glass and a DDS-coating and the corresponding maximal detachment force (Fγ
max) a liquid/air interface exerts. Glass DDS
Bacterial strain N1h
(x 106 cm-2)
Detach-
ment
(%)
Fγmax
(nN)
N1h
(x 106 cm-2)
Detach-
ment
(%)
Fγmax
(nN)
S. epidermidis HBH2 169
4.9 ± 0.5 9 ± 10 14 3.8 ± 0.5 92 ± 9 40
S. epidermidis ATCC 35983
4.0 ± 0.8 4 ± 5 20 3.5 ± 0.8 62 ± 47 39
R. terrigena ATCC 33527
0.8 ± 0.8 27 ± 6 16 1.4 ± 1.0 87 ± 14 72
S .thermophilus ATCC 19258
0.4 ± 0.3 56 ± 16 17 0.5 ± 0.5 47 ± 21 39
P. aeruginosa D1
0.3 ± 0.4 71 ± 40 37 0.4 ± 0.2 40 ± 14 48
P. aeruginosa KEI 1025
1.3 ± 2.1 53 ± 10 12 2.9 ± 0.7 51 ± 13 54
Bacterial cell surfaces and the glass substratum surface are predominantly
electron-donating, as evidenced by their larger γminus surface free energy
parameter as compared with γplus. Hydrophobic DDS-coated glass is neither a
good electron donor nor acceptor. All surfaces are negatively charged and
whereas bacterial zeta potentials vary between -22 and -50 mV, the zeta
potentials of glass and DDS-coated glass are similarly negative (-33 to -35 mV).
The bacterial cell and substratum surface properties listed in Table 4 have
been used in the extended DLVO theory, yielding interaction free energy- and
force-distance profiles for all combinations of bacteria and substratum surfaces,
as illustrated in Figure 4 for P. aeruginosa KEI 1025. Note the reversed force-

Forces involved in bacterial adhesion
29
axis (right hand side) in Figure 4 indicating that negative values correspond to
attractive interaction forces according to the definition of force:
( ) ( )dEd
dFδδ
−= (15)
Residing in the secondary minimum of the interaction energy corresponds to
zero interaction force, resulting from compensating attractive (Van der Waals)
and repulsive (electrostatic) forces. However, the approach toward the
secondary minimum yields a maximum net attraction force (Figure 4) at a
distance of about 40 nm from the surface. On glass, these interaction forces are
generally higher than on DDS-coated glass (see also Table 2), due to larger
Hamaker constants for glass as a substratum. Additionally, on DDS-coated glass
a primary minimum (closer to the surface) is predicted due to acid-base
interaction. The height of the energy barrier between the secondary and primary
minimum varies from 229 kT for S. thermophilus to 1030 kT for R. terrigena and
therefore it is very unlikely that a depositing micro-organism will cross the
barrier to adhere in the primary minimum. On glass, a primary interaction
minimum is absent.
Discussion
The forces that govern microbial deposition, adhesion and detachment are still
not fully understood, and difficult to relate with each other. In a previous study
we successfully investigated the characteristic shear force to prevent adhesion of
microbial strains [42]. In the current research we used a more systematic
approach by including not only the shear forces to prevent adhesion, but also
those that stimulate detachment of adhering bacteria, as well as theoretical
adhesion forces calculated using the extended DLVO theory. In addition, the
effect of a passing air-liquid interface, which invokes a high, perpendicularly

Cha
pter
2
30
Tab
le 4
. Phy
sico
-che
mic
al c
hara
cter
istic
s of
the
bact
eria
l stra
ins
and
colle
ctor
sur
face
s us
ed. B
acte
rial c
hara
cter
izat
ions
wer
e ba
sed
on th
ree
sepa
rate
ly g
row
n cu
lture
s. Pe
r cul
ture
, con
tact
ang
les
of w
ater
( Θw),
form
amid
e (Θ
form
), α
-bro
mon
apht
hale
ne (Θ
br) a
nd m
ethy
lene
iodi
de (Θ
met)
wer
e m
easu
red
on fo
ur b
acte
rial l
awns
usi
ng o
ne d
ropl
et p
er li
quid
per
bac
teria
l law
n. Z
eta
pote
ntia
ls (ζ
) wer
e de
term
ined
in tr
iplic
ate.
Con
tact
an
gle
and
stre
amin
g po
tent
ial
mea
sure
men
ts o
n su
bstra
tum
sur
face
s w
ere
perf
orm
ed i
n qu
adru
plic
ate.
Fre
e su
rfac
e en
ergy
com
pone
nts
are
deriv
ed fr
om c
onta
ct a
ngle
mea
sure
men
ts g
ivin
g an
ele
ctro
n-do
natin
g ( γ
min
us) a
nd -a
ccep
ting
(γpl
us) p
aram
eter
for t
he a
cid-
base
com
pone
nt (γ
AB),
the
Lifs
hitz
-Van
der
Waa
ls c
ompo
nent
(γLW
) and
the
tota
l sur
face
free
ene
rgy
(γTo
t ). B
acte
rial
stra
in
Θw
(º)
Θfo
rm
(º)
Θbr
(º
) Θ
met
(º)
γmin
us
(mJ
m-2
) γpl
us
(mJ
m-2
) γA
B
(mJ
m-2
) γLW
(m
J m
-2)
γTot
(mJ
m-2
) ζ
(m
V)
S. e
pide
rmid
is
HB
H2 1
69
31 ±
4
31 ±
4
34 ±
5
50 ±
3
47.8
0.
4 9
40
49
-50
± 6
S. e
pide
rmid
is
ATC
C 3
5983
38
± 5
40
± 5
36
± 1
54
± 4
45
.8
0.5
10
34
44
-51
± 2
R. te
rrig
ena
ATC
C 3
3527
24
± 3
24
± 3
40
± 4
51
± 4
49
.9
1.8
19
34
53
-49
± 5
S. th
erm
ophi
lus
ATC
C 1
9258
35
± 2
31
± 4
58
± 2
77
± 2
41
.2
5.3
30
22
52
-22
± 5
P. a
erug
inos
a
D1
44 ±
6
42 ±
4
48 ±
8
58 ±
6
38.8
1.
2 14
30
44
-3
0 ±
3
P. a
erug
inos
a
KEI
102
5 25
± 2
31
± 2
40
± 2
49
± 4
54
.8
0.8
14
35
49
-39
± 5
Subs
trat
um su
rfac
e
Gla
ss
28
± 8
25
± 3
51
± 2
64
± 1
45
.8
3.7
26
28
54
-35
± 5
DD
S-co
atin
g
101
± 2
85 ±
3
59 ±
4
65 ±
4
2.2
0.0
0 26
26
-3
3 ±
2
Chapter 2
30

Forces involved in bacterial adhesion
31
Figure 4. Example of the extended DLVO interaction energy (⎯) and –force (⋅⋅⋅⋅) as a function of distance for P. aeruginosa KEI 1025 on glass and DDS-coated glass. Arrows indicate the correct axis for both plots. Note the reversed force-axis.

Chapter 2
32
oriented detachment force on adhering bacteria, was determined. Furthermore,
all experiments were carried out with six different bacterial strains in order to
allow general conclusions to be drawn. As a first step in the experimental
analysis, the gravitational force and its impact on bacterial deposition [43,44]
and adhesion was eliminated by averaging the deposition rates on bottom-and
top plate. At low shear rates, deposition efficiencies (α) exceed unity especially
for the S. epidermidis strains, indicating that deposition is more favourable than
theoretically predicted. Often such deviations are ascribed to the presence of
surface structures [45]. With respect to possible relations between the different
forces distinguished, we test the following hypotheses:
1) A strong hydrodynamic shear force to prevent adhesion relates to a strong
hydrodynamic shear force to detach an adhering organism. This hypothesis
implies a positive correlation between attachment and detachment. Comparison
between Fprev and Fdet (Table 2) show that regardless of the substratum involved,
Fdet is always larger than Fprev. In the experimental set-up used, bacteria are
adhering to the substratum surface for at least half an hour before being subject
to high shear. Therewith, over time the bond between a bacterium and the
substratum surface may become stronger. Supporting evidence for this is
provided by others who have used AFM and found that the adhesion force
increases with prolonged contact time [46,47]. Thus, even though initial
adhesion forces are rather weak, they may be indicative for forces after a
prolonged time, i.e. a relatively strong Fprev might be expected to correspond
with a relatively strong Fdet. However, from Figure 5 it is clear that no
correlation exists between Fprev and Fdet. It implies that attachment and
detachment should be regarded as independent processes and the hypothesis of
an unambiguous relation between attachment and detachment forces should be
rejected.

Forces involved in bacterial adhesion
33
Figure 5. Graphical presentation of possible relations between Fprev and Fdet (A), FDLVO and Fprev (B), FDLVO and Fdet (C) and detachment percentage and Fmax (D).
2) A weak hydrodynamic shear force to detach adhering bacteria implies that
more bacteria will be stimulated to detach by a passing air-liquid interface
through the flow chamber. Table 2 clearly indicates that Fdet for hydrophobic
DDS-coated glass is larger than for hydrophilic glass, indicating stronger
interaction forces on the hydrophobic substratum. Table 3 summarizes
parameters involved in air-bubble-induced detachment. An air-liquid interface
exerts forces 104 times larger than Fdet, yet it does not result in complete
detachment. Combining the data in Tables 2 and 3, reveals the absence of a clear
relation between shear-induced detachment and detachment by passing an air-
bubble. Thus a weaker Fdet does not result in higher air-bubble-stimulated
detachment and this hypothesis has to be rejected too. In this respect it must be
realized that different mechanisms of detachment are involved in both processes.

Chapter 2
34
Hydrodynamic detachment forces are measured while the system is completely
submerged in liquid whereas an extra phase is introduced in air-bubble-induced
detachment. Furthermore, Fdet is a force acting parallel to the substratum surface,
whereas the air-liquid interface acts perpendicularly to the substratum surface.
3) DLVO interactions determine the characteristic hydrodynamic shear forces
to prevent adhesion and to detach adhering micro-organisms as well as the
detachment induced by a passing air-liquid interface. Further analysis revealed
the absence of quantitative relations between FDLVO and Fprev, as well as between
FDLVO and Fdet (Figure 5). DLVO-predictions have often been demonstrated to
deviate from experimental observations of bacterial interaction phenomena,
which is usually ascribed to the presence of surface appendages [48,49] or
chemical surface heterogeneities. However, the direction of action of the
DLVO-forces should be taken into account as well. DLVO-forces act
perpendicularly to the substratum surface, whereas both Fprev and Fdet are
directed parallel to the substratum surface.
When the fluid flow is increased to high enough values, the bacterium
most likely detaches in a rolling fashion [50]. It can be argued that in this mode
of detachment, forces normal to the surface (i.e. DLVO- and lift forces) are
related to forces directed parallel to the surface. However, in similar detachment
studies it was found that lift forces are negligible and surface roughness may
play a decisive role in determining the hydrodynamic force to remove adhering
particles from the surface [51,52]. This feature is not accounted for in the
DLVO-theory. Table 2 shows only slight differences between the theoretical
FDLVO-values for the various microbial strains, but substantial differences
between the experimentally obtained forces Fprev and Fdet. If a correlation
between DLVO forces and shear forces would exist, an increase of these parallel
directed forces implies an increase in normally directed forces. However, this is

Forces involved in bacterial adhesion
35
not observed in FDLVO. Hence, the parallel detachment forces do not correlate to
the perpendicularly directed DLVO-forces.
The DLVO theory predicts a secondary minimum of interaction at a
distance of about 30 to 40 nm away from the surface (see Figure 4). On
hydrophilic glass, closer approach is impossible due to strong repulsion and
adhesion can only occur in the secondary minimum. On DDS-coated glass, also
primary minimum interactions are predicted. However, due to the prohibitive
high barrier of the free energy (ranging from 229 kT to 1030 kT depending on
the strain used), it is very unlikely that adhesion in the primary minimum can
occur. Therefore, also on the hydrophobic DDS-coated glass, only adhesion in
the secondary minimum is expected to occur. As can be seen in Table 2, Fdet-
values are much higher than FDLVO. Often, a transition of adhesion from the
secondary interaction minimum towards the primary minimum is used as
explanation [53]. However, in this study this is considered to be impossible as
on glass a primary minimum is absent and on DDS-coated glass it is considered
to be unreachable due to the high energy barrier. It is therefore more likely that
the higher Fdet values are the result of attachment of surface appendages, or
“extracellular polymeric substances” produced, capable to reach the surface.
These structures are known to extend as much as hundreds of nm away from the
bacterial cell wall [38], which is more than enough to bridge the distance
between secondary minimum and the substratum surface. Unfortunately,
although it is known for instance that some streptococci may possess surface
fibrils, structural information about the cell surface of far most all strains studied
in the literature are lacking, let alone detailed knowledge about the length,
diameter and micro(nano-)scopic physico-chemical properties of these
structures. The use of the DLVO-theory as currently done in the literature as
well as in this chapter, can therefore only pertain to long-distance approach,
where fine surface structures do not play a role. Up to what distance of approach
and up to what extent this statement is valid, is hard to say. However, while the

Chapter 2
36
DLVO-theory predicts interactions for the entire micro-organism, it is likely that
the experimentally obtained detachment forces are related to a number of
distinct (hydrogen) bonds. When these linkages break, due to parallel directed
forces, the bacterium can be transported away from the surface due to lift forces
which are induced by the tangential flow [54]. In this respect, parallel directed
hydrodynamic forces (i.e. Fprev and Fdet) can serve as useful parameters to
indicate adhesion strength.
When combining the detachment parameters (i.e. Fdet and the air-bubble
detachment percentage), our results suggest that bridging between the bacterium
and the substrate surface is more favourable for DDS-coated glass. Fdet on
hydrophobic DDS-coated glass is always higher than on glass and even though
one has to be cautious in interpreting air-bubble detachment percentages, the
higher detachment force exerted by the air-bubble on DDS-coated glass does not
necessarily lead to more detachment. The hydrophobicity of the surface likely
enhances the possibility of bridging as removal of water from in between the
interacting surfaces is more favourable. This matter is further complicated by the
influence of the type of medium in which adhesion occurs. The DLVO-theory is
based on averaged properties of the surfaces of the bacterial cell and substratum.
However, it was found that ions in the suspending medium, especially divalent
ions, can greatly influence the adhesion of bacteria to a surface, probably due to
surface charge heterogeneities resulting from complexation of different ions
with the (bacterial cell) surface(s) [55]. Since our experiments were performed
in potassium phosphate buffer, we cannot rule out similar effects caused by the
divalent phosphate anion.
Even though no quantitative correlation between the DLVO theory and
detachment behaviour could be established, and the above forwarded hypothesis
should therefore be rejected, this theory does help to provide a better insight in
the mechanism of bacterial adhesion to a substratum surface.

Forces involved in bacterial adhesion
37
Conclusions
The hydrodynamic force to prevent adhesion (Fprev) is lower than the
hydrodynamic force to stimulate detachment (Fdet) showing that the bond
between a substratum surface and a bacterium becomes stronger after initial
adhesion. Consequently, Fprev and Fdet should be considered as independent
parameters.
There is no unambiguous relation between the hydrodynamic forces (Fprev
and Fdet) directed parallel to the substratum surface and perpendicularly oriented
parameters (FDLVO, air-liquid interface detachment), because these forces act in
different directions. DLVO forces maybe wrongfully estimated because of local
charge heterogeneities and bridging between cell appendages and/or exudates on
the one hand and substrate surface on the other. Furthermore, air-liquid interface
induced detachment relies on a three-phase system, whereas the other forces are
obtained for a two-phase environment, complicating establishment of a possible
correlation.

Chapter 2
38
References
1. Costerton, J.W., Stewart, P.S. and Greenberg, E.P. (1999), Bacterial biofilms: A
common cause of persistent infections, Science 284, 1318 - 1322.
2. Flemming, H.C. (2002), Biofouling in water systems - Cases, causes and
countermeasures, Appl Microbiol Biot 59, 629 - 640.
3. Von Eiff, C., Jansen, B., Kohnen, W. and Becker, K. (2005), Infections associated
with medical devices - Pathogenesis, management and prophylaxis, Drugs 65,
179 - 214.
4. Van Oss, C.J., Good, R.J. and Chaudhury, M. (1986), The role of Van der Waals
forces and hydrogen bonds in hydrophobic interactions between biopolymers and low
energy surfaces, J Colloid Interf Sci 111, 378 - 390.
5. Bakker, D.P., Busscher, H.J. and Van der Mei, H.C. (2002), Bacterial deposition in a
parallel plate and a stagnation point flow chamber: Microbial adhesion mechanisms
depend on the mass transport conditions, Microbiol-Sgm 148, 597 - 603.
6. Thomas, W.E., Nilsson, L.M., Forero, M., Sokurenko, E.V. and Vogel, V. (2004),
Shear-dependent 'stick-and-roll' adhesion of type 1 fimbriated Escherichia coli,
Molecular Microbiology 53, 1545 - 1557.
7. Higashi, J.M., Wang, I.W., Shlaes, D.M., Anderson, J.M. and Marchant, R.E.
(1998), Adhesion of Staphylococcus epidermidis and transposon mutant strains to
hydrophobic polyethylene, J Biomed Mater Res 39, 341 - 350.
8. Shive, M.S., Hasan, S.M. and Anderson, J.M. (1999), Shear stress effects on bacterial
adhesion, leukocyte adhesion, and leukocyte oxidative capacity on a polyetherurethane,
J Biomed Mater Res 46, 511 - 519.
9. Wang, I.W., Anderson, J.M., Jacobs, M.R. and Marchant, R.E. (1995), Adhesion of
Staphylococcus epidermidis to0 biomedical polymers - Contributions of surface
thermodynamics and hemodynamic shear conditions, J Biomed Mater Res 29, 485 - 493.

Forces involved in bacterial adhesion
39
10. Mohamed, N., Rainier, T.R. and Ross, J.M. (2000), Novel experimental study of
receptor-mediated bacterial adhesion under the influence of fluid shear, Biotechnol
Bioeng 68, 628 - 636.
11. Duddridge, J.E., Kent, C.A. and Laws, J.F. (1982), Effect of surface shear-stress on
the attachment of Pseudomonas fluorescens to stainless-steel under defined flow
conditions, Biotechnol Bioeng 24, 153 - 164.
12. Rutter, P.R. and Vincent, B. (1988), Attachment mechanisms in the surface growth of
microorganisms. In: Physiological models in microbiology. Bazin, M.J. and Prosser, J.I.
(Eds.), Boca Raton, Florida:CRC Press, Inc. pp 87 - 107.
13. Owens, N.F., Gingell, D. and Rutter, P.R. (1987), Inhibition of cell-adhesion by a
synthetic-polymer adsorbed to glass shown under defined hydrodynamic stress, J Cell
Sci 87, 667 - 675.
14. Katsikogianni, M. and Missirlis, Y.F. (2004), Concise review of mechanisms of
bacterial adhesion to biomaterials and of techniques used in estimating bacteria-material
interactions, Eur Cell Mater 8, 37 - 57.
15. Mohamed, N., Teeters, M.A., Patti, J.M., Hook, M. and Ross, J.M. (1999),
Inhibition of Staphylococcus aureus adherence to collagen under dynamic conditions,
Infect Immun 67, 589 - 594.
16. Walker, S.L., Redman, J.A. and Elimelech, M. (2004), Role of cell surface
lipopolysaccharides in Escherichia coli K12 adhesion and transport, Langmuir 20,
7736 - 7746.
17. Meinders, J.M., Van der Mei, H.C. and Busscher, H.J. (1995), Deposition efficiency
and reversibility of bacterial adhesion under flow, J Colloid Interf Sci 176, 329 - 341.
18. Busalmen, J.P. and de Sanchez, S.R. (2001), Adhesion of Pseudomonas fluorescens
(ATCC 17552) to nonpolarized and polarized thin films of gold, Appl Environ Microb
67, 3188 - 3194.

Chapter 2
40
19. Jacobs, A., Lafolie, F., Herry, J.M. and Debroux, M. (2007), Kinetic adhesion of
bacterial cells to sand: Cell surface properties and adhesion rate, Colloid Surface B 59,
35 - 45.
20. Vijayalakshmi, S.P. and Raichur, A.M. (2003), The utility of Bacillus subtilis as a
bioflocculant for fine coal, Colloid Surface B 29, 265 - 275.
21. Sharma, P.K. and Rao, K.H. (2003), Adhesion of Paenibacillus polymyxa on
chalcopyrite and pyrite: Surface thermodynamics and extended dlvo theory, Colloid
Surface B 29, 21 - 38.
22. Azeredo, J., Visser, J. and Oliveira, R. (1999), Exopolymers in bacterial adhesion:
Interpretation in terms of DLVO and XDLVO theories, Colloid Surface B 14, 141 - 148.
23. Cao, T., Tang, H.Y., Liang, X.M., Wang, A.F., Auner, G.W., Salley, S.O. and Ng,
K.Y.S. (2006), Nanoscale investigation on adhesion of E. coli surface modified silicone
using atomic force microscopy, Biotechnol Bioeng 94, 167 - 176.
24. Abu-Lail, N.I. and Camesano, T.A. (2003), Role of lipopolysaccharides in the
adhesion, retention, and transport of Escherichia coli JM109, Environ Sci Technol 37,
2173 - 2183.
25. Mendez-Vilas, A., Gallardo-Moreno, A.M. and Gonzalez-Martin, M.L. (2006),
Nano-mechanical exploration of the surface and sub-surface of hydrated cells of
Staphylococcus epidermidis, Anton Leeuw Int J Gen Mol Microbiol 89, 373 - 386.
26. Bowen, W.R., Fenton, A.S., Lovitt, R.W. and Wright, C.J. (2002), The measurement
of Bacillus mycoides spore adhesion using atomic force microscopy, simple counting
methods, and a spinning disk technique, Biotechnol Bioeng 79, 170 - 179.
27. Fallman, E., Schedin, S., Jass, J., Andersson, M., Uhlin, B.E. and Axner, O. (2004),
Optical tweezers based force measurement system for quantitating binding interactions:
System design and application for the study of bacterial adhesion, Biosens Bioelectron
19, 1429 - 1437.
Forces involved in bacterial adhesion
41
28. Simpson, K.H., Bowden, M.G., Hook, M. and Anvari, B. (2002), Measurement of
adhesive forces between S. epidermidis and fibronectin-coated surfaces using optical
tweezers, Laser Surg Med 31, 45 - 52.
29. Simpson, K.H., Bowden, A.G., Peacock, S.J., Arya, M., Hook, M. and Anvari, B.
(2004), Adherence of Staphylococcus aureus fibronectin binding protein a mutants: An
investigation using optical tweezers, Biomol Eng 21, 105 - 111.
30. Gomez-Suarez, C., Busscher, H.J. and Van der Mei, H.C. (2001), analysis of
bacterial detachment from substratum surfaces by the passage of air-liquid interfaces,
Appl Environ Microb 67, 2531 - 2537.
31. Bakker, D.P., Postmus, B.R., Busscher, H.J. and Van der Mei, H.C. (2004),
Bacterial strains isolated from different niches can exhibit different patterns of adhesion
to substrata, Appl Environ Microb 70, 3758 - 3760.
32. Busscher, H.J. and Van der Mei, H.C. (2006), Microbial adhesion in flow
displacement systems, Clin Microbiol Rev 19, 127 - 141.
33. Elimelech, M. (1994), Particle deposition on ideal collectors from dilute flowing
suspensions - Mathematical formulation, numerical-solution, and simulations, Separ
Technol 4, 186 - 212.
34. Van Holde, K.E. (1971), Introduction in transport processes:diffusion. In: Physical
biochemistry. Van Holde, K.E. (Eds.), Englewood Cliffs, New Jersey:Prentice-Hall, Inc.
pp 79 - 111.
35. Leenaars, A.F.M. and O'Brien, S.B.G. (1989), Particle removal from silicon
substrates using surface-tension forces, Philips J Research 44, 183 - 209.
36. Van Wagenen, R.A. and Andrade, J.D. (1980), Flat-plate streaming potential
investigations - Hydrodynamics and electrokinetic equivalency, J Colloid Interf Sci 76,
305 - 314.
37. Lyklema, J. (1991), Electrochemistry and its application to colloids and interfaces. In:
Fundamentals of interface and colloid science. London:Academic Press Ltd. pp

Chapter 2
42
38. Bos, R., Van der Mei, H.C. and Busscher, H.J. (1999), Physico-chemistry of initial
microbial adhesive interactions - Its mechanisms and methods for study, FEMS
Microbiol Rev 23, 179 - 230.
39. Van Oss, C.J. (1994), Rate of decay with distance. In: Interfacial forces in aqueous
media. Van Oss, C.J. (Eds.), New York:Marcel Dekker. pp 75 - 88.
40. Van Oss, C.J. (1994), Relation between the Hamaker constant and the apolar surface
tension component. In: Interfacial forces in aqueous media. Van Oss, C.J. (Eds.), New
York:Marcel Dekker. pp 154 - 160.
41. Norde, W. and Lyklema, J. (1989), Protein adsorption and bacterial adhesion to solid-
surfaces - A colloid-chemical approach, Colloid and Surface 38, 1 - 13.
42. Roosjen, A., Boks, N.P., Van der Mei, H.C., Busscher, H.J. and Norde, W. (2005),
Influence of shear on microbial adhesion to PEO-brushes and glass by convective-
diffusion and sedimentation in a parallel plate flow chamber, Colloid Surface B 46,
1 - 6.
43. Walt, D.R., Smulow, J.B., Turesky, S.S. and Hill, R.G. (1985), The effect of gravity
on initial microbial adhesion, J Colloid Interf Sci 107, 334 - 336.
44. Agladze, K., Wang, X. and Romeo, T. (2005), Spatial periodicity of Escherichia coli
K12 biofilm microstructure initiates during a reversible, polar attachment phase of
development and requires the polysaccharide adhesin pga, J Bacteriol 187, 8237 - 8246.
45. Triandafillu, K., Balazs, D.J., Aronsson, B.O., Descouts, P., Quoc, P.T., Van
Delden, C., Mathieu, H.J. and Harms, H. (2003), Adhesion of Pseudomonas
aeruginosa strains to untreated and oxygen-plasma treated poly(vinyl chloride) (PVC)
from endotracheal intubation devices, Biomaterials 24, 1507 - 1518.
46. Vadillo-Rodriguez, V., Busscher, H.J., Norde, W., De Vries, J. and Van der Mei,
H.C. (2004), Atomic force microscopic corroboration of bond aging for adhesion of
Streptococcus thermophilus to solid substrata, J Colloid Interf Sci 278, 251 - 254.

Forces involved in bacterial adhesion
43
47. Xu, L.C., Vadillo-Rodriguez, V. and Logan, B.E. (2005), Residence time, loading
force, pH, and ionic strength affect adhesion forces between colloids and biopolymer-
coated surfaces, Langmuir 21, 7491 - 7500.
48. Jucker, B.A., Zehnder, A.J.B. and Harms, H. (1998), Quantification of polymer
interactions in bacterial adhesion, Environ Sci Technol 32, 2909 - 2915.
49. Ong, Y.L., Razatos, A., Georgiou, G. and Sharma, M.M. (1999), Adhesion forces
between E.coli bacteria and biomaterial surfaces, Langmuir 15, 2719 - 2725.
50. Das, S.K., Schechter, R.S. and Sharma, M.M. (1994), The role of surface-roughness
and contact deformation on the hydrodynamic detachment of particles from surfaces, J
Colloid Interf Sci 164, 63 - 77.
51. Batra, A., Paria, S., Manohar, C. and Khilar, K.C. (2001), Removal of surface
adhered particles by surfactants and fluid motions, Aiche J 47, 2557 - 2565.
52. Yiantsios, S.G. and Karabelas, A.J. (1995), Detachment of spherical microparticles
adhering on flat surfaces by hydrodynamic forces, J Colloid Interf Sci 176, 74 - 85.
53. Van Loosdrecht, M.C.M. and Zehnder, A.J.B. (1990), Energetics of bacterial
adhesion, Experientia 46, 817 - 822.
54. Cantat, I. and Misbah, C. (1999), Lift force and dynamical unbinding of adhering
vesicles under shear flow, Phys Rev Lett 83, 880 - 883.
55. De Kerchove, A.J. and Elimelech, M. (2008), Calcium and magnesium cations
enhance the adhesion of motile and nonmotile Pseudomonas aeruginosa on alginate
films, Langmuir 24, 3392 - 3399.

Chapter 2
44

CHAPTER 3
RESIDENCE TIME DEPENDENT DESORPTION OF
STAPHYLOCOCCUS EPIDERMIDIS FROM HYDROPHILIC AND
HYDROPHOBIC SUBSTRATA
Reproduced with permission of Elsevier b.v. from: Boks, N.P., Kaper, H.J., Norde, W.,
Busscher, H.J. and Van der Mei, H.C. (2008), Colloids and Surfaces B: Biointerfaces 67,
276-278.

Chapter 3
46
Abstract
Adhesion and desorption are simultaneous events during bacterial adhesion to
surfaces, although desorption is far less studied than adhesion. Here, desorption
of Staphylococcus epidermidis from substratum surfaces is demonstrated to be
residence time dependent. Initial desorption rate coefficients were similar for
hydrophilic and hydrophobic dimethyldichlorosilane (DDS) -coated glass, likely
because initial desorption is controlled by attractive Lifshitz-Van der Waals
interactions, which are comparable on both substratum surfaces. However,
significantly slower decay times of the desorption rate coefficients are found for
hydrophilic glass than for hydrophobic DDS-coated glass. This difference is
suggested to be due to the acid-base interactions between staphylococci and
these surfaces, which are repulsive on hydrophilic glass and attractive on
hydrophobic DDS-coated glass. Final desorption rate coefficients are higher on
hydrophilic glass than on hydrophobic DDS-coated glass, due to the so called
hydrophobic effect, facilitating a closer contact on hydrophobic DDS-coated
glass.

Residence time dependent desorption
47
Introduction
Microbial adhesion to substratum surfaces is generally considered to consist of
two steps [1,2]. In the first step, adhesion is reversible and detachment may
occur spontaneously. Gradually, as a second step, adhesive forces increase to
cause more irreversible adhesion [3-6] with a lower desorption probability [7].
Although residence time dependent desorption has been investigated previously,
these studies were subject to technical limitations [8]. Analyses were based on a
series of images taken with 12 s time interval between consecutive pictures.
Nowadays, consecutive images can be taken with a time interval of 1 s, or even
shorter if desired, enabling more accurate registration and analysis of adhesion
and desorption events in microbial adhesion.
Desorption of bacteria from surfaces can be described by a so called
residence time dependent desorption rate coefficient (β(t-τ)). After adhesion,
immediate spontaneous detachment may occur, which is reflected in an initial
desorption rate coefficient (β0). However, due to bond strengthening effects, the
desorption probability will decrease with prolonged contact time and, as a result,
β0 will decay with a characteristic decay time τc to a final desorption rate
constant, β∞. The bond strength between bacteria and surfaces might be
influenced by several factors, like for example hydrodynamic shear [9,10],
substratum surface hydrophobicty or biosurfactant release. Initial desorption rate
coefficients of Streptococcus thermophilus B from hydrophilic glass and
hydrophobic fluoroethylenepropylene, for instance, were 7.4 x 10⁻³ s-1 and 7.7 x
10-3 s-1, respectively and decreased with residence time on both surfaces. Final
desorption rate coefficients were achieved within 60 s and were slightly larger
on the hydrophilic than on the hydrophobic surface (1.0 x 10⁻⁵ s-1 and 0.7 x 10⁻⁵
s-1, respectively), indicating that desorption was easiest from the hydrophilic
surface [8].

Chapter 3
48
Staphylococcus epidermidis is normally a non-pathogenic skin organism,
but it is involved in many biomaterial-related infections. S. epidermidis can
adhere to a variety of different hydrophobic and hydrophilic biomaterials, but
little is known about its ability to desorb from substratum surfaces. The aim of
this study is to investigate the residence time dependent desorption of 4 S.
epidermidis strains from a hydrophilic and a hydrophobic substratum surface.
Materials and Methods
Staphylococcal strains and culture conditions. S. epidermidis strains 3399,
ATCC 35983, HBH2 3 and HBH2 169 were cultured aerobically in 10 ml
Tryptone Soy Broth (OXOID) for 24 h at 37 ºC. After 24 h, cultures were used
to inoculate 200 ml main cultures, which were grown for 16 h under similar
conditions as the precultures. Bacteria were harvested by centrifugation for 5
min at 5000 x g, washed twice with 10 mM potassium phosphate buffer at pH 7
and suspended in the same buffer. To break bacterial aggregates, the bacterial
suspension was sonicated 3 times for 10 s at 30 W (Vibra Cell model 375,
Sonics and Materials Inc., Danbury, CT, USA), while cooling the suspension in
a water/ice bath. Staphylococci were suspended to a concentration of 3 x 10⁸ per
ml in 10 mM potassium phosphate buffer at pH 7.
Desorption studies. Experiments were conducted in a parallel plate flow
chamber [11]. The top and bottom plates of the flow chamber were comprised of
two microscope glass slides. As a hydrophilic substratum surface, glass (water
contact angle 28 ± 8 degrees) was used, while a hydrophobic surface was
obtained by silanization of glass slides in 0.05% (w/v) dimethyldichlorosilane
(DDS, water contact angle 101 ± 2 degrees) in trichloroethylene [12]. After
filling the system with a bacterial suspension, flow was maintained at a wall

Residence time dependent desorption
49
shear rate of 15 s-1 and adhesion and desorption was monitored microscopically
on the bottom plate of the flow chamber. Consecutive images were taken at 1 s
time intervals for a period of 25 min with a CCD camera (Basler A102F, Basler
AG, Germany). All experiments were conducted in six fold with three separately
grown cultures.
Analysis. Image analysis consisted of registering the time of arrival and the
location of adhering staphylococci on the substratum surface and comparison of
their positions in following images using proprietary software based on the
Matlab Image processing Toolkit (The MathWorks, MA, USA)). This analysis
allows us to follow individual bacteria in time and distinguishes between
moving and adhering bacteria. Subsequently, when the time of adsorption (τ)
and the time of desorption (t) were known, the residence time dependent
desorption rate (β(t-τ)) can be calculated according to [12]:
( ) ( )( )( )∑ ∑
−
= += −− −ΔΔ
−−=−
1
1 1 111N
j
N
ji iijiads
ides
ttntn
jNt
ττβ (1)
In this summation, which runs over the number of images taken, Δndes(ti) is the
number of bacteria desorbing between time ti-1 and ti and adsorbing between
time τi-j-1 and τi-j, and Δnads(ti-j) is the total number of adsorbed bacteria between
time τi-j-1 and τi-j.
The measured β(t-τ) was fitted according to [13]:
( ) ( )⎟⎟⎠
⎞⎜⎜⎝
⎛ −−−−=− ∞∞
c
ttττβββτβ exp)( 0 (2)
yielding the initial desorption rate coefficient (β0), which decays to a final
desorption rate coefficient (β∞) with a relaxation time (τc).

Chapter 3
50
Statistical analysis (non-parametric Mann-Whitney U test) was performed using
SPSS 14.0 to identify significant differences in staphylococcal desorption from
the two surfaces, taking p < 0.05 as a level of significance.
Results
Figure 1 gives an example of the residence time dependent desorption of S.
epidermidis HBH2 3 from hydrophilic glass and hydrophobic DDS-coated glass.
Similar curves were obtained for the other three staphylococcal strains. An
exponential decay pattern justifies the use of equation 2 to determine initial and
final desorption rate coefficients, as well as their relaxation times, as
summarized in Table 1. On average, the desorption rate coefficients decay from
0.5 s-1 to 2.0 x 10⁻³ s-1 in less than 1 s, indicating a rapid bond strengthening.
Table 1. Initial and final desorption rate coefficients (β0 and β∞, respectively) and their characteristic decay time (τc) of S. epidermidis strains from hydrophilic glass and hydrophobic DDS-coated, glass. Values represent averages of six measurements with three separately grown cultures. Average standard deviations amount ± 0.2 s-1 and ± 0.6 x 10⁻³ s-1 over β0 and β∞, respectively, and ± 0.2 s over τc. Glass DDS-coated glass
Strain β0 (s-1) β∞ (10-3 s-1) τc (s) β0 (s-1) β∞ (10-3 s-1) τc (s)
3399 0.4 2.8 1.1 0.5 1.9 0.7
ATCC 35983 0.4 2.4 1.1 0.4 1.2 0.7
HBH2 3 0.5 2.2 0.9 0.5 1.3 0.7
HBH2 169 0.8 2.5 1.1 0.5 1.4 0.8
Initial desorption rate coefficients β0 are not statistically different on hydrophilic
glass and hydrophobic DDS-coated glass. However, final desorption rate
coefficients β∞ and relaxation times τc differ significantly between both

Residence time dependent desorption
51
substratum surfaces. On DDS-coated glass, bond strengthening is faster and
yields lower final desorption rate coefficients than on hydrophilic glass.
Figure 1. Examples of the residence time dependent desorption rate coefficient (β(t-τ)) as a function of the residence time (t-τ) for S. epidermidis HBH2 3 from hydrophilic glass (●) and hydrophobic DDS-coated glass (○).
Discussion
Adhesion and desorption are outer cell surface events, and attractive Lifshitz-
Van der Waals forces are among the forces that become effective at some
separation distance between a bacterium approaching a surface. This is different
from interactions such as hydrogen bonding, which require close contact. The
Lifshitz-Van der Waals free energies of interaction are attractive and of
comparable magnitude for all staphylococci on both hydrophilic and DDS-

Chapter 3
52
coated hydrophobic glass, as can be seen from Table 2, constructed from
previously published contact angles on staphylococcal lawns and the solid
substrata involved [15]. Since the initial desorption rates on hydrophilic and
hydrophobic DDS-coated glass are comparable as well for all staphylococcal
strains, it is suggested here that initial desorption of adhering bacteria is
controlled by attractive Lifshitz-Van der Waals forces.
Hydrogen bonding between a bacterium (b) and a substratum surface (s)
requires direct contact between the two components. It is a competitive process
involving hydrogen bonding between b and water (l) and between s and l on the
one hand, and between s and b and l and l, on the other. The values for ΔGABslb,
reported in Table 2, indicate that this competition for hydrogen bonding results
in attraction of the staphylococci to the hydrophobic DDS-coated glass and in
repulsion from the hydrophilic glass surface.
Table 2. Lifshitz-Van der Waals and Acid-Base components of interaction free energy (ΔGLW
slb and ΔGABslb, respectively) between staphylococci and hydrophilic glass or
hydrophobic DDS-coated glass, calculated from published contact angles [14]. Glass DDS-coated glass
Strain ΔGLWslb
(mJ m-2)
ΔGABslb
(mJ m-2)
ΔGLWslb
(mJ m-2)
ΔGABslb
(mJ m-2)
3399 -1.7 +34.6 -1.2 -7.4
ATCC 35983 -1.4 +25.7 -1.0 -14.7
HBH2 3 -1.7 +22.1 -1.2 -13.3
HBH2 169 -2.1 +26.8 -1.4 -13.7
Since ΔGAB is evaluated from interfacial tensions [16] it is a macroscopic
property. However, the substratum surface and, even more so, the bacterial
surface are highly heterogeneous. Hence, even though for the whole bacterial

Residence time dependent desorption
53
cell ΔGABslb is repulsive on glass, favourable bonds between the cell and this
surface may be formed locally. Indeed, such favourable bonds must have been
formed, because otherwise no significant adhesion of the staphylococci on glass
would have been observed. It is understood that, unlike in adhesion to DDS-
coated glass, bacteria non-specifically adsorb to glass in the first, fast step of
adhesion by sampling multiple interaction sites until favourable conditions
enable progression to stronger adhesion. This process requires rearrangements of
bacterial surface structures and it explains why the strength of the adhesive bond
increases at a lower rate at the glass surface. This is reflected in the larger decay
times for the desorption rate coefficient, τc, on glass.
Although desorption rate coefficients do not provide information on the
magnitude of adhesion force or bond strength [17], the differences in final
desorption rate coefficients β∞ show that the rate of desorption at equilibrium is
higher for the staphylococci interacting with hydrophilic glass than those
interacting with hydrophobic DDS-coated glass. Apparently, the contribution of
the hydrophobic effect, i.e. the entropy-driven dehydration of a hydrophobic
surface [18], is responsible for the relatively low desorption probability. Also
other surface characteristics might aid bacterial adhesion. For example, Lichter
et al. recently showed that an increasing elastic modulus of the substratum
surface has a positive effect on the adhesion of viable S. epidermidis cells [19].
Such an effect cannot be ruled out in our case as we use glass and DDS-coated
glass.
At this point, it should be noted that previously reported values for the
desorption rate constants β0 and β∞ were 100 to 1000 times smaller and
relaxation time constants τc were about 50 times slower than reported in our
study [8]. This is a clear result of faster computing capabilities, allowing shorter
time intervals between recorded images. Interestingly, although the time interval

Chapter 3
54
between consecutive images is shorter, in our current study initial desorption
rate coefficients also decay by a factor 100 to 1000.
Conclusions
Staphylococcal desorption from hydrophobic DDS-coated glass and hydrophilic
glass is residence time dependent. Under the experimental conditions employed,
including hydrodynamic shear, temperature and the buffer, initial desorption rate
coefficients for a collection of staphylococcal strains were similar for all strains
and substrata and are suggested to be controlled by attractive Lifshitz-Van der
Waals interactions, acting immediately upon approach of a bacterium toward a
surface. Stable desorption rate coefficients were achieved faster for all four
staphylococcal strains on hydrophobic DDS-coated glass than on hydrophilic
glass, due to favourable acid-base interactions between the staphylococci and
DDS-coated glass. We propose that final desorption rate coefficients are
controlled by the hydrophobic effects, facilitating removal of interfacial water,
enhancing contact with DDS-coated glass and resulting in lower final desorption
rate coefficients for the hydrophobic surface.

Residence time dependent desorption
55
References 1. Hermansson, M. (1999), The DLVO theory in microbial adhesion, Colloids Surface B
14, 105 - 119.
2. Palmer, J., Flint, S. and Brooks, J. (2007), Bacterial cell attachment, the beginning of
a biofilm, J Ind Microbiol Biot 34, 577 - 588.
3. Castelain, M., Pignon, F., Piau, J.M., Magnin, A., Mercier-Bonin, M. and Schmitz,
P. (2007), Removal forces and adhesion properties of Saccharomyces cerevisiae on
glass substrates probed by optical tweezer, J Chem Phys 127, 135104-1 - 135104-14.
4. Mercier-Bonin, M., Ouazzani, K., Schmitz, P. and Lorthois, S. (2004), Study of
bioadhesion on a flat plate with a yeast/glass model system, J Colloid Interf Sci 271,
342 - 350.
5. Simpson, K.H., Bowden, M.G., Hook, M. and Anvari, B. (2002), Measurement of
adhesive forces between S. epidermidis and fibronectin-coated surfaces using optical
tweezers, Laser Surg Med 31, 45 - 52.
6. Xu, L.C. and Siedlecki, C.A. (2007), Effects of surface wettability and contact time on
protein adhesion to biomaterial surfaces, Biomaterials 28, 3273 - 3283.
7. Cowan, M.M., Taylor, K.G. and Doyle, R.J. (1986), Kinetic-analysis of Streptococcus
sanguis adhesion to artificial pellicle, J Dent Res 65, 1278 - 1283.
8. Meinders, J.M., Van der Mei, H.C. and Busscher, H.J. (1995), Deposition efficiency
and reversibility of bacterial adhesion under flow, J Colloid Interf Sci 176, 329 - 341.
9. Thomas, W., Forero, M., Yakovenko, O., Nilsson, L., Vicini, P., Sokurenko, E. and
Vogel, V. (2006), Catch-bond model derived from allostery explains force-activated
bacterial adhesion, Biophys J 90, 753 - 764.
10. Meinders, J.M., Noordmans, J. and Busscher, H.J. (1992), Simultaneous monitoring
of the adsorption and desorption of colloidal particles during deposition in a parallel
plate flow chamber, J Colloid Interf Sci 152, 265 - 280.
Chapter 3
56
11. Busscher, H.J. and Van der Mei, H.C. (2006), Microbial adhesion in flow
displacement systems, Clin Microbiol Rev 19, 127 - 141.
12. Ruardy, T.G., Schakenraad, J.M., Van der Mei, H.C. and Busscher, H.J. (1995),
Adhesion and spreading of human skin fibroblasts on physicochemically characterized
gradient surfaces, J Biomed Mater Res 29, 1415 - 1423.
13. Meinders, J.M., Van der Mei, H.C. and Busscher, H.J. (1994), Physicochemical
aspects of deposition of streptococcus-thermophilus-b to hydrophobic and hydrophilic
substrata in a parallel-plate flow chamber, J Colloid Interf Sci 164, 355 - 363.
14. Dabros, T. and Van de Ven, T.G.M. (1982), Kinetics of coating by colloidal particles,
J Colloid Interf Sci 89, 232 - 244.
15. Boks, N.P., Norde, W., Van der Mei, H.C. and Busscher, H.J. (2008), Forces
involved in bacterial adhesion to hydrophilic and hydrophobic surfaces, Microbiology
154, 3122 - 3133.
16. Van Oss, C.J. (1994), Polar or Lewis acid-base interactions. In: Interfacial forces in
aqueous media. Van Oss, C.J. (Eds.), New York:Marcel Dekker. pp 18 - 45.
17. Walton, E.B., Lee, S. and Van Vliet, K.J. (2008), Extending bell's model: How force
transducer stiffness alters measured unbinding forces and kinetics of molecular
complexes, Biophys J 94, 2621 - 2630.
18. Norde, W. (2003), Water. In: Colloids and interfaces in life sciences. Norde, W. (Eds.),
New York:Marcel Dekker Inc. pp 47 - 61.
19. Lichter, J.A., Thompson, M.T., Delgadillo, M., Nishikawa, T., Rubner, M.F. and
Van Vliet, K.J. (2008), Substrata mechanical stiffness can regulate adhesion of viable
bacteria, Biomacromolecules 9, 1571 - 1578.

CHAPTER 4
MOBILE AND IMMOBILE ADHESION OF STAPHYLOCOCCAL
STRAINS TO HYDROPHILIC AND HYDROPHOBIC SURFACES
Boks, N.P., Kaper, H.J., Norde, W., Van der Mei, H.C. and Busscher, H.J. (2008), Journal
of Colloid and Interface Science (in press).

Chapter 4
58
Abstract
Staphylococcus epidermidis adheres to hydrophilic glass and hydrophobic
dimethyldichlorosilane (DDS)-coated glass in similarly high numbers, but in
different modes. Real-time observation of staphylococcal adhesion under a shear
rate of 15 s-1 in a parallel plate flow chamber revealed different adhesion
dynamics on both substratum surfaces. The total number of adsorption and
desorption events to achieve a similar total number of adhering bacteria was
twice as high on hydrophilic glass than on hydrophobic DDS-coated glass.
Moreover, 22% of all staphylococci on hydrophilic glass slid over the surface
prior to adhering on a fixed site (“mobile adhesion mode”), but mobile adhesion
was virtually absent (1%) on hydrophobic DDS-coated glass. Similarly, sliding
preceded desorption on hydrophilic glass in about 20 % of all desorption events,
while on hydrophobic DDS-coated glass 2% of all staphylococci desorbed
straight from the site where they had adhered. Since acid-base interactions
between the staphylococci and a hydrophobic DDS-coating are attractive, it is
suggested that these interactions facilitate a closer approach of the bacteria to the
substratum and therewith enhance immobile adhesion at local, high affinity
surface heterogeneities. Alternatively, if the local site is low affinity, surface
heterogeneities may lead to desorption from the surface. In the absence of
attractive acid-base interactions, as the case on hydrophilic glass, bacteria can be
captured in the minimum of the DLVO-interaction energy curve, but this does
not prevent them from sliding under the influence of flow at a fixed distance
from a substratum surface until immobilization or desorption at or from a local
high or low affinity site, respectively.

Mobile and immobile adhesion of staphylococcal strains
59
Introduction
Microbial adhesion to surfaces is a phenomenon occurring in many fields of
application [1,2], as e.g. dairy processing, food and paper industry,
bioremediation of contaminated soils and in the restoration of human function
using biomaterials. Microbial adhesion can be detrimental or beneficial. For
example, the colonization of biomedical implants by Staphylococcus
epidermidis strains may lead to biomaterial related infections and usually
necessitates removal of the implant [3]. Alternatively, effective bioremediation
of soil or wastewater requires bacteria to adhere [4,5].
Adhesion starts with the transport of micro-organisms towards a
substratum surface by means of gravity, convection and diffusion [6,7]. Upon
close approach, adhesion is mediated by so-called non-specific DLVO
interactions, including Lifshitz-Van der Waals-, electrostatic- and Lewis acid-
base interactions [8] and ultimately via specific ligand-receptor interactions [9].
Microbial adhesion can be a dynamic process consisting of an ongoing series of
adsorption and desorption events, depending on the degree of reversibility of the
interaction. Micro-organisms may adhere reversibly or irreversibly and the
desorption probability was found to depend on the contact time between bacteria
and a substratum surface [10]. Generally, the desorption probability decreases
with increasing contact time, suggesting an increase in bond strength in time, as
evidenced for the time-dependent interaction between Streptococcus
thermophilus and a silicon nitride AFM tip [11].
Fluid flow may have a profound influence on microbial adhesion. Fluid
flow is not only responsible for convective mass transport toward a substratum
surface, but can also stimulate detachment once exceeding a critical limit [12] or
alternatively, facilitate stronger binding [13]. A basic feature of microbial
adhesion is, that the micro-organisms reside at a fixed distance from a

Chapter 4
60
substratum surface, or at least in the close vicinity of that surface for an
extended period of time. Therewith, adhesion does not rule out that organisms
can slide over a substratum surface due to fluid flow and it seems appropriate to
introduce the terms “mobile” and “immobile” adhesion. Sliding may occur
directly after a bacterium has arrived at a substratum surface until it has reached
its final site, or as the onset of a desorption event. We want to stress that in this
respect, our notion of mobile is not related to bacterial motility, like in
flagellated bacteria [14] or bacterial gliding, as expressed by some non-
flagellated bacteria [15,16].
In this chapter a method is proposed to distinguish between mobile and
immobile adhesion and the modes of adhesion of S. epidermidis strains on
hydrophilic glass and hydrophobic DDS-coated glass under flow are compared.
Materials and Methods
Bacterial strains and culture conditions. S. epidermidis strains 3399, ATCC
35983, HBH2 3 and HBH2 169 were cultured aerobically from blood agar plates
in 10 ml Tryptone Soya Broth (OXOID, Basingstoke, England) for 24 h at 37
ºC. After 24 h, precultures were used to inoculate 200 ml main cultures, which
were grown for 16 h. Bacteria were harvested by centrifugation for 5 min at
6500 x g, washed twice with 10 mM potassium phosphate buffer at pH 7 and
resuspended in the same buffer. To break bacterial aggregates, 3 times 10 s
sonication at 30 W (Vibra Cell model 375, Sonics and Materials Inc., Danbury,
CT, USA) was carried out while cooling the suspension in a water/ice bath.
Substratum surfaces. Glass slides were sonicated during 3 min in 2% RBS35
(Omnilabo International BV, Breda, The Netherlands) followed by thorough
rinsing with tap water, demineralised water, methanol, tap water and finally

Mobile and immobile adhesion of staphylococcal strains
61
demineralised water again to obtain a hydrophilic surface (water contact angle
28 ± 8 degrees). After washing, the slides were either directly used or dried for 4
h at 80 ºC for coating. A hydrophobic coating (water contact angle 101 ± 2
degrees) was achieved by submerging the dried glass slides during 15 min in a
solution of dimethyldichlorosilane (DDS, Merck, Darmstadt, Germany) in
trichloroethylene (0.05 w/v%) and subsequent washing with trichloroethylene,
methanol and ultrapure water. Coated slides were never stored longer than 3
days at room temperature prior to experiments and rinsed with 10 mM
potassium phosphate buffer before use.
Mobile and immobile bacterial adhesion in a parallel plate flow chamber.
The parallel plate flow chamber (PPFC) and image analysis have been described
previously [10]. The PPFC used in this study has a length of 175 mm, a depth
of 0.75 mm and a width of 17 mm. Prior to use, the flow chamber was washed
with 2% Extran (Merck, Darmstadt, Germany) and rinsed thoroughly with tap
water and demineralised water. After cleansing, the PPFC was equipped with a
glass top plate and a glass or DDS-coated bottom plate, to which staphylococcal
adhesion, including all individual adsorption and desorption events, was
observed. The PPFC was installed on a microscope stage between two
communicating vessels and the system was filled with 10 mM potassium
phosphate buffer while care was taken to remove all air bubbles. The vessels
containing bacterial suspension were positioned at different heights to create a
flow and the difference in fluid levels was maintained by a roller-pump to
ensure a circulating pulse free flow throughout the duration of an experiment.
Phosphate buffer was allowed to flow through the system at a flow rate of 1.5 ml
min-1 for half an hour. Subsequently, buffer was switched to bacterial
suspension, which was allowed to flow through the PPFC during 25 min at a
rate of 1.5 ml min-1. Under these conditions, flow is laminar and bacterial

Chapter 4
62
A
C
B
D
transport occurs by convective-diffusion. Deposition of bacteria was monitored
with a phase contrast microscope (Olympus BH-2) equipped with a 40x ultra
long working distance objective (Olympus ULWD-CD Plan 40 PL) which was
connected to a CCD-MXRi camera (Basler A102F, Basler AG, Hamburg,
Germany). Image frames (1392 x 1040 pixels) were grabbed at a rate of 15 s-1
and averaged to remove in focus flowing bacteria from the analysis, yielding
images with a time interval of 1 s between each image. Further analysis
consisted of registering the location of the bacteria on the substratum surface
and comparison of their positions in subsequent images in order to determine the
mode of adhesion of individual bacteria. Mobile and immobile adhesion were
distinguished both with respect to adsorption and desorption events (see Fig. 1).
Figure 1. Schematic presentation of the different modes of adhesion distinguished in this study: Immobile adsorption (A): A bacterium arrives at the surface and adheres without sliding along the surface until possible detachment. Mobile adsorption (B): A bacterium arrives at the surface and adheres, but slides along the surface in the direction of the flow under the perpendicularly oriented attractive forces originating from the substratum, until it has found its final adhesion site or possible detachment. Immobile desorption (C): A bacterium detaches from a substratum surface directly from its adhesion site, without sliding prior to desorption. Mobile desorption (D): A bacterium starts to slide away from its adhesion site, but remains adhering under the perpendicularly oriented attractive forces originating from the substratum, until it finally desorbs.

Mobile and immobile adhesion of staphylococcal strains
63
The distinction between adsorption and desorption can simply be made on the
basis of appearance or disappearance of a bacterium. The distinction between
mobile and immobile is a more difficult one to make. A bacterium was
identified as adhering in an immobile mode, when it showed a total
displacement immediately after adsorption or just prior to desorption of less than
1 µm around its adhesion site. Sometimes bacteria were observed to “wobble”
around their adhesion site, but since this was always within the displacement
limit of 1 µm, these bacteria were classified as immobile ones. Sliding once
adhering at a fixed distance above a substratum surface is flow-induced and
establishing mobile adhesion requires a distinction between sliding bacteria that
are under the influence of the perpendicularly oriented attractive forces
originating from the substratum and bacteria that are moving in the fluid flow
without an interaction with the substratum. In order to make this distinction (see
also Fig. 2), it was first calculated that under the experimental conditions, the
fluid velocity at a distance of 0.5 µm above the bottom plate of the flow
chamber (i.e. the radius of a single bacterium) was 5 µm s-1 [6]. Allowing a
minor displacement of 0.5 µm perpendicular to the flow direction, all bacteria
travelling a distance of less than 5 µm in two consecutive images in the direction
of flow were considered to have an interaction with the substratum surface and
were classified as adhering in a mobile mode.
Statistical analysis. Data were analyzed with the Statistical Package for the
Social Sciences (version 14.0, SPSS, Chicago Illinois, USA). Differences
between the two modes of adhesion on both substratum surfaces were analyzed
using the Mann-Whitney U test. The level of significance was set at p < 0.05.

Chapter 4
64
ΔX = 1-5 μm
2 μm
Δt = 1 s
Y-c
oord
inat
e
X-coordinate
Direction of flow
Figure 2. Graphical presentation of the criteria used to identify a mobile mode of adhesion. The black dot represents the X,Y location in the field of 1392 x 1040 pixels of a bacterium in the first image. If the X-displacement in the direction of the flow between two subsequent images is between 1 µm and 5 µm and the Y-displacement is less than 0.5 µm (i.e. the radius of the bacterium), the bacterium is considered to adhere in a mobile mode.
Results
Table 1 summarizes the total number of adhering bacteria to hydrophilic glass
and hydrophobic DDS-coated glass after 25 min of flow for all four
staphylococcal strains. It is of interest to note that three out of the four strains
adhere in similar numbers to the hydrophilic and hydrophobic substratum, while
only strain HBH2 169 adheres in higher numbers to hydrophobic DDS-coated
glass. Table 1 also comprises the number of adsorption and desorption events
leading to the total number of adhering bacteria given. Clearly, staphylococcal
adhesion is a dynamic process on both substrata.
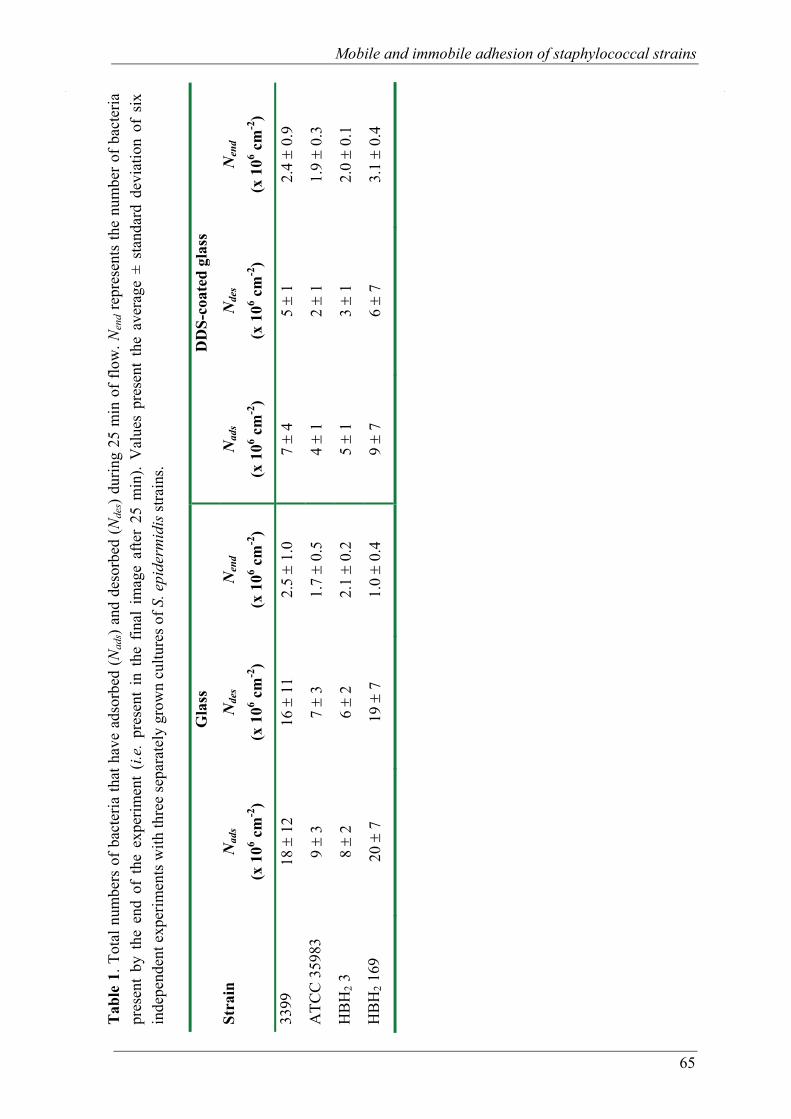
Mob
ile a
nd im
mob
ile a
dhes
ion
of st
aphy
loco
ccal
stra
ins
65
Tab
le 1
. Tot
al n
umbe
rs o
f bac
teria
that
hav
e ad
sorb
ed (N
ads)
and
deso
rbed
(Nde
s) du
ring
25 m
in o
f flo
w. N
end r
epre
sent
s th
e nu
mbe
r of b
acte
ria
pres
ent
by t
he e
nd o
f th
e ex
perim
ent
(i.e.
pre
sent
in
the
final
im
age
afte
r 25
min
). V
alue
s pr
esen
t th
e av
erag
e ±
stan
dard
dev
iatio
n of
six
in
depe
nden
t exp
erim
ents
with
thre
e se
para
tely
gro
wn
cultu
res o
f S. e
pide
rmid
is st
rain
s.
Gla
ss
DD
S-co
ated
gla
ss
Stra
in
Nad
s
(x 1
06 cm
-2)
Nde
s
(x 1
06 cm
-2)
Nen
d
(x 1
06 cm
-2)
Nad
s
(x 1
06 cm
-2)
Nde
s
(x 1
06 cm
-2)
Nen
d
(x 1
06 cm
-2)
3399
18
± 1
2 16
± 1
1 2.
5 ±
1.0
7 ±
4 5 ±
1 2.
4 ±
0.9
ATC
C 3
5983
9 ±
3 7 ±
3 1.
7 ±
0.5
4 ±
1 2 ±
1 1.
9 ±
0.3
HB
H2 3
8 ±
2 6 ±
2 2.
1 ±
0.2
5 ±
1 3 ±
1 2.
0 ±
0.1
HB
H2 1
69
20 ±
7
19 ±
7
1.0 ±
0.4
9 ±
7 6 ±
7 3.
1 ±
0.4
Mobile and immobile adhesion of staphylococcal strains
65

Chapter 4
66
However, on the hydrophilic glass surface, the number of adsorption and
desorption events observed are two- to threefold higher than on hydrophobic
DDS-coated glass and staphylococcal adhesion to the hydrophilic surface is thus
more dynamic than on the hydrophobic surface.
Figure 3 presents an example of staphylococcal sliding for S. epidermidis 3399
on hydrophilic glass and hydrophobic DDS-coated glass prior to desorption.
Tracks indicative of mobile desorption are clearly present on hydrophilic glass
(Fig. 3A) but not on hydrophobic DDS-coated glass (Fig. 3B). The modes of
adsorption and desorption for all four staphylococcal strains and both substrata
are summarized in Table 2. Interestingly, the percentages of staphylococci
showing immobile or mobile adsorption are similar to the percentages of
immobile and mobile desorption, respectively, with no considerable differences
between strains: 19-24% of the staphylococci adhering to hydrophilic glass do
so in a mobile mode, whereas on hydrophobic DDS-coated glass virtually no
(0-2%) staphylococci adhere in this mode.
Discussion
Over the past decades, many researchers have attempted to relate numbers of
bacteria adhering to substratum surfaces with surface free energies. Indeed for
specific collections of strains, or sometimes even one strain, the substratum
surface free energies, its Lifshitz-Van der Waals components and/or electron-
donating and electron-accepting parameters related with numbers of adhering
bacteria [17]. However, in other studies such a relation is rather weak [18], or
even absent [19,20]. Also in our current study, changing the substratum surface
hydrophobicity, and therewith the surface free energy, does not clearly influence
the number of adhering staphylococci.

Mob
ile a
nd im
mob
ile a
dhes
ion
of st
aphy
loco
ccal
stra
ins
67
Tab
le 2
. Fra
ctio
ns o
f im
mob
ile a
nd m
obile
ads
orpt
ion
and
deso
rptio
n ev
ents
in s
taph
yloc
occa
l adh
esio
n to
hyd
roph
ilic
glas
s an
d hy
drop
hobi
c D
DS-
coat
ed g
lass
. V
alue
s gi
ve t
he a
vera
ge o
f si
x in
depe
nden
t ex
perim
ents
with
thr
ee s
epar
atel
y gr
own
cultu
res
of S
. ep
ider
mid
is s
train
s. St
anda
rd d
evia
tions
are
, on
aver
age,
± 9
% o
n gl
ass a
nd ±
2%
on
DD
S-co
ated
gla
ss.
G
lass
D
DS-
coat
ed g
lass
A
dsor
ptio
n ev
ents
D
esor
ptio
n ev
ents
A
dsor
ptio
n ev
ents
D
esor
ptio
n ev
ents
Stra
in
Imm
obile
(%)
Mob
ile (%
)Im
mob
ile (%
) M
obile
(%)
Imm
obile
(%)
Mob
ile (%
) Im
mob
ile (%
) M
obile
(%)
3399
78
22
86
14
99
1
99
1
ATC
C 3
5983
81
19
82
18
99
1
99
1
HB
H2 3
76
24
82
18
10
0
0 99
1
HB
H2 1
69
77
23
71
29
98
2
94
6
67
Mobile and immobile adhesion of staphylococcal strains

Chapter 4
68
Figure 3. Example of the sliding for S. epidermidis 3399 on hydrophilic glass (A) and hydrophobic DDS-coated glass (B), prior to desorption. Single dots represent immobile desorption events, while lines indicate the tracks along which mobile desorption events occur.
However, it is still generally believed that surface free energies play a definitive
role in certain aspects of bacterial adhesion to surfaces.
In this chapter, we compared the mode of adhesion of four staphylococcal
strains under flow on hydrophilic glass and hydrophobic DDS-coated glass. The
total number of adsorption and desorption events appeared two times higher on
hydrophilic glass as compared to hydrophobic DDS-coated glass, despite the
fact that the total numbers of adhering bacteria were roughly similar on both

Mobile and immobile adhesion of staphylococcal strains
69
substratum surfaces. It was further shown that on hydrophilic glass, on average,
21% of the staphylococci adhered in a mobile mode and slid over the surface
prior to adhering on a fixed site or desorbing. Mobile adhesion occurred tenfold
less frequently on hydrophobic DDS-coated glass than on hydrophilic glass.
These results demonstrate that substratum hydrophobicity is much more
influential on the dynamics of bacterial adhesion to biologically inactive
surfaces, i.e. adhesion in the absence of specific ligand-receptor bonding, than it
is on the number of actually adhering bacteria. Interestingly, using a similar
experimental set-up and analysis, De Kerchove at al. [21] showed that sliding
of carboxylated latex particles was virtually absent on hydrophilic quartz but
present when an alginate conditioning film was used. It was stated that the
properties of the alginate (i.e. surface roughness and local charge/chemical
heterogeneities) were likely to facilitate the irreversible adhesion.
All four staphylococcal strains behaved similarly with respect to their
dynamic adhesion to glass and DDS-coated glass, respectively. This is in line
with their cell surface properties, including cell surface energetics and
electrostatic potentials (i.e. zeta-potentials), being similar [22]. Both substratum
surfaces were also negatively charged, and the major difference between glass
and DDS-coated glass is their hydrophobicity. Hydrophobicity is determined by
the Lifshitz-Van der Waals and acid-base (AB) free energy components of a
surface [23], which are both incorporated in the extended DLVO-theory (named
after Derjaguin, Landau, Verwey and Overbeek). Previously reported values of
surface free energies, including AB-interactions, for the staphylococci used in
this study [22], are employed here to calculate the distance-dependent total free
energy of interaction. By way of example, Fig. 4 presents the distance-
dependent free energy of interaction between S. epidermidis ATCC 35983 and
hydrophilic glass and hydrophobic DDS-coated glass, respectively. The distance
dependence of the interaction is very similar for both surfaces, except for short
separation distances where acid-base interactions become influential and

Chapter 4
70
dominate. On hydrophilic glass, the total free energy of interaction at close
approach is positive due to repulsive AB-interaction. Conversely, the AB-
interaction is attractive on DDS-coated glass, resulting in a negative total free
energy of adhesion at close approach. Here we suggest, that adhesion on
hydrophilic glass is more dynamic than on hydrophobic DDS-coated glass
because of attractive AB- interactions between the staphylococci and DDS-
coated glass. It has been reported, already more than twenty years ago, that for a
collection of oral streptococci adhesion is more reversible when the total free
energy of adhesion at contact is positive, i.e. repulsive [24]. However, at that
time the contribution of AB-interactions to surface energetics was not well
defined yet. Based on the current study we now conclude that highly reversible
bacterial adhesion can be ascribed to repulsive AB-interactions.
In the curves in Fig. 4, the depths of the minima in the DLVO-interaction
free energy, occurring at around 40 nm away from the surface, are about -0.5
kT. This is in the same range as the energy of thermal motion of a bacterial cell
(in one direction). However, when the surface is chemically non-homogeneous,
the depth of these minima varies over the substratum surface. Indeed, Wit and
Busscher [25] identified scattered positively charged spots on an overall
negatively charged glass surface by noticing that negatively charged polystyrene
particles repeatedly adhered first to the same positions after removal from the
glass surface. The DDS-coated glass surfaces are unlikely to be devoid of
heterogeneities as well. These heterogeneities may include local charge
variations, similar to glass but may also be physical in nature as the thickness of
the DDS-coating might vary. Furthermore, the bacterial cell surfaces, often
consisting of polymeric substances, may exhibit chemical and physical
heterogeneities. Thus, chemical and physical variations of the surface
characteristics of the substrata and bacteria used in our study may influence the
depth of the minima in the interaction free energy considerably. Consequently, a
bacterium sliding over the surface may arrive and become captured at a site

Mobile and immobile adhesion of staphylococcal strains
71
Figure 4. Example of the distance-dependent free energy of interaction between S. epidermidis ATCC 35983 and hydrophilic glass and hydrophobic DDS-coated glass, using the extended DLVO-theory and surface characteristics as reported previously [21].

Chapter 4
72
Figure 5. Schematic presentation of bacterial sliding on a heterogeneous surface. Bacteria adhering in the interaction minimum near the surface can slide until becoming immobilized in a local, high affinity site (top panel), or until desorption from a local, low affinity site (bottom panel). The grey area represents the hydrophilic glass; arrows denote the flow-induced movement of a bacterium.

Mobile and immobile adhesion of staphylococcal strains
73
where it is more strongly attracted or arrive at a site of weaker attraction from
where it desorbs. Both events are schematically displayed in Fig. 5.
Since adhesion was found to be more mobile on hydrophilic glass than on
hydrophobic DDS-coatings, the question has to be addressed why bacteria spot
high affinity sites more readily on the hydrophobic than on the hydrophilic
surface. Extracellular polymeric substances and/or appendages at the surface of
S. epidermidis may well be able to bridge across the DLVO-free energy barrier
near the DDS-coated glass surface (Fig. 4, lower panel) [26], thereby displacing
water molecules from that surface. With the AB-interaction between the
bacterium and the hydrophobic substratum being attractive, removal of
interfacial water allows the bacteria to approach the substratum surface more
closely. In contrast to hydrophobic surfaces, water molecules are attracted to the
hydrophilic glass surface by hydrogen bonding. Hence, adsorption of bacterial
cell surface components at the expense of displacement of interfacial water is far
less favourable, i.e. AB interaction between the bacterium and the substratum is
repulsive. We suggest that removal of the interfacial water from the hydrophobic
surface makes spotting of high affinity adsorption sites more easy. Hydrophobic
surfaces are thus expected to facilitate the immobile mode of adhesion.
Conclusions
Bacterial adhesion to hydrophilic glass and hydrophobic DDS-coated glass was
found to be comparable in terms of numbers of adhering bacteria for four
different staphylococcal strains. The main difference in staphylococcal adhesion
to both substrata was in the mode of adhesion and adhesion dynamics.
Significantly more adsorption and desorption events were found on hydrophilic
glass as compared to hydrophobic DDS coated glass. This difference is
attributed to repulsive acid-base interactions between the staphylococci and the

Chapter 4
74
hydrophilic glass surface, as opposed to the hydrophobic DDS-coating exerting
attractive acid-base interactions. Sliding over the surface, prior to fixed adhesion
or desorption, providing the basis for our notion of ”mobile” versus “immobile”
adhesion, constituted another important difference between staphylococcal
adhesion to both substrata. Immobile adhesion occurred tenfold more frequently
on hydrophobic DDS-coated glass than on hydrophilic glass. Sliding was
associated with surface chemical heterogeneity, inherent to virtually all surfaces,
and the capacity of adhering bacteria to become locally fixed at high affinity
sites which is facilitated by removal of interfacial water. The latter is clearly
easier at a hydrophobic than at a hydrophilic substratum.
References
1. Costerton, J.W., Stewart, P.S. and Greenberg, E.P. (1999), Bacterial biofilms: A
common cause of persistent infections, Science 284, 1318 - 1322.
2. Von Eiff, C., Jansen, B., Kohnen, W. and Becker, K. (2005), Infections associated
with medical devices - Pathogenesis, management and prophylaxis, Drugs 65, 179 -
214.
3. Vuong, C. and Otto, M. (2002), Staphylococcus epidermidis infections, Microbes
Infect 4, 481 - 489.
4. Nicolella, C., van Loosdrecht, M.C.M. and Heijnen, J.J. (2000), Wastewater
treatment with particulate biofilm reactors, J Biotechnol 80, 1 - 33.
5. Satoh, H., Ono, H., Rulin, B., Kamo, J., Okabe, S. and Fukushi, K.I. (2004),
Macroscale and microscale analyses of nitrification and denitrification in biofilms
attached on membrane aerated biofilm reactors, Water Research 38, 1633 - 1641.
6. Elimelech, M. (1994), Particle deposition on ideal collectors from dilute flowing
suspensions - Mathematical formulation, numerical solution, and simulations, Separ
Technol 4, 186 - 212.

Mobile and immobile adhesion of staphylococcal strains
75
7. Korber, D.R., Lawrence, J.R., Zhang, L. and Caldwell, D.E. (1990), Effect of
gravity on bacterial deposition and orientation in laminar flow environments, Biofouling
2, 335 - 350.
8. Hermansson, M. (1999), The DLVO theory in microbial adhesion, Colloids Surface B
14, 105 - 119.
9. Mohamed, N., Teeters, M.A., Patti, J.M., Hook, M. and Ross, J.M. (1999),
Inhibition of Staphylococcus aureus adherence to collagen under dynamic conditions,
Infect Immun 67, 589 - 594.
10. Meinders, J.M., Van der Mei, H.C. and Busscher, H.J. (1995), Deposition efficiency
and reversibility of bacterial adhesion under flow, J Colloid Interf Sci 176, 329 - 341.
11. Vadillo-Rodriguez, V., Busscher, H.J., Norde, W., De Vries, J. and Van der Mei,
H.C. (2004), Atomic force microscopic corroboration of bond aging for adhesion of
Streptococcus thermophilus to solid substrata, J Colloid Interf Sci 278, 251 - 254.
12. Mercier-Bonin, M., Ouazzani, K., Schmitz, P. and Lorthois, S. (2004), Study of
bioadhesion on a flat plate with a yeast/glass model system, J Colloid Interf Sci 271,
342 - 350.
13. Anderson, B.N., Ding, A.M., Nilsson, L.M., Kusuma, K., Tchesnokova, V., Vogel,
V., Sokurenko, E.V. and Thomas, W.E. (2007), Weak rolling adhesion enhances
bacterial surface colonization, J. Bacteriol. 189, 1794 - 1802.
14. Vigeant, M.A.S., Ford, R.M., Wagner, M. and Tamm, L.K. (2002), Reversible and
irreversible adhesion of motile Escherichia coli cells analyzed by total internal
reflection aqueous fluorescence microscopy, Appl Environ Microb 68, 2794 - 2801.
15. Kolari, M., Schmidt, U., Kuismanen, E. and Salkinoja-Salonen, M.S. (2002), Firm
but slippery attachment of Deinococcus geothermalis, J Bacteriol 184, 2473 - 2480.
16. Hoiczyk, E. (2000), Gliding motility in cyanobacteria: Observations and possible
explanations, Arch Microbiol 174, 11 - 17.

Chapter 4
76
17. Absolom, D.R., Lamberti, F.V., Policova, Z., Zingg, W., Van Oss, C.J. and
Neumann, A.W. (1983), Surface thermodynamics of bacterial adhesion, Appl Environ
Microb 46, 90 - 97.
18. Van Pelt, A.W.J., Weerkamp, A.H., Uyen, M.H.W.J., Busscher, H.J., De Jong, H.P.
and Arends, J. (1985), adhesion of Streptococcus sanguis CH3 to polymers with
different surface free energies, Appl Environ Microb 49, 1270 - 1275.
19. Bayoudh, S., Othmane, A., Bettaieb, F., Bakhrouf, A., Ben Ouada, H. and
Ponsonnet, L. (2006), Quantification of the adhesion free energy between bacteria and
hydrophobic and hydrophilic substrata, Mat Sci Eng C-Bio S 26, 300 - 305.
20. Pringle, J.H. and Fletcher, M. (1983), Influence of substratum wettability on
attachment of freshwater bacteria to solid surfaces, Appl Environ Microb 45, 811 - 817.
21. De Kerchove, A.J., Weronski, P. and Elimelech, M. (2007), Adhesion of nonmotile
Pseudomonsa aeruginosa on "soft" polyelectrolyte layer in a radial stagnation point
flow system: Measurements and model prediction, Langmuir 23, 12301 - 12308.
22. Boks, N.P., Norde, W., Van der Mei, H.C. and Busscher, H.J. (2008), Forces
involved in bacterial adhesion to hydrophilic and hydrophobic surfaces, Microbiology
154, 3122 - 3133.
23. Van Oss, C.J. (1995), Hydrophobicity of biosurfaces - Origin, quantitative
determination and interaction energies, Colloids Surface B 5, 91 - 110.
24. Busscher, H.J., Uyen, M.H.M.J., Weerkamp, A.H., Postma, W.J. and Arends, J.
(1986), Reversibility of adhesion of oral streptococci to solids, FEMS Microbiol Lett 35,
303 - 306.
25. Wit, P.J. and Busscher, H.J. (1998), Site selectivity in the deposition and redeposition
of polystyrene particles to glass, J Colloid Interf Sci 208, 351 - 352.
26. Palmer, J., Flint, S. and Brooks, J. (2007), Bacterial cell attachment, the beginning of
a biofilm, J Ind Microbiol Biot 34, 577 - 588.

CHAPTER 5
BOND-STRENGTHENING IN STAPHYLOCOCCAL ADHESION TO
HYDROPHILIC AND HYDROPHOBIC SURFACES USING AFM
Reproduced with permission of the American Chemical Society from: Boks, N.P.,
Busscher, H.J., Van der Mei, H.C. and Norde W. (2008), Langmuir 24, 12990-12994.

Chapter 5
78
Abstract
Time-dependent bacterial adhesion forces of four strains of Staphylococcus
epidermidis to hydrophobic and hydrophilic surfaces were investigated. Initial
adhesion forces differed significantly between the two surfaces and hovered
around -0.4 nN. No unambiguous effect of substratum surface hydrophobicity
on initial adhesion forces for the four different S. epidermidis strains was
observed. Over time, strengthening of the adhesion forces was virtually absent
on hydrophobic dimethyldichlorosilane (DDS)-coated glass, although in a few
cases multiple adhesion peaks developed in the retract curves. Bond-
strengthening on hydrophilic glass occurred within 5 to 35 s to maximum
adhesion forces of -1.9 ± 0.7 nN, and was concurrent with the development of
multiple adhesion peaks upon retract. Poisson analysis of the multiple adhesion
peaks allowed to separate contributions of hydrogen bonding from other non-
specific interaction forces and revealed a force contribution of -0.8 nN for
hydrogen bonding and +0.3 nN for other non-specific interaction forces. Time-
dependent bacterial adhesion forces were comparable for all four staphylococcal
strains. It is concluded that on DDS-coated glass, the hydrophobic effect causes
instantaneous adhesion, while strengthening of the bonds on hydrophilic glass is
dominated by non-instantaneous hydrogen bond formation.

Bond strengthening in staphylococcal adhesion
79
Introduction
Bacterial adhesion to surfaces is a crucial step in biofilm formation and
associated problems, such as in biomaterials implant surgery. Staphylococcus
epidermidis is one of the most often isolated bacterial pathogens in biomaterials-
implant related infections [1,2]. One of the first steps in biofilm formation is
transport of the bacterial cells towards the surface, which may be governed by
sedimentation, convection and diffusion [3,4]. Once brought within the range of
the interaction forces, bacteria can come in close contact with a substratum
surface and adhere. Initially, adhesion is reversible but over time adhesion
becomes irreversible [5,6], although the exact mechanism of this transition
remains poorly understood.
Flow displacements systems have been extensively used to determine the
close-range affinity of bacteria for a substratum surface [7]. One of the
possibilities in such systems is to determine the hydrodynamic forces to prevent
adhesion or to detach adhering bacteria. Usually, the forces to prevent adhesion
are smaller than the forces needed to establish detachment, suggesting that the
adhesion bond strengthens over time [8-10]. As a disadvantage, however, flow
displacement systems only provide an indirect measure of the actual adhesion
force, without a clear view on time dependence of strengthening of the bond
between individual bacteria and the substratum surface. Atomic force
microscopy (AFM) is a promising technique to directly measure the interaction
forces between bacteria and substratum surfaces.
For example, Cao et al. [11] found adhesion forces upon retract between 5
and 24 nN for Escherichia coli and various hydrophilic and hydrophobic
surfaces, while Sheng et al. [12] found adhesion forces upon retract of 0.5 to 5.6
nN for Pseudomonas aeruginosa on various metal surfaces. Others showed that
Chapter 5
80
the presence of surface structures influence bacterial adhesion properties
substantially, sometimes already in the approach curve [5,6,13].
Measuring bond-strengthening with AFM requires accurate control of the
z-displacement during contact of the probe with a substratum surface.
Previously, AFM systems were not fully capable of achieving this. Nowadays,
precise feedback in z-displacement, ensures that the probe can remain at the
same distance from a surface within a force-curve bandwidth of 0.1 nm root
mean square. Bond-strengthening effects have been reported for eukaryotic cells
with mica and silica [14,15], or polymer coated model colloids interacting with
bovine serum albumin, lysozyme and dextran [16]. Furthermore, Vadillo-
Rodriguez et al. [17] probed whole bacterial cells with silicon nitride tips at two
different pH values and found bond-strengthening to occur within 60 s,
independent of pH.
However, no study has been undertaken hitherto to demonstrate a
potential role of substratum hydrophobicity on bond-strengthening between
bacteria and substratum surfaces. Therefore, the aim of this chapter is to
compare bond-strengthening of four S. epidermidis strains on a hydrophobic
(dimethyldichlorosilane-coated glass) and a hydrophilic (glass) substratum.
Materials and Methods
Staphylococcal strains and culture conditions. S. epidermidis strains ATCC
35983, 3399, HBH2 3 and HBH2 169 were cultured aerobically from blood agar
plates in 10 ml Tryptone Soy Broth (OXOID, Basingstoke, England) for 24 h at
37ºC (Note that the latter three strains are clinical isolates). After 24 h,
precultures were used to inoculate 200 ml main cultures, which were grown for
16 h under similar conditions as the precultures. Bacteria were harvested by
centrifugation for 5 min at 5000 x g, washed twice with 10 mM potassium

Bond strengthening in staphylococcal adhesion
81
phosphate buffer at pH 7 and resuspended in the same buffer. To break bacterial
aggregates, 3 times 10 s sonication at 30 W (Vibra Cell model 375, Sonics and
Materials Inc., Danbury, CT, USA) was carried out while cooling the suspension
in a water/ice bath.
Substratum surfaces. Glass slides were sonicated during 3 min in 2% RBS35
(Omnilabo International BV, The Netherlands) followed by thorough rinsing
with tap water, demineralised water, methanol, tap water and finally
demineralized water again to obtain a hydrophilic surface (water contact angle
28 ± 8 degrees). After washing, the slides were either directly used or dried for 4
h at 80ºC prior to applying of a hydrophobic coating.
To obtain a hydrophobic surface (water contact angle 101 ± 2 degrees),
the dried glass slides were submerged during 15 min in a solution of
dimethyldichlorosilane (DDS, Merck, Germany) in trichloroethylene (0.05
w/v%) and washed with trichloroethylene, methanol and ultrapure water.
Prepared slides were stored for no longer than 3 days at room temperature and
rinsed with 10 mM potassium phosphate buffer before use.
Bacterial probe preparation. Staphylococci were immobilized to tipless “V”-
shaped cantilevers (VEECO, DNP-0) by means of electrostatic attraction with
positively charged poly-L-lysine. To this end, cantilevers were mounted in a
micromanipulator under microscopic observation to allow only the tip of the
cantilever to be coated. A droplet of poly-L-lysine solution was placed on a
glass slide and the tip of the cantilever was dipped in the droplet for 1 min. After
air drying the cantilever for 2 min, it was dipped in bacterial suspension for 1
min. Bacterial probes were freshly prepared for each experiment and checked
regularly during an experiment for staphylococcal presence.

Chapter 5
82
Atomic Force Microscopy. AFM experiments were carried out at room
temperature in 10 mM potassium phosphate buffer (pH 7) using an optical lever
microscope (Nanoscope IV Digital instruments). For each probe, force curves
were measured for different surface delay times on the same, randomly chosen,
spot on a hydrophobic or hydrophilic substratum surface. Interaction forces were
measured after 0, 10, 30, 45, 60, 90 and 120 s of contact time (Δt) between the
bacterial probe and the substratum surface with z-scan rates of less than 1 Hz.
To ensure that no staphylococci detached from the cantilever during the
experiment, 5 control force-distance curves were made with 0 s contact time
after each measurement with a certain surface delay, as schematically outlined in
Figure 1. Whenever the “0 s contact time” forces measured were out of range, a
bacterial probe was replaced. For each combination of a bacterial strain and
substratum surface, six probes were employed on average and the number of
staphylococcal probes used depended on the outcome of the control
measurements. Calibration of bacterial probes was done using the thermal
tuning method (Nanoscope V6.13r1), yielding spring constants of 0.044 ± 0.008
Nm-1 .
Subsequently, for each staphylococcal probe the maximum adhesion
forces were plotted as a function of the surface delay time and fitted to:
( ) ⎟⎠
⎞⎜⎝
⎛⎭⎬⎫
⎩⎨⎧ Δ−−−+=Δ ∞ τ
tFFFtF ss exp1)( 00 (1)
with F0s the maximum adhesion force at 0 s contact time, F∞ the maximum
adhesion force after bond-strengthening and τ the characteristic time needed for
the adhesion force to strengthen.

Bond strengthening in staphylococcal adhesion
83
Prepare a new probe
5curves at Δt = 0 s
5 curves at Δt = 10 s
5 control curves at Δt = 0 s
5 curves at Δt = i s
Are control curves and curves at Δt = 0 s similar?
Yes No
Figure 1. Schematics of the experimental time line, including go/no points after control measurements with a staphylococcal probe to determine the need to prepare a new bacterial probe. In the absence of the need for new probe preparation, the same probe was used for a new contact time i (30, 45, 60, 90 and 120 s).
Statistical Analysis. Data was analyzed with the Statistical Package for the
Social Sciences (version 14.0, SPSS, Chicago Illinois, USA). A Wilcoxon
signed rank test was used to analyze adhesion forces measured within a probe.
Differences between the above bond-strengthening parameters on the two
substratum surfaces were analyzed using the Mann-Whitney U test; this test was
also used to analyze the total ageing of the adhesion force. The level of
significance was set at p < 0.05.
Results
As an example, Figure 2 presents force-distance curves obtained for S.
epidermidis ATCC 35983 on hydrophobic DDS-coated and on hydrophilic
glass. A downward peak in the retract curves indicates attractive forces between
the bacterium and surface and the maximum adhesion force corresponds to the

Chapter 5
84
largest peak. From Figure 2A it is clear that there is hardly any strengthening of
the maximum adhesion force on hydrophobic DDS-coated glass, although upon
longer contact times (i.e. 120 s) a few multiple adhesion peaks may be observed.
On hydrophilic glass (Figure 2B), the maximum adhesion force increases
strongly with increasing surface delay time and multiple adhesion peaks, that
may already be observed at 0 s contact time, strongly develop during prolonged
contact between bacterial cell and substratum surface. Note that the long-range
detachment events at several hundred nanometers in the retract curves represent
stretching of staphylococcal cell surface structures.
Figures 3 and 4 show the maximum adhesion forces as a function of
contact time for the four staphylococcal strains involved in this study for both
DDS-coated glass (Figure 3) and bare glass (Figure 4). In both figures grey
regions represent the force window of the control curves at 0 s contact time. All
control curves had similar appearances and within each set of measurements no
significant changes in their adhesion force was observed. On a hydrophobic
substratum (Figure 3), adhesion forces hardly increase upon increasing the
contact time between the staphylococcal probe and the substratum surface. On
hydrophilic glass, however, adhesion forces increase significantly with longer
contact times (Figure 4). Adhesion forces already significantly strengthen within
10 s of contact for all strains and reach stable values within approximately 60 s.
Table 1 summarizes the bond-strengthening parameters, as can be determined by
using Eq. (1) for all four S. epidermidis strains investigated. There is no
unambiguous influence of the substratum on the initial maximal adhesion forces
(F0s) as can be seen from Table 1. However, in line with the qualitative features
of Figures 3 and 4, the increases in maximum adhesion force on hydrophobic
DDS-coated glass are limited to 0.3 nN and only significant for strains 3399 and
HBH2 3. Conversely, on the hydrophilic glass the maximum adhesion forces
increase significantly for all strains with increments ranging between 0.7 nN and

Bond strengthening in staphylococcal adhesion
85
Figure 2. Examples of force-distance curves for S. epidermidis ATCC 35983 on hydrophobic DDS-coated glass (A) and hydrophilic glass (B) with retract curves after 0, 10, 60 and 120 s. Maximum adhesion forces (Fmax) are defined as the force associated with the largest adhesion peak.

Chapter 5
86
1.5 nN. The characteristic time τ needed for the adhesion force to strengthen is
maximally 32 s (see Table 1). Table 1. Bond-strengthening parameters for four S. epidermidis strains on DDS-coated glass (hydrophobic) and glass (hydrophilic). Values represent the averages and standard deviations of 6 staphylococcal probes, each used to measure 5 force distance curves.
DDS-coated glass Glass
Strain F0s (nN) F∞ (nN) τ (s) F0s (nN) F∞ (nN) τ (s)
3399 -0.4 ± 0.3 -0.6 ± 0.4 17 ± 21 -0.2 ± 0.2 -0.9 ± 0.2 17 ± 13
ATCC 35983 -0.4 ± 0.3 -0.6 ± 0.5 16 ± 14 -0.5 ± 0.2 -1.9 ± 0.7 17 ± 15
HBH2 3 -0.3 ± 0.1 -0.6 ± 0.3 8 ± 6 -0.3 ± 0.1 -1.8 ± 0.9 32 ± 27
HBH2 169 -0.1 ± 0.1 -0.1 ± 0.1 -* -0.6 ± 0.3 -1.8 ± 0.4 3 ± 1
* No bond-strengthening found
Discussion
In this chapter, we investigated the time-dependent adhesion forces between
four S. epidermidis strains and hydrophilic and hydrophobic substratum
surfaces. Hydrophobicity was created by DDS-coating of glass surfaces, and
thus had little effect on the roughness of the substratum surface. Both glass as
well as DDS-coated glass are negatively charged with comparable zeta
potentials [18]. Therefore, hydrophobicity is considered to be the main
difference between the two surfaces. Strengthening of the bond was virtually
absent on hydrophobic DDS-coated glass, but on hydrophilic glass strengthening
of the bond by factors up to 6 occurred within a few tens of seconds, concurrent
with the consistent development of multiple adhesion peaks in the retract force-
distance curves. All four staphylococcal strains roughly exhibited a similar
behaviour with respect to bond-strengthening. In order to rule out artefacts due

Bond strengthening in staphylococcal adhesion
87
to bacterial detachment from the probe and/or due to bacterial footprints on the
substratum surface [19], force-distance curves with 0 s contact time were
recorded after each measurement with a given surface delay time. Control
experiments indicated that staphylococci did not detach from the probe and that
there were no bacterial footprints left on the substratum surface after
measurement of a force-distance curve, with a measurable influence on the 0 s
force-distance curves.
Figure 3. Adhesion forces of four S. epidermidis strains on DDS-coated glass as a function of the surface delay time. Grey regions denote the force window of the control curves at 0 s contact time, based on the average and standard deviation of 180 measurements. Each point represents the average and standard deviation of 30 measurements divided over 6 bacterial probes.
Bond-strengthening was significantly different on hydrophobic DDS-coated
glass than on hydrophilic glass. The hydrophobicity of DDS-coated glass is

Chapter 5
88
caused by the presence of apolar CH3-groups. Water molecules adjacent to the
substratum surface are not able to form hydrogen bonds with the apolar surface,
and therefore they will do so as much as possible with other water molecules at
the solution side of the surface [20]. This phenomenon is known as the hydro
phobic effect. As a result the water molecules near the surface are restricted in
their rotational freedom. Consequently, bacterial adhesion to a DDS-coated
substratum is driven by an entropically favourable release of DDS-associated
Figure 4. Adhesion forces of four S. epidermidis strains on glass as a function of the surface delay time. Grey regions denote the force window of the control curves at 0 second contact time, based on the average and standard deviation of 180 measurements. Each point represents the average and standard deviation of 30 measurements divided over 6 bacterial probes.
water molecules, giving relatively weak adhesion forces between bacteria and
substratum surface. This release of water molecules from the surface region is a

Bond strengthening in staphylococcal adhesion
89
fast process, and from the current data can be expected to be completed within
the first 10 s of contact.
Alternatively, hydrophilic glass offers numerous sites for hydrogen
bonding and the hydrophobic effect is not likely to play any significant role in
bond-strengthening between staphylococci and glass. Similar to the glass
surface, also the staphylococcal strains involved are negatively charged,
hydrophilic and able to form hydrogen bonds [21]. Upon approach of the
bacteria towards the hydrophilic surface, the outer cell surface first forms
hydrogen bonds with the substratum, therewith expelling surface-associated
water molecules. This implies a gain in entropy and a relatively fast rise in
adhesion force. However, upon prolonged contact times, more extensive
rearrangements of bacterial surface structures may occur to create additional
bonds and cause the adhesion force to strengthen further. This is reflected in
Figure 2, by the development of multiple adhesion peaks upon prolonged
contact times. Interestingly, Abu-Lail and Camesano [22] recently performed a
Poisson analysis of these multiple adhesion peaks in the interaction of E. coli
with silicon nitride AFM tips and associated these peaks with multiple hydrogen
bonds with an individual force value of -0.13 nN.
In the Poisson analysis of multiple adhesion forces, it is assumed that the
average force of all adhesion peaks (μF) is related to the variance (σF2) of the
adhesion force according to:
specificNonbondHbondHFF FFF −−− −= μσ 2 (2)
in which FH-bond and FNon-specific represent the contributions of hydrogen bonding
and other non-specific interaction forces (i.e. contributions of Lifshitz-Van der
Waals-, electrostatic- and steric interactions) to the adhesion force, respectively.
Thus, in a plot of σF2 versus μF , the slope of a linear fit will yield FH-bond, while
FNon-specific can be calculated from the intercept.

Chapter 5
90
Figure 5. Example of a Poisson analysis of the multiple adhesion peaks appearing after 120 s contact between S. epidermidis ATCC 35983 and hydrophilic glass. The linear dependency of the average adhesion force of all peaks (μF) versus the variance (σF
2) of the adhesion force is denoted by the solid line (r2 = 0.86). The slope of the regression yields FH-bond, while from the intercept FNon-specific is calculated.
Poisson analysis of our retract curves of staphylococci from glass obtained after
120 s contact time were completely in line with the observations by Abu-Lail
and Camesano [22] as can be seen in Figure 5 for a selected example. From the
straight line dependencies as in Figure 5, contributions of H-bonding and non-
specific interaction forces to the total adhesion forces between staphylococci and
glass after bond-strengthening could be calculated, as summarized in Table 2.

Bond strengthening in staphylococcal adhesion
91
Table 2. Poisson analysis on the multiple adhesion peaks as observed for four S. epidermidis strains on glass after a contact time of 120 s. Adhesion forces were separated in a hydrogen bonding component (FH-bond) and a component for non-specific interactions (FNon-specific).
Strain
FH-bond (nN)
FNon-specific (nN)
Net Force (nN)
(FH-bond + FNon-specific)
3399 -0.24 +0.07 -0.17
ATCC 35983 -0.79 +0.33 -0.46
HBH2 3 -1.02 +0.58 -0.45
HBH2 169 -0.75 +0.41 -0.34
All FNon-specific values are positive, indicating that non-specific interactions have a
net repulsive contribution due to the forced nature of the contact in AFM.
Whereas under non-forced conditions, it is difficult to establish contact closer
than in the secondary minimum of the DLVO interaction curve [23]. It is clear
from the current results that in AFM close contact beyond the secondary
minimum is imposed, causing the non-specific forces, attractive at long range, to
become repulsive at short range. FH-bond is negative for all four staphylococcal
strains involved and amounts to -0.70 nN on average. Abu-Lail et al. [22]
measured a force contribution FH-bond of -0.13 nN, but their measurements
involved a smaller contact area, i.e. a native AFM tip versus a bacterial cell
surface, whereas we used a bacterial probe versus a macroscopic glass surface.
Note that the net interaction force (i.e. FH-bond + FNon-specific) is attractive in all
cases, but less than the maximum adhesion forces after bond-strengthening
measured, because the Poisson analysis is based on average forces and not on
the maximum forces observed.

Chapter 5
92
Conclusions
Staphylococcal bond-strengthening between hydrophobic DDS-coated and
hydrophilic glass proceeds according to different mechanisms, as revealed here
by using atomic force microscopy. On hydrophobic DDS-coated glass bond-
strengthening was fast (less than 10 s), limited to a minor increase in adhesion
force and likely governed by hydrophobic interaction. On hydrophilic glass,
bond strength increased during contact time and is ascribed to progressive
formation of hydrogen bonds made possible by ongoing rearrangements of outer
cell surface structures over a time scale of, typically, a few tens of seconds. As a
consequence, adhesion forces strengthened considerably more on hydrophilic
glass than on hydrophobic DDS-coated glass, as confirmed by Poisson analysis
of the multiple adhesion peaks upon retract of the staphylococci from
hydrophilic glass surfaces.
References 1. Presterl, E., Lassnigg, A., Parschalk, B., Yassin, F., Adametz, H. and Graninger, I.
(2005), Clinical behavior of implant infections due to staphylococcus epidermidis, Int J
Artif Org 28, 1110 - 1118.
2. Vuong, C. and Otto, M. (2002), Staphylococcus epidermidis infections, Microbes
Infect 4, 481 - 489.
3. Elimelech, M. (1994), Particle deposition on ideal collectors from dilute flowing
suspensions - Mathematical formulation, numerical solution, and simulations, Separ
Technol 4, 186 - 212.
4. Korber, D.R., Lawrence, J.R., Zhang, L. and Caldwell, D.E. (1990), Effect of
gravity on bacterial deposition and orientation in laminar flow environments, Biofouling
2, 335 - 350.

Bond strengthening in staphylococcal adhesion
93
5. Bell, C.H., Arora, B.S. and Camesano, T.A. (2005), Adhesion of Pseudomonas putida
KT2442 is mediated by surface polymers at the nano- and microscale, Environ Eng Sci
22, 629 - 641.
6. Salerno, M.B., Li, X. and Logan, B.E. (2007), Adhesion characteristics of two
Burkholderia cepacia strains examined using colloid probe microscopy and gradient
force analysis, Colloid Surface B 59, 46 - 51.
7. Busscher, H.J. and Van der Mei, H.C. (2006), Microbial adhesion in flow
displacement systems, Clin Microbiol Rev 19, 127 - 141.
8. Duddridge, J.E., Kent, C.A. and Laws, J.F. (1982), Effect of surface shear stress on
the attachment of Pseudomonas fluorescens to stainless steel under defined flow
conditions, Biotechnol Bioeng 24, 153 - 164.
9. Mohamed, N., Teeters, M.A., Patti, J.M., Hook, M. and Ross, J.M. (1999),
Inhibition of Staphylococcus aureus adherence to collagen under dynamic conditions,
Infect Immun 67, 589 - 594.
10. Mercier-Bonin, M., Ouazzani, K., Schmitz, P. and Lorthois, S. (2004), Study of
bioadhesion on a flat plate with a yeast/glass model system, J Colloid Interf Sci 271,
342 - 350.
11. Cao, T., Tang, H.Y., Liang, X.M., Wang, A.F., Auner, G.W., Salley, S.O. and Ng,
K.Y.S. (2006), Nanoscale investigation on adhesion of E. coli surface modified silicone
using atomic force microscopy, Biotechnol Bioeng 94, 167 - 176.
12. Sheng, X.X., Ting, Y.P. and Pehkonen, S.O. (2007), Force measurements of bacterial
adhesion on metals using a cell probe atomic force microscope, J Colloid Interf Sci 310,
661 - 669.
13. Ong, Y.L., Razatos, A., Georgiou, G. and Sharma, M.M. (1999), Adhesion forces
between E. coli bacteria and biomaterial surfaces, Langmuir 15, 2719 - 2725.
14. Bowen, W.R., Lovitt, R.W. and Wright, C.J. (2001), Atomic force microscopy study
of the adhesion of Saccharomyces cerevisiae, J Colloid Interf Sci 237, 54 - 61.
Chapter 5
94
15. McNamee, C.E., Pyo, N., Tanaka, S., Vakarelski, I.U., Kanda, Y. and Higashitani,
K. (2006), Parameters affecting the adhesion strength between a living cell and a colloid
probe when measured by the atomic force microscope, Colloid Surface B 48, 176 - 182.
16. Xu, L.C., Vadillo-Rodriguez, V. and Logan, B.E. (2005), Residence time, loading
force, pH, and ionic strength affect adhesion forces between colloids and biopolymer-
coated surfaces, Langmuir 21, 7491 - 7500.
17. Vadillo-Rodriguez, V., Busscher, H.J., Norde, W., De Vries, J. and Van der Mei,
H.C. (2004), Atomic force microscopic corroboration of bond aging for adhesion of
Streptococcus thermophilus to solid substrata, J Colloid Interf Sci 278, 251 - 254.
18. Gomez-Suarez, C., Pasma, J., Van der Borden, A.J., Wingender, J., Flemming,
H.C., Busscher, H.J. and Van der Mei, H.C. (2002), Influence of extracellular
polymeric substances on deposition and redeposition of Pseudomonas aeruginosa to
surfaces, Microbiol-Sgm 148, 1161 - 1169.
19. Paul, J.H. and Jeffrey, W.H. (1985), Evidence for separate adhesion mechanisms for
hydrophilic and hydrophobic surfaces in Vibrio proteolytica, Appl Environ Microb 50,
431 - 437.
20. Norde, W. (2003), Water. In: Colloids and interfaces in life sciences. Norde, W. (Eds.),
New York:Marcel Dekker Inc. pp 47 - 61.
21. Kiers, P.J.M., Bos, R., Van der Mei, H.C. and Busscher, H.J. (2001), The
electrophoretic softness of the surface of Staphylococcus epidermidis cells grown in a
liquid medium and on a solid agar, Microbiology 147, 757 - 762.
22. Abu-Lail, N.I. and Camesano, T.A. (2006), Specific and nonspecific interaction forces
between Escherichia coli and silicon nitride, determined by poisson statistical analysis,
Langmuir 22, 7296 - 7301.
23. Hermansson, M. (1999), The DLVO theory in microbial adhesion, Colloid Surface B
14, 105 - 119.

CHAPTER 6
FIBRONECTIN INTERACTIONS WITH STAPHYLOCOCCUS
AUREUS WITH AND WITHOUT FIBRONECTIN-BINDING
PROTEINS AND THEIR ROLE IN ADHESION AND DESORPTION
Xu, C.-P., Boks, N.P., De Vries, J., Kaper, H.J., Norde, W., Busscher, H.J. and Van der
Mei, H.C. (2008), Applied and Environmental Microbiology (in press).

Chapter 6
96
Abstract
Adhesion and residence-time dependent desorption of two Staphylococcus
aureus strains with and without fibronectin binding proteins (FnBPs) on Fn-
coated glass were compared in a parallel plate flow chamber. To gain a better
understanding of the role of Fn-FnBP binding, adsorption enthalpies of Fn to
staphylococcal cell surfaces were determined using isothermal titration
calorimetry (ITC). Interaction forces between staphylococci and Fn-coatings
were measured using atomic force microscopy (AFM). The strain with FnBPs
adhered faster and initially stronger to a Fn-coating than the strain without
FnBPs and its Fn-adsorption enthalpies were higher. Initial desorption was high
for both strains, but decreased strongly within 2 s. These time scales of
staphylococcal bond ageing were confirmed by AFM adhesion force
measurements. After exposure of either Fn-coating or staphylococcal cell
surfaces to bovine serum albumin (BSA), adhesion of both strains to Fn-coatings
was reduced, suggesting that BSA not only suppresses non-specific, but also
specific Fn-FnBPs interactions. Adhesion forces and adsorption enthalpies were
only slightly affected by BSA adsorption. This implies that under the mild
contact conditions of convective-diffusion in the flow chamber, adsorbed BSA
prevents specific interactions, but does allow forced Fn-FnBPs binding during
AFM or stirring in ITC. Bond strength energies calculated from retract force-
distance curves in AFM were orders of magnitude larger than from desorption
data, confirming that the penetrating Fn-coated AFM tip probes multiple
adhesins in the outermost cell surface that remain hidden during mild landing of
an organism on a Fn-coated substratum as during convective-diffusional flow.

Fibronectin interactions
97
Introduction
Staphylococcus aureus is an extremely versatile pathogen, which can adhere to
epithelial cells, endothelial cells, fibroblasts as well as to plasma exposed
biomaterials implant surfaces in the human body [1], causing potentially
persistent infections. The best described mechanism of S. aureus adhesion to
eukaryotic cells and other fibronectin-coated surfaces involves the fibronectin
(Fn) binding proteins FnBP A and FnBP B on the surface of S. aureus [2,3].
Peacock et al. [4] demonstrated the significant role played by the FnBPs by
comparing adhesion of different isogenic S. aureus strains to human endothelial
cells. Moreover, in vitro adhesion of S. aureus strain Wood 46 to Fn-coated
surfaces was demonstrated to be inhibited in a dose-dependent manner by anti-
Fn antibodies [5,6].
At constant temperature and pressure, which is usually the case in
biological systems, all physico-chemical interactions, including adsorption, (co-)
adhesion and (co-)aggregation, are determined by changes in the Gibbs energy
(G) of a system. These interactions can either be evaluated at a macroscopic
level, in terms of Lifshitz-Van der Waals, electrostatic and hydrophobic forces
originating from overall characteristics of bacteria and substrata, or at a more
microscopic or even nanoscopic level, where highly specific interactions
between stereo-chemical surface components, such as fibronectin and FnBPs are
considered. For a spontaneous process, the change in Gibbs energy (ΔG) is
negative. ΔG is composed of a change in enthalpy (ΔH) and in entropy (ΔS),
according to
ΔG = ΔH – T ΔS (1)
where T is the temperature in Kelvin. The enthalpy tends to reach a minimum
value, whereas the entropy strives for a maximum. The enthalpy of a system is

Chapter 6
98
directly related to its heat content. At constant pressure, and if no work other
than that related to volume change is involved, the enthalpy change can be
determined as the heat exchange between a system and its environment. Direct
determination of the entropy, however, is practically impossible as it would
require counting all conformational and configurational possibilities before and
after a process. Many biological processes are characterized by strong enthalpy-
entropy compensation [7], that is, they occur spontaneously by virtue of an
entropy increase that compensates for an unfavourable enthalpy effect, or vice
versa. The enthalpy of interaction between bacterial cell surfaces and proteins
can be assessed using isothermal titration calorimetry (ITC). ITC measures the
enthalpy change of formation of a complex at constant temperature. Xu et al. [8]
determined the adsorption enthalpies of salivary proteins to Streptococcus
mutans and found that S. mutans LT11 with antigen I/II, a cell surface binding
protein involved in bacterial adhesion to extracellular matrix proteins, yielded a
much higher, exothermic adsorption enthalpy when mixed with saliva at pH 6.8
than did S. mutans IB03987, lacking surface antigen I/II. It was thus inferred
that antigen I/II at the surface of S. mutans LT11 specifically binds different
proteins with different affinities from the large pool of proteins present in whole
saliva. Furthermore, Busscher et al. [9] used ITC to evaluate the adsorption of a
single protein, laminin, to these streptococcal cell surfaces and found that
enthalpy is released upon adsorption of laminin to the surface of the parent
strain LT11, but not upon adsorption to IB03987. Whereas ITC operates at a
macroscopic level, atomic force microscopy (AFM) senses at the nanometer
level and allows to determine the force between a sharp probe attached to a
flexible cantilever and a cell surface and can thus distinguish between different
functional surface proteins [10]. Using AFM, differences in interaction forces
between protein-coated AFM probes and streptococcal strains with and without
antigen I/II have been measured. Generally, upon retraction of streptococci from
Fibronectin interactions
99
saliva- or laminin-coated probes, stronger forces were observed when the
streptococcal strain possessed antigen I/II than when it did not.
Initial microbial adhesion is reversible, but over time the bond strength
may increase and adhesion becomes less reversible. The kinetics of microbial
adhesion and desorption can be investigated simultaneously in a parallel plate
flow chamber with in situ observation and real-time image analysis. Moreover,
by registering the time of arrival and detachment of an adhering microorganism,
desorption can be measured as a function of the residence time of an adhering
organism [11-13]. Dabros and Van de Ven [11] proposed that the desorption rate
coefficient of a particle adsorbed at time τ and desorbing at time t, i.e. after
residing on the surface for a time (t−τ), changes exponentially from an initial
value β0 to a final value β∞ during ageing of the bond with a relaxation time 1/δ
according to:
β(t−τ) = β∞−(β∞−β0)e−δ(t−τ) (2)
Meinders et al. [14] applied this equation to analyze the residence time-
dependent desorption of Streptococcus thermophilus B during non-specific
adhesion on glass, and found that the desorption rate coefficient decreased
according to Eq. (2) from an initially high value β0 (2.5 × 10⁻³ s-1) to an almost
negligibly low value β∞ (0.01 × 10⁻³ s-1) over a time scale of approximately 50 s.
Many years later, atomic force microscopy (AFM) was applied to directly
measure the strengthening of the adhesion force between S. thermophilus B and
a silicon nitride (Si3Ni4) AFM tip and bond strengthening by a factor of 2 to 3
was found to occur over a similar time scale as the residence-time dependent
desorption [15]. However, S. thermophilus B adheres to glass utilizing non-
specific adhesion mechanisms, which are very different from the specific
mechanisms applied by S. aureus strains in their adhesion to Fn-films.
Therefore, the aim of this study is to analyze the role of FnBPs on S.
aureus cell surfaces in their interaction with (adsorbed) Fn using ITC and AFM,

Chapter 6
100
in particular in relation to adhesion and residence-time dependent desorption on
Fn-coated surfaces under flow. To this end, we first determined adhesion and
desorption of a S. aureus wild type strain 8325-4 and of an isogenic mutant
DU5883 lacking FnBPs, deposited by convective-diffusion on Fn-coated glass
slides in a parallel plate flow chamber. Subsequently, interaction forces between
Fn-coated AFM tips and the cell surfaces were compared, while furthermore the
enthalpies of adsorption of Fn to the surfaces of the S. aureus strains were
measured. In order to determine to what extent Fn-binding to S. aureus cell
surfaces is dominated by specific interactions, additional experiments were
performed after coating either the substrata or the staphylococcal cells with a
layer of bovine serum albumin (BSA).
Materials and Methods
Bacterial strains and culture conditions. S. aureus strain 8325-4 and its
isogenic mutant lacking FnBPs, DU5883 (kindly provided by Dr. T.J. Foster,
Moyne Institute of Preventive Medicine, Dublin, Ireland), were used in this
study. The bacterial cells were maintained at -80oC in tryptone soya broth (TSB;
OXOID, Basingstoke, UK) containing 7% dimethylsulfoxide (DMSO; MERCK,
Germany). For culturing, both strains were plated onto TSB agar plates
overnight at 37oC. Subsequently, bacterial colonies were precultured in 10 ml
TSB batch culture overnight under constant rotation. This preculture was used to
inoculate a main culture of 190 ml TSB. After approximately 2 h of growth to
early stationary phase, corresponding with peak expression of FnBPs in S.
aureus 8325-4 [16], bacteria were harvested by centrifugation at 6500g for 5
min at 10oC and washed twice with demineralised water. Bacterial chains and
aggregates were broken by mild sonication on ice for 3 × 10 s at 30 W (Vibra
Cell model 375, Sonics and Materials Inc., Danbury, Connecticut, USA). Then

Fibronectin interactions
101
bacteria were resuspended in phosphate-buffered saline (PBS; 10 mM potassium
phosphate and 0.15 M NaCl, pH 7), to a concentration of 3 × 10⁸ or 5 × 10⁹ per
ml for adhesion experiments or ITC, respectively, as determined in a Bürker-
Türk counting chamber. In order to block FnBPs on the staphylococcal cell
surfaces, staphylococci were also incubated for 60 min at 37oC in PBS
supplemented with 1% BSA.
Bacterial deposition to a Fn-film in a parallel plate flow chamber. The
deposition experiments were carried out in a parallel plate flow chamber
(internal dimensions: length × width × height, 175 × 17 × 0.75 mm) equipped
with image analysis options [17]. The bottom glass plate (76 × 26 mm) of the
flow chamber was first cleaned by sonication for 3 min in a surfactant solution
(2 % RBS 35 detergent in water; Omniclean), rinsed thoroughly with tap water,
and then washed with methanol, thoroughly rinsed with tap water and finally
with demineralised water. Subsequently, the centre of the glass plate was drop-
coated with 0.05 ml Fn (25 µg ml-1 human Fn, Sigma-Aldrich BV, Zwijndrecht,
The Netherlands) for 2 h at room temperature to create a circular Fn-coated
region with a diameter of approximately 1 cm on which staphylococcal adhesion
was monitored. In addition, glass plates were prepared on which non-specific
adhesion sites were blocked by immersing the entire glass plate, including the
Fn-coated region for 1 min in PBS containing 1% BSA. Glass plates were rinsed
after protein coating with demineralised water. Bacterial adhesion was
monitored with a phase-contrast microscope (Olympus BH-2) equipped with a
×40 ultra-long-working-distance lens (Olympus ULWD-CD plan 40 PL) and
coupled to a Firewire CCD camera (Basler AG, Germany).
The flow rate during the experiments was adjusted to 1.4 ml min-1 under
the influence of a hydrostatic pressure yielding a shear rate of 15 s-1. During
flow experiments, 15 images (1392 × 1040 pixels) were grabbed every second.
These 15 frames were averaged on a pixel by pixel basis in order to distinguish

Chapter 6
102
between adhered and in focus moving bacteria. The averaged frame was
computer-stored for subsequent offline analysis using proprietary software based
on the Matlab Image Processing Toolkit (The Mathworks, MA, USA). Further
analysis consisted of locating the staphylococci on the substratum surface and
comparison of their positions in a current image with their positions in previous
images to determine the total number of adhering bacteria n(t) as a function of
time during 4 h as well as their residence times. The affinity of an organism for
the Fn-coated glass surface was expressed as the initial deposition rate j0,
representing the initial increase of n(t) with time. Note that since the initial
deposition rate is derived only from the first adhering bacteria, it represents the
affinity of the organisms for the adsorbed Fn-coatings without intervening
influences of interactions between adhering bacteria, as occurs due to crowding
at the surface, such as after 4 h [17]. Finally, the staphylococcal desorption rate
coefficient β(t−τ) as a function of residence-time (t−τ) was calculated according
to [14]:
∑∑+= −−
−
= −ΔΔ
−−=−
N
ji iijiads
idesN
j ttntn
jNt
1 1
1
1 ))(()(
11)(
ττβ (3)
where the summation runs over the number of images taken, Δndes(ti) is the
number of bacterial desorbing between time ti-1 and ti and adsorbing between
time τi-j-1 and τi-j, and Δnads(ti-j) is the total number of adsorbed bacteria between
time τi-j-1 and τi-j. The residence–time dependent desorption rates calculated were
fitted to Eq. (2) to yield the initial and final desorption rate coefficients (β0 and
β∞, respectively) and their relaxation time 1/δ.
All adhesion and desorption experiments in the parallel plate flow
chamber were done in four-fold with separate bacterial cultures.
Atomic force microscopy. For AFM, the negatively charged bacteria were
attached through electrostatic interactions to a glass slide, made positively

Fibronectin interactions
103
charged through pre-adsorption of poly-L-lysine, as described before [18]. AFM
tips (DNP from Veeco, Woodbury, USA) were coated with a Fn-film by
immersion for 30 min in a Fn-solution (25 µg ml-1 in PBS, pH 7) with the aid of
a micromanipulator. All glass slides with immobilized bacteria and Fn-coated
AFM tips were immediately used after preparation. To block non-specific
binding sites on the bacterial cell surfaces, the glass slides with attached bacteria
were also immersed for 1 min in PBS containing 1% BSA and rinsed with
demineralised water.
AFM measurements were done at room temperature in PBS using a
Dimension 3100 system (Nanoscope IV Digital Instrument, Woodbury, USA).
Nanoscope imaging software (version 6.13r1, Veeco) was used to analyze the
resulting images. All AFM cantilevers were calibrated using resonant frequency
measurements [19] and the slopes of the retract force curves, in the region where
probe and sample are in contact, were used to translate the voltage into
cantilever deflection. Force-distance curves were generated and approach curves
analyzed for the repulsive force at contact. Retraction of the tip from the
bacterial surface was carried out after 0 and 2 s contact time between the AFM
tip and staphylococcal cell surface to demonstrate strengthening of the adhesion
force. Retract curves were integrated to yield the bond strength energy for the
two surface delay times evaluated.
Three different bacterial cells were examined at ten locations for each
particular case, yielding 30 force-distance curves. This resulted in a non-
parametric distribution, from which median, mode and range values were
derived.
Isothermal titration calorimetry. The adsorption enthalpy of Fn to the
bacterial cell surfaces was measured in a twin-type, isothermal microcalorimeter
TAM 2277 (Thermometric, Sweden). The calorimeter was positioned in a

Chapter 6
104
temperature-controlled environment (20 ± 0.1oC), allowing a baseline stability
of ± 0.1 µW over 24 h [20]. The instrument had an electrical calibration with a
precision better than 1% and proper calibration was regularly checked by
measuring the dilution enthalpy of concentrated sucrose solutions [21].
Experiments were performed isothermally at 25oC in stainless steel ampoules of
4 ml. Four ampoules, connected with separate titration systems, were used inside
the microcalorimeter. The use of a twin-type microcalorimeter allows the
measurement of the heat (Q) flowing from the reaction ampoule as compared
with a reference ampoule. The output signal was collected as power, P, versus
time, t, and was integrated to evaluate the isobaric heat exchange (the enthalpy
change) during adsorption, using the dedicated Digitam 4.1 software
(Thermometric, Sweden). Notably, the measured heat effect should be corrected
for the heat of dilution of the proteins to obtain the net adsorption enthalpy [22].
Typically, all four reaction ampoules including the reference ampoule,
were filled with 1.5 ml of bacterial suspension (5 ×10⁹ cells per ml) in PBS
under constant stirring (90 rpm) with a specially designed two-blades stirrer.
The ampoules were lowered gradually into the microcalorimeter and left in the
measuring position to reach thermal equilibrium before data collection started.
After equilibration, a stable baseline was obtained and Fn was titrated into the
reaction ampoules. Titration was done at a controlled rate of 2 µl s-1 via a
stainless steel cannula connected to a syringe. In order to study possible
saturation of adsorption sites, Fn solution (25 µg ml-1) was added in four
consecutive injections of 60 µl into the ampoule with intervals of 40 min. All
calorimetric experiments were done in fourfold.
Statistical analysis. Data were analyzed with the statistical package for the
social sciences (Version 11.0, SPSS, Chicago, Illinois, USA). Median values of
the repulsive force at contact (F0) upon approach, the adhesion force (Fadh) upon

Fibronectin interactions
105
retract, as well as of the bond strength energy were analyzed using the Wilcoxon
signed rank test for the median. A Student's t-test was used to determine
significant differences in initial deposition rates, adhesion numbers after 4 h,
initial and final desorption rate coefficients, and their relaxation time as well as
in interaction enthalpies. The level of significance was set at p < 0.05.
Time (s)
0 4000 8000 12000 16000
Bac
teria
(106
cm-2
)
0
2
4
6
8
Figure 1. Representative examples of the adhesion kinetics of S. aureus 8325-4 (●) and DU5883 (○) to Fn-films in PBS.
Results
Adhesion and residence time dependent desorption of S. aureus from Fn-
films. Figure 1 shows representative examples of the adhesion kinetics of S.
aureus 8325-4 and DU5883 to Fn-coatings in a parallel plate flow chamber in
PBS at pH 7. The adhesion kinetics of both S. aureus strains are linear during
approximately 4000-5000 s prior to levelling off toward stationary numbers. The
linear trajectories of the curves are taken to calculate the initial deposition rates,
as summarized in Table 1. The initial deposition rate of S. aureus 8325-4 is
about twice as high as the one of FnBPs deficient DU5883, which indicates the

Cha
pter
6
106
Tab
le 1
. M
ean
valu
es f
or th
e in
itial
dep
ositi
on r
ate
(j 0)
and
num
bers
adh
erin
g af
ter
4 h
(n4h
), in
itial
(β 0
) an
d fin
al d
esor
ptio
n ra
te c
oeff
icie
nts
(β∞) t
oget
her w
ith th
e re
laxa
tion
time
for b
ond
agei
ng (1
/δ) f
or S
. aur
eus
8325
-4 w
ith fi
bron
ectin
bin
ding
pro
tein
s (F
nBPs
) and
isog
enic
mut
ant
DU
5883
with
out F
nBPs
from
Fn-
coat
ings
. Exp
erim
ents
wer
e pe
rfor
med
prio
r to
and
afte
r exp
osur
e of
the
subs
trata
or t
he s
taph
yloc
occi
to a
1%
B
SA s
olut
ion.
Ave
rage
sta
ndar
d de
viat
ions
ove
r fou
r sep
arat
e ex
perim
ents
am
ount
± 1
10 c
m-2
s-1
and
± 0
.5 ×
106 c
m-2
ove
r the
initi
al d
epos
ition
ra
tes
and
num
bers
of
bact
eria
adh
erin
g af
ter
4 h,
res
pect
ivel
y; ±
124
x 1
0-3 s
-1 a
nd ±
0.3
x 1
0-3 s
-1 o
ver
the
initi
al a
nd f
inal
des
orpt
ion
rate
co
effic
ient
s, re
spec
tivel
y, a
nd ±
0.3
s in
the
rela
xatio
n tim
e fo
r bon
d ag
eing
.
j 0 (c
m-2
s-1)
n 4h
(106 c
m-2
) β
0 (1
0-3 s-1
) β ∞
(10-3
s-1)
1/δ
(s)
Subs
trat
um
8325
-4
DU
5883
83
25-4
D
U58
83
8325
-4
DU
5883
83
25-4
D
U58
83
8325
-4
DU
5883
Fn-c
oate
d gl
ass
2438
12
90
7.0
5.2
307
463
1.0
1.2
0.9
0.9
Fn a
nd B
SA-
coat
ed g
lass
81
5 67
8 5.
2 4.
4 20
0 17
0 0.
6 0
.4
1.0
1.2
Fn-c
oate
d gl
ass*
70
4 52
7 3.
9 3.
5 33
4
504
0.6
1.8
0.9
0.9
* Th
ese
expe
rimen
ts w
ere
carr
ied
out w
ith st
aphy
loco
cci e
xpos
ed to
1%
BSA
prio
r to
the
expe
rimen
ts
Chapter 6
106

Fibronectin interactions
107
Figure 2. Representative examples of force-distance curve between an Fn-coated AFM tip and staphylococcal cell surfaces: S. aureus 8325-4 after 0 s surface delay (A), S. aureus 8325-4 after 2 s surface delay (B), S. aureus DU5883 after 0 s surface delay (C), S. aureus DU5883 after 2 s surface delay (D), S. aureus 8325-4 coated with BSA after 0 s surface delay (E), S. aureus 8325-4 coated with BSA after 2 s surface delay (F), S. aureus DU5883 coated with BSA after 0 s surface delay (G) and S. aureus DU5883 coated with BSA after 2 s surface delay (H).
Separation distance (nm)

Chapter 6
108
relatively high affinity of strain 8325-4 for Fn-coatings. Also after 4 h of
deposition, strain 8325-4 adheres in higher numbers than FnBPs deficient
DU5883, but the difference is not two-fold anymore as in initial deposition rates.
After exposure of either the Fn-coating or the staphylococci to BSA, initial
deposition rates and the numbers of bacteria adhering after 4 h decreased
significantly for both strains.
Table 1 also summarizes desorption characteristics of the two
staphylococcal strains. Exposure of either the Fn-coated surface or the bacterial
cells to BSA has only a minor effect, if any, on the initial desorption rate
coefficients (β0), which suggests that the desorbing bacteria mainly leave non-
specific binding sites. Desorption rates decrease with increasing residence-times
for both strains, regardless of the absence or presence of a BSA-coating on the
surfaces with relaxation times for bond ageing less than 2 s. Final desorption
rate coefficients (β∞) are similar for both strains without significant influences of
bacterial exposure to BSA and with a slight reduction in final desorption rates
after exposure of the Fn-coated surface to BSA.
Bond strengthening between Fn-coatings and S. aureus cell surfaces.
Median values of the interaction forces measured using AFM are summarized in
Table 2. The repulsive force at contact F0, is significantly (p < 0.05) stronger for
S. aureus 8325-4 with FnBPs than for S. aureus DU5883. Blocking of non-
specific binding sites on the staphylococcal cell surfaces has little (S. aureus
DU5883) or no (S. aureus 8325-4) influence on the repulsive force upon
approach. However, upon retract, median adhesion forces were significantly
stronger after a 2 s surface delay than when measured immediately, i.e. with a 0
s surface delay. There is no significant difference in adhesion forces between the
two strains. Interestingly, the distance over which the adhesion forces are
operative varies considerably between the different conditions applied, (see Fig.
2) which translates in significant differences in bond strength energies. Initial

Fib
rone
ctin
inte
ract
ions
109
Tab
le 2
. M
edia
n va
lues
1) f
or th
e re
puls
ive
forc
es a
t con
tact
F0
upon
app
roac
h2), a
dhes
ion
forc
e F a
dh u
pon
retra
ct a
nd a
ssoc
iate
d bo
nd s
treng
th
ener
gies
for t
he in
tera
ctio
n be
twee
n Fn
-coa
ted
AFM
tips
and
S. a
ureu
s 832
5-4
and
an is
ogen
ic m
utan
t with
out F
nBPs
, DU
5883
prio
r to
and
afte
r ba
cter
ial e
xpos
ure
to 1
% B
SA. A
ll ex
perim
ents
wer
e do
ne in
thre
e-fo
ld w
ith s
epar
atel
y pr
epar
ed F
n-co
ated
AFM
tips
and
diff
eren
t bac
teria
l cu
lture
s, yi
eldi
ng th
irty
forc
e-di
stan
ce c
urve
s. Rep
ulsi
ve fo
rce
at
cont
act F
0 (nN
)
Adh
esio
n fo
rce
F adh
(nN
)
Bon
d st
reng
th e
nerg
y
(10-1
6 J)
Del
ay
time
(s)
Tre
atm
ent
8325
-4
DU
5883
83
25-4
D
U58
83
8325
-4
DU
5883
No
BSA
9.
1 6.
0 -0
.7
-0.6
-9
8 -3
2
0
1% B
SA
9.0
3.9
-0.6
-0
.5
-64
-21
No
BSA
9.
1 6.
0 -1
.5
-1.7
-1
87
-181
2
1% B
SA
9.0
3.9
-1.1
-1
.1
-176
-1
49
1) d
istri
butio
n fu
nctio
ns w
ere
mad
e ta
king
a c
lass
wid
th o
f 0.1
nN
. 2)
thes
e da
ta c
ompr
ise
repu
lsiv
e fo
rces
at c
onta
ct m
easu
red
in e
xper
imen
ts w
ith a
nd w
ithou
t a s
urfa
ce d
elay
and
thus
refe
r to
30 fo
rce-
dist
ance
cu
rves
.
Fibronectin interactions
109

Chapter 6
110
bond strength energies of S. aureus 8325-4 with FnBPs are significantly (p <
0.05) higher than for S. aureus DU5883 without FnBPs, regardless of exposure
of the staphylococci to a 1% BSA solution. Both strains show a significant
increase in bond strength energy by a factor 2 to 3 when the surface delay time
is increased from 0 to 2 s for S. aureus 8325-4 and even more (factor 4 to 5) for
S. aureus DU5883 (Table 2). Furthermore, after a surface delay, effects of BSA
exposure of the staphylococci on bond strength energies disappear.
Figure 3. Adsorption enthalpies (µJ), after correction for dilution effects, of Fn to S. aureus cell surfaces upon consecutive injections of 60 µl Fn solution (25 µg/ml) into 1.5 ml bacterial suspension of S. aureus 8325-4 (●) and S. aureus DU5883 (○) in PBS. Right panel data refer to staphylococci first exposed to 1% BSA. Error bars indicate standard deviation based on four independent measurements.
Enthalpies of adsorption of Fn to S. aureus cell surface. The measurement of
adsorption enthalpies of Fn to the S. aureus cell surfaces requires correction for
the heat of diluting of the proteins in PBS. For four consecutive injections of 60
μl of a 25 μg ml-1 Fn-solution into 1.5 ml of PBS yielded heat effects of,
respectively, -55, -56, -37 and -37 × 10-9 μJ. Figure 3 summarizes the adsorption
enthalpies upon consecutive injections of Fn to the staphylococcal suspensions,
after correction for protein dilution. For the parent strain 8325-4 with FnBPs
adsorption enthalpies decrease with the number of injections done, but no
saturation of adsorption sites seems to be reached within four injections. For

Fibronectin interactions
111
strain DU5883 the enthalpy effects are essentially invariant with the number of
injections. The cumulative adsorption enthalpies after the four injections are
shown in Table 3, as expressed per bacterium and per m2 bacterial cell surface.
Fn adsorption to the bacterial cell surfaces is an exothermic process in all cases,
i.e. enthalpy is released upon adsorption. Adsorption of Fn to S. aureus 8325-4
with FnBPs is enthalpically significantly more favourable than to S. aureus
DU5883. After exposure to BSA of S. aureus 8325-4, the adsorption enthalpy
decreases significantly, but remains larger than those for S. aureus DU5883. No
significant effect is seen for exposure to BSA on the adsorption enthalpy of S.
aureus DU5883, lacking FnBPs.
Table 3. Cumulative adsorption enthalpies per bacterium (10-9µJ) and per m2 bacterial cell surface (mJ m-2) after four consecutive injections of 60 µl Fn solution (25 µg ml-1) into 1.5 ml bacterial suspensions in PBS. Average standard deviations over 4 separate experiments amount ± 25 × 10-9 µJ per bacterium and ± 8 mJ m-2, respectively.
Cumulative adsorption
enthalpies per bacterium
(10-9µJ)
Cumulative adsorption
enthalpies per m2
(mJ)
Experiments
8325-4 DU5883 8325-4 DU5883
No BSA -140 -43 -44 -14
1% BSA -102 -54 -32 -17
* for calculation of the adsorption enthalpies per m2, it was assumed that the bacterial cell radius was 0.5 µm.
Discussion
In this chapter, we compare the interactions mediating adhesion to Fn-coated
surfaces as well as desorption of two S. aureus strains, one containing FnBPs
and the other one being FnBP-deficient, using three entirely different
techniques. Adhesion and residence-time dependent desorption of the two

Chapter 6
112
strains is determined in a parallel plate flow chamber under convective-
diffusion. In addition, the adhesion forces to Fn-coated AFM tips were measured
as well as the adsorption enthalpies of Fn to the staphylococcal cell surfaces. In
general, adhesion of the strain with FnBPs to Fn-coated substrata occurs faster
and in higher numbers than that of the strain deficient of FnBPs and, in line,
adhesive bonds are stronger and adsorption enthalpies higher. Surprisingly,
adsorption of BSA to either the Fn-coated substrata or the staphylococcal cell
surfaces not only blocks non-specific adhesion/adsorption sites, but also
obstructs the accessibility of the FnBPs on strain 8325-4 during convective-
diffusional mass transport, as, in this case, adhesion approaches that of the
FnBP-deficient strain DU5883. Influences of a BSA-coating on interaction
forces and adsorption enthalpies are far less significant, however. Strengthening
of the bond is evident from the resident-time dependent desorption of both
strains as measured in a parallel plate flow chamber as well as from a
comparison of the adhesion forces and adhesive bond strength energies
measured after 0 and 2 s surface delays in AFM.
Adsorption enthalpies. The enthalpy changes associated with the interaction
between Fn and the S. aureus cells are all exothermic, but differ markedly
between the two strains, as shown in Fig. 3 and Table 3. For the FnBP-deficient
DU5883 strain the enthalpy change is essentially the same for each injection
step, as is to be expected for non-specific adsorption in the sub-saturation range.
Assuming that the staphylococcal cell diameter equals 1 μm, it can be calculated
that in the ITC ampoule there is 23.6 × 10⁻³ m2 of bacterial surface area available
for adsorption. Since each fibronectin injection adds 1.5 ×10⁻³ mg Fn, the
maximal cell surface coverage by fibronectin after 4 consecutive injections
amounts 0.25 mg Fn per m2 bacterial cell surface, which is far below the
saturation limit for non-specifically adsorbed Fn, which would amount to at least

Fibronectin interactions
113
a few mg m-2 [23]. Assuming that all Fn added is adsorbed, the cumulative
enthalpy effect measured of -14 mJ m-2 corresponds to -13.8 × 10³ kJ per mol Fn
(which corresponds to about 5600 kT per molecule Fn at 25°C), as calculated
using a molar mass of 250 kDa. Taking into account the large molar mass of Fn,
this value is quite reasonable when compared with enthalpy effects reported for
non-specific adsorption of various proteins to different surfaces [24]. The
enthalpy effects measured for the FnBPs containing strain 8325-4 are more
exothermic than for the FnBP-deficient strain DU5883. This indicates
involvement of enthalpically favourable specific Fn-binding sites. The
downward trend of the interaction enthalpy with consecutive injection steps,
displayed in Fig. 3 (left panel), suggests that not all specific binding sites are
equally favourable, or, alternatively, that they become gradually saturated, so
that for each subsequent addition a smaller fraction of Fn binds to FnBPs on the
cell surface. Assuming that all Fn added during the first injection binds to
FnBPs, the measured -250 μJ corresponds to -41.7 × 10³ kJ per mol Fn. This is
about 300× higher than the enthalpy of the biotin-streptavidin interaction [25].
However, it should be realized that the much larger Fn molecule may interact
through more binding sites than the number of sites involved in e.g. a single
biotin-streptavidin interaction.
Exposure of the bacteria to a BSA solution hardly influences the enthalpy
of interaction between Fn and the FnBP-deficient strain DU5883. In contrast,
BSA exposure of the FnBP-containing strain 8325-4 significantly suppresses the
enthalpy of interaction with Fn, but not even nearly to the level of a non-specific
interaction. However, the downward trend in enthalpy for the BSA-coated strain
8325-4 (Fig. 3, right panel) seems to indicate that for the later Fn injections,
smaller fractions of Fn added finds FnBPs, as compared to the non-BSA-coated
cells. This is completely in line with the lack of effects of BSA coating on
adhesion forces observed by AFM and attests to the forceful contact established

Chapter 6
114
during AFM or stirring in the microcalorimeter as compared with the
spontaneous and relatively mild nature of cell-surface interaction during
convective-diffusion in the parallel plate flow chamber.
Interaction forces. AFM adhesion forces to Fn-coated surfaces are similar for
both S. aureus strains. This is unexpected considering their different abilities to
adsorb fibronectin [16]. Adsorption of fibronectin is a process occurring at the
outermost cell surface. However, the Fn-coated AFM tip penetrates the cell
surface therewith probing underneath the outermost cell surface. It is clear that,
upon penetration, for both S. aureus strains FnBPs or other adhesins are
encountered in the cell wall, even for strain DU5883 generally considered to be
devoid of FnBPs [16]. However, the spatial distribution of adhesins in strain
8325-4 must be completely different than in strain DU5883, as its adhesion
forces reach out much further and consequently strain 8325-4 has a higher Fn-
bond strength energy than strain DU5883 (see Table 2). Under the conditions of
convective-diffusion prevailing in the parallel plate flow chamber, it can be
envisaged that bacteria land mildly at the substratum surface, therewith invoking
interaction with only the outermost region of the cell wall. Contrary, the
penetrating AFM tip senses similar bond strength energies with no influence of
an adsorbed BSA-film over the cell surface. Mendez-Vilas et al. [26,27] has
suggested that a penetrating AFM tip may cause irreversible damage to the inner
cell surface, as concluded from saw-tooth patterns in the force-distance curves at
close approach. As we observed no such patterns in our force-distance curves
(see also Fig. 2), it is considered unlikely that the AFM tip has caused such cell
surface damage. Moreover, we regularly checked whether interaction of our Fn-
coated tips with clean glass yielded the same force values, and this was always
the case within one series of experiments.

Fibronectin interactions
115
Residence-time dependent desorption. Desorption rate coefficients from a Fn-
coated surface decrease for both S. aureus strains within 2 s by a factor of about
300-400. It is remarkable that the desorption rates and their residence time
dependence are insensitive to whether or not specific Fn-FnBP interactions were
involved in the adhesion. Apparently, the cells of strain 8325-4 that desorb
belong to the fraction of the population that have not been able to adhere
through strong specific bonds. Accordingly, exposure of either the bacterial cells
or the Fn-coated surface to BSA, therewith blocking specific Fn-FnBP
interactions has no or little effect on desorption kinetics. The decreasing
desorption rate coefficients could be confirmed by independent AFM
measurements.
Assuming that for a given condition, all bacteria adhere with the same
bond strength, a staphylococcal bond strength energy can also be calculated
from the desorption rate coefficients measured in the parallel plate flow
chamber, by applying
βesc= kTmehc
j /0 ϕ
Δ (4)
where βesc is the desorption rate coefficient, j0 the initial deposition rate, c the
bacterial cell concentration at the entrance of the flow chamber, Δh the width of
the energy minimum, φm depth of the energy minimum and kT the energy of
thermal motion [14,28]. The initial bond strength energies of our staphylococcal
strains to a Fn-film in the absence of a BSA-coating can be calculated from the
initial desorption rate coefficients and ranges between 2.2 to 3.3 kT, which
seems quite reasonable for non-specific binding. After bond ageing, the use of
the final desorption rate coefficients yields much higher bond strength energies
between 8.2 and 9.0 kT. Yet, these bond strength energies are orders of
magnitude smaller than derived from AFM, and conversion of the bond strength
energies from Table 2 to a thermal energy scale yields values of around 106 kT.

Chapter 6
116
This huge number attests to the fact that the penetrating, Fn-coated AFM tip
must have encountered numerous adhesins in the cell surface.
Conclusions
The combined use of a parallel plate flow chamber, AFM and ITC has yielded
new insights in the mechanisms of interaction between adsorbed Fn-films and S.
aureus strains, one of which (strain 8325-4) has FnBPs on its cell surface
whereas the other one (strain DU5883) is generally considered to be devoid of
FnBPs. First of all, the differences between the two strains with respect to (a)
initial deposition rate at a Fn-coated surface, (b) strength of binding to a Fn-
coated AFM tip and (c) enthalpy of interaction with Fn indicate that for 8325-4
additional attractive forces are involved which are ascribed to specific FnBP-Fn
interaction. Most interestingly, exposure of either Fn-coatings or staphylococcal
cell surfaces to BSA, strongly reduces staphylococcal adhesion under
convective-diffusion, but their enthalpy of Fn adsorption and their adhesion
force upon retracting a Fn-coated tip from the staphylococcal cell surface are
much less, if at all, influenced by a BSA-coating. It suggests that AFM and
calorimetry not only probe interactions at the outermost surfaces of the
interacting species but also those occurring underneath the BSA coating.
Residence-time dependent desorption data and AFM measurements reveal
considerable bond strengthening within a few seconds of contact for both S.
aureus strains. Bond strength energies calculated from the retract force-distance
curves in AFM were orders of magnitude larger than calculated from desorption
rate coefficients. This is another indication that the penetrating Fn-coated AFM
tip probes multiple receptor sites in the cell surface, for S. aureus 8325-4 as well
as DU5883. Apparently, mild landing of an organism on a Fn-coated substratum

Fibronectin interactions
117
as during convective-diffusion in the parallel plate flow chamber clearly does
not invoke specific interactions with deeper located adhesins.
Acknowledgements We like to thank ZON-MW for grant 91105005 enabling the purchase of the
Nanoscope IV Digital Instrument.
References 1. Lowy, F.D. (1998), Medical progress - Staphylococcus aureus infections, N Eng J Med
339, 520 - 532.
2. Fowler, T., Wann, E.R., Joh, D., Johansson, S.A., Foster, T.J. and Hook, M. (2000),
Cellular invasion by Staphylococcus aureus involves a fibronectin bridge between the
bacterial fibronectin-binding MSCRAMMS and host cell β1 integrins, Eur J Cell Biol
79, 672 - 679.
3. Greene, C., Mcdevitt, D., Francois, P., Vaudaux, P.E., Lew, D.P. and Foster, T.J.
(1995), Adhesion properties of mutants of Staphylococcus aureus defective in
fibronectin-binding proteins and studies on the expression of fnb genes, Mol Microbiol
17, 1143 - 1152.
4. Peacock, S.J., Foster, T.J., Cameron, B.J. and Berendt, A.R. (1999), Bacterial
fibronectin-binding proteins and endothelial cell surface fibronectin mediate adherence
of Staphylococcus aureus to resting human endothelial cells, Microbiol 145,
3477 - 3486.
5. Vaudaux, P., Suzuki, R., Waldvogel, F.A., Morgenthaler, J.J. and Nydegger, U.E.
(1984), Foreign-body infection - Role of fibronectin as a ligand for the adherence of
Staphylococcus aureus, J Infect Dis 150, 546 - 553.

Chapter 6
118
6. Vaudaux, P.E., Waldvogel, F.A., Morgenthaler, J.J. and Nydegger, U.E. (1984),
Adsorption of fibronectin onto polymethylmethacrylate and promotion of
Staphylococcus aureus adherence, Infect Immunol 45, 768 - 774.
7. Haynes, C.A. and Norde, W. (1995), Structures and stabilities of adsorbed proteins, J
Colloid Interf Sci 169, 313 - 328.
8. Xu, C.P., Van de Belt-Gritter, B.V., Busscher, H.J., Van der Mei, H.C. and Norde,
W. (2007), Calorimetric comparison of the interactions between salivary proteins and
Streptococcus mutans with and without antigen i/ii, Colloid Surface B 54, 193 - 199.
9. Busscher, H.J., Van de Belt-Gritter, B., Dijkstra, R.J.B., Norde, W., Petersen, F.C.,
Scheie, A.A. and Van der Mei, H.C. (2007), Intermolecular forces and enthalpies in
the adhesion of Streptococcus mutans and an antigen i/ii-deficient mutant to laminin
films, J Bacteriol 189, 2988 - 2995.
10. Binnig, G., Quate, C.F. and Gerber, C. (1986), Atomic force microscope, Phys Rev
Lett 56, 930 - 933.
11. Dabros, T. and van de Ven, T.G.M. (1982), Kinetics of coating by colloidal particles,
J Colloid Interf Sci 89, 232 - 244.
12. Sjollema, J., Van der Mei, H.C., Uyen, H.M. and Busscher, H.J. (1990), Direct
observations of cooperative effects in oral streptococcal adhesion to glass by analysis of
the spatial arrangement of adhering bacteria, FEMS Microbiol Let 69, 263 - 269.
13. Van de Ven, T.G.M. (1989), Effects of electrolytes, polymers and polyelectrolytes on
particle deposition and detachment, Colloid Surface 39, 107 - 126.
14. Meinders, J.M., Van der Mei, H.C. and Busscher, H.J. (1994), Physicochemical
aspects of deposition of Streptococcus thermophilus B to hydrophobic and hydrophilic
substrata in a parallel-plate flow chamber, J Colloid Interf Sci 164, 355 - 363.
15. Vadillo-Rodriguez, V., Busscher, H.J., Norde, W., De Vries, J. and Van der Mei,
H.C. (2004), Atomic force microscopic corroboration of bond aging for adhesion of
Streptococcus thermophilus to solid substrata, J Colloid Interf Sci 278, 251 - 254.

Fibronectin interactions
119
16. Saravia-Otten, P., Muller, H.P. and Arvidson, S. (1997), Transcription of
Staphylococcus aureus fibronectin binding protein genes is negatively regulated by agr
and an agr-independent mechanism, J Bacteriol 179, 5259 - 5263.
17. Busscher, H.J. and van der Mei, H.C. (2006), Microbial adhesion in flow
displacement systems, Clin Microbiol Rev 19, 127 - 141.
18. Camesano, T.A., Natan, M.J. and Logan, B.E. (2000), Observation of changes in
bacterial cell morphology using tapping mode atomic force microscopy, Langmuir 16,
4563 - 4572.
19. Cleveland, J.P., Manne, S., Bocek, D. and Hansma, P.K. (1993), A nondestructive
method for determining the spring constant of cantilevers for scanning force
microscopy, Rev Sci Instrum 64, 403 - 405.
20. Nordmark, M.G., Laynez, J., Schon, A., Suurkuusk, J. and Wadso, I. (1984),
Design and testing of a new microcalorimetric vessel for use with living cellular-
systems and in titration experiments, J Biochem Biophys Method 10, 187 - 202.
21. Wu, C.F., Chen, W.Y. and Lee, J.F. (1996), Microcalorimetric studies of the
interactions of imidazole with immobilized cu(ii): effects of pH value and salt
concentration, J Colloid Interf Sci 183, 236 - 242.
22. Briggner, L.E. and Wadso, I. (1991), Test and calibration processes for
microcalorimeters, with special reference to heat-conduction instruments used with
aqueous systems, J Biochem Biophys Method 22, 101 - 118.
23. Sousa, S.R., Manuela Bras, M., Moradas-Ferreira, P. and Barbosa, M.A. (2007),
Dynamics of fibronectin adsorption on TiO2 surfaces, Langmuir 23, 7046 - 7054.
24. Haynes, C.A. and Norde, W. (1994), Globular proteins at solid/liquid interfaces,
Colloid Surface B 2, 517 - 566.
25. Moy, V.T., Florin, E.L. and Gaub, H.E. (1994), Intermolecular forces and energies
between ligands and receptors, Science 266, 257 - 259.

Chapter 6
120
26. Mendez-Vilas, A., Gallardo-Moreno, A.M. and Gonzalez-Martin, M.L. (2006),
Nano-mechanical exploration of the surface and sub-surface of hydrated cells of
Staphylococcus epidermidis, Anton Leeuw Int J Gen Mol Microbiol 89, 373 - 386.
27. Mendez-Vilas, A., Gallardo-Moreno, A.M., Calzado-Montero, R. and Gonzalez-
Martin, M.L. (2008), AFM probing in aqueous environment of Staphylococcus
epidermidis cells naturally immobilised on glass: Physico-chemistry behind the
successful immobilisation, Colloid Surface B 63, 101 - 109.
28. Xia, Z.M., Goldsmith, H.L. and Van de Ven, T.G.M. (1994), Flow-induced
detachment of red blood cells adhering to surfaces by specific antigen-antibody bonds,
Biophys J 66, 1222 - 1230.

CHAPTER 7
GENERAL DISCUSSION

Chapter 7
122
Introduction
Microbial adhesion onto surfaces is a problem occurring in many fields and is
therefore widely studied [1-3]. Adhesion takes place when there is sufficient
affinity of the microbial cell surface for a substratum surface. To determine
these affinities, several experimental techniques as well as theoretical
predictions are available [4-8].
In this thesis we performed experiments in the parallel plate flow
chamber, as well as force measurements with an atomic force microscope
(AFM) to determine bacterial adhesion parameters. The extended DLVO-theory
was used as a theoretical reference.
Adhesion in the parallel plate flow chamber
In the parallel plate flow chamber, the deposition process occurs without
imposing forced contact and allows to determine several interaction parameters,
like the hydrodynamic force to prevent adhesion (Fprev), the hydrodynamic force
to detach adhering bacteria (Fdet) and desorption rate coefficients. Initial
interaction parameters, i.e. Fprev and initial desorption rate coefficient (β0)
showed no clear relation with the hydrophobicity of the substratum surfaces
used. Furthermore, regardless of the substratum used some general trends were
observed. The final desorption rate coefficient (β∞) was always lower than β0
and Fdet was always larger than Fprev, although no correlation between them was
observed. These parameters together indicate that over time the adhesive bond
between bacteria and surfaces strengthens and that adhesion and desorption are
independent processes. However, a clear influence of substratum surface
hydrophobicity was observed when comparing Fdet and β∞ on hydrophilic glass
and hydrophobic DDS-coated glass. As a rule, Fdet was larger and β∞ was lower

General discussion
123
on the hydrophobic substratum surface. Interestingly, also the adhesion
dynamics differed on both surfaces. On hydrophilic glass, a larger fraction of the
adhering bacteria slid along the surface, while on DDS-coated glass bacteria
tended to stick to the surface. All these observations lead to the conclusion that
adhesion of bacterial strains on hydrophobic DDS-coated glass was more
favourable than on hydrophilic glass.
Adhesion in Atomic Force Microscopy
In contrast to experiments in the parallel plate flow chamber, in AFM
experiments bacteria and surfaces are forced into contact. After 0 s of contact
between the bacterial probe and the substratum surface, retract curves showed
that adhesion forces (F0s) were hardly affected by substratum surface
hydrophobicity. However, upon prolonged contact between bacterium and the
hydrophilic substratum surface, adhesion forces gradually became stronger,
whereas this effect was virtually absent on the hydrophobic surface. This lead to
the conclusion that hydrophilic glass was a more favourable substratum surface
to adhere to, contradicting the findings in the parallel plate flow chamber.
Combining experimental data with theoretical predictions
Initial adhesion is governed by macroscopic interaction forces as described in
the extended-DLVO-theory for colloid stability [8]. In this theory, the total free
energy of interaction is described as the sum of Lifshitz-Van der Waals (LW)-,
electrostatic (EL)- and Lewis acid-base (AB) interactions as a function of
separation distance. Figure 1 gives an example of an extended-DLVO
interaction energy curve for a bacterium on hydrophilic glass and hydrophobic
DDS-coated glass. As can be seen from Figure 1, the major difference in

Chapter 7
124
predicted interaction energies is the AB-component, which also constitutes the
hydrogen bonding component of the free energy of cohesion of water [9], and
can directly be related to the substratum surface hydrophobicity.
Figure 1. Example of extended-DLVO profile (ΔGTOT) for Staphylococcus epidermidis HBH2 169 as well as contributions of the Lifshitz-Van der Waals (ΔGLW), electrostatic (ΔGEL) and Lewis acid-base (ΔGAB) interactions on hydrophilic glass and hydrophobic DDS-coated glass. Positive values denote repulsion, negative values denote attraction.
On hydrophilic glass, hydrogen bonds between the surface and surrounding
water molecules can occur easily, which need to be broken first before a
bacterium can make contact with the surface. As a consequence, the AB-
interaction on hydrophilic glass is repulsive (Figure 1). Conversely, on

General discussion
125
hydrophobic DDS-coated glass surrounding water molecules cannot bind
through hydrogen bonding and are restricted in their rotational freedom. As a
consequence their release from the surface is entropically more favourable upon
approach of a bacterium, resulting in attractive AB-interactions (Figure 1). It is
clear that, if there is any influence of surface hydrophobicity on adhesion, this is
only effective at close contact between bacteria and substratum surfaces.
Initially, bacteria will approach the surface towards a shallow secondary
minimum of interaction according to LW- and EL-interaction forces. As can be
seen from Figure 1, this minimum does not differ much on both surfaces.
Interestingly, none of the parameters concerning initial adhesion (i.e. Fprev, β0
and F0s), although different in magnitude and nature, show an unambiguous
influence of the substratum surface. It is therefore very likely that initial
adhesion is governed by long-range (LW) interaction forces in combination with
electrostatic interactions and that time and close approach are needed for a
significant effect of surface hydrophobicity on the observed adhesion
parameters.
When, in case of free, non-forced adhesion, as occurs in the flow
chamber, contact times were prolonged, surface appendages (like, for example,
extracellular polymeric substances, pili and fimbriae) present on the adhering
bacterium might be able to bridge with the hydrophobic DDS-coated glass due
to a favourable short-range AB-interaction. On hydrophilic glass these
interactions are repulsive which does not only cause less favourable final
adhesion parameters Fdet and β∞, but also in a higher percentage of mobile
adhering bacteria. At this point it is interesting to note that in case of a more
biologically relevant adhesion system (i.e. adhesion of Staphylococcus aureus to
fibronectin or bovine serum albumin in PBS), mobile adhesion was virtually
absent, regardless of the possibility of specific interaction. Here, a combined

Chapter 7
126
effect of ligand-receptor binding and high ionic strength prevented a rolling or
sliding mode of adhesion.
In the case of forced adhesion in AFM, the situation is different. Lewis
acid-base interactions are mechanically overcome by pressing the bacterium to
the surface. Once the water molecules adjacent to the substratum surface, as well
as those associated with the outside of the bacterial cell wall are removed into
the bulk, sites for hydrogen bond formation become available. However, DDS-
coated glass is apolar and therefore not capable to facilitate hydrogen binding
with the bacterium. Conversely, on hydrophilic glass numerous hydrogen
binding sites are present facilitating a steady increase in adhesion strength with
prolonged time.
At this point it should be noted that the forces measured in the flow
chamber (Fprev and Fdet) are orders in magnitude lower than adhesion forces
measured with AFM. A probable cause is the fact that AFM measurements
probe the force normal to the substratum surface, whereas Fprev and Fdet are
indicative force strengths in the tangential direction. Furthermore, by pressing
the bacteria towards the surface in AFM, deformation of the outer layer of the
bacterial cell wall may occur. This increases the contact area between bacterium
and substratum surface and therewith also the number of binding sites and as a
consequence the measured adhesion force.
Conclusions
Direct correlation of adhesion forces measured in a parallel plate flow chamber
and an atomic force microscope, is obscured by the nature of both experimental
techniques. Force values measured in a flow chamber, resemble the natural
process best and give the most accurate approximation of bioadhesion in vivo. In
this situation, attractive AB-interactions, due to release water molecules, cause a

General discussion
127
stronger attachment to a hydrophobic substratum surface, probably caused by
bridging of extracellular polymeric substances. On hydrophilic glass, AB-
interactions are repulsive, making bridging more difficult. In AFM experiments,
interaction forces are measured that are, because of the forced contact, very
often not reached in naturally occurring adhesion. After the initial release of
water molecules into the bulk solution upon close approach of a bacterium, the
apolar groups present on the hydrophobic substratum surface cannot form
hydrogen bridges directly with the rather hydrophilic bacterial cell surface,
preventing strengthening of the initial adhesion force. The opposite is true for
adhesion to hydrophilic glass, where numerous sites for hydrogen bonds are
present, facilitating a gradual increase of the adhesion force and contradicting
the findings in the flow chamber.
This means that researchers have to be careful in using AFM to prove that
microbial adhesion on one surface is more favourable as compared to another,
especially when these surfaces are very different in nature. However, both
experimental techniques indicate the importance of hydrogen bonding capability
in bacterial adhesion to non-specifically binding (inert) surfaces, especially with
respect to bond strength and associated adhesion dynamics.
Future research
To gain a better insight in the influence of substratum surface hydrophobicity on
adhesion dynamics, more experiments with substratum surfaces with
intermediate hydrophobicities should be performed. Also, in elucidating
microbial adhesion dynamics in biologically relevant adhesion systems (i.e. via
specific ligand-receptor binding), it is advisable to perform such experiments in
suspending media containing biopolymers to better mimic natural conditions.
However, it should be noted that in systems where ligand-receptor binding does

Chapter 7
128
not play a role, high ionic strength influences the dynamics significantly [10].
Therefore in elucidating adhesion dynamics in biologically more relevant
systems, experiments should be performed with media of different ionic
strengths, even though this implies that experiments may lose some of their
biological relevance.
Furthermore, a suggestion can be made with respect to direct force
measurements. AFM was, and may still be, a golden standard for direct
determination of interaction forces. But nowadays also optical tweezers can be
used to trap a single cell and probe its interactions with a surface [11]. The
advantage is that contact is not forced and perpendicular forces might be probed
more naturally, as compared to AFM. Interestingly, forces obtained using
optical tweezers are generally also in a similar range as obtained in a flow
chamber (i.e. 10-12 N [11,12]) and may lead to better correlations between
tangential and perpendicular forces. Therefore, this technique should be
optimized for measurements that allow direct force measurements of whole cells
on surfaces.
References
1. Cooksey, K.E. and Wigglesworth-Cooksey, B. (1995), Adhesion of bacteria and
diatoms to surfaces in the sea - A review, Aquat Microb Ecol 9, 87 - 96.
2. Costerton, J.W., Stewart, P.S. and Greenberg, E.P. (1999), Bacterial biofilms: A
common cause of persistent infections, Science 284, 1318 - 1322.
3. Flemming, H.C. (2002), Biofouling in water systems - Cases, causes and
countermeasures, Appl Microbiol Biot 59, 629 - 640.
4. Azeredo, J., Visser, J. and Oliveira, R. (1999), Exopolymers in bacterial adhesion:
Interpretation in terms of DLVO and XDLVO theories, Colloid Surface B 14, 141 - 148.

General discussion
129
5. Fang, H.H.P., Chan, K.Y. and Xu, L.C. (2000), Quantification of bacterial adhesion
forces using atomic force microscopy (AFM), J Microbiol Meth 40, 89 - 97.
6. Mendez-Vilas, A., Gallardo-Moreno, A.M., Gonzalez-Martin, M.L., Calzado-
Montero, R., Nuevo, M.J., Bruque, J.M. and Perez-Giraldo, C. (2004), Surface
characterisation of two strains of Staphylococcus epidermidis with different slime-
production by AFM, Appl Surf Sci 238, 18 - 23.
7. Owens, N.F., Gingell, D. and Rutter, P.R. (1987), Inhibition of cell-adhesion by a
synthetic polymer adsorbed to glass shown under defined hydrodynamic stress, J Cell
Sci 87, 667 - 675.
8. Hermansson, M. (1999), The DLVO theory in microbial adhesion, Colloid Surface B
14, 105 - 119.
9. Van Oss, C.J. (2003), Long-range and short-range mechanisms of hydrophobic
attraction and hydrophilic repulsion in specific and aspecific interactions, J Mol
Recognit 16, 177 - 190.
10. Castelain, M., Pignon, F., Piau, J.M. and Magnin, A. (2008), The initial single yeast
cell adhesion on glass via optical trapping and Derjaguin-Landau-Verwey-Overbeek
predictions, J Chem Phys 128, 135101-1 - 135101-14
11. Sharp, J.M., Clapp, A.R. and Dickinson, R.B. (2003), Measurement of long-range
forces on a single yeast cell using a gradient optical trap and evanescent wave light
scattering, Colloid Surface B 27, 355 - 364.
12. Fallman, E., Schedin, S., Jass, J., Andersson, M., Uhlin, B.E. and Axner, O. (2004),
Optical tweezers based force measurement system for quantitating binding interactions:
system design and application for the study of bacterial adhesion, Biosens Bioelectron
19, 1429 - 1437.

Chapter 7
130

SUMMARY

Summary
132
Microbial adhesion to surfaces is a problem occurring in many fields of
application, including biomaterials associated repair of human function. Several
experimental techniques as well as predictive theoretical models are available to
gain a better understanding of the strength by which bacteria adhere to a
substratum.
Chapter 1 gives an introduction on the importance of understanding the
adhesion strength between micro-organisms, like bacteria, and substratum
surfaces. Adhesion strengths can be determined experimentally, but also
predicted theoretically. Experimental forces not only differ orders of magnitude,
but also theoretical force calculations present their own class of force values.
Furthermore, little research exists, in which adhesion parameters are
investigated under identical experimental conditions (i.e. substratum surface,
suspending media, growth conditions and bacterial strains).
Therefore, the main aim of this thesis is to develop an understanding of
the reason(s) why different techniques yield different ranges for microbial
interaction forces with substratum surfaces. The possible relations between
hydrodynamic shear forces obtained in the PPFC, predicted DLVO-forces and
air bubble detachment percentages for six different bacterial strains are
investigated in Chapter 2 by testing three hypotheses:
1. A strong hydrodynamic shear force to prevent adhesion (Fprev) relates to a
strong hydrodynamic shear force to detach (Fdet) an adhering organism.
2. A weak Fdet implies that more bacteria will be stimulated to detach by a
passing air-liquid interface through the flow chamber.
3. DLVO interactions determine Fprev and Fdet as well as the detachment
induced by a passing air-liquid interface.
However, every hypothesis had to be rejected showing the importance to
distinguish between forces acting parallel (hydrodynamic shear) and
perpendicular (DLVO, air-liquid interface passages) to the substratum surface.

Summary
133
Substratum surface hydrophobicity did not have an unambiguous
influence on Fprev. However, on the hydrophobic, dimethyldichlorosilane (DDS)-
coated glass it was more difficult to detach adhering bacteria, which was
confirmed by air-liquid interface induced detachment. These results showed that
the hydrophobic surface is more favourable for bacterial adhesion.
Another indication for interaction strength is the residence time dependent
desorption rate coefficient, which is studied in Chapter 3. Initial desorption rate
coefficients of four strains of Staphylococcus epidermidis were similar for
hydrophilic and hydrophobic DDS-coated glass, likely because initial desorption
is controlled by attractive Lifshitz-Van der Waals interactions, which are
comparable on both substratum surfaces. However, contact time allows a
significant effect of substratum surface hydrophobicity. On DDS-coated glass,
decay times are slower and final desorption rate coefficients smaller, suggesting
adhesion is more favourable on the hydrophobic surface. It is concluded that the
hydrophobic effect is the probable cause for these observations, because of the
more close contact between bacterium and substratum surface on hydrophobic
DDS-coated glass.
In Chapter 4 the adhesion dynamics, a more qualitative way of
describing bacterial affinity, were investigated for the same strains of S.
epidermidis as those in Chapter 3. Two modes of adhesion were distinguished:
immobile and mobile adhesion in which, despite an interaction with the
substratum surface, sliding along a substratum surface is possible. On
hydrophilic glass significantly more bacteria were found to adhere mobile, while
this feature was virtually absent on hydrophobic DDS-coated glass. It was
concluded that the presence of fully mobile adhesion depends on the Lewis acid-
base component of the free energy of interaction between the bacterium and
substratum. On hydrophilic glass this component is repulsive, and bacteria
cannot bind locally with a strong enough force for immobile adhesion. On DDS-

Summary
134
coated glass, the Lewis acid-base component is attractive, creating stronger local
bonds and preventing fully mobile adhesion.
Residence time dependent adhesion forces of these staphylococcal strains
with hydrophilic glass and DDS-coated glass can be investigated directly by
using atomic force microscopy (AFM), as described in Chapter 5. No
unambiguous effect of substratum surface hydrophobicity on initial adhesion
forces was observed. However, over time, strengthening of the adhesion forces
was virtually absent on DDS-coated glass, although in a few cases multiple
adhesion peaks developed in the retract curves. Significant bond-strengthening
on hydrophilic glass was observed for all four staphylococcal strains and was
concurrent with the development of multiple adhesion peaks upon retract. It is
concluded that on DDS-coated glass, the hydrophobic effect causes
instantaneous adhesion, while strengthening of the bonds on hydrophilic glass is
dominated by non-instantaneous hydrogen bond formation as determined by
using Poisson analysis.
So far adhesion parameters were studied for systems where only non-
specific interactions were possible. Therefore, the adhesion of two
Staphylococcus aureus strains, one with fibronectin binding proteins (FnBP’s)
and the other without these proteins, was studied in Chapter 6. The strain with
FnBP’s adhered significantly faster and stronger to a fibronectin (Fn) coated
surface. In line with this, this strain also had higher adsorption enthalpies
(measured with isothermal titration calorimetry, ITC) of Fn as compared to the
strain without FnBP’s. Initial desorption rate coefficients were high for both
strains, but decreased orders of magnitude within 2 s. Bond ageing was
confirmed by AFM adhesion force measurements. After exposure of either Fn-
coatings or staphylococcal cell surfaces to bovine serum albumin (BSA), the
adhesion of both strains to the substratum surface was strongly reduced,
suggesting that BSA not only suppresses non-specific cell-surface interactions
but also specific Fn-FnBP interactions. However, adhesion forces and

Summary
135
adsorption enthalpies were only slightly affected by BSA adsorption.
Furthermore, desorption rate coefficients were insensitive to whether or not
specific Fn-FnBP interactions were involved. From this study it was concluded
that the forced contact during AFM or stirring in ITC allows Fn-FnBP binding
with deeper located FnBP’s, despite an adsorbed BSA film and that mild landing
of an organism on a Fn-coated substratum as during convective-diffusion in the
parallel plate flow chamber does not invoke deeper located receptors.
In the general discussion, Chapter 7, it was noted that direct correlation
of adhesion parameters measured with the PPFC and AFM, is obscured by the
nature of both experimental techniques. Parameters measured in a flow chamber,
resemble the natural process best and give the most accurate approximation of
bioadhesion in vivo. In AFM experiments, interaction forces are measured that
are, due to the forced contact in AFM, very often not reached in naturally
occurring adhesion. It is concluded that researchers have to be careful in using
AFM to prove that microbial adhesion on one surface is more favourable as
compared to another, especially when these surfaces differ in hydrophobicity.
However, in this thesis both experimental techniques have indicated the
importance of hydrogen bonding in bacterial adhesion to non-specifically
binding (inert) surfaces, especially with respect to bond strength and associated
adhesion dynamics.

Summary
136

SAMENVATTING

Samenvatting
138
Aanhechting van micro-organismen, zoals bacteriën, aan oppervlakken komt in
veel situaties voor. Een heel bekend voorbeeld van dit proces vindt plaats in de
mond. In de mond zijn veel verschillende soorten oppervlakken aanwezig
waaraan bacteriën zich kunnen hechten. Als dit gebeurt op tanden en kiezen, dan
kunnen zij zich na verloop van tijd vermenigvuldigen en een leefgemeenschap
vormen die, toepasselijk, “tandplaque” wordt genoemd. Wanneer plaque niet
wordt verwijderd, door bijvoorbeeld tandenpoetsen, zijn tandvleesontstekingen
of cariës (gaatjes in tanden en kiezen) het gevolg. De algemene term voor een
dergelijke microbiële leefgemeenschap is een “biofilm”. Biofilms komen in veel
praktische situaties voor en kunnen op metaaloppervlakken roestvorming
veroorzaken (bijvoorbeeld in pijpleidingen en warmtewisselaars in de industrie),
maar kunnen ook bij diverse medische toepassingen, zoals kunstgewrichten of
katheters, voor infecties zorgen. Voordat een biofilm kan ontstaan, moeten de
bacteriën sterk genoeg aan een oppervlak gaan hechten zodat ze niet wegspoelen
door een vloeistofstroom, zoals bijvoorbeeld speeksel in de mondholte. Om een
beter begrip te krijgen van de kracht waarmee de aanhechting plaatsvindt, is een
aantal experimentele technieken en theoretische beschrijvingen beschikbaar.
In Hoofdstuk 1 wordt het belang van kennis over de sterkte waarmee
bacteriën aan oppervlakken hechten kort weergegeven. Deze hechtingskrachten
kunnen experimenteel bepaald worden met, bijvoorbeeld, de Parallel Plate Flow
Chamber (afgekort tot PPFC) en de Atomic Force Microscope (afgekort tot
AFM). Ook kunnen ze berekend worden met behulp van een theorie die
ontwikkeld is door Derjaguin, Landau, Verwey en Overbeek (en dus de DLVO-
theorie genoemd wordt). De krachten die bepaald zijn met de verschillende
benaderingen hebben allemaal hun eigen orde van grootte. Een verdere
complicatie is dat er in de literatuur weinig experimenten worden beschreven die
bij dezelfde omstandigheden zijn uitgevoerd (bijvoorbeeld de te gebruiken
testoppervlakken, bacteriële stammen en de vloeistof waarin de hechting plaats

Samenvatting
139
vindt). Dit is echter wel een vereiste om de uitkomsten van de verschillende
technieken goed met elkaar te kunnen vergelijken.
Het doel van het onderzoek, beschreven in dit proefschrift, is om meer
inzicht te krijgen in de mechanismen die verantwoordelijk zijn voor de variatie
in grootte-orde van hechtingskrachten gemeten met verschillende technieken.
Om dit doel te bereiken werden experimenten in de PPFC en AFM uitgevoerd
bij dezelfde omstandigheden (vloeistof, temperatuur) en werden twee
testoppervlakken met verschillende affiniteiten voor water gebruikt: een
waterminnend (hydrofiel) en een waterafstotend (hydrofoob) oppervlak.
In Hoofdstuk 2 worden voor zes verschillende bacteriële stammen
hydrodynamische schuifkrachten, zoals bepaald in een PPFC, de berekende
DLVO-krachten en het percentage bacteriën dat van het oppervlak verwijderd
wordt als gevolg van het passeren van een luchtbel, getoetst aan een drie-tal
hypothesen:
1. Als een sterke hydrodynamische schuifkracht nodig is om aanhechting te
voorkomen (Fprev) zal ook een sterke hydrodynamische schuifkracht om
hechtende bacteriën te verwijderen (Fdet) nodig zijn.
2. Een zwakke Fdet impliceert dat meer bacteriën verwijderd zullen worden
als een luchtbel door de PPFC geleid wordt.
3. DLVO interacties bepalen Fprev, Fdet en het percentage bacteriën dat door
een passerende luchtbel verwijderd wordt.
Het bleek dat alle hypothesen verworpen moesten worden, waarmee duidelijk
werd dat er een onderscheid gemaakt moet worden tussen krachten die parallel
aan het oppervlak werken (de schuifkrachten) en de krachten die loodrecht op
het oppervlak werken (DLVO-krachten en de door de luchtbel uitgeoefende
krachten om hechtende bacteriën te verwijderen).
Uit het onderzoek bleek verder dat de affiniteit voor water van het
testoppervlak geen eenduidige invloed had op Fprev. Wel was het veel moeilijker
om bacteriën met schuifkrachten van het hydrofobe oppervlak te verwijderen,

Samenvatting
140
wat bevestigd werd door de verwijderingexperimenten met luchtbellen. Deze
resultaten laten zien dat aanhechting van bacteriën gunstiger is, als het oppervlak
waterafstotend is.
Een andere parameter voor hechtingssterkte is de zogenoemde
desorptiesnelheidscoëfficiënt die afhankelijk is van de contacttijd tussen bacterie
en testoppervlak. Voor vier verschillende Staphylococcus epidermidis stammen
werd deze coëfficiënt onderzocht en in Hoofdstuk 3 beschreven. De initiële
waarde van deze parameter werd niet beïnvloed door de water-affiniteit van het
testoppervlak. Waarschijnlijk komt dit doordat de krachten die voor aantrekking
zorgen (de zogenoemde Lifshitz-Van der Waals interacties) voor beide
oppervlakken gelijk zijn. Dat betekent dat onafhankelijk van het oppervlak
initieel evenveel hechtingsenergie overwonnen moet worden, om aan de
aantrekking van het oppervlak te kunnen ontsnappen. Met het toenemen van de
contacttijd tussen bacterie en oppervlak, wordt de desorptiesnelheidscoëfficiënt
kleiner. Met andere woorden, hechtende bacteriën gaan moeilijker van het
oppervlak af. In dit proces speelt de affiniteit voor water van het testoppervlak
wel een rol. Op het hydrofobe oppervlak gaat dit proces namelijk significant
sneller en zijn de eindwaarden van de coëfficiënt ook significant kleiner. Dit
suggereert dat hechten aan het water afstotende oppervlak gunstiger is. Aan het
einde van het hoofdstuk wordt geconcludeerd dat het “hydrofobe effect” hier de
oorzaak van is. Anders gezegd, doordat watermoleculen niet graag tegen een
waterafstotend oppervlak gedrukt zitten, is het gunstiger als hun plek wordt
ingenomen door de hechtende bacterie.
In Hoofdstuk 4 wordt beschreven hoe de PPFC gebruikt kan worden voor
een meer kwalitatieve benadering van adhesie, namelijk het dynamische
karakter waarmee bacteriën kunnen hechten. In dit hoofdstuk worden, voor
aanhechting van dezelfde vier S. epidermidis stammen als in Hoofdstuk 3, twee
verschillende hechtingsmechanismen beschreven: immobiel (bacteriën hechten
op een locatie op het oppervlak en blijven op die plek) en mobiel (bacteriën

Samenvatting
141
worden wel door het oppervlak aangetrokken, maar niet erg sterk, zodat de
gehechte bacteriën, als gevolg van de vloeistofstroom, over het oppervlak rollen
of glijden). Uit dit onderzoek bleek dat de water-affiniteit van het testoppervlak
een grote invloed had op het percentage bacteriën dat mobiel hecht. Op het
hydrofiele oppervlak bleek een substantieel deel van de bacteriën op een
mobiele manier te hechten, terwijl deze vorm nagenoeg niet aanwezig was op
het hydrofobe oppervlak. Geconcludeerd werd dat dit effect veroorzaakt wordt
door de zogenoemde Lewis acid-base interacties, die een maat zijn voor de
mogelijkheid van het vormen van waterstofbruggen tussen bacterie en water,
tussen oppervlak en water en tussen bacterie en oppervlak. Bij hechting aan het
hydrofiele oppervlak zijn deze interacties afstotend, waardoor de totale
aantrekkende kracht tussen bacterie en oppervlak te zwak is voor immobiele
hechting. Bij hechting aan het hydrofobe oppervlak zijn de Lewis acid-base
interacties aantrekkend, waardoor de hechting volledig immobiel is..
Tenslotte is, in Hoofdstuk 5, voor de S. epidermidis stammen op een
directe manier contacttijdafhankelijke interactiekrachten met het hydrofiele en
hydrofobe oppervlak gemeten, door gebruik te maken van AFM. Er was geen
eenduidige invloed van de water-affiniteit van het testoppervlak op de initiële
adhesiekrachten. Wel was er een invloed zichtbaar bij langere contacttijden
tussen de bacterie en het testoppervlak. Op het hydrofobe oppervlak werden de
adhesiekrachten namelijk nauwelijks sterker en ontstonden er slechts sporadisch
meer adhesiepieken in een enkele meting. Op het hydrofiele oppervlak echter,
ging het toenemen van de adhesiekracht bij langere contacttijden gepaard met
het ontstaan van meerdere adhesiepieken in een meting. Dit gedrag werd voor
alle onderzochte stammen gezien en met behulp van Poisson-analyse (een
methode uit de statistiek) kon de invloed van waterstofbrugvorming aangetoond
worden. Uit deze resultaten kon geconcludeerd worden dat op het hydrofobe
oppervlak hechting veroorzaakt wordt door het “hydrofobe effect” en dat dit
vrijwel direct plaatsvindt. Op het hydrofiele oppervlak wordt het sterker worden

Samenvatting
142
van de hechtingskracht veroorzaakt door de vorming van waterstofbruggen
tussen bacterie en oppervlak, nadat contact geforceerd is.
Tot nu toe zijn alleen parameters bepaald voor situaties waarin geen
specifieke interacties (zoals bijvoorbeeld binden van een bepaalde chemische
structuur aan een receptor van een bacterie) een rol spelen. Daarom is in
Hoofdstuk 6 onderzoek verricht naar de rol van specifieke receptoreiwitten
(bindingsplaatsen, BP’s) voor het eiwit fibronectine (Fn), zogenoemde FnBP’s,
die op Staphylococcus aureus aanwezig kunnen zijn. Het onderzoek toonde aan
dat de stam die de FnBP’s wel heeft, significant sneller en sterker aan een Fn-
coating hecht dan de stam zonder FnBP’s. In overeenstemming met deze
resultaten lieten studies met “isothermal titration calorimetry” (een manier om te
zien hoeveel warmte gepaard gaat met het binden van eiwitten aan receptoren op
bacteriën) zien dat bij deze stam de adsorptie-enthalpie van Fn hoger was dan bij
de stam zonder FnBP’s. Anders gezegd, er kwam meer warmte vrij als het eiwit
bindt met de bacterie die wel FnBP’s heeft. Tevens zijn er
desorptiesnelheidscoëfficiënten bepaald. Ook nu bleek dat de initiële
desorptiesnelheidscoëfficient snel enkele ordes kleiner werd met toenemende
contacttijd tussen bacterie en het testoppervlak (in dit geval een oppervlak van
fibronectine). Bij deze experimenten werd geen verschil gevonden tussen de
stam met FnBP’s en de stam zonder. Dat de bindingssterkte tussen bacterie en
oppervlak snel toeneemt, werd vervolgens met AFM bevestigd. Om te zien hoe
groot de rol van de FnBP’s op de gevonden parameters is, werd albumine (een
eiwit uit bloed) gebruikt om de specifieke interacties te blokkeren. Nadat óf de
Fn-coating, óf de bacteriën tijdens hun groei blootgesteld waren aan albumine,
bleek dat de adhesie van de stammen aan de oppervlakken sterk gereduceerd
werd. Dit wekte de suggestie dat het albumine niet alleen specifieke Fn-FnBP
bindingen blokkeert, maar ook de non-specifieke aantrekking onderdrukt omdat
ook de adhesie van de stam zonder FnBP’s gereduceerd was. Echter, na
blootstelling aan albumine lieten calorimetriemetingen zien dat er weinig effect

Samenvatting
143
was op de adsorptie-enthalpie van Fn aan bacteriën en ook AFM-krachten en
desorptiesnelheidscoëfficiënten waren nauwelijks verschillend.
Uit deze studies zijn twee belangrijke conclusies getrokken. De eerste is
dat AFM en calorimetrie in staat zijn om metingen te doen waarbij FnBP’s
betrokken zijn die wat dieper in de celwand liggen. Hierdoor is met deze
technieken geen verschil gevonden tussen de twee verschillende stammen
wanneer de specifieke interacties geblokkeerd werden door albumine. De
tweede conclusie is dat de desorptiesnelheidscoëfficiënt in deze gevallen
bepaald werd door bacteriën die op een non-specifieke manier gehecht waren.
Doordat bacteriën in de PPFC een milde landing op het testoppervlak hebben,
spelen de dieper gelegen receptoren in deze techniek geen rol en blijft de
desorptiesnelheidscoëfficiënt onafhankelijk van FnBP’s.
In de algemene discussie van dit proefschrift, Hoofdstuk 7, wordt
opgemerkt dat een directe correlatie tussen de adhesieparameters zoals bepaald
in de PPFC en met AFM bemoeilijkt wordt door de verschillende principes van
beide experimentele technieken. Metingen met de PPFC benaderen een
natuurlijke situatie het beste en geven daarom een goede indicatie voor
bacteriële adhesie zoals die plaatsvindt in een natuurlijke omgeving. Studies met
de PPFC laten zien dat waterstofbrugvorming tussen het oppervlak en het
omringende water een belangrijk mechanisme is in bacteriële adhesie en leiden
tot de conclusie dat hechting van bacteriën aan een hydrofoob oppervlak
gunstiger is. In experimenten met de AFM worden krachten bepaald die over het
algemeen in de praktijk niet bereikt worden. Dit komt doordat contact tussen de
bacterie en het oppervlak geforceerd wordt. Ook in deze techniek bleek
waterstofbrugvorming een belangrijk mechanisme voor adhesie. Echter, nu zijn
het de waterstofbruggen die direct tussen bacterie en oppervlak gevormd
worden. In tegenstelling tot studies met de PPFC, wordt met AFM
geconcludeerd dat bacteriële hechting aan het hydrofiele oppervlak gunstiger is.

Samenvatting
144
Een belangrijke conclusie van dit promotie-onderzoek is dan ook, dat
onderzoekers voorzichtig moeten zijn bij het gebruik van AFM om te bewijzen
dat de microbiële interacties op het ene oppervlak gunstiger zijn dan op het
andere oppervlak. Echter, uit beide experimentele technieken kan geconcludeerd
worden dat waterstofbrugvorming een belangrijk mechanisme in bacteriële
hechting aan oppervlakken is.

DANKWOORD
“So long, and thanks for all the fish” (Douglas Adams)

Dankwoord
146
Een promotie onderzoek is een onderneming die eigenlijk te omvangrijk is voor
één persoon. Hoewel ik, om te beginnen iedereen wil bedanken die op enige
wijze betrokken is geweest bij, en mij gesteund heeft in mijn promotie
onderzoek, wil ik de volgende mensen met name bedanken:
Allereerst mijn promotoren, prof. dr. ir. H.J. Busscher, prof dr. ir. W. Norde en
prof. dr. H.C. van der Mei. In veel dankwoorden wordt de “tandem” Henk &
Henny veelvuldig geroemd voor hun samenwerking (terecht overigens). Ik ben
blij hieraan toe te kunnen voegen, dat met Willem op de bagagedrager, jullie
voor mij een nog beter team zijn gebleken. Beste Henk, Willem en Henny, ik
heb in de afgelopen vier jaar veel van jullie geleerd. Bedankt voor de
mogelijkheid met jullie mee te fietsen, voor jullie inzet, input, vertrouwen,
kritische blik, goede gesprekken en nog veel meer.
Prof. dr. Y. Ren, prof. dr. ir. M. Cohen-Stuart en prof. dr. ir. M. van Loosdrecht
wil ik danken voor het beoordelen van het manuscript.
Hans Kaper en Joop de Vries wil ik bedanken voor hun hulp bij het praktische
werk. Zonder jullie waren de hoofdstukken 3 tot en met 6 niet mogelijk geweest.
Joop, heel veel dank voor al je geduld als ik weer eens aankwam met “Joop, de
AFM doet weer raar. Kun je even kijken?”. En ook voor je hulp bij de omslag
en het drukklaar maken van dit boekje.
Verder wil ik mijn kamergenoten, Astrid, Marco en Reza bedanken voor hun
gezelligheid en nodige afleiding. Daarbij heb ik erg veel gehad aan de
inhoudelijke discussies met jullie. In dit rijtje mag Pit, als “halve kamergenoot”
niet ontbreken. Na jouw promotie was het erg lastig weer iemand te vinden die
ik net zo leuk kon plagen (dat is me dan ook niet echt gelukt..). Bedankt voor je
gezelligheid en je goed getimede peptalk op de fiets!

Dankwoord
147
De “dames op het lab” wil ik bedanken voor de gesprekken tijdens het zoveelste
(flow) experiment. Op het lab staan met jullie maakt het experimentele werk
zoveel leuker! En Minie, gedeelde smart is inderdaad halve smart.
Beste Ina en Ellen, bedankt voor alle klusjes die jullie me uit handen hebben
genomen. Ellen, heel erg bedankt dat je mij veel frustratie hebt bespaard, door je
hulp met de lay-out van dit proefschrift.
Geen afdeling is compleet zonder goede koffie- en lunch- en andere pauzes.
Daarom wil ik iedereen van de disciplinegroep BME bedanken voor de
gezelligheid en de zo belangrijke “loze gesprekken” tijdens deze “kwartiertjes”.
Met name René, Daniëlle, Annet, Debbie, Theerthankar, Adam, Prashant en ook
Guru, Mihaela, Isa en Roelien, dank jullie wel voor de interessante en leuke
gesprekken. Debbie, ik ga de ziekenhuisdiners écht missen.
Beste Cynthia, Igor, Kalle, Laura en Anika. Zonder jullie steun en begrip tijdens
dit project had ik het echt veel zwaarder gehad. Vanaf nu komt er weer meer tijd
om leuke dingen te gaan doen. Beloofd!
Laura, dankjewel voor het zetje dat je me gegeven hebt toen ik bij jou mijn
afstudeeronderzoek deed. Jij bent echt een sturende factor geweest om zelf ook
een promotie onderzoek te gaan doen.
Hetzelfde geldt voor jou Anika, daarom vind ik het des te leuker dat we niet
alleen onze studie “samen” hebben gedaan, maar dat je ook mijn paranimf wil
zijn. Bedankt voor alle hulp rondom het proefschrift.
Dankwoord
148
Beste Eefje, jij was juist een sturende factor tijdens mijn promotie onderzoek. Je
had altijd tijd om me te helpen op het lab of om mij even de kans te geven stoom
af te blazen. Erg leuk dat ook jij mijn paranimf wil zijn. Bedankt voor alles!
Als laatste mijn directe familie. Beste Jarno, Linda en Maarten, bedankt voor
jullie begrip en hulp tijdens mijn promotie onderzoek. Jullie aanwezigheid thuis
hebben mijn Groningse start makkelijker gemaakt en mede daardoor gezorgd
voor een mooi eindresultaat. Ik kan jullie daar niet genoeg voor bedanken.
Zonder de niet aflatende steun en het vertrouwen van mijn ouders waren de
afgelopen jaren heel anders verlopen. Pa, ik geloof dat het wel eerlijk is om te
zeggen dat we allebei een roerige vier jaar achter de rug hebben. Ik ben blij dat
alles goed is gekomen en dat je mij ondanks alles hebt geholpen waar en
wanneer ik het nodig had. Moeders, ook jij bedankt voor alles dat je in de
afgelopen jaren voor me gedaan hebt. Door al die kleine dingen die je mij uit
handen hebt genomen, kon ik me veel beter op mijn onderzoek richten.
Dit alles was echter nooit tot stand gekomen zonder de stimulerende woorden
van mijn “tweede moeder”. Helaas heeft zij nooit van dit avontuur geweten,
maar ik weet zeker dat mijn oma dit geweldig mooi zou vinden. Aan haar is dit
werk dan ook opgedragen.
Allemaal bedankt voor vier onvergetelijke jaren.

Dankwoord
149

Curriculum vitae
150
Niels Peter Boks was born on the 3rd of April 1979 in Apeldoorn, The Netherlands. He
graduated from University Preparatory Education (VWO) in 1997 at the Christelijk Lyceum
in Apeldoorn. In that same year he started his university training in Chemical Engineering at
the faculty of Science and Technology of the University of Twente in Enschede. Specializing
in biomedical materials science, he graduated in the department of Polymer Chemistry and
Biomaterials (lead by prof. J. Feijen). From September 2004 to August 2008, he was
employed as a PhD-student at the department of BioMedical Engineering (lead by prof. H.J.
Busscher) of the University of Groningen / University Medical Center Groningen. The
research performed in that period is described in this dissertation.
List of publications:
N.P. Boks, W. Norde, H.C. van der Mei & H.J. Busscher, 2008. Forces involved in bacterial adhesion to hydrophilic and hydrophobic surfaces. Microbiology 154, 3122-3133. N.P. Boks, H.J. Kaper, W. Norde, H.J. Busscher, H.C. van der Mei, 2008. Residence time dependent desorption of Staphylococcus epidermidis from hydrophobic and hydrophilic substrata. Colloids and Surfaces B: Biointerfaces 67, 276-278. N.P. Boks, H.J. Busscher, H.C. van der Mei & W. Norde, 2008. Bond-strengthening in staphylococcal adhesion to hydrophilic and hydrophobic surfaces using AFM. Langmuir 24, 12990-12994. N.P. Boks, H.J. Kaper, W. Norde, H.C. van der Mei & H.J. Busscher, 2008. Mobile and immobile adhesion of staphylococcal strains to hydrophilic and hydrophobic surfaces. J Colloid Interf Sci (in press). C.-P. Xu, N.P. Boks, J. de Vries, H.J. Kaper, W. Norde, H.J. Busscher & H.C. van der Mei, 2008. Fibronectin interactions with Staphylococcus aureus with and without fibronectin-binding proteins and their role in adhesion and desorption. Appl Environ Microb (in press). A. Roosjen, N.P. Boks, H.C. van der Mei, H.J. Busscher & W. Norde, 2005. Influence of shear on microbial adhesion to PEO-brushes and glass by convective-diffusion and sedimentation in a parallel plate flow chamber. Colloid Surface B 46, 1-6. *
L. Buttafoco, N.P. Boks, P. Engbers-Buijtenhuijs, D.W. Grijpma, A.A. Poot, P.J. Dijkstra, I. Vermes & J. Feijen, 2006. Porous hybrid structures based on P(DLLA-co-TMC) and collagen for tissue engineering of small-diameter blood vessels, J Biomed Mater Res B Appl Biomater 79, 425-434. * * These publications are not the result of the research described in this dissertation.

Dankwoord
151

Curriculum vitae
152