analysis of the housing market developments and the
TRANSCRIPT

DP/103/2017
Analysis of the HousingMarket Developments
and the Underlying Macroeconomic Fundamentals in Bulgaria
Petra KotsevaMihail Yanchev

DP/103/2017
January 2017
Analysis of the Housing Market Developments
and the Underlying Macroeconomic Fundamentals in Bulgaria
Petra KotsevaMihail Yanchev
BULGARIANNATIONAL
BANK
DISCUSSION PAPERS

2
DP
/103
/201
7
© Petra Kotseva, Mihail Yanchev, 2017© Bulgarian National Bank, series, 2017
ISBN 978-954-8579-92-6 (print) ISBN 978-954-8579-93-3 (pdf)
Views expressed in the paper are those of the authors and do not necessarily reflect the BNB policy.
Responsibility for the non-conformities, errors and misstatements in this publication lies entirely with the authors.
Send your comments and opinions to:Publications BoardBulgarian National Banke–mail: [email protected]: www.bnb.bg
DISCUSSION PAPERSBulgarian National Bank Publications Council:
Chairman:Kalin Hristov, Deputy Governor and Member of the BNB Governing Council
Vice Chairman:Mariella Nenova, Ass. Prof., Ph. D.
Members:Andrey Vassilev, Ph. D.Boryana Pencheva, Member of the BNB Governing Council, Ph. D. Daniela Minkova, Ph. D.Ivaylo Nikolov, Ph. D.Lena Roussenova, Member of the BNB Governing Council, Ass. Prof., Ph. D.
Secretary: Lyudmila Dimova
Assistant Secretary: Christo Yanovsky

3
DIS
CU
SS
ION
PA
PE
RS
Contents
1. Introduction .......................................................................................5
2. Concepts of Housing Market Bubbles and Approaches to Estimation of Overvaluation .......................................................7
3. Construction and Housing Market in Bulgaria ....................... 103.1. Demand Side Factors ................................................................. 14
3.2. Supply Side Factors .................................................................... 23
3.3. Preliminary Conclusions ............................................................ 32
4. Data and Methodology for Estimation of Overvaluation ...... 33
5. Results ......................................................................................................... 35
6. Conclusions ..................................................................................... 38
References ........................................................................................... 40
Appendix .............................................................................................. 42A1. Reconstructed Data on Interest Rates and Loans ................ 42
A2. Population ..................................................................................... 45
A3. Hypothetical Borrowing Value ................................................. 46
A4. The Model ..................................................................................... 49

4
DP
/103
/201
7AbstrAct:The current paper aims to identify the main factors driving housing prices in Bulgaria in the last decade and formulate a model that would help determine whether housing prices were in line with the fundamental macroeconomic factors of supply and demand and if not measure and evaluate the magnitude and persistence of the misalignments. Our econometric methodology is a vector error correction model that exploits a cointegration relationship between the variables and is designed to deal with the dynamic fluctuations of housing prices around their long-run trend. Our results show that the dynamics in the housing market in the last decade were caused by objective factors driving the demand and consecutively the supply of housing. On the other hand the accumulation of a housing market bubble driven by subjective factors has started just few quarters prior the crises. The correction of house prices during the global crisis was also sufficient and at present property prices are in accordance with income, interest rates and foreign demand dynamics.
JEL cLAssificAtion: E32, L74, P22, P23, R31
Keywords: Housing Prices, Housing Prices Misalignment, Hypothetical Borrowing Value, Bubble, Real Estate, VECM, Cointegration, Bulgaria, Formerly Centrally Planned Economies
Petra Kotseva, Economic Research and Forecasting Directorate, Bulgarian National Bank, [email protected] Mihail Yanchev, Economic Research and Forecasting Directorate, Bulgarian National Bank (worked in the period 2012–2015), [email protected]
AcknowLEdgmEnt:We thank our colleagues from the Economic Research and Forecasting Directorate for the support and helpful discussions and especially Daniel Kasabov for his overall contribution to this paper. Views expressed in this material are those of the authors and do not necessarily reflect Bulgarian National Bank policy.
5
DIS
CU
SS
ION
PA
PE
RS
1. IntroductionLike most countries across Europe and all new European Union member states (NMS), in the period before the 2008 – 2009 global crisis Bulgaria experienced a strong growth in construction activity, real estate related activity and housing and land prices. Angello and Schuknecht (2009), Min Zhu (2014), among many, agree that the integration of the global financial markets were the main driver of housing market developments across the world and that these unprecedented, temporary spikes in housing prices observed in many advanced and developing economies (coupled with the strong mortgage credit growth) became one of the fundamental reasons behind the global crisis. The sharp increase of construction activity and house prices prior to the 2008 – 2009 global crisis and the significant correction in the following years demonstrated the unsustainability of the observed dynamics in the housing market in the boom years. Indications for slight revival of the sector at the end of 2013 and the beginning of 2014 also suggest that the bottom has already been reached and recovery in construction and housing market activity can be expected. It is imperative to understand whether the housing market was in line with fundamentals in the period before the 2008 – 2009 global crisis and determine where the current price level stands compared to its long-run path, in order to formulate appropriate expectations for the future developments. Accurate assessment of the current and future developments, on the basis of which relevant and timely policy measures can be determined is of great impor-tance, since housing market imbalances can have a significant impact on the overall macroeconomic stability.
Various factors affected housing market dynamics in the CEE countries in the period before the 2008 – 2009 global crisis. Egert and Mihaljek (2007) study the determinants of the house prices dynamics in CEE in the period from 1998 to 2005. They argue that along with the fundamental factors such as GDP per capita, real interest rates, housing credit and demographic factors important drivers in the region were also some (as they call them) transition-specific factors. Such factors, particularly relevant for Bulgaria were weak housing market institutions (housing market was fully regulated up until 1989), almost nonexistent housing finance, high level of home-ownership, limited supply of new homes, improvements in housing qual-ity (higher growth due to composition effect – the share of higher-quality and higher-priced housing increased) and house price misalignment (initial undershooting).

6
DP
/103
/201
7Both the sluggish transition of the economy and the severe domestic finan-cial crisis in 1997 in Bulgaria had a strong negative impact on the construc-tion sector and the housing market. As a consequence of the prevailing macroeconomic instability and lacking restructuring of the economy up to 1997 both the banking sector remained predominantly state-owned and underdeveloped and the interest rates were persistently high – legacy that contributed to the prolonged period of suppressed construction activity even in the years of growth acceleration. These country specific devel-opments made housing market in Bulgaria hard to fit in an international comparison and difficult to be investigated by methods that are already traditional for most advanced economies. Therefore, it is necessary to base the analysis of the housing market development in a historical context.
This paper aims to analyze the main driving factors of the housing market and determine whether housing prices were in line with the macroeco-nomic fundamentals. A detailed review of the literature is used to deter-mine a framework of concepts and definitions of a misalignment and a bubble. Furthermore, using established methods in the literature and applying them to the context of the Bulgarian housing market, an econo-metric model is constructed to measure the misalignments of the observed housing prices from the trend/level that would be suggested by the fun-damental macroeconomic factors. Understanding of the macroeconomic developments related to the housing market, which took place prior and after the 2008-2009 global crisis is essential to identify the main factors that determined housing price dynamics. Once these are pinpointed one has to evaluate the available macroeconomic indicators that would most effectively account for these fundamental factors. Traditional indicators of supply and demand for housing often suggested in the literature like GDP, household income, interest rates on mortgage lending, FDI inflows, construction activity and others are analyzed. An additional demand-side indicator (hypothetical borrowing value) is constructed for Bulgaria using a method outlined by Addison-Smyth, McQuinn and O’Reilly (2009), which is valuable from an analytical standpoint apart from its use in the context of an econometric model in this current paper. The evaluation of indicators of consumer sentiments and expectations also provide evidence whether there are periods of accumulation of a housing bubble or not, since rapid price increases alone do not provide enough evidence for the formation of a price bubble. In the end, the selection of the most relevant and informa-tive indicators is crucial for the construction of a robust economic model, as only a relatively short sample of data is available.

7
DIS
CU
SS
ION
PA
PE
RS
In the next section we summarize the main concepts in housing market literature and some of the approaches recently used for estimating market overvaluation. Then we review some of the developments in the economy which we identify as having a major impact on the housing market starting with short overview of the transition period and its legacy. The estimated model, together with a short discussion on some of the possible alterna-tive specifications is presented in section 4. In section 5 the results of the model are interpreted in the context of the observations previously made in the paper. The last section concludes.
2. Concepts of Housing Market Bubbles and Approaches to Estimation of Overvaluation
The literature on the housing market business cycle has reached an agree-ment over several facts. First, income is the main determinant of housing demand. It is either the case that richer agents can afford to spend more on housing or that higher income would relax credit constraints, which also raises the housing affordability for the particular agent (Poterba (1984), Case and Schiller (1990), Poterba (1991), Englund and Ioannides (1997)). Case and Schiller and later Englund and Ioannides use different economet-ric technique, but reach a similar finding that lagged real GDP growth and real interest rates have a high predictive power for real housing prices.
Second, housing supply is inelastic and adjusts to demand over long peri-ods of time (Glaeser and Gyourko (2007), Ortalo-Magné and Prat (2007), Glaeser, Gyourko and Saiz (2008)). It follows that the business cycle of the housing market spans over longer periods of time. In fact Kearl (1979), Poterba (1984), Topel and Rosen (1988) develop a framework where the housing market is actually presented as consisting of two separate markets: one for the existing housing stock and one for the flow of new construc-tion, which determines the level of new investment. Shocks to either of these markets can affect house prices.
Third, agents can invest in housing for speculative purposes and not only because they demand a dwelling to inhabit. That means that the desire to buy housing is strongly influenced by the expectation of reselling at higher prices in the future (Case and Shiller (1988), Case and Shiller (2004)). Moreover, such speculation is based on extrapolative expectations which are formed on the basis of past housing price movements, rather than any knowledge of fundamentals (Case and Shiller (1988)). Thus, housing price booms tend to persist as home buyers become “destabilizing speculators.”

8
DP
/103
/201
7Lastly, individuals hold heterogeneous expectations about housing prices and assessment of the situation on the housing market, meaning that people hold various beliefs about the future developments of the market. It is not possible to short-sell housing, which can be a reason for why prices are affected only by agents with positive expectations. Elaborating on the last point, it is the people with inflated expectations that make the deci-sions to buy when the slump is imminent that eventually go into foreclo-sure or are forced to sell at a loss (Case and Shiller (2004)).
With respect to the definition of an asset price bubble it is precisely that if investors base their decisions to purchase an asset on the belief that they will be compensated by a rapid further price increase in the future and not on some knowledge of fundamentals, then there is a bubble (Stiglitz (1990)). More specifically, if home-buyers decide that a home they would normally consider as too expensive is an acceptable purchase, because they will be compensated by further housing price increases, then there is a housing bubble (Case and Schiller (2004)). On the other hand home-buyers expecting a rapid price increase might decide to buy now rather than later when they will not be able to afford it. Therefore, if expectations of rapid price increases are important motivating factors for home-buyers, then “housing prices are inherently instable” (Case and Schiller (2004)).
In respect to measuring misalignments of housing prices from the long-run level suggested by the macroeconomic fundamentals, there is a broadly accepted methodology. According to Detken and Smets (2004) and Angello and Schuknecht (2009), housing prices can be compared to their long-run trends in order to define the persistence and magnitude of peri-ods of housing overvaluation or undervaluation. Defining boom and bust phases can be done by identifying the periods when housing prices are respectively above or below their long-run trend. Detken and Smets define a “boom cycle” as a period during which asset prices are 10% above their trend. That threshold, however, seems quite arbitrarily chosen and seems to fit the case of the US housing market. According to Angello and Schukne-cht (2009) it is not only the magnitude of an overpricing that matters in analyzing real or financial asset prices. If housing prices are overpriced for a longer period of time, consumers and investors may adjust their expec-tations upwards, which would have an effect on domestic demand and demand for credit as well. Therefore, persistence is as important as the actual magnitude, since people’s expectations can fuel the continuation of a boom period and in effect produce a deeper bust.
The methodology of Angello and Schuknecht (2009) is also followed by the European Commission (2012) in their “housing imbalance toolkit.”
9
DIS
CU
SS
ION
PA
PE
RS
Additionally, in their article on “Assessing the dynamics of house prices in the euro area” (2012) it is pointed out that house price cycle analy-sis can be supplemented with affordability and dividends ratios such as respectively price-to-income and price-to-rent ratios. Housing price booms should be analyzed in the context of affordability pressures for the home-buyers. An increase in households’ real disposable income can potentially accommodate rising house prices due to demand pressures and a slower reaction of the supply. On the other hand, prolonged and rapid increases in the price-to-income ratio or even deviations from its long-term average could be interpreted as a sign of overvaluation. Housing price dynamics can also be assessed against the cost of renting. Looking at housing as any other asset, house price changes are expected to be driven by changes in expected capital gains or in income from future housing services (income from renting). In equilibrium, agents should be indifferent between buying/selling and renting. Thus, the dynamics in the price-to-rental ratio could be interpreted as a sign of overheating or cooling, respectively when the ratio is higher or it is lower. In “normal times” the higher the ratio goes, the more potential buyers would chose to rent rather than buy, which should exert downward pressure on prices and vice versa.
However, as pointed out by the European Comission (2012), comparing house prices or other derived indicators to their long-run averages or assuming that their fundamental value is their historical average can bias the analysis, since it makes the simplifying assumption that the series are stationary. Therefore it is more appropriate to use other methods to derive equilibrium values of housing prices that are based on fundamental fac-tors. In a VAR/VECM framework one can simulate the dynamic interplay between housing prices and other factors on the demand and supply side.
Gattini and Hiebert (2010) use a VECM to model for purpose of forecasting and analyzing euro area house prices and their interplay with the macro-economic indicators. To arrive at an equilibrium level of Euro Area housing prices they use both demand and supply side factors as their explanatory variables: housing investment, real disposable income per capita and a mixed maturity measure of the real interest rate. Their results suggest that housing demand and financing cost shocks appear to have contributed strongly to the dynamics of euro area house prices.
In another paper Addison-Smyth, McQuinn and O’Reilly (2009) apply a model of mortgage credit and examine the relationship between Irish house prices and changes in lending patterns. In their model they use fundamental factors as mortgage credit, income, interest rates and hous-ing stock. Their results suggest that post 2003 a significant amount of the

10
DP
/103
/201
7increase in Irish housing prices was determined by developments in interna-tional finance, which enabled Irish institutions, in particular, to secure alter-native sources of lending funds. A useful contribution of their paper is an indicator they construct (hypothetical borrowing volume), which represents in a more realistic way the role of the interest rates on the agent’s behavior and in particular on the amount an individual can borrow. They formulate the indicator as the present value of an annuity, where the annuity is a given fraction of the current disposable income discounted at the current mortgage interest rate for a horizon equal to the term of the mortgage.
3. Construction and Housing Market in Bulgaria The housing stock and respectively the supply of housing evolve slowly over time given the long life of housing and the small additions to the housing stock and thus the current housing market situation is significantly affected by the economic developments decades ago. Due to the turbu-lent period of the transition from a command to market based economy in Bulgaria the construction sector and the housing market underwent a prolonged period of depressed supply.
Construction activity in Bulgaria remained subdued until 2004 compared to the overall economic growth in Bulgaria, which started to pick up after the two consecutive domestic crises in 1991 and 1996-1997. The share of value added in the sector to the total value added in the economy is an indicative measure of the supply of construction in the economy. According to the United Nations Statistical Division data, the share of the construction sector in Bulgaria dropped from average 8.3% in 1970-1989 to 4.5% in 1991 and then further to 2.7% in 1997 (Figure 1). By the end of the 1980s, a higher share of construction in the total value added was common for most centrally planned economies in Europe, and in the beginning of the transition period there was a slump in the construction activity. However for most NMS the construction activity recovered to around 6-7% of total value added quickly after the beginning of the transition and remained at these levels until the end of the 1990s. While in most countries the share of construction in total value added approaches 6% on average in the long run, Bulgaria remains in the first quartile in the distribution of the 28 EU member states according to this indicator together with Germany and Belgium at stable levels about 5% from 2000 to 20041 (Figure 2). As opposed to Germany and Belgium, in Bulgaria the process of restructuring of the economy, the underdeveloped infrastructure and the obsolete hous-
1 Missing data for significant part of EU before 2000.

11
DIS
CU
SS
ION
PA
PE
RS
ing stock suggested outpacing growth rates in construction as it was the case in most NMS shortly after the beginning of their transition period. This prolonged period of depressed supply is one of the significant differences between the construction and housing market developments in Bulgaria and the other CEE countries.
Figure 1: Over a Longer Horizon – Share of Construction in Total Value Added in Selected CES Countries
Source: United Nations Statistical Division
Figure 2: Share of Construction in Total Value Added (%)
Source: Eurostat

12
DP
/103
/201
7The high rate of owner occupied dwellings in Bulgaria was also a legacy of the socialist regime (see Table A4 in the Appendix for Distribution of population by tenure status). In 1990 Bulgaria was among the few coun-tries in Eastern Europe, where the housing was predominantly private but the state dominated all related activities. A major part of the dwellings were state-built or cooperative and especially in urban areas2. The public sector was the largest developer of new properties and private construction was represented typically by dwellings in the rural areas constructed by their owners.
The efforts at the beginning of the transition to transform the housing sector from state domination into a free market included legislation changes. The housing market deregulation of 1990 eliminated the involvement of the state or municipal authorities in the market operations. A change in the Property Law allowed each citizen in Bulgaria to possess unlimited amount of real estate. Another inevitable step in the process of transformation was the halt in public investment in dwellings which was driven by shortage of financing which imposed significant government budget expenditure cuts.
The economic crisis, the lack of housing finance and the withdrawal of the state from the development of housing led up to a collapse of resi-dential construction which was common for Eastern Europe (Palacin and Shelburne 2005). In Bulgaria the number of newly built dwellings declined continually from around 65 000 in 1985 and 26 000 in 1990 to less than 7 000 in 1995 (NSI Statistical Yearbook 1985, 1990, 1995).
The development of a functioning real estate market in Bulgaria began well after the deregulation of the economy and much later than in the other CEE countries. Factors for the delay were the low income of house-holds and the lack of a developed banking sector, which was associated with high cost of financing in both relative and absolute terms. Despite the highly worn-out housing stock and the deficient infrastructure in the beginning of the 2000s it wasn’t until 2004 that the share of construction started to rise from its level of about 5% of total value added. By that time the outstanding amounts of loans for house purchases had been growing with rates over 100% from initially very low levels while the interest rates were following a steady downward trend at the background of sustained macroeconomic stability.
2 According to the NSI Statistical Yearbook 1985, 56% of the newly build homes in 1975 were state-build, 26% - co-operative housing and 18% - privately build. In 1985 these shares are respectively 46%, 26% and 28%.

13
DIS
CU
SS
ION
PA
PE
RS
Figure 3: House Prices(%)
Figure 4: House Prices, Annual Growth Rate(%)
Thus, although somewhat later, Bulgaria joined the general trend in CEE countries of revival of the property market, with a sharp increase in con-struction activity and rapidly growing housing prices in the period before the 2008 – 2009 global crisis. Only in two years (2004-2005) house prices doubled and in 2007-2008 grew by another 50%.
In what follows we aim at identifying the possible demand and supply factors driving house prices. Additionally, we try to summarize the main changes which have occurred in 2009 due to the global crisis. A remark-able deceleration in prices in 2006 also attracts attention. For this reason

14
DP
/103
/201
7we separate the housing boom in the period before the 2008 – 2009 global crisis into two phases covering periods with annual growth rates exceeding an arbitrarily chosen threshold of 15% (see Figure 4). The first phase spans between 2003 and end 2005 when prices start growing from very low levels and reach annual growth of 50% and a second phase of growth between the end of 2006 and the end of 2008 with a slightly weaker magnitude.
3.1. Demand Side Factors
The growth in disposable income and the fast development of the banking sector, which was associated with an improved access to credit and the decline in interest rates, increased the demand for housing. Disposable income of households was growing at a high rate and often at double digit rates in the period before the 2008 – 2009 global crisis. The main contribution to the growth of disposable income came from the growth in compensations of employees. Government transfers to the households and the current transfers to the private sector are the other components of disposable income which have a significant contribution to its growth in the period before the 2008 – 2009 global crisis.
Figure 5: Households Real Disposable Income, Annual Growth Rate (Private Consumption Deflated) (%)
Mortgage interest rates, were well above 15% in the beginning of 2001 and fell down to below 7% on average in 2006. They were generally fol-lowing the dynamics of international interest rates as of during the period before the 2008 – 2009 global crisis, and were strongly influenced by the increased access to foreign financing and the expansion of the financial sector. Together with the high growth of all claims on non-financial cor-

15
DIS
CU
SS
ION
PA
PE
RS
porations and households, mortgage credit volumes also started to rise rapidly in 2003 and 2004. In response, the BNB implemented a number of counter-cyclical measures3 to moderate and stabilize the rate of growth of private sector credit to levels sustainable for the medium run and not threatening the financial stability. From the beginning of 2005, implicit credit ceilings were introduced for banks where the growth rate of credit exceeded a certain limit. The banks which violated the limit had to maintain additional minimum required reserves. Thus, lending was made more costly for the banks where credit growth was exceeding the limit. Moreover, from the beginning of 2006 (but in effect from May 2006) BNB introduced a progressive scale for determining additional required reserves. Special attention was paid to the rapid expansion of mortgage credit and particular measures in this respect were seen as necessary. Such a measure was a change in the risk weights of mortgage loans, which were to be used in calculating the bank’s capital adequacy ratio. In the second half of 2006 the BNB gradually lifted all these administrative measures. Although the exact effect of these measures is hard to be determined, a stabilization of mortgage credit growth in the end of 2005 and the beginning of 2006 is visible, which corresponds with BNB’s objectives. Thus, these measures could have affected the demand for housing through retention of the amount of the credit supply.
Figure 6: Interest Rate on New Housing Loans (Reconstructed)(%)
3 For detailed information on the counter-cyclical measures of the BNB see BNB Annual Reports 2004 – 2006.

16
DP
/103
/201
7Figure 7: Housing Credit Volume as a Share of GDP
Note: Information about the reconstructed series is provided in the Appendix.
Figure 8: Interest Rates and Growth in New Credit for Housing
The access to financing and in particular the supply of credit and the inter-est rates are important determining factors for housing demand. However, the effect of interest rates comes through its influence upon the amount that prospective house buyer can borrow from financial institution and thus the effects on the demand for housing can be far from linear. The typical amount of a mortgage offered by a bank is usually based on the present value of an annuity, where the annuity is a given fraction of the current dis-posable income, which is used for mortgage repayments and is discounted
(%) (%)

17
DIS
CU
SS
ION
PA
PE
RS
at the current mortgage interest rate for a horizon equal to the term of the mortgage. Following the example of Addison-Smyth, McQuinn and O’Reily (2009) we construct a hypothetical borrowing volume indicator Bt :
Bt= kYt
1–(1+Rt)–τ
Rt
where Yt is the nominal GDP as an approximation of the current disposable income of households, k is the fraction of that income that goes towards repayments of the mortgage, Rt is the current mortgage interest rate and τ is the duration of the mortgage.4 Constructed in this way this indica-tor should better resemble the considerations of consumers who want to purchase a home. Additionally we can decompose the growth of the hypo-thetical borrowing volume indicator into growth of income and change in interest rates. The overall indicator increased rapidly in the period before the 2008 – 2009 global crisis with steady contribution on the side of the income and more pronounced acceleration during the first phase, driven by the decline in mortgage interest rates. The growth in hypothetical bor-rowing volume notably decelerated starting from the end of the first phase and came to a halt in the beginning of the second when interest rates discontinued their decline.
Figure 9: Hypothetical Borrowing Volume(%)
4 More information about the construction of the indicator is provided in the Appendix.
%

18
DP
/103
/201
7The increase in income and in the amount that can possibly be bor-rowed made real estate more affordable for households prior to the first phase of house prices acceleration as the ratios of GDP to house prices and hypothetical borrowing volume to house prices indicates (see Figure 10). Although incomes increased and interest rates decreased during the housing price boom, house prices growth outpaced the growth in GDP and hypothetical borrowing volume and affordability deteriorated steeply during the first phase of the housing price boom and remained low throughout the second phase as well.
Figure 10: Affordability(index 2005=100)
An important factor affecting all aspects of the economic development in the period before the 2008 – 2009 global crisis was the high foreign capi-tal inflow into the country. The housing market in particular was affected through various channels. The supply of new housing was boosted through foreign direct investment in construction and real estate activities and in the banking sector, increasing the access for credit for non-financial cor-porations. The FDI in the banking sector had an effect on the demand side through the mortgage lending channel but probably the major effect of FDI on the housing market was the indirect one through the overall increase in income at that time. However, purchases of real estates by foreigners had direct effect on house prices. As a preferred tourist destination for many Europeans and with its relatively low housing prices, Bulgaria attracted large FDI inflows in real estates since 2004. The FDI inflows increased as percent of GDP after the initial rise in housing prices and the beginning of

19
DIS
CU
SS
ION
PA
PE
RS
the construction boom, when the quality of the housing stock was quickly improving.
Figure 11: FDI Inflows by Sectors as % Value Added in the Sector
FDI and New Housing Credit, EUR mln.
Consumer sentiment in the period before the 2008 – 2009 global crisis seemed to be in line with the fundamentals at least during the first phase. Their expectations for the financial situation were broadly consistent with the dynamics of the disposable income. Intent of households to purchase or build a home in the following year was upward sloping during that period which corresponds to a gradually increasing demand for dwellings.

20
DP
/103
/201
7According to this indicator, the peak in demand was in the middle of 2007, which roughly coincides with the peak in the growth of housing prices. On the other hand, consumer expectations for their own financial situation and the overall economic situation in the country were on a downward trend since the middle of 2005 with the exception of an outlying peak in the middle of 2007 and did not deteriorate much further as the global crisis struck. Therefore, probably consumer sentiment was a factor during the second phase (2007 – 2008) of housing price growth and speculative demand also had a role in the housing boom as individuals bought housing not as a consumption good, but rather an investment good as the prices were steadily climbing.
Figure 12: Consumer Expectations Balance of Opinions
21
DIS
CU
SS
ION
PA
PE
RS
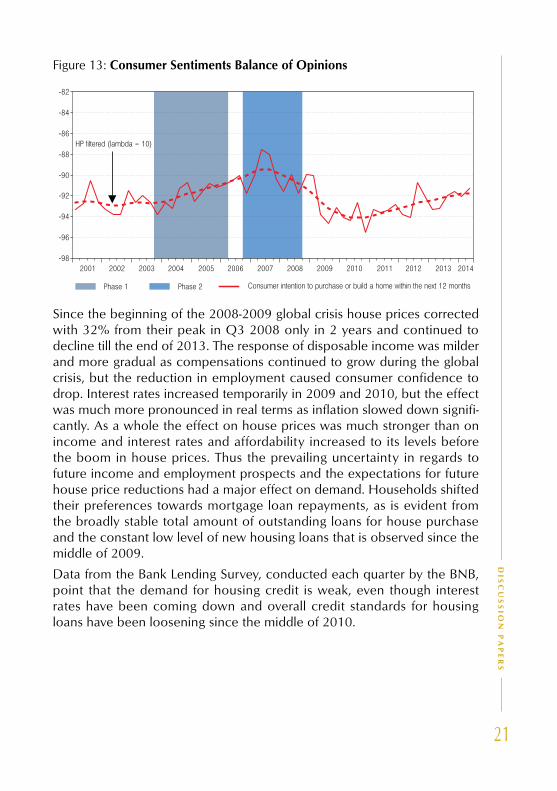
Figure 13: Consumer Sentiments Balance of Opinions
Since the beginning of the 2008-2009 global crisis house prices corrected with 32% from their peak in Q3 2008 only in 2 years and continued to decline till the end of 2013. The response of disposable income was milder and more gradual as compensations continued to grow during the global crisis, but the reduction in employment caused consumer confidence to drop. Interest rates increased temporarily in 2009 and 2010, but the effect was much more pronounced in real terms as inflation slowed down signifi-cantly. As a whole the effect on house prices was much stronger than on income and interest rates and affordability increased to its levels before the boom in house prices. Thus the prevailing uncertainty in regards to future income and employment prospects and the expectations for future house price reductions had a major effect on demand. Households shifted their preferences towards mortgage loan repayments, as is evident from the broadly stable total amount of outstanding loans for house purchase and the constant low level of new housing loans that is observed since the middle of 2009.
Data from the Bank Lending Survey, conducted each quarter by the BNB, point that the demand for housing credit is weak, even though interest rates have been coming down and overall credit standards for housing loans have been loosening since the middle of 2010.

22
DP
/103
/201
7Figure 14: Change in Demand for Housing Loans(net percentage)
Source: BNB, Bank Lending Survey
Change in Credit Standards as Applied to the Approval of Housing Loans(net percentage)
Source: BNB, Bank Lending Survey
Note: Net percentage balances are calculated by weighting together the responses of those banks who answered the question. The bars show the responses over the previous quar-ter. The lines show the expectations over the next quarter. Expectations balances have been moved forward one quarter to be compared with the actual outturns in the following quarter. A positive balance indicates that more secured credit is available.
However, Registry Agency data show a slight upward trend in the number of registered sales of properties since 2010, which is a sign of weak, but strengthening demand, not necessarily financed through mortgage loans.

23
DIS
CU
SS
ION
PA
PE
RS
Figure 15: Number of Registered Sales of Properties, Seasonally Adjusted Data
Source: Bulgarian Registry Agency
3.2. Supply Side Factors
With respect to the supply of housing, limited data availability forced us to gather information from a broad range of indicators. Due to a short sample for the housing stock we analyze short term statistics on construction pro-duction, national accounts data on value added in construction and data on residential investment that provide some broad measures of supply and show how it reacted to demand. Firm side indicators like profits and costs shed more light on the misalignment between supply and demand. On the other hand, information from business climate surveys in construction provides insight about how expectations and sentiments of firms’ managers as well as competition between firms in the sector evolved throughout the analyzed period.
There are two separate estimations of the housing stock from the 2001 and the 2011 census. However, they were declared unreliable by the National Statistical Institute itself in an ex-post evaluation of the last census. The data for the housing stock available on an annual frequency since 2004, shows that both the number and useful floor space of dwellings increased gradually until 2010. An abrupt jump in the data follows in 2011 when data was most probably corrected with additional information from the national census. The overall increase of housing stock in 2010 compared with 2004 is 2.7% in numbers of dwellings and 3.3% in useful floor space. Newly built dwellings data show gradual decrease from 2010 on in number of dwellings and from 2009 on in useful floor space, which corresponds

24
DP
/103
/201
7with the decrease in newly issued permits5 for residential buildings starting from 2008.
Figure 16: Housing Stock(number of dwellings)
Housing Stock(useful floor space)
5 A building permit is an authorization to start work on a building project, and as such is the final stage of authorization prior to the start of work. The objective of building permits indices is to assess the development of construction activity. Source: NSI

25
DIS
CU
SS
ION
PA
PE
RS
Newly Built Dwellings Completed(number of dwellings)
Newly Built Dwellings Completed (useful floor space)

26
DP
/103
/201
7Figure 17: Newly Issued Permits for Residential Buildings(number of dwellings)
Newly Issued Permits for Residential Buildings(useful floor space in dwellings)
Another indirect indicator for the supply of housing is the data for cosn-truction activity from the short term business statistics and the national accounts (Figure 18). This construction production index covers both con-struction of residential buildings and civil engineering. According to this indicator, supply of new buildings maintans constant growth rates in the period before the 2008 – 2009 global crisis. However, National Accounts data (which also takes into account civil engineering) shows acceleration in supply from the end of the first phase on. We considered also a more imperfect measure of housing supply, by constructing quarterly series for residential investment from the final use method of the national accounts

27
DIS
CU
SS
ION
PA
PE
RS
through interpolation of annual data. In general, data confirms that supply of housing reacts with a lag to changes in demand and price dynamics are leading for the supply. Nevertheless, in between the two phases a feedback effect possibly had a downward pressure on prices. On the other hand, it is worth noting that the construction production index started declining about a year earlier, around Q1 2009, compared to the other two supply-side indicators, which points out that the short-term statistics are leading the national accounts data.
Figure 18: Construction Production and Housing Investment(%)
As supply was not able to react as quickly on the rise in demand, profit-ability in the construction sector increased and the value added deflator for construction was outpacing both the value added deflator for the whole economy and the construction cost index. The latter encompasses both expenditures on labour and input materials and in the period before the 2008 – 2009 global crisis commoves together with the total economy deflator.

28
DP
/103
/201
7Figure 19: Value Added Deflator and Construction Cost, (index 2005=100)
Decomposing the annual growth rate of the value added deflator in con-struction into unit labor costs, unit profit and unit (net) tax reveals that the misalignment between supply and demand was quite significant during the first phase of the housing price boom. It is evident that the strong growth of the value added deflator in construction was due to the high contribu-tion of the unit profit component rather than the unit labor cost. The latter was more aligned to the one observed for the whole economy, while the former points out to an excess demand. This misalignment is much more pronounced in the first phase of the housing boom, but persists until the beginning of 2009.

29
DIS
CU
SS
ION
PA
PE
RS
Figure 20: Contribution to Value Added Deflator Annual Growth HP Filtered (Lambda=10)
Unit Labour Cost(p.p.)
Unit Profit(p.p.)
Moreover, as profit margins in the sector increased relative to the ones for the whole economy, managers of surveyed construction firms pointed that higher competition is a significant factor limiting the business activ-ity. According to this indicator, competition in the sector increases when growth rate of profitability in the sector accelerates above the average for the economy levels.

30
DP
/103
/201
7Figure 21: Profitability and Competition in Construction(p.p.)
Lastly, it is important to point out that during the second phase of the hous-ing boom, up until the beginning of the global crisis, the business activity surveys for the firms in construction show overly optimistic expectations about the future business activity and housing prices. This leads to the conclusion that expectations of economic agents both on the demand and supply side were an important factor for the second phase of the housing boom and much less so for the first phase. Therefore, it is plausible to speak of a housing bubble, since the decisions of firms were based on unrealistic expectations that the housing boom will continue indefinitely, despite the fact that in 2008 profit margins were already quickly shrinking and mortgage interest rates were starting to go up. Some of these expecta-tions might have been based on the assumption that the global crisis would not affect Bulgaria as much as other EU member states, but they were proven wrong as decline in external demand and a deceleration in capital inflows quickly followed the collapse of Lehman Brothers in September 2008 and domestic economic activity declined as well.

31
DIS
CU
SS
ION
PA
PE
RS
Figure 22: Expectations of Firms in Construction
The business climate expectations play an important role in the formation of housing market trends. Since the outbreak of the global crisis, there is a pronounced downward shift in the overall confidence indicator of the construction sector with a weak trend of improvement since the second The business climate expectations play an important role in the formation of housing market trends. Since the outbreak of the global crisis, there is a pronounced downward shift in the overall confidence indicator of the construction sector with a weak trend of improvement since the second quarter of 2012. Price expectations over the next 3 months have remained stable in 2013 pointing to an expected slight decrease in prices. Building activity in construction sector was assessed by managers as continuing to decline, though at a decelerating rate.
Since the beginning of 2011, the number of issued building permits has stabilized on a low level, after a period of decline between the end of 2007 and the end of 2010. Newly completed residential buildings experienced a slight recovery in the course of 2011, but continued falling on an annual basis since Q1 2012. The construction production index generally follows with a lag the building permits dynamics and has been declining on an annual basis since end-2008 until present, with the exception of a tem-porary stabilization in 2012. These developments point out to a stagnant supply.
Profits in construction also corrected downward after the beginning of 2009. The decline in the value added deflator for the construction sector during the 2008 – 2009 global crisis was higher than for the total economy.

32
DP
/103
/201
7Firms in the sector maintained lower increase in labor costs through larger reduction in employment and decreased significantly the gross operating surplus. The number of firms in the sector had decreased by 20% from 2009 to 2013 according to preliminary data from the structural business statistics. In this period value added declined by 31% in current prices and 22% in constant prices. Reduction in employment started even a year earlier and from 2008 to 2013 40% of employed were dismissed.
3.3. Preliminary Conclusions
Several conclusions can be drawn on the basis of the gathered data. During the first phase the increase in income and reduction in interest rates stimu-lated demand for housing; the high demand in turn, combined with the insufficient supply (before the first phase) allowed firms to increase sig-nificantly their profit margins. Most likely, the slowdown in property price growth in 2006 cannot be attributed to factors on the side of domestic or external demand, but rather to the dynamics of credit supply, mortgage interest rates and housing supply. During the second phase of the boom external demand for real estate (FDI) also had a significant effect on prices. An improvement in expectations was observed during the second phase, pointing to possible subjective factors pushing house prices above their fundamental values and causing a bubble on the real estate market.
With the outbreak of the global crisis house prices corrected rapidly under the declining demand, driven by households’ sentiments and the halt in external demand. On the supply side, the continuation of on-going projects postponed the decline in production for several quarters, but firms started to limit labour costs and observe a decline in profit margins in 2008 with the deterioration in confidence in the sector.
As of 2014 the weak real economic growth, the high level of unemploy-ment and the uncertainty in regards to future income can be viewed as some of the major demand-side factors for the continuing decline in housing prices since the onset of the global crisis. Furthermore, there is a prevailing preference for mortgage loan repayment by households, as is evident from the broadly stable total amount of outstanding loans for house purchases and the constant low level of new housing loans that is observed since the middle of 2009, even though interest rates have been coming down and overall credit standards for housing loans have been loosening since the middle of 2010.

33
DIS
CU
SS
ION
PA
PE
RS
4. Data and Methodology for Estimation of Overvaluation
The preferred approach for estimation of house price misalignment is to find a stable long-run relationship between house prices and some funda-mental driving factors, around which house prices fluctuate in the short run. We choose to use a vector error correction model, designed to deal with the dynamic fluctuations of housing prices around their long-run trend because of the non-stationarity of the variables of interest and the existence of a cointegration relationship between housing prices and the domestic demand indicator - hypothetical borrowing value. We arrive at a stable long-run relationship after testing numerous specifications, which reveals the size and persistence of the misalignments of observed housing prices from their fundamental level. It also provides enough information to make a guess about the expected future developments on the housing market.
Based on the investigation of the historical development of the Bulgarian housing market we arrived at three main factors affecting the house prices, for which we have statistical indicators. These factors are domestic demand for housing, foreign demand for real estate and the supply of housing.
On the demand side we have taken two measures for income: gross domestic product and disposable income. Disposable income is calcu-lated as the sum of the wage bill of employed (wages of self-employed persons are approximated by wages of employees), imputed rent of owner occupied dwellings, government transfers to the households, net current transfers of the private sectors, compensations of employees paid by non-residents and net of personal income tax and social security contributions paid by the employees. The credit market indicators that we used were the reconstructed nominal interest rate on housing loans and the reconstructed new business housing loans (see the appendix) and the quarterly change of the outstanding volume of housing loans as a measure of the credit activity of banks, alternative to the one reconstructed by us. Theoretically, population is one of the main factors, driving fundamental house prices and is also one of the considered series. In the case of Bulgaria, population decline should have had negative effect on property prices, but it is unclear whether such an effect could be identified in such a short and volatile sample such as ours.
Additionally, as a demand side indicator the hypothetical borrowing value constructed following the example of Addison-Smyth, McQuinn and O’Reily (2009) was used. The aim of including this indicator was twofold.

34
DP
/103
/201
7First, to account better for the non-linear effects of interest rates on the amount that an individual can afford to pay on a house. This indicator should capture in a better way the decision making considerations of consumers, compared to the indicators used for its construction taken separately. The second purpose was to arrive at a more parsimonious specification of the model combining the income and interest rate effect in one variable which has been proven to be crucial in our case after using more than three dependent variables in our ECM/VECM specifications did not yield robust results.
Our external demand proxy is foreign direct investment in real estate taken from the balance of payments statistics. Foreign direct investment in real estate data is available since 2004 when foreigners were allowed to pur-chase real estates in Bulgaria. We extrapolated the series for the period 2000-2003 on the basis of the data for FDI in real estate, renting and busi-ness activities, which were very low at that period.
On the supply side our main indicator was the construction production index for construction of buildings. The share of value added in construc-tion in the total value added for the economy was also used in several specifications, even though we understand that it encompasses not only the construction of residential buildings, but civil engineering as well. We also constructed a measure for residential investment (although this is more of a demand side indicator) by taking the available data on annual shares of residential investment to gross fixed capital formation and applying them to the quarterly series for gross fixed capital formation. Thus, we interpolated annual data to get quarterly series using the gross fixed capital formation quarterly profile. From the business climate survey in construction we also used the expectations of managers of firms in construction for the future economic activity and selling prices in the next 12 months.
Models for house prices were tested both in nominal and in real terms. To construct real terms indicators the following deflation procedure was applied. House prices were deflated by HICP index, GDP by GDP defla-tor, mortgage interest rates by the annual rate of HICP inflation, FDI in real estates and new housing loans by the house price index. Additionally, income was considered both in absolute value and per capita. All variables were seasonally adjusted and taken in natural logarithms. Most series start in Q1 2000 and end Q2 2014, which provided us with 58 observations. As we aim at finding cointegration relationship, all variables were first tested

35
DIS
CU
SS
ION
PA
PE
RS
for unit roots (see the appendix). Phillips-Perron test suggests that all indica-tors are first order integrated.6
By testing different specifications we have arrived at an error correction model of house prices (HP), hypothetical borrowing value (HBV) and foreign direct investment in real estate (FDI). Factors on the supply side rarely entered significantly or with the expected negative sign in any of the specifications tested. Granger causality tests between housing prices and supply-side factors confirmed that the supply is always lagging behind the movement of prices. Therefore, this in a way confirms that if the supply was a driving factor for the housing market, it was only so for a short part of the sample between the two identified phases of housing price growth.
Johansen method for cointegration testing suggested one cointegration relationship between the variables with deterministic trend in the data, which is significant only for HBV. Tests for weak exogeneity further show weak exogeneity of HBV and FDI, which we also find plausible, given that both were driven by external factors. Income, interest rates and FDI were determined by the overall economic development in the country and, especially prior to the global crisis, by the international economic conjunc-ture. Estimated cointegration relationship and further details for the model are given in the appendix.
5. ResultsThe developed VECM model estimates house price levels which are in line with the factors included in the model – income, mortgage interest rates and foreign demand for real estate. These levels are usually referred to as fundamental or long-term house prices, but with the following caveats. They cannot be called equilibrium prices as effects on the side of supply could be nontrivial and part of their dynamics is also cyclical. However, they are informative and useful as they show (keeping in mind the possible limitations of the model) to what extent the dynamics in house prices are caused by the factors included (income, interest rates and FDI).
6 Three types of unit root tests were used in this analysis: the Augmented Dickey-Fuller Test, the Kwiatkowski-Phillips-Schmidt-Shin Test and the Phillips-Perron test. All three types of tests gave comparable results, which led to the decision to report only the Phillips-Perron results in full.

36
DP
/103
/201
7Figure 23: Estimated House Prices Misalignment
The estimated model suggests that during the first phase of rapid growth property prices were broadly in line with the increase in income and the reduction of interest rates. Between the two phases of housing price appreciation that we identified there was a housing price undervaluation, which is not explained by the fundamental factors in the model, i.e. house-hold income and mortgage interest rates. Most likely it was driven by the increased investment in construction which was prompted by the outpac-ing growth in profitability in the construction sector during the first phase. The constraining measures for credit growth, which limited the growth of mortgage credit are most probably another factor for the undervaluation in 2006.
During the second phase the withdrawal of the administrative measure limiting the credit growth and the large FDI inflows allowed once again acceleration in house prices. Around the end of the second phase there was a significant overvaluation of about 20 percent, which can be attrib-uted to the inflated expectations of economic agents for housing prices and future income. Therefore, there is evidence for a housing price bubble during the second phase of housing price growth, since the overvaluation in housing prices during that period cannot be explained by fundamentals alone.
Moreover, the model suggests that during the global crisis, the fundamen-tal house prices declined and in the first quarter of 2010 they were around 30 per cent below their peak value from Q1 2008. The reduction in the
37
DIS
CU
SS
ION
PA
PE
RS
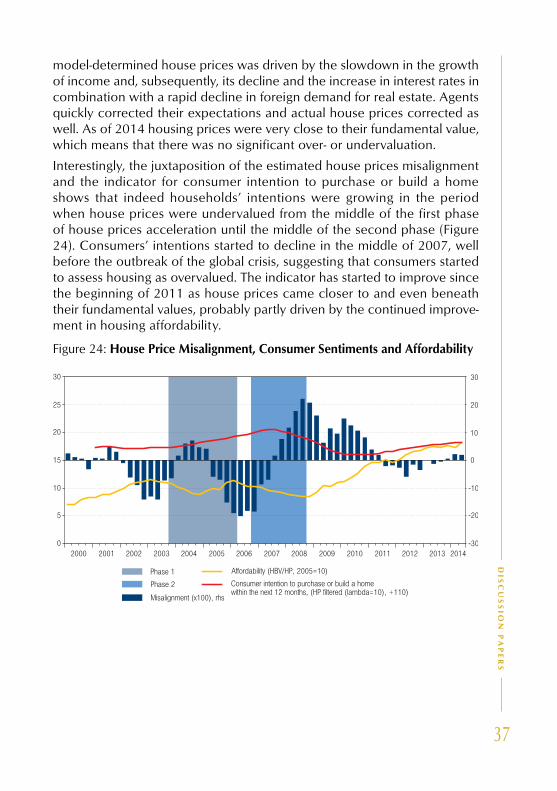
model-determined house prices was driven by the slowdown in the growth of income and, subsequently, its decline and the increase in interest rates in combination with a rapid decline in foreign demand for real estate. Agents quickly corrected their expectations and actual house prices corrected as well. As of 2014 housing prices were very close to their fundamental value, which means that there was no significant over- or undervaluation.
Interestingly, the juxtaposition of the estimated house prices misalignment and the indicator for consumer intention to purchase or build a home shows that indeed households’ intentions were growing in the period when house prices were undervalued from the middle of the first phase of house prices acceleration until the middle of the second phase (Figure 24). Consumers’ intentions started to decline in the middle of 2007, well before the outbreak of the global crisis, suggesting that consumers started to assess housing as overvalued. The indicator has started to improve since the beginning of 2011 as house prices came closer to and even beneath their fundamental values, probably partly driven by the continued improve-ment in housing affordability.
Figure 24: House Price Misalignment, Consumer Sentiments and Affordability

38
DP
/103
/201
7
6. ConclusionsLike most countries in Europe and all NMS, Bulgaria experienced construc-tion boom prior the global crisis and a sharp correction in house prices and construction activity after that. Given the limitations of data available for the housing market in Bulgaria, a reasonable explanation of house price dynamics can be achieved by the model proposed. It exploits the cointegration relationship between house prices, hypothetical borrowing volume, which is constructed on the basis of income and mortgage interest rate, and FDI in real estate, which is our indicator for foreign demand for housing. We argue that after a prolonged period of suppressed housing market the first phase of housing market boom, from the end of 2003 to the end of 2005, was driven by higher income and decreasing interest rates. The limited supply of new housing created conditions for demand side pressures on housing prices, since the response of supply occurs with a lag. On the other hand, the significant increase in the profitability in the construction sector stimulated construction activity in the following years. This, together with the measures aiming at constraining the fast growth in mortgage credit helped to cool off the housing market temporarily in 2006 before a second phase of house price acceleration. According to our model, during this period housing was undervalued for the observed levels of income, interest rates and foreign demand. Households also continued to improve their assessment for the appropriateness of house purchases. The second phase continued until the end of 2008 and was caused by the high foreign demand and overly optimistic expectations of economic agents for the future housing prices. Thus, there is evidence of a housing bubble during the second phase of housing price growth, since the funda-mentals alone cannot explain the housing price dynamics. By the end of 2008 house prices were overvalued by about 20% and started correcting downwards rapidly with the deterioration of business sentiments. Although the affordability of housing improved after the 2008 – 2009 global crisis compared with the period of housing boom, high unemployment and the uncertainty about future income and economic developments reduced housing demand and households shifted their preferences towards mort-gage loans repayment. Firms in construction sector also reduced their profit margins and shed significant part of their employment. As of 2014 house prices are estimated as being aligned with income, interest rates and foreign demand.
If the upward trend in household income and the downward trend in interest rates on mortgage loans continue, the demand for housing can be expected to recover further. Construction activity will probably remain

39
DIS
CU
SS
ION
PA
PE
RS
depressed until a more substantial rise in prices is observed. Therefore, the increase in demand for housing can be expected to bring an increase in housing prices in the medium term, in the absence of increase in supply. On the other hand, the low yield and interest rates environment and the expectations for an increase in housing prices and rents, can lead to increase in speculative demand for housing as well. In the long term a cor-rection from the supply side can be expected, due increase in prices and profit margins. This expected upturn will be more tamed in the absence of FDI inflows, compared to the housing boom of 2003-2008. In light of these expectations, no significant overvaluation can be anticipated in the medium term.

40
DP
/103
/201
7
ReferencesAddison-Smyth, D., K. McQuinn, G. O’Reilly (2009), “Modelling Credit in the Irish Mortgage Market”, Central Bank of Ireland Research Technical Paper, 9/RT
Angello, L., L. Schuknecht (2009), “Booms and Busts in Housing Markets: Determinants and Implications” ECB Working Paper No. 1071
Case, K., R. Schiller (1988), “The Behavior of Home Buyers in Boom and Post-Boom Markets”, NBER Working Paper No. 2748
Case, K., R. Schiller (1990), “Forecasting Prices and Excess Returns in the Housing Market”, AREUEA Journal, 18, 253-273
Case, K., R. Schiller (2004), “Is There A Bubble in The Housing Market?”, Cowles Foundation Paper No. 1089
Detken, C., F. Smets (2004), “Asset Price Booms and Monetary Policy”, European Central Bank Working Papers Series, No 364, May
Egert, B., D. Mihaljek (2007), “Determinants of House Prices in Central and Eastern Europe”, BIS Working Papers, No 236, September
Englund, P., Y. Ioannides (1997), “House Price Dynamics: An International Empirical Perspective”, Journal of Housing Economics, 6
European Commission (2012), Quarterly Report on The Euro Area, Volume 11, #4, 2012, Focus: “Assessing the dynamics of house prices in the euro area”
Gattini and Hiebert (2010), “Forecasting and assessing euro area house prices through the lens of key fundamentals”, European Central Bank Work-ing Papers Series, No 1249
Glaeser, E., J. Gyourko (2007), “Arbitrage in Housing Markets,” NBER Working Paper 13704
Glaeser, E., J. Gyourko, A. Saiz (2008), “Housing Supply and Housing Bub-bles”, Harvard Institute of Economic Research, Discussion Paper No. 2158
Hamilton, J. D. (1994), “Time Series Analysis”, Princeton University Press.
Juselius, K., D. Hendry (2000), “Explaining Cointegration Analysis: Part II”, Discussion Papers 00-20, University of Copenhagen. Department of Economics.
Kearl, J. (1979), “Inflation, mortgages, and housing”, Journal of Political Economy, 87
National Statistical Institute, Statistical Yearbook 1985, 1990, 1995

41
DIS
CU
SS
ION
PA
PE
RS
Ortalo-Magné and Prat (2007), “The Political Economy of Housing Supply: Homeowners, Workers and Voters,” STICERD Theoretical Economics Dis-cussion Paper No. 514
Palacin, J., R. Shelburne (2005), “The Private Housing Market in Eastern Europe and the CIS”, ECE Discussion Papers Series 2005_5, UNECE.
Poterba, J. (1984), “Tax Subsidies to Owner-Occupied Housing: An Asset-Market Approach”, The Quarterly Journal of Economics, Vol. 99, No. 4 (Nov., 1984), pp. 729-752
Poterba, J. (1991), “House Price Dynamics: The Role of Tax Policy and Demography”, Brookings Papers on Economic Activity, 2:1991
Rahbek, A., E. Hansen, J.G. Dennis (2002), “ARCH innovations and their impact on cointegration rank testing”, Preprint no. 12, 1998, Department of Theoretical Statistics, Working paper no. 22, Centre for Analytical Finance.
Stiglitz, J. (1990),”Symposium on Bubbles”, The Journal of Economic Per-spectives, Vol. 4, No. 2. (Spring, 1990), pp. 13-18
Topel, R., S. Rosen (1988), “Housing Investment in the United States”, Journal of Political Economy, Vol. 96, No. 4 (Aug., 1988), pp. 718-740
Zhu, M. (2014), “Housing Markets, Financial Stability and the Economy”, Opening Remarks at the Bundesbank/German Research Foundation/IMF Conference

42
DP
/103
/201
7
Appendix
A1. Reconstructed Data on Interest Rates and Loans
A break in interest rates statistics in Bulgaria in the beginning of 2007 causes additional difficulties in analyzing and modeling housing market developments. Prior to 2007 data for interest rates on new business hous-ing loans is available only for loans in BGN, while in other currencies data is available on an aggregated level – for all long-term loans of households. Long-term loans are defined as loans with maturity one year and longer. We should also note that in 2007 the definition of new business loans was changed.
We reconstructed the data for interest rates on housing loans weighted for all currencies before 2007 based on some necessary and somewhat arbitrary assumptions. To weight the interest rates we need to construct time series for new business long-term housing loans in foreign currency on the basis of the available data for total long-term new business loans to households in foreign currency. We assume a constant share of 80% of housing loans in all long-term loans to households in foreign currency as this is their share for 2007 (the first year for which data is available). Monetary statistics data for the change in the outstanding volumes of loans also confirms that housing loans were the major part of all long-term loans to households in foreign currency.
Next, we make an assumption for the spread between interest rates on housing loans in foreign currency and consumption and other long-term loans to households in foreign currency. We again assume that the spread observed in 2007, 1.37 p.p., was the one in the period from 2000 to 2006. Having data on the weighted interest rate on long-term loans for house-holds prior to 2007 and the reconstructed new business loans we construct series for interest rates on housing loans in foreign currency and the overall weighted interest rate on housing loans.

43
DIS
CU
SS
ION
PA
PE
RS
Interest Rate Statistics Data – Long-term Loans to Households – New Business, Quarterly Data, BGN mln.
Monetary Statistics Data – Long-term Loans to Households – Change in Outstanding Stock, Quarterly Data, BGN mln.

44
DP
/103
/201
7Interest Rate Statistics Data – Interest Rates on Long-run Loans for Households in Foreign Currency for New Business, Quarterly Weighted
Interest Rate Statistics Data – Interest Rates on Long-run Housing Loans for New Business, Quarterly Weighted

45
DIS
CU
SS
ION
PA
PE
RS
A2. Population
To calculate indicators like income per capita, a population data with quar-terly frequency was needed. The official statistics on population, however, show drastic changes in demographics in the years of national census, which maybe is an indication that the standard means for yearly estimation of the population, used by the statistical office, cannot resemble the fast shrinkage of the number of individuals. One possible reason for this might be the unregistered emigration outflows. In our research we preferred to rely solely on census data and the available forecast for 2015 and to inter-polate the data for the years in between. This procedure gave us smoother population data, without drastic changes in demographic dynamics, as one would typically expect to be observed. As a next step, the smoothed popu-lation data was additionally interpolated to a quarterly frequency using the Boot-Feibes-Lisman method.
Population (end of period; mln.)

46
DP
/103
/201
7A3. Hypothetical Borrowing Value
Several specifications of the hypothetical borrowing value indicator have been tested. As a measure of personal income we have used both GDP and disposable income, both total and per capita, calculated with the smoothed population series (see appendix A2). Three different durations were also assumed for the mortgage loans – 20, 25 and 30 years. In terms of dynamics all tested specifications show similar results independent of the duration. GDP based indicators have significantly more pronounced reaction during the 2008-2009 crisis, and per capita indicators give slightly higher growth rates on average. Our preferred measure at the end is the hypothetical borrowing value indicator based on GDP per capita with dura-tion of the loan of 25 years.
Hypthetical Borrowing Value(BGN bln.)(BGN)

47
DIS
CU
SS
ION
PA
PE
RS
Hypthetical Borrowing Value – Annual Growth Rates(%) (%)

48
DP
/103
/201
7Table A1: Unit Root Phillips–Perron Test
H0: Variable has a unit root
Adj. t-statisticsLevel First diff.
Sample 2000q1-2014q2
Sample 2004q1-2014q2
Sample 2000q1-2014q2
Sample 2004q1-2014q2
House prices -1.47 -2.94***
Real house prices -1.33 -3.48 ***
Hypothetical borrowing value -2.38 -4.34 ***
FDI in real estates -1.45 -2.38 -3.70 *** -3.15 ***
FDI in real estates, house prices deflated -1.44 -2.08 -4.49 *** -3.89 ***
Gross domestic product -2.46 -3.79 ***
Gross domestic product per capita -2.53 -3.53 ***
Real gross domestic product -2.34 -2.65 ***
Real gross domestic product per capita -2.46 -2.40 **
Housing interest rate -1.96 -3.89 ***
Real housing interest rate -2.09 -4.69 ***
New housing loans -2.52 -3.79 ***
New housing loans, house prices deflated -2.88 * -4.67 ***
Construction production -1.69 -2.44 ***
Share of value added in construction -1.67 -11.05 ***
Test critical values:
*** 1% level -3.55 -3.60 -2.61 -2.62
** 5% level -2.91 -2.93 -1.95 -1.95
* 10% level -2.59 -2.60 -1.61 -1.61
Note: Unit root tests on variables are done with automatic lag length selection based on SIC, for vari-ables in levels constant is included in the equation. The Hypothetical borrowing value was also tested under the assumption of deterministic linear trend and the test again suggested that the series is I(1). FDI in real estates was additionally tested for unit roots on the shorter sample 2004-2014q2 as for 2000-2003 there are no official data and the series was extrapolated.

49
DIS
CU
SS
ION
PA
PE
RS
A4. The Model
We have followed the Hendry and Juselius (2000) procedure to construct our model. Both Schwarz information criterion and Hannan-Quinn informa-tion criterion suggested inclusion of 3 lags in a VAR model of variables in levels (HP, HBV, FDI). Under the assumption of linear deterministic trend in the data trace test and maximum eigenvalue test indicate one cointegration relationship (Table A2). Tests on significance of the variables in the relation-ship and weak exogeneity suggest that all three variables are significant and only house prices correct to the estimated long-run relationship (with error-correction term of -0.23). Residual test for normality was passed. White heteroscedasticity test rejected residual homoscedasticity at 0.05 critical value but Rahbek et al. (2002) have shown that the cointegration rank tests are robust against moderate residual ARCH effects. LM autocor-relation test also showed first order serial correlation in the residuals. As OLS estimate of the cointegration vector should still be consistent even in the presence of serial correlation (Hamilton (1994) we find our model appropriate for illustrative purposes. The estimated cointegration equation is given in Table A3.
Table A2: Cointegration Tests
HypothesizedNo. of CE(s) Eigenvalue Trace
Statistic
0.05Critical Value
Prob.**Max-Eigen
Statistic
0.05Critical Value
Prob.**
None * 0.383 36.982 29.797 0.006 26.589 21.132 0.008
At most 1 0.141 10.393 15.495 0.252 8.366 14.265 0.343
At most 2 0.036 2.028 3.841 0.155 2.028 3.841 0.155
Table A3: Cointegration Vector
Cointegration equation
HP1
HBV-0.31
(-0.05)
FDI-0.16
(-0.02)
Constant -1.91
Note: Standard errors in parenthesis

50
DP
/103
/201
7Table A4:
Distribution of population by tenure status
2005 2006 2007 2008 2009 2010 2011 2012
Owner 85.4 85.4 87.6 87.1 86.8 86.9 87.2 87.4
Owner, with mortgage or loan 2.3 2.3 2.5 9.9 9.3 1.8 1.5 2.0
Owner, no outstanding mortgage or housing loan 83.1 83.1 85.1 77.3 77.5 85.2 85.7 85.3
Tenant 14.6 14.6 12.4 12.9 13.2 13.1 12.8 12.6
Tenant, rent at market price 3.0 3.0 2.3 1.6 2.0 2.1 1.7 1.3
Tenant, rent at reduced price or free 11.6 11.6 10.1 11.2 11.2 10.9 11.1 11.3Source: Eurostat