analysis of the genetic divergence of soybean lines ... · experiment consisted of 20 genotypes,...
TRANSCRIPT

Genetics and Molecular Research 15 (4): gmr.15048836
Analysis of the genetic divergence of soybean lines through hierarchical and Tocher optimization methods
D.A.V. Cantelli1, O.T. Hamawaki1, M.R. Rocha1, A.P.O. Nogueira2, R.L. Hamawaki3, L.B. Sousa1, C.D.L. Hamawaki4
1Instituto de Ciências Agrárias, Universidade Federal de Uberlândia, Uberlândia, MG, Brasil2Instituto de Genética e Bioquímica, Universidade Federal de Uberlândia, Uberlândia, MG, Brasil3Department of Plant, Soil & Agricultural Systems, Southern Illinois University, Carbondale, Il, USA4Instituto Master Presidente Antônio Carlos, Araguari, MG, Brasil
Corresponding author: M.R. RochaE-mail: [email protected]
Genet. Mol. Res. 15 (4): gmr.15048836Received May 31, 20146Accepted July 12, 2016Published October 5, 2016DOI http://dx.doi.org/10.4238/gmr.15048836
Copyright © 2016 The Authors. This is an open-access article distributed under the terms of the Creative Commons Attribution ShareAlike (CC BY-SA) 4.0 License.
ABSTRACT. This study aimed to evaluate the clustering pattern consistency of soybean (Glycine max) lines, using seven different clustering methods. Our aim was to evaluate the best method for the identification of promising genotypes to obtain segregating populations. We used 51 generations F5 and F6 soybean lines originating from different hybridizations and backcrosses obtained from the soybean breeding program of Universidade Federal de Uberlândia in addition to three controls (Emgopa 302, BRSGO Luziânia, and MG/BR46 Conquista). We evaluated the following agronomic traits: number of

2D.A.V. Cantelli et al.
Genetics and Molecular Research 15 (4): gmr.15048836
days to flowering, number of days to maturity, height of the plant at maturity, insertion height of the first pod, grain yield, and weight of 100 seeds. The data was submitted to analyses of variance followed by average Euclidean distance matrix estimation used as measure of dissimilarity. Subsequently, clusters were formed using the Tocher method and dendrograms were constructed using the hierarchical methods simple connection (nearest neighbor), complete connection (most distant neighbor), Ward, median, average within cluster connection. The nearest neighbor method presented the largest number of genotypes in group I and showed the greatest similarity with the Tocher optimization method. The joint use of these two methodologies allows for differentiation of the most genetically distant genotypes that may constitute the optimal parents in a breeding program.
Key words: Glycine max; Genetic diversity; Genetic breeding
INTRODUCTION
Among the main cultivated species, soybean [Glycine max (L.) Merrill] is the oleaginous plant with the greatest planted area in the world. It occupies a prominent position in the Brazilian economy, with an estimated production of 94.5 million tons in the 2014/2015 season (CONAB, 2015).
In soybean culture, artificial hybridization has been the used and most common method to increase the intraspecific genetic variability (Baenziger et al., 2006). However, in any breeding program, knowledge of the available germplasm in terms of performance, combination capacity, and genetic dissimilarity is of fundamental importance (Vieira et al., 2005). It has recently seen that modern soybean genotypes present a narrow genetic base complicating the development of superior genotypes (Dellagostin et al., 2011; Hamawaki et al., 2012; Yokomizo et al., 2013). Furthermore, it has been shown that the Brazilian soybean germplasm has maintained constant genetic variability in the last 30 years of expansion and breeding of crops with satisfactory results for many traits of interest (Priolli et al., 2004; Miranda et al., 2007; Wysmierski and Vello, 2013).
Due to the large amount of genes involved in the control of quantitative traits, it is unlikely that modern cultivars contain all the favorable alleles corresponding to all of the loci of agronomic interest in soybean (Mulato et al., 2010). By measuring the genetic divergence of four soybean populations, Hyten et al. (2006) concluded that the low genetic variability observed was likely due to the small number of Asiatic genetic material introduced during the process of domestication and not the selection process itself.
Studies of genetic divergence are important for understanding the genetic variability of populations. Such studies allow for monitoring the germplasm banks and selection of the most efficient crossings. They also generate important information with respect to genetic distance among the genotypes that may be used in the exploitation of the genetic variability in the development of new cultivars (Cruz et al., 2014).
To estimate the genetic diversity, one can, for example, use agronomic, morphological, and molecular traits (Silva et al., 2011). Within the available methods for genetic diversity studies, the average Euclidean distance is used as a measure of dissimilarity, which underlies hierarchical
3Genetic divergence of soybean (Glycine max)
Genetics and Molecular Research 15 (4): gmr.15048836
clustering methods such as UPGMA (unweighted pair group method with arithmetic mean), nearest neighbor, and the Tocher optimization method (Silva et al., 2011; Azevedo et al., 2013). The Tocher optimization method is normally used concomitantly with the UPGMA hierarchical method, providing correspondence for the allocation of elements in the clusters (Arriel et al., 2006). According to Hamawaki et al. (2012), an agreement between the Tocher optimization method and other hierarchical clustering or multivariate techniques can be used to compare methods.
The choice of analysis method to be utilized depends on the desired precision, ease of analysis, and form of obtaining the data and there is no defined parameter of choice for the study of genetic divergence for a group of genotypes (Cargnelutti Filho et al., 2008; Cruz et al., 2012). The measure of dissimilarity and together with analysis method used should guarantee the breeder security in the selection of parents for the crossings. If there is no agreement between the methods used, the choice of parents depends on the method utilized, which requires selection of the most efficient method (Cargnelutti Filho et al., 2008).
In this study, we evaluated the clustering pattern consistency of soybean lines, starting with a measure of dissimilarity obtained through the average Euclidean distance. Our aim was to identify the best method to indicate promising genotypes for obtaining segregating populations.
MATERIAL AND METHODS
The experiment was initiated on January 19, 2004 in the field of Fazenda Capim Branco of Universidade Federal de Uberlândia, located in the municipality of Uberlândia, Minas Gerais (18°55'23''S, 48°17'19''W, 872 m in altitude).
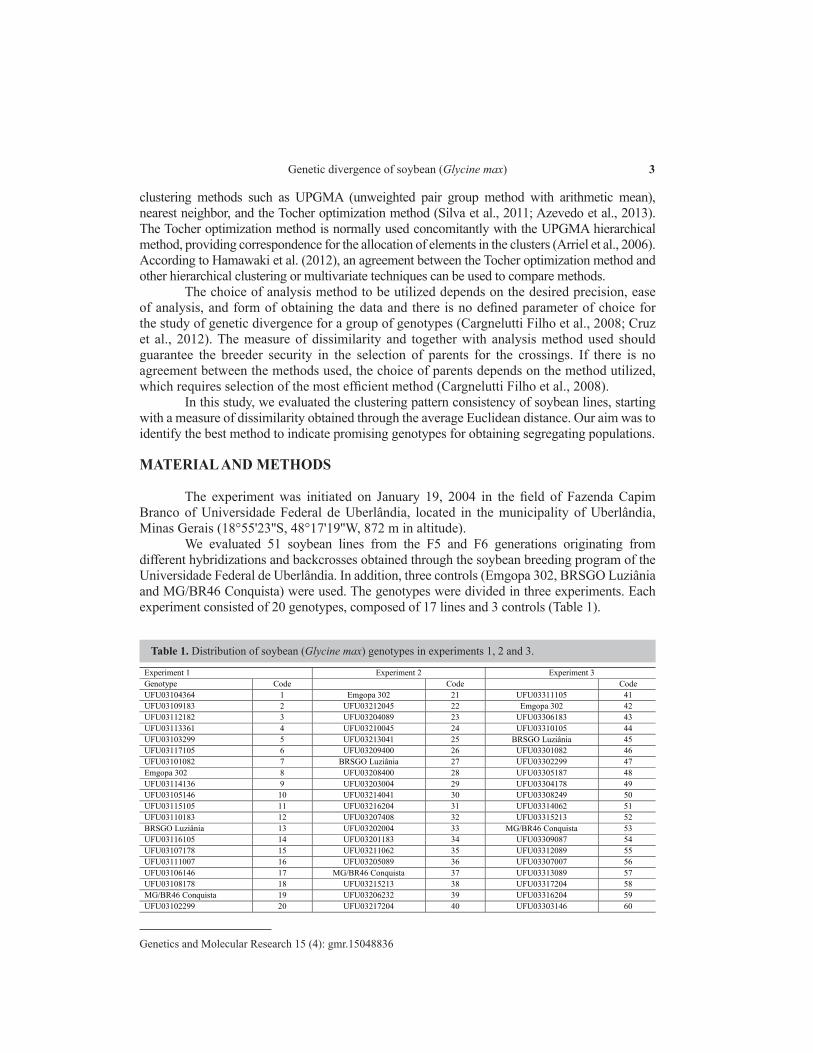
We evaluated 51 soybean lines from the F5 and F6 generations originating from different hybridizations and backcrosses obtained through the soybean breeding program of the Universidade Federal de Uberlândia. In addition, three controls (Emgopa 302, BRSGO Luziânia and MG/BR46 Conquista) were used. The genotypes were divided in three experiments. Each experiment consisted of 20 genotypes, composed of 17 lines and 3 controls (Table 1).
Table 1. Distribution of soybean (Glycine max) genotypes in experiments 1, 2 and 3.
Experiment 1 Experiment 2 Experiment 3 Genotype Code Code Code UFU03104364 1 Emgopa 302 21 UFU03311105 41 UFU03109183 2 UFU03212045 22 Emgopa 302 42 UFU03112182 3 UFU03204089 23 UFU03306183 43 UFU03113361 4 UFU03210045 24 UFU03310105 44 UFU03103299 5 UFU03213041 25 BRSGO Luziânia 45 UFU03117105 6 UFU03209400 26 UFU03301082 46 UFU03101082 7 BRSGO Luziânia 27 UFU03302299 47 Emgopa 302 8 UFU03208400 28 UFU03305187 48 UFU03114136 9 UFU03203004 29 UFU03304178 49 UFU03105146 10 UFU03214041 30 UFU03308249 50 UFU03115105 11 UFU03216204 31 UFU03314062 51 UFU03110183 12 UFU03207408 32 UFU03315213 52 BRSGO Luziânia 13 UFU03202004 33 MG/BR46 Conquista 53 UFU03116105 14 UFU03201183 34 UFU03309087 54 UFU03107178 15 UFU03211062 35 UFU03312089 55 UFU03111007 16 UFU03205089 36 UFU03307007 56 UFU03106146 17 MG/BR46 Conquista 37 UFU03313089 57 UFU03108178 18 UFU03215213 38 UFU03317204 58 MG/BR46 Conquista 19 UFU03206232 39 UFU03316204 59 UFU03102299 20 UFU03217204 40 UFU03303146 60
4D.A.V. Cantelli et al.
Genetics and Molecular Research 15 (4): gmr.15048836
In all three experiments, we used a complete randomized block design composed of 20 genotypes and three replications. Each experimental plot consisted of soybean plants planted along a 6-m line, with 0.90 m between lines, totaling 180 plots.
The following agronomic traits were evaluated: number of days to flowering-R1 (NDF), number of days to maturity-R8 (NDM), height of the plant at maturity (HPM), insertion height of the first pod (IHFP), grain yield (YIELD), and weight of 100 seeds (WHS). The soybean development stages (R1 and R8) were identified following the phenological scale of Fehr and Caviness (1977).
The data were analyzed with analysis of variance using the F-test to verify the genetic variability among lines and cultivars using the software SAEG-UFV (SAEG, 2007). The average Euclidean distance matrices between the lines and controls were estimated and used as measures of dissimilarity. Subsequently, clusters were formed using the Tocher method and dendrograms were constructed using the following hierarchical methods simple connection (nearest neighbor), complete connection (most distant neighbor), Ward, median (WPGMA), average within cluster connection, and UPGMA. In the hierarchical clustering methods were established at 60% dissimilarity as criterion for the formation of clusters in the dendrograms.
The coefficient of cophenetic correlation between the matrix of average Euclidean distance and the matrix of cophenetic distance was obtained from the dendrogram of each method. All analyses were conducted in GENES (Cruz, 2013).
RESULTS
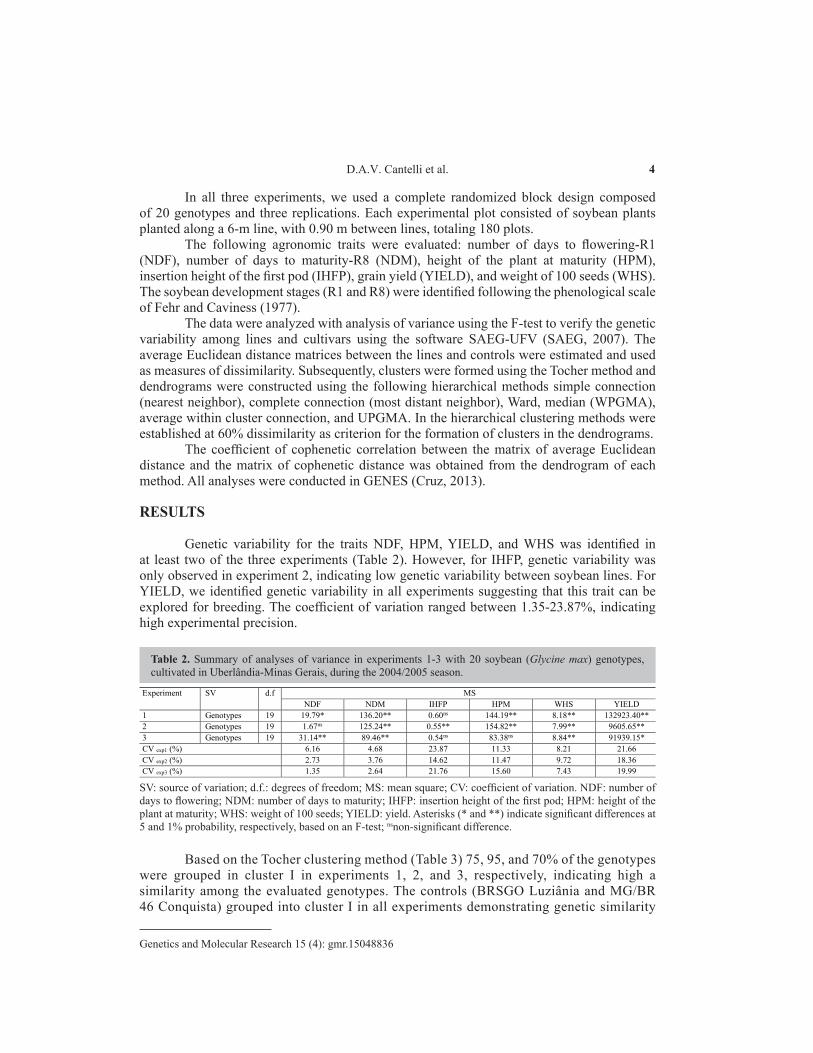
Genetic variability for the traits NDF, HPM, YIELD, and WHS was identified in at least two of the three experiments (Table 2). However, for IHFP, genetic variability was only observed in experiment 2, indicating low genetic variability between soybean lines. For YIELD, we identified genetic variability in all experiments suggesting that this trait can be explored for breeding. The coefficient of variation ranged between 1.35-23.87%, indicating high experimental precision.
SV: source of variation; d.f.: degrees of freedom; MS: mean square; CV: coefficient of variation. NDF: number of days to flowering; NDM: number of days to maturity; IHFP: insertion height of the first pod; HPM: height of the plant at maturity; WHS: weight of 100 seeds; YIELD: yield. Asterisks (* and **) indicate significant differences at 5 and 1% probability, respectively, based on an F-test; nsnon-significant difference.
Table 2. Summary of analyses of variance in experiments 1-3 with 20 soybean (Glycine max) genotypes, cultivated in Uberlândia-Minas Gerais, during the 2004/2005 season.
Experiment SV d.f MS NDF NDM IHFP HPM WHS YIELD
1 Genotypes 19 19.79* 136.20** 0.60ns 144.19** 8.18** 132923.40** 2 Genotypes 19 1.67ns 125.24** 0.55** 154.82** 7.99** 9605.65** 3 Genotypes 19 31.14** 89.46** 0.54ns 83.38ns 8.84** 91939.15* CV exp1 (%) 6.16 4.68 23.87 11.33 8.21 21.66 CV exp2 (%) 2.73 3.76 14.62 11.47 9.72 18.36 CV exp3 (%) 1.35 2.64 21.76 15.60 7.43 19.99
Based on the Tocher clustering method (Table 3) 75, 95, and 70% of the genotypes were grouped in cluster I in experiments 1, 2, and 3, respectively, indicating high a similarity among the evaluated genotypes. The controls (BRSGO Luziânia and MG/BR 46 Conquista) grouped into cluster I in all experiments demonstrating genetic similarity

5Genetic divergence of soybean (Glycine max)
Genetics and Molecular Research 15 (4): gmr.15048836
among these lines. In experiment 2, the genotypes were grouped into only two clusters. This indicates that the genetic base of this experiment was small, which contributes to the low genetic diversity observed.
(1)Emgopa 302, (2)BRSGO Luziânia, and (3)MG/BR46 Conquista.
Table 3. Results from the Tocher optimization method in three experiments with soybean (Glycine max) genotypes and three controls, cultivated in Uberlândia-Minas Gerais, during the 2004/2005 season.
Group Experiment 1 I 3, 5, 13(2), 4, 12, 14, 2, 16, 1, 20, 11, 6, 15, 18, and 19 (3) II 10 and 17 III 7 and 9 IV 8(1) Group Experiment 2 I 22, 24, 32, 31, 25, 30, 23, 21(1), 27(2), 28, 36, 38, 26, 35, 37 (3), 39, 29, and 34 II 40 Group Experiment 3 I 58, 60, 56, 59, 57, 46, 47, 53(3), 54, 49, 45 (2), 41, 44, and 55 II 50 and 51 III 43 and 52 IV 48 V 42(1)
The hierarchical clusters obtained from the dissimilarity matrices demonstrated that the majority of the evaluated genotypes could be found in cluster I in all three experiments (Figures 1 to 18). The genotypes grouped into cluster I in the hierarchical methods were more similar to the results using the Tocher optimization method. In experiments 2 and 3, only the nearest neighbor method presented 100 and 95% similarity, respectively, which cluster I obtained with the Tocher method (Figure 7 and 13). The comparison between the optimization and the hierarchical methods demonstrated that the dendrogram cluster presented the identification of the highest number of clusters and, consequently, improved possibility of identifying divergent parents.
The average within cluster connection proved to reveal the greatest number of clusters, with the formation of 8, 8, and 9 clusters in experiments 1, 2, and 3, respectively. By contrast, the Ward method resulted in the smallest number of clusters, indicating relatively homogeneous distribution of the genotypes. The WPGMA method presented genotype clusterings similar to those of the UPGMA method in all experiments, indicating that these methods are similar to one another.
Figure 1. Clustering of 20 soybean (Glycine max) genotypes using the simple connection (nearest neighbor) method, from the Euclidean distances obtained based on six agronomic traits from experiment 1.

6D.A.V. Cantelli et al.
Genetics and Molecular Research 15 (4): gmr.15048836
Figure 2. Clustering of 20 soybean (Glycine max) genotypes using the complete connection (most distant neighbor) method, from the Euclidean distances obtained based on six agronomic traits from experiment 1.
Figure 3. Clustering of 20 soybean (Glycine max) genotypes using the Ward method, from the Euclidean distances obtained based on six agronomic traits from experiment 1.
Figure 4. Clustering of 20 soybean (Glycine max) genotypes using the median method (WPGMA), from the Euclidean distances obtained based on six agronomic traits from experiment 1.
Figure 5. Clustering of 20 soybean (Glycine max) genotypes using the average within cluster connection method, from the Euclidean distances obtained based on six agronomic traits from experiment 1.

7Genetic divergence of soybean (Glycine max)
Genetics and Molecular Research 15 (4): gmr.15048836
Figure 6. Clustering of 20 soybean (Glycine max) genotypes using the average among cluster connection method from the Euclidean distances obtained based on six agronomic traits from experiment 1.
Figure 7. Clustering of 20 soybean (Glycine max) genotypes using the simple connection (nearest neighbor) method, from the Euclidean distances obtained based on six agronomic traits from experiment 2.
Figure 8. Clustering of 20 soybean (Glycine max) genotypes using the complete connection (most distant neighbor) method, from the Euclidean distances obtained based on six agronomic traits from experiment 2.
Figure 9. Clustering of 20 soybean (Glycine max) genotypes using the Ward method, from the Euclidean distances obtained based on six agronomic traits from experiment 2.

8D.A.V. Cantelli et al.
Genetics and Molecular Research 15 (4): gmr.15048836
Figure 10. Clustering of 20 soybean (Glycine max) genotypes using the median method (WPGMA), from the Euclidean distances obtained based on six agronomic traits from experiment 2.
Figure 11. Clustering of 20 soybean (Glycine max) genotypes using the average within cluster connection method, from the Euclidean distances obtained based on six agronomic traits from experiment 2.
Figure 12. Clustering of 20 soybean (Glycine max) genotypes using the average among cluster connection method from the Euclidean distances obtained based on six agronomic traits from experiment 2.
Figure 13. Clustering of 20 soybean (Glycine max) genotypes using the simple connection (nearest neighbor) method, from the Euclidean distances obtained based on six agronomic traits from experiment 3.

9Genetic divergence of soybean (Glycine max)
Genetics and Molecular Research 15 (4): gmr.15048836
Figure 14. Clustering of 20 soybean (Glycine max) genotypes using the complete connection (most distant neighbor) method, from the Euclidean distances obtained based on six agronomic traits from experiment 3.
Figure 15. Clustering of 20 soybean (Glycine max) genotypes using the Ward method, from the Euclidean distances obtained based on six agronomic traits from experiment 3.
Figure 16. Clustering of 20 soybean (Glycine max) genotypes using the median method (WPGMA), from the Euclidean distances obtained based on six agronomic traits from experiment 3.
Figure 17. Clustering of 20 soybean (Glycine max) genotypes using the average within cluster connection method, from the Euclidean distances obtained based on six agronomic traits from experiment 3.

10D.A.V. Cantelli et al.
Genetics and Molecular Research 15 (4): gmr.15048836
Figure 18. Clustering of 20 soybean (Glycine max) genotypes using the average among cluster connection method from the Euclidean distances obtained based on six agronomic traits from experiment 3.
The coefficient of cophenetic correlation obtained between the matrix of average Euclidean distances and the matrix of cophenetic distances, from the dendrogram of each method ranged between 0.52 and 0.83 and was statistically significant (Table 4). The nearest neighbor, WPGMA, and UPGMA methods presented values above 0.7 for experiments 2 and 3, respectively, suggesting that these methods were consistent.
*Significant at 1% probability based on a t-test.
Table 4. Coefficients of cophenetic correlation obtained between the matrix of average Euclidean distances and the matrix of cophenetic distances for the different hierarchical methodologies in three experiments with soybean (Glycine max) genotypes.
Methodologies Coefficient of cophenetic correlation Experiment 1 Experiment 2 Experiment 3
Nearest neighbor 0.74* 0.58* 0.79* Most distant neighbor 0.72* 0.67* 0.60* Ward 0.70* 0.59* 0.52* WPGMA 0.76* 0.74* 0.77* Average within cluster connection 0.77* 0.59* 0.64* UPGMA 0.77* 0.75* 0.83*
DISCUSSION
The study of genetic divergence is an important tool to identify parents that contrast the most for crosses seeking to increase the variability through breeding. Knowledge of genetic diversity can be used to produce new cultivars (Veloso et al., 2015). In our study, all investigated traits presented genetic variability in at least two experiments with exception of IHFP. IHFP is a trait important for breeding, with the ideal IHFP value being between 10 and 12 cm to minimize loss during mechanical harvest (Sediyama, 2015). Therefore, this trait is often considered during the selection of soybean lines.
In this study, the identified coefficients of variation were similar with values found in others studies. Selestrino et al. (2014) found coefficient of variation values ranging between 1.37 and 22.27% for NDF, NDM, IHFP, HPM, YIELD, and WHS. According to Carvalho et al. (2003), the maximum acceptable limit for the coefficient of variation in relation to yield and height of the soybean plant is 16 and 12%, respectively. We found that the coefficients of variation for yield were higher than those established by Carvalho et al. (2003) and exceeded the 20% that is required for the inscription of new cultivars in the National Registry of

11Genetic divergence of soybean (Glycine max)
Genetics and Molecular Research 15 (4): gmr.15048836
Cultivars, the Ministry of Agriculture, Livestock, and Food Supply (MAPA, 1998).Clustering methods allow for the identification of genotypes genetically that are
contrasting for the crosses. The first cluster in a dendrogram is formed by genotypes sharing the greatest similarity (Cruz et al., 2014). We observed some clusters composed of only one or two genotypes (Table 3), and the control cultivar Emgopa 302 proved to be the most divergent among all evaluated genotypes. Selection of divergent parents should be based on the magnitude of the genetic divergence among genotypes, when the aim is to perform crossings resulting in superior progenies in relation to the traits of interest. Vieira et al. (2005) reported that clusters formed by one single individual suggest that those individuals are the most divergent in relation to the rest. According to Abreu et al. (2004), knowledge of genetic divergence allows inferences to be made about the specific combination capacity before carrying out the crossings, resulting in a greater chance of identifying and recovering more promising combinations among the segregating populations.
Our comparative study between the optimization and hierarchical methods demonstrated that the clusters in the dendrograms could be used for identification of the method yielding the highest number of clusters and, consequently, constitute an improvement in the possibility of selecting the most divergent parents. Rotili et al. (2012) suggested that, compared to the Tocher method, the nearest neighbor method can be used with the objective of evaluating the genetic divergence among corn genotypes.
Vogt et al. (2010) also confirmed that the UPGMA and Tocher optimization methods were in agreement in a study of genetic divergence of sunflowers. Furthermore, Bertan et al. (2006) confirmed that the clustering of genotypes using UPGMA resulted in results that were similar to the method of cluster formation among the most divergent genotypes, suggesting optimization method agreement method. Further studies have shown that the UPGMA method is superior to the nearest neighbor and most distant neighbor methods when compared with known information of the genealogy (Sneath and Sokal, 1973; Romesburg, 1984; Dudley, 1994).
Using various clustering methods for processing the data, using different measures of dissimilarity and taking into account the particularities of each method are required for an accurate choice of parents for crossings (Cargnelutti Filho et al., 2008). Through the use of dendrograms, it is possible to evaluate the formation of clusters and, consequently, to select the genetically most distinct genotypes.
The reference information regarding genetic divergence is typically not sufficient for selecting parents for hybridization (Ferreira Júnior et al., 2015). Instead, the reference information should be accompanied by information about the genotype performance in relation to the desirable traits. The ideal strategy is one that combines the results of genetic divergence analyses and the identification of the genotypes carrying the traits that are the target of the breeding program.
Conflicts of interest
The authors declare no conflict of interest.
ACKNOWLEDGMENTS
The authors are indebted the Universidade Federal de Uberlândia by support to implementation of experiment.
12D.A.V. Cantelli et al.
Genetics and Molecular Research 15 (4): gmr.15048836
REFERENCES
Abreu FB, Leal NR, Rodrigues R, Amaral Júnior ATD, et al. (2004). Divergência genética entre acessos de feijão-de-vagem de hábito de crescimento indeterminado. Hortic. Bras. 22: 547-552. http://dx.doi.org/10.1590/S0102-05362004000300009
Arriel NHC, Di Mauro AO, Di Mauro SMZ, Bakke OA, et al. (2006). Técnicas multivariadas na determinação da diversidade genética em gergelim usando marcadores RAPD. Pesqui. Agropecu. Bras. 41: 801-809. http://dx.doi.org/10.1590/S0100-204X2006000500012
Azevedo AM, Andrade Júnior VC, Oliveira CM, Fernandes JSC, et al. (2013). Seleção de genótipos de alface para cultivo protegido: divergência genética e importância de caracteres. Hortic. Bras. 31: 260-265. http://dx.doi.org/10.1590/S0102-05362013000200014
Baenziger PS, Russell WK, Graef GL, Campbell BT, et al. (2006). Improving lives: 50 years of crop breeding, genetics, and cytology (C-1). Crop Sci. 46: 2230-2244. http://dx.doi.org/10.2135/cropsci2005.11.0404gas
Bertan I, Carvalho FIF, Oliveira AC, Vieira EA, et al. (2006). Comparação de métodos de agrupamento na representação da distância morfológica entre genótipos de trigo. Curr. Agr. Sci. Tech. 12: 279-286.
Cargnelutti Filho A, Ribeiro ND, Reis RCP, Souza JR, et al. (2008). Comparação de métodos de agrupamento para o estudo da divergência genética em cultivares de feijão. Cienc. Rural 38: 2138-2145. http://dx.doi.org/10.1590/S0103-84782008000800008
Carvalho CGP, Arias CAA, Toledo JFF, Almeida LA, et al. (2003). Proposta de classificação dos coeficientes de variação em relação à produtividade e altura da planta de soja. Pesqui. Agropecu. Bras. 38: 187-193. http://dx.doi.org/10.1590/S0100-204X2003000200004
CONAB (2015). Companhia Nacional de Abastecimento. Acompanhamento da Safra Brasileira de Grãos. Available at [http://www.conab.gov.br/OlalaCMS/uploads/arquivos/15_05_13_08_46_55_boletim_graos_maio_2015.pdf]. Accessed May 20, 2015.
Cruz CD (2013). Genes: a software package for analysis in experimental statistics and quantitative genetics. Acta Sci. Agron. 35: 271-276. http://dx.doi.org/10.4025/actasciagron.v35i3.21251
Cruz CD, Regazzi AJ and Carneiro PCS (2012). Modelos biométricos aplicados ao melhoramento genético. 4th ed. UFV, Viçosa.
Cruz CD, Regazzi AJ and Carneiro PCS (2014). Modelos biométricos aplicados ao melhoramento genético. 3 rd ed. UFV, Viçosa.
Dellagostin M, Henning FA, Mertz LM, Kopp MM, et al. (2011). Dissimilaridade genética em população segregante de soja com variabilidade para caracteres morfológicos de semente. Rev. Bras. Sementes 33: 689-698. http://dx.doi.org/10.1590/S0101-31222011000400011
Dudley JW (1994). Comparison of genetic distance estimators using molecular marker data. In: Analysis of molecular marker data. American Society for Horticultural Science and Crop Science Society of America, Corvallis.
Fehr WR and Caviness CE (1977). Stage of soybean development. Iowa State University of Science and Technology, Ames.Ferreira Júnior JA, Unêda-Trevisoli SH, Espindola SMCG, Vianna VF, et al. (2015). Diversidade genética em linhagens
avançadas de soja oriundas de cruzamentos biparentais, quádruplos e óctuplos. Rev. Cien. Agron 46: 339-351.Hamawaki OT, Sousa LB, Romanato FN, Nogueira APO, et al. (2012). Genetic parameters and variability in soybean
genotypes. Comput. Sci. 3: 76-83.Hyten DL, Song Q, Zhu Y, Choi IY, et al. (2006). Impacts of genetic bottlenecks on soybean genome diversity. Proc. Natl.
Acad. Sci. USA 103: 16666-16671. http://dx.doi.org/10.1073/pnas.0604379103MAPA, Ministério da Agricultura e do Abastecimento. Anexo VI (1998). Requisitos mínimos para determinação do valor
de cultivo e uso de soja (Glycine max L.) para a inscrição no registro nacional de cultivares - RNC.Miranda ZFS, Arias CAA, Prete CEC, Kiihl RAS, et al. (2007). Genetic characterization of ninety elite soybean
cultivars using coefficient of parentage. Pesqui. Agropecu. Bras. 42: 363-369. http://dx.doi.org/10.1590/S0100-204X2007000300009
Mulato BM, Möller M, Zucchi MI, Quecin V, et al. (2010). Genetic diversity in soybean germplasm identified by SSR and EST-SSR markers. Pesqui. Agropecu. Bras. 45: 276-283.
Priolli RHG, Mendes-Junior CT, Sousa SMB, Sousa NEA, et al. (2004). Diversidade genética da soja entre períodos e entre programas de melhoramento no Brasil. Pesqui. Agropecu. Bras. 39: 967-975. http://dx.doi.org/10.1590/S0100-204X2004001000004
Romesburg HC (1984). Cluster analysis for researchers. Lifetime Learning Publications, Belmont.Rotili EA, Cancellier LL, Dotto MA, Peluzio JM, et al. (2012). Divergência genética em genótipos de milho, no Estado do
Tocantins. Rev. Cienc. Agron. 43: 516-521. http://dx.doi.org/10.1590/S1806-66902012000300014

13Genetic divergence of soybean (Glycine max)
Genetics and Molecular Research 15 (4): gmr.15048836
SAEG, Sistema para Análises Estatísticas: Versão 9.1 (2007). Fundação Artur Bernardes, UFV, Viçosa.Sediyama T (2015). Melhoramento genético da soja. Mecenas, Piracicaba.Selestrino PR, Unêda-Trevisoli SH, Silva FM, Pereira EM, et al. (2014). Performance agronômica de genótipos precoces
de soja destinadas a áreas de reforma de canavial. Cienc. Tecnol 6: 59-71.Silva GC, Oliveira FJ, Anunciação Filho CJ, Neto DES, et al. (2011). Divergência genética entre genótipos de cana-de-
açúcar. Agraria 6: 52-58. http://dx.doi.org/10.5039/agraria.v6i1a848Sneath PHA and Sokal RR (1973). Numerical taxonomy. San Francisco, W.R. Freeman.Veloso JS, Silva W, Pinheiro LR, Dos Santos JB, et al. (2015). Genetic divergence of common bean cultivars. Genet. Mol.
Res. 14: 11281-11291. http://dx.doi.org/10.4238/2015.September.22.22Vogt GA, Balbinot Júnior AA and Souza AM (2010). Divergência genética entre cultivares de girassol no Planalto Norte
Catarinense. Sci. Agrar 11: 307-315.Vieira EA, Carvalho FIF, Oliveira AC, Benin G, et al. (2005). Comparação entre medidas de distância genealógica,
morfológica e molecular em aveia em experimentos com e sem a aplicação de fungicida. Bragantia 64: 51-60. http://dx.doi.org/10.1590/S0006-87052005000100006
Yokomizo GKI, Duarte JB, Vello NA and Unfried JR (2013). AMMI analysis of grain yield in soybean lines selected for resistance to Asian rust. Pesqui. Agropecu. Bras. 48: 1376-1384. http://dx.doi.org/10.1590/S0100-204X2013001000009
Wysmierski PT and Vello NA (2013). The genetic base of Brazilian soybean cultivars: evolution over time and breeding implications. Genet. Mol. Biol. 36: 547-555. http://dx.doi.org/10.1590/S1415-47572013005000041