bbrazil soybean transportationrazil soybean transportation · brazil soybean transportation 7 may...
TRANSCRIPT
Record Brazilian Soybean Crop Drives Higher Transportation Cost. Brazil’s current record soybean harvest is expected to reach 73.6 million metric tons (mt) (CONAB)1, 7 percent higher than the 2009/2010 levels. The heavy rain of March 2011 delayed the soybean harvest in some regions of the Mato Grosso do Sul (MS), Mato Grosso (MT), Goiás (GO), Minas Gerais (MG) states (CONAB). The rain also led to port congestion at truck unloading export terminal facilities by preventing vessel loadings. Grain must remain dry because moisture can create mold, which lowers grain quality. For example, at the port of Paranaguá a line of trucks 20 miles long waited to unload grain. The delay was caused by heavy rain that prevented vessel’s loading, and a technical problem that disrupted truck service registration, overloading the system (Globo Rural). The port of Paranaguá is the second largest soybean export port, after Santos. Almost half of all soybean exports are shipped through these two ports. During the fi rst quarter of the year, 65 percent of the Brazil soybean production is harvested and, on average, about 14 percent of the crop is exported (CONAB).
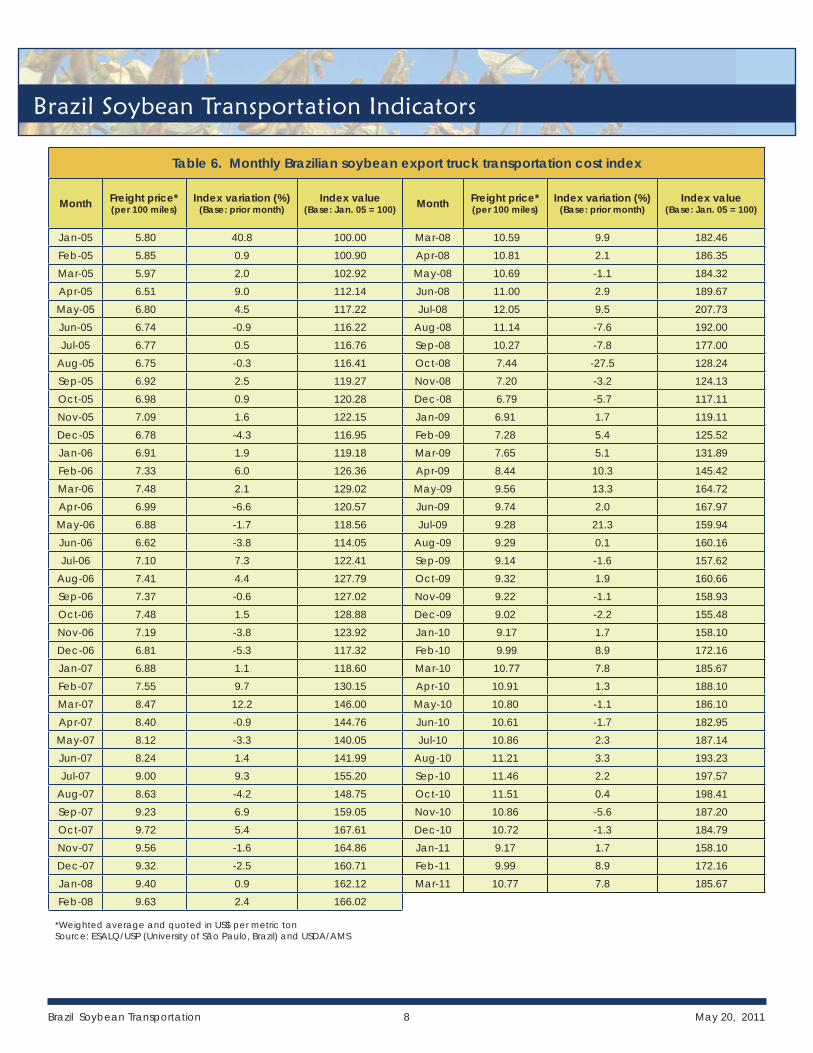
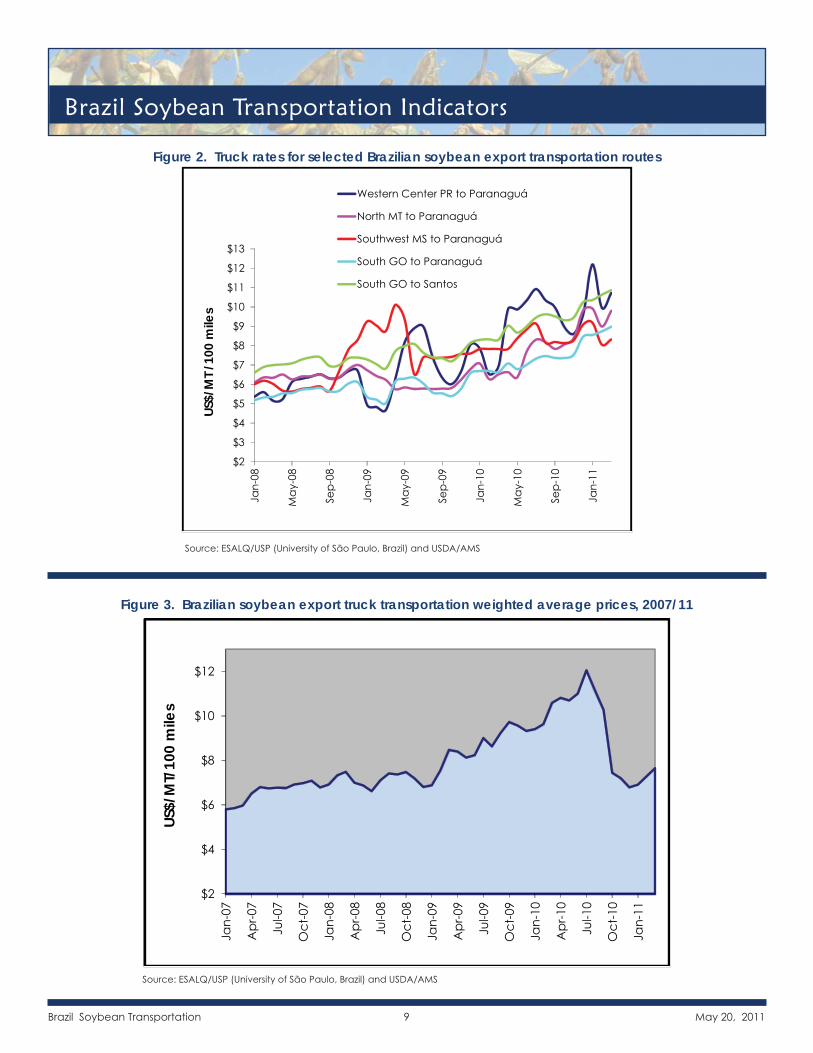
Truck rates typically rise during the fi rst half of the year because of the soybean harvest season. During the 2011 fi rst quarter, the cost of shipping a metric ton of soybeans 100 miles by truck increased nearly 15 percent from $9.97 in the fi rst quarter of 2010 to $11.46 in 2011. This increase surpassed the peak reached in the same period last year (table 6). During this quarter, transportation cost as a percentage of the total landed cost of soybean shipments to Shanghai declined up to 25 percent because of a drop in ocean rates and higher farm prices that offset the rise in truck rates (tables 1 and 2). The reais appreciated 7 percent against the dollar, from 1.8003 reais per US$ to 1.6673. The stronger reais helped producers by lowering prices of imported production inputs, such as chemicals, fertilizers, and farm equipment, as well as lowering ocean rates. For more information contact Delmy L. Salin at [email protected].
1 CONAB: National Company of Food and Supply, Brazilian Ministry of Agriculture, Livestock, and Supply.
Brazil Soybean TransportationBrazil Soybean Transportationa quarterly publication of the
Transportation and Marketing Programs/Transportation Services Divisionwww.ams.usda.gov/AgTransportation
May 20, 2011
Contents
Brazil Soybean Transportation Indicators
Brazil Soybean Transportation Guide: 2009 (PDF)
Contact Information
Data Sets
Subscription Information
Brazil Soybean Transportation 2 May 20, 2011
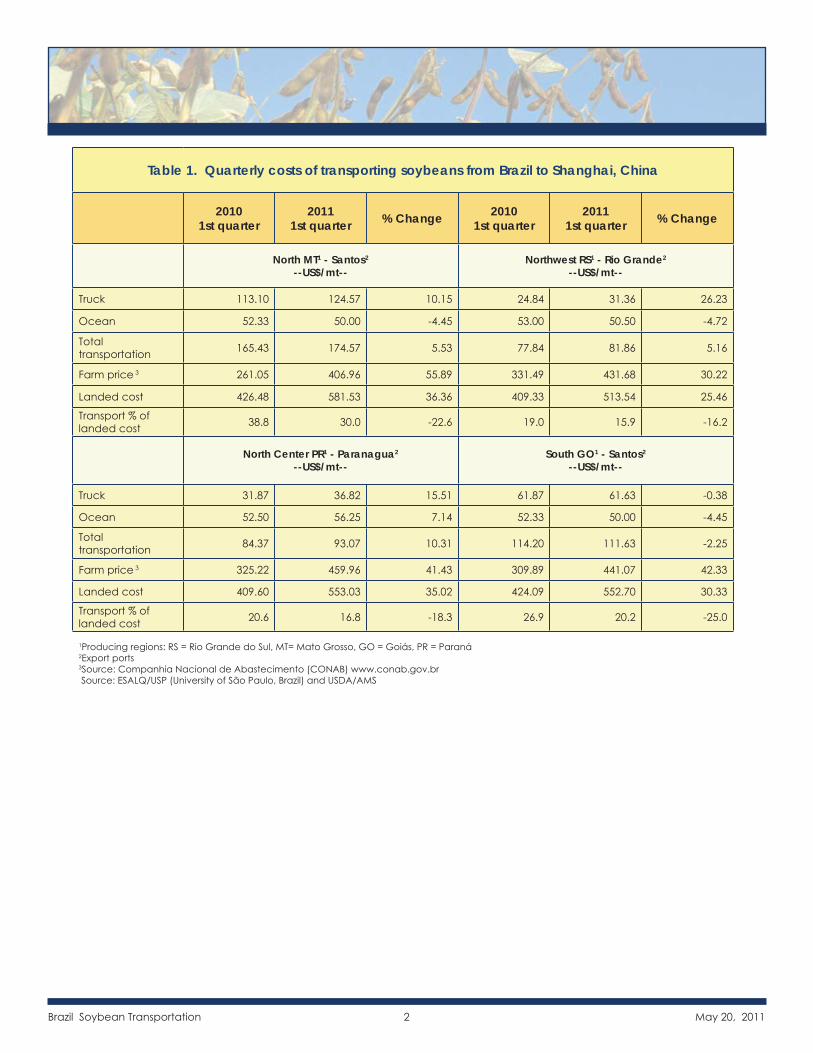
Table 1. Quarterly costs of transporting soybeans from Brazil to Shanghai, China
20101st quarter
20111st quarter % Change 2010
1st quarter2011
1st quarter % Change
North MT1 - Santos2 --US$/mt--
Northwest RS1 - Rio Grande2 --US$/mt--
Truck 113.10 124.57 10.15 24.84 31.36 26.23
Ocean 52.33 50.00 -4.45 53.00 50.50 -4.72
Total transportation 165.43 174.57 5.53 77.84 81.86 5.16
Farm price 3 261.05 406.96 55.89 331.49 431.68 30.22
Landed cost 426.48 581.53 36.36 409.33 513.54 25.46
Transport % of landed cost 38.8 30.0 -22.6 19.0 15.9 -16.2
North Center PR1 - Paranagua2 --US$/mt--
South GO1 - Santos2 --US$/mt--
Truck 31.87 36.82 15.51 61.87 61.63 -0.38
Ocean 52.50 56.25 7.14 52.33 50.00 -4.45
Total transportation 84.37 93.07 10.31 114.20 111.63 -2.25
Farm price 3 325.22 459.96 41.43 309.89 441.07 42.33
Landed cost 409.60 553.03 35.02 424.09 552.70 30.33
Transport % of landed cost 20.6 16.8 -18.3 26.9 20.2 -25.0
1Producing regions: RS = Rio Grande do Sul, MT= Mato Grosso, GO = Goiás, PR = Paraná 2Export ports3Source: Companhia Nacional de Abastecimento (CONAB) www.conab.gov.br Source: ESALQ/USP (University of São Paulo, Brazil) and USDA/AMS
Brazil Soybean Transportation 3 May 20, 2011
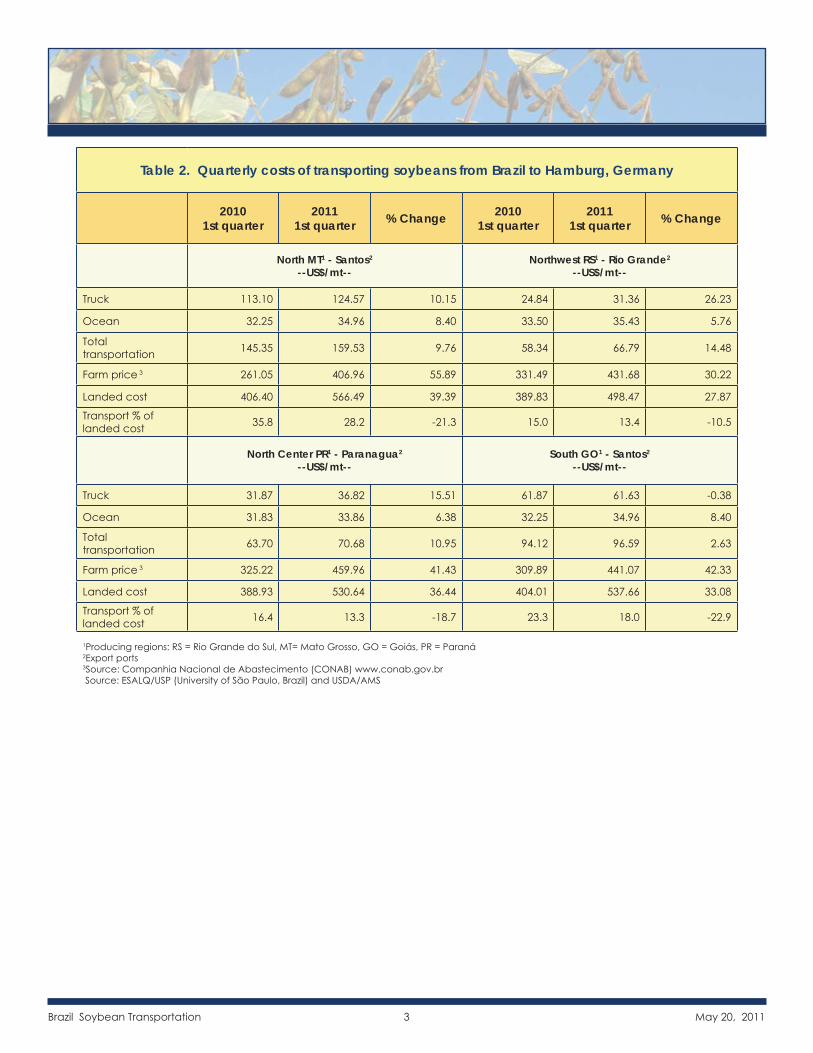
Table 2. Quarterly costs of transporting soybeans from Brazil to Hamburg, Germany
20101st quarter
20111st quarter % Change 2010
1st quarter2011
1st quarter % Change
North MT1 - Santos2 --US$/mt--
Northwest RS1 - Rio Grande2 --US$/mt--
Truck 113.10 124.57 10.15 24.84 31.36 26.23
Ocean 32.25 34.96 8.40 33.50 35.43 5.76
Total transportation 145.35 159.53 9.76 58.34 66.79 14.48
Farm price 3 261.05 406.96 55.89 331.49 431.68 30.22
Landed cost 406.40 566.49 39.39 389.83 498.47 27.87
Transport % of landed cost 35.8 28.2 -21.3 15.0 13.4 -10.5
North Center PR1 - Paranagua2 --US$/mt--
South GO1 - Santos2 --US$/mt--
Truck 31.87 36.82 15.51 61.87 61.63 -0.38
Ocean 31.83 33.86 6.38 32.25 34.96 8.40
Total transportation 63.70 70.68 10.95 94.12 96.59 2.63
Farm price 3 325.22 459.96 41.43 309.89 441.07 42.33
Landed cost 388.93 530.64 36.44 404.01 537.66 33.08
Transport % of landed cost 16.4 13.3 -18.7 23.3 18.0 -22.9
1Producing regions: RS = Rio Grande do Sul, MT= Mato Grosso, GO = Goiás, PR = Paraná 2Export ports3Source: Companhia Nacional de Abastecimento (CONAB) www.conab.gov.br Source: ESALQ/USP (University of São Paulo, Brazil) and USDA/AMS
Brazil Soybean Transportation 4 May 20, 2011
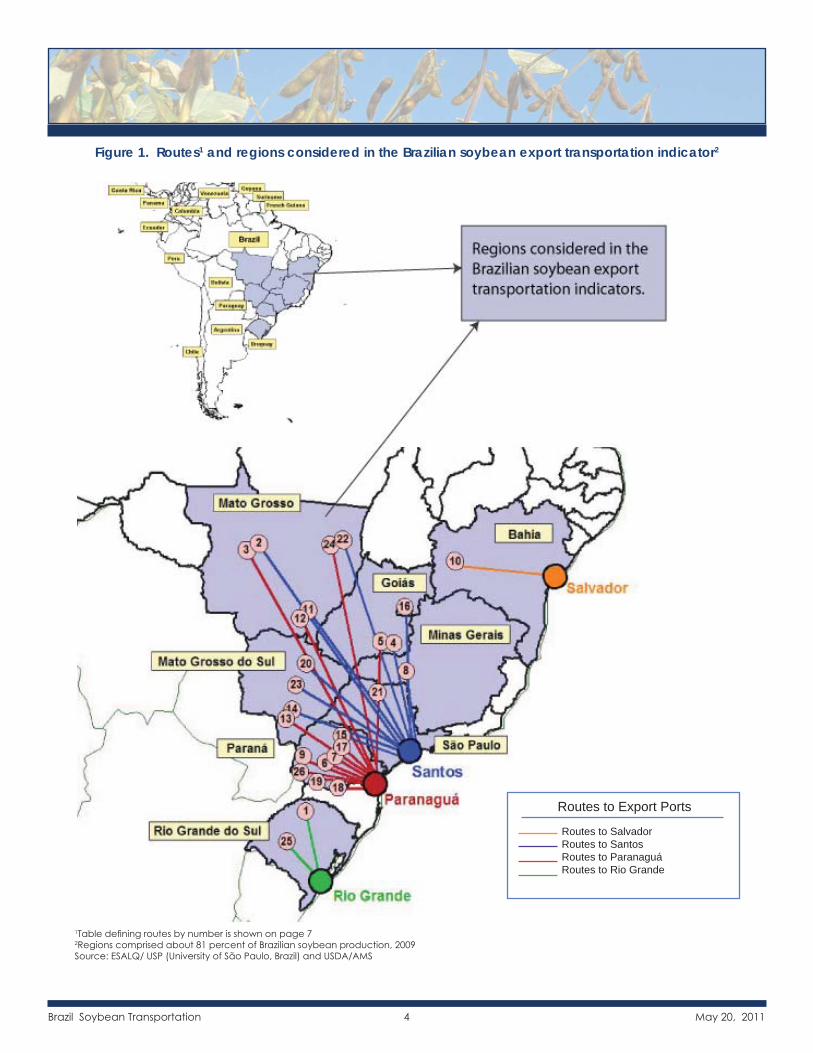
Figure 1. Routes1 and regions considered in the Brazilian soybean export transportation indicator2
Routes to Export Ports
Routes to Salvador Routes to Santos Routes to Paranaguá Routes to Rio Grande
1Table defi ning routes by number is shown on page 72Regions comprised about 81 percent of Brazilian soybean production, 2009Source: ESALQ/ USP (University of São Paulo, Brazil) and USDA/AMS
Brazil Soybean Transportation 5 May 20, 2011
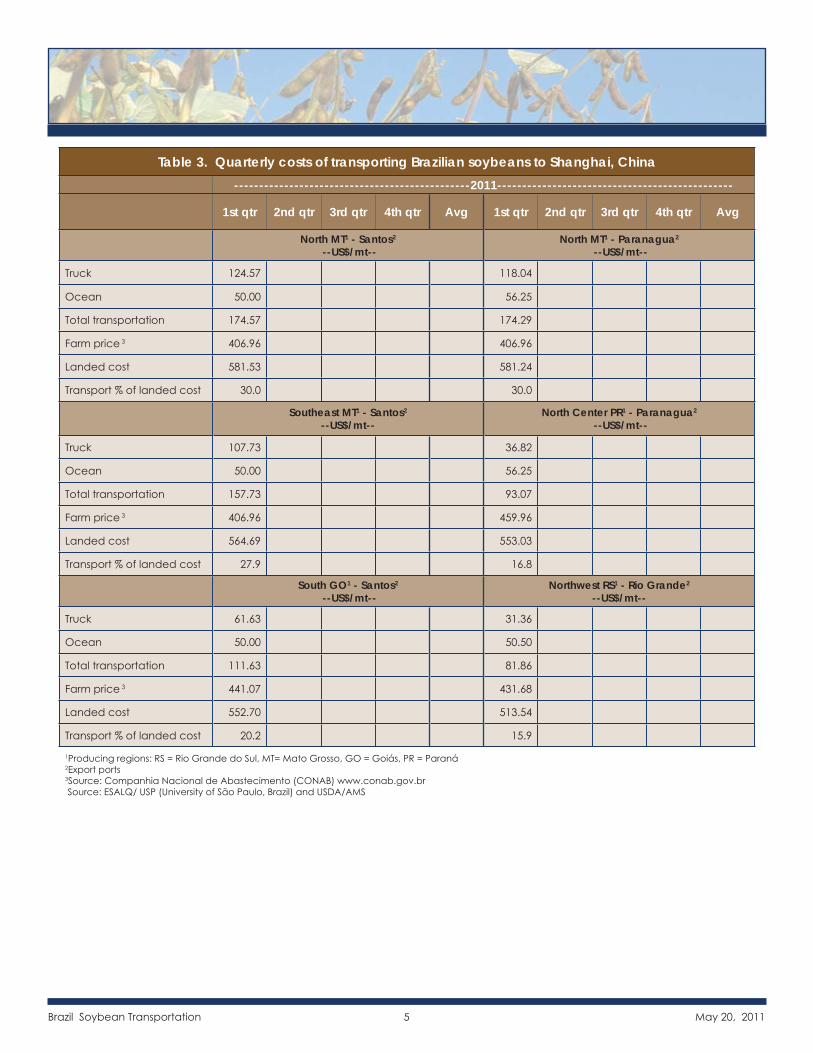
Table 3. Quarterly costs of transporting Brazilian soybeans to Shanghai, China-----------------------------------------------2011-----------------------------------------------
1st qtr 2nd qtr 3rd qtr 4th qtr Avg 1st qtr 2nd qtr 3rd qtr 4th qtr Avg
North MT1 - Santos2
--US$/mt-- North MT1 - Paranagua2
--US$/mt--
Truck 124.57 118.04
Ocean 50.00 56.25
Total transportation 174.57 174.29
Farm price 3 406.96 406.96
Landed cost 581.53 581.24
Transport % of landed cost 30.0 30.0
Southeast MT1 - Santos2
--US$/mt-- North Center PR1 - Paranagua2
--US$/mt--
Truck 107.73 36.82
Ocean 50.00 56.25
Total transportation 157.73 93.07
Farm price 3 406.96 459.96
Landed cost 564.69 553.03
Transport % of landed cost 27.9 16.8
South GO1 - Santos2
--US$/mt-- Northwest RS1 - Rio Grande2
--US$/mt--
Truck 61.63 31.36
Ocean 50.00 50.50
Total transportation 111.63 81.86
Farm price 3 441.07 431.68
Landed cost 552.70 513.54
Transport % of landed cost 20.2 15.9
1Producing regions: RS = Rio Grande do Sul, MT= Mato Grosso, GO = Goiás, PR = Paraná 2Export ports3Source: Companhia Nacional de Abastecimento (CONAB) www.conab.gov.br Source: ESALQ/ USP (University of São Paulo, Brazil) and USDA/AMS
Brazil Soybean Transportation 6 May 20, 2011
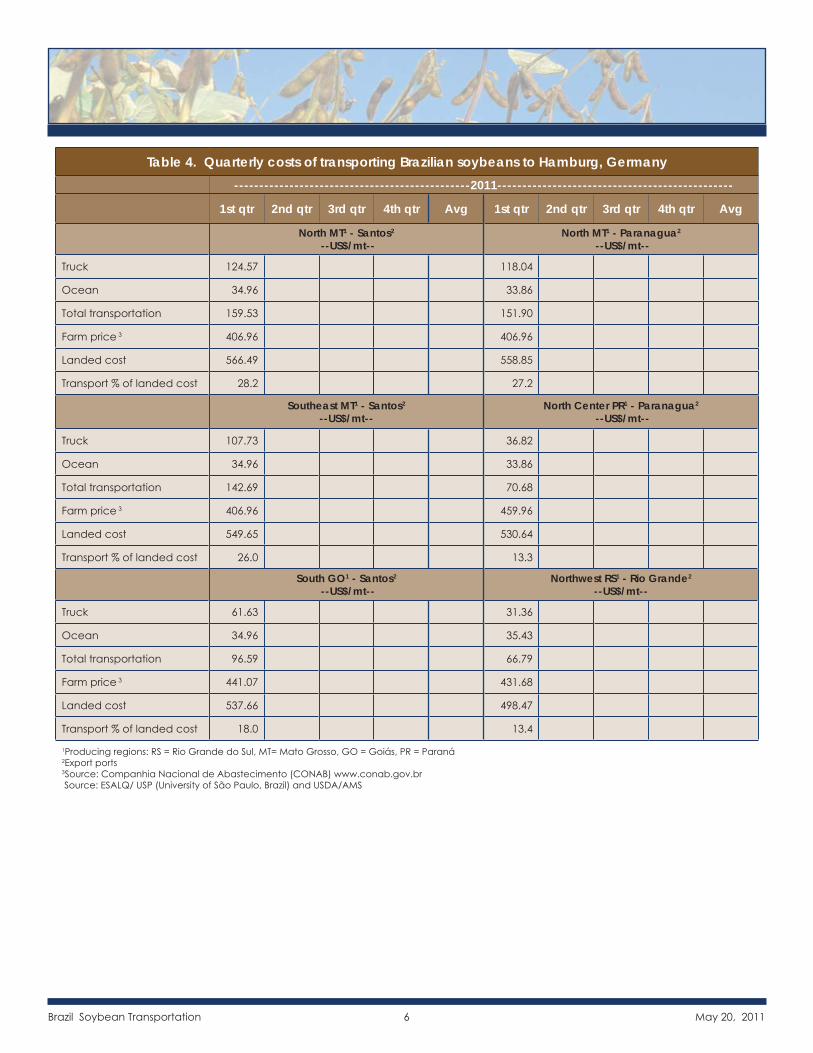
Table 4. Quarterly costs of transporting Brazilian soybeans to Hamburg, Germany-----------------------------------------------2011-----------------------------------------------
1st qtr 2nd qtr 3rd qtr 4th qtr Avg 1st qtr 2nd qtr 3rd qtr 4th qtr Avg
North MT1 - Santos2
--US$/mt-- North MT1 - Paranagua2
--US$/mt--
Truck 124.57 118.04
Ocean 34.96 33.86
Total transportation 159.53 151.90
Farm price 3 406.96 406.96
Landed cost 566.49 558.85
Transport % of landed cost 28.2 27.2
Southeast MT1 - Santos2
--US$/mt-- North Center PR1 - Paranagua2
--US$/mt--
Truck 107.73 36.82
Ocean 34.96 33.86
Total transportation 142.69 70.68
Farm price 3 406.96 459.96
Landed cost 549.65 530.64
Transport % of landed cost 26.0 13.3
South GO1 - Santos2
--US$/mt-- Northwest RS1 - Rio Grande2
--US$/mt--
Truck 61.63 31.36
Ocean 34.96 35.43
Total transportation 96.59 66.79
Farm price 3 441.07 431.68
Landed cost 537.66 498.47
Transport % of landed cost 18.0 13.4
1Producing regions: RS = Rio Grande do Sul, MT= Mato Grosso, GO = Goiás, PR = Paraná 2Export ports3Source: Companhia Nacional de Abastecimento (CONAB) www.conab.gov.br Source: ESALQ/ USP (University of São Paulo, Brazil) and USDA/AMS
Brazil Soybean Transportation 7 May 20, 2011
Brazil Soybean Transportation Indicators
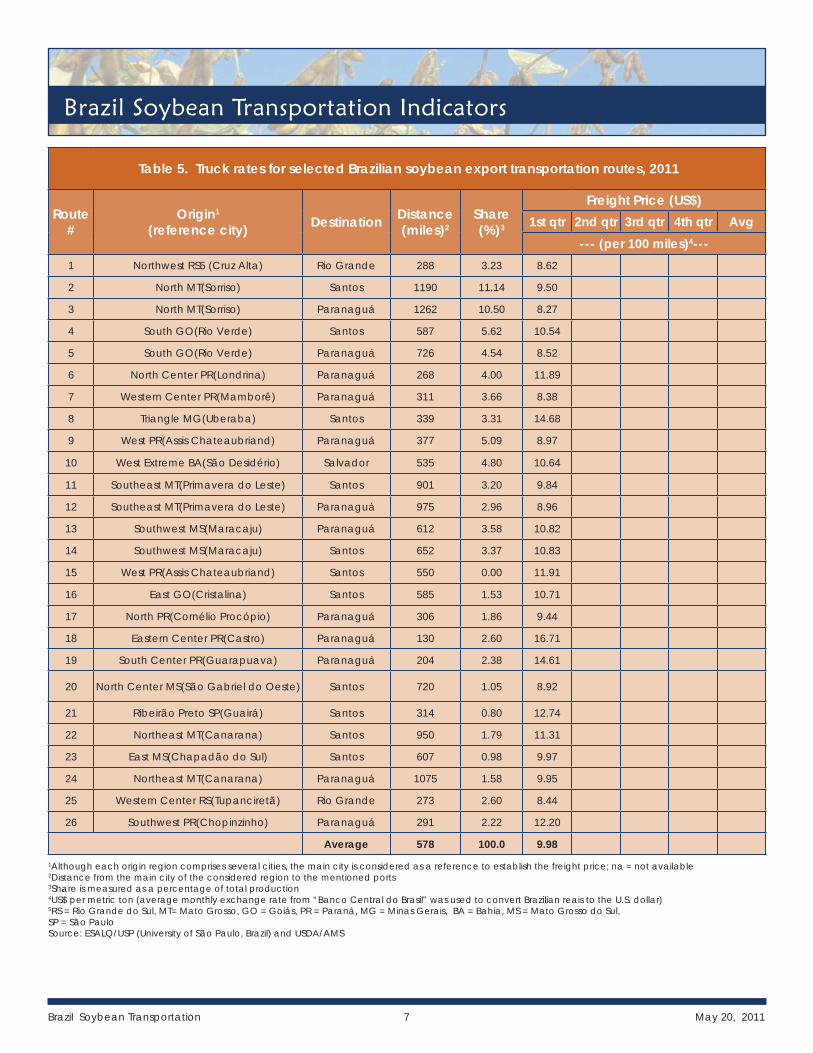
Table 5. Truck rates for selected Brazilian soybean export transportation routes, 2011
Route #
Origin1 (reference city) Destination Distance
(miles)2Share(%)3
Freight Price (US$)1st qtr 2nd qtr 3rd qtr 4th qtr Avg
--- (per 100 miles)4---1 Northwest RS5 (Cruz Alta) Rio Grande 288 3.23 8.62
2 North MT(Sorriso) Santos 1190 11.14 9.50
3 North MT(Sorriso) Paranaguá 1262 10.50 8.27
4 South GO(Rio Verde) Santos 587 5.62 10.54
5 South GO(Rio Verde) Paranaguá 726 4.54 8.52
6 North Center PR(Londrina) Paranaguá 268 4.00 11.89
7 Western Center PR(Mamborê) Paranaguá 311 3.66 8.38
8 Triangle MG(Uberaba) Santos 339 3.31 14.68
9 West PR(Assis Chateaubriand) Paranaguá 377 5.09 8.97
10 West Extreme BA(São Desidério) Salvador 535 4.80 10.64
11 Southeast MT(Primavera do Leste) Santos 901 3.20 9.84
12 Southeast MT(Primavera do Leste) Paranaguá 975 2.96 8.96
13 Southwest MS(Maracaju) Paranaguá 612 3.58 10.82
14 Southwest MS(Maracaju) Santos 652 3.37 10.83
15 West PR(Assis Chateaubriand) Santos 550 0.00 11.91
16 East GO(Cristalina) Santos 585 1.53 10.71
17 North PR(Cornélio Procópio) Paranaguá 306 1.86 9.44
18 Eastern Center PR(Castro) Paranaguá 130 2.60 16.71
19 South Center PR(Guarapuava) Paranaguá 204 2.38 14.61
20 North Center MS(São Gabriel do Oeste) Santos 720 1.05 8.92
21 Ribeirão Preto SP(Guairá) Santos 314 0.80 12.74
22 Northeast MT(Canarana) Santos 950 1.79 11.31
23 East MS(Chapadão do Sul) Santos 607 0.98 9.97
24 Northeast MT(Canarana) Paranaguá 1075 1.58 9.95
25 Western Center RS(Tupanciretã) Rio Grande 273 2.60 8.44
26 Southwest PR(Chopinzinho) Paranaguá 291 2.22 12.20
Average 578 100.0 9.981Although each origin region comprises several cities, the main city is considered as a reference to establish the freight price; na = not available2Distance from the main city of the considered region to the mentioned ports3Share is measured as a percentage of total production4US$ per metric ton (average monthly exchange rate from “Banco Central do Brasil” was used to convert Brazilian reais to the U.S. dollar)5RS = Rio Grande do Sul, MT= Mato Grosso, GO = Goiás, PR = Paraná, MG = Minas Gerais, BA = Bahia, MS = Mato Grosso do Sul, SP = São PauloSource: ESALQ/USP (University of São Paulo, Brazil) and USDA/AMS
Brazil Soybean Transportation 8 May 20, 2011
Table 6. Monthly Brazilian soybean export truck transportation cost index
Month Freight price* (per 100 miles)
Index variation (%) (Base: prior month)
Index value (Base: Jan. 05 = 100) Month Freight price*
(per 100 miles)Index variation (%)
(Base: prior month)Index value
(Base: Jan. 05 = 100)
Jan-05 5.80 40.8 100.00 Mar-08 10.59 9.9 182.46Feb-05 5.85 0.9 100.90 Apr-08 10.81 2.1 186.35Mar-05 5.97 2.0 102.92 May-08 10.69 -1.1 184.32Apr-05 6.51 9.0 112.14 Jun-08 11.00 2.9 189.67May-05 6.80 4.5 117.22 Jul-08 12.05 9.5 207.73Jun-05 6.74 -0.9 116.22 Aug-08 11.14 -7.6 192.00Jul-05 6.77 0.5 116.76 Sep-08 10.27 -7.8 177.00
Aug-05 6.75 -0.3 116.41 Oct-08 7.44 -27.5 128.24Sep-05 6.92 2.5 119.27 Nov-08 7.20 -3.2 124.13Oct-05 6.98 0.9 120.28 Dec-08 6.79 -5.7 117.11Nov-05 7.09 1.6 122.15 Jan-09 6.91 1.7 119.11Dec-05 6.78 -4.3 116.95 Feb-09 7.28 5.4 125.52Jan-06 6.91 1.9 119.18 Mar-09 7.65 5.1 131.89Feb-06 7.33 6.0 126.36 Apr-09 8.44 10.3 145.42Mar-06 7.48 2.1 129.02 May-09 9.56 13.3 164.72Apr-06 6.99 -6.6 120.57 Jun-09 9.74 2.0 167.97May-06 6.88 -1.7 118.56 Jul-09 9.28 21.3 159.94Jun-06 6.62 -3.8 114.05 Aug-09 9.29 0.1 160.16Jul-06 7.10 7.3 122.41 Sep-09 9.14 -1.6 157.62
Aug-06 7.41 4.4 127.79 Oct-09 9.32 1.9 160.66Sep-06 7.37 -0.6 127.02 Nov-09 9.22 -1.1 158.93Oct-06 7.48 1.5 128.88 Dec-09 9.02 -2.2 155.48Nov-06 7.19 -3.8 123.92 Jan-10 9.17 1.7 158.10Dec-06 6.81 -5.3 117.32 Feb-10 9.99 8.9 172.16Jan-07 6.88 1.1 118.60 Mar-10 10.77 7.8 185.67Feb-07 7.55 9.7 130.15 Apr-10 10.91 1.3 188.10Mar-07 8.47 12.2 146.00 May-10 10.80 -1.1 186.10Apr-07 8.40 -0.9 144.76 Jun-10 10.61 -1.7 182.95May-07 8.12 -3.3 140.05 Jul-10 10.86 2.3 187.14Jun-07 8.24 1.4 141.99 Aug-10 11.21 3.3 193.23Jul-07 9.00 9.3 155.20 Sep-10 11.46 2.2 197.57
Aug-07 8.63 -4.2 148.75 Oct-10 11.51 0.4 198.41Sep-07 9.23 6.9 159.05 Nov-10 10.86 -5.6 187.20Oct-07 9.72 5.4 167.61 Dec-10 10.72 -1.3 184.79Nov-07 9.56 -1.6 164.86 Jan-11 9.17 1.7 158.10Dec-07 9.32 -2.5 160.71 Feb-11 9.99 8.9 172.16Jan-08 9.40 0.9 162.12 Mar-11 10.77 7.8 185.67Feb-08 9.63 2.4 166.02
*Weighted average and quoted in US$ per metric ton Source: ESALQ/USP (University of São Paulo, Brazil) and USDA/AMS
Brazil Soybean Transportation Indicators
Brazil Soybean Transportation 9 May 20, 2011
Figure 3. Brazilian soybean export truck transportation weighted average prices, 2007/11
Figure 2. Truck rates for selected Brazilian soybean export transportation routes
Source: ESALQ/USP (University of São Paulo, Brazil) and USDA/AMS
Source: ESALQ/USP (University of São Paulo, Brazil) and USDA/AMS
Brazil Soybean Transportation Indicators
$2
$3
$4
$5
$6
$7
$8
$9
$10
$11
$12
$13Ja
n-08
May
-08
Sep-
08
Jan-
09
May
-09
Sep-
09
Jan-
10
May
-10
Sep-
10
Jan-
11
US$/
MT /
100
mile
sWestern Center PR to Paranaguá
North MT to Paranaguá
Southwest MS to Paranaguá
South GO to Paranaguá
South GO to Santos
$2
$4
$6
$8
$10
$12
Jan-
07
Apr
-07
Jul-0
7
Oct
-07
Jan-
08
Apr
-08
Jul-0
8
Oct
-08
Jan-
09
Apr
-09
Jul-0
9
Oct
-09
Jan-
10
Apr
-10
Jul-1
0
Oct
-10
Jan-
11
US$/
MT/
100
mile
s
Brazil Soybean Transportation 10 May 20, 2011
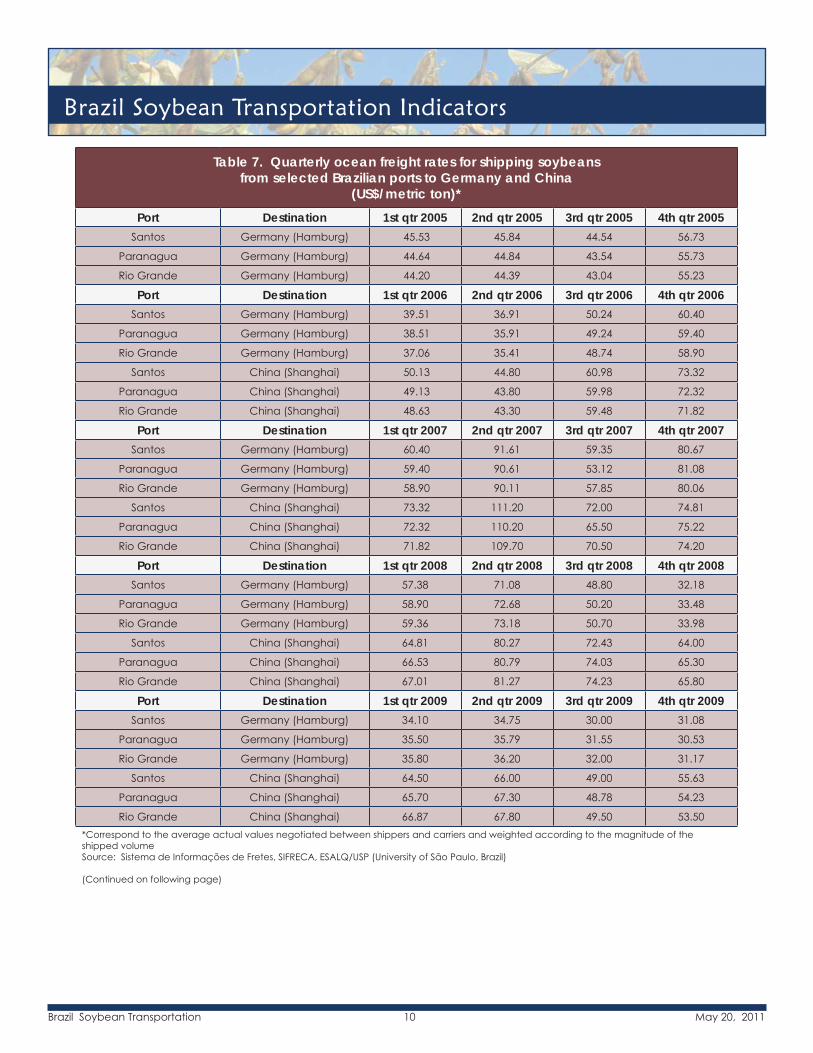
Table 7. Quarterly ocean freight rates for shipping soybeans from selected Brazilian ports to Germany and China
(US$/metric ton)*Port Destination 1st qtr 2005 2nd qtr 2005 3rd qtr 2005 4th qtr 2005
Santos Germany (Hamburg) 45.53 45.84 44.54 56.73
Paranagua Germany (Hamburg) 44.64 44.84 43.54 55.73
Rio Grande Germany (Hamburg) 44.20 44.39 43.04 55.23
Port Destination 1st qtr 2006 2nd qtr 2006 3rd qtr 2006 4th qtr 2006Santos Germany (Hamburg) 39.51 36.91 50.24 60.40
Paranagua Germany (Hamburg) 38.51 35.91 49.24 59.40
Rio Grande Germany (Hamburg) 37.06 35.41 48.74 58.90
Santos China (Shanghai) 50.13 44.80 60.98 73.32
Paranagua China (Shanghai) 49.13 43.80 59.98 72.32
Rio Grande China (Shanghai) 48.63 43.30 59.48 71.82
Port Destination 1st qtr 2007 2nd qtr 2007 3rd qtr 2007 4th qtr 2007Santos Germany (Hamburg) 60.40 91.61 59.35 80.67
Paranagua Germany (Hamburg) 59.40 90.61 53.12 81.08
Rio Grande Germany (Hamburg) 58.90 90.11 57.85 80.06
Santos China (Shanghai) 73.32 111.20 72.00 74.81
Paranagua China (Shanghai) 72.32 110.20 65.50 75.22
Rio Grande China (Shanghai) 71.82 109.70 70.50 74.20
Port Destination 1st qtr 2008 2nd qtr 2008 3rd qtr 2008 4th qtr 2008Santos Germany (Hamburg) 57.38 71.08 48.80 32.18
Paranagua Germany (Hamburg) 58.90 72.68 50.20 33.48
Rio Grande Germany (Hamburg) 59.36 73.18 50.70 33.98
Santos China (Shanghai) 64.81 80.27 72.43 64.00
Paranagua China (Shanghai) 66.53 80.79 74.03 65.30
Rio Grande China (Shanghai) 67.01 81.27 74.23 65.80
Port Destination 1st qtr 2009 2nd qtr 2009 3rd qtr 2009 4th qtr 2009Santos Germany (Hamburg) 34.10 34.75 30.00 31.08
Paranagua Germany (Hamburg) 35.50 35.79 31.55 30.53
Rio Grande Germany (Hamburg) 35.80 36.20 32.00 31.17
Santos China (Shanghai) 64.50 66.00 49.00 55.63
Paranagua China (Shanghai) 65.70 67.30 48.78 54.23
Rio Grande China (Shanghai) 66.87 67.80 49.50 53.50*Correspond to the average actual values negotiated between shippers and carriers and weighted according to the magnitude of the shipped volumeSource: Sistema de Informações de Fretes, SIFRECA, ESALQ/USP (University of São Paulo, Brazil) (Continued on following page)
Brazil Soybean Transportation Indicators
Brazil Soybean Transportation 11 May 20, 2011
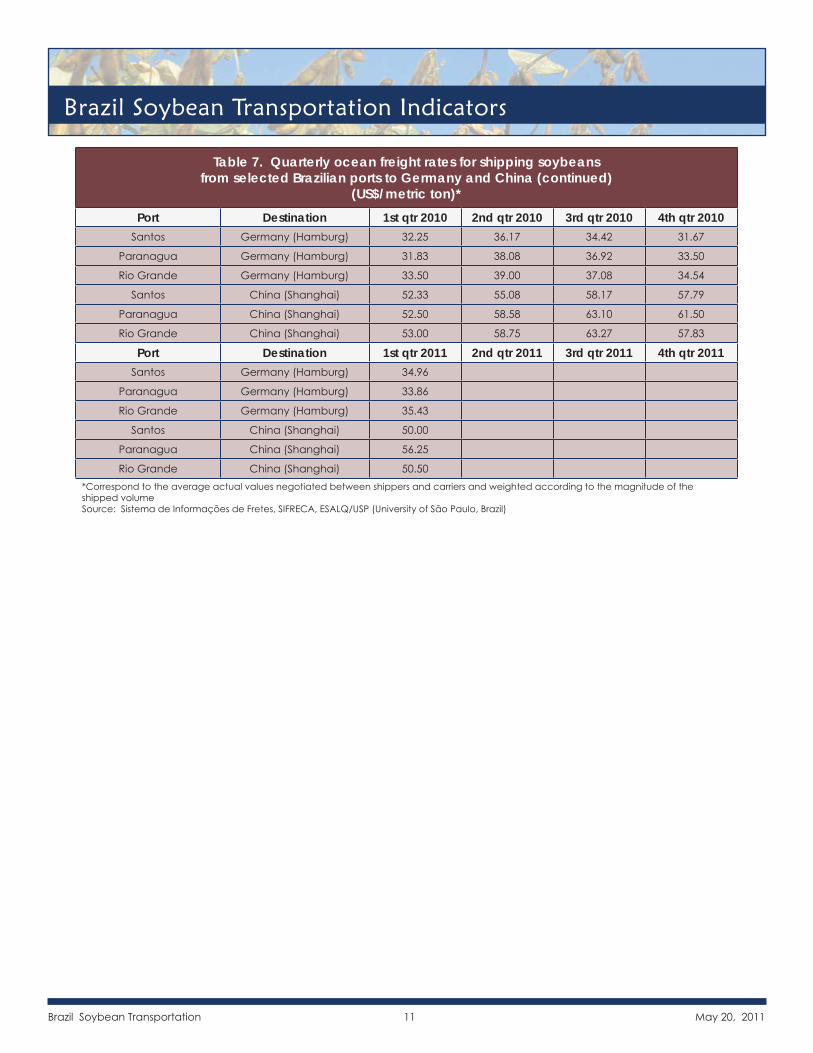
Table 7. Quarterly ocean freight rates for shipping soybeans from selected Brazilian ports to Germany and China (continued)
(US$/metric ton)*Port Destination 1st qtr 2010 2nd qtr 2010 3rd qtr 2010 4th qtr 2010
Santos Germany (Hamburg) 32.25 36.17 34.42 31.67
Paranagua Germany (Hamburg) 31.83 38.08 36.92 33.50
Rio Grande Germany (Hamburg) 33.50 39.00 37.08 34.54
Santos China (Shanghai) 52.33 55.08 58.17 57.79
Paranagua China (Shanghai) 52.50 58.58 63.10 61.50
Rio Grande China (Shanghai) 53.00 58.75 63.27 57.83
Port Destination 1st qtr 2011 2nd qtr 2011 3rd qtr 2011 4th qtr 2011Santos Germany (Hamburg) 34.96
Paranagua Germany (Hamburg) 33.86
Rio Grande Germany (Hamburg) 35.43
Santos China (Shanghai) 50.00
Paranagua China (Shanghai) 56.25
Rio Grande China (Shanghai) 50.50*Correspond to the average actual values negotiated between shippers and carriers and weighted according to the magnitude of the shipped volumeSource: Sistema de Informações de Fretes, SIFRECA, ESALQ/USP (University of São Paulo, Brazil)
Brazil Soybean Transportation Indicators
Brazil Soybean Transportation 12 May 20, 2011
Contact Information:
Delmy L. SalinSenior Economist, Project Manager [email protected] (202) 694-3052
Jessica E. LaddGraphic Analyst [email protected] (202) 720-6494
Data Sets:
Figure 2: ♦ Truck rates for selected Brazilian soybean export transportation routes (XLS)
Figure 3: ♦ Brazilian soybean export truck transportation weighted average prices, 2007/11 (XLS)
Table 1: ♦ Quarterly costs of transporting soybeans from Brazil to Shanghai, China (XLS)
Table 2: ♦ Quarterly costs of transporting soybeans from Brazil to Hamburg, Germany (XLS)
Table 3: Quarterly costs of transporting Brazilian soybeans to Shanghai, China (XLS) ♦Table 4: Quarterly costs of transporting Brazilian soybeans to Hamburg, Germany (XLS) ♦Table 5: Truck rates for selected Brazilian soybean export transportation routes, 2011 (XLS) ♦Table 6: Monthly Brazilian soybean export truck transportation cost index (XLS) ♦Table 7: Quarterly ocean freight rates for shipping soybeans from selected Brazilian ports to Germany and ♦China (XLS)
Subscription Information: Send relevant information to [email protected] for an electronic copy.
Related Websites:
Soybean Transportation Guide: Brazil 2009 (PDF ♦ )
Prior Articles: Brazil Soybean Transportation, March 14, 2011 (PDF ♦ )
Related Articles: Grain Transportation Report, March 31, 2011 (PDF ♦ )
U.S. Corn, Soybean, and Wheat Quarterly Transportation Cost Indicator Report ♦ s
The U.S. Department of Agriculture (USDA) prohibits discrimination in all its programs and activities on the basis of race, color, national origin, age, disability, and where applicable, sex, marital status, familial status, parental status, religion, sexual orientation, genetic information, political beliefs, reprisal, or because all or part of an individual’s income is derived from any public assistance program (Not all prohibited bases apply to all programs.) Persons with disabilities who require alternative means for communication of program information (Braille, large print, audiotape, etc.) should contact USDA’s TARGET Center at (202) 720-2600 (voice and TDD). To fi le a complaint of discrimination, write to USDA, Director, Offi ce of Civil Rights, 1400 Independence Avenue, S.W., Washington, D.C. 20250-9410, or call (800) 795-3272 (voice) or (202) 720-6382 (TDD). USDA is an equal opportunity provider and employer.