analysis of the electric vehicle industry - robert b....
TRANSCRIPT

CREATING THE CLEAN ENERGY ECONOMY
Analysis of the Electric Vehicle Industry
CCrreeaattiinngg tthhee CClleeaann EEnneerrggyy
EEccoonnoommyy
Analysis of the Electric Vehicle Industry
Primary Authors
Jennifer Todd is an Economic Development Associate at IEDC. Jess Chen is a Research Fellow and
a PhD candidate at American University. Frankie Clogston is an IEDC Consultant and a PhD
candidate at Johns Hopkins University.
Primary Editors
Liz Thorstensen, Vice President of Knowledge Management & Economic Development Practice, Tye
Libby, Associate, Knowledge Management and Development
Acknowledgements
IEDC is grateful to the Rockefeller Brothers Fund for its generous support of this research project.
Special thanks Lauren Avioli, Emily Brown, and Patrick McHugh for research support, and Mishka
Parkins, who provided technical assistance for the creative design of the report.
© Copyright 2013 International Economic Development Council
This report was made possible by a grant from the Rockefeller Brothers Fund.

Paul Krutko, FM
President and Chief Executive Officer,
Ann Arbor SPARK
Chairman of the IEDC Board
Jay C. Moon, CEcD, FM
President and CEO,
Mississippi Manufacturers Association
Immediate Past Chairman of the IEDC Board
Jeffrey A. Finkle, CEcD
President & CEO
International Economic Development Council
International Economic Development Council
734 15th Street NW / Suite 900
Washington, DC 20005
www.iedconline.org | Phone: (202) 223-7800 | Fax: (202) 223-4745
International Economic Development Council
IEDC is the world's largest membership organization serving the economic development
profession, with over 4,500 members, and a network of over 25,000 economic development
professionals and allies. From public to private, rural to urban, and local to international, our
members represent the entire range of economic development experience. IEDC is dedicated to
helping economic developers do their job more effectively and raising the profile of the
profession. When we succeed, our members create more high-quality jobs, develop more vibrant
communities, and generally improve the quality of life in their regions.
The issue of sustainability has been designated a strategic priority by the IEDC Board of
Directors. Further, sustainability and policy responses to climate change are growing issues for our
members. Through a range of services, including: conferences, training courses, webinars,
publications, research and technical assistance efforts, we are striving to be on the cutting edge
of understanding the opportunities and challenges stemming from sustainability, climate change
and economic transformation. For more information about IEDC visit www.iedconline.org

INTERNATIONAL ECONOMIC DEVELOPMENT COUNCIL 3
TTAABBLLEE OOFF CCOONNTTEENNTTSS
Introduction to Electric Vehicles ................................................................................................................... 4
Job Creation Potential of Electric Vehicles ......................................................................................... 12
The State of the U.S. Electric Vehicle Market ..................................................................................... 23
Hurdles and Solutions: Electric Vehicles Market ................................................................................... 61
Reduce the Cost of PEVs ......................................................................................................................... 63
Expand Charging Infrastructure ............................................................................................................ 73
Educate Consumer Perception ............................................................................................................... 83
Convention Gas Cars: Lessons for Electric Vehicles ........................................................................... 90
INTERNATIONAL ECONOMIC DEVELOPMENT COUNCIL 4
IINNTTRROODDUUCCTTIIOONN TTOO EELLEECCTTRRIICC
VVEEHHIICCLLEESS
Of all the oil consumed in the U.S., 70 percent is used for transportation. Further, passenger
vehicles use 70 percent of transportation oil.1 Globally, a rising middle class in China and India is
causing demand for passenger cars to balloon, and with it, demand for oil. By 2050, there may
be as many as 1.5 billion cars on the road, compared to 750 million in 2010.2
This type of demand represents both a challenge and an opportunity to capitalize on new vehicle
technologies, and in the process, reap substantial economic development benefits. In a world
where oil is a limited resource, an alternate source of transportation fuel – electricity – is not only
a smart investment, but as some would say, it is an inevitable one. Further, the switch to electric
vehicles will generate demand for existing jobs and create new jobs as well. As study after study
confirms, job growth in electric vehicle industries will outweigh any reduction of jobs in traditional
fuel industries, resulting in net job growth. Electric vehicles create additional economic
development opportunities by improving quality of life, reducing energy spending, and
decreasing reliance on foreign oil.
TThhee IImmppoorrttaannccee ooff EElleeccttrriicc VVeehhiicclleess ttoo EEccoonnoommiicc DDeevveellooppmmeenntt
Like any transformative new technology, electric vehicles create a variety of potent economic
development challenges and opportunities. While the electric vehicle market is still at a relatively
early stage of development, it is poised to reshape industries and communities the world over.
This section provides a quick overview of the potential benefits of electric vehicles so that
economic developers can better assess what the evolution of this market will mean to their specific
local communities.
1 Harvard Kennedy School, Belfer Center for Science and International Affairs. (2011, July). Will Electric Cars Transform the U.S. Car Market? Cambridge: Lee, H. & Lovellette, G. Retrieved from
http://belfercenter.ksg.harvard.edu/files/Lee%20Lovellette%20Electric%20Vehicles%20DP%202011%20web.pdf 2 Harvard Kennedy School, Belfer Center for Science and International Affairs. (2011, July). Will Electric Cars Transform the U.S. Car Market? Cambridge: Lee, H. & Lovellette, G. Retrieved from http://belfercenter.ksg.harvard.edu/files/Lee%20Lovellette%20Electric%20Vehicles%20DP%202011%20web.pdf
INTERNATIONAL ECONOMIC DEVELOPMENT COUNCIL 5
EElleeccttrriicc VVeehhiicclleess CCrreeaattee JJoobbss
At this point it is difficult to reliably estimate the total job creation potential of electric vehicles.
More electric vehicles, however, would also likely lead to some job losses in the oil industry. With
that said, there is good reason to expect that electrification of personal transportation can drive
job creation in a host of industries. More efficient automobiles require more technology, which are
designed and produced by adding workers to the auto industry.3 Many of these jobs would be
created in industrial sectors closely tied to auto manufacturing, advanced batteries, and research
and development.
Moreover, electric vehicles are much cheaper to operate than conventional vehicles. Drivers who
switch to electric vehicles will have more disposable income to spend in other sectors of the
economy, such as housing and services. Spending in these sectors keeps more wealth moving within
local economies and will drive job creation in sectors not immediately connected to producing
electric vehicles.
These ideas are summed up in the different types of job creation. Direct jobs are created through
increased production by firms that make PEVs, PEV components, and PEV infrastructure. Indirect
jobs are those tied to firms that supply to these direct producers. Further, higher employment in
direct and indirect jobs leads to more spending in the broader economy. These create induced
jobs in industries like food, clothing, and entertainment. One leading estimate of total job creation
from PEVs – direct, indirect, and induced – is that provided by the BlueGreen Alliance/American
Council for an Energy-Efficient Economy. The organization predicts that the new federal vehicle
standards passed in 2012 will result in the creation of 570,000 jobs, including 50,000 in vehicle
manufacturing.4
EElleeccttrriicc VVeehhiiccllee IInnffrraassttrruuccttuurree IImmpprroovveess QQuuaalliittyy ooff LLiiffee
Early adopters of electric vehicles face significant constraints in where they can live and work.
Before charging infrastructure becomes widespread, communities that can offer adequate
charging locations and PEV purchase incentives will have an advantage in attracting and
3 BlueGreen Alliance/American Council for Energy-Efficient Economy. (June 2012). Gearing Up: Smart Standards Create Good Jobs Building Cleaner Cars. Washington, D.C. Retrieved from http://www.drivinggrowth.org/wp-content/uploads/2012/06/BGA-Auto-Report.pdf 4 Ibid.

INTERNATIONAL ECONOMIC DEVELOPMENT COUNCIL 6
retaining workers who want to make the switch to electrified transportation. Critically, from an
economic development perspective, there is good reason to expect that early adopters of electric
vehicles will also be highly talented workers. Surveys of buyers who preordered the Nissan Leaf
indicate they are an educated and tech-savvy group. In fact, the average Leaf buyer is:
Around 45 years old,
Owns a home and a garage,
Makes about $125,000 a year,
Is college-educated, and
Already owns a fuel-efficient vehicle such as the Toyota Prius.5
Surveys by the University of Michigan and Pike Research found that the more education a person
has, the more likely he or she is to be interested in purchasing a plug-in hybrid vehicle.6 Those with
higher income are also more likely to purchase a PEV.7 However, a Deloitte survey found that
even these early adopters are sensitive to government incentives and overall cost considerations.8
Thus, communities that adopt charging infrastructure and offer purchase incentives can strengthen
their appeal to these educated, wealthier workers.
EElleeccttrriicc VVeehhiicclleess CCaann RReedduuccee RReelliiaannccee oonn FFoorreeiiggnn OOiill
According to the U.S. Energy Information Administration, over 80 percent of the cost of a gallon
of gas immediately leaves the local economy.9 Further, higher gas prices means retailers typically
charge a lower markup in an attempt to compete, thereby reducing local profits even more.10
5 Gordon-Bloomfield, N. (2010, September 10). Just Who is a Typical 2011 Nissan Leaf Buyer? We Find Out. Green Car Reports. Retrieved from http://www.greencarreports.com/news/1049202_just-who-is-a-typical-2011-nissan-leaf-buyer-we-find-out 6 University of Michigan. (2009). Plug-In Hybrid Electric Vehicles. Ann Arbor: Curtin, R., Shrago, Y., & Mikkelson, J. Retrieved from http://www.ns.umich.edu/Releases/2009/Oct09/PHEV_Curtin.pdf, Pike Research. (2011). Electric Vehicle Consumer Survey. Boulder: Vyas, C., Hurst, D. & Gartner, J. Retrieved from http://www.pikeresearch.com/wordpress/wp-content/uploads/2011/12/EVCS-11-Executive-Summary.pdf 7 Ibid. 8 Deloitte. (April 2011). Gaining Traction: Will consumers ride the electric vehicle wave? Retrieved from http://www.deloitte.com/assets/Dcom-Australia/Local%20Assets/Documents/news-research/Press%20releases/Deloitte%20EV%20Survey%20Summary%20Findings.pdf 9 U.S. Energy Information Administration. (2012, September 10). Gasoline and Diesel Fuel Update. Retrieved from http://www.eia.gov/petroleum/gasdiesel/ 10 National Association of Convenience Stores. (2011). NACS Annual Fuels Report 2011. Retrieved from http://www.nacsonline.com/NACS/Resources/campaigns/GasPrices_2011/Documents/GasPriceKit2011.pdf

INTERNATIONAL ECONOMIC DEVELOPMENT COUNCIL 7
Most communities are not significant producers of oil and gas for personal transportation, which
means that when local residents spend money at the gas pump, much of that wealth exits the local
economy.
Savings on gas can add up to significant benefits to regional economies. Not all of the savings will
be spent locally, but even a fraction of what is spent annually on personal transportation has the
potential to bolster job growth and build wealth within local economies. A study by the California
Electric Transportation Coalition found that each dollar saved from gas spending and spent on
other household goods and services generates 16 jobs in the state.11 A few specific examples
underscore how significant the import substitution effect of electric vehicles can be. New Yorkers
drive much less than the average U.S. metro resident, which keeps $19 billion each year flowing
within the local economy.12 In Portland, Oregon, residents drive only four miles less per day than
the national urban average, but the fuel savings still result in $2.6 billion dollars each year
staying local.13
With savings of these magnitudes being realized by trimming only a few miles off the national
driving average, it is clear that decreasing operational costs of vehicles can add up to massive
amounts of wealth staying local and creating jobs. Electric vehicles prevent local wealth from
being literally pumped away and, as these examples make clear, the gains to local economies
can be significant.
EElleeccttrriicc VVeehhiicclleess CCaann DDeeccrreeaassee UUttiilliittyy PPrriicceess
Electric vehicles have the potential to decrease, or at least moderate the growth of, utility rates.
For a technology that will increase total demand for electricity, this may seem counter-intuitive.
The reason that electric vehicles may actually decrease utility rates lies in daily oscillations in
power consumption. Electric vehicles typically charge at night, when electricity is cheapest to
11 California Electric Transportation Coalition. (2012). Plug-in Electric Vehicle Deployment in California: An Economic Jobs Assessment. Retrieved from http://www.caletc.com/wp-content/uploads/2012/11/Economic-Jobs-Assessment-Exec-Summary.pdf 12 Cortright, J. (2010, April). New York City’s Green Dividend. CEOs for Cities. Retrieved from http://www.ceosforcities.org/pagefiles/NYCGD_elctrnc_FINAL.pdf 13 Cortright, J. (2007, June 28). Portland’s Green Dividend. CEOs for Cities. Retrieved from http://www.ceosforcities.org/files/PGD%20FINAL.pdf
INTERNATIONAL ECONOMIC DEVELOPMENT COUNCIL 8
generate. By balancing the demand for electricity between day and night, electric vehicles
decrease the average cost of electricity. Thus, overall rates decrease.
One potential future technology allows vehicles to feed electricity back into the grid, a reverse
charge system known as “vehicle to grid” (V2G). Peak hours of electricity demand generally occur
in the early to mid-afternoon, when most commuter vehicles are sitting idle and can feed power
back into the grid.14 Conversely, electric vehicles are generally charging in the later-evening,
overnight, and in the early morning, when there is excess generation capacity in the grid. As a
result, large-scale deployment of electric vehicles will allow utilities to dispense with power plants
that are currently only needed to satisfy peak demand, a prospect that could substantially
decrease operating costs and therefore utility rates. Further, V2G can accommodate greater use
of clean energy. Electric vehicles primarily charge from late afternoon to early morning, a period
during which a greater portion of energy is generated from clean energy resources such as wind.
Initial studies estimate that electric vehicle owners can make $300 to $500 per year through
V2G.15 However, this may differ from grid to grid. Electric vehicles may earn more by providing
a backup power source for quick-response utility markets. These markets include “spinning
reserves” generation, which provide immediate backup power for 10 minute spurts, and
frequency regulation, which balances generation to ensure an even electricity flow through outlets
at all times. Frequency regulation requires adjusting output about 400 times a day, and electric
vehicles can respond within seconds to this need. It is possible that electric vehicles can earn up to
$5,000 a year in frequency regulation markets.16 Nuuve Corporation, a leading V2G pilot
program, is currently testing 30 electric vehicles for the frequency regulation market in Denmark
and expects to pay electric vehicle owners up to $10,000 over the lifetime of the car.17
V2G applications are still in the concept stage, and some issues have yet to be addressed.
Specifically, large-scale deployment of electric vehicles presents a substantial burden on the grid.
If charging times are not coordinated, utilities may need to add additional capacity – which
would actually raise rates. Coordinating PEV charging is one of primary hurdles that current PEV
14 Ibid. 15 Ferber, D. (2011, October 31). Vehicle-to-Grid: A New Spin on Car Payments. Miller-McCune. Retrieved from http://www.miller-mccune.com/environment/vehicle-to-grid-a-new-spin-on-car-payments-36697/ 16 Ibid. 17 Ibid.

INTERNATIONAL ECONOMIC DEVELOPMENT COUNCIL 9
infrastructure demonstration projects are exploring (see Current Hurdles section of this report).
Nonetheless, V2G is a potentially transformative technology that could make electric vehicles a
game-changer for both the transportation and energy industries.
This report will review the current state of the U.S. electric vehicles market and discuss strategies
toward large-scale adoption of electric vehicles. Although the market faces several hurdles at this
stage of development, concerted efforts by key stakeholders can help electric vehicles become a
self-sustaining market in the near-term future.
INTERNATIONAL ECONOMIC DEVELOPMENT COUNCIL 10
Definition of Electric Vehicles for this Report
This report focuses on the mass deployment of plug-in
electric vehicles (PEVs), which includes both BEVs and
plug-in hybrids. Although more conventional hybrids,
light duty vehicles, and fuel-efficient gas cars provide
valuable fuel savings and environmental benefits, they
rely heavily on gas and thus should be considered a
preliminary step toward a more visionary transportation
solution. Because battery electric vehicles and plug-in
hybrids are impacted by similar charging infrastructure
and battery technology, they will share many of the
same hurdles and corresponding solutions that are jointly
addressed in this report.
DDeeffiinniittiioonnss ffoorr tthhiiss RReeppoorrtt
Hybrid Electric Vehicles: Electric vehicles that employ both electric and gas power. The onboard
battery helps gas to be used more efficiently, while gas recharges the battery.
Battery Electric Vehicles (BEVs): Electric vehicles that are solely electricity-powered and have no
backup fuel source.
Extended-Range Electric Vehicles (EREVs): A vehicle that is powered by battery for a certain
number of miles. Gasoline then powers an electric generator for the next several hundred miles of
extended-range driving.
Plug-In Hybrids (PHEVs): A subset
of hybrids that allows batteries to
be recharged by plugging into an
external electricity source. PEVs
can operate on a combination of
electricity and gasoline, depending
on the vehicle’s configuration and
power needs.
Other Abbreviations:
OEM: Original equipment
manufacturer.
ARRA: American Recovery and
Reinvestment Act

INTERNATIONAL ECONOMIC DEVELOPMENT COUNCIL 11
SSuummmmaarryy ooff HHuurrddlleess aanndd EEDD SSttrraatteeggiieess
The table below summarizes the primary hurdles to PEV deployment and the proposed economic
development strategies to overcome these hurdles. While these are discussed in detail in Section 3
of this report, challenges can be summarized in three main hurdles: the high cost of PEVs, the
limited charging infrastructure currently available, and consumer misperceptions about the
operation of PEVs. However, economic developers can and are taking strides to reduce these
barriers. Section 3 presents examples and case studies of each economic development initiative.
Hurdles to Development and Solutions
High cost of PEVs Limited charging
infrastructure Consumer misperceptions
Demand Side Strategies
Provide tax incentives for purchase
Alleviate battery ownership risk
Provide non-financial incentives
Encourage utility rate discounts
Transition government fleets to PEVs
Encourage PEV cabs
Supply Side Strategies
Make public investments in R&D
Create tailored workforce training programs
Provide business financing
Support supply chain development
Invest in chargers in public spaces
Provide incentives for installing chargers
Collaborate with private charging station providers
Streamline local zoning and permitting
Disseminate information on charger locations
Develop a consumer education plan
Establish public demonstration of PEVs
Market private sector solutions and advancements
INTERNATIONAL ECONOMIC DEVELOPMENT COUNCIL 12
JJOOBB CCRREEAATTIIOONN PPOOTTEENNTTIIAALL OOFF EELLEECCTTRRIICC VVEEHHIICCLLEESS
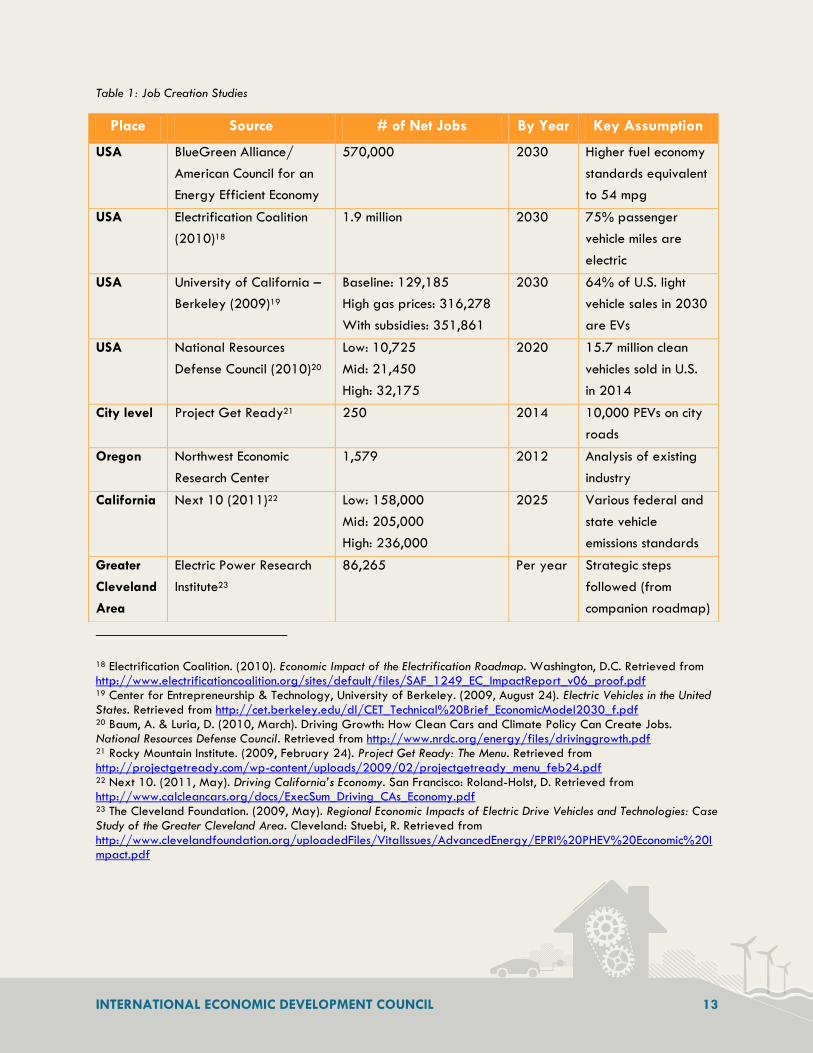
Greater adoption of PEVs will create rising demand for existing jobs and produce opportunities
for new types of jobs as well. Among PEV industries, battery and charging infrastructure will likely
generate the most new jobs, while the manufacturing of the PEVs themselves will help strengthen
the U.S. automotive industry. Although there may be some job losses in the oil and conventional
car industries, study after study confirms that the result will be net job growth. Table 1 summarizes
the findings of various studies on the impact of higher PEV deployment on employment growth.
Each study uses a different modeling methodology, and the job creation estimates hinge on
different assumptions of future oil prices, policy packages, and PEV costs. Thus, there is a wide
range of estimates across these studies.
INTERNATIONAL ECONOMIC DEVELOPMENT COUNCIL 13
18 Electrification Coalition. (2010). Economic Impact of the Electrification Roadmap. Washington, D.C. Retrieved from http://www.electrificationcoalition.org/sites/default/files/SAF_1249_EC_ImpactReport_v06_proof.pdf 19 Center for Entrepreneurship & Technology, University of Berkeley. (2009, August 24). Electric Vehicles in the United States. Retrieved from http://cet.berkeley.edu/dl/CET_Technical%20Brief_EconomicModel2030_f.pdf 20 Baum, A. & Luria, D. (2010, March). Driving Growth: How Clean Cars and Climate Policy Can Create Jobs. National Resources Defense Council. Retrieved from http://www.nrdc.org/energy/files/drivinggrowth.pdf 21 Rocky Mountain Institute. (2009, February 24). Project Get Ready: The Menu. Retrieved from http://projectgetready.com/wp-content/uploads/2009/02/projectgetready_menu_feb24.pdf 22 Next 10. (2011, May). Driving California’s Economy. San Francisco: Roland-Holst, D. Retrieved from http://www.calcleancars.org/docs/ExecSum_Driving_CAs_Economy.pdf 23 The Cleveland Foundation. (2009, May). Regional Economic Impacts of Electric Drive Vehicles and Technologies: Case Study of the Greater Cleveland Area. Cleveland: Stuebi, R. Retrieved from http://www.clevelandfoundation.org/uploadedFiles/VitalIssues/AdvancedEnergy/EPRI%20PHEV%20Economic%20Impact.pdf
Table 1: Job Creation Studies
Place Source # of Net Jobs By Year Key Assumption
USA BlueGreen Alliance/
American Council for an
Energy Efficient Economy
570,000 2030 Higher fuel economy
standards equivalent
to 54 mpg
USA Electrification Coalition
(2010)18
1.9 million 2030 75% passenger
vehicle miles are
electric
USA University of California –
Berkeley (2009)19
Baseline: 129,185
High gas prices: 316,278
With subsidies: 351,861
2030 64% of U.S. light
vehicle sales in 2030
are EVs
USA National Resources
Defense Council (2010)20
Low: 10,725
Mid: 21,450
High: 32,175
2020 15.7 million clean
vehicles sold in U.S.
in 2014
City level Project Get Ready21 250 2014 10,000 PEVs on city
roads
Oregon Northwest Economic
Research Center
1,579 2012 Analysis of existing
industry
California Next 10 (2011)22 Low: 158,000
Mid: 205,000
High: 236,000
2025 Various federal and
state vehicle
emissions standards
Greater
Cleveland
Area
Electric Power Research
Institute23
86,265 Per year Strategic steps
followed (from
companion roadmap)
INTERNATIONAL ECONOMIC DEVELOPMENT COUNCIL 14
NNaattiioonnaall EEssttiimmaatteess ooff JJoobb GGrroowwtthh
National estimates for job creation vary widely. A June 2012 report by BlueGreen Alliance and
the American Council for an Energy-Efficient Economy (ACEEE) examines the job impacts of the
new federal vehicle emissions regulations adopted in August 2012.24 The standards raise the
average miles per gallon of new vehicles to 54.5 mpg by 2025. BlueGreen Alliance/ACEEE
estimates that these standards would create 570,000 net jobs throughout the U.S., including
50,000 jobs in auto manufacturing (see the Appendix for a state-by-state breakdown of job
growth). Further, these jobs are on average higher paying, so that real wage across the economy
grows as well. Job creation results from two mechanisms: 1) Improving vehicle efficiency will
require new technology, which will be designed and produced by adding workers to the auto
industry, and 2) Consumer fuel savings will be spent on other goods and services, thereby
increasing demand for workers in these industries.
The BlueGreen Alliance/ACEEE study uses a propriety economic model called the Dynamic Energy
Efficiency Policy Evaluation Route (DEEPER) developed by ACEEE. DEEPER evaluates how vehicle
standard changes impact interrelationships between 15 sectors of the economy. Employment
effects within each sector over time are then calculated according to labor productivity projections
from the Bureau of Labor Statistics.
Another widely-cited study is one done by the University of California-Berkeley in 2009.25 UC-
Berkeley examines three scenarios depending on different levels of gas prices and PEV subsidies.
In the baseline case, gradually rising gas prices up to $4 per gallon by 2030 results in a net
employment gain of 129,185. In the high oil price scenario, gas prices above $5.50 per gallon
will push up PEV sales even more, resulting in 316,278 jobs gained. A third “operator-subsidized”
scenario assumes both the current federal tax credit of $7,500 for each PEV purchase and an
additional subsidy of 3 cents per mile driven. This scenario results in net job growth of 351,861
jobs. The study does not assume a net employment change in the automobile manufacturing sector.
Rather, the growth in jobs will be in the charging infrastructure, battery manufacturing, and
24 Blue Green Alliance. (June 2012). Gearing Up: Smart Standards Create Good Jobs Building Cleaner Cars.
Washington, D.C. Retrieved from http://www.drivinggrowth.org/wp-content/uploads/2012/06/BGA-Auto-Report.pdf 25 Center for Entrepreneurship & Technology, University of Berkeley. (2009, August 24). Electric Vehicles in the United States. Retrieved from http://cet.berkeley.edu/dl/CET_Technical%20Brief_EconomicModel2030_f.pdf
INTERNATIONAL ECONOMIC DEVELOPMENT COUNCIL 15
electricity production sectors. The employment in domestic oil production remains stable, although
there will be job losses along the supply chain (i.e. gas attendants, auto parts suppliers, etc.). PEVs
have fewer moving parts than conventional gas cars, and they will also require fewer trips to
mechanic shops, (thereby reducing demand for mechanics as well).
The UC-Berkeley study combines two economic models to reach overall estimates for PEV
deployment. The macro model is also supported by survey data on the driving patterns of U.S.
drivers under different oil price scenarios and a general model of how quickly consumers adopt a
new technology. Central to this study is the assumption that private firms will step in to alleviate
the cost of batteries and infrastructure installations. That is, the model for battery ownership will
be similar to that pioneered by the PEV infrastructure firm Better Place. Under this model, a
private firm owns the batteries and charges consumers per mile driven. Revenue gained from the
“pay-per-mile” arrangement finances the cost of the battery, public charging station installations,
and the charging electricity. This setup is a crucial assumption since it makes PEVs competitive
today for the consumer, while other studies rely on different scenarios of payback periods to drive
consumer adoption. Since consumers often value future savings at a discount, a lower PEV sticker
price is more valuable than a lower overall cost of ownership (all else being equal). Thus, the UC-
Berkeley study avoids having to make assumptions about the consumer discount rate.
The National Resources Defense Council evaluates the employment impacts of various clean
vehicle technologies including PEVs.26 Its estimates are in the lower range, since NRDC assumes
that reduced dependence on oil will raise the popularity of non-PEV clean vehicle technologies as
well (such as diesel and hybrid vehicles). The study focuses on how greater PEV adoption in the
U.S. will impact domestic employment – assuming that not all jobs created will be based
domestically. In fact, domestic job creation is tied to domestic research and development in PEVs
as well as how much of successful innovation translates into jobs in the U.S. The NRDC study
assumes that the U.S. is able to capture all job benefits associated with the value of domestic PEV
innovations (or total technology value):
If the U.S. produces 25 percent of the total technology value and appropriates 25
percent of the job benefits, this leads to an increase of 10,725 net jobs.
26 Baum, A. & Luria, D. (2010, March). Driving Growth: How Clean Cars and Climate Policy Can Create Jobs. National Resources Defense Council. Retrieved from http://www.nrdc.org/energy/files/drivinggrowth.pdf
INTERNATIONAL ECONOMIC DEVELOPMENT COUNCIL 16
At 50 percent appropriation, 21,450 net jobs are generated.
At 75 percent appropriation, 32,175 net jobs are generated.
The level that is achieved depends on the activeness of the federal government to implement
clean energy legislation and to provide domestic manufacturing incentives. However, NRDC does
not specify exactly how much federal support is needed to reach each level of appropriation.
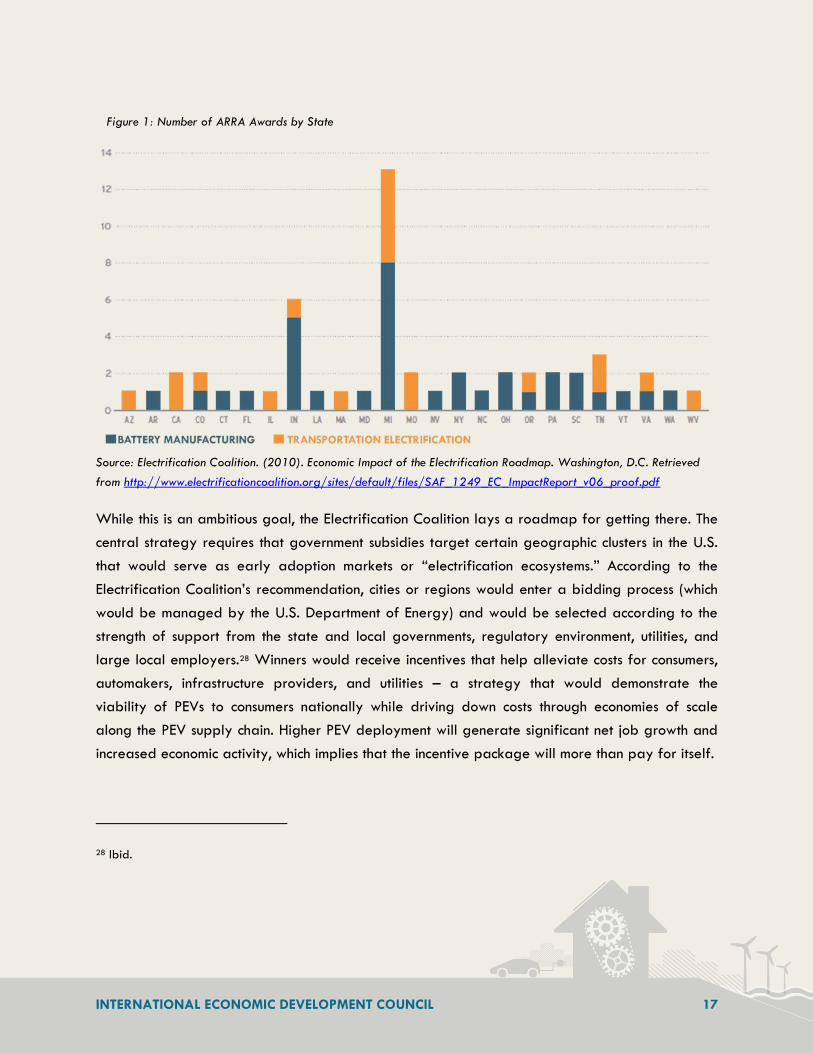
The Electrification Coalition projects the most optimistic job growth: 1.9 million net jobs by 2030.27
This estimate operates on the assumption that by 2040, 75 percent of U.S. passenger vehicle
miles traveled will be powered by electricity. Job growth will not be uniform across the country,
as regions with a high concentration of automakers and their suppliers are likely to see the most
benefit, as well as regions that received American Recovery and Reinvestment Act (ARRA) grants.
ARRA grants were awarded to 53 battery makers and other PEV component suppliers in 25
states (Figure 1).
27 Electrification Coalition. (2010). Economic Impact of the Electrification Roadmap. Washington, D.C. Retrieved from http://www.electrificationcoalition.org/sites/default/files/SAF_1249_EC_ImpactReport_v06_proof.pdf
INTERNATIONAL ECONOMIC DEVELOPMENT COUNCIL 17
Figure 1: Number of ARRA Awards by State
Source: Electrification Coalition. (2010). Economic Impact of the Electrification Roadmap. Washington, D.C. Retrieved
from http://www.electrificationcoalition.org/sites/default/files/SAF_1249_EC_ImpactReport_v06_proof.pdf
While this is an ambitious goal, the Electrification Coalition lays a roadmap for getting there. The
central strategy requires that government subsidies target certain geographic clusters in the U.S.
that would serve as early adoption markets or “electrification ecosystems.” According to the
Electrification Coalition’s recommendation, cities or regions would enter a bidding process (which
would be managed by the U.S. Department of Energy) and would be selected according to the
strength of support from the state and local governments, regulatory environment, utilities, and
large local employers.28 Winners would receive incentives that help alleviate costs for consumers,
automakers, infrastructure providers, and utilities – a strategy that would demonstrate the
viability of PEVs to consumers nationally while driving down costs through economies of scale
along the PEV supply chain. Higher PEV deployment will generate significant net job growth and
increased economic activity, which implies that the incentive package will more than pay for itself.
28 Ibid.
INTERNATIONAL ECONOMIC DEVELOPMENT COUNCIL 18
It should be emphasized that the Electrification Coalition study relies on some ambitious
assumptions regarding the extent of vehicle electrification, while most studies assume more modest
job growth.
SSttaattee aanndd LLooccaall EEssttiimmaatteess ooff JJoobb GGrroowwtthh
As aforementioned, the employment effects of PEV adoption will vary by region. With that said,
each city or state can take concrete steps to increase PEV adoption within its jurisdiction and reap
the associated job benefits as well. Project Get Ready, a network of plug-in ready cities backed
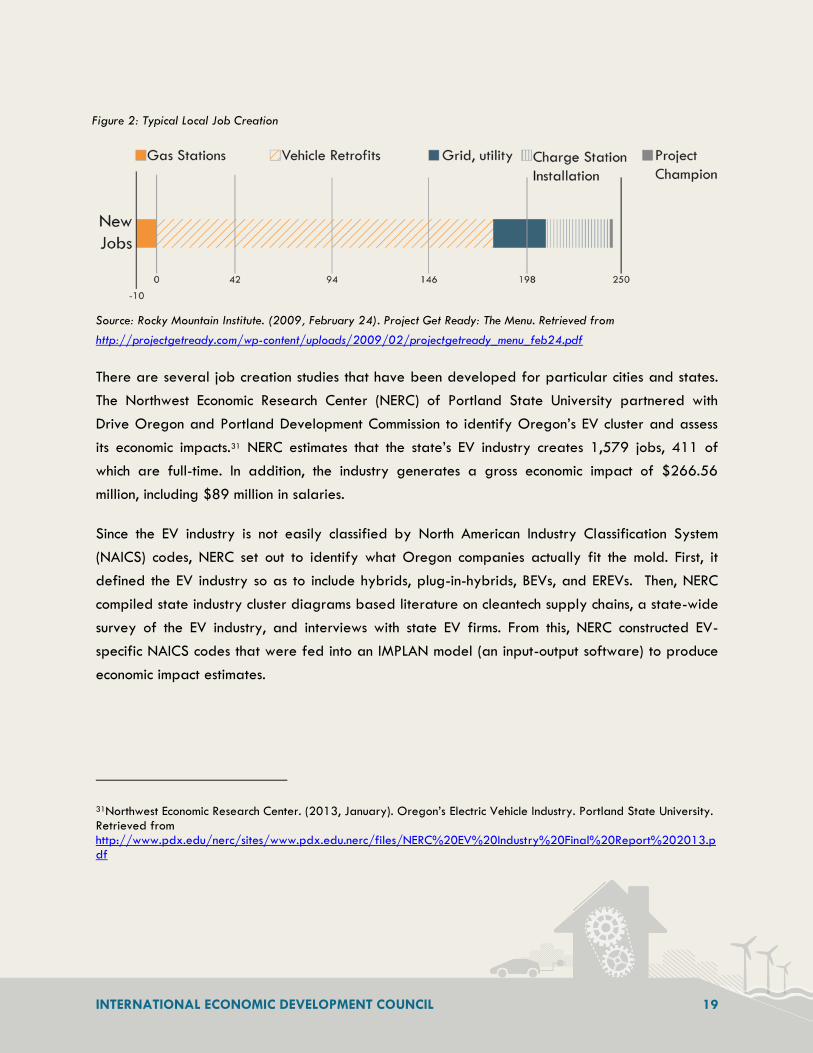
by the think tank Rocky Mountain Institute, has published a general study on the local job creation
potential of PEVs (see Figure 2). This study is broadly applicable to any city, not just the ones with
a significant automobile manufacturing sector. Project Get Ready estimates an average of 250
new jobs can be created if a city takes certain “must-have” actions to support vehicle
electrification in order to get at least 10,000 electric vehicles on the road. These steps include
purchasing city/corporate PEV fleets, creating key incentives and encouraging banks to give low-
interest loans to PEV buyers, and installing public charging stations.29 These “must-have” actions
come at an average net cost of about $10 million, divided between the city, state, local
employers, and the local utility.
Cities with a high concentration of automobile manufacturing will see job gains above and
beyond this (not included in Project Get Ready’s analysis). Some jobs will be lost in conventional
gas industries (such as gas station attendants), but the employment increase more than makes up
the difference. The study is based on some key assumptions: a gas price of $2.50 per gallon,
subsidies that reduce the price premium of PEVs to $5,000, a retrofit cost of $7,000 after
subsidies and tiered rates for electricity. Also, this study assumes a cost of $750 for a Level 2
home charger (while these chargers are now available on the market for about $500).30
29 Rocky Mountain Institute. (2009, February 24). Project Get Ready: The Menu. Retrieved from http://projectgetready.com/wp-content/uploads/2009/02/projectgetready_menu_feb24.pdf 30 Plug In America. (2012). Accessory Tracker. Plug In America. Retrieved from http://www.pluginamerica.org/accessories
INTERNATIONAL ECONOMIC DEVELOPMENT COUNCIL 19
Figure 2: Typical Local Job Creation
Source: Rocky Mountain Institute. (2009, February 24). Project Get Ready: The Menu. Retrieved from
http://projectgetready.com/wp-content/uploads/2009/02/projectgetready_menu_feb24.pdf
There are several job creation studies that have been developed for particular cities and states.
The Northwest Economic Research Center (NERC) of Portland State University partnered with
Drive Oregon and Portland Development Commission to identify Oregon’s EV cluster and assess
its economic impacts.31 NERC estimates that the state’s EV industry creates 1,579 jobs, 411 of
which are full-time. In addition, the industry generates a gross economic impact of $266.56
million, including $89 million in salaries.
Since the EV industry is not easily classified by North American Industry Classification System
(NAICS) codes, NERC set out to identify what Oregon companies actually fit the mold. First, it
defined the EV industry so as to include hybrids, plug-in-hybrids, BEVs, and EREVs. Then, NERC
compiled state industry cluster diagrams based literature on cleantech supply chains, a state-wide
survey of the EV industry, and interviews with state EV firms. From this, NERC constructed EV-
specific NAICS codes that were fed into an IMPLAN model (an input-output software) to produce
economic impact estimates.
31Northwest Economic Research Center. (2013, January). Oregon’s Electric Vehicle Industry. Portland State University. Retrieved from http://www.pdx.edu/nerc/sites/www.pdx.edu.nerc/files/NERC%20EV%20Industry%20Final%20Report%202013.pdf
INTERNATIONAL ECONOMIC DEVELOPMENT COUNCIL 20
Next 10, a California-based research institution, published a study on how changes in federal
and state fuel standards will impact California’s employment growth.32 The rationale is that more
stringent fuel standards increase employment by:
Increasing demand for clean vehicle technologies, including EVs, thereby driving job
growth along the EV supply chain.
Generating savings from decreased fuel use, which is money that is often spent locally.
If the current federal Low Carbon Fuel Standard and the California vehicle emissions standard
continue through 2025, the state will see a growth of 38,000 net jobs compared to a scenario
without vehicle standards. The recently passed four percent annual increase in federal standards
will produce a net employment growth of 158,000. Next 10 compares the job creation potential
of the PEV industry with that of California’s electric power sector; efficiency policies in the power
sector over the past 30 years led to higher employment and economic growth in the state.
Likewise, fuel savings from PEVs will also shift consumer expenditures from import-dependent
goods to goods and services produced within the state.
The Electric Power Research Institute (EPRI) conducted a study of the possible employment impacts
of PEVs in the Greater Cleveland Area.33 EPRI uses a regional input-output model, which examines
how shifting transportation demand from oil to electricity may impact industries throughout the
regional economy. This model captures employment effects on direct jobs, indirect jobs, and
induced jobs. EPRI’s analysis is conditional on implementing the recommendations of a companion
report: the “Cleveland Transportation Electrification Roadmap.”34 Action steps include constructing
and increasing production at vehicle and battery plants, capturing supply chain opportunities
created by these plants, dedicating research and development to PEVs at regional universities,
and securing opportunities for PEV infrastructure suppliers. In an automotive-intensive city such as
32 Next 10. (2011, May). Driving California’s Economy. San Francisco: Roland-Holst, D. Retrieved from http://www.calcleancars.org/docs/ExecSum_Driving_CAs_Economy.pdf 33 The Cleveland Foundation. (2009, May). Regional Economic Impacts of Electric Drive Vehicles and Technologies: Case Study of the Greater Cleveland Area. Cleveland: Stuebi, R. Retrieved from http://www.clevelandfoundation.org/uploadedFiles/VitalIssues/AdvancedEnergy/EPRI%20PHEV%20Economic%20I
mpact.pdf 34 The Cleveland Foundation. (2009, May). Cleveland Transportation Electrification Roadmap. Cleveland: Stuebi, R. Retrieved from http://www.clevelandfoundation.org/uploadedFiles/VitalIssues/AdvancedEnergy/EPRI%20PHEV%20Roadmap.pdf
INTERNATIONAL ECONOMIC DEVELOPMENT COUNCIL 21
Cleveland, higher PEV deployment can result in as many as 86,000 new jobs each year. This
includes:
68,955 vehicle production jobs,
7,247 battery production jobs,
5,130 construction jobs,
3,527 vehicle component production jobs,
1,177 infrastructure supplier jobs, and
228 R&D jobs.
EPRI’s total of 86,000 new jobs is far ahead of the 250 jobs Project Get Ready estimates for the
typical city without a strength in auto manufacturing. Although it is difficult to combine the two
studies since they use different methodologies, it is intuitive that cities strong in automotive
manufacturing are likely to see more employment gains from PEV deployment than the average
city.
PPEEVV JJoobb PPrrooffiilleess
Wider PEV deployment will require more workers across different kinds of fields.

INTERNATIONAL ECONOMIC DEVELOPMENT COUNCIL 22
Figure 3 outlines typical job profiles in the PEV industry. Some jobs will require certification or
specialized training programs. Job certification and licensing is typically done on the state level
and involves some combination of work experience, training, and/or an exam. There are federal
programs as well. The Department of Energy’s Graduate Automotive Technology Education
Program trains upcoming engineering students in the next generation of vehicle technology,
including PEVs.

INTERNATIONAL ECONOMIC DEVELOPMENT COUNCIL 23
Figure 3: Job Profiles in the PEV Industry
Field of Activity Skilled
Semi-
Skilled Un-skilled Representative Job Profiles
Scientific research of
batteries X Chemists, materials scientists
Design and development of
automobile technology X x
Engineers, engineering technicians,
software developers, industrial
designer
Manufacturing X x
Assemblers, machinists, production
managers
Vehicle maintenance x x
Automotive service technicians,
mechanics
Infrastructure development X x
Urban and regional planners, power-
line installers/repairers, electricians
Sales and support x x
Retail salespersons, customer service
representatives
Source: U.S. Bureau of Labor Statistics. (2011, September). Careers in Electric Vehicles. Hamilton, H. Retrieved from
http://www.bls.gov/green/electric_vehicles/electric_vehicles.pdf
Opportunities in manufacturing are concentrated in the Midwest and Great Lakes region, where
existing autoworkers can be trained to make electric vehicle components. Maintenance jobs, on
the other hand, are more geographically dispersed. While some maintenance of PEVs is similar to
that of conventional cars, work being done on the electric drive system will require technicians to
be trained in these skills. Workers can receive training through programs such as those set up by
automakers or by the National Alternative Fuels Training Consortium.
IInntteeggrraattiinngg tthhee JJoobb SSttuuddiieess
Although the studies presented in this section may differ on the exact number of jobs gained from
PEV adoption, a few facts are clear.
First, the employment benefits from PEV adoption increase with the number of PEVs on the
road. More PEVs will drive up demand for PEV-related production and services. More
INTERNATIONAL ECONOMIC DEVELOPMENT COUNCIL 24
PEVs will also drive down costs on the production side, making PEVs cheaper and
indirectly boosting the economy by giving consumers more disposable income.
Second, federal, state and local policy is front and center in shaping the deployment of
PEVs. How policies and incentives are structured determines if, which, and when
advanced vehicle technologies are adopted. Federal subsidies are crucial to reducing
supply- and demand-side costs of adoption. Policies that favor lower carbon emissions
will increase demand for PEVs, but also for non-PEV clean vehicle technologies as well.
Third, government subsidies will pay for themselves, and profitable private sector
models will emerge once the PEV industry matures. The pay-per-mile model is one such
scheme. Current government subsidies are needed to speed the market in the short-term,
but each study points to net employment and economic growth to justify this investment.
TTHHEE SSTTAATTEE OOFF TTHHEE UU..SS.. EELLEECCTTRRIICC VVEEHHIICCLLEE MMAARRKKEETT
EElleeccttrriicc VVeehhiicclleess:: AA BBrriieeff HHiissttoorryy
The electric vehicle was first developed in the 1830s by a number of inventors including Thomas
Davenport and Robert Anderson. These early electric vehicles ran on non-rechargeable batteries
and far outsold gas cars for decades.35 However, cars were still a curiosity for the rich. Then in the
1910s, the Ford Motor Company began to mass produce the Model T, a gas car that would
become the transportation icon of the middle class. Henry Ford chose gas power over electricity
and steam because gas cars could travel much further between refueling. Furthermore, electric
cars were vulnerable to breaking down, and mechanics were few and far between. The
assembly-line-produced Model T saw runaway sales, and with it, America’s thirst for gasoline
grew. Renewed interest in the electric vehicle began in the 1960s and 1970s as Congress sought
to reduce air pollution and vulnerability to rising oil prices. A combination of public and private
investment spurred the beginning of mass production of electric vehicles in the late 1990s and
throughout the 2000s.
35 PBS. (2010). Timeline: History of the Electric Car. NOW on PBS. Retrieved from http://www.pbs.org/now/shows/223/electric-car-timeline.html
INTERNATIONAL ECONOMIC DEVELOPMENT COUNCIL 25
CCuurrrreenntt PPEEVV SSaalleess aanndd IInndduussttrryy EEmmppllooyymmeenntt
Although automakers have been experimenting with electric vehicle prototypes for years, they
only have recently begun to produce them on a larger scale.
PPEEVV SSaalleess:: AAnn IInnffaanntt MMaarrkkeett
The market for purely electric vehicles is in its infancy. The Nissan Leaf was the first to become
available in the U.S., with Ford, Toyota, and Honda rolling out models in 2011 and 2012. The
Nissan Leaf sold 8,720 in its first 11 months.36 Nissan expects to sell over 10,000 of the Leaf
within the first year of rollout.37 The Tesla Model S, a luxury BEV, received considerable attention
including Motor Trend’s “Car of the Year” award in 2012. In the long term, Pike Research projects
that BEVs will account for 0.8% of U.S. car sales by 2017.38
The market for PEVs and EREVs is more developed, but has yet to reach rapid deployment.
Hybrids have been retrofitted for plug-in capability since they were introduced in the early
2000s. The Chevy Volt was the first EREV on the market, but it was soon followed by Toyota and
Ford models in 2011 and 2012.39 Through August 2012, 13,479 Volts were sold.40 The Volt
topped Consumer Reports’ Owner Satisfaction Survey for both 2011 and 2012, with 92 percent
of owners saying they would make the same purchase again.41 Although PEVs and EREVs do not
have the same mileage range limitations that battery electric vehicles do, they tend to be more
expensive than battery electric vehicles and gas cars because they must incorporate both gas and
36 Loveday, E. (2011, December 1). Chevy Volt Sales Trump Nissan LEAF in November 2011. PlugInCars. Retrieved from http://www.plugincars.com/chevy-volt-sales-nissan-leaf-november-2011-110656.html 37 Ibid. 38 Pike Research. (2011). Electric Vehicle Geographic Forecasts. Retrieved from http://www.pikeresearch.com/research/electric-vehicle-geographic-forecasts 39 For a full list of PEVs, refer to http://www.pluginamerica.org/vehicles 40 Voelcker, John. (2012, September 4). August Plug-In Electric Car Sales: Volt Surges, Leaf Static. Green Car Reports. Retrieved from http://www.greencarreports.com/news/1078919_august-plug-in-electric-car-sales-volt-
surges-leaf-static 41 Edelstein, Stephen. (2012, December 3). Chevrolet Volt tops Consumer Reports’ Owner Satisfaction survey for the second year. Digital Trends.Retrieved from http://www.digitaltrends.com/cars/chevrolet-volt-tops-consumer-reports-owner-satisfaction-survey-for-the-second-year/

INTERNATIONAL ECONOMIC DEVELOPMENT COUNCIL 26
electric power systems. Pike Research projects that by 2017, plug-in hybrids will comprise 1.2%
of U.S. car sales.42
Since BEVs, PEVs, and EREVs are still relatively new, it difficult to accurately project how fast these
markets will expand. The performance of the traditional hybrid market can give some insight into
how these emerging markets will mature. While these markets will face different challenges than
traditional hybrids (notably adequate charging infrastructure), many of the same market and
consumer demands will play a role in how fast these younger markets develop.
SSaalleess ooff HHyybbrriiddss:: AA LLoonnggeerr TTrraacckk RReeccoorrdd
Non-plug-in hybrids have been mass-produced in the U.S. since 2000. The Honda Insight was the
first hybrid available in the United States. Since then, most of the major auto makers have
introduced hybrid models in the U.S. The best-selling hybrid currently on the road is the Toyota
Prius, which sold nearly one million units between 2000 and 2010.43
Figure 4 shows the percentage of retail hybrid registrations by state. California, Vermont, the
District of Columbia, Oregon, Arizona, and Washington have the greatest penetration in the non-
plug-in hybrid market and are also leading markets for the initial rollout of PEVs.44 Key EV
Figures
Object 1 and Object 2 of the Appendix trace the sales of non-plug-in hybrids since 1999. Sales
have risen steadily but still remain below 3 percent of total U.S. car and truck sales throughout the
decade.
42 Pike Research. (2011). Electric Vehicle Geographic Forecasts. Retrieved from http://www.pikeresearch.com/research/electric-vehicle-geographic-forecasts 43 U.S. Department of Energy. (2012, February 7). Data, Analysis & Trends. Alternative Fuels & Advanced Vehicles Data Center. Retrieved from http://www.afdc.energy.gov/afdc/data/vehicles.html 44 Center for Automotive Research. (2011, January). Deployment Rollout Estimate of Electric Vehicles 2011-2015. Ann Arbor: Hill, K. & Cregger, J. Retrieved from http://www.cargroup.org/pdfs/deployment.pdf

INTERNATIONAL ECONOMIC DEVELOPMENT COUNCIL 27
Figure 4: U.S. Retail Hybrid Registrations
Source: Center for Automotive Research. (2011, January). Deployment Rollout Estimate of Electric Vehicles 2011-2015.
Ann Arbor: Hill, K. & Cregger, J. Retrieved from http://www.cargroup.org/pdfs/deployment.pdf
PPEEVV IInndduussttrryy EEmmppllooyymmeenntt:: AAnn AApppprrooxxiimmaattiioonn
Total employment in the PEV industry is difficult to capture since firms working in the PEV space
frequently diversify their workloads across different markets. For instance, OEMs often
manufacture both electric and conventional vehicles; battery companies may make batteries for
electric vehicles and consumer electronics; large conglomerates may serve several parts of the
PEV supply chain while doing most of their work in other markets. There are firms that do work
exclusively in the PEV space. For example, the introduction of PEVs has spawned a unique market
for firms that can manage PEV charging infrastructure. The shifting landscape for electric vehicle
jobs and the diversification of firm workload, however, makes it difficult to ascertain how many
workers are currently dedicated to making or servicing PEVs.
With that said, imperfect measures can help shed light on current employment in the PEV industry.
A good place to begin is with automotive OEMs. The Electric Drive Transportation Association
(EDTA) represents automakers, suppliers, utilities, and other stakeholders working in the electric

INTERNATIONAL ECONOMIC DEVELOPMENT COUNCIL 28
vehicle space. EDTA’s membership includes a fairly exhaustive list of U.S. automakers that are
currently manufacturing PEVs (Error! Reference source not found.Error! Reference source not
found.Table 2). As of early 2012, there are 19 U.S. automakers making PEVs, and they
collectively employ about 197,022 workers in the country.45 Many of their facilities produce
conventional cars as well as PEVs, so the employment numbers only partially reflect PEV.
Table 2: Electric Vehicle OEMs in the U.S.
Vehicle Manufacturer Total U.S. Employment
Vehicle Manufacturer Total U.S. Employment
AMP Electric Vehicles 25 Hyundai Motor America 5,199
Azure Dynamics Corporation 119 Mitsubishi Motors R&D of America
81
BMW of North America 7,000+ Nissan North America 13,000
Chrysler Group, LLC 51,625 Odyne Systems 11-50
Coda Automotive 225 Smith Electric Vehicles 281
Electric Mobile Cars 50 Tesla Motors 1,400
Ford Motor Company 38,132 Toyota Motor Company 29,089
General Motors Company 26,000 Via Motors N/A
Global Electric Motorcars by Polaris
85 Volkswagen Group of America
4,500
Honda North America, Inc. 25,000
Total 197,022
Source: Electric Drive Transportation Association. (2012, February 3). Members List - Vehicle. Electric Drive
Transportation Association. Retrieved from http://electricdrive.org/index.php?ht=d/sp/i/23168/pid/23168
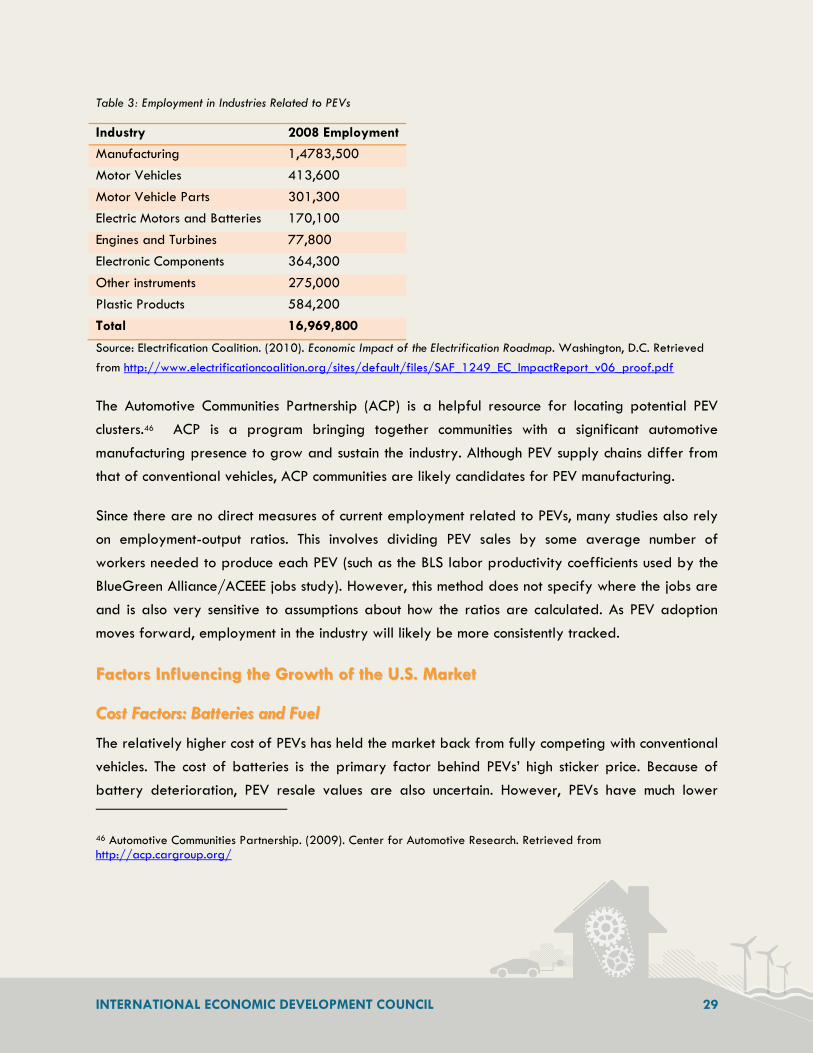
The electric vehicle supply chain extends far beyond the OEMs, however. As Table 3 shows, the
U.S. automobile supply chain includes engine, battery and other component makers and in total
supports almost 17 million direct jobs. Once again, these numbers reflect employment related to
the production of both PEVs and non-electric vehicles.
45 Employment numbers compiled from various sources including Hoovers, company websites and news releases.
INTERNATIONAL ECONOMIC DEVELOPMENT COUNCIL 29
Table 3: Employment in Industries Related to PEVs
Industry 2008 Employment
Manufacturing 1,4783,500
Motor Vehicles 413,600
Motor Vehicle Parts 301,300
Electric Motors and Batteries 170,100
Engines and Turbines 77,800
Electronic Components 364,300
Other instruments 275,000
Plastic Products 584,200
Total 16,969,800
Source: Electrification Coalition. (2010). Economic Impact of the Electrification Roadmap. Washington, D.C. Retrieved
from http://www.electrificationcoalition.org/sites/default/files/SAF_1249_EC_ImpactReport_v06_proof.pdf
The Automotive Communities Partnership (ACP) is a helpful resource for locating potential PEV
clusters.46 ACP is a program bringing together communities with a significant automotive
manufacturing presence to grow and sustain the industry. Although PEV supply chains differ from
that of conventional vehicles, ACP communities are likely candidates for PEV manufacturing.
Since there are no direct measures of current employment related to PEVs, many studies also rely
on employment-output ratios. This involves dividing PEV sales by some average number of
workers needed to produce each PEV (such as the BLS labor productivity coefficients used by the
BlueGreen Alliance/ACEEE jobs study). However, this method does not specify where the jobs are
and is also very sensitive to assumptions about how the ratios are calculated. As PEV adoption
moves forward, employment in the industry will likely be more consistently tracked.
FFaaccttoorrss IInnfflluueenncciinngg tthhee GGrroowwtthh ooff tthhee UU..SS.. MMaarrkkeett
CCoosstt FFaaccttoorrss:: BBaatttteerriieess aanndd FFuueell
The relatively higher cost of PEVs has held the market back from fully competing with conventional
vehicles. The cost of batteries is the primary factor behind PEVs’ high sticker price. Because of
battery deterioration, PEV resale values are also uncertain. However, PEVs have much lower
46 Automotive Communities Partnership. (2009). Center for Automotive Research. Retrieved from http://acp.cargroup.org/
INTERNATIONAL ECONOMIC DEVELOPMENT COUNCIL 30
operational costs. The cost of charging electric vehicles is roughly a quarter of what it costs to fuel
a conventional vehicle that gets 30 miles per gallon.47 Even plug-in hybrids that still run on gas can
decrease fuel costs by a substantial margin. The lower operational cost of electric vehicles is a
comparative advantage that is further strengthened by volatile gas prices. Moving forward,
battery costs and fuel costs will together determine how quickly PEVs become the demonstrably
cheaper option for personal transportation and, thus, how rapidly this market expands. The
outlook for these costs will be discussed below.
CCoosstt ooff AAddvvaanncceedd BBaatttteerriieess
Batteries make up roughly one-third of the cost of today’s electric vehicles. Unique assembly lines
for PEV batteries lead to higher manufacturing costs. Further, electric vehicles require batteries
with both high endurance and power, and there is often a tradeoff between these capacities.
Lithium ion batteries, which encompass a number of competing sub-technologies, are the most
commonly used batteries for vehicle applications. However, they are also expensive. A lithium ion
battery with average range of 60-80 miles costs between $10,000 and $15,000, more than the
price differential between PEVs and traditional vehicles.48 In 2012, Ford’s chief executive
revealed that its battery pack costs between $522 and $620 per kWh, which equates to one-
third of the entire cost of the electric car.49 The United States Advanced Battery Consortium has
set a target of $150 per kWh for advanced electric vehicle batteries.50 This is the price point they
believe will make long-term commercialization possible. However, it is difficult to set a hard price
point because changes in other cost factors can move the tipping point. As will be discussed in
more detail below, a significant increase in the cost of gas could make PEVs cost competitive even
without decreasing the cost of batteries.
Regardless of the specific tipping point, or when it will be reached, there is no doubt that battery
prices are falling rapidly. Higher production volumes in recent years have pushed down prices
47 Electrification Coalition. (2009). Electrification Roadmap. Washington, D.C. Retrieved from http://www.electrificationcoalition.org/sites/default/files/SAF_1213_EC-Roadmap_v12_Online.pdf 48 Harvard Kennedy School, Belfer Center for Science and International Affairs. (2011, July). Will Electric Cars Transform the U.S. Car Market? Cambridge: Lee, H. & Lovellette, G. Retrieved from http://belfercenter.ksg.harvard.edu/files/Lee%20Lovellette%20Electric%20Vehicles%20DP%202011%20web.pdf 49 Ramsey, Mike. (2012, April 17). Ford CEO: Battery Is Third of Electric Car Cost. Wall Street Journal. Retrieved from http://online.wsj.com/article/SB10001424052702304432704577350052534072994.html 50 Batteries for Advanced Transportation Technologies. (2011). USABC Goals for Advanced Batteries for EVs. Retrieved from http://batt.lbl.gov/files/Goals_for_Advanced_EV_Batteries-21.pdf
INTERNATIONAL ECONOMIC DEVELOPMENT COUNCIL 31
through economies of scale. Between 2007 and 2010, the cost of batteries declined from $1,000
per kWh to around $400 per kWh,51 a 600 percent decline in only three years. The Deutsche
Bank expects battery costs to reach $250 per kWh by 2020.52
Past and future reductions in battery costs depend on the interplay of technological advances
and economies of scale. On the research and development side, both public and private entities
are pouring significant resources into improving the performance and reducing the costs of
battery technology. In the last decade, the number of scientists working on PEV technology
worldwide has tripled.53 On the production side, increasing economies of scale is poised to drive
down costs as well. There is evidence that achieving economies of scale can decrease prices faster
than research efforts in the short-term.54 Using current technology and materials, scaling up to
500,000 batteries per year drops the cost of plug-in hybrid batteries to $363 per kWh.55
Eventually, reductions in cost achieved through economies of scale may hit a ceiling, and further
R&D will be needed. However, public policies, such as battery production incentives, can make
great strides in reducing PEV cost in the short-term.
PPrriiccee ooff FFuueell
Since conventional cars run on gas and electric vehicles run on electricity, the future prices of gas
and electricity can have a significant impact on the cost effectiveness of electric vehicles. Studies
agree that gas prices will likely rise in the long-term. The U.S. Energy Information Administration
and IHS Global Insight, a leading forecasting firm, predict both gas and electricity will be more
expensive in 2035 than in 2011.56 A rising world population, especially in developing countries,
will push up demand for cars and thus of gas. Electricity prices, although subject to different
market factors, may also increase. Since the price of fuel is a key advantage of electric vehicles,
51 Kanellos, M. (2010, August 31). EV Batteries Plummet in Price: Down to $400 a kwH. Greentech Media. Retrieved from http://www.greentechmedia.com/articles/read/ev-batteries-dropping-rapidly-in-Price 52 Deutsche Bank. (2010, December 22). The End of the Oil Age, 2011 and Beyond: A Reality Check. Global Markets Research. Retrieved from http://bioage.typepad.com/files/1223fm-05.pdf 53 Behr, P. (2011, January 14). M.I.T. Panel Says a Charging Infrastructure May Be a Bigger Roadblock for Electric Vehicles Than Technology. Scientific American. Retrieved from http://www.scientificamerican.com/article.cfm?id=mit-panel-electric-vehicles 54 Electrification Coalition. (2009). Electrification Roadmap. Washington, D.C. Retrieved from http://www.electrificationcoalition.org/sites/default/files/SAF_1213_EC-Roadmap_v12_Online.pdf 55 Barnett, B. et al. (2009, May 19). PHEV Battery Cost Assessment [PowerPoint]. Retrieved from http://www1.eere.energy.gov/vehiclesandfuels/pdfs/merit_review_2009/energy_storage/es_02_barnett.pdf 56 U.S. Energy Information Administration. (2011, April). Annual Energy Outlook 2011. Retrieved from http://www.eia.gov/forecasts/aeo/pdf/0383%282011%29.pdf

INTERNATIONAL ECONOMIC DEVELOPMENT COUNCIL 32
higher electricity costs may push up the lifetime costs of electric vehicles and make them less
competitive.
With that said, fuel prices are difficult to predict with certainty. Both electricity and gas prices are
highly volatile and responsive to many factors, such as overall demand, political conditions
(especially in oil-rich countries), prices of other fuel commodities, weather conditions, government
regulation and policies, and supply shocks (such as natural disasters.) How relative prices between
gas and electricity play out will be crucial to the adoption of electric vehicles. The fact that
operational costs of conventional vehicles are more responsive to oil prices than electric vehicles
are to electricity prices is a key tipping point in this competitive race. For example, one study
found that gas prices rising to $4.50 per gallon, coupled with decreased battery costs, would
make electric vehicles significantly cheaper to own and operate than conventional vehicles.57 This
is true even with the same proportional increase in electricity prices.58
IInncceennttiivveess aanndd PPoolliicciieess:: GGrroowwiinngg DDeemmaanndd aanndd IInnccrreeaassiinngg SSuuppppllyy
Policy support for PEVs includes both supply side and demand side incentives. Supply side
incentives provide assistance to manufacturers and suppliers who wish to enter the PEV market,
increase their market share, or conduct research and development in the PEV space. Some of
these incentives include ATVM loans and export assistance (see text box).
57 Harvard Kennedy School, Belfer Center for Science and International Affairs. (2011, July). Will Electric Cars Transform the U.S. Car Market? Cambridge: Lee, H. & Lovellette, G. Retrieved from http://belfercenter.ksg.harvard.edu/files/Lee%20Lovellette%20Electric%20Vehicles%20DP%202011%20web.pdf 58 Ibid.

INTERNATIONAL ECONOMIC DEVELOPMENT COUNCIL 33
Advanced Technology Vehicles Manufacturing (ATVM) loans: The DOE set aside $25 billion
for the Advanced Technology Vehicles Manufacturing Loan Program, which provides loans to help
automakers and their suppliers retool, expand, or build new facilities to make fuel-efficient
vehicles.1 The loans can help finance up to 30 percent of qualified manufacturing expenses
(research and development are not eligible). Automakers must meet a rigorous approval process
to prove the viability of their projects, especially in light of the declining auto industry. Since the
funds were authorized in 2008, only about $9 billion has been handed out due to a lengthy and
stringent approval process. For example, General Motors submitted an application in October
2009 and withdrew it after a year of no response from DOE. In fact, as of early 2013, there
were no active applications for the remaining $16.6 billion in available loans. Companies have
been hesitant to apply for the loans due to a lengthy application process and extensive reporting
requirements.
Export Assistance: The International Trade Administration of the Department of Commerce has a
Global Automotive Team that directly assists auto manufacturers with exporting. Due to a high
number of inquiries, the team has published an export guide for makers of PEVs and PEV
components on exporting to European markets, with hopes to cover other world markets. The
report discusses the automotive markets in 21 major European countries, including opportunities
and challenges to exporting to each market. The ITA found that Denmark and Germany present
the most ripe export opportunities for U.S. automakers, while other countries may present more
challenges than opportunities. For more detail, the report can be accessed at www.export.gov.
Demand-side incentives help alleviate the cost or convenience of purchasing or operating an
electric vehicle. These include PEV purchase tax credits, charging station tax credits, and
local/state financing.
As energy legislation moves forward, the policy landscape affecting electric vehicles is likely to
evolve quickly. The Current Hurdles section of this report discusses how current policies can be
restructured to provide a greater boost to PEV adoption while balancing impacts to government
budgets, consumer budgets, and consumer behavior.
INTERNATIONAL ECONOMIC DEVELOPMENT COUNCIL 34
CChhaarrggiinngg IInnffrraassttrruuccttuurree:: TThhee CChhiicckkeenn aanndd tthhee EEgggg
Adequate charging infrastructure, as well as consumer perception of adequate infrastructure, is
crucial to the growth of PEVs and especially BEVs. While hybrids use gasoline as a backup power
source, BEVs are constrained by their driving range on battery charge. Increasing the adoption of
BEVs will require significant and thoughtful investment in a network of charging stations. Whether
this need should be met by the public or private sector is yet unclear, as well as where stations
should be located. When and where cars charge are critical issues to grid development, as excess
demand can overburden the grid (especially at peak hours). This adds to existing concerns by
utilities to provide adequate supply of electricity to meet demand. Current demonstration projects
hope to resolve some of these issues. These projects, as well as consumer perceptions of
infrastructure, are further discussed in the Current Hurdles section of this report.
TTyyppeess ooff CChhaarrggiinngg SSttaattiioonnss
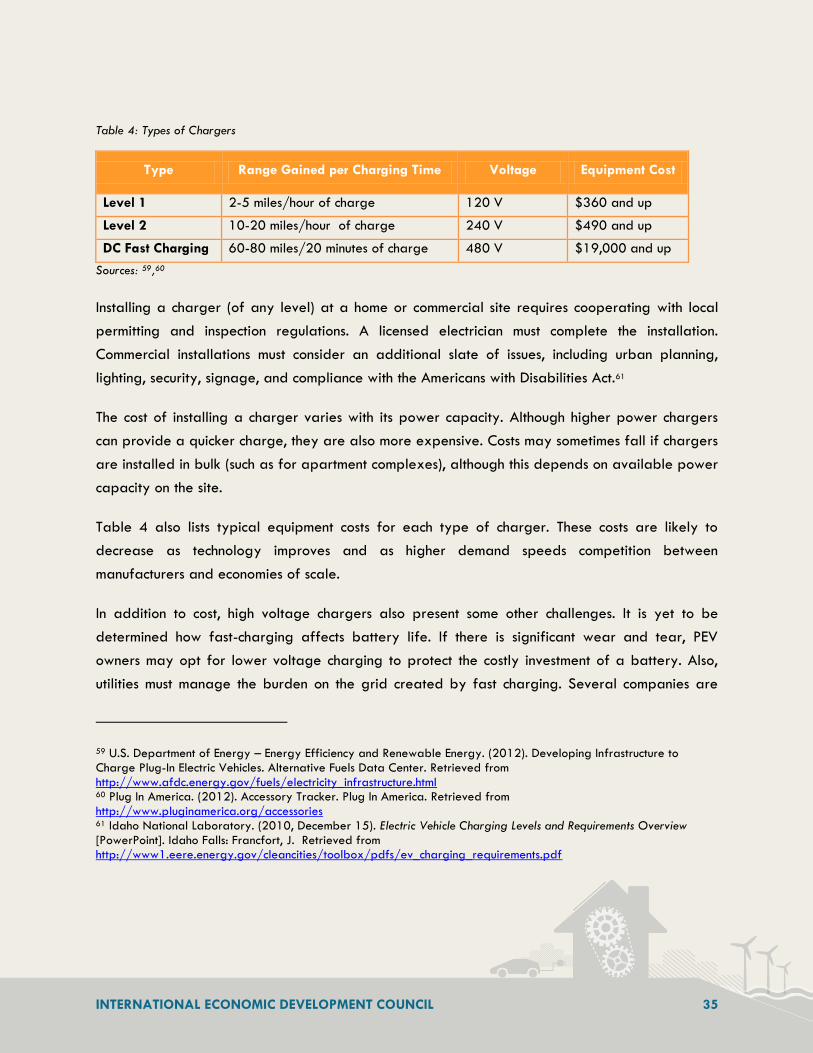
Different types of chargers can accommodate different needs.
Table 4 outlines current charging technology or Electric Vehicle Supply Equipment (EVSE). A Level I
charger uses a standard household three-prong plug, which does not require installation of
additional charging equipment. A Level 2 charger carries twice the voltage of a Level I charger
and requires installation of charging equipment to safely manage voltage levels. Direct current
(DC) fast charging carries twice the voltage of a Level 2 charger and can significantly speed
charging times.
PEV Tax Credits: The American Recovery and Reinvestment Act of 2009 (ARRA) increased the
maximum income tax credit to $7,500 for purchase of a PEV. Only plug-in electric vehicles
qualify (non-plug in hybrids like the Prius would not be eligible). The amount of tax credit
depends on the battery capacity. The tax credits are not retroactive and only apply to newly
purchased PEVs.
State and Local Financing: Policy incentives on the state and local levels include rebates, income
tax credits, sales tax exemptions, and insurance discounts. HybridCenter.org provides a full
listing of federal and state incentives for both hybrid and plug-in electric vehicles.1
INTERNATIONAL ECONOMIC DEVELOPMENT COUNCIL 35
Table 4: Types of Chargers
Type Range Gained per Charging Time Voltage Equipment Cost
Level 1 2-5 miles/hour of charge 120 V $360 and up
Level 2 10-20 miles/hour of charge 240 V $490 and up
DC Fast Charging 60-80 miles/20 minutes of charge 480 V $19,000 and up
Sources: 59,60
Installing a charger (of any level) at a home or commercial site requires cooperating with local
permitting and inspection regulations. A licensed electrician must complete the installation.
Commercial installations must consider an additional slate of issues, including urban planning,
lighting, security, signage, and compliance with the Americans with Disabilities Act.61
The cost of installing a charger varies with its power capacity. Although higher power chargers
can provide a quicker charge, they are also more expensive. Costs may sometimes fall if chargers
are installed in bulk (such as for apartment complexes), although this depends on available power
capacity on the site.
Table 4 also lists typical equipment costs for each type of charger. These costs are likely to
decrease as technology improves and as higher demand speeds competition between
manufacturers and economies of scale.
In addition to cost, high voltage chargers also present some other challenges. It is yet to be
determined how fast-charging affects battery life. If there is significant wear and tear, PEV
owners may opt for lower voltage charging to protect the costly investment of a battery. Also,
utilities must manage the burden on the grid created by fast charging. Several companies are
59 U.S. Department of Energy – Energy Efficiency and Renewable Energy. (2012). Developing Infrastructure to Charge Plug-In Electric Vehicles. Alternative Fuels Data Center. Retrieved from http://www.afdc.energy.gov/fuels/electricity_infrastructure.html 60 Plug In America. (2012). Accessory Tracker. Plug In America. Retrieved from
http://www.pluginamerica.org/accessories 61 Idaho National Laboratory. (2010, December 15). Electric Vehicle Charging Levels and Requirements Overview [PowerPoint]. Idaho Falls: Francfort, J. Retrieved from http://www1.eere.energy.gov/cleancities/toolbox/pdfs/ev_charging_requirements.pdf
INTERNATIONAL ECONOMIC DEVELOPMENT COUNCIL 36
developing technology that will allow utilities to manage fast charging (and all levels of charging)
in real time. For instance, Delta Products in Fremont, California is developing a residential charger
that connects to utilities through a wireless network, which facilitates two-way communication
between the utility and charger at a low cost. Delta is one of four PEV infrastructure companies
being funded by a recently announced $7 million DOE grant.62
CCoonnssuummeerr PPssyycchhoollooggyy:: AAddaappttiinngg ttoo aa NNeeww MMiinnddsseett
Like any new technology, the adoption of PEVs requires consumers to step out into the relative
unknown and put aside tried and true technology in. Buying a PEV not only requires adjusting to a
new product with new features but also adapting to a novel infrastructure and way of life. Most
consumers still know relatively little about PEVs and what owning one would mean to their
everyday lives. As such, the speed with which consumers become informed about, and comfortable
with, the realities of PEV ownership will have a significant impact on how rapidly this market
expands.
One of the chief consumer perception issues is generally referred to as range anxiety. Range
anxiety is the concern over running out of power without the ability to recharge a PEV’s batteries.
Most gas cars can travel over 300 miles between fueling, while the range of most electric vehicles
tops out at 100-200 miles.63 Air conditioning and radio further lower the range capacity. In many
cases, range anxiety is not entirely rational, given that the Oak Ridge National Laboratory has
found that the average driver in the United States travels less than 35 miles per day, which is well
within the range of existing PEV technology.64 That said, range anxiety is also rooted in a concern
about the unusual times when need arises unexpectedly. The driving public is used to a technology
where range is almost never a concern, as gas stations are available every few miles. With
charging infrastructure still scattered, customers may worry about not being able to take PEVs on
long road trips, particularly away from urban core areas.
62 Hessman, K. (2011, December 27). DOE Invests To Lower EV Charger Costs. Earth Techling. Retrieved from http://www.earthtechling.com/2011/12/doe-invests-to-lower-ev-charger-costs/ 63 U.S. Department of Energy. (2012, February 7). Electric Vehicles. www.fueleconomy.gov. Retrieved from http://www.fueleconomy.gov/feg/evtech.shtml 64 Electrification Coalition. (2010). Economic Impact of the Electrification Roadmap. Washington, D.C. Retrieved from http://www.electrificationcoalition.org/sites/default/files/SAF_1249_EC_ImpactReport_v06_proof.pdf
INTERNATIONAL ECONOMIC DEVELOPMENT COUNCIL 37
Beyond the specific concern about range, PEVs are also subject to a range of other anxieties that
attach to most new technologies. Is the technology reliable? Do local service providers know how
to fix things that go wrong? Have all of the safety issues really been worked out? Will the
technology be much cheaper in a few years? All of these types of questions plague new
technologies, particularly ones as important to consumers’ everyday lives as how they get around.
However, if history is any guide, these types of fears will become less salient as customers
become more familiar with PEVs. The Current Hurdles section of this report discusses some lessons
learned from previous adoption of new technologies as well as how these may be applied to the
PEVs.
DDoommeessttiicc MMaannuuffaaccttuurriinngg:: CCuurrrreenntt aanndd FFuuttuurree OOppppoorrttuunniittiieess
CCuurrrreenntt MMaannuuffaaccttuurriinngg CCaappaacciittyy,, PPoosstt--AARRRRAA
Many major automakers are already producing PEVs or are planning to do so. Incumbent
automakers are in a good position to transition into PEVs since they have existing manufacturing
scale, brand recognition, supply chain relationships, customer service channels, and startup
capital.65 However, they must collectively spend billions of dollars to retool production lines and
ramp up production of PEVs. Although U.S. manufacturing capacity in the PEV space was limited
before the American Recovery and Reinvestment Act, the stimulus provided a boost to domestic
manufacturing of batteries and PEVs. Error! Reference source not found.
Table 5 below lists major automakers currently producing PEV components in the U.S., as well as
any planned expansions due to ARRA funds. Object is a more general map of all ARRA award
winners related to transportation electrification. These represent awards to firms that manufacture
PEVs or install charging infrastructure, as well as to institutions that train engineers, technicians,
and other workers crucial to PEV deployment.
65 McKinsey Quarterly. (2009, June). Electrifying cars: How three industries will evolve. Hensley, R., Knupfer, S. & Pinner, D. Retrieved from https://www.mckinseyquarterly.com/Electrifying_cars_How_three_industries_will_evolve_2370

INTERNATIONAL ECONOMIC DEVELOPMENT COUNCIL 38
Table 5: Automakers Manufacturing PEVs in the U.S.
In total, ARRA allocated $2.4 billion to support PEVs and its battery components, with $1.5 billion
as grants to U.S. battery manufacturers, $500 million to manufacturers of other PEV components,
and $400 million to demonstration projects.66 Batteries are the highest value component in PEVs,
and because battery packs have large weight-to-volume ratios, there are significant market
pressures to produce batteries as near to final assembly locations as possible. ARRA grants
contributed toward the opening of nine new battery production plants in the U.S. and helped 21
existing plants retool to make battery and electric vehicle components. According to the DOE, the
U.S. produced only two percent of the world’s advanced vehicle batteries prior to ARRA; ARRA is
66 U.S. Department of Energy. (2011, July 7). Recovery Act Funding Opportunities. Vehicle Technologies Program. Retrieved from http://www1.eere.energy.gov/vehiclesandfuels/financial/recovery.html
Company Location Function/Capacity #
Empl ARRA Support
Type of
Vehicle
General Motors White
Marsh, MD Electric motors
190
jobs
$105 million
grant from DOE
PEV and
hybrid
Nissan
Smyrna, TN
Battery plant:
200,000
batteries/yr;
Vehicle assembly
plant (Leaf): 150,00
cars/yr
1,300
jobs
$1.6 billion DOE
loan to retool
Battery
electric
vehicle
Decherd, TN
Electric motor for the
Leaf: 150,000
motors/yr
Up to
90 jobs
in
2013
Battery
electric
vehicle
Tesla
Fremont, CA
Model S:
500,000/yr
capacity
Up to
1,000
jobs $465 million loan
from DOE
Battery
electric
vehicle
Palo Alto,
CA Powertrain plant
600
jobs
Battery
electric
vehicle
INTERNATIONAL ECONOMIC DEVELOPMENT COUNCIL 39
helping boost U.S. capacity to 20 percent of world supply by 2012 and up to 40 percent by
2015.67 Object maps the PEV battery and component makers that received an ARRA award.
PPootteennttiiaall MMaannuuffaaccttuurriinngg:: SSeeiizziinngg FFuuttuurree OOppppoorrttuunniittiieess
OOppppoorrttuunniittiieess ffoorr AAuuttoommaakkeerrss
Although all major automakers are making electric vehicles, they must decide how to invest across
hybrids, plug-in hybrids, and battery electric vehicles for the future market. For example, Ford’s
Michigan Truck Plant was retooled with the help of ATVM loans to build electric vehicles. The
retooling was part of a company-wide strategy to increase its portfolio of fuel-efficient hybrids
and PEVs.
Automakers typically specialize in engine and transmission systems, while outsourcing other
components. However, the more electric-dependent a vehicle is, the more value the battery holds.
Major automakers are now building in-house expertise or partnering with specialized PEV and
battery firms to differentiate their technology. The race is to build a better battery, achieve
economies of scale, and provide the customer with the best end value. Over time, value may shift
from batteries to the electronics and software of power and thermal management systems.68
These systems constrain the overall performance of the car, so automakers may move into this
space to increase efficiency and capture this value.
OOppppoorrttuunniittiieess ffoorr BBaatttteerryy MMaakkeerrss
The global market for electric vehicle batteries in 2009 was $1.3 billion. McKinsey & Company
projects that if annual sales of PEVs reach 6-8 million by 2020, the value of the battery market
will be $60 billion.69 This potential opportunity has drawn leading battery makers as well as
startups to invest hefty research and development dollars into vehicle applications. Some have
begun to partner with automakers to gain knowledge of vehicle platforms. Incumbent battery
67 Lee, J. (2010, July 15). Electric Vehicles, Advanced Batteries, and American Jobs: Another Piece of the Puzzle in Holland, Michigan. The White House Blog. Retrieved from http://www.whitehouse.gov/blog/2010/07/15/electric-vehicles-advanced-batteries-and-american-jobs-another-piece-puzzle-holland- 68 McKinsey Quarterly. (2009, June). Electrifying cars: How three industries will evolve. Hensley, R., Knupfer, S. & Pinner, D. Retrieved from https://www.mckinseyquarterly.com/Electrifying_cars_How_three_industries_will_evolve_2370 69 Ibid.

INTERNATIONAL ECONOMIC DEVELOPMENT COUNCIL 40
makers (especially foreign) have an advantage in this market, as startup costs are high,
competition is built on economies of scale, and there are currently only a handful of customers.70
However, the battery industry has also seen a plethora of startup companies that are driven by
innovative technology and venture capitalists eyeing the expanding electric vehicle market.
As electric vehicles take off, the battery industry is set to evolve. Battery technology is highly
differentiated at the moment. Ultimately, battery makers that compete well on cost, safety, and
performance will rise as leaders. The price of batteries will also fall as technology becomes more
standardized. Once this happens, battery makers may want to expand into other systems of the
electric vehicle to gain more profit opportunities. For example, McKinsey & Company foresees
that battery companies may also be able to manufacture components for power and thermal
management systems.71
OOppppoorrttuunniittiieess iinn tthhee SSuuppppllyy CChhaaiinn
Although electric vehicles and conventional vehicles share some of the same component parts,
there are over a dozen new systems used for PEVs that are not compatible with conventional
vehicles.72 Some of these new systems include new gear boxes, electric power steering, and water
pumps to cool the electric engine. Battery packs, cell components, and basic materials for
batteries will also require supply chains to be refigured.
Figure 5 outlines the basic differences in supply chains for PEVs and conventional vehicles. Mass
deployment of PEVs will require supply chains to be retooled, thereby opening up opportunities
for battery makers, cell component makers, and their suppliers while diminishing the role of other
component suppliers. The opportunities for suppliers depend upon which companies they are
supplying. Incumbent automakers negotiate down their costs along supply chains in order to
provide the best end-value for the customer. Thus, suppliers who work with startup OEMs and
battery companies may be able to earn better profit margins.
70 Chernova, Y. (2011, December 5). Battery Companies in Need of a Boost. The Wall Street Journal. Retrieved from http://online.wsj.com/article/SB10001424052970204443404577051832763572816.html 71 McKinsey Quarterly. (2009, June). Electrifying cars: How three industries will evolve. Hensley, R., Knupfer, S. &
Pinner, D. Retrieved from https://www.mckinseyquarterly.com/Electrifying_cars_How_three_industries_will_evolve_2370 72 School of Public and Environmental Affairs at Indiana University. (2011, February). Plug-In Electric Vehicles: A Practical Plan for Progress. Retrieved from http://www.indiana.edu/~spea/pubs/TEP_combined.pdf
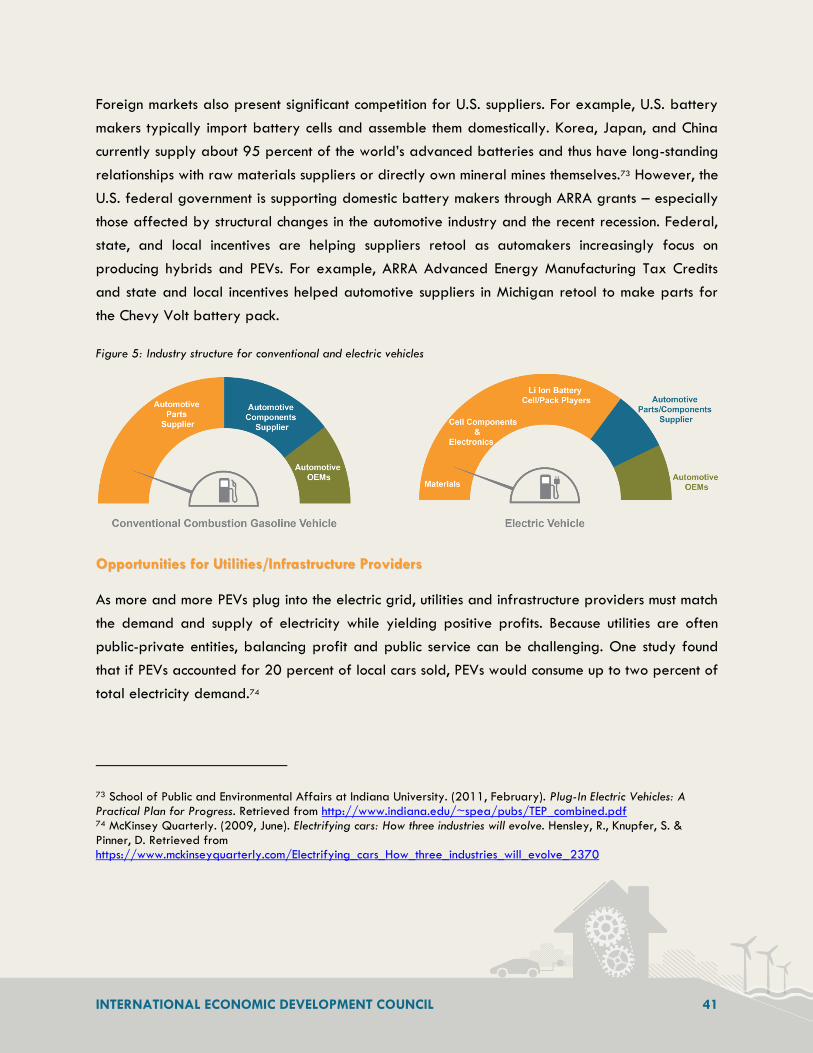
INTERNATIONAL ECONOMIC DEVELOPMENT COUNCIL 41
Foreign markets also present significant competition for U.S. suppliers. For example, U.S. battery
makers typically import battery cells and assemble them domestically. Korea, Japan, and China
currently supply about 95 percent of the world’s advanced batteries and thus have long-standing
relationships with raw materials suppliers or directly own mineral mines themselves.73 However, the
U.S. federal government is supporting domestic battery makers through ARRA grants – especially
those affected by structural changes in the automotive industry and the recent recession. Federal,
state, and local incentives are helping suppliers retool as automakers increasingly focus on
producing hybrids and PEVs. For example, ARRA Advanced Energy Manufacturing Tax Credits
and state and local incentives helped automotive suppliers in Michigan retool to make parts for
the Chevy Volt battery pack.
Figure 5: Industry structure for conventional and electric vehicles
OOppppoorrttuunniittiieess ffoorr UUttiilliittiieess//IInnffrraassttrruuccttuurree PPrroovviiddeerrss
As more and more PEVs plug into the electric grid, utilities and infrastructure providers must match
the demand and supply of electricity while yielding positive profits. Because utilities are often
public-private entities, balancing profit and public service can be challenging. One study found
that if PEVs accounted for 20 percent of local cars sold, PEVs would consume up to two percent of
total electricity demand.74
73 School of Public and Environmental Affairs at Indiana University. (2011, February). Plug-In Electric Vehicles: A
Practical Plan for Progress. Retrieved from http://www.indiana.edu/~spea/pubs/TEP_combined.pdf 74 McKinsey Quarterly. (2009, June). Electrifying cars: How three industries will evolve. Hensley, R., Knupfer, S. & Pinner, D. Retrieved from https://www.mckinseyquarterly.com/Electrifying_cars_How_three_industries_will_evolve_2370

INTERNATIONAL ECONOMIC DEVELOPMENT COUNCIL 42
If cars charge mostly at night, little or no new capacity will be needed. However, if new
generation capacity is needed, a question arises as to who will pay for the necessary upgrades.
According to one study, potential sales of 1.8 million PEVs in California will require up to $5
billion in upgrades to transmission/generation infrastructure.75 While utilities may mitigate some of
the cost through federal grants or tax credits, rates will likely go up. This raises the lifetime cost of
owning a PEV, and if rates are sufficiently high, PEV demand will go down. Utilities and
regulators will need to agree on a pricing framework that is not self-defeating, whether new
generation capacity is needed or not. The Current Hurdles section of this report discusses
infrastructure in further detail.
OOppppoorrttuunniittiieess ffoorr SSooffttwwaarree DDeevveellooppeerrss aanndd SSmmaarrtt GGrriidd
The development of the smart grid will go hand-in-hand with mass PEV deployment. The smart
grid will allow utilities to manage vehicle charging on the grid and facilitate billing during on and
off peak hours. Utilities can also use smart grid software to turn vehicle chargers on or off to
shape the system load. In vehicle to grid (V2G) applications, cars feed their electricity back into
the grid to supplement electricity supply during peak demand hours. In this case, bi-directional
chargers and appropriate software will be needed to control the charge flow.76 Initial estimates
of the entire V2G installation set the cost at $2,000.77 NRG Energy, a New Jersey-based energy
company, launched the United States’ first commercial-scale V2G demonstration project in late
2011. As results are gathered from studies like this, the unique opportunities for smart grid and
software developers will become more apparent.
CCoommppeettiittiivvee AAddvvaannttaaggeess wwiitthhiinn tthhee GGlloobbaall MMaarrkkeett
This section outlines the current global competitive landscape within industries tied to the
production of PEVs.
75 Ibid. 76 Electrification Coalition. (2009). Electrification Roadmap. Washington, D.C. Retrieved from
http://www.electrificationcoalition.org/sites/default/files/SAF_1213_EC-Roadmap_v12_Online.pdf 77 Kempton, W. et al. (2008, November). A Test of Vehicle-to-Grid (V2G) for Energy Storage and Frequency Regulation in the PJM System. University of Delware. Retrieved from http://www.udel.edu/V2G/resources/test-v2g-in-pjm-jan09.pdf
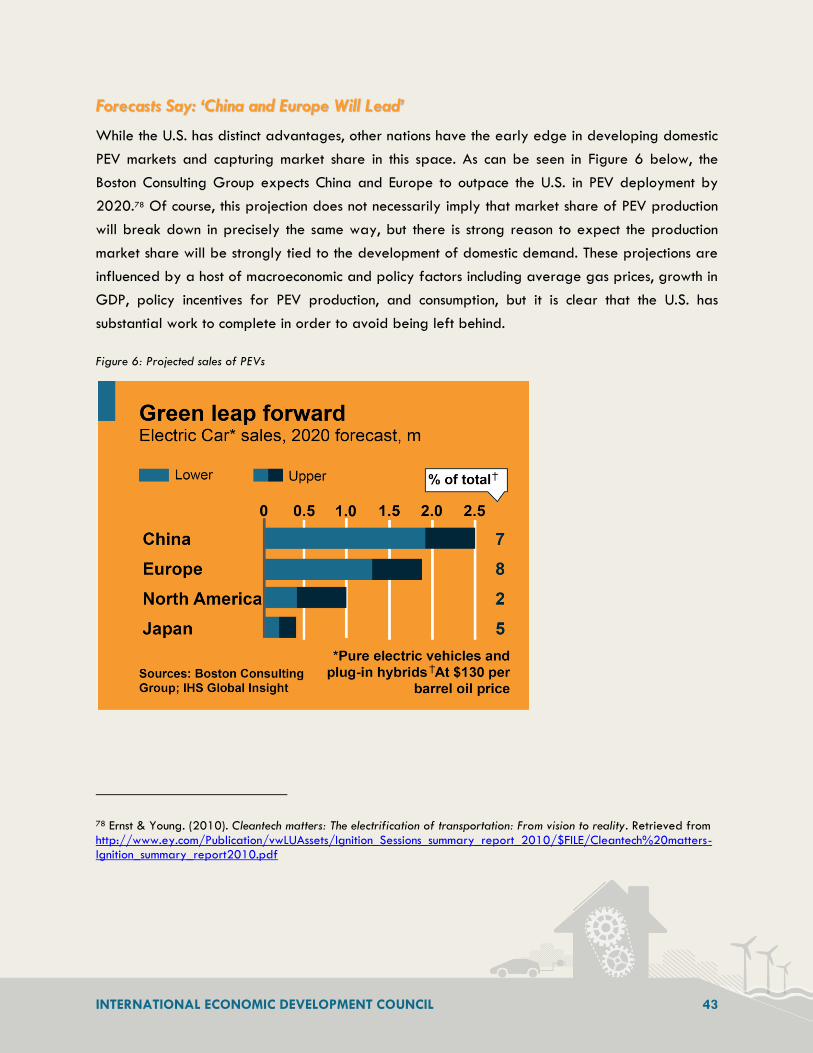
INTERNATIONAL ECONOMIC DEVELOPMENT COUNCIL 43
FFoorreeccaassttss SSaayy:: ‘‘CChhiinnaa aanndd EEuurrooppee WWiillll LLeeaadd’’
While the U.S. has distinct advantages, other nations have the early edge in developing domestic
PEV markets and capturing market share in this space. As can be seen in Figure 6 below, the
Boston Consulting Group expects China and Europe to outpace the U.S. in PEV deployment by
2020.78 Of course, this projection does not necessarily imply that market share of PEV production
will break down in precisely the same way, but there is strong reason to expect the production
market share will be strongly tied to the development of domestic demand. These projections are
influenced by a host of macroeconomic and policy factors including average gas prices, growth in
GDP, policy incentives for PEV production, and consumption, but it is clear that the U.S. has
substantial work to complete in order to avoid being left behind.
Figure 6: Projected sales of PEVs
78 Ernst & Young. (2010). Cleantech matters: The electrification of transportation: From vision to reality. Retrieved from http://www.ey.com/Publication/vwLUAssets/Ignition_Sessions_summary_report_2010/$FILE/Cleantech%20matters-Ignition_summary_report2010.pdf
INTERNATIONAL ECONOMIC DEVELOPMENT COUNCIL 44
Source: Boston Consulting Group, IHS Global Insight
OOvveerrvviieeww ooff GGlloobbaall PPEEVV MMaarrkkeettss
The next several subsections compare the competitive advantages and disadvantages for the
United States, Europe, and Asia. This summary analysis does not delve into the specific
advantages and disadvantages of specific countries or states within each larger region, but it
does outline the broad nature of the global competitive landscape in this emerging market. It is
important to note that in this space the connection between public policy and market advantages
is very strong, so these competitive advantages and disadvantages should not be viewed as
inexorable or set. As with most emerging markets, governmental policy can have a major impact
on how and where market share is captured.
TThhee RRiissiinngg UU..SS.. MMaarrkkeett
The U.S. is in a unique position. A large potential consumer base, investment in R&D, government
support, and a shifting domestic automobile industry create ripe opportunities for PEVs. The U.S. is
a substantial exporter of vehicles to the world. BMW of North America, the largest U.S. exporter
of vehicles to the world, exported $7.4 billion in vehicles in 2011.79 Although the great recession
and a suffering auto industry have hurt the U.S. economy, they can also be opportunities to retrain
workers and retool production lines for new industries. The federal government is capitalizing on
this opportunity by investing stimulus funds into domestic production and R&D capacity and
creating long term strategies to build new industries. These investments, coupled with favorable
environmental policies, are sure to make the U.S. a contender moving forward.
The U.S. PEV industry also faces some hurdles. Once a technology reaches the mass production
stage, labor costs are critical. China and India have a distinct advantage in access to inexpensive
labor. However, it is likely that Chinese and Indian labor costs will rise, and labor costs also tend
to play a lesser role in capital-intensive and innovation-driven industries. The U.S. can gain a
competitive edge in manufacturing by focusing on battery and vehicle R&D and automating the
production process. It will, however, have to face Japan’s expert auto industry and the advanced
battery industries in South Korea and China. Protectionist policies in large markets like China also
complicate expansion into foreign markets, as firms are often required to partner with a Chinese
79 R. Stromberger, personal communication, December 3, 2012.
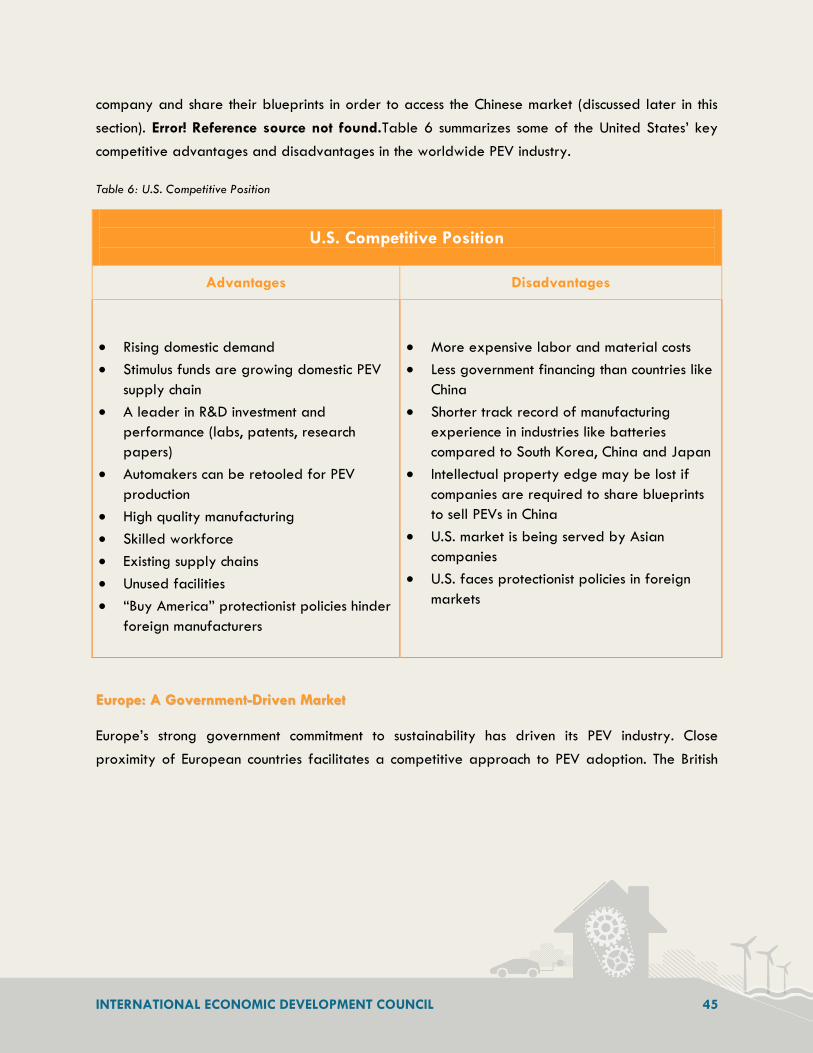
INTERNATIONAL ECONOMIC DEVELOPMENT COUNCIL 45
company and share their blueprints in order to access the Chinese market (discussed later in this
section). Error! Reference source not found.Table 6 summarizes some of the United States’ key
competitive advantages and disadvantages in the worldwide PEV industry.
Table 6: U.S. Competitive Position
EEuurrooppee:: AA GGoovveerrnnmmeenntt--DDrriivveenn MMaarrkkeett
Europe’s strong government commitment to sustainability has driven its PEV industry. Close
proximity of European countries facilitates a competitive approach to PEV adoption. The British
U.S. Competitive Position
Advantages Disadvantages
Rising domestic demand
Stimulus funds are growing domestic PEV
supply chain
A leader in R&D investment and
performance (labs, patents, research
papers)
Automakers can be retooled for PEV
production
High quality manufacturing
Skilled workforce
Existing supply chains
Unused facilities
“Buy America” protectionist policies hinder
foreign manufacturers
More expensive labor and material costs
Less government financing than countries like
China
Shorter track record of manufacturing
experience in industries like batteries
compared to South Korea, China and Japan
Intellectual property edge may be lost if
companies are required to share blueprints
to sell PEVs in China
U.S. market is being served by Asian
companies
U.S. faces protectionist policies in foreign
markets
INTERNATIONAL ECONOMIC DEVELOPMENT COUNCIL 46
government gave Nissan a £20.7 million ($32.5 million) grant to support a new plant that will
serve as the manufacturing base of the Nissan Leaf for all of Europe.80
Europe also faces significant challenges. Having a patchwork of countries makes it more difficult
to standardize safety regulations and charging infrastructure. The electric cars available on the
European market today employ a variety of charging technology, which greatly complicates
attempts to install a unified charging network.81 The European Union recognizes this challenge and
is moving forward with the Green eMotion initiative – a €41.8 million ($57.3 million) partnership
to advance PEV safety standards and infrastructure innovation (including smart grid) and improve
urban mobility.82 Green eMotion engages an EU-wide network of industries, energy players, PEV
manufacturers, municipalities, universities, and research institutions, thereby uniting existing
programs under one common initiative. Further, the EU is in talks with the U.S. to jointly address
regulatory, safety, and research issues.83 The United Nations met in Washington DC in April 2012
to set up informal standards of development and safety.84 This global partnership will allow
economies to speed up PEV deployment.
AAssiiaa:: SSuuppppllyy aanndd DDeemmaanndd SSttrreennggtthhss
A fast-growing consumer base and unparalleled government support have contributed to rapidly
rising PEV industries in Asia. Historically, Japan and South Korea have led the region in the
production of electric vehicles. However, China is the fastest-growing market in Asia. China has a
combination of high population, low oil production, and heavy government involvement in the
industry that show promise for PEV adoption. The Chinese Central Government is making an
unprecedented $15 billion investment to support PEV development and deployment. This massive
investment will help commercialize powertrain technologies, fund demonstration programs and
80 Kollewe, J. (2010, March 18). Nissan’s Sunderland factory to build new electric car. The Guardian. Retrieved from http://www.guardian.co.uk/business/2010/mar/18/nissan-leaf-sunderland-factory-jobs 81 Sebastian, S. (2010, February 10). Europe faces challenges to electric car industry. Reuters. Retrieved from http://www.reuters.com/article/2010/02/10/us-europe-electric-cars-idUSTRE6185BU20100210 82 Green eMotion. (2012). Retrieved from http://www.greenemotion-project.eu 83 Mark Drajem, “EU Working With U.S. on Electric-Car Rules, De Gucht Says,” Bloomberg, June 21, 2011,
http://www.bloomberg.com/news/2011-06-21/eu-working-with-u-s-on-electric-car-standards-de-gucht-says.html. 84 United Nations Economic Commission for Europe. (2012). Informal Group on Electric Vehicle Safety. Retrieved from http://www.unece.org/trans/main/wp29/wp29wgs/wp29grsp/evs_01.html
INTERNATIONAL ECONOMIC DEVELOPMENT COUNCIL 47
infrastructure, provide demand-side incentives, and inject funds directly into the country’s vehicle,
electric motor, and battery manufacturing operations.85
Due to these investments, the Chinese PEV market is expected to grow 40 percent annually
through 2015 (compared to ten percent annual growth in Japan).86 China has set a target of 10
percent vehicle electrification by 2020, which would mean 20 million electric vehicles on the
country’s roads.87 Although China will likely achieve its PEV deployment targets faster because of
its total investment across the board, the U.S. will likely produce more new technologies because
of its higher investment in R&D.88 Whether this translates into a stronger U.S. PEV industry will
depend partly on the size of U.S. domestic demand and how protectionist policies play out
between the two countries.
China is projected to soon surpass the region’s historical leaders in PEV production: Japan and
South Korea. Japan is a worldwide leader in the automotive sector, and its automakers are
among the first to make the leap to electric vehicles. Nissan, Mitsubishi, and Toyota have
significant PEV production capacity in Japan; the LEAF and Mitsubishi’s i-MiEV are exclusively
made in Japan, although Nissan is opening a U.S. production facility in Smyrna, Tennessee in
2012.89 The Japanese government has set a national PEV goal of 20 percent market share by
2020.90 This is an equivalent of 800,000 electric vehicles sold each year. The government has also
supported the domestic PEV industry with hefty incentives, including purchase subsidies of up to 40
percent off the original price.91 The 2011 earthquake caused widespread damage to vehicle
production facilities and crippled dozens of nuclear power plants, and electric vehicle production
85 School of Public and Environmental Affairs at Indiana University. (2011, February). Plug-In Electric Vehicles: A Practical Plan for Progress. Retrieved from http://www.indiana.edu/~spea/pubs/TEP_combined.pdf 86 Pike Research. (2011, October 6). China Will Lead Electric Vehicle Sales in Asia Pacific by 2015. Retrieved from http://www.pikeresearch.com/newsroom/china-will-lead-electric-vehicle-sales-in-asia-pacific-by-2015 87 Ibid. 88 Accenture. (2011). The United States and China: The Race to Disruptive Transport Technologies. Retrieved from http://nstore.accenture.com/acn_com/resources/Accenture_Energy_US_China_Report.pdf 89 Chambers, N. (2011, March 14). Japanese Earthquake Disrupts Electric Car Supply, Long-Term Effect Unknown. PluginCars.com. Retrieved from http://www.plugincars.com/japanese-earthquake-disrupts-electric-car-supply-long-term-effect-unknown-106929.html 90 International Energy Agency. (2011, June). Technology Roadmap: Electric and Plug-In Hybrid Vehicles. Paris. Retrieved from http://www.iea.org/papers/2011/EV_PHEV_Roadmap.pdf 91 Energy Policy Information Center. (2010, July 29). Electric Vehicle Incentives: Everywhere… Retrieved from http://energypolicyinfo.com/2010/07/electric-vehicle-incentives-everywhere%E2%80%A6/

INTERNATIONAL ECONOMIC DEVELOPMENT COUNCIL 48
was delayed by as much as several months as a result. The earthquake’s long-term impacts on
domestic production in Japan are still uncertain.
South Korea’s strong domestic battery industry supports its electric vehicle industry. Battery
companies LG Chem and SK Energy together represent 20 percent of the global lithium ion
battery market.92 Domestic PEV manufacturers include Hyundai-Kia and CT&T. The South Korean
government has also set a target of 20 percent vehicle electrification by 2020. Since the country
does not produce any oil, it is taking steps to ensure this goal is met. The government is investing
$345 million in battery and PEV-related technologies by 2014 and is offering tax incentives of
$3,400 per PEV purchased. It is also investing in charging stations along major highways.93
In India, the market for PEVs is tougher. India passed a subsidy package worth 20 percent of
each PEV sold. However, a variety of cheap cars on the market (such as the $2,200 Tata Nano
microcar) makes it difficult for PEVs to compete in India. Further, India’s PEV technology trails that
of the U.S. Seeing this gap, GM had plans to partner with India-based Reva Electric Car
Company to sell PEVs in India, but Reva was later acquired by Mahindra & Mahindra, a leading
Indian automobile company. Instead, GM is currently testing an all-electric version of the
Chevrolet Beat minicar in India.94
KKeeyy DDrriivveerrss ooff GGlloobbaall MMaarrkkeett SShhaarree
GGaass PPrriicceess PPllaayy aa RRoollee
PEV adoption is moving forward more quickly in countries with higher gas prices. Denmark and
Israel have both seen gas prices of up to $9 a gallon in recent years.95 In fact, Europe's gas prices
are typically higher than that of the U.S., which creates favorable market conditions for PEVs.
However, high gas prices are only one positive factor in supporting PEV deployment. A recent
92 Virtanen, A. & Lee, Y. (2010). Electric Vehicles: South Korea. FinPro. Retrieved from http://www.finpro.fi/documents/10304/9b52fef5-e0d1-4938-8ec8-961ea6c87491 93 Chambers, S. (2011, December 20). Emerging markets: tax cuts drive EV growth in South Korea. FC Business Intelligence Limited. Retrieved from http://analysis.evupdate.com/industry-insight/emerging-markets-tax-cuts-drive-ev-growth-south-korea 94 Jeff Cobb, “GM shows electric Chevrolet Beat in India,” GM-Volt.com, June 24, 2011, http://gm-volt.com/2011/06/24/gm-puts-its-all-electric-chevrolet-beat-on-display-in-india/. 95 Vick, K. & Hasharon, R. (2011, April 26). Israel’s Electric Car Network: Can It Change the World? TIME. Retrieved from http://www.time.com/time/world/article/0,8599,2066975,00.html
INTERNATIONAL ECONOMIC DEVELOPMENT COUNCIL 49
Deloitte survey of drivers in seven European countries confirmed that drivers also consider range,
charge time, cost, and purchase price as essential factors.96
SSiizzee ooff DDoommeessttiicc DDeemmaanndd
Companies in the PEV industry, including makers of battery electric vehicles, hybrids, and
batteries, have faced tremendous difficulty exporting to foreign markets. They may manufacture
overseas, but homemade PEV products rarely venture into foreign markets. The reason for this is
two-fold. Cars and finished battery packs are bulky and costly to transport, and so are often
manufactured close to markets. Further, many countries enact protectionist policies to encourage
growth of nascent industries like PEVs (discussed below).
In this environment, domestic demand is the primary driver of the U.S. PEV industry. While the
consumer market for PEVs is still small, government and company PEV fleets are helping to
support domestic demand. In a 2011 survey of corporate fleet managers, 28 percent indicated
they were going to introduce electric vehicles into their corporate fleet within the year.97 UPS,
Fedex and the United States Postal Service have already purchased hybrids. General Electric is
developing proprietary PEV charging technology and has committed to purchasing 25,000 PEVs
by 2015.98
City governments are also taking a role in spearheading infrastructure projects and PEV
adoption. The City of New York City, with 430 electric vehicles, boasts the largest percentage
electrification of any U.S. municipal fleet.99 Plug-In Bay Area is an initiative engaging 113 local
governments and numerous businesses in the San Francisco Bay area to encourage public
infrastructure demonstration projects, PEV fleet orders, and other PEV purchase incentives for
96 Deloitte. (2011, March 9). Deloitte survey: Despite rising fuel prices, mass adoption of electric vehicles still a distance away [Press Release]. Geneva. Retrieved from http://www.deloitte.com/view/en_GX/global/industries/manufacturing/3949c2ee7169e210VgnVCM1000001a56f00aRCRD.htm 97 Berti, F. (2011, May 18). Corporate Vehicle Fleet Managers to Add EVs to Fleets. Gas2. Retrieved from http://gas2.org/2011/05/18/corporate-vehicle-fleet-managers-to-add-evs-to-fleets/ 98 Demorro, C. (2010, November 12). GE Will Buy 25,000 Electric(ish) Vehicles by 2015. Gas2. Retrieved from http://gas2.org/2010/11/12/ge-will-buy-25000-electric-vehicles-by-2015/ 99 JotZoom. (2011, July 13). Electric Cars Added to New York Municipal Fleet. Retrieved from http://jotzoom.com/electric-cars-added-to-new-york-municipal-fleet/1517/
INTERNATIONAL ECONOMIC DEVELOPMENT COUNCIL 50
consumers.100 Project Get Ready, an initiative led by the Rocky Mountain Institute, encompasses a
national network of 14 cities that have committed to taking aggressive steps toward
electrification.
GGoovveerrnnmmeennttaall PPrrootteeccttiioonn ooff DDoommeessttiicc MMaarrkkeett
Governments hoping to jumpstart their domestic PEV industries are imposing a slate of
protectionist taxes and regulations. For example, China limits foreign investment to 50 percent on
PEV technologies.101 In order for a foreign company to sell in China, it must form a joint venture
with a Chinese company by manufacturing in China and sharing blueprints. For example, the GM
debut of the Volt in China would have relied heavily on $19,300 in government incentives, but the
Chinese government demanded that GM share engineering technology secrets.102 Some U.S.
companies, like battery-maker A123 Systems, have chosen to share technology blueprints in order
to access the enormous Chinese market.103 If this restriction continues, however, the U.S. may
struggle to retain its long-term R&D competitiveness. On the other hand, this protectionist trend
may change with the rise of international cooperation on PEV standards and technology (such as
the anticipated U.S.-EU collaboration). Other markets, such as Europe, do impose protectionist
policies but are far more accessible than China.
CCoouunnttrriieess CChhaassiinngg BBaatttteerriieess
Battery technology is a major factor in the performance of PEVs, and accordingly, countries are
racing to gain dominance in the battery industry. South Korea, China, and Japan currently supply
95 percent of the world’s advanced batteries.104 Japan pursued an aggressive plan for long-term
battery dominance and built strong supply chains by fostering relationships between domestic
battery-makers and electronic manufacturers. In addition, Japan-based Panasonic supplies 80
100 Plug-In Bay Area. Retrieved from http://pluginbayarea.org/ 101 Koh, C. (2011, May 20). China moving to keep electric vehicle value chain inside its own borders. Lux Research. Retrieved from http://www.luxresearchinc.com/blog/2011/05/china-moving-to-keep-electric-vehicle-value-chain-inside-its-own-borders/ 102 Bradsher, K. (2011, September 5). G.M. Aims the Volt at China, but Chinese Want Its Secrets. NY Times. Retrieved from http://www.nytimes.com/2011/09/06/business/global/gm-aims-the-volt-at-china-but-chinese-want-its-secrets.html?_r=2&ref=electricvehicles 103 Rahim, S. (2010, September 28). Can America Lead the Global Electric Car Industry? Scientific American. Retrieved from http://www.scientificamerican.com/article.cfm?id=can-america-lead-the-global-electric-car-industry 104 School of Public and Environmental Affairs at Indiana University. (2011, February). Plug-In Electric Vehicles: A Practical Plan for Progress. Retrieved from http://www.indiana.edu/~spea/pubs/TEP_combined.pdf

INTERNATIONAL ECONOMIC DEVELOPMENT COUNCIL 51
percent of the world’s nickel-hydride batteries used in vehicles, and with its recent acquisition of
Sanyo, the company is poised to be a leader in lithium ion batteries as well.105 South Korea, home
to Samsung SDI and LG Chem, launched a $12.5 billion project – known as the “Battery 2020
Project” – to become the leading battery producer within 10 years. China’s combination of
inexpensive labor, government incentives and access to lithium boosted its global market share
from 11 percent in 2002 to 25 percent in 2009.106
The U.S. made early investments into battery R&D but did not aggressively pursue the industry
due to lack of consumer demand for PEVs.107 Researchers at the University of Texas at Austin
developed cathode materials for rechargeable lithium batteries in the 1980s, and the U.S.
Advanced Battery Consortium made R&D investments in lithium ion battery technology beginning
in the 1990s. Currently, the U.S. government and major U.S. automakers are investing in domestic
battery production so that the U.S. does not become constrained by foreign supplies (including $2
billion in ARRA grants for battery manufacturing).
MMaajjoorr SSttaakkeehhoollddeerrss aanndd PPaarrttnneerrsshhiippss
Accelerating PEV adoption requires cooperation between a wide range of stakeholders:
government/regulatory authorities, utilities, automakers, suppliers, consumers, research institutions,
investors, and more. Indeed, each stakeholder stands to gain from increased PEV adoption, but
each must also make investments to reap the benefits. Economic developers can help coordinate
between local stakeholders and illuminate the benefits of PEV adoption to each party.
The following section identifies the key roles of each stakeholder and potential paths of
cooperation. Each stakeholder can take the lead role on certain actions while providing ancillary
support on other ones. A comprehensive community PEV strategy can then be built based on what
each party can bring to the table.
105 Ibid. 106 Ibid. 107 Ibid.

INTERNATIONAL ECONOMIC DEVELOPMENT COUNCIL 52
Local/State Government
Local and state governments, especially transportation and energy offices, have a critical role in
building a policy environment conducive to PEV adoption. This includes both demand-side
incentives, such as tax rebates and HOV lanes, as well as supply-side incentives, such as
accelerating the permitting of charging stations. Local and state governments are often
constrained by budget and staff limitations, so cooperation with other stakeholders is crucial. Also,
since governments are also the primary regulatory body, they are often tasked with fairly
distributing the benefits and costs of public projects between public and private parties.
Major benefits from PEV adoption: Job creation, talent attraction, reduced reliance on foreign
oil, cleaner air, gas savings from municipal fleet PEV purchases
Lead roles:
Act as champion for PEV adoption for the city
Consider PEVs for municipal fleet purchases
Participate in local stakeholder meetings to create comprehensive PEV readiness plan
Accelerate permitting for charging stations, provide manufacturing tax credits, invest in workforce training programs and other supply-side incentives
Provide charging stations, tax credits, HOV lanes, dedicated parking spaces and other demand-side incentives
Revise building codes to accommodate PEVs
Spearhead consumer education campaign
Support roles:
Utilities: Invest in demonstration projects conducted by utilities; work with utilities to develop a profit model
Consumers: Provide education and purchase incentives to consumers
Local businesses: Provide supply-side incentives to OEMs and suppliers for PEV production. Create workforce training programs specific to PEV manufacturing
Universities: Provide R&D funding for PEV research
Other: Work with banks to get low-interest loans for PEV purchases. Partner with investors to
make public-private investment in PEV manufacturing

INTERNATIONAL ECONOMIC DEVELOPMENT COUNCIL 53
Utilities
Utilities stand to gain a significant economic boost if there is widespread PEV adoption. However,
charging a large number of PEVs will require utilities to manage charge times and locations to avoid
overburdening the grid. In the short-term, utilities can manage charging behavior by picking the low-
hanging fruit, such as strategically locating charging stations and working with utility regulators to
incentivize electricity rates around peak hours. In the medium-term, utilities may need to install new
transmission and distribution capacity to meet demand. In the long-term, installing smart grid
capabilities will greatly improve utilities’ ability to manage charge load (see Current Hurdles section for
a detailed discussion.)
Major benefits from PEV adoption: New revenues from PEV charging
Lead roles:
Lead infrastructure demonstration projects
Participate in local stakeholder meetings to create comprehensive PEV readiness plan
Provide or certify home/commercial chargers that are compatible with grid
Negotiate electricity rates around peak hours to manage charging times
Consumer education and outreach regarding owning or charging a PEV
Support roles:
Local/state government: Assist local/state government with transportation planning/PEV policies
Consumers: Educate consumers on owning/charging a PEV; provide electricity rate incentives for owners of PEVs; certify and/or install residential chargers
Local businesses: Educate businesses on owning/charging PEV fleets; provide electricity rate incentives for PEV fleets; certify and/or install commercial chargers
Universities: Partner with universities on demonstration projects and R&D of electric vehicles
Other: Work with developers on installing public charging stations

INTERNATIONAL ECONOMIC DEVELOPMENT COUNCIL 54
Local Businesses
Local businesses can operate on both the demand and supply sides of PEV adoption. On the demand
side, businesses can purchase PEVs for their corporate fleets or provide incentive programs to
encourage PEV use among employees. On the supply side, widespread PEV adoption will open up new
service opportunities that local businesses can capitalize on. Larger businesses will be able to do more,
but smaller businesses can also implement more modest programs to encourage PEV use.
Major benefits from PEV adoption: New business opportunities from PEV servicing, “green” branding
opportunity to attract customers and environmentally conscious employees
Lead roles:
Participate in local stakeholder meetings to create comprehensive PEV readiness plan
Purchase PEVs for corporate fleets
Educate and provide incentives for employee purchases of PEVs ad workplace charging
Install commercial charging station
Support roles:
Local/state government: Inform local/state government on business impacts of PEV adoption
Utilities: Work with utilities to install commercial charging station
Consumers: Encourage PEV use through incentive programs
Universities: Large businesses can run pilot programs and provide information on consumer behavior to universities.
Other: Businesses can sponsor PEV awareness efforts in the larger community.

INTERNATIONAL ECONOMIC DEVELOPMENT COUNCIL 55
Universities
Universities and research institutions are unique resources. Faculty members and associated
researchers are leading experts in their fields, and many research universities operate on-campus
technology transfer offices that can assist with commercializing innovations. In addition to
technology advancements, universities also research the behavioral side of PEVs, such as consumer
charging behavior and price-point thresholds that make PEVs a more attractive buy. Some
universities have established research centers dedicated to electric vehicle technology and
demonstration, such as the University of California-Davis’ Plug-In Hybrid Electric Vehicle Research
Center and the Ohio State University’s Center for Automotive Research. Many of these centers are
housed in university engineering departments, while others are part of sustainability initiatives,
such as Georgetown’s Electric Vehicle Research Program.
Major benefits from PEV adoption: Technology commercialization opportunities, university
branding opportunity
Lead roles:
Participate in local stakeholder meetings to create comprehensive PEV readiness plan
R&D of PEV technology and implementation
Purchase PEV vehicles for university fleet
Promoting PEVs for student transport
Lead consumer education programs
Support roles:
Local/state government: Inform public policy discussions with appropriate expertise on technological, economic, behavioral, and environmental aspects of PEVs; contribute to consumer education programs.
Utilities: Work with utilities to gather and analyze data from PEV demonstration projects; provide expertise to utilities on technological, economic, behavioral, and environmental aspects of PEVs
Consumers: Encourage PEV use through education programs
Local businesses: Encourage PEV use through education programs; partner with PEV
companies on R&D projects and provide technology expertise

INTERNATIONAL ECONOMIC DEVELOPMENT COUNCIL 56
Consumers
Consumers can do the most to advance the PEV industry – by actually purchasing a PEV. As the
PEV industry matures, consumers will be able to reap greater cost savings from owning and
operating an electric vehicle. In addition to buying a PEV, consumers can also provide valuable
feedback to entities engaged in studying consumer behavior, such as research institutions, utilities,
and local/state governments. Drivers of PEVs can serve as PEV enthusiasts who educate other
consumers as well.
Major benefits from PEV adoption: Lower vehicle operating costs
Lead roles:
Become educated on owning/charging PEVs
Support roles:
Local/state government: Provide feedback on PEV purchase and charging behavior
Utilities: Provide feedback on PEV purchase and charging behavior
Local businesses: Inform and participate in employer incentive programs for PEVs
Universities: Provide feedback on PEV purchase and charging behavior

INTERNATIONAL ECONOMIC DEVELOPMENT COUNCIL 57
Economic Developers
Economic developers can help facilitate PEV development by rallying local and regional
organizations to remove barriers to adoption and drive interest in PEVs. Economic development
organizations have a unique role to work closely with local, state, and regional entities to align
policy priorities to support local jobs. They often are the only local agency with the resources,
network, and directive to create an environment where businesses can thrive at the local level.
Major benefits from PEV adoption: Economic development opportunities like job creation,
more local spending from decreased alliance on foreign oil and energy savings
Although economic development strategies are discussed in detail in the Hurdles and Solutions
follow up report, here is an overview of economic development lead and support roles.
Lead roles:
Negotiate financial and non-financial incentives for EV adoption
Catalyze and support EV infrastructure investment
Help educate consumer perception of EVs
Interface with the stakeholders to rally local, state and regional development of EV infrastructure and adoption
Support roles:
Local/state government: Inform public policy discussions by promoting the economic development benefits of PEVs.
Utilities: Work with utilities to advance PEV demonstration projects.
Consumers: Encourage PEV use through education programs.
Local businesses: Encourage PEV use through education or incentive programs. Conduct supply chain support activities.
Universities: Coordinate research and development of PEV technology and use.
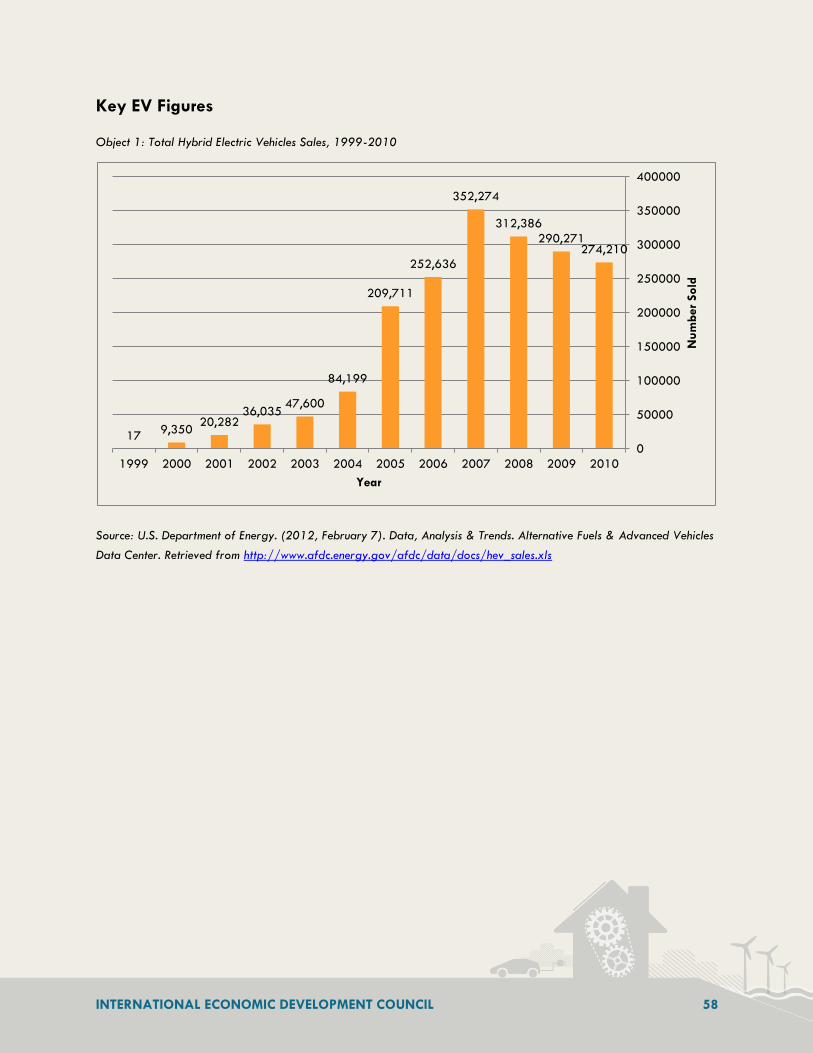
INTERNATIONAL ECONOMIC DEVELOPMENT COUNCIL 58
Key EV Figures
Object 1: Total Hybrid Electric Vehicles Sales, 1999-2010
Source: U.S. Department of Energy. (2012, February 7). Data, Analysis & Trends. Alternative Fuels & Advanced Vehicles
Data Center. Retrieved from http://www.afdc.energy.gov/afdc/data/docs/hev_sales.xls
274,210 290,271
312,386
352,274
252,636
209,711
84,199
47,600 36,035
20,282 9,350
17 0
50000
100000
150000
200000
250000
300000
350000
400000
2010 2009 2008 2007 2006 2005 2004 2003 2002 2001 2000 1999
Num
ber
Sold
Year
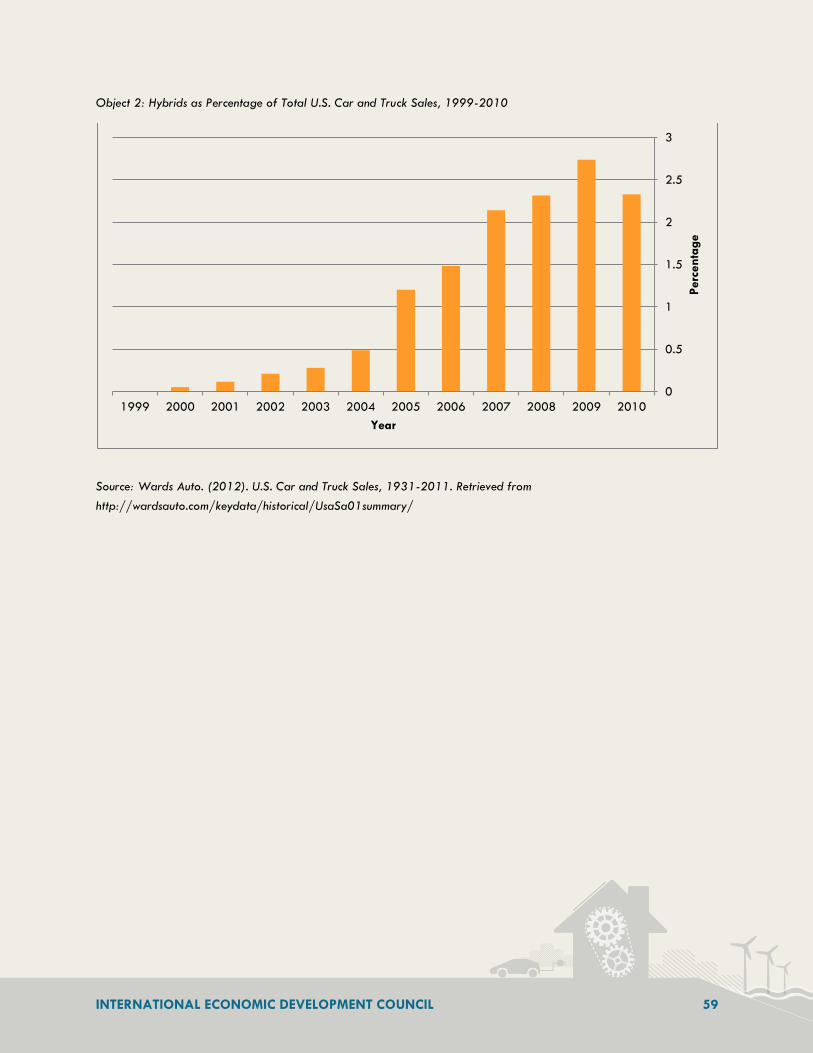
INTERNATIONAL ECONOMIC DEVELOPMENT COUNCIL 59
Object 2: Hybrids as Percentage of Total U.S. Car and Truck Sales, 1999-2010
0
0.5
1
1.5
2
2.5
3
2010 2009 2008 2007 2006 2005 2004 2003 2002 2001 2000 1999
Perc
enta
ge
Year
Source: Wards Auto. (2012). U.S. Car and Truck Sales, 1931-2011. Retrieved from
http://wardsauto.com/keydata/historical/UsaSa01summary/

INTERNATIONAL ECONOMIC DEVELOPMENT COUNCIL 60
Source: U.S. Department of Energy. (2011, February 10). Transportation Electrification Award Distribution. Washington, D.C. Retrieved from
http://www1.eere.energy.gov/recovery/pdfs/battery_awardee_map.pdf
Object 3: ARRA Awards for Transportation Electrification

INTERNATIONAL ECONOMIC DEVELOPMENT COUNCIL 61
Object 4: ARRA Awards for Battery and Component Manufacturing
Source: U.S. Department of Energy. (2011, February 10). Battery and Electric Drive Manufacturing. Washington, D.C. Retrieved
from http://www1.eere.energy.gov/recovery/pdfs/battery_awardee_map.pdf

INTERNATIONAL ECONOMIC DEVELOPMENT COUNCIL 62
HHUURRDDLLEESS AANNDD SSOOLLUUTTIIOONNSS:: EELLEECCTTRRIICC VVEEHHIICCLLEESS
MMAARRKKEETT
IEDC’s market analysis of electric vehicles points to the economic development benefits of greater
PEV adoption. It also alludes to some hurdles. Wide deployment of PEVs will require addressing
some key drawbacks, including:
Reducing the cost of PEVs,
Developing a wider network of charging infrastructure, and
Aligning consumer perception of PEVs with reality.
Currently, the supply of PEVs outweighs demand, and a PEV’s high sticker price is a large reason
why. Early adopters of PEVs are willing to pay a higher upfront cost in exchange for a PEV’s
environmental and fuel benefits. Mainstream consumers, on the other hand, put more emphasis on
the upfront cost of a PEV rather than the lifetime cost. The typical consumer discounts the value of
future savings; they prefer a dollar today over three dollars tomorrow (figuratively speaking.) In
fact, some studies on PEV deployment estimate a discount rate of 15-30%.108 Under these
conditions, the lifetime cost of PEVs need not only reach parity with that of gas cars but
outperform them by at least 15-30%. Reaching this milestone will increase demand and make
electric vehicles truly competitive with gas cars in terms of cost.
Low demand is also the reason behind another key hurdle to PEV deployment, which is an
inadequate charging network. Charging infrastructure, especially public charging stations,
requires a hefty upfront investment. Private investors are hesitant to make this investment on their
own unless the local demand for PEVs has reached a critical mass. However, this presents the
classic chicken and egg problem: consumers are also hesitant to purchase PEVs unless they know
they can find a convenient charging station. These worries are further exacerbated by consumer
108 Harvard Kennedy School, Belfer Center for Science and International Affairs. (2011, July). Will Electric Cars
Transform the U.S. Car Market? Cambridge: Lee, H. & Lovellette, G. Retrieved from
http://belfercenter.ksg.harvard.edu/files/Lee%20Lovellette%20Electric%20Vehicles%20DP%20
2011%20web.pdf
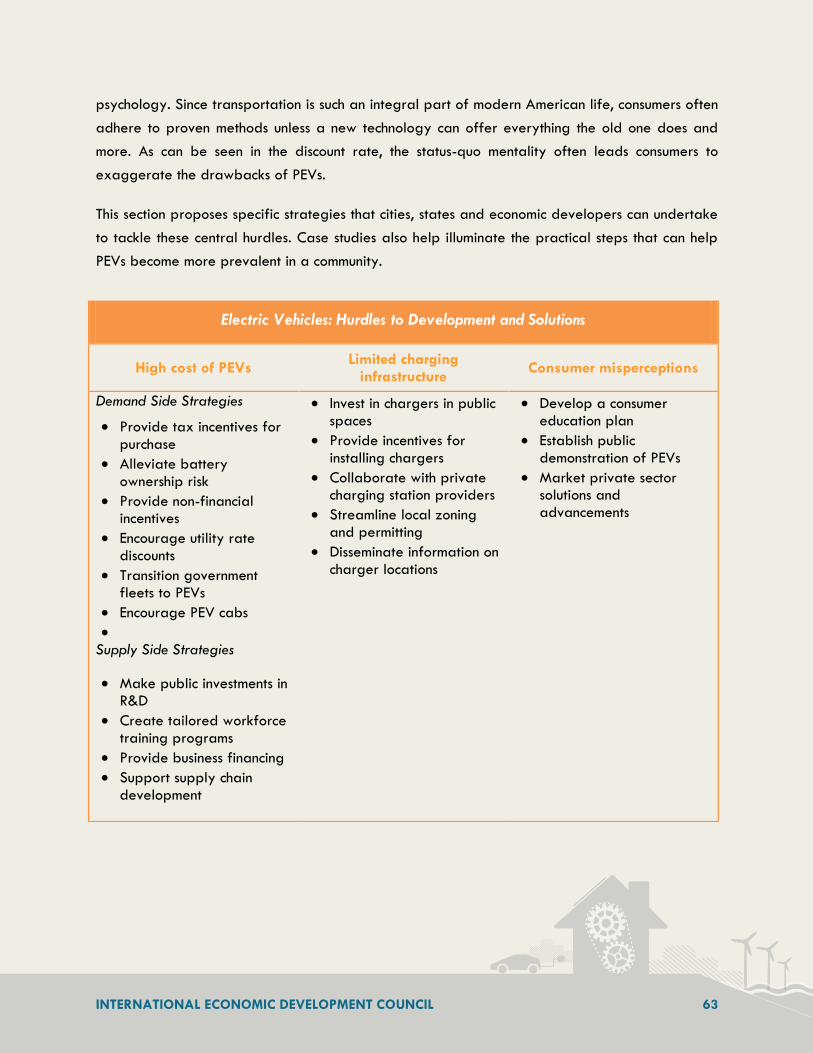
INTERNATIONAL ECONOMIC DEVELOPMENT COUNCIL 63
psychology. Since transportation is such an integral part of modern American life, consumers often
adhere to proven methods unless a new technology can offer everything the old one does and
more. As can be seen in the discount rate, the status-quo mentality often leads consumers to
exaggerate the drawbacks of PEVs.
This section proposes specific strategies that cities, states and economic developers can undertake
to tackle these central hurdles. Case studies also help illuminate the practical steps that can help
PEVs become more prevalent in a community.
Electric Vehicles: Hurdles to Development and Solutions
High cost of PEVs Limited charging
infrastructure Consumer misperceptions
Demand Side Strategies
Provide tax incentives for purchase
Alleviate battery ownership risk
Provide non-financial incentives
Encourage utility rate discounts
Transition government fleets to PEVs
Encourage PEV cabs
Supply Side Strategies
Make public investments in R&D
Create tailored workforce training programs
Provide business financing
Support supply chain development
Invest in chargers in public spaces
Provide incentives for installing chargers
Collaborate with private charging station providers
Streamline local zoning and permitting
Disseminate information on charger locations
Develop a consumer education plan
Establish public demonstration of PEVs
Market private sector solutions and advancements

INTERNATIONAL ECONOMIC DEVELOPMENT COUNCIL 64
RReedduuccee tthhee CCoosstt ooff PPEEVVss
PEVs are on a path toward cost competitiveness with, and ultimately cost advantages over,
traditional vehicles. PEVs are already much more cost effective to operate than comparable
internal combustion vehicles. With that said, PEVs currently carry a premium sticker price which
can keep potential PEV owners from making the switch from conventional vehicles. However, the
total cost of ownership, which includes the sticker price and operational costs, is likely to decrease
over time. The primary drivers of PEV cost will be economies of scale and R&D. At the same time,
the total cost of ownership for gas cars will rise if gas prices rise as projected by the U.S. Energy
Information Administration.109
EEDD SSttrraatteeggiieess
Strategies to reduce cost can be broken down into demand-side and supply-side strategies.
Demand-side strategies reduce the cost of purchasing a PEV. Demand is thought to be the limiting
factor in the growth of the PEV market, and reducing the purchase price is the primary way to
increase demand. Supply-side strategies, on the other hand, either help improve upon the product
or reduce the cost of producing PEVs. Since consumers are often turned off by PEVs’ range
limitation, advancing battery technology will help alleviate this concern. Lowering production
costs—either though innovation or through creating economies of scale—creates savings that can
then be passed on to the consumer. In this way, supply-side strategies are also indirectly demand-
side strategies.
109 U.S. Energy Information Administration. (2011, April). Annual Energy Outlook 2011. Retrieved from http://www.eia.gov/forecasts/aeo/pdf/0383%282011%29.pdf
Hurdle
The costly sticker price of PEVs can deter some buyers from purchasing them.
INTERNATIONAL ECONOMIC DEVELOPMENT COUNCIL 65
DDeemmaanndd--SSiiddee SSttrraatteeggiieess
PPrroovviiddee TTaaxx IInncceennttiivveess ffoorr PPuurrcchhaassee
Financial incentives increase demand for PEVs by reducing their purchase price. Demand-side
incentives commonly take the form of a rebate, income tax credit, or sales tax exemption. Some
incentives apply to retrofits as well. On the federal level, buyers can receive up to a $7,500
income tax credit for a PEV purchase. This tax credit makes a substantial impact on the price of
PEVs. For example, the average price of new cars purchased in August 2012 was $30,274.110
The federal tax credit bring the price of the Chevy Volt, currently priced at around $39,000,
down to comparable price levels with popular gas cars. Defending existing tax credits such as the
federal one is crucial, especially in times of tax reform.
In addition to federal incentives, most states and some cities offer additional incentives (see text
box below).111 For example, the state income tax credit for PEV buyers ranges from $750 in Utah
to up to $20,000 for commercial PEVs in California.112 While the amount of incentives each
state/city can offer may depend on its budget, a nearly free strategy is to bundle federal, state,
and local incentives to provide a complete picture of the total discount a buyer can receive. With
that said, there are a few questions state and city governments should consider when formulating
PEV purchase incentives. For example, public entities have no tax incidence, and thus would not be
eligible for a tax credit.
110 Welsh, Jonathan. (2012, September 4). Is $30,000 Cheap? New-Car Transaction Prices Rose in August. Wall Street Journal. Retrieved from http://blogs.wsj.com/drivers-seat/2012/09/04/is-30000-cheap-new-car-transaction-prices-rose-in-august/
111 Some of these are adapted from: School of Public and Environmental Affairs at Indiana University. (2011, February). Plug-In Electric Vehicles: A Practical Plan for Progress. Retrieved from http://www.indiana.edu/~spea/pubs/TEP_combined.pdf
112 School of Public and Environmental Affairs at Indiana University. (2011, February). Plug-In Electric Vehicles: A
Practical Plan for Progress. Retrieved from http://www.indiana.edu/~spea/pubs/TEP_combined.pdf

INTERNATIONAL ECONOMIC DEVELOPMENT COUNCIL 66
AAlllleevviiaattee BBaatttteerryy OOwwnneerrsshhiipp RRiisskk// RReedduucciinngg UUppffrroonntt CCoosstt
As PEV batteries endure long-term wear and tear through repeated charging cycles, they may
need to be replaced. However, the price of a replacement may deter consumers from purchasing
PEVs in the first place. Battery warranties, leases or buy-back guarantees can help alleviate this
concern. Battery warranties guarantee a free replacement in the case a battery deteriorates past
a certain performance range for a given time period. These models work because even depleted
Guidelines for Formulating PEV Incentives
1. Do we hope to promote a specific technology or will we take a technology-neutral road
to reducing emissions? Some states offer incentives for many types of fuel efficient
vehicles, including PEVs, as part of a broader green energy initiative. However, if a
state/city is heavily investing in a PEV infrastructure project, it may make more sense
to focus resources on PEV purchase incentives in order to raise demand for charging
stations.
2. What is the impact on the budget? This question comes into play when deciding the
amount of incentives to offer as well as the types of incentives and policies.
States/cities should first consider how the incentive would be paid for and how much of
the budget could be dedicated to financing the incentive. When developing the
specifics of an incentive, it is important to keep in mind that more generous the
incentives result in higher demand and thus greater government budget outlay.
3. How will we balance between demand and supply incentives? There are economic
development benefits of increasing both demand and supply for PEVs. Increasing
demand means freeing up disposable income that would have been spent on gas, and
this is income that will likely go back to stimulating the local economy. Increasing
supply helps support jobs in local manufacturing, although the success of supply-side
incentives is likely to vary by region according to the intensity of the automotive
manufacturing sector.
4. How will we balance between purchase incentives and other demand-side incentives?
State/local government can also insure battery ownership or, in particularly cash-
strapped times, offer non-financial incentives that increase demand (discussed below).
INTERNATIONAL ECONOMIC DEVELOPMENT COUNCIL 67
batteries have residual value that can be used for other applications. Automakers such as Chevy
and Nissan offer battery warranties for their PEVs.113 However, warranties are often limited in
scope, so additional warranty coverage financed through the public sector may create a stronger
case for PEVs.
In battery leasing, a third party owns the battery and customers pay monthly rates to use the
battery. This is akin to the model being tested by Better Place, a leading PEV infrastructure firm.
Better Place owns the batteries and charges PEV drivers a usage fee per mile. To allow for a
profitable business model, the fee is higher than electricity rates but still lower than gas prices.
Until this type of model becomes common in the PEV market, the public sector may want to offer
battery leasing options for PEV drivers.
PPrroovviiddee NNoonn--FFiinnaanncciiaall IInncceennttiivveess
While many discussions of PEVs focus on reducing cost impediments, a range of non-financial
incentives can effectively encourage PEV use. Particularly in tight budgetary times, communities
need to think creatively about ways of providing value to PEV owners that do not require direct
financial supports. One such strategy is to offer free parking or reserve parking spots for PEV
owners, particularly in downtown urban areas where it is difficult to find parking. These
preferential parking spots are also prime candidates for public charger installations. Another
strategy is to allow PEV drivers access to HOV lanes, especially in cities that experience heavy
traffic congestion. A number of states already do this.
The U.S. Department of Energy’s Alternative Fuels Data Center provides a comprehensive
database for state and federal incentives (http://www.afdc.energy.gov/laws/). This resource
also summarizes the previously discussed demand-side incentives and outlines what each state
offers.
113 Cole, J. (2010, October 26). Nissan LEAF Battery Warranty Update. Nissan LEAF. Retrieved from http://nissan-leaf.net/2010/10/26/nissan-leaf-battery-warranty-update/
INTERNATIONAL ECONOMIC DEVELOPMENT COUNCIL 68
EEnnccoouurraaggee UUttiilliittyy RRaattee DDiissccoouunnttss
PEVs are already cheaper to operate than conventional vehicles; but, utility rate discounts or
rebates for charging can make them even cheaper to operate. Further, utility rate discounts can
also help balance grid load. Since PEVs can represent a significant strain on the grid, rates can
be tiered by time to encourage vehicle recharging during off-peak hours. For example, Pacific
Gas & Electric Company (PG&E) enrolls customers who drive PEVs into a rate schedule that offers
discounted charging for off-peak hours and separate winter and summer rates as well. Since the
program is mandatory for all customers who drive PEVs, the program also allows PG&E to
effectively manage any extra burden that PEVs impose on the grid.
Public utility commissions (PUCs) are responsible for setting the utility rates of regulated utilities.
Economic developers can work with PUCs to gauge the benefits and costs of utility rate discounts
and set up a program that balances load demands while encouraging PEV charging. The
incentives should be structured so as to not have contradictory policies. For example, an energy
demand reduction program would not encourage EV charging.
TTrraannssiittiioonn GGoovveerrnnmmeenntt FFlleeeettss ttoo PPEEVVss
Government fleet managers trying to reign in long-term costs and to catalyze the local PEV
market can begin to phase in electric vehicles to their fleet. Fleet purchases not only directly boost
local demand, but they also demonstrate PEVs to a consumer base that may be hesitant to adopt
a new technology. Transitioning fleets can entail a specific commitment to purchasing PEVs or
imposing restrictions on the total gas consumption of government fleets. For example, federal
fleets are required to reduce their petroleum consumption by 2 percent each year through
2020.114 If the state/city commits to meeting a specific quota of PEVs, the fleet manager should
consider what types of vehicles are needed for fleets as well as fairness to automakers. For
example, the City of New York City spreads its purchases across different automakers. A recent
purchase included 50 new Chevy Volts, 10 Ford Transit Connect cargo vans, and 10 new Navistar
E-star utility trucks.115
114 School of Public and Environmental Affairs at Indiana University. (2011, February). Plug-In Electric Vehicles: A Practical Plan for Progress. Retrieved from http://www.indiana.edu/~spea/pubs/TEP_combined.pdf
115 Green Car Congress. (2011, July 12). New York City adding 70 electric vehicles to fleet; launches EV educational push. Retrieved from http://www.greencarcongress.com/2011/07/nyc-20110712.html

INTERNATIONAL ECONOMIC DEVELOPMENT COUNCIL 69
Transitioning fleets to PEVs can be expensive, especially with larger projects. State and local
governments will need to leverage multiple financing mechanisms. For example, the Bay Area
Metropolitan Transportation Commission split the costs of purchasing 90 PEVs for eight municipal
fleets in the Bay Area. Local governments made a 50-50 match for a combined investment of
about $5 million. To be sure, not all governments will be able to invest at this level. Any
investment should, however, seek to leverage grants and outside sources of funding.
An added benefit of fleet electrification is that the government can play a more direct role in
infrastructure testing and demonstration projects, since these projects require a dedicated PEV
fleet. In return, fleet managers are given access to state-of-the-art fleet management technology.
For example, infrastructure firm Coulomb Technologies has tailored partnerships with government
and corporate fleets.116 Coulomb’s ChargePoint Network service allows fleet managers to track
and control the charging of all fleet vehicles via web, email, and text message. Any charging
station installed for fleet charging can also be opened up to the public, and Coulomb passes on
the collected profits to the fleet owner. The partnership also allows Coulomb to track charging
behavior for both fleet and public vehicles and to share this data with the fleet manager.
EEnnccoouurraaggee PPEEVV CCaabbss
Buying PEV cabs or retrofitting existing cabs is a distinct opportunity for large cities and their
surrounding metropolitan areas. These urban areas are usually where charging infrastructure is
first installed, since a critical mass of PEV customers is needed to justify the investment. Urban
areas also tend to have the most taxi cabs in operation. Taxi cabs are high-mileage vehicles and
thus produce more significant gas and emissions savings over the average residential vehicle when
a standard taxi is replaced by a PEV. Taxis are also highly visible in the community and can offer
riders a first glimpse into the PEV experience.
Since taxis are in constant use, they cannot afford to sit idle for hours while charging. The City of
San Francisco is partnering with Better Place to roll out an electric taxi program that uses battery-
switching to keep taxis charged and on the go. To this end, the Bay Area Transportation
Commission is investing almost $7 million in 61 electric taxis and four charging stations (see case
116 Coulomb Technologies. (2010 March). Delivering Electric Fuel for Commercial and Government Fleets. Retrieved from http://www.coulombtech.com/pdfs/CT_SB_Fleet_Solution_Brief_201003_020.pdf
INTERNATIONAL ECONOMIC DEVELOPMENT COUNCIL 70
study, “Bay Area Local Government EV Fleet National Demonstration Project”). Another option is
to install fast-charging stations, which under current technology can get taxis in and out under 30
minutes.117
SSuuppppllyy--SSiiddee SSttrraatteeggiieess
MMaakkee PPuubblliicc IInnvveessttmmeennttss iinn RR&&DD
Since batteries are the highest cost component of PEVs, the cost of producing PEVs can be
reduced by investing in battery R&D. Namely, reducing the cost and increasing the efficiency of
batteries make the end product more palatable to consumers: a cheaper PEV with a longer
range. The federal government is investing $1.5 million in battery R&D through ARRA
appropriations.118 Many states are also providing R&D grants, loans, and tax credits to battery
makers. Some grants come from dedicated state funds set aside to accelerate high-tech industries,
such as the Indiana 21st Century Research and Technology Fund. Other states have created
dedicated funding programs for alternative vehicle technology. In California, the state energy
commission manages a program that makes grants and loans to encourage the use of alternative
and renewable fuel and vehicles. The funds can be used for a wide range of purposes related to
alternative vehicles including alternative fuel and vehicle R&D, retrofitting, expanding
infrastructure, and workforce development.
CCrreeaattee TTaaiilloorreedd WWoorrkkffoorrccee TTrraaiinniinngg PPrrooggrraammss
Widespread PEV adoption will require a host of workers trained in new skills: designing PEVs
(including batteries) and infrastructure, servicing PEVs, responding to safety issues, and upgrading
the grid. Electrical components of PEVs typically require less servicing than internal combustion
engines. However, vehicle technicians need to be trained to handle the high-voltage electrical
components of PEVs. Universities and community colleges are often tapped for their technical
expertise to develop curriculum for all types of needed skills. In Indiana, Purdue University and
Ivy Tech Community College have partnered to create a program that trains both engineers and
technicians for the PEV market. Workforce programs can also partner with training organizations
117 National Radio Cabs. (n.d.) Electric Taxis. National Radio Cabs. Retrieved from http://www.radiocabs.ie/electric-taxis.html
118 U.S. Department of Energy. (2011, July 7). Recovery Act Funding Opportunities. Vehicle Technologies Program. Retrieved from http://www1.eere.energy.gov/vehiclesandfuels/financial/recovery.html

INTERNATIONAL ECONOMIC DEVELOPMENT COUNCIL 71
such as the Clean Tech Institute, which is endorsed by the U.S. Green Vehicle Council, to provide
certified training.
PPrroovviiddee BBuussiinneessss FFiinnaanncciinngg
In addition to R&D incentives, local and state governments can provide PEV manufacturers and
suppliers with incentives tied to production, job creation, or retooling for the PEV industry. This
includes both general supply-side incentives and industry-specific incentives. Depending on its
budget, the state/city can make direct expenditures such as grants and tax credits, or it can also
leverage loan guarantees, which are not a direct financial outlay but involve financial risk.
Incentives for PEV or component manufacturing should reward more advanced technology and
consider piggybacking on existing federal incentives to support the most promising projects. For
example, the Michigan Economic Growth Authority created a special tax credit for advanced
battery makers based on the battery’s kilowatt hours of capacity. The tax credit is only available
to those battery makers whose batteries go into electric vehicles that qualify for the federal PEV
tax credit.
SSuuppppoorrtt SSuuppppllyy CChhaaiinn DDeevveellooppmmeenntt
Given that PEVs are still in their infancy, supply chain integration and development is essential to
driving down costs. As with many other emerging markets, economic developers can play a vital
role in helping manufacturers to locate suppliers and for suppliers to explore opportunities in
developing supply chains. While this function is important to reining in costs, it is also a key way
that economic developers can ensure that companies in their communities can gain access to this
growing market. A good place to begin is by reviewing the Electric Drive Transportation
Association’s membership list for existing electric drive makers and suppliers in the community or
state.119 PEV supply chains do not map perfectly onto preexisting automotive manufacturing
supply chains, so some manufacturers on this list may come as a surprise.
Once these suppliers are identified, economic developers will gain a better understanding of
what types of companies to:
119 Electric Drive Transportation Association. (2012, February 3). All Members List. Electric Drive Transportation Association. Retrieved from http://www.electricdrive.org/index.php?ht=d/sp/i/22908/pid/22908

INTERNATIONAL ECONOMIC DEVELOPMENT COUNCIL 72
Approach for retooling opportunities. Electric parts suppliers may not fully understand the
opportunities in PEV manufacturing. If a community locates a PEV manufacturing facility or is
courting one, preparing suppliers for the opportunity means potential new business for these
existing firms. Economic developers can facilitate supplier conferences, workshops, and networking
opportunities for potential PEV suppliers. Retooling incentives can also be formulated to capitalize
on local strengths in the supply chain.
Connect original equipment manufacturers (OEMs) with suppliers. Automakers need stable supply
chains in order to ensure timely and cost-effective production lines. As PEV production scales up,
connecting automakers with suppliers will help strengthen a business attraction or retention deal.
Economic developers can play a key role in making automakers aware of existing local firms that
could potentially supply PEV parts.
INTERNATIONAL ECONOMIC DEVELOPMENT COUNCIL 73
Case Study: General Motors White Marsh Plant
The General Motors electric motor plant in White Marsh, Maryland, represents a key
development in the U.S. electric vehicles industry, as it is the first plant by a major U.S.
automaker dedicated to making electric vehicle components. GM operates an existing
transmission plant in White Marsh, and the new electric motor plant was relocated from Mexico
to join GM’s facilities in Maryland. In an extra step to fulfill its eco-friendly mission, the new
plant will receive nine percent of its energy needs from a 1.23 megawatt solar array rooftop
installation. The plant, which is currently under construction, will employ 190 workers when it
opens in 2013 and generate hundreds of additional jobs along the local supply chain.
Although the plant is set to make electric motors for GM’s hybrid lines, this investment
represents a seminal step toward greater vehicle electrification and the economic development
opportunities that result. The plant also illustrates how policies and incentives can be structured
together to catalyze U.S. industries and “re-shore” outsourced jobs. In 2008, federal legislation
requiring automobiles to get better fuel efficiency spurred automakers to redesign their
portfolios to accommodate lighter vehicles and hybrid lines. Further, dedicated federal funding
through the Recovery Act and increased state and local government investment are helping
automakers suppliers make the switch toward greater electrification. For example, the new
White Marsh plant is being built with a combined $244 million investment from GM and
federal, state, and local incentives. GM is investing $129 million itself, while the U.S.
Department of Energy is contributing $105 million via Recovery Act grants. Baltimore County
approved $6 million in grants, and a further $3 million in grants are coming from the State of
Maryland. The state and county are also contributing an additional $1.75 million to train
workers for the new plant.
Source: Sentementes, G. (2011, May 17). GM breaks ground in White Marsh for electric motor
plant. The Baltimore Sun. Retrieved from http://articles.baltimoresun.com/2011-05-
17/business/bs-bz-gm-groundbreaking-20110517_1_gm-s-baltimore-transmission-plant-gm-
s-allison-transmission

INTERNATIONAL ECONOMIC DEVELOPMENT COUNCIL 74
Hurdle
Widespread PEV adoption requires a greater availability of charging stations.
EExxppaanndd CChhaarrggiinngg IInnffrraassttrruuccttuurree
While cheaper and better batteries are crucial to making PEVs more price competitive, many
industry experts see charging infrastructure as the key hurdle to the growth of this market.120 PEV
infrastructure requires expensive investment, cooperation among a host of players, and time to
expand before it can rival the universality of gas stations. Gas stations are located every few
miles in urban and suburban areas, and even the remotest of towns has a gas station. Public PEV
infrastructure is typically only located in large metropolitan areas. Home charging is sometimes
infeasible, such as is the case for multi-family units. Further, PEVs have a shorter range than gas
cars and will thus need a dense charging infrastructure that can accommodate both long and short
distance travel.
The current charging infrastructure in the U.S. is mixed at best. The Department of Energy’s
Alternative Fuels Data Center maintains a map of public and private charging stations, including
those in the planning process (http://www.afdc.energy.gov/fuels/electricity_locations.html).
Charging options vary widely between states. Even within states, PEV stations are typically
concentrated within certain cities. This limits the ability of PEV drivers to venture to adjacent cities
with limited charging infrastructure. To meet this need, the American Recovery and Reinvestment
Act helped fund the installation of 1,500 charging stations across the country. Some states are
also working together to install stations in or between metro areas that see heavy back-and-forth
travel. For example, the West Coast Green Highway is an initiative along Interstate-5, which
120 Behr, P. (2011, January 14). M.I.T. Panel Says a Charging Infrastructure May Be a Bigger Roadblock for Electric Vehicles Than Technology. Scientific American. Retrieved from http://www.scientificamerican.com/article.cfm?id=mit-panel-electric-vehicles

INTERNATIONAL ECONOMIC DEVELOPMENT COUNCIL 75
extends from Canada to Mexico along the U.S. west coast. Once complete, the project will offer
public fast charging every 25-60 miles along the entire 1,300 mile span of I-5.121
The lack of charging infrastructure can be attributed to the classic chicken-and-egg problem.
Some environmentally conscious consumers may purchase PEVs as a secondary vehicle for short-
distance travel. However, this investment may be beyond the reach of ordinary family budgets.
Until more charging stations are installed, consumers will be hesitant to purchase PEVs if it means
sacrificing driving convenience. This hesitance may be alleviated as consumers better understand
their own driving patterns. On the other side of the problem, the private sector looks to PEV sales
when deciding to invest in charging infrastructure. Charging stations are expensive and require a
long payback period. It is difficult to justify an investment if chances for profitability are still
uncertain. Thus, government subsidies on the federal, state or local level have largely supported
private-sector demonstrations.
While some of the other hurdles that confront the PEV market are difficult to address at the local
level—particularly driving down costs and increasing macro demand—local communities can do a
great deal to accelerate the installation of charging stations. Not only is this challenge very much
within the control of local communities, it represents a distinct opportunity in the early stages of
PEV deployment. As noted previously, early PEV adopters will be constrained by the availability
of charging locations, thereby making communities that can offer sufficient infrastructure distinctly
appealing. As PEVs gain traction, the availability of charging infrastructure can signal a
community’s commitment to staying on the cutting edge of technological innovation and
sustainability. All of this makes charging infrastructure one of the best points of emphasis for local
communities looking to take advantage of the economic benefits that PEVs represent.
EEDD SSttrraatteeggiieess
PPrroovviiddee IInncceennttiivveess ffoorr IInnvveessttmmeenntt iinn CChhaarrggiinngg IInnffrraassttrruuccttuurree
Charging stations, especially those offering high voltage, represent a sizable investment. Many
state and local governments are trying to bring down the costs by offering tax incentives and
public financing for PEV infrastructure. These include tax credits, low-interest loans, and grants
121 West Coast Electric Highway. (2010). West Coat Electric Highway. Retrieved from http://www.westcoastgreenhighway.com/electrichighways.htm

INTERNATIONAL ECONOMIC DEVELOPMENT COUNCIL 76
given for installing charging stations or repairing existing ones. Priority areas are residential
charging (both single unit and multi-unit homes) and work charging, since these are the places
where cars will be parked the most.
For example, state incentives range from a $75 tax credit for installing a home charger in
Arizona to a 50% tax credit for installing a public charging station in Louisiana. Some states, such
as Washington, waive sales and use taxes for labor and services related to the installation or
repair of charging stations. Cities are encouraging public infrastructure installations as well. The
Greater Houston Clean Cities Coalition provides grants up to 50 percent of the cost of installing a
public charging station. The New York City Private Fleet Alternative Fuel/Electric Vehicle Program
offers a similar grant to private companies and nonprofit organizations that install a charging
station.
At this stage of development, public-private investment is key to moving PEV infrastructure
forward. A long-term public commitment through incentives and other policies will attract the
attention of private investors who are drawn to ventures with the highest chances of profitability.
Public incentives for PEV drivers help increase demand for charging stations, and incentives for
installation lower the cost of private investment. Local governments and economic developers can
further lower investment costs by providing local banks and financiers with information on PEV
infrastructure and partnering with them to provide low-interest loans.
IInnvveesstt iinn CChhaarrggiinngg IInnffrraassttrruuccttuurree iinn PPuubblliicc SSppaacceess
Local governments can make important strides by ensuring that charging infrastructure can be
accessed in public spaces such as designated street parking areas. Although this does not replace
the need for private charging stations (i.e. home and work charging), public infrastructure serves
two vital purposes. PEV owners need actual charging locations and potential PEV buyers need to
be reassured that they will be able to rely on electricity to get them around town. As charging
stations start appearing at locations near streets, parks, government buildings, publicly operated
parking garages, and park-and-ride lots, consumer anxiety will also start to decrease.
Some “low-hanging fruit” in this area is encouraging infrastructure investment as part of the
permitting process for new buildings or developments, such as retail locations, public transit
hotspots, and parking garages, all of which are prime locations for PEV charging.

INTERNATIONAL ECONOMIC DEVELOPMENT COUNCIL 77
Monetary public investments in a new technology should be guided by a sound understanding of
the costs and benefits at stake. The Rocky Mountain Institute, as part of Project Get Ready, has
published an investment guide for public charging stations.122 The guide is a plug-and-play tool
that investors and stakeholders can use to determine what factors make a public charging station
profitable. These factors may vary widely between different states and include installation costs,
incentives (which may offset up to half the cost of hardware), and local demand for PEVs. The
guide also offers investors strategies that can improve profitability. This tool can also be used to
help state/local governments understand their role in encouraging private investment, whether it is
making direct investments or providing incentives for installing public chargers.
CCoollllaabboorraattee wwiitthh PPrriivvaattee CChhaarrggiinngg SSttaattiioonn PPrroovviiddeerrss
There are several companies currently rolling out charging infrastructure (see following text box).
Most of these efforts are in their early stages and, as of yet, there is no clear consensus on what
type of business model is the most viable. Nevertheless, these efforts represent potential allies
that local communities can partner with to enhance the availability of charging infrastructure.
These can also serve as models for future public-private initiatives to expand infrastructure.
122 See: May, J. & Mattila, M. (2009, July). Plugging In: A Stakeholder Investment Guide for Public Electric-Vehicle Charging Infrastructure. Rocky Mountain Institute. Retrieved from http://projectgetready.com/docs/Plugging%20In%20-%20A%20Stakeholder%20Investment%20Guide.pdf
INTERNATIONAL ECONOMIC DEVELOPMENT COUNCIL 78
EV Project: The EV Project is the largest private charging station demonstration.123 The project
represents $230 million in public and private investment, including a $115 million award from
ARRA. ECOtality, an advanced transportation and energy firm, is managing the installation of
14,000 chargers across 16 cities in eight states. Chargers are being installed across the west
coast, Texas, Tennessee, and Washington, D.C. to analyze charging practices across different
topographies and climates. ECOtality is also partnering with Nissan to install over 8,000
chargers in the homes of Volt and Leaf owners at no cost to the owners. The project is collecting
data on charging patterns on these home chargers and public chargers and hopes to determine
the most effective revenue models for different types of charging stations and geographies. In
the meantime, the EV Project will also support job growth by creating or retaining 1,200 jobs
through 2012.
ChargePoint America: ChargePoint America is roughly a third the size of EV Project.124 Partly
funded by $15 million from ARRA and $3.4 million from the California Energy Commission,
ChargePoint America represents a total public-private investment of $37 million. The project is
being implemented by Coulomb Technologies, which specializes in electric vehicle charging
systems and applications and has installed them worldwide. For the project, Coulomb partnered
with Ford, Chevy, and Tesla to identify cities where PEVs were being sold. Coulomb then
installed 5,000 chargers in nine cities along the east and west coasts and in Michigan,
completing installations by October 2011. Chargers were installed in public stations, private
garages, and commercial areas free of charge, and they included different voltage levels to
accommodate a variety of charging speeds. PEV drivers in the select cities also received a
complimentary home charger. The charging stations are networked through the ChargePoint
Network Operating System, a combination of cellular and radio technology that collects data
from each station on charging patterns. ChargePoint will collect data on charging behavior
through October 2013.
123 The EV Project. (2012). The EV Project. ECOtality. Retrieved from http://www.theevproject.com
124 Coulomb Technologies. (2012). ChargePoint America Program Info. ChargePoint America. Retrieved from http://chargepointamerica.com/program-info.php

INTERNATIONAL ECONOMIC DEVELOPMENT COUNCIL 79
eVgo: NRG Energy is an energy company that is proceeding with a demonstration project
funded with private dollars alone.125 NRG made an initial investment of $10 million into a
network of 150 “eVgo” charging stations and added an additional $50.5 million for charging
stations after a settlement with the state of California. The stations will be located at shopping
centers so that drivers can recharge while they shop. The network is being launched in Houston,
where the company has a significant generating capacity (including wind farms). NRG is
embracing a subscription-based revenue model: customers pay monthly fee ranging from $49 to
$89 per month in exchange for a free home charger.
Utilities: Utilities may also manage infrastructure installations and charging for their customers.
Many of these programs collect data in order to understand charging needs. Southern California
Edison (SCE) is leading the way in tracking charging behavior. SCE offers two residential
charging plans for PEV drivers: one that combines PEV charging with other household energy
needs on one meter, and one that dedicates a separate meter for PEV charging. SCE also assists
customers with finding rebates and incentives, choosing a PEV, finding qualified charging
equipment, and locating public charging stations. Portland General Electric (PGE) is also a
leading utility active in the PEV space. In addition to facilitating PEV charging on the customer
side, PGE is working with Portland State University to develop an understanding of charging
patterns and its impacts on the grid. PGE’s active role and the advocacy of other state and local
stakeholders helped lead to Oregon’s selection as one of the demonstration locations for the EV
Project. The EV Project will install over 2,000 charging stations in Portland and other Oregon
metro areas. Oregon’s PEV infrastructure is growing in tandem with its PEV market – the state
has produced several startup companies making electric vehicles and is also one of the early test
markets for major automakers rolling out PEVs. Although not discussed in length here, other
leading utilities in the PEV space include Detroit Edison, Progress Energy, Georgia Power, and
the Sacramento Municipal Utilities District.
125 Helman, C. (2010, November 18). NRG Energy Launches Network Of Electric Car Chargers, In Houston. Forbes. Retrieved from http://www.forbes.com/sites/christopherhelman/2010/11/18/nrg-energy-launches-network-of-electric-car-chargers-in-houston/

INTERNATIONAL ECONOMIC DEVELOPMENT COUNCIL 80
Case Study: Bay Area Local Government EV Fleet National Demonstration Project
The San Francisco Bay area is home to one of the nation’s largest public PEV demonstration
projects. Eleven Bay Area agencies are participating in the Local Government EV Fleet National
Demonstration project, which is part of the larger Bay Area Climate Collaborative (BACC). The
mayors of San Francisco, San Jose, and Oakland, along with business and civic leaders and
nonprofit organizations, spearheaded the BACC in an effort to align the clean energy initiatives
of Bay Area local governments. These local agencies can accelerate their own clean energy
goals by coordinating economies of scale, securing financing, and getting program management
support from BACC.
The clean energy industries targeted by BACC include solar energy, next-generation
streetlights, green building, and electric vehicles. The EV component is being carried out by six
surrounding city governments, two counties, two water agencies and a transportation authority.
These agencies are focused on demonstrating PEVs in government fleets, installing charging
stations, and increasing the overall use of PEVs. To this end, the Bay Area Metropolitan
Transportation Commission has provided major grants for four PEV projects, which are also
matched by local funds.
$7 million for electric taxi demonstration in San Francisco and San Jose. The
demonstration involves purchasing 61 taxi cabs with switchable batteries and will be
managed by Better Place. The total cost of the project is $20 million.
$2.8 million to purchase 90 PEVs for eight municipal fleets. The total cost is $5 million.
$1.7 million for adding 19 PEVs to Bay Area car-sharing programs.
$2.4 million for installing charging stations and infrastructure ready programs.
The EV working group also collaborated to publish “Ready, Set, Charge, California! A Guide to
EV-Ready Communities” as a guide for local governments on the policies, permitting, and best
practices of EV infrastructure installation:
http://www.baclimate.org/images/stories/actionareas/ev/readysetcharge_evguidelines.pdf.
By coordinating funds, pooling knowledge and reaching out to local governments, BACC is
helping to accelerate deployment of PEVs from the bottom up.

INTERNATIONAL ECONOMIC DEVELOPMENT COUNCIL 81
Sources:
Silicon Valley Leadership Group. (2012). Bay Area Impact. Bay Area Climate Collaborative.
Retrieved from http://www.baclimate.org/impact/local-government-ev-fleet.html
Metropolitan Transportation Commission. (2010, October 27). MTC Awards $33 Million in New
Grants to Spur Innovations in Emissions Reduction [Press Release]. Retrieved from
http://mtc.ca.gov/news/press_releases/rel510.htm
SSttrreeaammlliinnee LLooccaall ZZoonniinngg aanndd PPeerrmmiittttiinngg
Local zoning regulations and permitting processes can be used to accelerate the installation of
charging stations. An excellent and relatively simple first step is to ensure that permitting
processes for charging stations are streamlined. Decreasing the duration and complexity of
permitting lowers costs and uncertainty for developers and business owners. Particularly given
that charging stations serve a nascent market, authoring clear regulations and ensuring that
permitting processes run smoothly can encourage developers to take the plunge. Many
communities have instituted a one-stop permitting process and have taken steps to make the
process more transparent (see case study below). Permitting processes are often accompanied by
a variety of fees that can be reduced or waived for certain installations. For example, the city of
Columbus, Ohio waived the zoning clearance application requirement for most residential and
business charging installations and also enacted the lowest building fee for certain residential
installations.126
Going a step further, local zoning ordinances can be changed to require that electrical conduit be
included in new residential, commercial, and retail developments to accommodate future charging
infrastructure. It is useful to identify where charging infrastructure can have the most dramatic
impact and then find ways to use zoning regulations to address the need. In communities where
most PEV owners live in single-family homes where vehicles can be plugged into traditional wall
126 Rocky Mountain Institute. (2009, February 24). PGR Columbus. Retrieved from http://projectgetready.com/city/columbus-oh

INTERNATIONAL ECONOMIC DEVELOPMENT COUNCIL 82
Case Study: Raleigh’s Permitting & Installation Process
The City of Raleigh, North Carolina, began efforts to accelerate PEV deployment in 2009 when
it joined Project Get Ready. The city’s first step was to bring crucial partners to the table to form
a PEV working group. The group included the local transportation, sustainability, development
services, permitting, administration, and public affairs departments as well as the local utility and
an energy consultant. The group convened to address five key objectives related to PEV
deployment, including the PEV infrastructure permitting and installation process. Drawing on
successes in other cities, the group streamlined the PEV infrastructure permitting process to be
“walk through,” which means the permit is completed as an applicant is walked through the
process. The city developed a six-step framework to assist PEV drivers with the permitting and
installation process.
1. Identify licensed electricians: PEV drivers begin by contacting their automaker, dealer, or
utility for a list of local electricians who are licensed to install PEV charging infrastructure.
2. Assess the customer’s site: The licensed electrician visits the customer’s site (i.e. home or
business) to assess whether the electric panel has adequate capacity to accommodate PEV
charging.
3. Get a permit: The licensed electrician gets a permit from the city’s inspection center. This
process takes about an hour and costs $74.
4. Install the charger: Once the permit is obtained, the licensed electrician can install the
charger. In some cases, the customer/electrician may need to contact the utility to get a
service upgrade to accommodate the additional load.
5. Inspect the installation: The customer/electrician schedules an inspection appointment with
the city. The inspection can be made the next day if scheduled by 4 pm.
6. Integrate with the grid: Although PEV charging is not metered separately from other
household energy uses, the customer can enroll in a time-of-use rate schedule to get
discounted rates for night charging.
sockets, it may be most important to require charging stations in non-residential locations like
shopping centers, garages, and places of work so that PEV owners can feel comfortable venturing
away from their places of residence. In locations where PEV owners live in multi-unit buildings, it
may be important to use zoning regulations to require residential developments to feature
charging infrastructure.
INTERNATIONAL ECONOMIC DEVELOPMENT COUNCIL 83
DDiisssseemmiinnaattee IInnffoorrmmaattiioonn oonn CChhaarrggiinngg LLooccaattiioonnss
Making sure the public is informed of charging station locations is as important to reducing range
anxiety as having the stations installed in the first place. The U.S. Department of Energy recently
partnered with Google Maps to develop consistent and up-to-date maps of charging stations.127
PEV owners need only search for charging locations in their area and Google Maps will return
where access can be found. The application can also map out charging stations along travel
routes (see Figure 7).
One strategy local EDOs, governments and utilities can pursue is to promote this resource on their
websites, social media outlets, and other marketing materials. Not only does this inform PEV
drivers of their local charging options, but it also helps to reduce range anxiety for the local
community. Further, a national map helps illustrate how the rest of the state and nation is
progressing in infrastructure installation. This map also provides a cue that perhaps local citizens
should also push for more local charging stations.
127 U.S. Department of Energy. (2010, January 14). Basic Station Search. Alternative Fuels & Advanced Vehicles Data Center. Retrieved from http://www.afdc.energy.gov/afdc/locator/stations/
The city trained its permitting personnel and private electricians in the new process and is
currently in talks with community colleges to certify more installers. As city staff gains more
experience processing permits, there are plans to make automated permitting available online.
Source:
U.S. Department of Energy. (2011, June 6). Raleigh, North Carolina’s Plug-In Vehicle Activities
and Processes. Alternative Fuels & Advanced Vehicles Data Center. Retrieved from
http://www.afdc.energy.gov/afdc/vehicles/electric_deployment_case_study_raleigh.html
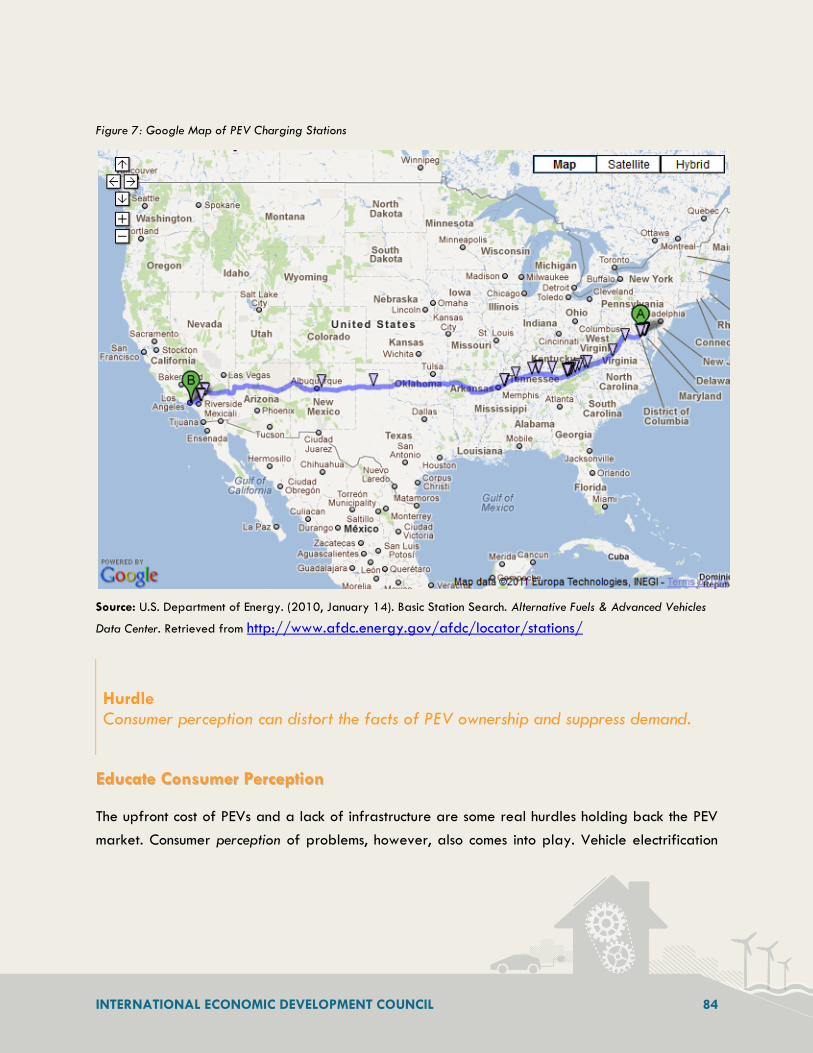
INTERNATIONAL ECONOMIC DEVELOPMENT COUNCIL 84
Figure 7: Google Map of PEV Charging Stations
Source: U.S. Department of Energy. (2010, January 14). Basic Station Search. Alternative Fuels & Advanced Vehicles
Data Center. Retrieved from http://www.afdc.energy.gov/afdc/locator/stations/
EEdduuccaattee CCoonnssuummeerr PPeerrcceeppttiioonn
The upfront cost of PEVs and a lack of infrastructure are some real hurdles holding back the PEV
market. Consumer perception of problems, however, also comes into play. Vehicle electrification
Hurdle Consumer perception can distort the facts of PEV ownership and suppress demand.

INTERNATIONAL ECONOMIC DEVELOPMENT COUNCIL 85
requires consumers to operate within a new transportation framework. Consumers attuned to the
status quo may overstate the hurdles of the transition into the new framework. For example, a
recent J.D. Power survey shows that consumers who were not willing to purchase a PEV cited
higher upfront cost, driving range, availability of charging sites, increased maintenance costs, and
lower vehicle performance as their primary motivations.128 Some of these are real challenges,
while others are perceived. For example, electric vehicles actually have lower maintenance costs
than conventional vehicles.129 A conventional vehicle motor has hundreds of moving parts, while an
electric vehicle motor only has one moving part.130 Although PEVs do have a higher upfront cost
and decreased driving range, these issues are exaggerated by perception as well.
HHiigghheerr uuppffrroonntt ccoosstt
The higher upfront cost of PEVs is balanced by fuel savings over the lifetime of the vehicle. The
payback period can be thought of as the amount of time it would take gas savings to accrue so
that purchasing a PEV is comparable to purchasing a convention vehicle. Payback periods vary
by electric vehicle model. They are also difficult to predict with accuracy since future gas prices
are volatile. Some studies estimate the payback period for PEVs could be as little as five years
with gas prices of five dollars.131 While this estimate is in the more optimistic range, government
subsidies and special low-interest bank loans are likely to make payback periods more
favorable. In the long run, R&D and economies of scale will further drive down the upfront cost of
PEVs.
The perception problem here is that consumers often discount the value of future savings. In other
words, given the choice between two vehicles of the same total lifetime cost, they tend to prefer
128 J.D. Power & Associates. (2011, April 27). Despite Rising Fuel Prices, the Outlook for “Green” Vehicles Remains Limited for the Foreseeable Future [Press Release]. Retrieved from http://businesscenter.jdpower.com/JDPAContent/CorpComm/News/content/Releases/pdf/2011039-gass.pdf
129 Center for Entrepreneurship & Technology, University of Berkeley. (2009, August 24). Electric Vehicles in the United States. Retrieved from http://cet.berkeley.edu/dl/CET_Technical%20Brief_EconomicModel2030_f.pdf
130 U.S. Department of Energy. (2005, November 7). How Do Gasoline and Electric Vehicles Compare? Retrieved from http://www1.eere.energy.gov/vehiclesandfuels/avta/light_duty/fsev/fsev_gas_elec1.html
131 Krebs, M. (2012, February 28). Will Higher Gas Prices Boost Hybrid, EV Sales? Edmunds.com. Retrieved from http://www.edmunds.com/industry-center/analysis/will-higher-gas-prices-boost-hybrid-ev-sales.html

INTERNATIONAL ECONOMIC DEVELOPMENT COUNCIL 86
the one with the lower upfront cost—all else being equal. Thus, consumer education programs
should focus on demonstrating that PEVs are not only the more environmentally friendly choice, but
they can also be more budget friendly in the long-term.
LLiimmiitteedd ddrriivviinngg rraannggee
Drivers of conventional vehicles are accustomed to travelling several hundred miles on one tank of
gas. Many current purely electric vehicles can only travel up to 100 miles on a full charge. Many
consumers cite “range anxiety” regarding PEVs since they require charging more often than
conventional cars, and charging stations are fewer and farther between than gas stations.
Figure 8: Average Daily Miles Drive (U.S.)132
For everyday use, range anxiety is more of a perception problem than a real hurdle. As Figure 8
illustrates, PEVs can easily accommodate the average daily driving range on one full charge. This
makes PEVs a natural fit for driving to and from work, the grocery store, and other daily errands.
However, as discussed earlier, the lack of charging stations along long-distance routes may limit
how drivers can use PEVs. Early adopters often use PEVs for getting to and from work but keep a
132 Electrification Coalition. (2009). Electrification Roadmap. Washington, D.C. Retrieved from
http://www.electrificationcoalition.org/sites/default/files/SAF_1213_EC-
Roadmap_v12_Online.pdf

INTERNATIONAL ECONOMIC DEVELOPMENT COUNCIL 87
gas car as a backup for long-distance trips.133 As more charging stations are installed, long-
distance trips in a PEV will become more feasible.
Another aspect of range anxiety is that extra strain on the battery can dramatically and
unpredictability reduce a PEV’s range. For example, the Nissan Leaf has a potential range of up
to 73 miles, but averages only 65 miles when the electric heater is running.134 In these situations,
drivers may not be able to reach a charging station when recharging is required sooner than
expected. If there is a charger nearby, the process of charging itself can be an issue. Level III fast
chargers can charge a PEV in about the same time it takes to refuel a gas car. However, fast
chargers are very expensive to install and hence less commonly found. Level I and II chargers can
also do the job, but they require longer charging times.
Better battery technology is the long-term solution to reducing range anxiety. In the short-term,
installing more public charging stations and making drivers aware of their locations can greatly
reduce range anxiety. According to one study, installing even one public charging station per 100
electric vehicles can sufficiently alleviate range anxiety during the early stages of PEV rollout.135
However, in practice, it is difficult to pinpoint an exact ratio since consumer perception is fluid and
is influenced by many factors.
133 Garthwaite, J. (2011, March 10). Range Anxiety: Fact or Fiction? National Geographic. Retrieved from http://news.nationalgeographic.com/news/energy/2011/03/110310-electric-car-range-anxiety/
134 Consumers Union. (2011, April). Initial impressions: Nissan Leaf. Consumer Reports. Retrieved from http://www.consumerreports.org/cro/magazine-archive/2011/april/cars/nissan-leaf/overview/index.htm
135 Roland Berger Strategy Consultants. (2010). PEV Readiness Study: Electric Vehicles in America. Retrieved from http://www.rolandberger.com/expertise/industries/automotive/2010-10-14-rbsc-pub-PEV_Readiness_Study_Electric_Vehicles_in_America.html
INTERNATIONAL ECONOMIC DEVELOPMENT COUNCIL 88
EEDD SSttrraatteeggiieess
MMaarrkkeett ““ssttoorriieess”” ooff EEVVss’’ eeccoonnoommiicc iimmppaacctt
To supplement EV job creation studies, EDOs can share anecdotal evidence of how EVs have
impacted their local economies. Many EDOs are already doing this by publicizing stories of
attraction or retention deals in traditional industry sectors. There is often a disconnect between
new industries and economic developers. Economic developers can connect with local EV
manufacturers and suppliers to understand job and economic benefits and then help promote
these success stories.
DDeevveelloopp aa ccoonnssuummeerr eedduuccaattiioonn ppllaann
While early adopters are more willing to research and accept the environmental and overall cost
advantages of PEVs, wide deployment of PEVs will require addressing the concerns of ordinary
consumers. The economic development strategies discussed in previous sections make great strides
in directly tackling these concerns: the high upfront cost of PEVs and a lack of infrastructure.
However, developing a consumer education plan is crucial to disseminating the latest advances in
addressing hurdles and dispelling myths about PEVs. Consumer education plans should be
developed with the target audience in mind, and the most obvious target group is car buyers.
There are several existing resources for prospective buyers from which economic developers can
draw information.
“Plugging In: A Consumer’s Guide to the Electric Vehicle” (published by Electric Power
Research Institute)
This introductory guide to electric vehicles explains the differences between major electric
vehicle technologies, answers basic questions potential buyers may have, and showcases current
and upcoming models of EVs. (http://plugmyride.org/PDF/EPRI%27s_EV_consumer-
guide_Apr2011.pdf)
Green Vehicle Guide (EPA): This online resource helps potential buyers search EVs by the states
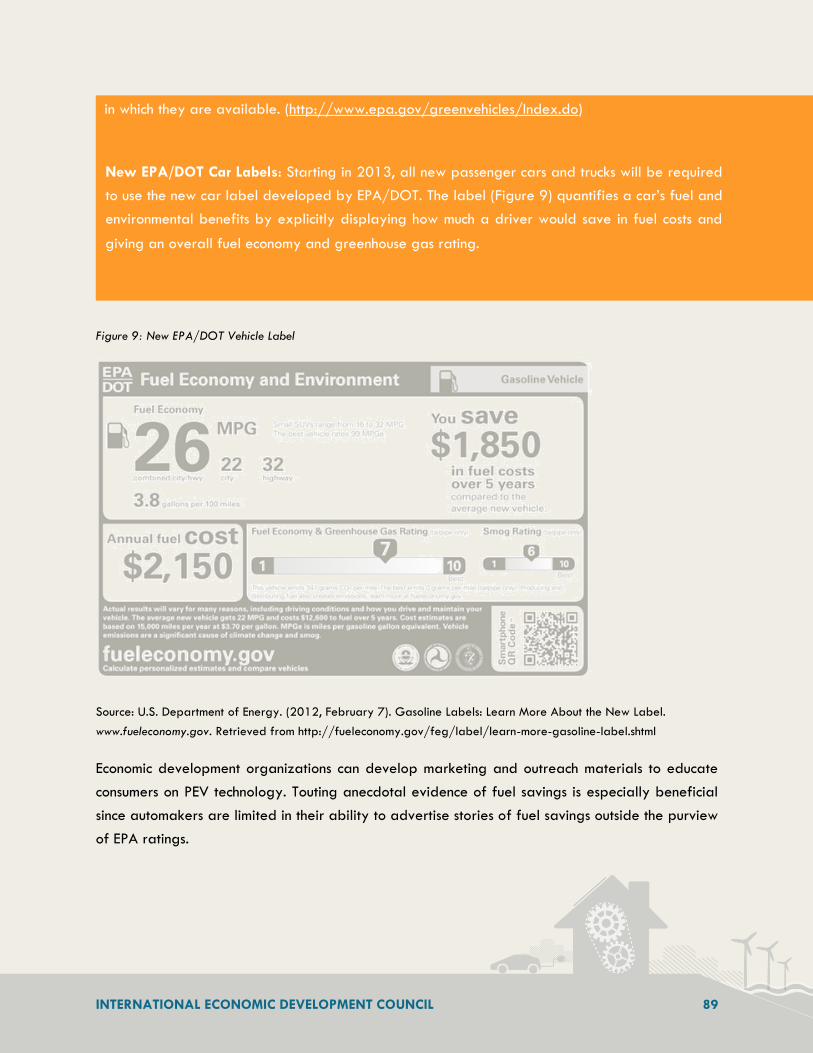
INTERNATIONAL ECONOMIC DEVELOPMENT COUNCIL 89
Figure 9: New EPA/DOT Vehicle Label
Source: U.S. Department of Energy. (2012, February 7). Gasoline Labels: Learn More About the New Label.
www.fueleconomy.gov. Retrieved from http://fueleconomy.gov/feg/label/learn-more-gasoline-label.shtml
Economic development organizations can develop marketing and outreach materials to educate
consumers on PEV technology. Touting anecdotal evidence of fuel savings is especially beneficial
since automakers are limited in their ability to advertise stories of fuel savings outside the purview
of EPA ratings.
in which they are available. (http://www.epa.gov/greenvehicles/Index.do)
New EPA/DOT Car Labels: Starting in 2013, all new passenger cars and trucks will be required
to use the new car label developed by EPA/DOT. The label (Figure 9) quantifies a car’s fuel and
environmental benefits by explicitly displaying how much a driver would save in fuel costs and
giving an overall fuel economy and greenhouse gas rating.
INTERNATIONAL ECONOMIC DEVELOPMENT COUNCIL 90
One example of a consumer education initiative is West Virginia University’s DOE-funded
Advanced Electric Drive Vehicle Education Program (AEDVE). The program disseminates
information to consumers through a website, media relations and project marketing. The website
provides a basic educational toolkit that includes: a downloadable vehicle simulation and
demonstration software tool, videos and animations, an online press room, RSS feeds, white
papers, podcasts, and an event calendar. AEDVE’s media presence encompasses television
segments, press releases, and social media sites such as Facebook, LinkedIn and Twitter. AEDVE
also hosts the National Alternative Fuels Vehicle Day each year across hundreds of high schools
and colleges nationwide. Each event promotes alternative fuel vehicles (including PEVs) through
activities like test rides, vehicle displays, workshops, trivia contests, and automotive lab tours.
Consumer education initiatives like this can not only reach out to today’s generation of car buyers,
but help raise a future generation within an electric vehicle mindset.
EEssttaabblliisshh PPuubblliicc DDeemmoonnssttrraattiioonn ooff PPEEVVss
City PEV fleets, as a visible consumer of PEVs and infrastructure, can help instill consumer
confidence by publicly demonstrating the viability of PEVs as a substitute for conventional cars.
Public demonstrations can impact consumer perception in several ways. Increasing PEVs’ visibility
helps reduce their novelty and get consumers more acclimated to the PEV culture. Demonstrations
also lend the help of social networks to market PEVs through word-of-mouth, as increased visibility
will get consumers talking to each other about PEVs and further raise awareness.
Cities can scale public demonstrations according to their available resources. As a first step,
featuring several high-profile PEV drivers such as city officials, local celebrities and media
personalities can raise awareness at a relatively low cost. Cities that have PEV fleets should
update the public on the progress of the PEV program, and those that participate in national
infrastructure demonstrations (such as the EV Project) can partner with sister cities to collectively
market PEVs among the network. Public demonstrations can directly engage the consumer by
providing opportunities to test drive PEVs. These are the perfect occasion to invite media
representatives to increase media coverage.
INTERNATIONAL ECONOMIC DEVELOPMENT COUNCIL 91
MMaarrkkeett pprriivvaattee sseeccttoorr ssoolluuttiioonnss
The private sector is also taking steps to help alleviate range anxiety. Automakers, technology
firms, and service companies alike are creating innovative methods to keep drivers more informed
of their charging needs and options. For example, “MyFord Mobile” is a cell phone application
that connects to the Ford Focus Electric’s on-board wireless module.136 The application provides a
PEV owner with his vehicle’s current state of charge and the amount of time needed to reach
different charge levels. Based on current charge levels, the application can calculate whether
there is sufficient charge to reach desired destinations and plots nearby charging stations. The
calculation takes into account other factors that may affect battery life, such as the outside
temperature. MyFord Mobile also provides smart-charging data to help drivers charge during
non-peak hours and records how much the driver saves in fuel costs compared to driving a gas
car. In case a PEV driver does get stranded, AAA provides roadside assistance in select pilot
regions to quick charge PEVs that are stranded.137 Cities and economic developers should not only
stay informed of the latest innovations in battery technology, but also of these supplementary PEV
innovations as well.
CCoonnvveennttiioonn GGaass CCaarrss:: LLeessssoonnss ffoorr EElleeccttrriicc VVeehhiicclleess
The conventional gas car industry has obvious and natural parallels to the electric vehicles
industry. Early gas cars were quite expensive. For instance, a Model T in 1908 cost up to two
year’s average wages.138 Further, since trains were the primary form of early long-distance
travel, roads were scarce and inadequate. Building and updating a national network of roads
required concerted Congressional effort and coordination among individual states. Early gas cars
had a reputation for being dirty, noisy, and inconvenient, and marketers had to convince
136 Ford Motor Company. (2011, January 7). New MyFord Mobile App Keeps Focus Electric Owner Engaged and In Control of Electric Car Experience. Ford Media. Retrieved from http://media.ford.com/article_display.cfm?article_id=33763
137 Glover, M. (2011, August 3). AAA to provide emergency recharging for electric vehicles. The Modesto Bee. Retrieved from http://www.modbee.com/2011/08/03/1801661/aaa-to-provide-emergency-recharging.html
138 Skousen, M. (2008). EconoPower: How a New Generation of Economists is Transforming the World. Hoboken, NJ: Wiley.
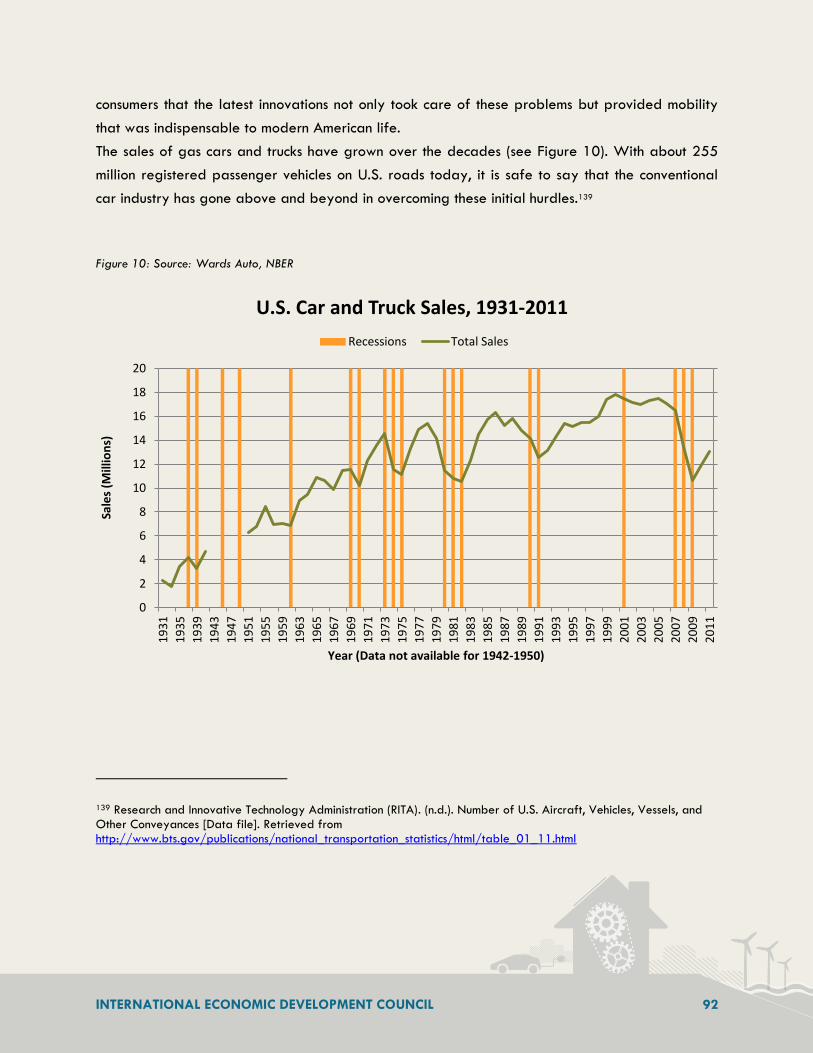
INTERNATIONAL ECONOMIC DEVELOPMENT COUNCIL 92
consumers that the latest innovations not only took care of these problems but provided mobility
that was indispensable to modern American life.
The sales of gas cars and trucks have grown over the decades (see Figure 10). With about 255
million registered passenger vehicles on U.S. roads today, it is safe to say that the conventional
car industry has gone above and beyond in overcoming these initial hurdles.139
Figure 10: Source: Wards Auto, NBER
139 Research and Innovative Technology Administration (RITA). (n.d.). Number of U.S. Aircraft, Vehicles, Vessels, and Other Conveyances [Data file]. Retrieved from http://www.bts.gov/publications/national_transportation_statistics/html/table_01_11.html
0
2
4
6
8
10
12
14
16
18
20
19
31
19
35
19
39
19
43
19
47
19
51
19
55
19
59
19
63
19
65
19
67
19
69
19
71
19
73
19
75
19
77
19
79
19
81
19
83
19
85
19
87
19
89
19
91
19
93
19
95
19
97
19
99
20
01
20
03
20
05
20
07
20
09
20
11
Sale
s (M
illio
ns)
Year (Data not available for 1942-1950)
U.S. Car and Truck Sales, 1931-2011
Recessions Total Sales

INTERNATIONAL ECONOMIC DEVELOPMENT COUNCIL 93
AA BBrriieeff EEaarrllyy HHiissttoorryy
The American automobile industry began in the 1890s when inventors in Michigan and New
England built on the popularity of bicycles by introducing other self-propelled vehicles like electric
carriages, steam cars, and motorized trucks. Each technology had its drawbacks: electric batteries
had short range, steam cars required long starting times in cold weather, and gas cars were loud,
dirty and needed the help of a hand crank to start. However, the hand crank was no longer
needed after the invention of the electric starter, and the gas-powered internal combustion engine
soon became the dominant vehicle technology.
By 1905, Michigan had risen to prominence as the automobile capital of the nation. The state’s
timber, copper, and iron industries had made a few capitalists very wealthy, and these capitalists
were ready to invest in new automobile ventures. Michigan is also home to two prominent
automobile entrepreneurs: Ransom E. Olds (of Oldsmobile) and Henry Ford. Ford’s invention of the
moving assembly line greatly reduced production costs. Once cars became affordable for the
average consumer, they radically changed the landscape of American life by connecting urban
and rural areas, making suburban communities possible, and boosting the tourism industry as
Americans became increasingly mobile.
PPrroocceessss iinnnnoovvaattiioonn rreedduucceess ssuuppppllyy--ssiiddee ccoossttss
Conventional cars faced many of the same hurdles early on that electric vehicles face today. The
section below presents shared hurdles and lessons taken from the conventional car industry.
Early in their history, gas cars were so expensive that they were considered a toy for the rich. To
reach the mass market, Henry Ford took a cue from the meat-packing plants of Chicago and
Cincinnati where meat was moved via conveyor belt between workers.140 Ford implemented the
140 History.com. (n.d.). Moving Assembly Line at Ford. Retrieved from http://www.history.com/this-day-in-history/moving-assembly-line-at-ford
Hurdle Gas cars have a high upfront cost for consumers.

INTERNATIONAL ECONOMIC DEVELOPMENT COUNCIL 94
assembly line technique in the production of cars and reduced the average assembly time of one
component from 20 minutes to five minutes.141 This time-saving procedure translated into cost-
savings as well, as the price of the Model T fell from $850 to $260 after this innovation.142 Ford’s
“low cost, high volume” approach allowed the company to appeal to average consumers and
take a significant share of the car market.
Over time, the assembly line technique became rivaled by the “lean manufacturing” approach of
Japanese automakers. Instead of sending a car down an entire assembly line, small teams of
workers built each car. This technique allowed automakers to quickly switch to making new
models. This also allowed workers to view the “bigger picture” of the production process and to
more easily identify possible improvements. These examples illustrate that process innovation can
create significant cost savings. Since electric vehicles involve a different assembly process than
gas cars, rethinking how electric vehicle production can be streamlined may produce supply-side
savings that can be passed on to the consumer.
SSqquueeeezziinngg ccoosstt ssaavviinnggss ffrroomm tthhee ssuuppppllyy cchhaaiinn
Early auto manufacturing is epitomized by Henry Ford’s Rouge facility near Detroit, Michigan. The
facility was completely vertically integrated, as raw materials arrived in one gate and finished
cars exited the other.143 Since then, automakers have warmed to the idea of “doing what they do
best” and relying on supply chains for the rest. The concentration of the Big Three—Ford, General
Motors, and Chrysler—in Detroit drove the development of local supply chains. By working
closely with local suppliers, automakers helped speed the standardization of car parts. Further,
by firms focusing on what they do best, they produced economies of scale along the supply chain.
This was the approach that Japanese automakers took early on, and coupled with the “lean
manufacturing” approach, they were subsequently able to produce cheaper and better cars than
141 Ibid.
142 Ford Motor Company. (n.d.). Model T Facts. Retrieved from http://media.ford.com/article_display.cfm?article_id=858
143 National Science Foundation. (n.d.). Supply Chain Management. Retrieved from http://www.nsf.gov/about/history/nsf0050/manufacturing/supply.htm

INTERNATIONAL ECONOMIC DEVELOPMENT COUNCIL 95
their U.S. counterparts. More recently, automakers across the world are revisiting their supply
chains to generate new cost savings:
A Wharton Business School professor devised a new strategy for General Motors to revamp
how they distribute 600,000 repair parts to over a thousand local dealers.144 Using empirical
data and mathematical models, the strategy allowed GM to reduce their idle inventory while
anticipating the demands of their dealerships.
Indian automaker Tato determined through market research that customers would be willing to
pay $2,500 for their budget car, the Nano.145 Tato then worked backwards to meet the
target price by challenging suppliers to make lower-cost components without sacrificing
quality or service. For example, the Nano uses a smaller (and thus cheaper) engine since they
will often be driven at low speeds in India’s congested city roads.
These lessons demonstrate that supply chain economies are crucial to low production costs and
supply chain innovation is far from obsolete.
FFeeddeerraall aanndd ssttaattee ggoovveerrnnmmeennttss rraaiisseedd ttaaxxeess ffoorr rrooaadd eexxppaannssiioonn
Before the advent of the automobile, roads were primarily used by bicyclists. As cars began to
gain popularity, drivers added to the demand for reliable roads, especially in rural areas serving
farmers. By 1916, there were 2.3 million vehicles on U.S. roads.146 Beginning that year, Congress
passed a series of acts that eventually culminated in the modern interstate system. The Federal
Road Aid Act of 1916 allotted $75 million in federal funds to states for the construction of rural
144 Ibid.
145 Scanlon, J. (2009, March 18). What Can Tata's Nano Teach Detroit? Bloomberg BusinessWeek. Retrieved from http://www.businessweek.com/innovate/content/mar2009/id20090318_012120_page_2.htm
146 Wisconsin Historical Society. (2012). Federal Highway Act. Retrieved from http://www.wisconsinhistory.org/archstories/late_roads/fed_hwy_act.asp
Hurdle Gas cars require widespread infrastructure, including roads and gas stations.
INTERNATIONAL ECONOMIC DEVELOPMENT COUNCIL 96
roads.147 The funds were appropriated based on each state’s land area, population and mileage
of rural delivery routes, and the terms also required each state to set up a highway agency to
oversee the projects. In 1921, Congress authorized the Bureau of Public Roads to implement the
construction of highway systems in each state and to make sure road networks tied into other
land-use plans and transportation options. The Federal Highway Act of 1956 authorized the
construction of the modern interstate highway system. The highways would be funded by 90/10
federal to state funds, with the federal portion being funded by federal gas and diesel fuel
taxes. The state portion would be funded by a state-level gas tax.
The history of national road expansion demonstrates two key points.
New roads were multipurpose. They met the demand for infrastructure for motorists and
bicyclists alike. PEV charging infrastructure could be adapted to accommodate many charging levels
and serve multiple uses – charging PEV passenger vehicles, commercial trucks, recreational vehicles,
electric lawn mowers, etc. This would raise the demand for charging stations and encourage the
installation of more stations.
While there was early resistance against raising taxes, federal and state gas taxes are now
regarded as commonplace. The shared burden between federal and state coffers also suited the
nature of the demand for infrastructure – roads are prioritized by local demand (i.e. number of
vehicles) but an interstate system also recognizes the need for long-distance travel. PEV
infrastructure also must balance between local and long-distance travel needs, which make it well
suited for a combination of state-federal investment.
Oil companies invested in gas stations
Early on, gas cars refueled at hardware, drug, and general stores, or at the occasional curbside
vendor.148 As demand for cars rose, so did demand for “filling stations.” Oil companies hoped to
differentiate themselves by building dedicated gas stations that marketed and sold their brand
oil. These gas stations displayed state-of-the-art equipment and were an attraction in themselves.
147 Weingroff, R. (2011, April 8). Federal Aid Road Act of 1916: Building the Foundation. U.S. Federal Highway Administration. Retrieved from http://www.fhwa.dot.gov/publications/publicroads/96summer/p96su2.cfm
148 Pees, S. (2004). Gasoline Stations. Oil History. Retrieved from http://www.petroleumhistory.org/OilHistory/pages/gasoline/stations.html

INTERNATIONAL ECONOMIC DEVELOPMENT COUNCIL 97
The stations were often located next to car dealerships for convenience and offered extra
amenities like free maps, water and air.149 Today, PEV charging stations are often installed as a
secondary service in shopping malls, garages, restaurants, etc. Just as oil companies began
installing filling stations with the rise of gas cars, utilities or third party firms may install more PEV
charging stations as demand rises.
CCoollllaabboorraattiioonn aaccrroossss iinndduussttrriieess aanndd iinnssttiittuuttiioonnss ttoo aaddddrreessss ccoonnssuummeerr ccoonncceerrnnss
Before the invention of the electric starter, drivers had to use a
hand crank to start a gas engine. These hand cranks were both
inconvenient and dangerous, as they required enormous strength to
operate and could kick back at the driver with great force. A
friend of Henry Leland, head of the Cadillac Motor Car
Company, died from injuries related to a hand crank accident.
Leland thus solicited for researchers to work on developing a self-
starter. Charles Kettering, an engineer who worked at a cash
register manufacturing firm at the time, then invented an electric
starter based on the blueprints for a cash register motor. The
electric starter could turn on a gas engine with the touch of a
button. These starters were introduced with the 1912 generation
of Cadillacs. The invention of the electric starter made gas cars
safer, more convenient, and marked a turning point in the rise of
gas cars.
149 WITF-TV. (2000). First Drive-In Filling Station Historical Marker. ExplorePAHistory.com. Retrieved from http://explorepahistory.com/hmarker.php?markerId=1-A-112
Hurdle Consumers need to adjust to a new transportation paradigm.
Figure 11: 1912 Advertisement for
a Cadillac with a self-starting
engine
INTERNATIONAL ECONOMIC DEVELOPMENT COUNCIL 98
CCaarrmmaakkeerrss iinnttrroodduucceedd ffrreesshh mmaarrkkeettiinngg tteecchhnniiqquueess
As cars became more commonplace, the market for first-time buyers hit a peak and began to
shrink in the 1920s. Alfred P. Sloan, former president of General Motors, devised new strategies
to persuade Americans to buy more new cars. Sloan introduced annual models, changing the
appearance and features of cars each year so customers could “trade up” or think about adding
a second car to their garage. Sloan also segmented GM’s brands by price to produce “a car for
every purse and purpose.”150 In this brand structure, the top line in one brand costs a little less
than the lowest priced model of the next expensive brand. This way, customers could be more
easily persuaded to transition into the more expensive brand.
The rise of gas cars also introduced a new aspect to American life: indebtedness. Carmakers
allowed customers to pay off a car in installments, and gasoline companies also issued credit
cards to aid with car purchases.151 Despite the high up-front cost, consumers felt they could afford
a car with these financing mechanisms. Likewise, making PEVs more affordable includes making
them feel more affordable through creative financing mechanisms. The majority of PEV buyers
today have an above-average income. However, not all PEVs are more expensive than gas cars.
The Tato Nano in India, priced at $2,500, is an example of a low-end PEV. Offering segmented
brands and prices of PEVs will cater to customers of all income levels and expand overall
demand.
150 Dreyer, R. (2009, July). Automotive History. Bentley Historical Library, University of Michigan. Retrieved from
http://bentley.umich.edu/research/guides/automotive/index.php
151 Ibid.

INTERNATIONAL ECONOMIC DEVELOPMENT COUNCIL 99
The “Big Three” Cluster
Around the turn of the 20th century, automakers were scattered across the Midwest and the
eastern seaboard. By 1919, the industry began to mature, and many firms failed due to the
shakeout. The remaining carmakers—including the “Big Three”—formed Detroit’s automobile
cluster. The location of the cluster was no accident; Detroit had a crucial combination of resources
that the auto industry needed. It had a strong industrial base including machine and stove
manufacturing, cigar making, pharmaceuticals, and food production. Furthermore, Detroit was
located near coal, iron, and copper mining and could be easily accessed by land or water. These
resources spawned the formation of over 200 auto companies in the early 20th century. The Big
Three–Ford, General Motors and Chrysler—rose to the top as the most technologically and
managerially innovative. The clustering of the auto industry contributed to unique economies of
scale, including:
1) The acceleration of research and development. Knowledge spillovers from existing firms can
accelerate R&D within an industry and can even cross over industries. Detroit’s shipbuilding
industry, which began in the 1820s, made crucial improvements upon the internal combustion
engines used to power boats. Since gasoline-powered engines eventually became the most
popular automobile technology, Detroit had an advantage over other regions through
decades of innovation. Detroit’s other existing industries—including steel and machine tools—
produced knowledge spillovers as well.
2) A concentration of skilled labor. By implementing the famous five-dollar day, Ford drew
workers domestically and internationally with its high wages. The company also worked to
recruit the most skilled workers from across the globe, including from Scotland, England,
Mexico, and Lebanon. By the mid-20th century, one in six working Americans were working
directly or indirectly for the auto industry, with the highest concentration of workers in Detroit.
3) Supply chains efficiencies. The Midwest already had a concentration of industries that supplied
to automakers, including bicycle, carriage, and foundries. This allowed automakers to produce
at larger scales without being concerned with the supply of components. Large production
volumes then generated economies of scale, created better opportunities for financing and
built worker experience for large scale production.
4) Attraction of government investment. Knowledge spillovers within clustered industries generate
more “bang for the buck” for each dollar of investment, whether its impact is on production,
technology, or employment. The economies of scale discussed above are crucial drivers of the
return on government investment.

INTERNATIONAL ECONOMIC DEVELOPMENT COUNCIL 100
Sources:
Sugrue, T. (n.d.) Motor City: The History of Detroit. The Gilder Lehrman Institute of American
History. Retrieved from http://www.gilderlehrman.org/history-by-era/politics-
reform/essays/motor-city-story-detroit
Tsai, L. (1999). The Spatial Aggregation of Automobile Manufacturing Activities in the American
Midwest. Berkeley, CA: University of California, Berkeley
Carlino, G. (2001). Knowledge Spillovers: Cities’ Role in the New Economy. Business Review. Federal Reserve
Bank of Philadelphia. Retrieved from http://www.philadelphiafed.org/research-and-
data/publications/business-review/2001/q4/brq401gc.pdf