analysis of processes and costs of alternative packaging
TRANSCRIPT

RESEARCH Open Access
Analysis of processes and costs ofalternative packaging options of sterilegoods in hospitals – a case study in twoGerman hospitalsMarkus Krohn* , Josefine Fengler, Thomas Mickley and Steffen Flessa
Abstract
Background: Hospitals should monitor the costs of all direct and indirect processes in order to achieve efficiencyand safeguard financial sustainability. One neglected process with significant costs is the processing of reusablemedical devices and their packaging performed in the central sterilisation supply department and the operatingroom. The objective of this research is to analyse and compare processes and costs of four different packingalternatives, i.e. non-woven sterilisation wrap with two sheets, one-step wrap, sterilisation container with inner wrapand sterilisation container without inner wrap.
Methods: We defined sub-processes that are directly related to the packaging options and measured themthrough a comprehensive time study. For all sub-processes and the total processes a distribution fitting and aMonte-Carlo-Simulation were performed. We calculated the costs for all sub-processes, i.e., costs for personnel,variable costs and the respective share of fixed and jump-fixed costs (e.g. depreciation of containers) associatedwith each packaging option. All results are discussed through various scenarios to evaluate the advantageousnessof all packaging options.
Results: The four packaging options are associated with different costs. “Sterile container without inner wrap” causes2.05€ per use. The options “sterile container with inner wrap” (3.24€), “one-step sterilisation wrap” (3.44€) and “two sheetssterilisation wrap” (3.87€) cause higher costs. With regard to personnel costs the option “sterile container without innerwrap” clearly causes the lowest costs. In addition, variable costs are lower in case of sterile container. Sterile containeronly cause higher costs in the aspect of fixed and jump-fixed costs per packaging.
Conclusions: The analysis shows that even under a broad set of scenarios the “sterile container without inner wrap” isthe most cost-effective alternative. The evaluation of the options “sterile container with inner wrap” and “one-stepsterilisation wrap” remains particularly interesting as they often yield comparable results. Both options causeapproximately the same personnel costs, so the decision appears to be more dependent on the materialprices for wrap or the frequency and duration of use for container. It turns out that the personnel time andconsequently the personnel costs significantly influence the rational choice of the packaging options.
Keywords: Non-woven sterilisation wrap, Sterilisation container, Process analysis, Cost analysis, Time study,CSSD, OR, Monte-Carlo-simulation
* Correspondence: [email protected] Assistant, Chair of General Business Administration and Health CareManagement, Faculty of Law and Economics, University of Greifswald,Friedrich-Loeffler-Straße 70, 17489 Greifswald, Germany
© The Author(s). 2019 Open Access This article is distributed under the terms of the Creative Commons Attribution 4.0International License (http://creativecommons.org/licenses/by/4.0/), which permits unrestricted use, distribution, andreproduction in any medium, provided you give appropriate credit to the original author(s) and the source, provide a link tothe Creative Commons license, and indicate if changes were made.
Krohn et al. Health Economics Review (2019) 9:1 https://doi.org/10.1186/s13561-018-0218-2

IntroductionSince diagnosis-related groups were introduced in Ger-man hospitals (G-DRG) as a compulsory financingscheme in 2003, the management of these institutionshas to assess the financial impact of all components ofin-patient care. Before, hospitals could claim a refundfrom the health insurance funds for their actual expend-iture with higher costs resulting in higher revenues. Atthat time, German hospitals could hardly generate a def-icit and cost containment was rather irrelevant [1]. Aftera period of adjustment from 2003 to 2009, German hos-pitals now receive a DRG-based revenue for treating apatient which is – within a DRG-specific range betweena lower and an upper time bound covering the vast ma-jority of patients – independent from the length of stayand the actual costs of treatment [1]. Consequently,higher costs lead to a deficit in a way that hospital man-agers are forced to monitor the costs that are associatedwith in-patient cases much more than before [2]. A cru-cial instrument of cost containment are clinicalpathways.A clinical pathway is a series of interdependent pro-
cesses and respective sub-processes which are requiredto treat a patient from admission to discharge. They aredeveloped primarily in order to increase the effectivenessand quality of medical treatment. In addition, clinicalpathways are proven instruments to reduce costs and in-crease cost-effectiveness of health care delivery. [3] Forthis purpose, all sub-processes which contribute to thetreatment process and the costs of service delivery mustbe included in the analysis. This regularly includes ser-vice processes beyond the line of visibility from the per-spective of the patient such as laboratory services orlogistics [4].One of these service processes which is not perceived by
the patient and usually outside the focus of hospital man-agers is the reprocessing of medical devices in the CentralSterilisation Supply Department (CSSD). It is obvious thatthe provision of sterile materials by the CSSD is of highrelevance for the quality of the entire treatment process[5]. At the same time, it significantly contributes to thetotal process costs [6–10]. According to the official hand-book of calculating the cost per DRG, the cost of supply-ing sterile goods is included in the cost category “medicalinfrastructure”. It can be stated that the CSSD is one ofthe main cost drivers in this cost category, and the re-spective costs vary widely between (surgical) DRGs. How-ever, our knowledge of the costs associated with theseservices is limited. In particular, there is hardly any litera-ture on the costs of different packaging and processingoptions within the CSSD, especially sterilisation containerwith inner wrap (SCW), sterilisation container withoutinner wrap (SC), two sheets non-woven sterilisation wrap(TSW) as well as one-step non-woven sterilisation wrap
(OSW). For a hospital manager it is crucial to know thecosts of each of these alternatives in order to support thestrategic decision on the packaging and processing optionto perform in the hospital. However, no detailed cost ana-lysis is known in the literature and no decision-supportfor best practice packaging options can be found so far.This paper intends to close this research gap by analys-
ing the processes and resource consumption of differentpackaging options of sterile goods in CSSD sub-processes.In the next section we present background information ondifferent packaging systems in CSSDs. Afterwards themethodology of this study is presented consisting of a de-tailed process analysis of the entire sterile supply cycle, acomprehensive time study and the financial assessment.As the supply cycle does not only comprise CSSD, theprocesses of the operating room (OR) are included in theanalysis. The fourth section will present the results. Theanalysis does not only present the processes and therespective resource consumption, but also comparessub-processes of the four main process options. The papercloses with a discussion of the results by presenting vari-ous scenarios and provides recommendations for hospitalmanagers which are relevant not only to German healthcare providers.
Packaging optionsThe supply and disposal of sterile goods is of high im-portance for maintaining functional services in hospitals,in particular for surgical units [11, 12]. Above all, it iscrucial that sterilised materials (e.g. surgical instruments)maintain sterility until they are used at a later time andanother place in the hospital. For this purpose, sterilisedmaterials are professionally packaged as described inDIN EN ISO 11607-1 [13]. Two principal systems existfor wrapping of standard surgical instrument sets:non-woven sterilisation wrap and sterilisation container.The non-woven sterilisation wrap is a one-way mater-
ial covering the sterilised set of instruments or otherproducts (e.g. implants, screws etc.). After the set isused, the wrap is disposed. Different types and qualitiesof non-woven sterilisation wrap are available on themarket and have to be chosen based on the size andweight of the set. Typical wrap qualities range fromabout 70 g to 140 g per m2 for two layers of wrap. Fur-ther distinction can be made between a sequential wrap(two sheets of wrap per set) or a one-step wrap made oftwo sheets [10]. Sterilisation containers are made for fre-quent re-use and can be used over a wide range of setweights. The total container weight is limited by thesterilisation method used and the respective country’sworking conditions act [14].Wrapping and container packaging can be combined
resulting in the before mentioned packing alternativesused in Europe and Northern America:
Krohn et al. Health Economics Review (2019) 9:1 Page 2 of 17
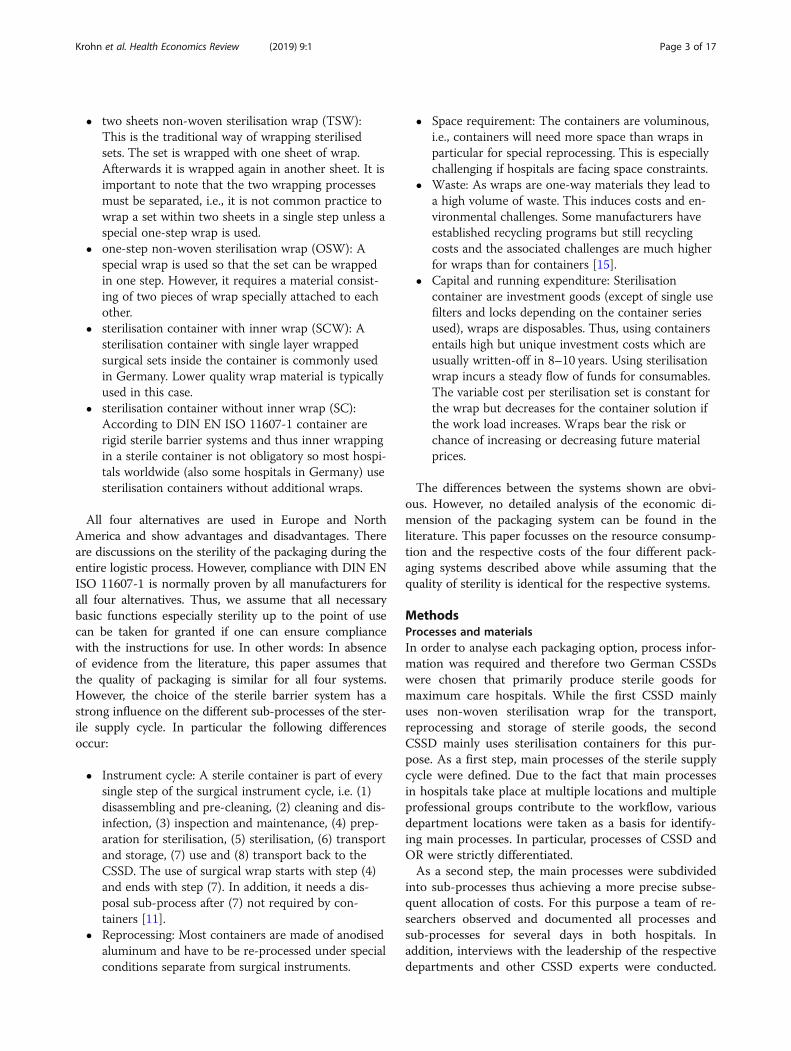
� two sheets non-woven sterilisation wrap (TSW):This is the traditional way of wrapping sterilisedsets. The set is wrapped with one sheet of wrap.Afterwards it is wrapped again in another sheet. It isimportant to note that the two wrapping processesmust be separated, i.e., it is not common practice towrap a set within two sheets in a single step unless aspecial one-step wrap is used.
� one-step non-woven sterilisation wrap (OSW): Aspecial wrap is used so that the set can be wrappedin one step. However, it requires a material consist-ing of two pieces of wrap specially attached to eachother.
� sterilisation container with inner wrap (SCW): Asterilisation container with single layer wrappedsurgical sets inside the container is commonly usedin Germany. Lower quality wrap material is typicallyused in this case.
� sterilisation container without inner wrap (SC):According to DIN EN ISO 11607-1 container arerigid sterile barrier systems and thus inner wrappingin a sterile container is not obligatory so most hospi-tals worldwide (also some hospitals in Germany) usesterilisation containers without additional wraps.
All four alternatives are used in Europe and NorthAmerica and show advantages and disadvantages. Thereare discussions on the sterility of the packaging during theentire logistic process. However, compliance with DIN ENISO 11607-1 is normally proven by all manufacturers forall four alternatives. Thus, we assume that all necessarybasic functions especially sterility up to the point of usecan be taken for granted if one can ensure compliancewith the instructions for use. In other words: In absenceof evidence from the literature, this paper assumes thatthe quality of packaging is similar for all four systems.However, the choice of the sterile barrier system has astrong influence on the different sub-processes of the ster-ile supply cycle. In particular the following differencesoccur:
� Instrument cycle: A sterile container is part of everysingle step of the surgical instrument cycle, i.e. (1)disassembling and pre-cleaning, (2) cleaning and dis-infection, (3) inspection and maintenance, (4) prep-aration for sterilisation, (5) sterilisation, (6) transportand storage, (7) use and (8) transport back to theCSSD. The use of surgical wrap starts with step (4)and ends with step (7). In addition, it needs a dis-posal sub-process after (7) not required by con-tainers [11].
� Reprocessing: Most containers are made of anodisedaluminum and have to be re-processed under specialconditions separate from surgical instruments.
� Space requirement: The containers are voluminous,i.e., containers will need more space than wraps inparticular for special reprocessing. This is especiallychallenging if hospitals are facing space constraints.
� Waste: As wraps are one-way materials they lead toa high volume of waste. This induces costs and en-vironmental challenges. Some manufacturers haveestablished recycling programs but still recyclingcosts and the associated challenges are much higherfor wraps than for containers [15].
� Capital and running expenditure: Sterilisationcontainer are investment goods (except of single usefilters and locks depending on the container seriesused), wraps are disposables. Thus, using containersentails high but unique investment costs which areusually written-off in 8–10 years. Using sterilisationwrap incurs a steady flow of funds for consumables.The variable cost per sterilisation set is constant forthe wrap but decreases for the container solution ifthe work load increases. Wraps bear the risk orchance of increasing or decreasing future materialprices.
The differences between the systems shown are obvi-ous. However, no detailed analysis of the economic di-mension of the packaging system can be found in theliterature. This paper focusses on the resource consump-tion and the respective costs of the four different pack-aging systems described above while assuming that thequality of sterility is identical for the respective systems.
MethodsProcesses and materialsIn order to analyse each packaging option, process infor-mation was required and therefore two German CSSDswere chosen that primarily produce sterile goods formaximum care hospitals. While the first CSSD mainlyuses non-woven sterilisation wrap for the transport,reprocessing and storage of sterile goods, the secondCSSD mainly uses sterilisation containers for this pur-pose. As a first step, main processes of the sterile supplycycle were defined. Due to the fact that main processesin hospitals take place at multiple locations and multipleprofessional groups contribute to the workflow, variousdepartment locations were taken as a basis for identify-ing main processes. In particular, processes of CSSD andOR were strictly differentiated.As a second step, the main processes were subdivided
into sub-processes thus achieving a more precise subse-quent allocation of costs. For this purpose a team of re-searchers observed and documented all processes andsub-processes for several days in both hospitals. Inaddition, interviews with the leadership of the respectivedepartments and other CSSD experts were conducted.
Krohn et al. Health Economics Review (2019) 9:1 Page 3 of 17

Furthermore, the results of a literature analysis were in-cluded in the process analysis of the CSSDs and ORs.This analysis included the review of standard operatingprocedures of those particular institutions as well asDIN EN ISO standards and German laws related to thereprocessing of medical devices. The decisive factor fordetermining sub-processes were those procedure stepsthat required personnel and time for producing sterileinstrument trays while peel packed instruments werenot part of the analysis. Interim results of defining pro-cesses were discussed in several workshops withkey-informants in terms of sterilisation and supply ofmedical devices.As a third step, we determined the time consumption
per service unit for each sub-process by measuring thetime based on a so-called “elapsed time measurement”.[16] Consequently, the observers were present through-out the entire survey period and noted their observa-tions continuously in the data entry form. Stopwatcheswere used, which means that timestamps were appliedto calculate sub-process times retrospectively [17]. Theoverall time measurement included four observers whoascertained sub-process times parallel for a total ofabout 320 working hours per hospital. The main pack-aging options in the CSSDs were observed in equalshares. The results of the process analyses and the timemeasurement with in total 19,661 measured times aredescribed in detail in the results section. An overview ofthe measured times per sub-process can be found inTable 4.
Infrastructure adjustmentThe total process times of all sub-processes of the entiresterile supply cycle is equal to the minimum overall timewhich one single instrument tray needs to pass throughthe CSSD and OR. This alone is an important informa-tion, but it does not allow to compare the different pack-aging alternatives. This is due to the fact that theinfrastructure of both hospitals is slightly different whichmight bias the results. For this reason, only selectedsub-processes were considered for further analysis. Wefocus only on those sub-processes that differ stronglybetween packaging options. Furthermore, we neglectsub-processes that are associated with transporting ster-ile goods. Consequently, the relevant sub-processes for acontainer comprise the packaging activities, the prepar-ation of containers at the CSSD as well as the openingand closing activities in the OR. The respectivesub-processes of non-woven sterilisation wrap consist ofpackaging activities, the additional process for wrap dis-posal at the CSSD and OR sub-processes. With regardto the chosen focus of one single reprocessed unit, weadjusted collected sub-process times belonging to mul-tiple units. This was necessary to ensure that personnel
times and costs would not be overestimated when mul-tiple objects were processed at a time. For those casessub-process times were divided through the amount ofobjects, e.g. multiple containers at one loading trolley.
Further analysisIn order to determine a distribution of time consump-tion and costs of the alternatives it was necessary to per-form a distribution fitting and a simulation. In a firststep, outliers were identified by elimination of all processtimes outside the range of the fourfold standard devi-ation under and above the average. The methodology ofelimination of outliers is based on the Chebyshev’s the-orem which states that for unknown distributions atleast 93.75% of all data is situated between the twobounds of four standard deviations in both directionsfrom the mean value [18]. In sum 74 process times(0.38%) had to be eliminated. Furthermore, afour-character-acronym is defined for each process. Thefirst character defines the process option (“W” = sterilisa-tion wrap; “C” = sterilisation container), the second andthird character is defined as a consecutive number (“01”up to “17”) and the fourth character defines the processlocation (“S” = CSSD; “O” = operation theatre).To calculate the theoretical distribution behind the
gained data the software tool EasyFit Professional Ver-sion 5.6 by MathWave Technologies was used. A lowerbound of zero and an unknown upper bound were as-sumed in order to test all input samples to fit on the fol-lowing distributions: Beta, Johnson SB, Kumaraswamy,Pert, Power Function, Reciprocal, Triangular, Uniform,Burr, Chi-Quadrat, Dagum, Erlang, Exponential, FatigueLife, Frechet, Gamma, Generalized Gamma, InverseGaussian, Levy, Log-Gamma, Log-Logistic, Lognormal,Nakagami, Pareto, Pareto 2, Pearson 5, Pearson 6, Ray-leigh, Rice, Weibull, Generalized Extreme Value, Gener-alized Logistic, Generalized Pareto, Log-Pearson 3,Phased Bi-Exponential, Phased Bi-Weibull and Wakeby.To decide which distribution fits best the
Anderson-Darling (AD) test was used as defined inEasyFit Professional 5.6. Subsequently, the best-rankeddistribution based on the AD-test was chosen for fur-ther analysis. Significant results at a = 0.01 based onAD-testing are marked with “*”. Furthermore, “°” showssignificant distributions based on the Kolmogorov-Smirnov(KS) test. Due to the circumstances of some sub-processesbeing quite short (range of a few seconds) and the timestudy only measuring integer second-values, some distri-butions do not generate significant results. Consequently,the P-P-plot was also checked in order to decide if thehighest ranked distribution could be used for simulation.As an example Fig. 1 shows the probability density func-tion of process “bring, check und prepare the wrap(W04S)” by displaying the highest ranked distribution
Krohn et al. Health Economics Review (2019) 9:1 Page 4 of 17

(Generalized Extreme Value) and the density function ofthe sample.Based on the fitted distributions a Monte Carlo simu-
lation was performed. In this case, 1000 random num-bers were taken from the distribution of eachsub-process. The results of individual simulation runswere combined in an additive manner, so as a result adetermination of the overall distribution for the CSSD,the OR and the entire process was possible. The follow-ing assumptions had to be made in the context of thefour defined procedural options. All assumptions can beregarded to as a correction factor of the process time, as
some collected sub-processes are only partially allocableto the overall process. Table 1 shows the weighting ofthe individual sub-processes in case this value is lessthan one. A value below one means that the sub-processis not completely integrated into the overall process. Bytaking these correction factors into account, a total dis-tribution of the CSSD, the OR and both areas wasdetermined.An example of a process with a weight of less than
one is “dispose of all collected wrap” (W02S) for OSWand TSW. The correction factor results from the ratio ofthe process “remove and dispose wrap” (W01S) and the
Fig. 1 Probability Density function of process “bring, check und prepare the wrap (W04S)”
Table 1 Correction factors for sub-processes
Correctionfactor
For sub-process Reason
0 bring, check and prepare the Containers with inner wrap (C07S) for SC not part of total process in case of SC
0 cover tray with inner wrap, add label (C09S) for SC not part of total process in case of SC
0 check and open Containers inner wrap (C13O) for SC not part of total process in case of SC
0 dispose of inner wrap (C15O) for SC not part of total process in case of SC
0 cover tray with first wrap layer, add label (W05S) for OSW not part of total process in case of OSW
0.05840708 dispose of all collected wrap (W02S) for OSW and TSW process has to be performed once per 17.12 produced units
0.05840708 provide new garbage bag (W03S) for OSW and TSW process has to be performed once per 17.12 produced units
0.5 remove and dispose of wrap (W01S) for OSW Assumption: half process time while using OSW
0.5 check and open wrapped tray (W08O) for OSW Assumption: half process time while using OSW
Krohn et al. Health Economics Review (2019) 9:1 Page 5 of 17

process “dispose of all collected wrap” (W02S). Whileprocess W01S was measured 1360 times, process W02Scould be measured 66 times. That results that processW02S has to be performed once per 17.12 units and thecorrection factor is 0.05840708.
Costs and pricesIn addition, staff costs per minute as well as costs for con-sumables and allocated costs were calculated. Table 2shows the basic parameters of the respective calculations.According to these assumptions, the respective minute
rate are 0.45 € (CSSD) and 0.60 € (OR).The variable costs include wrap, trayliner, labels, con-
tainer filter, container seal and indicator tape. The priceinformation is based on the considered units. Sinceprices are also subject to strong fluctuations, scenariosare formed in the discussion section of this article. Table2 shows the basic assumptions based on hospital priceinformation. All values include value added tax as hospi-tals in Germany are not given a tax-credit for VAT paid.The acquisition costs of containers and transport bas-
kets were attributed to the process by defining a lifetimeand the annual turnover. Assuming a lifetime of tenyears and a turnover rate of 120 per year, the total usagefrequency is 1200. It should be noted that the life timeand frequency of circulation are variable. As part of thesensitivity analysis in the discussion, alternative scenariosare formed.Annual total maintenance costs for the containers
were allocated according to the number of containersand the annual turnover. It should be noted that theresulting repair costs of 0.80 € per container per yearare not attributable exclusively to wear and tear. Thecosts also include the repair of damages due to hand-ling errors and can therefore be considered as conser-vative. For the waste disposal, the costs per litre are0.04 €. The survey found that the volume of wasteper one layer wrap is around 3.504 l. Consequently, avolume of 7.009 l is assumed for the disposal of twosheets (TSW). Since OSW also exists on two firmlyconnected layers, we also assume 7.009 l. As part ofSCW, only one sheet of trash is produced. Disposalcosts for container filters and container seals are in-cluded in the area of variable costs.Finally, the additional costs per unit produced were
determined for the large-scale washing facility. The costsof the large-scale washing system result from the costsof a cleaning process divided by the load. Since, inaddition to the containers, other materials are beingcleaned in the large-capacity washing system, it is as-sumed that containers will take up 70% of the load perrun. Thus, for the cleaning of containers, each run costs5.19 €. Within the study, an average load of 22.45 con-tainers per cycle was recorded. Due to the fact that the
mean of loading was at 22.45 containers and the max-imum loading was 33, the assumption that 70% of thecosts are allocated to container cleaning can be consid-ered as conservative.Furthermore, it has to be taken into account that the
options SCW and SC in certain circumstances require ahigher capacity for container cleaning. In the base sce-nario, it is assumed that the use of containers does notresult in full utilization of the large-capacity washingsystem. Acquisition, maintenance and repair costs aretherefore not relevant to the decision. Two further sce-narios are considered in the discussion. The first as-sumes that a larger large-capacity washing system willbe needed to clean containers with additional acquisition
Table 2 Input parameters
Category Parameter Dimension Value
Personnel Working days per year (assuming52 weekends, 30 days of vacationdays, 10 holidays, 17 days ofsickness, 5 days of further educationand training)
days 199
Maximum utilisation of staff % 85
Working time per day hours 7.8
Gross employer’s salary CSSD peryear
€ 36,000
Gross employer’s salary OR per year € 47,500
Variable cost Wrap (one layer) for TSW € 0.61
One-Step-Wrap for OSW € 1.27
Inner Wrap for SCW € 0.55
Trayliner € 0.11
Labels € 0.05
Container Filters (2x) € 0.11
Container Seals (2x) € 0.17
Tape with Indicator € 0.04
Fixed andjump-fixedCosts
Container € 476.00
Transport basket € 154.70
Life time container and transportbasket
years 10
Turnover rate of container andtransport basket p.a.
120
Waste disposal per 120 l € 4.54
Water consumption per cycle forlarge-scale washing system
litre 380
Water (per 1000 l) € 8.38
Power consumption per cycle forlarge-scale washing system
kWh 6
Electricity (per kWh) € 0.20
Chemicals per cycle for large-scalewashing system
litre 0.6
Chemicals (per litre) € 5.06
Percentage container of total load % 70
Krohn et al. Health Economics Review (2019) 9:1 Page 6 of 17

costs of 17,500 €. Maintenance and repair costs are notrelevant to the decision in this scenario, since it is assumedthat the size of the machine has no influence on the abso-lute maintenance and repair costs. In the second scenario itis assumed that the CSSD requires an additionallarge-capacity washing system, which causes 167,500 € ac-quisition costs. Furthermore, 9500 € per year are taken intoaccount for maintenance and repair. For the large-scalewashing system a lifetime of 13.5 years and an annual pro-duction volume of 82.500 container is assumed. It shouldbe noted that large-capacity washing systems are not usedexclusively for cleaning containers. As previously stated, avalue of 70% is assumed for the cleaning of containers and30% for the cleaning of other products (for example, trol-leys and large volume medical products).
ResultsProcess analysisAs a result of observation, expert interviews, literatureanalysis and key-informant interviews we determined
the processes as described in Figs. 2 and 3. In total 36sub-processes for using non-woven sterilisation wrap(Fig. 2) and 48 sub-processes for using sterilisation con-tainer (Fig. 3) were identified (Table 3). With regard tothe infrastructure adjustment, all sub-processes onwhich the analysis is based on, are noted in red in theprocess diagrams.Table 4 shows those processes which were included
into the comparison of the alternatives. In total, the timeof 19,661 sub-processes was measured by usingstop-watches. Furthermore, the table shows the respect-ive acronyms as well as the sample size from the timerecording.
Distribution fitting and Monte-Carlo-simulationTable 5 shows the results of the distribution fitting. Thecorresponding parameters have been rounded off to fourdecimal places for reasons of better presentation. Thedistributions in combination with the correction factorsform the basis for the Monte-Carlo-Simulation. It
Receiving (CSSD)
unload thetransport trolley
Washing & Disinfection
remove and disposeof wrapW01S
sort, dismount,pretreat (if required)surgical instruments
bring the emptyWD loading cart to
the work area
load WD loading cart
bring loading cartto the WD, load into and
start program
bring empty transporttrolley to large-capacityWD and start program
Maintenance & Inspection
WD: Release?
put instrument traysin shelves
no
yes
get transport trolleyout of large-capacityWD, park (cool off)
bring instrument trayto the packaging area
inspect, scan,fill up, maintain,mount surgicalinstruments,print label
load sterile good trolley
bring, check andprepare the wrap
W04S
cover tray with firstwrap layer, add label
W05S
bring and providebasket and trayliner,
place tray into itW07S
cover tray with secondwrap layer, place label
W06S
scan sterile goods,load into sterilizerand start program
unload sterilizer
Release?
bring sterile good trolleyto scan work place;
check, scan,print and archive record
Commissioning:order picking of
sterile goods to trolleys
distribute sterile goodsin OR area (store)
take sterile goodsout of store,
transport to OR
scan sterile goodscheck and open
wrapped trayW08O
take out andprovide instrument tray
W09O
usage ofsterile goods
pre-cleaning of surgicalinstruments if required
(distance to OR area(transport sterile goods))
distance from OR area(to Receiving at CSSD)
Disposal
Usage
Storage & Preparation
Sterilization
Packaging
yes
no
dispose of allcollected wrap
W02S
provide newgarbage bag
W03S
put wrap (withouttray) aside
W10O
bring fully loadedtransport trolley to
Automatic-Transport
transport instrumenttrays from OR to store
put instrumentsand tray back intowrap and cover it
W11O
Fig. 2 Sterile supply cycle of non-woven sterilisation wrap
Krohn et al. Health Economics Review (2019) 9:1 Page 7 of 17

becomes clear that the theoretical distributions behindthe sub-processes are manifold.In order to answer the question of which distribution
can be assumed for the CSSD, the OR and the overallprocess, the theoretical distribution behind the simula-tion data was determined. Table 6 shows that in theCSSD the processes for the options TSW, OSW andSCW follow a Generalized Extreme Value distribution.Option SC is subjected to a Johnson SB distribution. Inthe OR, the theoretic distributions are more diverse.These can be seen in Table 6 as well as the distributionsof the total process (rounded at four decimal places).Based on the distributions from Table 6, the personnel
time consumption for all process options were again de-termined through 1000 simulation runs. In case of theCSSD these ranged between approximately 105 s and202 s. It turns out that the option SC causes the lowestprocess times in the CSSD. TSW generates the highestexpenditure with a process time that is around 92%higher. The remaining options OSW and SCW are
Receiving (CSSD)
unload thetransport trolley
Washing & Disinfection
open the Containerand take tray from it
C01S
remove and dispose ofgarbage/ single use
goods if required
sort, dismount,pretreat (if required)surgical instruments
load Container onlarge-capacity WD
loading trolleyC02S
bring the emptyWD loading cart to
the work area
load WD loading cart
bring loading cartto the WD, load into and
start program
bring Containerloading trolley to
large-capacityWD and start program
C03S
bring empty transporttrolley to large-capacityWD and start program
WD: Release?
put instrument traysin shelves
no
yes get Container loadingcart out of large-
capacity WD,park (cool off)
C04S
get transport trolleyout of large-capacityWD, park (cool off)
reload Containers fromloading cart onto little
transport trolleysC05S
bring instrument trayand container
to the packaging area
put Containersin shelves
C06S
inspect, scan,fill up, maintain,mount surgicalinstruments,print label
put Containeronto work place
load sterile good trolley
bring, check andprepare the Containers
with inner wrapC07S
close Container, sealwith lock, place label
C11S
place trayinto Container
C08S
insert filter, checkContainers filter holder
C10S
cover tray withinner wrap, add label
C09S
scan sterile goods,load into sterilizerand start program
unload sterilizerbring sterile good trolley
to scan work place
Release?check, scan;
print and archive record
push little transporttrolleys to (tray) shelves
Commissioning:order picking of
sterile goods to trolleys
distribute sterile goodsin OR area (store)
take sterile goodsout of store,
transport to OR
open ContainerC12O
scan sterile goods
check and openContainers inner wrap
C13O
dispose of inner wrapC15O
take out and provideinstrument tray
C14O
put Container asideC16O
collect Containers ofall stores (OR area)
transport Containerfrom OR to store
put instruments andtray back in Containeror disposal Container
C17O
distance to OR area(transport sterile goods)
distance fromOR area (back to
order picking area)
usage ofsterile goods
pre-cleaning of surgicalinstruments if required
distance to OR area(bring the emptytransport trolley)
distance from OR area(to Receiving at CSSD)
Disposal
Usage
Storage & Preparation
Sterilization
Packaging
yes
no
Maintenance & Inspection
Fig. 3 Sterile supply cycle of sterilisation container
Table 3 Main processes and amount of sub-processes thatwere identified
Main process Non-wovensterilisation wrap
Sterilisationcontainer
CSSD Washing anddisinfection
10 11
Maintenance andinspection
4 9
Packaging 5 6
Sterilisation 3 4
Storage andpreparation
9 11
OR Usage 2 2
Disposal 3 5
Total 36 48
Krohn et al. Health Economics Review (2019) 9:1 Page 8 of 17

nearly identical at 153 to 156 s, but the standard devi-ation of SCW is 20% lower. The OR results in thesame ranking. While SC causes the least effort withabout 30 s, the process with TSW takes about 52 s.Both OSW and SCW cause about 42 s, with almostidentical standard deviations. The detailed results areshown in Table 7.Figure 4 shows the aggregated density function of the
process times of the CSSD personnel. It is clear that the
SC option causes the lowest personnel costs and can beconsidered dominant in over 99.9% of cases. The TSWoption is always dominated by all other options. Com-paring the options OSW and SCW shows that OSWdominates the option SCW in about 61.99% of cases.However, the differences between the two options areconsidered very low. This can be exemplified by Q1 andQ3, where the difference is only about 4.2% or 1.1%.A similar picture can be observed in case of the pro-
cessing times in the OR. According to the determineddistribution, the option SC is dominant in about 97.7%.However, the OSW option dominates the SCW optionin only about 37.33% of cases. At Q1, SCW causes about7.1% higher process times than OSW, while OSW causes4.6% higher times at Q3. The distribution function isshown in Fig. 5.
Cost-analysisThe determination of the personnel costs per packagingoption was carried out by formation of a minute set. Asa result, average personnel costs amount to 2.05 € forTSW, 1.58 € for OSW, 1.60 € for SCW and 1.09 € forSC based on the times shown. The variable costs show avalue of 1.42 € for TSW and a value of 1.46 € for theOSW option. The SCW option costs 0.87 € and the SCoption 0.32 €.In terms of additional costs, it becomes clear that the
acquisition costs of a container cause a total of 0.40 €per use (Option SCW and SC). There is also a value of0.01 € for repairs. The costs for the transport baskets are0.13 € per use (Option TSW and OSW). Disposal costsin the context of TSW and OSW result at around 0.27€. The disposal costs for SCW are around 0.13 €. Thecosts of the large-capacity washing maschine are 5.19 €per run. Within the study, an average load of 22.45 con-tainers per cycle was recorded. Consequently, per con-tainer about 0.23 € are attributable (SCW and SC).For the material costs as well as the allocated costs re-
sults show 1.81 € for TSW, 1.86 € for OSW, 1.64 € forSCW and 0.96 € for SC. In comparison to the personnelcosts, a partially changed ranking shows up. The previ-ously dominant option SC remains dominant. The op-tion OSW (previously approximately equal to SCW) isnow dominated by all other options.Table 8 shows the total result of personnel and ma-
terial costs. It turns out that SC shows the least costsat 2.05 €. Rank two takes the SCW option, which at3.24 € causes approx. 58.0% higher costs inpackaging-related processes. The costs of TSW areranked third with 3.44 € (+ 67.5% compared to SC).OSW occupies fourth place, with costs of 3.87 €,which is about 88.5% higher than SC.Figure 6 combines the personnel costs of CSSD and OR
based on the distributions. Furthermore, the figure
Table 4 Process definition and sample size
Process name acronym samplesize
Open the Container and take tray from it C01S 824
Load Container on large-capacity WD loadingtrolley
C02S 1101
Bring Container loading trolley to large-capacityWD and start program
C03S 2155
Remove and dispose of wrap W01S 1124
Dispose of all collected wrap W02S 65
Provide new garbage bag W03S 66
Get Container loading cart out of large-capacityWD, park (cool off)
C04S 1998
Reload Containers from loading cart onto littletransport trolleys
C05S 1139
Put Containers in shelves C06S 1854
Bring, check and prepare the Containers with innerwrap
C07S 759
Bring, check und prepare the wrap W04S 732
Place tray into Container C08S 836
Cover tray with inner wrap, add label C09S 810
Cover tray with first wrap layer, add label W05S 1051
Insert filter, check Containers filter holder C10S 661
Close Container, seal with lock, place label C11S 812
Cover tray with second wrap layer, place label W06S 1059
Bring and provide basket and trayliner, place trayinto it
W07S 423
Open Container C12O 253
Check and open Containers inner wrap C13O 248
Check and open wrapped tray W08O 262
Take out and provide instrument tray C14O 285
Take out and provide instrument tray W09O 239
Dispose of inner wrap C15O 212
Put Container aside C16O 211
Put instruments and tray back in Container ordisposal Container
C17O 243
Put wrap (without tray) aside W10O 104
Put instruments and tray back into wrapand cover it
W11O 135
Total 19,661
Krohn et al. Health Economics Review (2019) 9:1 Page 9 of 17

Table 5 Results of the distribution fitting of sub-processes
Process Distribution Parameters
C01S Wakeby α = 10.1959 β = 0.0440 γ = 0 δ = 0 ξ = 0.8446
C02S Johnson SB* γ = 4.6286 δ = 2.4426 λ = 114.0524 ξ = −4.4557
C03S Log-Pearson 3 α = 13.6700 β = − 0.1317 γ = 3.2264
W01S Johnson SB*° γ = 2.7028 δ = 1.4808 λ = 107.0346 ξ = −1.0275
W02S Beta*° α1 = 0.7476 α2 = 1.1590 a = 0 (Fixed) b = 173.0000
W03S Gen. Logistic*° k = − 0.0314 σ = 5.0845 μ = 31.9906
C04S Pareto 2* α = 0.5536 β = 0.0000
C05S Beta α1 = 2.4664 α2 = 4.774 a = 0 (Fixed) b = 35.3533
C06S Wakeby α = 820.7058 β = 70.7089 γ = 11.5924 δ = −0.3908 ξ = −5.0945
C07S Burr* k = 0.6447 α = 4.0719 β = 9.2797
W04S Gen. Extreme Value*° k = − 0.0385 σ = 10.6179 μ = 22.5843
C08S Pearson 6 α1 = 41.7009 α2 = 4.2773 β = 0.3206
C09S Log-Pearson 3*° α = 63.1624 β = − 0.0679 γ = 7.7562
W05S Dagum*° k = 1.1123 α = 3.8903 β = 35.8406
C10S Gen. Extreme Value* k = 0.1449 σ = 3.8764 μ = 9.3659
C11S Inv. Gaussian*° λ = 110.0178 μ = 34.5505
W06S Gen. Extreme Value*° k = − 0.0255 σ = 28.8306 μ = 78.5859
W07S Dagum*° k = 0.6310 α = 3.4634 β = 17.3266
C12O Log-Logistic* α = 3.0702 β = 4.1318
C13O Log-Logistic* α = 4.2215 β = 5.9365
W08O Burr*° k = 0.6565 α = 4.4354 β = 14.3868
C14O Gen. Extreme Value k = 0.3659 σ = 1.6206 μ = 3.6036
W09O Pearson 6* α1 = 11.9523 α2 = 3.4768 β = 0.9310
C15O Burr* k = 0.5800 α = 4.2272 β = 3.4437
C16O Log-Logistic* α = 3.3153 β = 4.01482
C17O Johnson SB*° γ = 1.5759 δ = 0.7162 λ = 81.6481 ξ = 1.4134
W10O Wakeby*° α = 20.6865 β = 7.7626 γ = 4.8861 δ = −0.2130 ξ = 1.6206
W11O Wakeby*° α = 23.2417 β = 0.1569 γ = 0 δ = 0 ξ = 0.0504
*significant at a = 0,01 (AD-test)° significant at a = 0,01 (KS-test)
Table 6 Results of the distribution fitting for the CSSD, the OR as well as the overall process based on the Monte-Carlo-Simulationof sub-processes
location distribution parameters
TSW CSSD Gen. Extreme Value*° k = −0,0873 σ = 40,9700 μ = 182,1558
OR Fatigue Life*° α = 0,4057 β = 47,9642
Total Gen. Extreme Value*° k = −0,0659 σ = 44,4708 μ = 231,4989
OSW CSSD Gen. Extreme Value*° k = −0,0809 σ = 34,6168 μ = 135,9204
OR Johnson SB*° γ = 27,767 δ = 15,727 λ = 221,3539 ξ = 59,964
Total Gen. Extreme Value*° k = −0,0804 σ = 38,4413 μ = 176,0546
SCW CSSD Gen. Extreme Value*° k = −0,1065 σ = 29,1803 μ = 140,0069
OR Wakeby*° α = 424,5955 β = 42,8428 γ = 19,3004 δ = −0,06700 ξ = 14,2733
Total Lognormal*° σ = 0,1869 μ = 52,610
SC CSSD Johnson SB*° γ = 26,335 δ = 20,008 λ = 294,7783 ξ = 39,1941
OR Dagum*° k = 62,639 α = 27,462 β = 11,5481
Total Fatigue Life*° α = 0,2133 β = 131,9283
Krohn et al. Health Economics Review (2019) 9:1 Page 10 of 17

Table 7 Results of the Monte-Carlo-Simulation for the CSSD, the OR and the overall process – personnel time consumptions inseconds
In seconds CSSD OR Total (by distribution) Total as sum of CSSD and OR
TSW Mean 202.09 52.11 255.10 254.20
Median 195.87 48.83 247.65 246.59
Standard deviation 47.96 20.34 53.38 51.85
Q1 (25%) 166.54 37.50 215.48 214.96
Q3 (75%) 230.29 63.80 284.99 287.24
OSW Mean 153.16 41.96 195.10 195.12
Median 150.18 37.92 188.53 191.27
Standard deviation 39.93 18.72 43.18 43.55
Q1 (25%) 123.75 28.16 163.54 164.12
Q3 (75%) 175.99 51.65 221.93 220.90
SCW Mean 156.04 42.00 196.39 198.04
Median 153.29 37.11 194.02 193.43
Standard deviation 32.14 17.34 39.90 37.22
Q1 (25%) 132.42 29.55 169.54 170.77
Q3 (75%) 176.84 49.73 217.25 222.99
SC Mean 104.50 30.23 135.23 134.73
Median 101.22 25.17 131.58 129.82
Standard deviation 24.96 18.25 29.34 30.85
Q1 (25%) 86.08 19.22 113.58 111.76
Q3 (75%) 120.16 34.60 153.85 153.72
Fig. 4 Cumulative Distribution Function of personnel time consumption in CSSD separated by packaging options
Krohn et al. Health Economics Review (2019) 9:1 Page 11 of 17
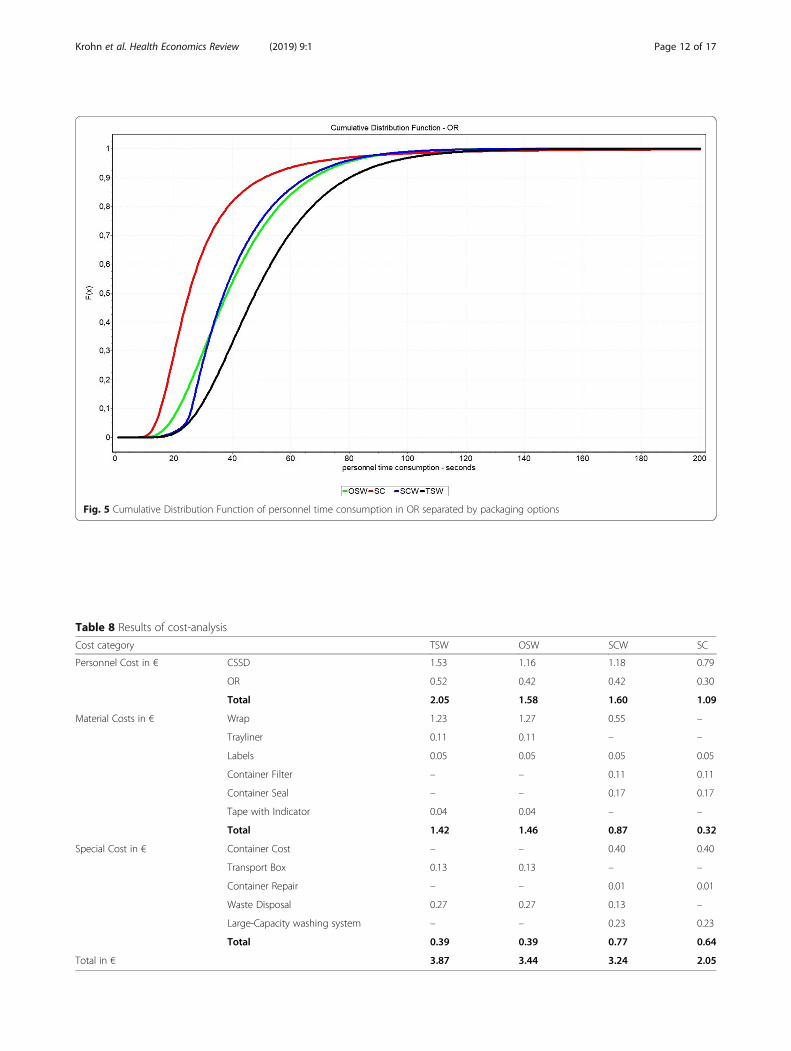
Fig. 5 Cumulative Distribution Function of personnel time consumption in OR separated by packaging options
Table 8 Results of cost-analysis
Cost category TSW OSW SCW SC
Personnel Cost in € CSSD 1.53 1.16 1.18 0.79
OR 0.52 0.42 0.42 0.30
Total 2.05 1.58 1.60 1.09
Material Costs in € Wrap 1.23 1.27 0.55 –
Trayliner 0.11 0.11 – –
Labels 0.05 0.05 0.05 0.05
Container Filter – – 0.11 0.11
Container Seal – – 0.17 0.17
Tape with Indicator 0.04 0.04 – –
Total 1.42 1.46 0.87 0.32
Special Cost in € Container Cost – – 0.40 0.40
Transport Box 0.13 0.13 – –
Container Repair – – 0.01 0.01
Waste Disposal 0.27 0.27 0.13 –
Large-Capacity washing system – – 0.23 0.23
Total 0.39 0.39 0.77 0.64
Total in € 3.87 3.44 3.24 2.05
Krohn et al. Health Economics Review (2019) 9:1 Page 12 of 17

includes the material costs and the transferred costs ac-cording to Table 8. This results in aMonte-Carlo-Simulation of the costs.In the overall result we clearly see that the option SC
dominates all other options. Rank two is now takensolely by SCW. The OSW option dominates the TSWoption by approximately 100%. The significant right shiftof the OSW option is caused by the material costs ofthis option. Based on the presented input values, the fol-lowing sequence of options can be displayed.
– Rank 1 - SC (Sterile Container without inner wrap) -mean: 2.05 €
– Rank 2 - SCW (Sterile Container with inner wrap) -mean: 3.24 €
– Rank 3 - OSW (one-step non-woven sterile wrap) -mean: 3.44 €
– Rank 4 - TSW (two sheets non-woven sterile wrap)- mean: 3.87 €
DiscussionThe results of this analysis show that the SC optioncauses the least costs. For the decision maker how-ever, the question arises how stable this result is ifmajor assumptions are subject to change. Conse-quently, we have to assess the sensitivity of these re-sults if major parameters change. The following 33scenarios analyse the consequences of the followingchanges of parameters:
– Part A (personnel costs)○ staff costs increase by 10%○ staff costs increase by 20%○ personnel costs are not relevant to
the decision– Part B (material and special costs):
○ material and special costs increase by 10%○ material and special costs increase by 20%○ material costs decrease by 10%
Fig. 6 Cumulative Distribution Function of total cost separated by packaging options
Table 9 Scenario analysis – Part A
Packaging Option TSW OSW SCW SC
Scenario Cost Rank Cost Rank Cost Rank Cost Rank
Personnel costs + 10% 4.07 € 4 3.59 € 3 3.40 € 2 2.16 € 1
Personnel costs + 20% 4.28 € 4 3.75 € 3 3.56 € 2 2.27 € 1
Personnel costs not relevant 1.81 € 3 1.86 € 4 1.64 € 2 0.96 € 1
Krohn et al. Health Economics Review (2019) 9:1 Page 13 of 17

○ material costs decrease by 20%○ acquisition costs for containers increase by 10%○ acquisition costs for containers increase by 20%○ acquisition costs for containers increase by 50%○ material cost for wrap decrease by 10%○ material cost for wrap decrease by 20%○ material cost for wrap decrease by 50%○ material cost for wrap (TSW and OSW)
increase by 10%○ material cost for wrap (TSW and OSW)
increase by 25%○ material cost for wrap (TSW and OSW)
increase by 50%– Part C (changes in usage)
○ turnover rate of containers and transportbaskets increases by 10%
○ turnover rate of containers and transportbaskets increases by 25%
○ turnover rate of containers and transportbaskets increases by 50%
○ turnover rate of containers and transportbaskets decreases by 10%
○ turnover rate of containers and transportbaskets decreases by 25%
○ turnover rate of containers and transportbaskets decreases by 50%
○ transport baskets are not used○ containers are used only 5 years○ containers are used for 15 years○ containers are used for 20 years○ larger large-capacity washing system needed○ additional large-capacity washing system
needed– Part D (extreme scenarios)
○ personnel costs are not relevant to the decisionand material costs for wrap decrease by 75%
○ material costs for wrap decrease by 50% andturnover rate of containers and transportbaskets increases by 50%
○ material costs for wrap decrease by 91% andtransport baskets are not used
○ additional large-capacity washing systemneeded, material costs for wrap decrease by50% and transport baskets not used
○ personnel costs not relevant to the decision,material costs for wrap decrease by 40%,transport baskets not used and additional large-capacity washing system needed
Part A: As part of the scenario building process,personnel costs were varied. The changes + 10% and +20% can have two meanings. Either 10% or 20% increasein personnel costs or 10% and 20% increase in personneltime consumptions. It turns out that the order of the
results does not change. The reason is that the rankingof the personnel time consumptions follows the overallranking. Another situation arises when personnel costsare not relevant to the decision. This situation occurswhen the differences in time consumptions do not re-quire additional personnel. Consequently, this situationonly occurs if – regardless of the packaging option – thestaff is working within its capacity limits. In this sce-nario, TSW (now in rank three) costs less than OSW(now in rank four). In all scenarios, SC causes the leastcosts and SCW the second lowest costs. The changedvalues are shown in Table 9.Part B: Within the scenarios, the material or contribu-
tion costs were varied. It turns out that a change in thevariable costs by + 10% and + 20% and the special costsby + 10% and + 20%, does not result in any changes inthe ranking. The same applies to the increase in con-tainer price by + 20%. Only if the container price isincreased by + 50% is the option OSW beneficialcompared to SCW (0.004€). An identical picture isfound in the change in price of the sterilisation fleece.A change of - 20% will not influence the originalranking. Only if the price for wrap is reduced by 50%does the OSW option benefit SCW. TSW will not beadvantageous over SCW. This is due to relatively highstaff costs for TSW. Furthermore, the effects of ahigher price for non-woven wrap in the TSW andOSW options were investigated. The reason for thisis that with a higher weight of the sterile goods, ex-pensive nonwovens must be used, while there are nochanges in the container options. It turns out thatwith a 50% increase of prices for wrap, TSW andOSW options can cost more than twice as much asSC. In reality, large price fluctuations can exist. Onone hand side, discounts for high sales volumes leadto strong benefits, on the other hand side, low salevolumes or high weights of the instrument tray (re-quiring stronger wrap) significantly affect the costs.Consequently, the price fluctuations assumed here arerather realistic. The result shows that the price ofwrap (including disposal) is the relevant cost driver.In the baseline scenario, they cause about 38.6% ofthe packaging related costs in the TSW option. In theoption OSW it is about 44.7% and in the optionSCW about 21.0%. Table 10 displays the scenarios indetail.Part C: The third part examines changes in usage. This
includes changes in the turnover rate and the non-use oftransport baskets in the TSW and OSW option. Further-more, changes in the period of usage of containers is ex-amined. It turns out that an increase in the turnoverrate has no influence on the ranking of the results. Theincreased usage of containers and transport baskets,however, leads to a decrease in the packaging related
Krohn et al. Health Economics Review (2019) 9:1 Page 14 of 17

costs per piece produced. Another result shows in caseof the reduction of the turnover rate. While the resultsare unchanged at a − 25% reduction, a 50% reductionmakes OSW less expensive than SCW. The reason forthis are the acquisition costs for containers. With a life-time of 10 years and a circulation of 60 per year, thecontainers are used only 600 times in total. This showsthat the circulation rate has a significant impact oncosts. Furthermore, the changes in the non-use of trans-port baskets were examined. It turns out that the optionOSW now dominates the SCW. However, this does nottake into account the additional measures required tostore the sterile goods in order to compensate for thedisadvantage of the missing transport baskets. Thus, theoption will only be beneficial if the additional cost forstorage is less than 0.04 € per piece. It should be notedthat option SC is still dominant in this case. Finally,the influence of the usage time of the containers wasexamined. While an extension to 15 or 20 years in-creases the advantage of the SCW and SC options, incase of a reduction to a 5-year usage, the OSW op-tion becomes dominant over SCW. However, itshould be noted that a useful lifetime of 5 years witha circulation frequency of 120 per year is rather pes-simistic. On the basis of surveys of 36 CSSDs inGermany, the average period of usage was 13.25 years,with a standard deviation of 6.86 years and a medianof 12 years. It should be noted, that even with a usagetime of only 5 years, the SC option is dominant. Thisis due to the low personnel time consumption of theoption. As part of the large-capacity washing systemscenarios, it becomes clear that a larger washing sys-tem has only a small impact on the costs per item(0.01 €). The reason for this is that the depreciation
per year is very small, since only the difference of theacquisition costs and no maintenance and repair costshave to be considered. If an additional system is re-quired, the costs of the SCW and SC options increasesignificantly. The cost of the SCW option is then al-most identical to the OSW option. However, it turnsout that the SC option still causes the least cost.Table 11 shows the scenarios in detail.Part D: The last three scenarios can be regarded as ex-
treme scenarios. It turns out that the replacement of theSC option as best option requires massive changes. TheSC option becomes third-rate, if personnel costs are notrelevant to the decision and the price for wraps de-creases by 75%. If personnel costs are included, the op-tion SC even remains optimal if the wrap pricedecreases by 50% and the turnover rate is reduced by50%. The third scenario shows that the TSW optionwould only become dominant over the SC option by0.01 € if the wrap price were to fall by 91% and transportbaskets would not be used. It turns out that personnelcosts have a massive impact on determining the best op-tion. Scenario number four includes a 50% reduction inwrap price, the non-use of transport baskets and theneed for an additional washing system for container use.Even in this scenario, the SC option dominates. The lastextreme scenario shows under which circumstances bothwrap options dominate the container options. Ifpersonnel costs are not relevant to the decision, theprice for wrap is reduced by 40%, transport baskets arenot used and an additional washing system for con-tainers is required, the options TSW and OSW domin-ate. Table 12 displays the ranking of these five scenarios.The scenarios underline that the option SC is
dominant and favorable in almost all constellations.
Table 10 Scenario analysis – Part B
Packaging Option TSW OSW SCW SC
Scenario Cost Rank Cost Rank Cost Rank Cost Rank
Material and special costs + 10% 4.05 € 4 3.62 € 3 3.40 € 2 2.15 € 1
Material and special costs + 20% 4.23 € 4 3.81 € 3 3.57 € 2 2.24 € 1
Material costs −10% 3.72 € 4 3.29 € 3 3.15 € 2 2.02 € 1
Material costs −20% 3.58 € 4 3.14 € 3 3.07 € 2 1.99 € 1
Price container + 10% 3.87 € 4 3.44 € 3 3.28 € 2 2.09 € 1
Price container + 20% 3.87 € 4 3.44 € 3 3.32 € 2 2.13 € 1
Price container + 50% 3.87 € 4 3.44 € 2 3.44 € 3 2.25 € 1
Material costs for wrap −10% 3.74 € 4 3.31 € 3 3.19 € 2 2.05 € 1
Material costs for wrap −20% 3.62 € 4 3.18 € 3 3.13 € 2 2.05 € 1
Material costs for wrap −50% 3.25 € 4 2.80 € 2 2.97 € 3 2.05 € 1
Material costs for wrap + 10% for TSW and OSW 3.99 € 4 3.56 € 3 3.24 € 2 2.05 € 1
Material costs for wrap + 25% for TSW and OSW 4.17 € 4 3.75 € 3 3.24 € 2 2.05 € 1
Material costs for wrap + 50% for TSW and OSW 4.48 € 4 4.07 € 3 3.24 € 2 2.05 € 1
Krohn et al. Health Economics Review (2019) 9:1 Page 15 of 17

Furthermore, the option SCW causes the second lowestcosts. Often the option SCW and OSW are close together.The reason for this is that the higher material costs of theOSW option are almost compensated by higher specialcosts (contribution costs for containers and large-capacitywashing system). However, this does not apply if strongerand more expensive fleece must be used as protectivepackaging. In some cases significantly higher costs resultin the option OSW. The option TSW causes the highestcosts in most cases. This is due to the higher processtimes and thus higher personnel costs.This study has a number of limitations. Firstly, it fo-
cuses purely on the economic dimension assuming thatall the four options achieve the same level ofhygiene-quality, which is in agreement with the fact thatcompliance with DIN EN ISO 11607-1 is normallyproven by all manufacturers for all four alternatives.Meaning that we did not have to comparecost-effectiveness ratios but could concentrate on acost-comparison alone. However, further research mustfollow to give more evidence to this assumption.
Secondly, our study calculates the actual costs basedon the real-life situation in two hospitals. We do notassess whether the processes are efficient but assumethat the time consumption reflect the real situation.It might be worthwhile to produce a standard-costingfor “best” processes instead of “actual” processes.Thirdly, the analysis took a strategic perspective, i.e.,we assume that all costs are relevant. If we take ashort-term perspective, depreciation charges are to beneglected as they are sunk costs in the short-run.This will not change the ranking of the alternatives,but has an impact on the comparative advantages ofthe options container versus wrap. Finally, our ana-lysis is based on two German hospitals with respect-ive laws and regulations, personnel costs, processesand financing systems.
ConclusionThis analysis shows that the costs of different pack-aging alternatives do differ – a result of high rele-vance to hospital managers worldwide. This result is
Table 12 Scenario analysis – Part D
Packaging Option TSW OSW SCW SC
Scenario Cost Rank Cost Rank Cost Rank Cost Rank
Personnel costs not relevant and material costs wrap −75% 0.89€
1 0.90€
2 1.23€
4 0.96€
3
Material costs wrap −50% and turnover rate (container and transport basket) -50% 3.38€
4 2.93€
2 3.37€
3 2.46€
1
Material costs wrap −91% and transport baskets not used 2.51€
3 2.04€
1 2.74€
4 2.05€
2
Additional large-capacity washing system needed, wrap −50% and transport baskets not used 3.02€
3 2.56€
2 3.15€
4 2.24€
1
Personnel costs not relevant, material costs wrap −40%, transport baskets not used andadditional large-capacity washing system needed
1.09€
1 1.11€
2 1.60€
4 1.14€
3
Table 11 Scenario analysis – Part C
Packaging Option TSW OSW SCW SC
Scenario Cost Rank Cost Rank Cost Rank Cost Rank
Turnover rate (container and transport basket) + 10% 3.85 € 4 3.42 € 3 3.20 € 2 2.01 € 1
Turnover rate (container and transport basket) + 25 3.84 € 4 3.41 € 3 3.16 € 2 1.97 € 1
Turnover rate (container and transport basket) + 50% 3.82 € 4 3.39 € 3 3.11 € 2 1.92 € 1
Turnover rate (container and transport basket) -10% 3.88 € 4 3.45 € 3 3.29 € 2 2.10 € 1
Turnover rate (container and transport basket) -25% 3.91 € 4 3.48 € 3 3.38 € 2 2.19 € 1
Turnover rate (container and transport basket) -50% 4.00 € 4 3.56 € 2 3.65 € 3 2.46 € 1
Transport baskets not used 3.63 € 4 3.20 € 2 3.24 € 3 2.05 € 1
Container used for 5 years 3.87 € 4 3.44 € 2 3.64 € 3 2.45 € 1
Container used for 15 years 3.87 € 4 3.44 € 3 3.11 € 2 1.92 € 1
Container used for 20 years 3.87 € 4 3.44 € 3 3.04 € 2 1.85 € 1
Larger large-capacity washing system needed 3.87 € 4 3.44 € 3 2.25€ 2 2.06€ 1
Additional large-capacity washing system needed 3.87 € 4 3.44€ 3 3.43 € 2 2.24 € 1
Krohn et al. Health Economics Review (2019) 9:1 Page 16 of 17

not a consequence of structural differences of the twohospitals analysed as we concentrated only on those pro-cesses which are comparable. Instead, differences in timeand costs are consequences of the packaging alternatives.However, this result should not be overestimated. Instead,each CSSD or hospital should analyse its own situation,requirements and circumstances. For some institutions,for instance, capital is the scarcest agent of production asthese institutions have no access to loans while relying on(declining) government funded grants to purchase con-tainers. For these institutions, leasing of containers orusing wraps might be the most rational solution. For otherinstitutions, rising costs of personnel or a shortage ofpersonnel are the most pressing influencing factors. In thiscase, the alternative with the lowest consumption ofpersonnel time should be sought. Although an advantageof about 98 s per sterilisation set (SC vs. TSW) appearslow, this difference accumulates to more than onefull-time position in the CSSD if we assume an annualoutput of 49,000 units. From the economic point of view,it becomes clear that factors such as personnel time con-sumptions, turnover rates, material costs and acquisitioncosts should always be taken into account.It will be challenging to see whether an analysis in an-
other country will reproduce the same results. Thus, thispaper calls for more research in the economics of hos-pital management and in particular the economics of hy-giene management.
Abbreviations€: Euro; AD: Anderson-Darling; CSSD: Central Sterilisation Supply Department;DIN: German Institute for Standardization; DRG: diagnosis-related groups;EN: European Committee for Standardization; G-DRG: German-diagnosis-related groups; ISO: International Organization for Standardization;KS: Kolmogorov-Smirnov; OR: operating room; OSW: one-step non-wovensterilisation wrap; Q: Quantile; SC: sterilisation container without inner wrap;SCW: sterilisation container with inner wrap; TSW: two sheets non-wovensterilisation wrap; VAT: value added tax; WD: washing device
AcknowledgementsWe would like to thank Aesculap AG for its support in the field ofstandardization of the packaging option in the chapter “Packaging Option”.
FundingThis study was partly financed by Aesculap AG. In particular, the costs ofconducting the time-study were refunded to the respective university insti-tute. The authors confirm that the results of this analysis were not influencedat all by this sponsoring.
Availability of data and materialsThe datasets used and analysed during the current study are available fromthe corresponding author on reasonable request.
Authors’ contributionsMK and TM created the study design and collected the data. TM wrote theresults of the process analysis, MK wrote the results of the simulation andcost analysis. All other sections were written together. SF had the researchidea, supervised the entire process and finalized the manuscript. JF has giventhe final approval for the version to be published and was mainlyresponsible for the revision process. All authors read and approved the finalmanuscript.
Competing interestsThis study was partly financed by Aesculap AG. In particular, the costs ofconducting the time-study were refunded to the respective university insti-tute. The authors confirm that the results of this analysis were not influencedat all by this sponsoring.
Publisher’s NoteSpringer Nature remains neutral with regard to jurisdictional claims inpublished maps and institutional affiliations.
Received: 7 September 2018 Accepted: 25 December 2018
References1. Flessa S. Grundzüge der Krankenhausbetriebslehre: Band 1. 3rd ed.
München: Oldenbourg Wissenschaftsverlag; 2013.2. Mühlbauer B. Prozessorganisation im DRG-geführten Krankenhaus. 1st ed.
Weinheim: Wiley; 2004.3. Dobesh PP, Bosso J, Wortman S, Dager WE, Karpiuk EL, MA Q, Zarowitz BJ. Critical
pathways: the role of pharmacy today and tomorrow. Pharmacotherapy.Pharmacotherapy. 2006. https://doi.org/10.1592/phco.26.9.1358.
4. Iannone R, Lambiase A, Miranda S, Riemma S, Sarno D. Modelling hospitalmaterials management processes. Int J Eng Bus Manag. 2013. https://doi.org/10.5772/56607.
5. Kohnen W, Fleischhack R, Kaiser U, Kühne T, Salzbrunn R, Getreuer H,Wegner WD, Jatzwauk L. Grundlagen der Sterilisation. In: Kramer A, AssadianO, Exner M, Hübner NO, Simon A, editors. Krankenhaus- und Praxishygiene.München: Urban: Fischer; 2016. p. 64–95.
6. Reymondon F, Pellet B, Marcon E. Optimization of hospital sterilization costsproposing new grouping choices of medical devices into packages. Int JProduction Economics. 2008. https://doi.org/10.1016/j.ijpe.2006.12.066.
7. Stockert EW, Langerman A. Assessing the magnitude and costs ofintraoperative inefficiencies attributable to surgical instrument trays. J AmColl Surg. 2014. https://doi.org/10.1016/j.jamcollsurg.2014.06.019.
8. Mhlaba JM, Stockert EW, Coronel M, Langerman AJ. Surgicalinstrumentation: the true cost of instrument trays and a potential strategyfor optimization. J Hosp Admin. 2015. https://doi.org/10.5430/jha.v4n6p82.
9. Van Meter MM, Adam RA. Costs associated with instrument sterilization ingynecologic surgery. Am J Obstet Gynecol. 2016. https://doi.org/10.1016/j.ajog.2016.06.019.
10. Webster J, Radke E, George N, Faoagali J, Harris M. Barrier properties and costimplications of a single versus a double wrap for storing sterile instrumentpacks. Am J Infect Control. 2005. https://doi.org/10.1016/j.ajic.2004.11.010.
11. Rose J, Weiser TG, Hider P, Wilson L, Gruen RL, Bickler SW. Estimated needfor surgery worldwide based on prevalence of diseases: a modellingstrategy for the WHO Global Health estimate. Lancet Glob Health. 2015.https://doi.org/10.1016/S2214-109X(15)70087-2.
12. McDonnell G, Sheard DA. Practical guide to decontamination in healthcare.1st ed. Chichester: Wiley-Blackwell; 2012.
13. DIN EN ISO 11607-1. Verpackungen für in der Endverpackung zusterilisierende Medizinprodukte Teil 1: Anforderungen an Materialien,Sterilbarrieresysteme und Verpackungssysteme (ISO 11607-1:2006 + Amd 1:2014), Deutsche Fassung EN ISO 11607-1:2009 + A1:2014.
14. Seavey R. High-level disinfection, sterilization, and antisepsis: current issuesin reprocessing medical and surgical instruments. Am J Infect Control. 2013.https://doi.org/10.1016/j.ajic.2012.09.030.
15. Kagoma Y, Stall N, Rubinstein E, Naudie D. People, planet and profits: thecase for greening operating rooms. CMAJ. 2012. https://doi.org/10.1503/cmaj.112139.
16. REFA, Verband für Arbeitsstudien und Betriebsorganisation. Methodenlehre desArbeitsstudiums Teil 2: Datenermittlung. 7th ed. München: Carl Hanser; 1992.
17. Krohn M. Personaleinsatz bei stationären intermittierenden Dialysen. 1st ed.Heidelberg: Springer; 2014.
18. Monhor D, Takemoto S. Understanding the concept of outlier and itsrelevance to the assessment of data quality: probabilistic backgroundtheory. Earth Planet Sp. 2005. https://doi.org/10.1186/BF03351881.
Krohn et al. Health Economics Review (2019) 9:1 Page 17 of 17