analysis of minor elements and metals in hog manure by field- … · 2007. 3. 14. · the...
TRANSCRIPT

1
Analysis of Minor Elements and Metals in Hog Manure by Field-portable Near-infrared Spectroscopy: Results for Foss NIRSystems Inc. Model 6500 Spectrophotometer in the Laboratory
Final Report 1 of 3 to Manitoba Livestock Manure Management Initiative on Project 00-02-03 July 2001 (Revised October 2001) D.F. Malley, P.D. Martin, S.E. Woods, and L. Dettman PDK Projects, Inc. 365 Wildwood Park Winnipeg MB R3T 0E7 www.pdkprojects.com

2
Copyright ©PDK Projects, Inc. 2001 Executive Summary
The overall purpose of this project was to develop a field protocol for testing two field-portable near-infrared (NIR) spectrophotometers as on-site, free-standing (not in-line), measurement tools for nutrients in hog manure at the time of application of manure to agricultural land. This project is a developmental step between the analysis of hog manure in the laboratory using near-infrared spectroscopy (NIRS) and the deployment of NIR instruments in the manure stream for real-time measurement of composition of manure during application to land. The field-portable instruments included the Textron Systems Corp (USA)/Case NH (USA) ProSpectra™ Spectrometer and the Carl Zeiss (Germany) Corona® Spectrometer.
The first step in this project was the design and construction of a mobile laboratory
mounted on the bed of a 1/4-ton pick-up truck. Considerations in designing and building this system included reliable power supply for the instruments and laptop computers, security of the equipment against movement during transit and against theft, protection from the elements, and worker safety.
Secondly, the project involved sampling of manure at 13 application operations during September to November 2000. A total of 121 manure samples were collected. Using conventional physical and chemical methods, the samples were analyzed for moisture, pH, density, conductivity, nutrients, metals and minor elements.
Thirdly, the project involved operating the two field-portable NIR instruments on the mobile laboratory for the scanning of the manure samples. As well, all of the samples were scanned with a laboratory instrument, the Foss NIRSystems Inc. (USA) Model 6500 visible/near-infrared scanning spectrophotometer. The NIR spectral data from the 6500 and field-portable instruments were statistically correlated with the chemical data on the same samples to develop calibrations, or statistical models, for each constituent on each instrument. The success of calibrations was evaluated statistically as a measure of the performance of the instruments and their suitability for on-site manure analysis. Successful calibrations can be used with the respective instruments in the field to predict composition of future manure samples.
This is the third of six reports describing the results from the overall project. It reports the concentrations of minor elements and metals in the manure samples collected in fall 2000. It also reports the results from developing calibrations for each of these constituents from the spectra obtained with the Model 6500 NIR instrument in the laboratory. Finally, it provides calibration results for a separate set of manure samples from another study collected in 1999 for the Agricultural Research Development Initiative (ARDI) Project 98-124 and scanned with the 6500. The calibration results for fall 2000, ARDI 1999 and ARDI 1998 samples are compared.
Moisture was predicted very successfully. Based on calibrations for the three years of data, successful calibrations were developed for Cu and Cd and moderately successful calibrations were developed for Ca, Fe, Mg, Mn, Mo, S, and Sn. Based on two of three sets, the

3
elements Al, Ba, Be, Cr, Ni, Se, Sr and Ti were predicted successfully or moderately successfully. Calibrations were inconsistent for Co, K, Na, Pb, Si, V, and Zn. Of these elements in this report, S is the most important as a nutrient. The metals Cu, Cr, and Zn are important as micro-nutrients. When they are in high concentrations in the manure and at risk of accumulating in soil, Cd, Cu, Cr, Pb, and Zn are important as potentially-toxic metals. The most important elements that were not reliably predicable by NIRS were K and B.
. Acknowledgments
This hog manure field demonstration project received funding from the Manitoba Livestock Manure Management Initiative Inc. as project 00-02-03 for the purpose of exploring the application of field-portable near-infrared (NIR) spectrometers for the analysis of minor elements and metals in hog manure.
The development of the mobile near-infrared spectroscopy (NIRS) laboratory and the analysis of nutrients using the field-portable NIR instruments was funded by the TEAM (Technology Early Action Measures) component of the Climate Change Action Fund) and Western Economic Diversification through the Hog Manure Management Strategic Initiative of CETAC-West, Calgary.
The authors are indebted to G. Plohman, G. Racz, J. Hicks, and Norwest Labs who made available hog manure samples and analytical data from two years of sampling, 1998 and 1999, under the Agricultural Research Development Initiative (ARDI) Project 98-124. The project by these workers is entitled “Long-term effects of hog manure on soil quality and productivity”.
Foss NIRSystems Inc. (Silver Spring, MD) is acknowledged for in-kind support with instrumentation, software, supplies, and technical support.
The photo on the cover shows the mobile NIR lab set up for operation in the field. Photo is the property of PDK Projects, Inc.

4
Table of Contents Executive Summary.........................................................................................................................2 Acknowledgments............................................................................................................................3 Introduction......................................................................................................................................5 Near-infrared Spectroscopy (NIRS)....................................................................................5 Mobile NIR Laboratory.......................................................................................................6
Measurement of Minor Elements and Metals with NIRS...................................................7 Purpose................................................................................................................................7
Methods...........................................................................................................................................8 Mobile Laboratory and Sampling of Manure......................................................................8
Chemical Analyses..............................................................................................................8 Recording Spectra in the Laboratory Using the NIRSystems Model 6500.........................9
Principal Component Analysis of the Constituent Data....................................................10 Calibration Procedure by Multiple Linear Regression.......................................... ...........10 Statistical Evaluation of Calibrations.................................................................................11
Results............................................................................................................................................11 Composition of the Manure...............................................................................................11 NIR Prediction of Minor Elements and Metals in Hog Manure........................................24 Discussion......................................................................................................................................33 References......................................................................................................................................34

5
Introduction
Economically and environmentally-sustainable operation of the hog production industry in Manitoba requires a life cycle approach to the management of all inputs and outputs. Acceptable management of the manure wastes from the operations is a particular challenge not only because of the associated odour, their large volume and high water content, but also because they are highly variable in nutrient composition (Malley, Martin and Woods, 2001). The practice of using the manure as a raw material as a crop fertilizer can be ecologically-sound, both solving a waste management problem and reducing the cost of chemical fertilizer, providing precautions are taken to avoid over-fertilization of soils; leaching of nutrients into ground and surface water; and accumulation of salts, heavy metals, and minor elements in the manure by the soil.
Hog manure is a complex mixture with three sources of inputs. It is primarily a
collection of excretory products and non-digested food that have passed through the hogs, including metabolites of food, pharmaceuticals, and, potentially, pathogens and parasites. It also contains materials washed from the barns, including wasted feed, wash water, cleaning products, spilled drinking water, and water from staff showers. Finally, it contains materials such as clay and minerals scoured from the storage facility, particularly when manure is stored in earthen ponds. The composition of manure varies depending upon the type and age of animal, food, water content, storage and handling procedures, and climate (Prairie Swine Centre Inc. Factsheet, undated).
Determination of constituent concentrations in the hog manure before application to land is desirable because the concentration of total solids and the chemical composition of the manure vary from one production facility to another, over time within a facility, and most importantly, with settling. Material drawn from the top of a non-agitated truck, tank, or earthen manure store will be highly liquid and contain high ammonia and low phosphate concentrations, while that from the bottom can be highly concentrated in phosphorus, organic nitrogen and other particle-bound constituents. Manure sampled from typical hog operations in Manitoba contains a wide range of concentrations of minor elements and metals (Fitzgerald and Racz 2001) as well as of nutrients. Thus, one-time mixing and sampling of a manure store some time in advance of pump-out will not provide accurate compositional information on the manure during the application of the manure to fields or pastures.
A method of chemical analysis of the manure that is rapid, cost effective, versatile, field-
portable and, if possible, operating in-stream would have wide applicability.
Near-infrared Spectroscopy (NIRS)
Near-infrared spectroscopy is a 30-year old technology that has the capability of determining quantities of organic constituents in liquids, slurries, and solids. It is used globally for determination of a wide variety of constituents, composition, and functionality in agricultural products, feeds, food, forages, petrochemicals, cosmetics, polymers, (including waste plastic streams for recycling), pharmaceuticals, textiles and other materials. Medical and environmental applications are emerging areas.
6
The technique is based on measurement of the intensity of the absorption of near-infrared radiation (780 to 2500 nm) by a sample. Radiant energy in this range may excite molecular vibrations to higher energy levels. Absorbance occurs at wavelengths that match the frequency of the molecular vibrations. Commonly, NIRS is used for quantitative measurement of constituents containing organic functional groups composed of light atoms, such as covalent O-H, C-H, N-H, C=O, and C-N bonds and for prediction of functional properties of samples resulting from the organic composition. Although organic substances are typically analyzed by NIRS, it has been used to determine the concentration of electrolytes such as NaNO3, NaNO3, Na2CO3 in liquids based on the perturbation of the water spectrum (Espinoza et al. 1999). Metals, themselves, do not absorb NIR light, but may be predictable by NIRS by their association with NIR absorbers, such as organic matter or clay, or possibly by their effects on water. Predictability of six heavy metals in sediments by NIRS was attributed to their association with naturally-occurring organic matter (Malley and Williams, 1997). NIRS is not a stand-alone analytical technique. Its ability to provide rapid analyses depends on the prior preparation of mathematical calibrations used to predict constituents, parameters, or functionality in unknown samples. Calibrations are statistical models developed between NIR spectra from a set of samples and values for constituents, parameters, or functions of interest that have been determined by conventional methods on the same samples. The calibrations are then entered into the NIR instrument’s computer and are used to predict the parameters of interest in the unknown samples within 1 minute or less. Accuracy and precision are maintained by periodical, on-going analysis by the conventional methods of some proportion, e.g., 5-10%, of the unknown samples. NIRS has the capability of measuring constituents in liquids (e.g., Gatin et al. 1995) and slurries (Wust et al. 1996). NIRS technology is used in-line in industrial applications where fibre optic probes are inserted into the industrial process stream (e.g., Brookes et al. 1996; Wust et al. 1996), or focused on to an industrial flow such as waste plastic articles. Considerable experience exists in the measurement of constituents in hog manure by NIRS using bench-top laboratory NIR instruments (Malley 1999; Malley and Currie 1999; Malley et al. 1999; Malley and Vandenbyllaardt 1999; Millmier et al. 2000). Some experience has been gained with the use of a field portable NIR instrument, the Textron/Case NH ProSpectra™ in the laboratory (Malley, Badiou and Williams 2000). Mobile NIR Laboratory
As a developmental stage between laboratory analysis of hog manure and in-stream, real-time measurement of composition of manure during application to land, a mobile laboratory was built carrying two field-portable NIR instruments (Malley, Martin and Woods, 2001). The instruments were the Textron Systems Corp (USA)/Case NH (USA) ProSpectra™ Spectrometer and the Carl Zeiss (Germany) Corona® Spectrometer. The capability of these instruments for the analysis of nutrients in hog manure is reported by Malley, Martin and Moffat (2001a) and Malley, Martin and Dettman (2001a), respectively.

7
The model 6500 laboratory instrument serves as a baseline instrument with a wide wavelength range and well-known performance throughout all of our studies on hog manure analysis by NIRS. It is expected that it provides a performance target against which to measure the performance of the field-portable instruments. Nevertheless, a number of factors other than instrument electronic performance affect the success of calibrations. Calibrations are highly dependent on the accuracy and precision of the chemically-measured reference data. Sample presentation affects the success of calibrations. The algorithms and the software package used for the development of calibrations have an influence as well.
Measurement of Minor Elements and Metals with NIRS
Malley and Vandenbyllaardt (1999) reported on the feasibility of estimating a number of metals and minor elements by NIRS in 75 hog manure samples collected in 1998 from 25 manure stores affiliated with Elite Swine Ltd. The samples and analytical data were obtained from a two-year study funded by the Agricultural Research Development Initiative (ARDI project 98-124) on the long-term effects of hog manure on soil quality and productivity (Fitzgerald and Racz 2001). Useful calibrations were developed for Ca, Mg, Ba, Be, Cd, Cu, Cr, Fe, Mn, Mo, Ni, Se, Sr, S, Ti, V, and Zn. Unsuccessful results were obtained for Na, K, Cl, Al, As, B, and Li (Malley and Vandenbyllaardt 1999). Malley, Badiou and Williams (2000) scanned the year 2 (1999) samples from the ARDI study using the model 6500 spectrophotometer and the ProSpectra™ spectrometer and developed calibrations for nutrients.
Purpose
The goals of this project were: 1. Development of calibrations for up to 28 metals and minor elements from the year 2 (1999)
ARDI samples scanned with the model 6500 instrument. 2. Development of calibrations for up to 28 metals and minor elements from the year 2 (1999)
ARDI samples scanned with the Textron/Case NH ProSpectra™ spectrometer. 3. Analysis of 100 of up to150 hog manure samples collected in the fall of 2000 for 32 elements
by inductively-coupled plasma emission spectroscopy (ICP-ES). 4. Development of calibrations for up to 28 metals and minor elements in the fall 2000 samples
from the scans from three instruments: a. Foss NIRSystems Inc. model 6500 b. Textron/Case NH ProSpectra™ spectrometer c. Zeiss Corona® spectrometer.
This report describes the results of developing calibrations for the ARDI year 2 (1999)
samples for metals and minor elements (goal 1) and compares the results with those for the ARDI year 1 (1998). It reports the concentrations of minor elements and metals in the manure samples collected in 2000 (goal 3), and the success of developing calibrations for the year 2000 samples for metals and minor elements (goal 4a). Results for the ProSpectra™ (goals 4b) are given in Malley, Martin, and Moffatt (2001b) and for the Corona® (goal 4c) are given in Malley, Martin, and Dettman (2001b). Based on further work with sample presentation to the

8
ProSpectra™ spectrometer (Malley, Martin and Moffat 2001a), it was decided not to pursue goal 2 at this time. This report is fourth in a series of six reports on the field-testing of the mobile instruments where Malley, Martin, and Woods (2001), Malley, Martin and Moffatt (2001a) and Malley, Martin and Dettman (2001a) describe the results for nutrients. This report and Malley, Martin and Moffatt (2001b) and Malley, Martin and Dettman (2001b) describe results for the minor elements and metals. Methods Mobile Laboratory and Sampling of Manure
The design and construction of the mobile laboratory are described by Malley, Martin and Woods (2001). They also report on the collection of hog manure samples for this study from 13 hog operations in the vicinity of Winnipeg from September to November 2000.
The collection of hog manure for the two-year ARDI study is described by Fitzgerald and
Racz 2001). Chemical Analyses The 1998 ARDI manure samples (n = 75) were analyzed by Norwest Labs by four tests: 1) liquid manure physical properties - moisture, electrical conductivity; 2) liquid manure nutrients - total N, NH4-N, total P, K and Na; 3) salts - Ca, Mg, Na, Cl, and 4) inductively-coupled plasma (ICP) spectroscopy for 32 elements including Ca, Mg, K, Na, P, Al, Sb, As, Ba, Be, Bi, B, Cd, Cr, Co, Cu, Fe, Pb, Li, Mn, Mo, Ni, Se, Si, Ag, Sr, S, Ti, Tl, V, Sn, and Zn. The 1999 ARDI samples (67 of 137 samples) were analyzed by Norwest Labs for: 1) liquid manure physical properties - moisture, pH, electrical conductivity and 2) trace inductively-coupled plasma emission spectroscopy (ICP-ES) for 32 elements including Ca, Mg, K, Na, P, Al, Sb, As, Ba, Be, Bi, B, Cd, Cr, Co, Cu, Fe, Pb, Li, Mn, Mo, Ni, Se, Si, Ag, Sr, S, Ti, Tl, V, Sn, and Zn.
In both years, values for Sb, As, Ag, and Tl were all or mostly below the limits of detection of the method. They were not considered further here. Eighty of 121 samples of manure collected from September to November 2000 were analyzed for moisture, and for 32 metals and minor elements by Norwest Labs. All or many of the values for Ag, As, Bi, Sb, Se, and Ti were below the limits of detection for the method. These were not considered further.

9
For the ICP analysis, 500 mL of manure sample was preserved with 5 mL of 20% nitric acid preservative and stored at 4° C until measured. Samples were presented to the spectrometer using an ultrasonic nebulizer. Detection limits varied with the element.
Recording Spectra in the Laboratory Using the NIRSystems Model 6500
NIR spectra were recorded in the laboratory using a Foss NIRSystems Inc. (Silver Spring, MD) Model 6500 visible/NIR scanning spectrophotometer fitted with a standard sample transport. Absorbance was recorded every 2 nm from 400 to 2498 nm using DOS-based Near-infrared Spectral Analysis Software (NSAS). An electronic noise test was carried out prior to scanning on each day. Once a week a bandwidth test was performed using internal standards in the instrument. The NIR instrument with the standard sample transport was turned on its back so that the transport operated horizontally, instead of vertically as is normal (Fig. 1, from Malley and Currie 1999). In this way, settling particles stayed in the path of the light, rather than falling out of it.
Manure samples were well shaken and aliquots removed and dispensed into a liquid sample cell with quartz glass on two sides, an opaque ceramic fastened over one glass side, and a gasket to make the cell watertight. Path length of the cell was 2 mm.
Between each sample scan, a non-absorbing reference ceramic was scanned and the resulting reference spectrum was automatically subtracted from each sample scan. Samples were
Fig. 1. Foss NIRSystems model 6500 visible/near-infrared scanning spectrophotometer on its back so that the sample transport (uppermost) operated horizontally instead of vertically.

10
loaded into the cell twice. For each loading, triplicate scans were recorded, with the cell being turned 120o between scans. This resulted in 6 scans per sample. Principal Component Analysis of Constituent Data
Using multivariate analysis software, Unscrambler® (CAMO ASA Oslo, Norway), principal component analysis (PCA) was performed on the metal and minor element chemical data. The data were centered, all 27 constituents were weighted using a transformation 1/SD. On a two-dimensional scatter plot, loadings of individual constituents on the first two principal components (PC) explaining the variance in constituents were examined. The plot shows the importance of various constituents, i.e., the extent to which their variability is explained by PC1 or PC2, and the extent to which they are interrelated. Variables close to each other in the loading plot will have a high positive correlation if the two variables explain a large proportion of the variance in composition. Variables in diagonally-opposed quadrants will tend to be negatively correlated. Variables close to the center of the plot will be poorly explained by the plotted PCs.
On a second scatter plot, scores for individual samples on the first two PCs explaining the variance in the constituent data were plotted. The plot gives information about patterns among the samples. The closer samples are in the score plot, the more similar they will be with respect to composition. Conversely, samples far away from each other will be different from each other. The loading and score plots can be viewed together. Samples in one quadrant of the score plot will usually have high values for the variables in that quadrant in the loading plot. Calibration Procedure by Multiple Linear Regression using NSAS
The ability of NIRS to provide rapid analyses depends on the prior preparation of mathematical calibrations used to predict constituents, parameters or functionality in unknown samples. A calibration is a statistical correlation model relating the spectral data for a set of samples to its compositional data determined by conventional methods.
The six replicate spectra for each sample were averaged to give one spectrum per sample.
The reference chemical results for all the constituents for each sample were added to the NIR spectral file. Concentrations of constituents in the manure were on a wet weight basis.
For each constituent, the spectra were sorted from lowest to highest constituent value and
divided equally into two sets. Every other sample was allocated to the calibration set ("A"), and the remaining samples to the validation set ("B"). Each set therefore represented the full range of constituent concentrations. Using the calibration set, up to 288 calibration equations were developed for the wavelength range 400-2498 nm using the stepwise multiple linear regression (MLR) option in the NSAS software. For example, separate calibration equations were computed using the raw optical data (log 1/R) smoothed over 4, 10, 20, or 40 wavelength points, termed "segments" (where wavelength points were 2 nm apart). The optical data were then transformed using first or second derivative and derivative (“gap”) sizes of 4, 10, 20, or 40

11
wavelength points. As for the raw optical data, the derivatized data were smoothed using the above wavelengths segments. For each combination of segment and gap, equations for one to 8 wavelengths were calculated.
Each of the calibration equations developed from the calibration set was used to predict
the constituent values for the independent spectra in the validation set. The NIR-predicted values for the validation set were correlated to their chemically-measured reference values. The calibration process was completed when one equation was selected as giving the best results. This is referred to as "A/B" in Table 6. The procedure was repeated by using the validation set ("B") to develop the calibrations and the calibration set (A") for the prediction process. This is referred to as "B/A" in Table 6. The procedure was repeated for each constituent.
Statistical Evaluation of Calibrations
The best calibration was the one with the highest r2 (coefficient of determination) between NIR-predicted values and reference values, and lowest SEP (standard error of performance, i.e., the standard deviation of the residuals about the 1:1 line). Other statistics used to evaluate the calibration were the RPD, i.e., the ratio of the SD of the chemically-determined values for the validation set to the SEP; and the RER, i.e., the ratio of the range of the chemically-determined values for the validation set to the SEP.
In the successful analysis of agricultural commodities, usually r2 is > 0.95, RPD is > 5 and RER is > 20. Nevertheless, for samples such as manure that are more variable than commodities, several levels of performance are defined and used in this study. Excellent calibrations were those with r2 > 0.95 and RPD > 4. Successful calibrations had r2 = 0.9 - 0.95 and RPD = 3 - 4. Moderately successful calibrations had r2 = 0.8 - 0.9 and RPD = 2.25 - 3 and moderately useful ones had r2 from 0.7 - 0.8 and RPD from 1.75 - 2.25. Calibrations with lower statistical performance may still be useful depending on the accuracy required in the field situation and the availability of better alternative field methods. They are useful for screening purposes, such as for distinguishing among low, medium, and high values, or for selecting samples for costly conventional chemical analysis. Results Composition of the Manure
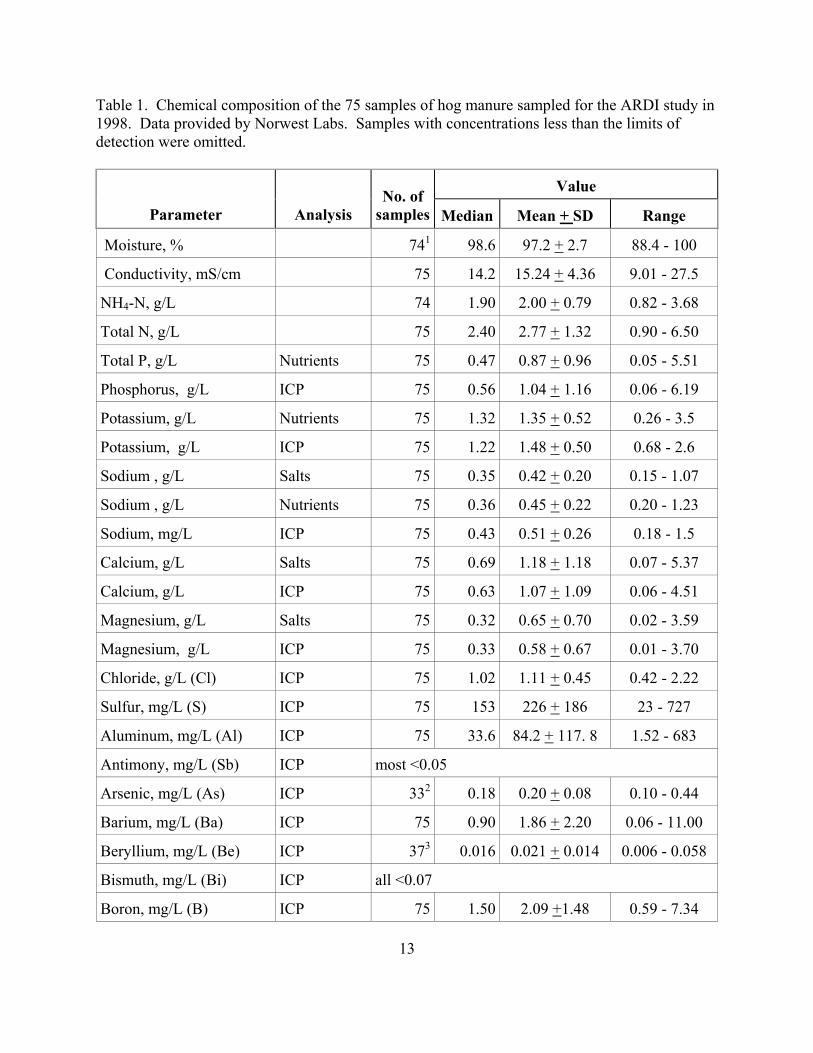
Tables 1 to 3 report the composition of three years of manure samples in this study. Median concentrations are given as the concentrations at the 50th percentile of the samples. The two years of samples from the ARDI study were similar ranging from 85 to almost 100 % water and averaging 97.0 %. Conductivity ranged from 8 to 28 mS/cm (Tables 1, 2).
In the 121 samples from fall 2000, moisture ranged from 89 to nearly 100%. pH varied from 6.7 to 8.1, conductivity from 7 to 27 mS/cm and density from 1.002 to 1.049 (Malley, Martin, and Woods 2001) (Table 3). On average, 90.9 % of the TDN was NH4-N, and 84.9 % of

12
the total N was TDN. Therefore most, 77.2 %, of the total N was NH4-N. Total dissolved P was 95.8 % SRP, or inorganic phosphate, and TDP was 73.2 % of the total P (Table 3). Therefore, most of the total P was inorganic phosphate. Suspended C was the most concentrated nutrient. Coefficient of variability (CV) was calculated for each constituent in these samples as a comparative measure of variation in concentrations. Suspended C was the most variable nutrient, i.e., had the highest coefficient of variation. Suspended P, the other P fractions, and suspended N were also highly variable in concentration. Potassium, NH4-N, and TDN were the least variable of the nutrients (Table 3). Concentrations of metals and minor constituents were similar among the three sets of samples. Silicon was the most variable constituent among the three years (Table 1-3). Comparing CVs among minor elements and metals in Table 3, it can be seen that Zn, Cu, Mn, and Cr were the most variable. Of the important metals, Pb varied the least (Table 3).
Figure 2 shows the relationships among the constituents from the principal component analysis of the compositional data for the samples collected in fall 2000. The first principal component explained 72 % of the variance in the composition, was dominated by water, and reflects the particulate content of the samples. As expected there was an inverse relationship between water content and the concentrations of the elements, except for Pb that was correlated with water and inversely correlated with the remaining elements. The second principle component explained an additional 8 % of the variance in the composition. It was dominated by Na and possibly reflects the degree to which the elements were dissolved (ionic) vs particulate.
Elements that are close together in Fig. 2 were highly correlated. This includes most of
the metals. Lead, Sn, and Na were not correlated with any other elements. Potassium, Si, Co, and Li were correlated. Correlations are important in explaining why spectrally-inactive constituents can be predicted by NIRS. More data on inter-correlations for the samples collected in fall 2000are provided in Table 4. Correlations are reported for all of the constituents, including the nutrients. There were numerous correlations among constituents. In particular, a number of constituents were highly correlated (r ~> 0.9) with dry matter, i.e., particulate content of the manure, namely, suspended N, SRP, TDP, suspended P, total P, suspended C, Ca, Cd, Cr, Cu, Fe, Mg, Mn, Ni, P (by ICP), Sr, Zn, and Zr (Table 4). These include the most variable constituents in the manure consistent with the knowledge that compositional variability in manure is largely a function of particulate content. Figure 3 shows the relationships among the samples collected in fall 2000 with respect to their composition. It shows that there are two sets of outliers, a group of samples in the lower, right hand corner, and a second group at the top of the PC2 axis. The samples in the lower right hand corner are in the same quadrant as most of the constituents and opposite to water. They are samples with the highest particulate content.
13
Table 1. Chemical composition of the 75 samples of hog manure sampled for the ARDI study in 1998. Data provided by Norwest Labs. Samples with concentrations less than the limits of detection were omitted.
Value
Parameter Analysis No. of
samples Median Mean + SD Range
Moisture, % 741 98.6 97.2 + 2.7 88.4 - 100
Conductivity, mS/cm 75 14.2 15.24 + 4.36 9.01 - 27.5
NH4-N, g/L 74 1.90 2.00 + 0.79 0.82 - 3.68
Total N, g/L 75 2.40 2.77 + 1.32 0.90 - 6.50
Total P, g/L Nutrients 75 0.47 0.87 + 0.96 0.05 - 5.51
Phosphorus, g/L ICP 75 0.56 1.04 + 1.16 0.06 - 6.19
Potassium, g/L Nutrients 75 1.32 1.35 + 0.52 0.26 - 3.5
Potassium, g/L ICP 75 1.22 1.48 + 0.50 0.68 - 2.6
Sodium , g/L Salts 75 0.35 0.42 + 0.20 0.15 - 1.07
Sodium , g/L Nutrients 75 0.36 0.45 + 0.22 0.20 - 1.23
Sodium, mg/L ICP 75 0.43 0.51 + 0.26 0.18 - 1.5
Calcium, g/L Salts 75 0.69 1.18 + 1.18 0.07 - 5.37
Calcium, g/L ICP 75 0.63 1.07 + 1.09 0.06 - 4.51
Magnesium, g/L Salts 75 0.32 0.65 + 0.70 0.02 - 3.59
Magnesium, g/L ICP 75 0.33 0.58 + 0.67 0.01 - 3.70
Chloride, g/L (Cl) ICP 75 1.02 1.11 + 0.45 0.42 - 2.22
Sulfur, mg/L (S) ICP 75 153 226 + 186 23 - 727
Aluminum, mg/L (Al) ICP 75 33.6 84.2 + 117. 8 1.52 - 683
Antimony, mg/L (Sb) ICP most <0.05
Arsenic, mg/L (As) ICP 332 0.18 0.20 + 0.08 0.10 - 0.44
Barium, mg/L (Ba) ICP 75 0.90 1.86 + 2.20 0.06 - 11.00
Beryllium, mg/L (Be) ICP 373 0.016 0.021 + 0.014 0.006 - 0.058
Bismuth, mg/L (Bi) ICP all <0.07
Boron, mg/L (B) ICP 75 1.50 2.09 +1.48 0.59 - 7.34

14
Cadmium, mg/L (Cd) ICP 704 0.036 0.049 + 0.045 0.006 - 0.198
Chromium, mg/L (Cr) ICP 74 0.16 0.37 + 0.42 0.012 - 1.67
Cobalt, mg/L (Co) ICP 645 0.015 0.050 + 0.058 0.008 - 0.340
Copper, mg/L (Cu) ICP 75 19.7 33.5 + 35.8 1.1 - 169.0
Iron, mg/L (Fe) ICP 75 67.7 138.6 +169.6 4.7 - 988.0
Lead, mg/L (Pb) ICP 406 0.13 0.16 + 0.12 0.03 - 0.48
Lithium, mg/L (Li) ICP 75 0.19 0.24 + 0.15 0.05 - 0.96
Manganese, mg/L (Mn) ICP 75 9.2 19.3 + 22.0 0.5 - 96.0
Molybdenum, mg/L (Mo) ICP 73 0.26 0.40 + 0.38 0.02- 2.02
Nickel, mg/L (Ni) ICP 75 0.31 0.42 + 0.38 0.06 - 1.88
Selenium, mg/L (Se) ICP 677 0.21 0.26 + 0.18 0.04 - 0.85
Silicon, mg/L (Si) ICP 75 124 255 + 272 46 - 1520
Silver, mg/L (Ag) ICP most <0.01
Strontium, mg/L (Sr) ICP 75 1.40 2.14 + 2.06 0.14 - 10.50
Tin, mg/L (Sn) ICP 649 0.41 0.50 + 0.45 0.05 - 2.42
Titanium, mg/L (Ti) ICP 75 1.76 3.26 + 3.62 0.10 - 19.3
Thallium mg/L (Tl) ICP all <0.04
Vanadium, mg/L (V) ICP 678 0.35 0.58 + 0.64 0.01 - 2.60
Zinc, mg/L (Zn) ICP 75 41.5 76.2 + 90.8 1.2 - 541.0 1 One extreme outlier was removed 2 Remainder of values were <0.10 mg/L 3 Remainder of values were <0.005 mg/L 4 Remainder of values were < 0.005 mg/L 5 Remainder of values were <0.007 mg/L 6 Remainder of values were <0.02 mg/L 7 Remainder of values were <0.04 mg/L 8 Remainder of values were <0.01 mg/L 9 Remainder of values were <0.03 mg/L Nutrient data from Malley and Vandenbyllaardt (1999)

15
Table 2. Chemical composition of the samples of hog manure sampled for the ARDI study in 1999 for nutrients (n = 123) and minor elements and metals (n = 67). Data provided by Norwest Labs. Samples with concentrations less than the limits of detection were omitted.
Value
Parameter Analysis No. of
samples Median Mean + SD Range
Moisture, % 123 98.3 97.0 + 3.1 85.4 - 99.6
Conductivity, mS/cm 123 15.9 15.8 + 3.6 8.3 - 23.8
NH4-N, g/L Nutrients 123 2.02 2.06 + 0.86 0.52 - 3.95
Total N, g/L Nutrients 123 2.4 2.7 + 1.3 0.6 - 6.2
Total P, g/L Nutrients 123 0.50 0.90 + 0.99 0.03 - 5.71
Phosphorus, g/L ICP 67 0.18 0.63 + 1.51 0.38 - 10.90
Potassium, g/L Nutrients 123 1.36 1.34 + 0.37 0.66 - 2.22
Potassium, g/L ICP 67 1.92 1.77 + 0.62 0.21 - 3.38
Sodium , g/L Nutrients 123 0.38 0.45 + 0.22 0.14 - 1.18
Sodium, mg/L ICP 67 0.52 0.54 + 0.22 0.19 - 1.22
Calcium, g/L ICP 67 0.55 1.03 + 1.33 0.07 - 8.64
Magnesium, g/L ICP 67 0.21 0.53 + 0.76 0.009 - 4.76
Sulfur, mg/L (S) ICP 67 157 251 + 227 33 - 1220
Aluminum, mg/L (Al) ICP 67 35.7 99.0 + 164.9 1.15 - 825
Antimony, mg/L (Sb) ICP most <0.02
Arsenic, mg/L (As) ICP most <0.05
Barium, mg/L (Ba) ICP 67 0.72 1.67 + 2.32 0.06 - 10.64
Beryllium, mg/L (Be) ICP 351 0.012 0.015 + 0.012 0.003 - 0.044
Bismuth, mg/L (Bi) ICP all <0.04
Boron, mg/L (B) ICP 67 1.41 2.04 +1.88 0.32 - 11.2
Cadmium, mg/L (Cd) ICP 662 0.025 0.042 + 0.045 0.003 - 0.193
Chromium, mg/L (Cr) ICP 67 0.12 0.32 + 0.43 0.01 - 2.17
Cobalt, mg/L (Co) ICP 67 0.046 0.077 + 0.081 0.012 - 0.410

16
Copper, mg/L (Cu) ICP 67 15.6 31.9 + 34.9 0.6 - 177.0
Iron, mg/L (Fe) ICP 67 45.5 130.8 +193.8 3.9 - 906.0
Lead, mg/L (Pb) ICP 67 0.09 0.12 + 0.11 0.01 - 0.47
Lithium, mg/L (Li) ICP 67 0.29 0.36 + 0.26 0.05 - 1.41
Manganese, mg/L (Mn) ICP 67 6.8 16.7 + 22.1 0.4 - 134.0
Molybdenum, mg/L (Mo) ICP 67 0.16 0.33 + 0.34 0.02- 1.59
Nickel, mg/L (Ni) ICP 67 0.26 0.41 + 0.38 0.04 - 1.42
Selenium, mg/L (Se) ICP 663 0.15 0.19 + 0.16 0.01 - 0.97
Silicon, mg/L (Si) ICP 67 29.3 30.2 + 12.04 9.5 - 64.0
Silver, mg/L (Ag) ICP all <0.005
Strontium, mg/L (Sr) ICP 67 1.71 2.41 + 2.63 0.13 - 15.80
Tin, mg/L (Sn) ICP 494 0.091 0.121 + 0.007 0.016 - 0.382
Titanium, mg/L (Ti) ICP 67 0.96 2.31 + 2.83 0.05 - 10.9
Thallium, mg/L (Tl) ICP all <0.02
Vanadium, mg/L (V) ICP 67 0.18 0.45 + 0.61 0.02 - 2.80
Zinc, mg/L (Zn) ICP 67 21.5 40.2+ 45.8 1.5 - 239.0 1 Remainder of values were <0.003 mg/L 2 One value was <0.003 mg/L 3 One value was <0.02 mg/L 4 Remainder of values were <0.02 mg/L

17
Table 3. Composition of the 121 hog manure samples collected in fall 2000 for nutrients (n = 121) and minor elements and metals (n = 80)
Value
Parameter Analysis No. of
samples Mean + SD Range Median CV Median lb/ton
Median lb/1000 gal
Moisture, % NWL 80 97.6 + 2.8 88.5 - 99.7 98.8 2.9 N/A N/A
pH FWI 121 6.66 - 8.1 7.71 4.7 N/A N/A
Conductivity, mS/cm FWI 121 15.14 + 4.73 6.84 - 27.20 15.28 31.3 N/A N/A
Density, g/mL FWI 121 1.023 + 0.010 1.002 - 1.049 1.022 1.0 N/A N/A
NH4-N, g/L FWI 121 2.18 + 1.11 0.56 - 5.54 1.95 51.0 3.82 16.25
Total Dissolved N, g/L FWI 121 2.40 + 1.21 0.59 - 6.11 2.11 50.6 4.14 17.61
Suspended N, g/L FWI 121 0.602 + 0.798 0.014 - 4.083 0.306 132.7 0.597 2.55
Total N, g/L FWI 121 3.00 + 1.89 0.61 - 10.14 2.46 62.9 4.83 20.54
Soluble Reactive P, g/L FWI 121 0.562 + 0.703 0.047 - 3.813 0.363 125.1 0.702 3.03
Total Dissolved P, g/L FWI 121 0.580 + 0.716 0.055 - 3.86 0.378 123.3 0.734 3.15
Suspended P, g/L FWI 121 0.380 + 0.573 0.003 - 2.650 0.125 150.9 0.245 1.04
Total P, g/L FWI 121 0.960 + 1.268 0.055 - 6.512 0.579 132.0 1.13 4.83
Phosphorus, g/L NWL-ICP 80 1.10 + 1.46 0.053 - 6.03 0.54 132.4 1.06 4.50
Suspended C, g/L FWI 121 6.10 + 10.007 0.092 - 54.602 2.4 164.0 4.67 20.03

18
Potassium, g/L NWL-ICP 80 1.44 + 0.53 0.71 - 2.81 1.38 36.8 2.66 11.53
Sulfur, mg/L NWL-ICP 80 88.3 + 54.4 15 - 235 77.5 61.6 0.150 0.647
Sodium, mg/L NWL-ICP 80 419 + 84 221 - 573 394 20.0 0.772 3.28
Calcium, g/L NWL-ICP 80 0.82 + 1.21 0.06 - 5.37 0.31 147.5 0.603 2.56
Magnesium, g/L NWL-ICP 80 0.48 + 0.71 0.01 - 38.75 0.15 146.3 0.298 1.27
Aluminum, mg/L NWL-ICP 80 43.75 + 51.15 1.20 - 199.03 19.12 116.9 0.038 0.160
Boron, mg/L NWL-ICP 80 6.89 + 2.42 2.85 - 15.43 6.4 35.2 0.013 0.054
Barium, mg/L NWL-ICP 80 1.53 + 1.81 0.20 - 6.92 0.63 118.3 0.001 0.005
Beryllium, mg/L NWL-ICP 80 0.023 + 0.016 0.010 - 0.090 0.02 69.5 3.93 0.0002
Cadmium, mg/L NWL-ICP 79 0.047 + 0.057 0.010 - 0.270 0.03 121.7 5.86 0.0003
Cobalt, mg/L NWL-ICP 71 0.118 + 0.088 0.050 - 0.430 0.08 75.1 0.0002 0.0007
Chromium, mg/L NWL-ICP 80 0.303 + 0.473 0.010 - 2.100 0.105 156.0 0.0002 0.0009
Copper, mg/L NWL-ICP 80 23.84 + 39.49 0.65 - 175.47 10.91 165.7 0.021 0.091
Iron, mg/L NWL-ICP 80 103.09 + 125.01 4.17 - 513.60 46.53 121.3 0.091 0.388
Lithium, mg/L NWL-ICP 80 0.137 + 0.073 0.040 - 0.330 0.11 53.7 0.0002 0.0009
Manganese, mg/L NWL-ICP 80 16.72 + 26.80 0.22 - 118.00 6.21 160.3 0.012 0.052
Molybdenum, mg/L NWL-ICP 80 0.236 + 0.267 0.010 - 1.230 0.17 113.0 0.0003 0.001

19
Nickel, mg/L NWL-ICP 80 0.534 + 0.667 0.090 - 3.190 0.36 124.9 0.0007 0.003
Lead, mg/L NWL-ICP 31 0.214 + 0.063 0.040 - 0.350 0.2 29.6 0.0004 0.002
Silicon, mg/L NWL-ICP 80 146.2 + 92.9 33.4 - 442.3 120.2 63.5 0.235 1.00
Tin, mg/L NWL-ICP 23 0.574 + 0.364 0.210 - 1.360 0.42 63.3 0.0008 0.004
Strontium, mg/L NWL-ICP 80 1.845 + 2.525 0.160 - 11.560 0.89 136.9 0.002 0.007
Vanadium, mg/L NWL-ICP 49 0.684 + 0.745 0.030 - 2.910 0.5 108.8 0.0010 0.004
Zinc, mg/L NWL-ICP 80 75.48 + 129.43 2.300 - 590.3 27.85 171.5 0.055 0.232
Zirconium, mg/L NWL-ICP 80 0.086 + 0.083 0.010 - 0.360 0.05 96.5 9.84 0.0004
* Coefficient of variation = (standard deviation/mean) * 100 Moisture, conductivity and nutrient data from Malley, Martin, and Woods (2001)

20
Fig. 2. Loadings plot for moisture, metals and minor nutrients in 80 samples of hog manure collected in fall 2000 on the first two principal components explaining the variance in constituent concentrations. Fig. 3. Scores plot for the 80 samples of hog manure collected in fall 2000 on the first two principal components explaining the variance in constituent concentrations.
-0.4
-0.2
0
0.2
0.4
0.6
-0.3 -0.2 -0.1 0 0.1 0.2 0.3 mdmetalcons, X-expl: 73%,8%
%moistureAl
B
BaBeCa
Cd
Co
Cr
CuFe
K Li
MgMn
Mo
Na
NiP
Pb
S
Si
Sn
SrV Zn
Zr
PC1
PC2 X-loadings
-4
-2
0
2
4
-5 0 5 10 15 20 mdmetalcons, X-expl: 73%,8%
PC1
PC2 Scores

21
Table 4. Correlation, r, matrix among the nutrients, minor elements, and metals in 80 of the 121 samples of hog manure collected in fall 2000.
Moisture
Dry matter pH Cond Density NH4-N TDN
Susp N
Total N
Moisture 1.000 Dry matter -1.000 1.000 pH 0.760 -0.760 1.000 Cond -0.164 0.164 -0.028 1.000 Density -0.284 0.284 -0.384 0.384 1.000 NH4-N -0.791 0.791 -0.488 0.749 0.411 1.000 TDN -0.781 0.781 -0.478 0.759 0.397 0.998 1.000 Susp N -0.960 0.960 -0.690 0.158 0.296 0.763 0.746 1.000 Total N -0.904 0.904 -0.600 0.555 0.381 0.965 0.960 0.904 1.000 SRP -0.949 0.949 -0.643 0.236 0.249 0.811 0.798 0.980 0.928 TDP -0.950 0.950 -0.643 0.243 0.258 0.814 0.803 0.978 0.930 Susp P -0.939 0.939 -0.608 0.109 0.342 0.705 0.685 0.973 0.853 Total P -0.955 0.955 -0.638 0.187 0.300 0.778 0.763 0.992 0.911 Susp C -0.951 0.951 -0.701 0.105 0.175 0.728 0.714 0.984 0.876 Al -0.854 0.854 -0.575 0.145 0.287 0.705 0.687 0.900 0.819 B -0.705 0.705 -0.550 0.203 0.157 0.621 0.621 0.689 0.686 Ba -0.892 0.892 -0.550 0.135 0.304 0.725 0.705 0.922 0.840 Be -0.784 0.784 -0.413 0.136 -0.002 0.702 0.692 0.874 0.811 Ca -0.958 0.958 -0.661 0.101 0.102 0.768 0.755 0.984 0.898 Cd -0.923 0.923 -0.601 0.139 0.076 0.780 0.765 0.981 0.903 Co -0.165 0.165 0.013 0.567 0.275 0.526 0.526 0.252 0.484 Cr -0.903 0.903 -0.549 0.121 0.058 0.764 0.749 0.972 0.889 Cu -0.916 0.916 -0.725 0.164 0.009 0.786 0.777 0.943 0.894 Fe -0.900 0.900 -0.581 0.157 0.245 0.756 0.738 0.950 0.873 K -0.426 0.426 -0.214 0.878 0.159 0.851 0.864 0.417 0.719 Li -0.721 0.721 -0.670 0.242 0.485 0.621 0.610 0.682 0.677 Mg -0.988 0.988 -0.738 0.109 0.279 0.761 0.747 0.973 0.888 Mn -0.939 0.939 -0.656 0.151 0.057 0.788 0.778 0.973 0.908 Mo -0.837 0.837 -0.538 0.269 0.082 0.814 0.803 0.925 0.902 Na -0.378 0.378 -0.366 0.673 0.505 0.639 0.636 0.337 0.543 Ni -0.897 0.897 -0.578 0.171 -0.002 0.793 0.782 0.961 0.905 P -0.975 0.975 -0.665 0.188 0.250 0.814 0.801 0.980 0.925 Pb 0.262 -0.262 0.254 -0.147 -0.221 -0.173 -0.180 -0.333 -0.215 S -0.805 0.805 -0.695 0.479 0.348 0.859 0.855 0.802 0.881 Si -0.530 0.530 -0.405 0.196 0.668 0.439 0.421 0.517 0.487 Sn -0.765 0.765 -0.505 0.051 -0.630 0.868 0.856 0.929 0.901 Sr -0.974 0.974 -0.751 0.120 0.114 0.780 0.769 0.978 0.904 V -0.849 0.849 -0.464 -0.063 -0.270 0.735 0.717 0.948 0.873 Zn -0.912 0.912 -0.587 0.085 -0.011 0.750 0.737 0.972 0.882 Zr -0.925 0.925 -0.657 0.152 0.278 0.760 0.743 0.960 0.880

22
Table 4. cont'd.
SRP TDP
Susp P
Total P Susp C Al B Ba Be
SRP 1.000 TDP 0.999 1.000 Susp P 0.938 0.935 1.000 Total P 0.988 0.987 0.980 1.000 Susp C 0.978 0.976 0.935 0.973 1.000 Al 0.875 0.875 0.904 0.897 0.861 1.000 B 0.685 0.684 0.679 0.689 0.684 0.652 1.000 Ba 0.883 0.883 0.961 0.926 0.871 0.912 0.664 1.000 Be 0.871 0.870 0.892 0.889 0.856 0.830 0.586 0.853 1.000 Ca 0.972 0.971 0.981 0.986 0.979 0.876 0.688 0.933 0.872 Cd 0.975 0.974 0.973 0.984 0.970 0.908 0.668 0.929 0.897 Co 0.351 0.340 0.199 0.282 0.192 0.413 0.203 0.252 0.356 Cr 0.960 0.959 0.978 0.978 0.956 0.909 0.671 0.945 0.924 Cu 0.958 0.956 0.880 0.933 0.965 0.832 0.679 0.783 0.797 Fe 0.928 0.927 0.961 0.952 0.913 0.981 0.666 0.962 0.884 K 0.498 0.501 0.357 0.444 0.409 0.355 0.416 0.330 0.410 Li 0.672 0.676 0.648 0.671 0.656 0.795 0.503 0.641 0.520 Mg 0.951 0.951 0.965 0.967 0.955 0.886 0.701 0.935 0.812 Mn 0.974 0.971 0.951 0.973 0.975 0.873 0.706 0.892 0.873 Mo 0.929 0.928 0.910 0.930 0.906 0.881 0.612 0.861 0.895 Na 0.366 0.371 0.280 0.336 0.297 0.488 0.324 0.313 0.260 Ni 0.970 0.968 0.947 0.969 0.961 0.890 0.687 0.893 0.896 P 0.970 0.970 0.978 0.984 0.958 0.890 0.699 0.952 0.858 Pb -0.151 -0.152 -0.230 -0.199 -0.305 -0.298 -0.087 -0.187 -0.019 S 0.817 0.817 0.765 0.803 0.780 0.708 0.575 0.713 0.684 Si 0.473 0.476 0.542 0.510 0.432 0.799 0.416 0.634 0.441 Sn 0.898 0.897 0.947 0.928 0.900 0.934 0.646 0.870 0.926 Sr 0.969 0.969 0.951 0.971 0.985 0.856 0.705 0.884 0.824 V 0.925 0.922 0.952 0.948 0.921 0.929 0.769 0.930 0.915 Zn 0.968 0.966 0.968 0.977 0.973 0.851 0.654 0.905 0.905 Zr 0.929 0.928 0.968 0.955 0.922 0.939 0.658 0.958 0.869

23
Table 4. cont'd.
Ca Cd Co Cr Cu Fe K Li Mg Ca 1.000 Cd 0.978 1.000 Co 0.129 0.381 1.000 Cr 0.975 0.989 0.335 1.000 Cu 0.917 0.923 0.381 0.893 1.000 Fe 0.940 0.961 0.372 0.965 0.862 1.000 K 0.401 0.419 0.472 0.412 0.462 0.390 1.000 Li 0.654 0.645 0.237 0.610 0.674 0.742 0.378 1.000 Mg 0.972 0.943 0.156 0.930 0.908 0.933 0.360 0.721 1.000 Mn 0.967 0.973 0.522 0.961 0.956 0.923 0.434 0.625 0.948 Mo 0.895 0.953 0.625 0.945 0.884 0.925 0.510 0.600 0.852 Na 0.286 0.311 0.405 0.279 0.383 0.423 0.644 0.724 0.342 Ni 0.968 0.977 0.388 0.979 0.926 0.939 0.490 0.637 0.911 P 0.983 0.966 0.245 0.960 0.903 0.949 0.444 0.692 0.988 Pb -0.395 -0.320 -0.178 -0.142 -0.291 -0.310 -0.124 -0.216 -0.242 S 0.772 0.786 0.458 0.748 0.776 0.755 0.631 0.657 0.786 Si 0.467 0.505 0.379 0.503 0.421 0.705 0.188 0.796 0.566 Sn 0.924 0.945 -0.294 0.960 0.826 0.970 0.836 0.571 0.835 Sr 0.985 0.953 0.134 0.938 0.952 0.909 0.421 0.696 0.975 V 0.936 0.968 0.255 0.984 0.867 0.978 0.329 0.504 0.892 Zn 0.985 0.983 0.167 0.985 0.910 0.925 0.405 0.574 0.930 Zr 0.943 0.956 0.398 0.949 0.871 0.971 0.364 0.714 0.956
Table 4. cont'd.
Mn Mo Na Ni P Pb S Si Sn Mn 1.000 Mo 0.929 1.000 Na 0.293 0.376 1.000 Ni 0.959 0.930 0.336 1.000 P 0.959 0.895 0.358 0.940 1.000 Pb -0.316 -0.382 -0.086 -0.262 -0.212 1.000 S 0.797 0.837 0.535 0.761 0.813 -0.281 1.000 Si 0.450 0.517 0.632 0.462 0.547 -0.285 0.485 1.000 Sn 0.864 0.888 0.387 0.942 0.884 ERR 0.721 0.062 1.000 Sr 0.967 0.867 0.336 0.947 0.969 -0.328 0.794 0.455 0.877 V 0.940 0.938 0.073 0.958 0.926 -0.459 0.666 0.387 0.954 Zn 0.963 0.923 0.225 0.979 0.955 -0.287 0.757 0.395 0.934 Zr 0.942 0.919 0.366 0.913 0.962 -0.289 0.810 0.650 0.941
Table 4. cont'd.
Sr V Zn Zr Sr 1.000 V 0.895 1.000 Zn 0.958 0.945 1.000 Zr 0.924 0.955 0.920 1.000

24
NIR Prediction of Minor Elements and Metals in Hog Manure
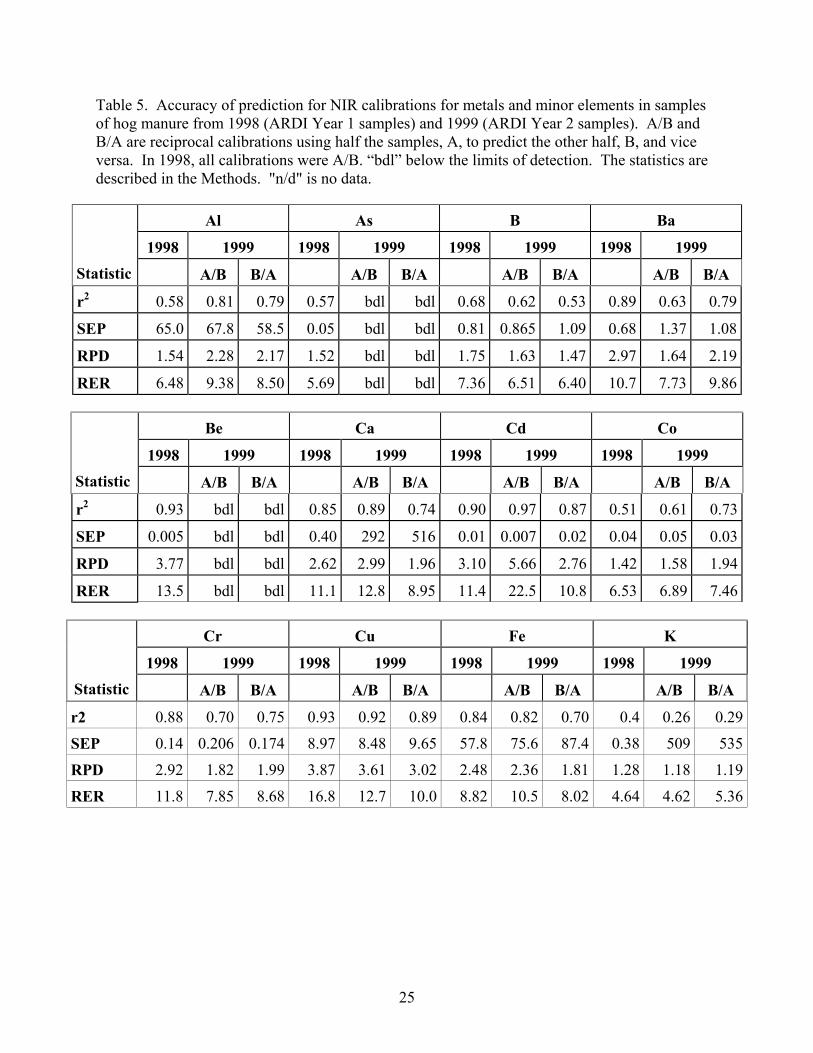
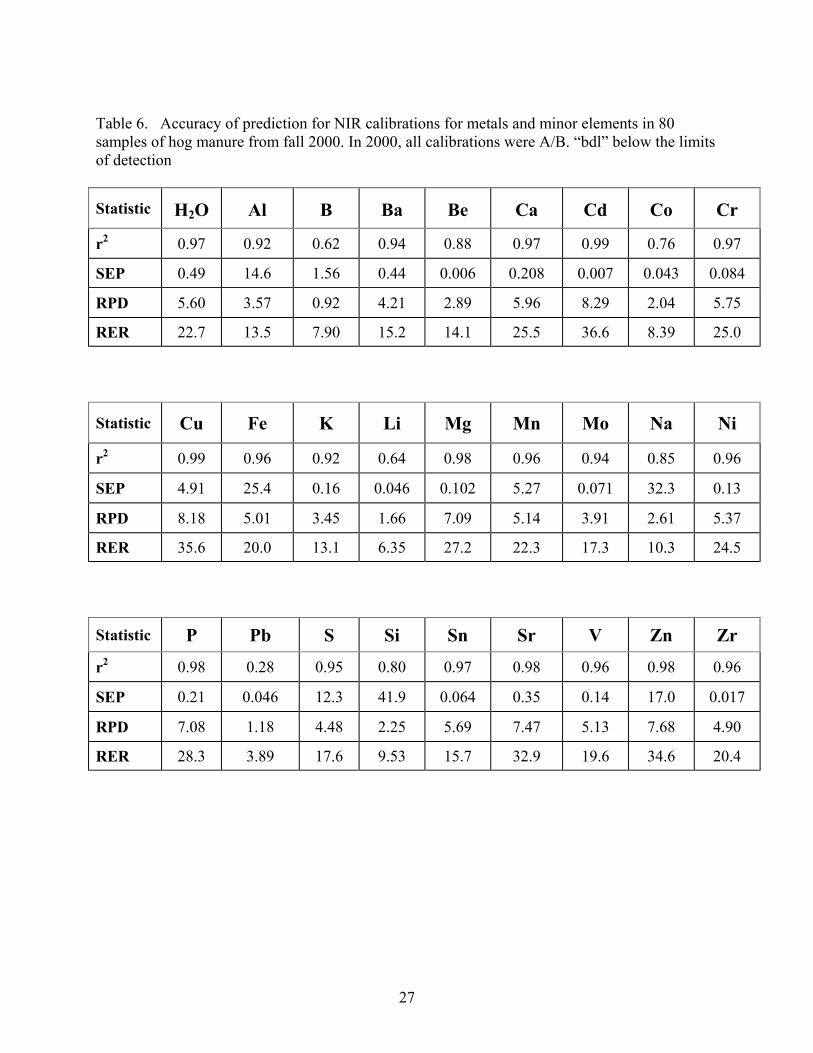
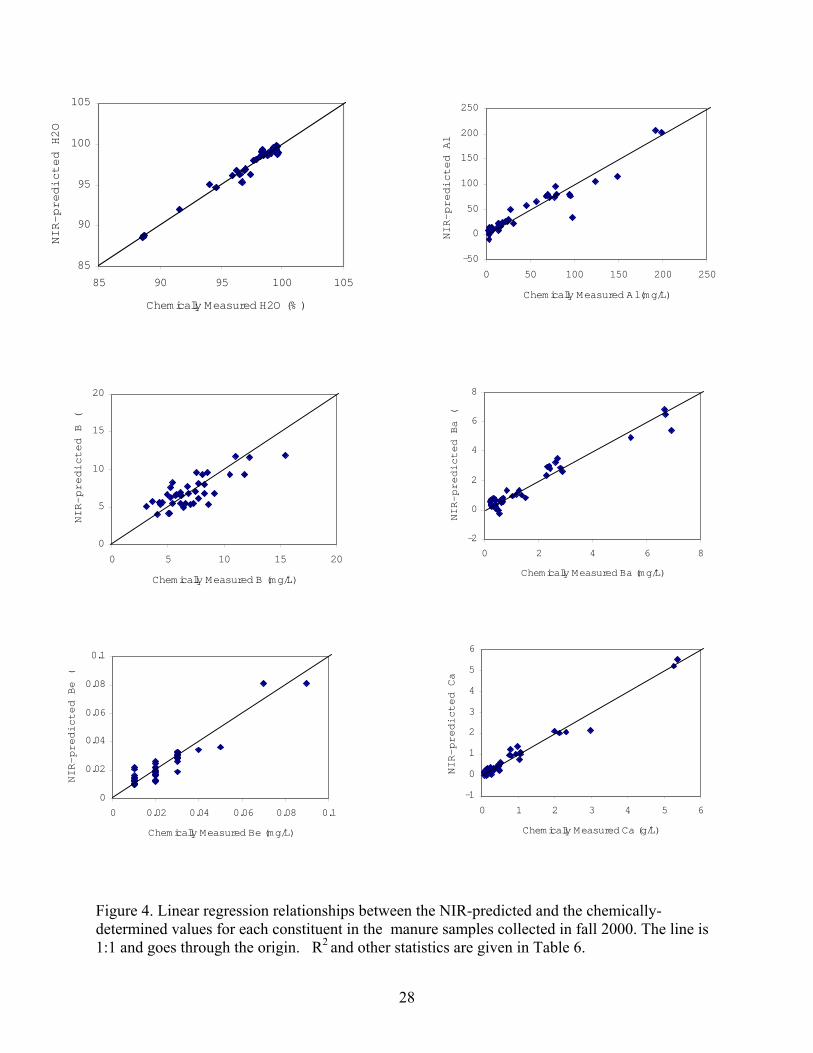
An excellent calibration was developed for moisture in the fall 2000 samples. It predicted moisture to within 0.5 % with r2 = 0.97 and RPD = 5.6 (Table 6; Fig. 4). Cadmium and Cu were predicted successfully across the three sets of samples, ARDI 1998, ARDI 1999, and fall 2000, with r2 generally >0.9 and RPD >3.0 (Tables 5,6). Moderately successful calibrations (r2 generally >0.8 and RPD >2.25) were achieved across the three sets for Ca, Fe, Mg, Mn, Mo, S, and Sn (Tables 5,6). The following elements were predicted successfully or moderately successfully in two of the three years, or only had two years of data, Al, Ba, Be, Cr, Ni, Se, Sr and Ti. Several elements showed inconsistent response across the sets, including Co, K, Na, Pb, Si, V, and Zn. Several elements were not predictable in any of the three sets, including B and Li. There was only one year of data for As (not successful), Zr (successful). Figure 4 shows the calibration results for the year 2000 samples graphically. The distribution of concentrations for a number of constituents is not continuous, due to the several samples with high particulate content, producing a "dumbbell". Nevertheless, the figures show that for the successful calibrations the medium and low values fit the line; statistical success was not due primarily to the large range.
25
Table 5. Accuracy of prediction for NIR calibrations for metals and minor elements in samples of hog manure from 1998 (ARDI Year 1 samples) and 1999 (ARDI Year 2 samples). A/B and B/A are reciprocal calibrations using half the samples, A, to predict the other half, B, and vice versa. In 1998, all calibrations were A/B. “bdl” below the limits of detection. The statistics are described in the Methods. "n/d" is no data.
Al As B Ba
1998 1999 1998 1999 1998 1999 1998 1999 Statistic A/B B/A A/B B/A A/B B/A A/B B/A
r2 0.58 0.81 0.79 0.57 bdl bdl 0.68 0.62 0.53 0.89 0.63 0.79
SEP 65.0 67.8 58.5 0.05 bdl bdl 0.81 0.865 1.09 0.68 1.37 1.08
RPD 1.54 2.28 2.17 1.52 bdl bdl 1.75 1.63 1.47 2.97 1.64 2.19
RER 6.48 9.38 8.50 5.69 bdl bdl 7.36 6.51 6.40 10.7 7.73 9.86
Be Ca Cd Co
1998 1999 1998 1999 1998 1999 1998 1999 Statistic A/B B/A A/B B/A A/B B/A A/B B/A
r2 0.93 bdl bdl 0.85 0.89 0.74 0.90 0.97 0.87 0.51 0.61 0.73
SEP 0.005 bdl bdl 0.40 292 516 0.01 0.007 0.02 0.04 0.05 0.03
RPD 3.77 bdl bdl 2.62 2.99 1.96 3.10 5.66 2.76 1.42 1.58 1.94
RER 13.5 bdl bdl 11.1 12.8 8.95 11.4 22.5 10.8 6.53 6.89 7.46
Cr Cu Fe K
1998 1999 1998 1999 1998 1999 1998 1999 Statistic A/B B/A A/B B/A A/B B/A A/B B/A
r2 0.88 0.70 0.75 0.93 0.92 0.89 0.84 0.82 0.70 0.4 0.26 0.29
SEP 0.14 0.206 0.174 8.97 8.48 9.65 57.8 75.6 87.4 0.38 509 535
RPD 2.92 1.82 1.99 3.87 3.61 3.02 2.48 2.36 1.81 1.28 1.18 1.19
RER 11.8 7.85 8.68 16.8 12.7 10.0 8.82 10.5 8.02 4.64 4.62 5.36

26
Li Mg Mn Mo
1998 1999 1998 1999 1998 1999 1998 1999 Statistic A/B B/A A/B B/A A/B B/A A/B B/A
r2 0.54 0.63 0.59 0.82 0.74 0.86 0.83 0.83 0.61 0.84 0.85 0.87
SEP 0.09 0.14 0.141 0.26 271 216 8.73 7.30 16.1 0.12 0.116 0.117
RPD 1.48 1.64 1.57 2.33 1.95 2.68 2.40 2.42 1.60 2.49 2.54 2.73
RER 5.92 6.91 6.48 9.83 7.04 10.8 10.1 9.90 8.30 9.27 8.64 10.6
Na Ni Pb S
1998 1999 1998 1999 1998 1999 1998 1999 Statistic A/B B/A A/B B/A A/B B/A A/B B/A
r2 0.33 0.40 0.41 0.84 0.55 0.66 0.73 0.92 0.74 0.86 0.77 0.87
SEP 0.21 159 163 0.15 0.24 0.225 0.06 0.03 0.05 69.7 91.4 70.9
RPD 1.22 1.29 1.3 2.48 1.49 1.72 1.93 3.44 1.97 2.63 2.08 2.8
RER 5.87 5.39 5.44 11.6 5.72 6.13 6.72 14.4 8.72 9.79 8.08 10.7
Se Si Sn Sr
1998 1999 1998 1999 1998 1999 1998 1999 Statistic A/B B/A A/B B/A A/B B/A A/B B/A
r2 0.80 0.73 0.81 0.67 0.13 0.109 0.92 0.82 0.85 0.83 0.78 0.73
SEP 0.08 0.06 0.06 136 10.2 11.2 0.11 0.03 0.03 0.80 0.85 1.15
RPD 2.18 1.93 2.29 1.75 1.07 1.06 3.52 2.35 2.55 2.43 2.15 1.95
RER 8.94 7.63 9.02 7.45 3.95 4.55 11.7 7.28 7.84 10.4 7.44 9.10
Ti V Zn
1998 1999 1998 1999 1998 1999 Statistic A/B B/A A/B B/A A/B B/A
r2 0.84 0.77 0.84 0.84 0.76 n/d 0.80 0.68 n/d
SEP 1.28 1.18 1.11 0.26 0.31 n/d 34.6 28.7 n/d
RPD 2.5 2.08 2.50 2.48 2.04 n/d 2.25 1.77 n/d
RER 6.72 7.53 9.69 7.33 8.86 n/d 9.73 8.27 n/d
27
Table 6. Accuracy of prediction for NIR calibrations for metals and minor elements in 80 samples of hog manure from fall 2000. In 2000, all calibrations were A/B. “bdl” below the limits of detection
Statistic H2O Al B Ba Be Ca Cd Co Cr
r2 0.97 0.92 0.62 0.94 0.88 0.97 0.99 0.76 0.97
SEP 0.49 14.6 1.56 0.44 0.006 0.208 0.007 0.043 0.084
RPD 5.60 3.57 0.92 4.21 2.89 5.96 8.29 2.04 5.75
RER 22.7 13.5 7.90 15.2 14.1 25.5 36.6 8.39 25.0
Statistic Cu Fe K Li Mg Mn Mo Na Ni
r2 0.99 0.96 0.92 0.64 0.98 0.96 0.94 0.85 0.96
SEP 4.91 25.4 0.16 0.046 0.102 5.27 0.071 32.3 0.13
RPD 8.18 5.01 3.45 1.66 7.09 5.14 3.91 2.61 5.37
RER 35.6 20.0 13.1 6.35 27.2 22.3 17.3 10.3 24.5
Statistic P Pb S Si Sn Sr V Zn Zr
r2 0.98 0.28 0.95 0.80 0.97 0.98 0.96 0.98 0.96
SEP 0.21 0.046 12.3 41.9 0.064 0.35 0.14 17.0 0.017
RPD 7.08 1.18 4.48 2.25 5.69 7.47 5.13 7.68 4.90
RER 28.3 3.89 17.6 9.53 15.7 32.9 19.6 34.6 20.4
28
Figure 4. Linear regression relationships between the NIR-predicted and the chemically-determined values for each constituent in the manure samples collected in fall 2000. The line is 1:1 and goes through the origin. R2 and other statistics are given in Table 6.
85
90
95
100
105
85 90 95 100 105
Chemically Measured H2O (% )
NIR-predicted H2O
-50
0
50
100
150
200
250
0 50 100 150 200 250
Chemically Measured Al (mg/L)
NIR-predicted Al
0
5
10
15
20
0 5 10 15 20
Chemically Measured B (mg/L)
NIR-predicted B (
-2
0
2
4
6
8
0 2 4 6 8
Chemically Measured Ba (mg/L)
NIR-predicted Ba (
0
0.02
0.04
0.06
0.08
0.1
0 0.02 0.04 0.06 0.08 0.1
Chemically Measured Be (mg/L)
NIR-predicted Be (
-1
0
1
2
3
4
5
6
0 1 2 3 4 5 6
Chemically Measured Ca (g/L)
NIR-predicted Ca

29
Figure 4 con’t.
0
0.1
0.2
0.3
0.4
0.5
0 0.1 0.2 0.3 0.4 0.5
Chemically Measured Co (mg/L)
NIR-predicted Co (
-0.5
0
0.5
1
1.5
2
2.5
0 0.5 1 1.5 2 2.5
Chemically Measured Cr (mg/L)
NIR-predicted Cr (
-150
0
150
300
450
600
0 200 400 600
Chemically Measured Fe (mg/L)
NIR-predicted Fe
0
0.1
0.2
0.3
0 0.1 0.2 0.3Chemically Measured Cd (mg/L)
NIR
-Pre
dict
ed C
d (m
g/L)
-50
0
50
100
150
200
0 50 100 150 200
Chemically Measured Cu (mg/L)
NIR-predicted Cu (
0
1
2
3
0 1 2 3
Chemically Measured K (g/L)
NIR-predicted K

30
Fig. 4. con't
0
0.1
0.2
0.3
0.4
0 0.1 0.2 0.3 0.4
Chemically Measured Li (mg/L)
NIR-predicted Li
-1
0
1
2
3
0 1 2 3
Chemically Measured Mg (g/L)
NIR-predicted Mg
-25
0
25
50
75
100
125
0 25 50 75 100 125
Chemically Measured Mn (mg/L)
NIR-predicted Mn (
-0.3
0
0.3
0.6
0.9
1.2
1.5
0 0.3 0.6 0.9 1.2 1.5
Chemically Measured M (g mg/L)
NIR-predicted Mo (
100
300
500
700
100 300 500 700
Chemically Measured Na (mg/L)
NIR-predicted Na (
0
1
2
3
4
0 1 2 3 4
Chemically Measured Ni (mg/L)
NIR-predicted Ni

31
Figure 4 con’t.
-2
0
2
4
6
8
0 2 4 6 8
Chemically Measured P (g/L)
NIR-predicted P
0
0.1
0.2
0.3
0.4
0 0.1 0.2 0.3 0.4
Chemically Measured Pb (mg/L)
NIR-predicted Pb
0
50
100
150
200
250
0 50 100 150 200 250
Chemically Measured S (mg/L)
NIR-predicted S (
0
3
6
9
12
0 3 6 9 12
Chemically Measured Sr (mg/L)
NIR-predicted Sr
0
100
200
300
400
500
0 100 200 300 400 500
Chemically Measured Si (mg/L)
NIR-predicted Si
0
0.4
0.8
1.2
1.6
0 0.4 0.8 1.2 1.6
Chemically Measured Sn (mg/L)
NIR-predicted Sn (

32
Figure 4 con’t.
-1
0
1
2
3
4
0 1 2 3 4
Chemically Measured V (mg/L)
NIR-predicted V (
-200
0
200
400
600
800
0 200 400 600 800
Chemically Measured Zn (mg/L)
NIR-predicted Zn (
0
0.1
0.2
0.3
0.4
0 0.1 0.2 0.3 0.4
Chemically Measured Zr (mg/L)
NIR-predicted Zr
33
Discussion
In the context of this study that evaluated the performance of two field-portable NIR instruments for the analysis of metals and minor elements in hog manure, the use of the NIRSystems model 6500 provided a baseline instrument of wide wavelength range (400 - 2500 nm), and well-known performance history. The 6500 is the most commonly used bench-top NIR instrument and has been in use for about 15 years. Calibrations produced using the 6500 can be used for the rapid, low-cost analysis of hog manure samples in the laboratory.
Based on repeatable results for the 6500 across three independent sets of samples, this
study demonstrated the feasibility of estimating a number metals and minor elements in hog manure with NIRS. Once suitable calibrations have been developed, these elements in manure samples can be predicted in the laboratory simultaneously with the macro-nutrients with little additional cost.
Moisture was predicted very successfully. Based on calibrations for the three years of
data, successful calibrations were developed for Cu and Cd. Moderately successful calibrations were developed for Ca, Fe, Mg, Mn, Mo, S, and Sn. Based on two of three sets, the elements Al, Ba, Be, Cr, Ni, Se, Sr and Ti were predicted successfully or moderately successfully. Calibrations were inconsistent for Co, K, Na, Pb, Si, V, and Zn. Of these elements, S is the most important as a nutrient. The metals Cu, Cr, and Zn are important as micro-nutrients. When they are in high concentrations in the manure and at risk of accumulating in soil, Cd, Cu, Cr, Pb, and Zn are important as potentially-toxic metals. The most important elements that were found not reliably predicable by NIRS were K and B.
Calibrations developed for the year 2000 samples tended to be more successful than those for the two ARDI sets. This may be related to the lesser heterogeneity among samples in year 2000. The 80 samples in 2000 represented 13 manure stores, in contrast to 25 stores represented in ARDI 1998 samples and at least that many in the ARDI 1999 samples. Experience with the determination of nutrients in hog manure by NIRS suggests that calibration success appears to vary inversely with sample heterogeneity (Malley and Vandenbyllaardt 1999).
Further analysis of the data is required to test the robustness of calibrations by predicting
constituents in each set of samples with calibrations developed on the other sets of samples. It is expected that the calibrations based on more heterogeneous sample sets may be more robust, i.e., better predict new sample sets. Ultimately, the sample sets from the three years will be pooled and the calibrations updated. With a set of over 300 samples, it will be possible to explore if there is an improvement in calibration performance if calibrations are developed separately for different types of hog operations or manure stores. Possibly future unknown samples will be more successfully predicted if calibrations are tailored for specific groups of samples.

34
References Brookes, I.K., B.N. Gedge, and S.V. Hammon. 1996. Applications of near infrared
spectroscopy to fermentation process analysis. pp 259-271. In A.M.C. Davies and Phil Williams (Eds). Near Infrared Spectroscopy: The Future Waves. NIR Publications, Chichester U.K.
Espinoza, L.H., D. Lucas, and D. Littlejohn. 1999. Characterization of hazardous aqueous
samples by near-IR spectroscopy. Applied Spectroscopy 53: 97-102. Fitzgerald, M., and G.J. Racz. 2001. Long-term effects of hog manure on soil quality and
productivity. Volume 1: Properties and composition of hog manure samples. Final Report Prepared for Agri-Food Research and Development Initiative, Project 98-124, April, 72 pp.
Gatin, M.R., J.R. Long, J.R., P.W. Schmitt, P.J. Galley and J.F Price. 1996. Comparison of
clinical studies: near infrared predictions of multiple analytes in human sera. pp 347- 352. In A.M.C. Davies and Phil Williams (Eds). Near Infrared Spectroscopy: The Future Waves. NIR Publications, Chichester U.K.
Malley, D.F. 1999. Rapid, accurate, on-site analysis of hog manure: A possibility with near-
infrared spectroscopy. World Wise ‘99 Conference Proceedings, Winnipeg MB, 7-8 December 1999, Track 1C on CD Rom
Malley, D.F., P. Badiou, and P. Williams. 2000. Evaluation of mobile, short wave, near-infrared
spectrophotometer for hog manure analysis. Report to the Industrial Research Assistance Program, National Research Council of Canada on Project # 375093. April, 23 pp. (Confidential report)
Malley, D.F. and R.S. Currie. 1999. Feasibility study on the rapid analysis of available N and P
in hog manure and manure-amended soils by near-infrared spectroscopy. Report to The Manitoba Livestock Manure Management Initiative Inc. and The Prairie Farm Rehabilitation Administration. March, 36 pp.
Malley, D.F., R. G. Eilers, E. Rempel, M. Van Walleghem, and P.D. Martin. 1999. Rapid
analysis of nutrient and salt concentrations in hog manure by near-infrared spectroscopy. Manure Management’99 Proceedings of a tri-provincial conference on manure management. Saskatoon, SK, 22-24 June 1999, p 633-641.
Malley, D.F., P.D. Martin, and L. Dettman. 2001a. Analysis of nutrients in hog manure by field-
portable near-infrared spectroscopy: Results for the Zeiss Corona® Spectrometer. Final Report to CETAC-West, July, 17 pp
Malley, D.F., P.D. Martin, and L. Dettman. 2001b. Analysis of minor elements and metals in
hog manure by field-portable near-infrared spectroscopy: Results for the Zeiss Corona® Spectrometer. Final Report to Manitoba Livestock Manure Management Initiative Inc., July, 16 pp.

35
Malley, D.F., P.D. Martin, and T. Moffatt. 2001a. Analysis of nutrients in hog manure by field-portable near-infrared spectroscopy: Results for the Textron/Case NH ProSpectra™ Spectrometer Final Report to CETAC-West, July, 28 pp.
Malley, D.F., P.D. Martin, and T. Moffatt. 2001b. Analysis of minor elements and metals in hog
manure by field-portable near-infrared spectroscopy: Results for the Textron/Case NH ProSpectra™ Spectrometer Final Report to Manitoba Livestock Manure Management Initiative Inc., July, 17 pp.
Malley, D.F., P.D. Martin, and S.E. Woods. 2001. Analysis of nutrients in hog manure by field-
portable near-infrared spectroscopy: Development of a mobile laboratory and results for Foss NIRSystems Inc. model 6500 spectrophotometer in the laboratory. Final Report to CETAC-West, July, 33 pp.
Malley, D.F. and L. Vandenbyllaardt in collaboration with G. Racz, M. Fitzgerald, G. Plohman,
and J. Hicks. 1999. Feasibility study on the rapid compositional analysis of hog manure by near-infrared spectroscopy. Report to The Manitoba Livestock Manure Management Initiative Inc. on Project 99-01-25. August, 31 pp.
Malley, D.F. and P.C. Williams. 1997. Use of near-infrared reflectance spectroscopy in
prediction of heavy metals in freshwater sediment by their association with organic matter. Environmental Science and Technology 31: 3461-3467.
Malley, D.F., L. Yesmin, and R.G. Eilers. Determination of N, P, and salts in hog manure and
manure-amended soils using near-infrared spectroscopy. Soil Science Society of America Journal (submitted for publication).
Millmier, A., J. Lorimor, C. Hurburgh Jr., C. Fulhage, J. Hattey, and H. Zhang. 2000. Near-
infrared sensing of manure nutrients. Transactions of the ASAE 43:903-908. Prairie Swine Centre Inc. undated. Impact of Land Application of Swine Manure on Soil, Water
and Human Health. Factsheet, 8 pp. (http://adminsrv.usask.ca/psci/manure.htm) Wust, E, A. Fehrman, A. Hoffman and L. Rubzik. 1996. In-line measurement of high moisture
products. pp 268-271. In A.M.C. Davies and Phil Williams (Eds). Near Infrared Spectroscopy: The Future Waves. NIR Publications, Chichester U.K