analysis of long-term observations of nox and co in
TRANSCRIPT

HAL Id: insu-01371221https://hal-insu.archives-ouvertes.fr/insu-01371221
Submitted on 19 Jul 2020
HAL is a multi-disciplinary open accessarchive for the deposit and dissemination of sci-entific research documents, whether they are pub-lished or not. The documents may come fromteaching and research institutions in France orabroad, or from public or private research centers.
L’archive ouverte pluridisciplinaire HAL, estdestinée au dépôt et à la diffusion de documentsscientifiques de niveau recherche, publiés ou non,émanant des établissements d’enseignement et derecherche français ou étrangers, des laboratoirespublics ou privés.
Analysis of long-term observations of NOx and CO inmegacities and application to constraining emissions
inventoriesBirgit Hassler, Brian C. Mcdonald, Gregory J. Frost, Agnes Borbon, David C.Carslaw, Kevin Civerolo, Claire Granier, Paul S. Monks, Sarah Monks, David
D. Parrish, et al.
To cite this version:Birgit Hassler, Brian C. Mcdonald, Gregory J. Frost, Agnes Borbon, David C. Carslaw, et al.. Analysisof long-term observations of NOx and CO in megacities and application to constraining emissionsinventories. Geophysical Research Letters, American Geophysical Union, 2016, 43 (18), pp.9920-9930.�10.1002/2016GL069894�. �insu-01371221�

Analysis of long-term observations of NOx and COin megacities and application to constrainingemissions inventoriesBirgit Hassler1,2, Brian C. McDonald1,2, Gregory J. Frost2, Agnes Borbon3, David C. Carslaw4,Kevin Civerolo5, Claire Granier1,2,6, Paul S. Monks7, Sarah Monks1,2, David D. Parrish1,2,Ilana B. Pollack1,2,8, Karen H. Rosenlof2, Thomas B. Ryerson2, Erika von Schneidemesser9,and Michael Trainer2
1Cooperative Institute for Research in Environmental Sciences, University of Colorado Boulder, Boulder, Colorado, USA,2Earth System Research Laboratory, National Oceanic and Atmospheric Administration, Boulder, Colorado, USA, 3LaMP,OPGC, CNRS-UMR 6016, University of Blaise Pascal, Clermont-Ferrand, France, 4Wolfson Atmospheric ChemistryLaboratories, Department of Chemistry, University of York, York, United Kingdom, 5New York State Department ofEnvironmental Conservation, Division of Air Resources, Albany, New York, USA, 6LATMOS/CNRS, Paris and Laboratoired'Aerologie/CNRS, Toulouse, France, 7Department of Chemistry, University of Leicester, Leicester, United Kingdom, 8Now atDepartment of Atmospheric Science, Colorado State University, Fort Collins, Colorado, USA, 9Institute for AdvancedSustainability Studies e.V., Potsdam, Germany
Abstract Long-term atmospheric NOx/CO enhancement ratios in megacities provide evaluations ofemission inventories. A fuel-based emission inventory approach that diverges from conventional bottom-upinventory methods explains 1970–2015 trends in NOx/CO enhancement ratios in Los Angeles. Combiningthis comparison with similar measurements in other U.S. cities demonstrates that motor vehicle emissionscontrols were largely responsible for U.S. urban NOx/CO trends in the past half century. Differing NOx/COenhancement ratio trends inU.S. and European cities over the past 25 years highlights alternative strategies formitigating transportation emissions, reflecting Europe's increased use of light-duty diesel vehicles andcorrespondingly slower decreases in NOx emissions compared to the U.S. A global inventory widely usedby global chemistry models fails to capture these long-term trends and regional differences in U.S. andEurope megacity NOx/CO enhancement ratios, possibly contributing to these models' inability to accuratelyreproduce observed long-term changes in tropospheric ozone.
1. Introduction
Accurate knowledge of the sources and sinks of tropospheric ozone is important for understanding its effectson human health, air quality, and climate [Monks et al., 2015]. Tropospheric ozone is produced through atmo-spheric photochemical oxidation of carbon monoxide (CO) and volatile organic compounds (VOCs) in thepresence of nitrogen oxides (NOx =NO+NO2) and is also modulated by stratospheric influx. “Bottom-up”inventories of these ozone precursors provide spatially and temporally resolved emissions from all relevantsource sectors and are critical input to atmospheric model simulations.
Global chemistry models (GCMs) are used in the Intergovernmental Panel on Climate Change AssessmentReports [Intergovernmental Panel on Climate Change, 2013] to understand the past atmospheric state andpredict its future based on historical emissions trends and projected emissions scenarios, with the goal ofproviding guidance to policy makers. Multidecadal GCM simulations of tropospheric ozone have been usedto assess model fidelity over historical time periods withmeasurement-based constraints. For example, over adozen GCMs were run for the past several decades within the Atmospheric Chemistry and Climate ModelIntercomparison Project (ACCMIP, http://www.giss.nasa.gov/projects/accmip/) and the Chemistry-ClimateModel Initiative (CCMI, http://www.igacproject.org/CCMI) [Lamarque et al., 2010; Eyring et al., 2013].Comparisons with long-term ozone measurements show that these CCMs overestimate ozone mixing ratiosand underestimate long-term ozone trends at Northern Hemisphere (NH) midlatitudes, where the effect ofanthropogenic emissions on ozone is expected to be largest [Logan et al., 2012; Parrish et al., 2014]. The lati-tudinal distributions of NH ozone concentrations are also not well simulated by these models [Young et al.,2013; Cooper et al., 2014; Parrish et al., 2014]. While the GCMs in these exercises had different representations
HASSLER ET AL. MEGACITIES OBSERVATIONS AND INVENTORIES 9920
PUBLICATIONSGeophysical Research Letters
RESEARCH LETTER10.1002/2016GL069894
Key Points:• Measured NOx/CO enhancement ratiotrends are compared to inventoryemissions ratio trends in megacities
• Chemistry-climate modelinginventory fails to capture NOx/COemission ratio trends and regionaldifferences
• Observations demonstrate divergentpaths in motor vehicle emissioncontrol strategies in the U.S. versusEurope
Supporting Information:• Supporting Information S1
Correspondence to:B. Hassler,[email protected]
Citation:Hassler, B., et al. (2016), Analysis oflong-term observations of NOx and COin megacities and application toconstraining emissions inventories,Geophys. Res. Lett., 43, 9920–9930,doi:10.1002/2016GL069894.
Received 8 JUN 2016Accepted 29 AUG 2016Published online 22 SEP 2016
©2016. American Geophysical Union.All Rights Reserved.

of transport and chemistry with their own uncertainties, all the models used the related inventories ACCMIPand MACCity [Lamarque et al., 2010; Granier et al., 2011] to prescribe the long-term evolution of emissions.Inaccuracies in these inventories thus represent a potential source of error common to long-termchemistry-climate simulations of tropospheric ozone and its impact on radiative forcing.
Methods for constructing bottom-up inventories are complex and continuously evolving, resulting in uncer-tainties that are difficult to quantify. Atmospheric observations can provide an objective evaluation of inven-tory emissions fluxes, spatial and temporal variability, and source sector partitioning. For example, observedatmospheric enhancement ratios of coemitted species above a local background can be directly compared tothe corresponding emissions ratio in an inventory [Parrish et al., 2002; Parrish, 2006; Pollack et al., 2013].Enhancement ratios are conserved at spatial and temporal scales appropriate to urban area sampling andare independent of atmospheric dilution into background air. Similarly, the fuel-based inventory approach[Singer and Harley, 1996] offers advantages over conventional bottom-up inventory methods by using road-way measurements of emissions factors of real-world vehicle fleets and fuel sales data to derive emissions formobile sources. The fuel-based approach can improve emission estimates and, when used as input to chemi-cal transport models, has been demonstrated to produce more realistic modeled ozone concentrations com-pared to conventional approaches [Harley et al., 1997; Kim et al., 2016].
In order to monitor progress toward air quality regulatory targets, long-term accurate measurements of NO,NO2, and CO have been made for decades in several world megacities, including the Los Angeles (LA) Basinand New York City (NYC), USA; London, United Kingdom (UK); and Paris, France [von Schneidemesser et al.,2010; Parrish et al., 2011; Pollack et al., 2013]. Long-term accurate VOC measurements are sparser than thoseof NOx and CO. However, CO and VOC concentrations are highly correlated in megacities where motor vehi-cle emissions dominate [Parrish et al., 2009;Warneke et al., 2012; von Schneidemesser et al., 2010; Borbon et al.,2013], allowing urban VOC levels to be estimated from their enhancement ratios relative to CO.
In this work, we compare ambient NOx/CO enhancement ratios and NOx/CO emission trends in U.S. andEuropean cities. We find that a long-term fuel-based inventory can account for the drivers of multidecadalurbanNOx andCOemissions changes.We evaluate theMACCity global inventory against the long-termobser-vations and the fuel-based inventory and explore causes forMACCity's inability to reproducemeasured trends.Our study demonstrates that air quality monitoring can be used to assess the ability of global inventoriesto capture the long-term evolution and regional differences in emissions that impact ozone climate forcing.
2. Data and Methods2.1. Ambient Measurements
The long-term evolution of the LA Basin's air pollution and emissions has been studied in detail [McDonald et al.,2012, 2013, 2015;Warneke et al., 2012; Pollack et al., 2013]. Pollack et al. [2013] (referred to as “POL13” hereafter)analyzed observations dating back to 1960 from ambient monitors maintained by the California Air ResourcesBoard (CARB), intensive field research campaigns employing ground-based and aircraft sampling, and roadsideremote sensing combined with vehicle identification. We adopted the same LA Basin spatial extent as POL13(Table S1 in the supporting information) and used their reported 1965–2010 NOx/CO enhancement ratios.We supplemented POL13's analysis with eight additional CARB stations (Figure S1 and Table S1) and extendedthe CARB data record through 2015. Most CARB monitors used here were chosen due to their location nearbusy roadways and thus their representativeness of motor vehicle emissions.
Following POL13, Parrish et al. [2002], and Parrish [2006], we derived NOx/CO enhancement ratios from theslope of the correlation between observed NOx and CO mixing ratios determined by a bivariate least squareslinear regression (e.g., see Figure S2). Like POL13, we considered only CARB measurements taken during theweekday (Monday–Friday) morning rush hour (0500–0900 local time), to capture mostly fresh vehicle emis-sions and to minimize potential instrument artifacts from reactive nitrogen species other than NO or NO2. Forconsistency with POL13, CARB data were filtered for the May–September peak ozone production season[Parrish et al., 2011]. For each CARB monitor, we included in our analysis only years when at least two thirdsof the possible number of hourly data during weekday morning rush hours between May and Septemberwere available and for which r2 ≥ 0.5, where r is the correlation coefficient between hourly mixing ratios ofNOx and CO. Restricting our analysis to well-correlated enhancement ratio data helps to ensure that ambientNOx and CO originates from the same emission source, i.e., mainly motor vehicles.
Geophysical Research Letters 10.1002/2016GL069894
HASSLER ET AL. MEGACITIES OBSERVATIONS AND INVENTORIES 9921

CO and NOx mixing ratios from air quality monitoring and intensive field campaigns conducted in sevenother U.S. cities were also considered in our analysis. Detailed explanation of observational data collectionand processing in these cities is provided in the supporting information (Text S1).
Hourly measured mixing ratios of CO, NO, and NO2 for 1989–2015 (Figure S4 and Table S1) were obtainedfrom the UK National Air Quality Archive for 17 stations in London [Dollard et al., 2007; von Schneidemesseret al., 2010; Derwent et al., 2014]. Remote sensing NOx and CO emission measurements of almost 70,000 vehi-cles are available from a system deployed at four locations in London in 2012 [Carslaw and Rhys-Tyler, 2013],identical to the system employed in the U.S. by Bishop and Stedman [2008]. Hourly measured mixing ratios forCO, NO, and NO2 for 1995–2014 were obtained from Paris' AIRPARIF air quality network for five traffic sites(Table S1 and Figure S5) [Parrish et al., 2009]. Ambient enhancement ratios are calculated from the hourlyLondon and Paris monitoring data following the same procedure as the LA Basin CARB data.
2.2. Emissions Inventories
The MACCity inventory [Granier et al., 2011] used in this work is based on the ACCMIP inventory [Lamarqueet al., 2010] for the period 1960–2000 and after 2000 uses the Representative Concentration Pathways(RCP) 8.5 emissions. ACCMIP is input to the multicentury simulations performed within the Coupled ModelIntercomparison Project (CMIP) Phase 5, while CCMI's hindcasts (REF-C1 simulations) use MACCity asinput. ACCMIP's year 2000 emissions are based on several regional inventories, including from the U.S.Environmental Protection Agency (EPA) and the European Monitoring and Evaluation Programme, and else-where are based on the Emissions Database for Global Atmospheric Research (EDGAR) version-4 inventory.ACCMIP's 1960–2000 emission trends are a combination of EDGAR-History Database of the GlobalEnvironment [van Aardenne et al., 2001] and RETRO [Schultz et al., 2008]. All inventories contributing toMACCity and ACCMIP were constructed with conventional approaches using emission factors and sourceactivity data specific to the economic sector and region of interest [Lamarque et al., 2010; Granier et al.,2011]. ACCMIP was built at the regional level and allocated to a global horizontal grid using populationand other surrogates. A detailed description of ACCMIP's development can be found in Lamarque et al.[2010]. MACCity extends decadal ACCMIP and RCP 8.5 emissions to annual values with a seasonal cycle[Granier et al., 2011]. Details of MACCity data processing are given in the supporting information (Text S2).
We also produced our own 1970–2014 inventory for the LA Basin that incorporates emission estimates formobile sources, including on-road and off-road engines, using a fuel-based approach for CO [McDonaldet al., 2013, 2015] and NOx [McDonald et al., 2012]. The data set reported here extends the fuel-based inven-tory reported in McDonald et al. [2013] for 1990–2010. Mobile source emissions were calculated using fuelsales reports as a measure of engine activity, and emission factors were calculated from a meta-analysis ofroadside observations that are normalized to fuel use, most of which were collected by the Universityof Denver [Bishop and Stedman, 2008, 2014] at cities around the U.S., and at the Caldecott Tunnel inOakland, California [Kirchstetter et al., 1996; Kean et al., 2002; Ban-Weiss et al., 2008; Dallmann et al., 2013].The fuel-based mobile source emissions differ from conventional inventory approaches used by the U.S.EPA and CARB in that vehicle activity is quantified on the basis of the amount of fuel consumed and emissionfactors are expressed per unit of fuel burned, rather than as a function of vehicle distance traveled. The fuel-based approach is also novel because it relies on emission factor observations of vehicles under real-worlddriving conditions, in contrast to conventional approaches based on representative sampling of a few vehi-cles under idealized conditions (e.g., using dynamometers). CARB's official inventory quantifies emissionsfrom other anthropogenic sectors, including stationary and area sources [California Air Resources Board,2009, 2013b], which represent a minor fraction of the LA Basin's total NOx and CO emissions during theperiod of interest. A detailed description of our long-term LA Basin inventory is provided in the supportinginformation (Text S3).
3. Results and Discussion3.1. Los Angeles Basin and Other U.S. Cities
Figure 1a shows ambient NOx/CO enhancement ratios derived frommeasurement platforms deployed in theLA Basin over the past 50 years. The variation in NOx/CO enhancement ratios measured at different CARBstations across the basin in any given year reflects the precise mix of sources sampled at each site. For the
Geophysical Research Letters 10.1002/2016GL069894
HASSLER ET AL. MEGACITIES OBSERVATIONS AND INVENTORIES 9922

same reason, ratios measured at these LA Basin stations differ somewhat from those observed by roadsideremote sensing and from research intensive measurements collected at ground sites and across the entirebasin using aircraft sampling (Figure 1a).
Taken together, NOx/CO enhancement ratio observations from these different platforms present a consistentlong-term trend (Figure 1a). The average 1965–2015 growth rate of the LA Basin ambient NOx/CO ratio (i.e.,the slope of a log-linear fit to the ratios as a function of year) is 3.5%± 0.1% yr�1 (all uncertainties are 1σ
Figure 1. (a) Measured NOx/CO enhancement ratios for the LA Basin from 10 CARB monitoring stations (blue circles), fromremote sensing at West LA roadways (blue stars), and from airborne (blue squares) and ground-based (blue triangles)platforms during intensive field campaigns, along with a combination of a quadratic and linear fit to the logarithm of theobserved ratios (blue line). Also shown are our LA Basin long-term inventory's NOx/CO total emissions ratios (black line)with their 1σ uncertainties (gray shading), the MACCity average NOx/CO total emissions ratios for the entire LA Basin (thickred line) and for each of the six grid cells in the LA Basin (red shading), and the average MACCity NOx/CO mobile sourceemission ratio of the LA Basin (orange thick dashed line). The NOx/CO ratio for uncontrolled gasoline vehicle emissions(= 0.03) is also shown (dotted gray line). (b) NOx/CO enhancement ratios from hourly roadside monitor measurements atfour Paris stations (dark green symbols) and 17 stations in London (light green stars), along with log-linear trends for theParis (green dark line) and London (green light line) monitoring data. The trend for the LA Basin observations from Figure 1a is shown for comparison (blue line). Also shown are MACCity NOx/CO emissions ratios for Paris (solid red line) andaveraged for all London grid cells (dashed red line) and the range for individual London grid cells (red shading). The fleet-weighted average NOx/CO ratio from roadway remote sensing at four London sites in 2012 is denoted with a black cross.
Geophysical Research Letters 10.1002/2016GL069894
HASSLER ET AL. MEGACITIES OBSERVATIONS AND INVENTORIES 9923
uncertainties on the trend fit coefficient). This increase is smaller than the 1960–2010 average growth ratereported by POL13 (4.9%± 0.4% yr�1; see Figure 6 in POL13). The 1965–2015 evolution of LA Basin ambientln(NOx/CO) is more closely fit with a combination of a quadratic and linear fit than a straight line (Figure 1a).The observed LA Basin NOx/CO ratio increases slowly from 1970 to 1995, followed by a steeper increase until2007 (described by a quadratic fit), and has begun to decrease since then (described by a linear fit).Differences from POL13 in the LA Basin NOx/CO 1965–2015 trend result from using additional CARB monitor-ing sites and extending the data record to more recent years.
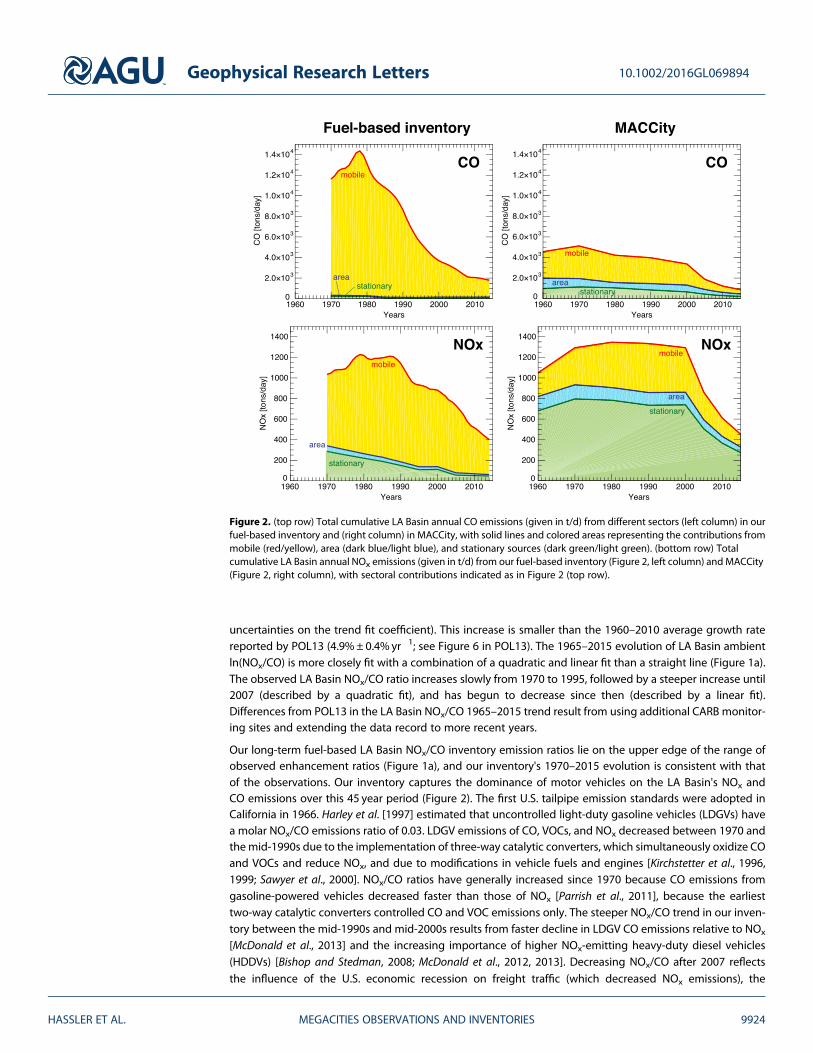
Our long-term fuel-based LA Basin NOx/CO inventory emission ratios lie on the upper edge of the range ofobserved enhancement ratios (Figure 1a), and our inventory's 1970–2015 evolution is consistent with thatof the observations. Our inventory captures the dominance of motor vehicles on the LA Basin's NOx andCO emissions over this 45 year period (Figure 2). The first U.S. tailpipe emission standards were adopted inCalifornia in 1966. Harley et al. [1997] estimated that uncontrolled light-duty gasoline vehicles (LDGVs) havea molar NOx/CO emissions ratio of 0.03. LDGV emissions of CO, VOCs, and NOx decreased between 1970 andthemid-1990s due to the implementation of three-way catalytic converters, which simultaneously oxidize COand VOCs and reduce NOx, and due to modifications in vehicle fuels and engines [Kirchstetter et al., 1996,1999; Sawyer et al., 2000]. NOx/CO ratios have generally increased since 1970 because CO emissions fromgasoline-powered vehicles decreased faster than those of NOx [Parrish et al., 2011], because the earliesttwo-way catalytic converters controlled CO and VOC emissions only. The steeper NOx/CO trend in our inven-tory between the mid-1990s and mid-2000s results from faster decline in LDGV CO emissions relative to NOx
[McDonald et al., 2013] and the increasing importance of higher NOx-emitting heavy-duty diesel vehicles(HDDVs) [Bishop and Stedman, 2008; McDonald et al., 2012, 2013]. Decreasing NOx/CO after 2007 reflectsthe influence of the U.S. economic recession on freight traffic (which decreased NOx emissions), the
Figure 2. (top row) Total cumulative LA Basin annual CO emissions (given in t/d) from different sectors (left column) in ourfuel-based inventory and (right column) in MACCity, with solid lines and colored areas representing the contributions frommobile (red/yellow), area (dark blue/light blue), and stationary sources (dark green/light green). (bottom row) Totalcumulative LA Basin annual NOx emissions (given in t/d) from our fuel-based inventory (Figure 2, left column) andMACCity(Figure 2, right column), with sectoral contributions indicated as in Figure 2 (top row).
Geophysical Research Letters 10.1002/2016GL069894
HASSLER ET AL. MEGACITIES OBSERVATIONS AND INVENTORIES 9924

beginning of the implementation of new HDDV NOx emission control technologies, e.g., by selective catalyticreduction (SCR) systems [Bishop et al., 2015], and initial implementation of Tier two emission standards on U.S.light-duty vehicles where NOx controls were emphasized in the regulations [Bishop and Stedman, 2015].
It is unclear why the NOx/CO emissions ratio from this study is systematically higher than the ambient obser-vations from weekday mornings. However, it is possible that congestion-related impacts, prevalent duringthemorning commute, could affect these differences. Severe congestion is estimated to increase the amountof fuel burned in the Los Angeles basin by 7–12% [Barth and Boriboonsomsin, 2008]. This would disproportio-nately impact gasoline vehicles, as diesel trucks avoid driving during morning and evening commuting per-iods [McDonald et al., 2014]. Because gasoline engines have lower NOx/CO emissions than diesel engines,increasing gasoline emissions relative to diesel would bring our NOx/CO emissions closer to the ambientobservations. Under hard acceleration, gasoline engines can also become fuel-enriched, which significantlyincreases the emission factor of CO relative to NOx (or lowers NOx/CO emissions) [Bishop and Stedman,2008; Lee and Frey, 2012]. The frequency of hard accelerations during congestion is unlikely to be fully cap-tured by roadway studies used in this analysis. Lastly, it is also possible that the fleet of vehicles traveling dur-ing the morning commute period is newer than the typical fleet, which has more effective NOx controltechnologies installed than older vehicles [Bishop and Stedman, 2015].
Our multidecadal LA Basin inventory (Figures 1a and 2) has already been independently evaluated. Using thisinventory as input to a regional chemical transport model enabled accurate prediction of CO and NOx
concentrations in the LA Basin during the 2010 CalNex field campaign [Kim et al., 2016]. From CalNex dataand observations from a 2002 aircraft campaign in California, Brioude et al. [2013] estimated 2002–2010reductions in LA Basin CO and NOx emissions of 41% and 37%, respectively, in good agreement with ourinventory's predicted declines of 44% and 41%, respectively [McDonald et al., 2012, 2013]. Between 2005and 2014, our inventory's NOx emissions declined 45.3%±10.9%, in agreement with a reduction insatellite-derived NO2 columns of 56.4%± 5.6% over Los Angeles [Duncan et al., 2016].
Figure 1a also shows MACCity's NOx/CO anthropogenic emissions ratio averaged for the LA Basin andthe ratio's variation across the six grid cells encompassing the LA Basin. The 1960–2015 increase inMACCity's NOx/CO emissions ratio is 1.54%± 0.03% yr�1, less than half of the observed NOx/CO growth rate.MACCity's NOx/CO emission ratio is also higher than observed enhancement ratios throughout the entiretime period by a factor of 2–5, suggesting a significant overestimate of NOx emissions and/or an underesti-mate of CO emissions. Compared to our inventory, MACCity's total CO emissions are much lower and totalNOx emissions are somewhat higher (Figure 2). Also, in contrast to our LA Basin inventory and the observedtrends, MACCity's NOx/CO emissions ratio increases monotonically and does not decline after 2007.
When considering mobile source emissions only (Figure 1a), the MACCity LA Basin NOx/CO emissions ratiosare still higher than the 1960–2000 observations and increase too slowly (2.2%± 0.05% yr�1). MACCity mobilesource CO and NOx emissions are much less, and CO emissions decreasing too slowly, compared to thosederived from our fuel-based inventory (Figure 2). Since the mobile source emissions dominate LA Basin emis-sions in the fuel-based inventory, and the fuel-based emissions are closer to ambient observations duringweekday mornings, we infer that MACCity does not accurately capture the city's motor vehicle emissionsand their trends.
Additionally, MACCity's area and stationary source emissions of NOx are much higher than the CARB esti-mates used in this study. The incorrect MACCity sector partitioning likely reflects errors arising from theuse of a small number of generic spatial surrogates (e.g., population) to allocate national-level emissions tourban scales [Lamarque et al., 2010; Granier et al., 2011]. This spatial allocation scheme can also be proble-matic for large stationary sources, which may be located outside major urban areas.
The long-term trends in observed NOx/CO enhancement ratios and their differences with MACCity emissionsratios seen in the LA Basin persist for seven other U.S. metropolitan areas with populations of 100,000–20,000,000 (see supporting information Text S1 and Figure S6). Measured NOx/CO enhancement ratios fromair quality monitoring and intensive field studies in a variety of U.S. cities show similar 1989–2013 trends asthose measured in the LA Basin. Like in the LA Basin, average annual increases in the observed NOx/CO in allU.S. cities considered here over the past 25 years (4.1%±0.2% yr�1) are steeper than for MACCity emissionsratios (1.45%± 0.06% yr�1), which are also higher than the ambient ratios by factors of 2–5. We therefore
Geophysical Research Letters 10.1002/2016GL069894
HASSLER ET AL. MEGACITIES OBSERVATIONS AND INVENTORIES 9925

reach some general results for the U.S. cities considered here: the long-term trend in NOx/CO enhancementratios is driven by changes in motor vehicle emissions, and MACCity does not accurately capture changes inmotor vehicle emissions over the past several decades and the urban-scale spatial distribution of thedominant emission sectors.
3.2. London and Paris
To understand how NOx and CO emissions have changed over time in megacities outside the U.S., we con-sider NOx/CO enhancement ratios recorded at monitoring stations in London (1989–2015) and Paris(1995–2014) and by roadside remote sensing in 2012 in London (Figure 1b). The combined data from differ-ent monitoring sites within London or Paris show a consistent interannual trend, with station-to-stationvariations in any given year in each city similar to those seen in Los Angeles. The growth rates in the observedNOx/CO enhancement ratios for London and Paris are 7.2%± 0.4% yr�1 and 8.8%± 0.4% yr�1, respectively,about twice the average growth rate observed in U.S. cities. In London, observed NOx/CO ratios are higherthan those in the LA Basin, and the same is true of Paris for the past decade or so. The fleet-averaged emissionratio of NOx/CO, based on the analysis from roadway remote sensing measurements at four London sites in2012 [Carslaw and Rhys-Tyler, 2013], was 0.67mol/mol, which compares well with London's monitoring data(Figure 1b).
Like the U.S., most heavy-duty vehicles in Europe use diesel fuel. However, in contrast to the predominance ofgasoline fuel in U.S. light-duty vehicles, European nations have incentivized the use of light-duty diesel vehi-cles (LDDVs) to increase fuel economy and decrease CO2 emissions. There are now similar numbers of LDGVsand LDDVs in the UK [Carslaw et al., 2011], where overall diesel currently accounts for the majority of trans-portation fuel burned [Dunmore et al., 2015]. France and other European countries have similarly high dieselusage in their vehicle fleets [Weiss et al., 2012; Dunmore et al., 2015]. European vehicle fleets have correspond-ingly higher NOx emissions and lower CO emissions than in the U.S., as demonstrated by the London andParis observations (Figure 1b). Higher NOx/CO enhancement ratios in London compared to Paris also reflectmeasures to control congestion in central London, such as charging tolls on passenger vehicles, whichencourage a higher fraction of diesel-powered buses and taxis in London compared to other European cities.
Interestingly, observed NOx/CO enhancement ratios continue to climb in London and Paris in recent yearsdespite more stringent controls implemented on motor vehicle NOx emissions. Recent evidence [Carslawet al., 2011; Carslaw and Rhys-Tyler, 2013] suggests that diesel vehicle emission controls have not been aseffective as predicted, although the reasons for this observed behavior are unclear. Measurements ofEuropean Emission Standards 4 to 6 (Euro 4–6) LDDVs showed higher NOx emissions on roadways comparedto laboratory tests [Chen and Borken-Kleefeld, 2014]. While the newest Euro 6 SCR systems for LDDVs showpromise in reducing on-road NOx emissions compared to earlier Euro 4–5 technology, real-world tests ofEuro 4–6 vehicles demonstrate that all can exceed European NOx emissions standards [Weiss et al., 2012].Meanwhile, NOx concentrations near roadways in the UK have remained stable [Carslaw et al., 2011], andNOx emissions from all diesel vehicle types in the UK have not declined much over the past two decades[Carslaw and Rhys-Tyler, 2013].
The observations presented in Figure 1b support the conclusions of these European studies, demonstratingthat ambient air monitoring can detect trends in urban vehicle emissions. Agreement between the monitor-ing network and remote sensing observations in the LA Basin (Figure 1a) and in London (Figure 1b) furtherstrengthens our conclusion that the long-term evolution of ambient NOx/CO enhancement ratios in thesecities are driven bymotor vehicle emissions. Taken together, comparisons of observed NOx/CO enhancementratio trends in all cities considered here highlight the effect of different motor vehicle emissions control stra-tegies pursued in the U.S. and Europe since the late 1990s. Before then, we might expect that the Europeanemissions ratios would be similar to those in the LA Basin, because past European light-duty vehicle fleets hadhigher fractions of gasoline engines and relatively few diesels compared with recent years. However, Euroemissions standards began later than in the U.S., which may result in some differences between the U.S.and European trends prior to 1990.
MACCity captures the factor of 2–3 higher NOx/CO emissions ratio in London compared to Paris seen inthe ambient observations (Figure 1b). As in the U.S. cities studied here, increases in MACCity's NOx/CO emis-sions ratio in London and Paris are smaller (1.88%± 0.05% yr�1 and 1.59%±0.05% yr�1, respectively) than the
Geophysical Research Letters 10.1002/2016GL069894
HASSLER ET AL. MEGACITIES OBSERVATIONS AND INVENTORIES 9926

observed trends in these cities (7.2%±0.4% yr�1 and 8.8%± 0.4% yr�1, respectively). London and ParisMACCity NOx/CO emissions ratios are similar to observed enhancement ratios between 2000 and 2010.However, because of differing temporal trends, MACCity diverges from the observations in both cities before2000 and after 2010. MACCity cannot be directly evaluated prior to 1990 in London or Paris due to the lack ofavailable monitoring data for NOx and CO. From 1970 to 1990, MACCity's NOx/CO emissions ratio in bothcities is higher than the curve fitted to the LA Basin observations (Figure 1b). Because we expect trends inLondon and Paris to be more similar to those in the LA Basin prior to 1990, we suggest that MACCity likelyalso overestimates NOx/CO emissions ratios in European cities during this earlier time period.
4. Conclusions
We demonstrate that multidecadal observations of NOx/CO enhancement ratios in source regions providevaluable information on emissions trends in U.S. and European megacities. In Los Angeles, agreementbetween a variety of measurement platforms and a long-term emissions inventory using a fuel-basedapproach for motor vehicles shows that the 1965–2015 evolution of ambient levels of NOx and CO resultedfrom more stringent vehicle emission standards, the growing importance of heavy-duty diesel engines, andthe influence of the 2008 economic recession. Similarities between Los Angeles NOx/CO observations andthose in seven other U.S. cities in the past 25 years indicate that the comparatively longer measurementrecord in Los Angeles can be used to understand the trends in U.S. motor vehicle emissions ratios over thepast five decades. Comparisons of the past 25 years of NOx/CO observations in London, Paris, and LosAngeles demonstrate the differences in these cities' vehicle fleets and highlight the atmospheric impactsof different emissions control strategies in Europe and the U.S. The long ambient monitoring record inLondon and Paris is consistent with recent observations showing higher-than-expected NOx emissions fromEuropean diesel passenger vehicles.
Megacity observations provide a key constraint on global emissions inventories. Long-term trends inobserved NOx/CO enhancement ratios in Los Angeles, New York, London, and Paris are systematicallyhigher than the trends in MACCity. In Los Angeles, comparisons of MACCity to our observationally vali-dated fuel-based inventory show that MACCity underestimates motor vehicle CO emissions and incorrectlypartitions emissions between mobile and nonmobile source sectors. The similarity of long-term MACCityNOx/CO emissions trends in U.S. and European cities highlights a major challenge that must be addressedby global inventories: capturing important regional differences for key emission sectors around the world.Verification of transportation emissions is needed in other megacities, especially those with rapidly growingvehicle fleets. Fuel-based approaches employing roadway remote sensing of vehicles under real-world oper-ating conditions, and using vehicle identification to correlate emissions with engine type, age, and controltechnology [Bishop and Stedman, 2008, 2015; Carslaw and Rhys-Tyler, 2013], could be replicated elsewhere.
Accurate long-term measurements of NOx and CO are scarce or nonexistent in developing regions of theworld, particularly in the rapidly changing cities of Asia, Latin America, and Africa. Accurate measurementsfrom field campaigns outside the U.S. and Europe, e.g., in Tokyo and Mexico City [Kondo et al., 2010;Parrish et al., 2011; Gallardo et al., 2012], offer only brief snapshots when compared with the multidecadalmeasurement records discussed here. Recent findings [Carslaw and Rhys-Tyler, 2013; Bishop and Stedman,2015] of higher-than-anticipated NOx emissions from diesel passenger vehicles in Europe and the U.S.demonstrate that it is still difficult for developed nations to accurately assess their mobile fleet emissionsby relying solely on laboratory testing of individual vehicles. The challenges are even greater for coun-tries undergoing rapid economic changes that lack resources for systematic environmental monitoringand assessment.
Whether changes to MACCity indicated by our analysis will actually improve model simulations of tropo-spheric ozone is an open question. A critical issue is how well MACCity captures VOC emissions trends.Because CO and VOC emissions in the LA Basin are highly correlated [Warneke et al., 2012], we assume thatMACCity's underestimation of CO emissions will translate to similar underestimates of VOC emissions, as wasdemonstrated for Beirut, Lebanon [Salameh et al., 2016]. Ozone predictions from different models in responseto improved emissions estimates will also likely depend on model VOC emissions speciation and chemicalmechanisms [von Schneidemesser et al., 2016]. Recent observations suggest that there are higher VOC
Geophysical Research Letters 10.1002/2016GL069894
HASSLER ET AL. MEGACITIES OBSERVATIONS AND INVENTORIES 9927

emissions from UK diesel vehicles than inventories report [Dunmore et al., 2015], further complicating effortsto accurately model ozone in global megacities.
MACCity is one example of a global emissions inventory used as input for global chemistry model simula-tions. The systematic differences with observations and inability to capture regional differences are likelynot unique to MACCity, since global inventories rely on similar information about activity, emission factors,and spatial allocation. This study points to the utility of long-term urban atmospheric monitoring and analysisto critically evaluate emissions inventories and demonstrates the need for globally consistent bottom-upmethods that incorporate regional knowledge about emissions sources. Constraining bottom-up emissionsinventories against historical observations helps verify that the underlying emissions drivers are understoodand gives confidence in using such methods to project future emissions, with attendant improvements insimulating future tropospheric composition, air quality, and climate impacts.
ReferencesBan-Weiss, G. A., J. P. McLaughlin, R. A. Harley, M. M. Lunden, T. W. Kirchstetter, A. J. Kean, A. W. Strawa, E. D. Stevenson, and G. R. Kendall
(2008), Long-term changes in emissions of nitrogen oxides and particulate matter from on-road gasoline and diesel vehicles,Atmos. Environ., 42, 220–232, doi:10.1016/j.atmosenv.2007.09.049.
Barth, M., and K. Boriboonsomsin (2008), Real-world carbon dioxide impacts of traffic congestion, Transport Res. Rec., 2058, 163–171,doi:10.3141/2058-20.
Bishop, G. A., and D. H. Stedman (2008), A decade of on-road emissions measurements, Environ. Sci. Technol., 42(5), 1651–1656, doi:10.1021/es702413b.
Bishop, G. A., and D. H. Stedman (2014), The recession of 2008 and its impact on light-duty vehicle emissions in three western United Statescities, Environ. Sci. Technol., 48, 14,822–14,827, doi:10.1021/es5043518.
Bishop, G. A., and D. H. Stedman (2015), Reactive nitrogen species emission trends in three light-/medium-duty United States fleets,Environ. Sci. Technol., 49(18), 11,234–11,240, doi:10.1021/acs.est.5b02392.
Bishop, G. A., B. G. Schuchmann, and D. H. Stedman (2013), Heavy-duty truck emissions in the South Coast air basin of California, Environ. Sci.Technol., 47, 9523–9529, doi:10.1021/es401487b.
Bishop, G. A., R. Hottor-Raguindin, D. H. Stedman, P. McClintock, E. Theobald, J. D. Johnson, D. W. Lee, J. Zietsman, and C. Misra (2015),On-road heavy-duty vehicle emissions monitoring system, Environ. Sci. Technol., 49, 1639–1645, doi:10.1021/es505534e.
Borbon, A., et al. (2013), Emission ratios of anthropogenic volatile organic compounds in northern mid-latitude megacities: Observationsversus emission inventories in Los Angeles and Paris, J. Geophys. Res. Atmos., 118, 2041–2057, doi:10.1002/jgrd.50059.
Brioude, J., et al. (2011), Top-down estimate of anthropogenic emission inventories and their interannual variability in Houston using amesoscale inverse modeling technique, J. Geophys. Res., 116, D20305, doi:10.1029/2011JD016215.
Brioude, J., et al. (2013), Top-down estimate of surface flux in the Los Angeles Basin using a mesoscale inverse modeling technique: Assessinganthropogenic emissions of CO, NOx and CO2 and their impacts, Atmos. Chem. Phys., 13, 3661–3677, doi:10.5194/acp-13-3661-2013.
Burgard, D. A., C. R. M. Bria, and J. A. Berenbeim (2011), Remote sensing of emissions from in-use small engine marine vessels, Environ. Sci.Technol., 45, 2894–2901, doi:10.1021/es1027162.
CARB (2007), OFFROAD2007 Model, California Air Resources Board, Sacramento, Calif. [Available at http://www.arb.ca.gov/msei/categories.html.]California Air Resources Board (2009), California Almanac of Emissions and Air Quality–2009 Edition, California Air Resources Board,
Sacramento, Calif. [Available at http://www.arb.ca.gov/aqd/almanac/almanac09/almanac09.htm.]CARB (2013a), California Motor Vehicle Emission Factor/Emission Inventory Model (EMFAC 2011), California Air Resources Board, Sacramento,
Calif. [Available at http://www.arb.ca.gov/emfac/.]California Air Resources Board (2013b), CEPAM: 2013 Almanac—Standard Emissions Tool, California Air Resources Board, Sacramento, Calif.
[Available at http://www.arb.ca.gov/app/emsinv/fcemssumcat2013.php.]Carslaw, D. C., and G. Rhys-Tyler (2013), New insights from comprehensive on-road measurements of NOx, NO2 and NH3 from vehicle
emission remote sensing in London, UK, Atmos. Environ., 81, 339–347, doi:10.1016/j.atmosenv.2013.09.026.Carslaw, D. C., S. D. Beevers, J. E. Tate, E. J. Westmoreland, and M. L. Williams (2011), Recent evidence concerning higher NOx emissions from
passenger cars and light duty vehicles, Atmos. Environ., 45, 7053–7063, doi:10.1016/j.atmosenv.2011.09.063.Chen, Y., and J. Borken-Kleefeld (2014), Real-driving emissions from cars and light commercial vehicles: Results from 13 years remote sensing
at Zurich/CH, Atmos. Environ., 88, 157–164, doi:10.1016/j.atmosenv.2014.01.040.Cooper, O. R., et al. (2014), Global distribution and trends of tropospheric ozone: An observation-based review, Elementa, 2, 000029,
doi:10.12952/journal.elementa.000029.Dallmann, T. R., and R. A. Harley (2010), Evaluation of mobile source emission trends in the United States, J. Geophys. Res., 115, D14305,
doi:10.1029/2010JD013862.Dallmann, T. R., T. W. Kirchstetter, S. J. DeMartini, and R. A. Harley (2013), Quantifying on-road emissions from gasoline-powered motor
vehicles: Accounting for the presence of medium- and heavy-duty diesel trucks, Environ. Sci. Technol., 47, 13,873–13,881, doi:10.1021/Es402875u.
Derwent, R. G., J. I. R. Dernie, G. J. Dollard, P. Dumitrean, R. F. Mitchell, T. P. Murrells, S. P. Telling, and R. A. Field (2014), Twenty years ofcontinuous high time resolution volatile organic compound monitoring in the United Kingdom from 1993 to 2012, Atmos. Environ., 99(C),239–247, doi:10.1016/j.atmosenv.2014.10.001.
Dollard, G. J., P. Dumitrean, S. Telling, J. Dixon, and R. G. Derwent (2007), Observed trends in ambient concentrations of C2–C8 hydrocarbonsin the United Kingdom over the period from 1993 to 2004, Atmos. Environ., 41, 2559–2569, doi:10.1016/j.atmosenv.2006.11.020.
Duncan, B. N., L. N. Lamsal, A. M. Thompson, Y. Yoshida, Z. Lu, D. G. Streets, M. M. Hurwitz, and K. E. Pickering (2016), A space-based,high-resolution view of notable changes in urban NOx pollution around the world (2005–2014), J. Geophys. Res. Atmos., 121, 976–996,doi:10.1002/2015JD024121.
Dunmore, R. E., J. R. Hopkins, R. T. Lidster, J. D. Lee, M. J. Evans, A. R. Rickard, A. C. Lewis, and J. F. Hamilton (2015), Diesel-related hydrocarbonscan dominate gas phase reactive carbon in megacities, Atmos. Chem. Phys., 15, 9983–9996, doi:10.5194/acp-15-9983-2015.
Geophysical Research Letters 10.1002/2016GL069894
HASSLER ET AL. MEGACITIES OBSERVATIONS AND INVENTORIES 9928
AcknowledgmentsWe thank ECCAD (Emissions ofAtmospheric Compounds andCompilation of Ancillary Database,http://pole-ether.fr/eccad), which wasused to download the MACCityemissions data. The contribution ofAIRPARIF through access to their NOxand CO data is acknowledged. Thisstudy was supported in part by NOAA'sClimate Program Office. The viewsexpressed here do not necessarilyreflect those of the participatingagencies/organizations.

EIA (2015), California Adjusted Distillate Fuel Oil and Kerosene Sales by End Use, Energy Information Administration, U.S. Dep. of Energy,Washington, D. C. [Available at http://www.eia.gov/dnav/pet/pet_cons_821usea_dcu_SCA_a.htm.]
Eyring, V., et al. (2013), Overview of IGAC/SPARC Chemistry-Climate Model Initiative (CCMI) community simulations in support of upcomingozone and climate assessments, SPARC Newsl., 40, 48–66.
FHWA (2014a), Highway Statistics: Motor-Fuel Volume Taxed by States (Table MF-2), Office of Highway Policy Information, Federal HighwayAdministration, U.S. Dep. of Transportation, Washington, D. C. [Available at http://www.fhwa.dot.gov/policyinformation/statistics.cfm.]
FHWA (2014b), Highway Statistics: Non-Highway Use of Gasoline (Table MF-24), Office of Highway Policy Information, Federal HighwayAdministration, U.S. Dep. of Transportation, Washington, D. C. [Available at http://www.fhwa.dot.gov/policyinformation/statistics.cfm.]
Gallardo, L., J. Escribano, L. Dawidowski, N. Rojas, M. de Fátima Andrade, and M. Osses (2012), Evaluation of vehicle emission inventories forcarbon monoxide and nitrogen oxides for Bogotá, Buenos Aires, Santiago, and São Paulo, Atmos. Environ., 47, 12–19, doi:10.1016/j.atmosenv.2011.11.051.
Gordon, T. D., et al. (2013), Primary gas- and particle-phase emissions and secondary organic aerosol production from gasoline and dieseloff-road engines, Environ. Sci. Technol., 47, 14,137–14,146, doi:10.1021/Es403556e.
Granier, C., et al. (2011), Evolution of anthropogenic and biomass burning emissions of air pollutants at global and regional scales during the1980–2010 period, Clim. Change, 109(1–2), 163–190, doi:10.1007/s10584-011-0154-1.
Harley, R. A., R. F. Sawyer, and J. B. Milford (1997), Updated photochemical modeling for California's South Coast Air Basin: Comparison ofchemical mechanisms and motor vehicle emission inventories, Environ. Sci. Technol., 31, 2829–2839, doi:10.1021/Es9700562.
Intergovernmental Panel on Climate Change (2013), Climate Change 2013: The Physical Science Basis. Contribution of Working Group I to theFifth Assessment Report of the Intergovernmental Panel on Climate Change, edited by T. F. Stocker, et al., 1535 pp., Cambridge Univ. Press,Cambridge, U. K., and New York, doi:10.1017/CBO9781107415324.
Kean, A. J., R. F. Sawyer, R. A. Harley, and G. R. Kendall (2002), Trends in exhaust emissions from in-use California light-duty vehicles,1994-2001, SAE SP, 167-174.
Kim, S.-W., et al. (2016), Modeling the weekly cycle of NOx and CO emissions and their impacts on O3 in the Los Angeles-South Coast Air Basinduring the CalNex 2010 field campaign, J. Geophys. Res. Atmos., 120, 1340–1360, doi:10.1002/2015JD024292.
Kirchstetter, T. W., B. C. Singer, R. A. Harley, G. R. Kendall, and W. Chan (1996), Impact of oxygenated gasoline use on California light-dutyvehicle emissions, Environ. Sci. Technol., 30, 661–670, doi:10.1021/es950406p.
Kirchstetter, T. W., B. C. Singer, R. A. Harley, G. R. Kendall, and M. Traverse (1999), Impact of California reformulated gasoline on motor vehicleemissions. 1. Mass emission rates, Environ. Sci. Technol., 33, 318–328, doi:10.1021/es9803714.
Kondo, Y., et al. (2010), Formation and transport of aerosols in Tokyo in relation to their physical and chemical properties: A review,J. Meteorol. Soc. Jpn., 88, 597–624, doi:10.2151/jmsj.2010-401.
Lamarque, J.-F., et al. (2010), Historical (1850–2000) gridded anthropogenic and biomass burning emissions of reactive gases and aerosols:Methodology and application, Atmos. Chem. Phys., 10, 7017–7039, doi:10.5194/acp-10-7017-2010.
Lee, T., and H. C. Frey (2012), Evaluation of representativeness of site-specific fuel-based vehicle emission factors for route average emissions,Environ. Sci. Technol., 46, 6867–6873, doi:10.1021/Es204451z.
Logan, J. A., et al. (2012), Changes in ozone over Europe: Analysis of ozone measurements from sondes, regular aircraft (MOZAIC) and alpinesurface sites, J. Geophys. Res., 117, D09301, doi:10.1029/2011JD016952.
McDonald, B. C., T. R. Dallmann, E. W. Martin, and R. A. Harley (2012), Long-term trends in nitrogen oxide emissions from motor vehicles atnational, state, and air basin scales, J. Geophys. Res., 117, D00V18, doi:10.1029/2012JD018304.
McDonald, B. C., D. R. Gentner, A. H. Goldstein, and R. A. Harley (2013), Long-term trends in motor vehicle emissions in US urban areas,Environ. Sci. Technol., 47(17), 10,022–10,031, doi:10.1021/es401034z.
McDonald, B. C., Z. C. McBride, E. W. Martin, and R. A. Harley (2014), High-resolution mapping of motor vehicle carbon dioxide emissions,J. Geophys. Res. Atmos., 119, 5283–5298, doi:10.1002/2013JD021219.
McDonald, B. C., A. H. Goldstein, and R. A. Harley (2015), Long-term trends in California mobile source emissions and ambient concentrationsof black carbon and organic aerosol, Environ. Sci. Technol., 49, 5178–5188, doi:10.1021/es505912b.
Monks, P. S., et al. (2015), Tropospheric ozone and its precursors from the urban to the global scale from air quality to short-lived climateforcer, Atmos. Chem. Phys., 15, 8889–8973, doi:10.5194/acp-15-8889-2015.
Nassar, R., L. Napier-Linton, K. R. Gurney, R. J. Andres, T. Oda, F. R. Vogel, and F. Deng (2013), Improving the temporal and spatial distributionof CO2 emissions from global fossil fuel emission data sets, J. Geophys. Res. Atmos., 118, 917–933, doi:10.1029/2012JD018196.
Neuman, J. A., et al. (2006), Reactive nitrogen transport and photochemistry in urban plumes over the North Atlantic Ocean, J. Geophys. Res.,111, D23S54, doi:10.1029/2005JD007010.
Parrish, D. D. (2006), Critical evaluation of US on-road vehicle emission inventories, Atmos. Environ., 40, 2288–2300, doi:10.1016/j.atmosenv.2005.11.033.
Parrish, D. D., M. Trainer, D. Hereid, E. J. Williams, K. J. Olszyna, R. A. Harley, J. F. Meagher, and F. C. Fehsenfeld (2002), Decadal change incarbon monoxide to nitrogen oxide ratio in US vehicular emissions, J. Geophys. Res., 107(D12), 4140, doi:10.1029/2001JD000720.
Parrish, D. D., W. C. Kuster, M. Shao, Y. Yokouchi, Y. Kondo, P. D. Goldan, J. A. de Gouw, M. Koike, and T. Shirai (2009), Comparison of airpollutant emissions among mega-cities, Atmos. Environ., 43(40), 6435–6441, doi:10.1016/j.atmosenv.2009.06.024.
Parrish, D. D., H. B. Singh, L. Molina, and S. Madronich (2011), Air quality progress in North American megacities: A review, Atmos. Environ., 45,7014–2025, doi:10.1016/j.atmosenv.2011.09.039.
Parrish, D. D., et al. (2014), Long-term changes in lower tropospheric baseline ozone concentrations: Comparing chemistry-climate modelsand observations at northern midlatitudes, J. Geophys. Res. Atmos., 119, 5719–5736, doi:10.1002/(ISSN)2169-8996.
Pollack, I. B., T. B. Ryerson, M. Trainer, J. A. Neuman, J. M. Roberts, and D. D. Parrish (2013), Trends in ozone, its precursors, and relatedsecondary oxidation products in Los Angeles, California: A synthesis of measurements from 1960 to 2010, J. Geophys. Res. Atmos., 118,5893–5911, doi:10.1002/jgrd.50472.
Salameh, T., S. Sauvage, C. Afif, A. Borbon, and N. Locoge (2016), Source apportionment vs. emission inventories of non-methane hydrocarbons(NMHC) in an urban area of theMiddle East: Local and global perspectives, Atmos. Chem. Phys., 16, 3595–3607, doi:10.5194/acp-16-3595-2016.
Sawyer, R. F., R. A. Harley, S. H. Cadle, J. M. Norbeck, R. Slott, and H. A. Bravo (2000), Mobile sources critical review: 1998 NARSTO assessment,Atmos. Environ., 34, 2161–2181, doi:10.1016/S1352-2310(99)00463-X.
Schultz, M. G., et al. (2008), REanalysis of the TROpospheric chemical composition over the past 40 years: Emission data sets andmethodologies for estimating emissions, Report onWork Package 1, Deliverable D1-6, EU-Contract No. EVK2-CT-2002-00170. [Available athttp://retro-archive.iek.fz-juelich.de/data/documents/reports/D1-6_final.pdf.]
Geophysical Research Letters 10.1002/2016GL069894
HASSLER ET AL. MEGACITIES OBSERVATIONS AND INVENTORIES 9929

Singer, B. C., and R. A. Harley (1996), A fuel-based motor vehicle emission inventory, J. Air Waste Manage. Assoc., 46(6), 581–593.Van Aardenne, J. A., F. J. Dentener, J. G. J. Olivier, C. G. M. Klein Goldewijk, and J. Lelieveld (2001), A 1 × 1 degree resolution dataset of
historical anthropogenic trace gas emissions for the period 1890–1990, Global Biogeochem. Cycles, 15(4), 909–928, doi:10.1029/2000GB001265.
Volckens, J., J. Braddock, R. F. Snow, and W. Crews (2007), Emissions profile from new and in-use handheld, 2-stroke engines, Atmos. Environ.,41, 640–649, doi:10.1016/j.atmosenv.2006.08.033.
von Schneidemesser, E., P. S. Monks, and C. Plass-Duelmer (2010), Global comparison of VOC and CO observations in urban areas,Atmos. Environ., 44(39), 5053–5064, doi:10.1016/j.atmosenv.2010.09.010.
von Schneidemesser, E., J. Coates, H. A. C. Denier van der Gon, A. J. H. Visschedijk, and T. M. Butler (2016), Variation of the NMVOC speciationin the solvent sector and the sensitivity of modelled tropospheric ozone, Atmos. Environ., 135, 59–27, doi:10.1016/j.atmosenv.2016.03.057.
Warneke, C., J. A. de Gouw, J. S. Holloway, J. Peischl, T. B. Ryerson, E. Atlas, D. Blake, M. Trainer, and D. D. Parrish (2012), Multiyear trends involatile organic compounds in Los Angeles, California: Five decades of decreasing emissions, J. Geophys. Res., 117, D00V17, doi:10.1029/2012JD017899.
Weiss, M., et al. (2012), Will Euro 6 reduce the NOx emissions of new diesel cars? Insights from on-road tests with Portable EmissionsMeasurement Systems (PEMS), Atmos. Environ., 62, 657–665, doi:10.1016/j.atmosenv.2012.08.056.
Yanowitz, J., R. L. McCormick, and M. S. Graboski (2000), In-use emissions from heavy-duty diesel vehicles, Environ. Sci. Technol., 34, 729–740,doi:10.1021/Es990903w.
Young, P. J., et al. (2013), Pre-industrial to end 21st century projections of tropospheric ozone from the Atmospheric Chemistry and ClimateModel Intercomparison Project (ACCMIP), Atmos. Chem. Phys., 13, 2063–2090, doi:10.5194/acp-13-2063-2013.
Geophysical Research Letters 10.1002/2016GL069894
HASSLER ET AL. MEGACITIES OBSERVATIONS AND INVENTORIES 9930