7.5 observations on term prom while awaiting onset of
TRANSCRIPT
145
Some women have pain without cervical change. Although these women are described as not being in labour, they may well consider themselves ‘in labour’ by their own definition. Women who seek advice or attend hospital with painful contractions but who are not in established labour should be offered individualised support and occasionally analgesia, and encouraged to remain at or return home.
The use of admission cardiotocography (CTG) in low-risk pregnancy is not recommended in any birth setting.
Research recommendation on initial observation
Studies to examine the clinical efficacy of the initial contact observations/examination.
7.5 Observations on term PRoM while awaiting onset of labour
For observations on term PRoM while awaiting onset of labour, refer to Chapter 11.
7.6 Observations during the established first stage of labour
IntroductionIt is usual practice to carry out a number of maternal and fetal observations during the first stage of labour, to detect changes in maternal or fetal health. These provide an important overview of how the woman is progressing during her labour and what her needs are over time. These obser-vations can be recorded in the woman’s records or on a pre-designed chart (partogram).
Clinical questionIs there evidence that the assessment of the following on admission, and throughout labour and the immediate postnatal period, affect outcomes?
• observation of vital signs• bladder care• palpation and presentation/position of baby• frequency and duration of contractions• membrane and liquor assessment/placental examination• maternal behaviour• vaginal examination• length, strength and frequency of contractions• assessment of cervical effacement, dilatation and position• presentation and descent of the presenting part• assessment of liquor if membranes ruptured.
7.6.1 Women’s observation (including women’s behaviour)
No relevant study was identified.
7.6.2 Palpation and presentation/position of the baby
No relevant study was identified.
7.6.3 Contractions
No relevant study was identified.
7.6.4 Membrane and liquor assessment
No relevant study was identified.
7.6.5 Bladder care
No relevant study was identified.
Normal labour: first stage

146
Intrapartum care
Evidence statementThere was no evidence found concerning the impact upon outcomes of performing maternal observations during the first stage of labour.
7.6.6 Vaginal examinations
IntroductionA vaginal examination during labour often raises anxiety and interrupts the woman’s focus in labour.
Description of included studiesOne UK RCT was identified which compared 2 hourly and 4 hourly vaginal examinations (VEs) and their effect on the duration of labour (n = 109).298 [EL = 1−] A small Swedish case–control study (n = 68) also investigated number of vaginal examinations as a possible predictor of neo-natal sepsis.299 [EL = 2−]
Review findingsA UK RCT (1996) involving 109 nulliparous women in spontaneous labour at term, compared 2 hourly and 4 hourly VEs and found that there was no significant difference in duration of labour between the two groups.298 [EL = 1−] However, the study also found there was no difference in the number of VEs performed between the two groups. A case–control study (1988) was also found which sought to determine predictive factors in neonatal sepsis.299 The study samples comprised 26 neonates with sepsis, compared with 42 controls. The study is of low quality (including inappropriate statistical analysis). [EL = 2−] The authors considered seven intrapartum variables as possible predictive factors of sepsis, including VEs. No predictive factors of neonatal sepsis were confirmed. However, where there is term prelabour rupture of membranes (PRoM), increasing numbers of VEs have been found to be associated with neonatal sepsis (refer to Section 11.1.4 in Chapter 11).300 [EL = 2++]
Evidence statementThere is low-quality evidence on the frequency of vaginal examinations during labour, with some evidence that the number of digital vaginal examinations is associated with neonatal and mater-nal sepsis, where the membranes rupture prior to the onset of labour.
7.6.7 Charting of observations
IntroductionMost UK labour wards use some form of formal charting of observations during established labour. These are usually referred to as partograms. A partogram usually contains up to three charts or graphs onto which the midwife records a woman’s physical observations, frequency and strength of contractions, descent of the fetal head as felt on abdominal palpation, and cervical dilatation. A number of different partograms have evolved for use, some of which contain lines drawn to guide interventions, usually referred to as alert or action lines. These action lines are drawn to the right of the line which denotes progress by cervical dilatation at a rate of 1 cm/hour. A 2 hour action line would be displaced 2 hours to the right of the progress line and if progress then slows so as to cross the action line interventions for delay in the first stage of labour would be considered. For a 4 hourly action line this line is drawn 4 hours to the right of the progress line, i.e. more time is given before interventions would be considered.
Clinical questionWhat is the effectiveness of the following interventions or techniques in labour on outcomes?• formal charting of fetal and maternal observations.
Previous guidelineThe NICE clinical guideline on Caesarean Section reviewed this intervention.6 Three RCTs were included.301–303 The guideline recommended: A partogram with a 4-hour action line should be used to monitor progress of labour of women in spontaneous labour with an uncomplicated singleton pregnancy at term, because it reduces the likelihood of CS.
Description of included studiesA cluster RCT conducted in South-East Asia (n = 8 hospitals; 35 484 women) compared the use of the WHO partogram (a partogram that has an action line) with no use of a partogram.301 [EL = 1+]
147
Review findingsThe trial presented the results for nulliparous and parous women separately. For all nulliparous women, use of the partogram seemed to reduce the proportion of women with prolonged labour (women whose labour lasted > 18 hours, RR 0.56 [95% CI 0.47 to 0.67]), use of augmentation (RR 0.43 [95% CI 0.39 to 0.47]), rate of postpartum sepsis (RR 0.09 [95% CI 0.03–0.31]), and rate of CS (RR 0.70 [95% CI 0.61 to 0.81]), whereas it increased rate of spontaneous cephalic birth (RR 1.05 [95% CI 1.03 to 1.08], when compared with no use of a partogram. For all parous normal women, the findings were similar.
No studies have been identified that examine outcomes using partograms without action or alert lines.
Evidence statementEvidence from low income settings show that the use of pictorial representations of progress in labour (partograms), that have an action line, increases vaginal birth and reduces maternal morbidity. A 4 hour action line is associated with fewer intrapartum interventions than a 2 hour action line with the same outcomes.
There is no current evidence on the efficacy or otherwise of partograms without action or alert lines.
GDG interpretation of the evidenceThe benefits offered by use of the partogram which provides a pictorial summary of labour were felt to be applicable to the UK, even though the evidence was drawn from low income countries.
Research recommendation on charting of observations
Studies looking at the efficacy of the use of the partogram, and the comparison of a partogram with an action line and one without, should be carried out.
For further advice on partogram line placement, refer to Section 7.7.2
7.6.8 Monitoring of fetal wellbeing
Refer to Chapter 13 (monitoring babies in labour).
7.6.9 Pain assessment during labour
Use of pain scales during labour
IntroductionThis systematic review was undertaken to answer the clinical question: does the use of pain scales during labour affect outcomes? In addition, the impact of pain scales on women’s experi-ence of labour, validity and reliability of pain scales used during labour, predictive value of pain scores, acceptability of using pain scales during labour, observer ratings versus self-ratings and comparison of pain scales were also investigated.
Previous guidelinesThe use of pain scales has not been considered in any previous guideline.
Description of included studiesThe review included 13 papers providing evidence of a fair to poor quality regarding the use of pain scales during labour. This low level of evidence can be explained by the fact that the impact of pain scales on labour outcome is not the main focus of the studies under review, many of which are descriptive in nature.
Review findings
Impact on women’s experience of labourA large-scale prospective survey of women’s expectations and experiences of labour conducted in Finland included women’s experiences of pain and pain relief (n = 1091; 33% nulliparous
Normal labour: first stage

148
Intrapartum care
women).123 [EL = 3] Pain was measured using an 11-point box scale (BS-11) and a 5-point verbal rating scale (VRS) (anchor points ‘no pain’ and ‘intolerable pain’). Despite the regular use of pain scales (every 30 minutes), after administration of pain relief 50% of multiparous women still reported pain scores of 8–10 on the BS-11 (this figure was 19% for nulliparous women). 18% of women rated their pain relief as poor, 37% rated it as moderate, and 45% as good. Views of pain relief were not related to parity. Ratings of overall satisfaction were not related to parity, level of pain experienced or pain relief received.
A small US study (n = 23) of women giving birth with no pharmacological analgesia asked women to rate labour pain sensation intensity and pain affect (unpleasantness).304 [EL = 2−] Women were asked to state what they had been thinking about in the few minutes prior to pain assessment: the pain/avoiding pain or having the baby. Women who focused on having the baby had signifi-cantly lower pain affect scores than those who focused on the pain of labour or avoiding pain in all stages of labour.
Validity and reliability of pain scales used during labourResearch conducted in France compared observer ratings of pain intensity with women’s self-ratings on a 5-point numerical scale, the Present Pain Intensity (PPI) scale.305 [EL = III] The study involved 100 nulliparous women asked to rate their labour pain at 30 minute intervals from the onset of labour (defined as 3 cm cervical dilatation) until full dilatation was confirmed. Mean PPI ratings increased significantly with increasing cervical dilatation.
A US descriptive correlational study was undertaken to investigate the sensory and emotional aspects of labour pain.306 [EL = 3] The study involved a convenience sample of 79 women in established labour. Pain was assessed by each woman using four methods: a 10 cm visual ana-logue scale (VAS); the question ‘What does your pain feel like?’; the question ‘How strong is your pain?’; and by an observer (research assistant) using the Behavioural Index of Pain (BIP). All four measures of pain showed a significant difference between early and late established labour.
A recent German study examined women’s experience of pain and feeling of ‘fitness’ (mental and physical energy) during labour.307 [EL = 3] Fifty women were asked to complete a VAS every 45 minutes during both stages of labour. The mean pain score increased steadily as labour pro-gressed. The administration of pharmacological analgesia had the effect of reducing pain scores. This was more marked for epidural analgesia than intramuscular analgesia.
Secondary analysis of data obtained from three RCTs compared pain scores reported before and after the administration of epidural analgesia (n = 311).308 [EL = III] Pain was measured using a 10-point verbal numeric scale. Findings showed that 2% of women with a pain score of 0 or 1 wanted additional analgesia, 51% of women with a score of 2 or 3 wanted additional analgesia and 93% of women with a score of > 3 wanted additional analgesia.
A small US study of 33 adolescent women measured pain using a small plastic hand-held tool incorporating pain descriptors (e.g. cramping, agonising) and a 10 cm numerical scale.309 [EL = 3] Scores obtained using the numeric visual analogue scale (VAS) increased with cervical dilatation. There were significant increases in VAS scores for pain sensation intensity from early to active labour and from first stage of labour to transition. This increase in score was not seen from transi-tion to pushing.
The effect of pethidine on women’s ability to use the VAS reliably has been investigated as part of a small UK study.310 [EL = III] Two subgroups of women in labour were asked ten times to judge one-fifth of the length of a 15 cm VAS line. They were also asked to rate their current pain level on two occasions, 5 minutes apart. Group One (n = 10) conducted the test approximately half an hour after the administration of 150 mg of pethidine, Group Two (n = 10) did so without pethidine. There were no significant differences between the mean error nor variance of women’s ratings of one-fifth along the 15 cm line, whether the woman had pethidine or not. Women’s assessment of current pain made 5 minutes apart also showed no significant differences.
Predictive value of pain scoresA Canadian study of 115 low-risk women from a single institution examined the relationship between pain scores obtained in the latent phase of labour and labour outcomes, including length of labour and mode of birth.311 [EL = II] Pain intensity assessed during the early phase of

149
labour (≤ 3 cm cervical dilatation) was positively correlated with the duration of the latent phase (r = 0.58, P < 0.0001) and the duration of active labour (r = 0.50, P < 0.0001). Analysis of vari-ance showed that latent labour pain was prognostic of the dilatation levels at which analgesia was requested, the number of requests for analgesia and the mode of birth. The incidence of spontaneous birth declined with each increase in pain category recorded during the latent phase ( ² = 12.09, df = 4, P = 0.01).
Acceptability of using pain scales during labourThe recent German study described above also asked for women’s opinions regarding using the pain assessment scale during labour.307 [EL = 3] Written evaluations (n = 28, response rate 56%) suggested that most women (n = 21) felt positive about their participation in the research. However, three women felt it had interfered with their own needs and six expressed negative views regarding the timing of the assessments (too frequent/at the wrong time).
A small-scale study (n = 13 women and nine midwives) carried out in Australia compared the per-ceptions of pain of labouring women with those of their attendant midwife.312 [EL = III] Women were asked to rate their labour pain at 15 minute intervals throughout the first and second stages of labour using three pain scales. While most women were able to complete the pain scales dur-ing the first stage of labour, 12 of the 13 women were not able to complete the scales towards the end of the first stage. Unfortunately, women were not asked their views of completing the scales so frequently during labour.
A US study which investigated the congruence between intrapartum and postnatal labour pain scores also reported briefly on women’s responses to being asked to complete the pain scales during the first stage of labour.313 [EL = 3] Fifty women were asked to complete a 6-point PPI (anchors ‘no pain’ and ‘excruciating’) and a scale involving scoring of 20 adjectives. The authors reported that the women ‘responded favourably’ to administration of the tool and were usually able to complete both scales between contractions until late into the first stage of labour.
A small-scale study conducted in Scotland also used a list of 20 pain descriptors.314 [EL = 3] In this case, the words were presented verbally and women (n = 23) were asked to choose words which best described their current experience of pain. Women were reported as having ‘little difficulty’ in selecting and reporting words that described their pain.
Observer ratings versus self-ratingsA descriptive cohort study carried out in Israel investigated the effect of ethnic differences between labouring women and their care provider on the carers’ perceptions of pain.315 [EL = 2−] Two groups of women in early established labour (4–5 cm cervical dilatation) at term were compared, one group included Jewish women (n = 255), the other comprised Bedouin women (n = 192). Despite marked differences in demographic variables and pregnancy education, self-assessments of pain were found to be similar for the two groups of women. Clinical staff (Jewish doctors and/or midwives) rated Bedouin women’s experience of labour pain as lower than that of Jewish women (6.89 versus 8.52, P < 0.001). For Jewish women, 60% of self-assessments of labour pain agreed with assessments made by carers, this agreement was just 30% for Bedouin women.
The French study described above, conducted to validate an observer-rated behavioural pain index, compared observer ratings (midwife or obstetrician) of pain intensity with women’s self-ratings on a 5-point numerical scale.305 [EL = 3] Significant positive correlations were obtained between self-ratings and observer ratings for each phase of labour. However, self-ratings were significantly higher than observer ratings for all phases of labour, F values obtained from analysis of variance being 354.62, 348.34, 360.95 and 396.78, respectively, P < 0.0005 for all values. These findings suggest staff were underestimating the woman’s experience of pain throughout the first stage of labour.
The US study discussed in the validity of pain scales subsection above compared different pain scales used during labour.306 [EL = 3] It was found that observer ratings of pain using the BIP, although closely correlated with self-rated pain scores, were consistently lower, suggesting that carers may underestimate the pain a woman is experiencing.
A small-scale but detailed study carried out in Australia compared the perception of pain of labouring women with those of their attendant midwife.312 [EL = 2−] There was a significant posi-
Normal labour: first stage

150
Intrapartum care
tive correlation between women’s and midwives’ assessments of pain on all three pain scales used. However, for two of the scales, although there was no significant difference between women’s and midwives’ scores for mild–moderate pain, there was a significant difference between the two sets of scores when pain intensity was severe, with midwives consistently giving lower ratings of pain intensity (VAS: t(30) = 2.157, P < 0.05; PPI: t(25) = 2.301, P < 0.05).
Evidence statementEvidence is drawn from mostly descriptive studies of variable methodological quality. There is some evidence that pain scales provide a valid measurement of women’s pain during labour. No study evaluated their effect on clinical outcomes.
There is also evidence that caregivers tend to underestimate women’s level of pain during labour.
Focusing on pain and pain relief has a negative impact on some women’s experience of labour.
There is some support for the use of a verbal scale over a pencil and paper scale for use by women during labour.
There may be some correlation between high pain scores in early labour and prolonged labour and instrumental birth.
GDG interpretation of the evidenceThe evidence for the use of formal pain scores as a routine method of assessing a woman’s needs in managing her pain is not convincing, even allowing for some evidence that healthcare profes-sionals may underestimate the severity of a woman’s pain.
Recommendation on verbal assessment of pain
Verbal assessment using a numerical pain score is not recommended routinely.
Research recommendation on assessment of pain
Further studies are required to investigate methods of assessing pain relief, attitudes to pain, effects of labour pain, and long-term outcomes.
For pain-relieving strategies, refer to Chapters 5 and 6 on choosing pain relief in labour.
Recommendations on observations during the established first stage of labour
A pictorial record of labour (partogram) should be used once labour is established.
Where the partogram includes an action line, the World Health Organization recommenda-tion of a 4 hour action line should be used.* [repeated from Section 7.7.2]
Observations by a midwife during the first stage of labour include:
• 4 hourly temperature and blood pressure• hourly pulse• half-hourly documentation of frequency of contractions• frequency of emptying the bladder• vaginal examination offered 4 hourly, or where there is concern about progress or in
response to the woman’s wishes (after abdominal palpation and assessment of vaginal loss).
In addition:
• Intermittent auscultation of the fetal heart after a contraction should occur for at least 1 minute, at least every 15 minutes, and the rate should be recorded as an average. The maternal pulse should be palpated if an FHR abnormality is detected to differentiate the two heart rates. (See recommendations in Section 7.8 for reasons to transfer to continuous EFM.)
* Anonymous. World Health Organization partograph in management of labour. World Health Organization Maternal Health and Safe Motherhood Programme. Lancet 1994;343(8910):1399–404. See also www.who.int/reproductive-health/impac/Clinical_Principles/Normal_labour_C57_C76.html.
151
Ongoing consideration should be given to the woman’s emotional and psychological needs, including her desire for pain relief.
Women should be encouraged to communicate their need for analgesia at any point during labour.
7.7 Possible routine interventions in the first stage of labour
IntroductionAlthough most would not intervene in normal labour, a number of policies have been examined in attempts to reduce unnecessary interventions, particularly in nulliparous women.
Clinical questionWhat is the effectiveness of the following interventions or techniques in labour on outcomes?
• active management• amniotomy• oxytocin.
7.7.1 Active management of the first stage of labour
IntroductionActive management includes:
• one-to-one continuous support• strict definition of established labour• early routine amniotomy• routine 2 hourly cervical examination• oxytocin if labour becomes slow.
Description of included studiesThere were four trials identified: a US trial316 involved 1934 nulliparous women in labour (intervention n = 1017; control n = 917) with mixed ethnicity; a Mexican trial317 involved 405 nulliparous women (intervention n = 200; control n = 205) also with mixed ethnicity; a New Zealand trial318 involved 651 nulliparous women (intervention n = 320; control n = 331) with mixed ethnicity; and a Nigerian trial319 that involved 448 nulliparous women (intervention n = 221; control n = 227) in labour with a black population.
Review findingsBased on reasonable homogeneity of the trials, a series of meta-analyses were conducted. The analyses showed that active management does not reduce the rate of CS (four trials, RR 0.83 [95% CI 0.67 to 1.03]) or increase spontaneous vaginal birth (four trials, RR 1.04 [95% CI 0.99 to 1.08]). The analyses also showed that active management of labour shortens the length of first stage (two trials, WMD −121.93 minutes [95% CI −134.54 to −109.31 minutes]), but not the second stage (two trials, WMD −2.11 minutes [95% CI−4.49 to 0.26 minutes]. There was no evidence of difference in use of epidural (three trials, RR 1.03 [95% CI 0.92 to 1.16]) or neonatal outcome (admission to neonatal unit two trials, RR 0.93 [95% CI 0.89 to 1.73]). One trial reported maternal satisfaction, although there was no evidence of differences (satisfied with labour and birth care RR 1.04 [95% CI 0.94 to 1.15]; would choose the same management plan RR 1.05 [95% CI 0.94 to 1.18]).318
Evidence statementThe package known as active management of labour (one-to-one continuous support, diagnosis of labour, early amniotomy, 2 hourly vaginal examinations and oxytocin if labour becomes slow) appears to reduce the duration of the first stage of labour but has no effect on the incidence of CS. There was no assessment of pain for women, nor of neonatal outcomes. Overall, there is no evidence of any other effect from ‘the package’ to either woman or baby.
Normal labour: first stage

152
Intrapartum care
GDG interpretation of the evidenceIt is the view of the GDG that the component of the package known as the active management of labour that most influenced outcomes was one-to-one care. Other components of the pack-age have not been shown to be of benefit. The high level of routine interventions associated with active management of labour do not justify its use.
Recommendation on active management of the first stage of labour
The package known as active management of labour (one-to-one continuous support; strict definition of established labour; early routine amniotomy; routine 2 hourly vaginal examina-tion; oxytocin if labour becomes slow) should not be offered routinely.
7.7.2 Partogram line placement
Description of included studiesTwo RCTs were identified that compared different action line placements. The first trial was conducted in Liverpool (UK) and comprised 928 women in labour.302 [EL = 1++] The study com-pared use of 2 hour and 3 hour action lines with a 4 hour action line. A second trial conducted in South Africa (n = 694) compared a single action line at 2 hours with the WHO partogram (4 hour action line).303 An additional recent UK RCT compared a partogram with a 2 hour action line with one using a 4 hour action line.320 [EL = 1+] The trial involved 2975 nulliparous women and compared outcomes of labour following use of a partogram with an action line 2 or 4 hours to the right of the alert line. If progress crossed the action line a diagnosis of prolonged labour was made and labour managed according to a standard protocol. Primary outcome measures were caesarean section rate and women’s satisfaction. Postal questionnaires were completed 2–10 days postnatally by 1929 women (65%).
Review findingsFindings from the UK RCT suggested that use of the 2 hour action line, compared with the 3 hour line, seemed to increase women’s satisfaction (satisfaction score MD 3.5 [95% CI 1.7 to 5.3]), but there is no evidence of a difference in interventions, e.g. amniotomy: OR 0.9 [95% CI 0.6 to 1.3]; epidural OR 1.3 [95% CI 0.9 to 1.8]; CS for failure to progress OR 0.7 [95% CI 0.4 to 1.3]; or instrumental birth OR 0.9 [95% CI 0.6 to 1.4]).302 [EL = 1++] There was no evidence of differ-ences in neonatal outcomes between use of the 2 and 3 hour action line. Use of the 3 hour action line compared with the 4 hour action line seemed to increase the rate of CS (OR 1.8 [95% CI 1.1 to 3.2]), but not rates for CS for fetal distress (OR 1.8 [95% CI 0.6 to 5.5]) or for failure to progress (OR 1.8 [95% CI 0.9 to 3.4]). There is no evidence of a difference in other interventions, women’s satisfaction or neonatal outcome. Use of a 2 hour action line compared with a 4 hour action line seemed to increase women’s satisfaction (satisfaction score MD 5.2 [95% CI 3.4 to 7.0]). There was no evidence of a difference in rate of interventions or neonatal outcome.
A second trial conducted in South Africa showed that use of a single action line reduced the rate of CS (RR 0.68 [95% CI 0.50 to 0.93]), and instrumental births (RR 0.73 [95% CI 0.56 to 0.96]), and increased use of oxytocin (RR 1.51 [95% CI 1.10 to 2.07]).303 There was no evidence of dif-ferences in use of analgesia (RR 1.01 [95% CI 0.93 to 1.11]) or neonatal outcomes (Apgar < 8 at 1 minute (RR 1.24 [95% CI 0.93 to 1.65]); perinatal death RR 7.12 [95% CI 0.37 to 137.37]).
For the UK RCT,320 there was no evidence of difference for either of the primary outcomes between the 2 and 4 hour action line trial groups: caesarean birth RR 1.0 (CI 0.80 to 1.26); women dissat-isfied with labour experience RR 0.89 [95% CI 0.66 to 1.21]. More women in the 2 hour action line group crossed the partogram action line (854/1490 versus 673/1485; RR 1.27 [95% CI 1.18 to 1.37]) and therefore received more interventions to augment labour (772/1490 versus 624/1486; RR 1.23 [95% CI 1.14 to 1.33]). There were no significant differences between groups for instrumental birth, cord pH < 7.1, Apgar score < 7 at 5 minutes or admission to SCBU.
Evidence statementThere are no studies which involve the use of a partogram with no action line. Placing an action line earlier than that recommended by the WHO (at 4 hours) increases interventions without any benefit in outcomes to either woman or baby.

153
Recommendation on partogram line placement
Where the partogram includes an action line, the World Health Organization recommenda-tion of a 4 hour action line should be used.*
7.7.3 Routine amniotomy
Early routine amniotomy with selective oxytocin versus conservative management
IntroductionFor this review, the intervention was defined as routine early amniotomy, with oxytocin if labour becomes slow compared with conservative management (no routine amniotomy).
Description of included studiesTwo trials were identified for inclusion in this review: a Belgian study321 involving 306 nullipa-rous women (intervention n = 152; control n = 154) and a US trial322 involving 705 nulliparous women in labour (intervention n = 351; control n = 354). Based on reasonable homogeneity in study designs, a series of meta-analyses were conducted.
Review findingsThe meta-analyses showed that there was no evidence of differences in mode of birth (CS (two trials): RR 0.80 [95% CI 0.55 to 1.17]; spontaneous vaginal birth (two trials): RR 1.06 [95% CI 0.97 to 1.16]; use of epidural (two trials): RR 1.02 [95% CI 0.92 to 1.12]; length of first stage of labour (two trials): WMD −65.06 minutes [95% CI −134.83 to 4.71 minutes]; length of second stage of labour (two trials): WMD 1.80 minutes [95% CI −1.83 to 5.44 minutes]; or neonatal outcomes (Apgar score less than 7 at 5 minutes: (two trials): RR 1.22 [95% CI 0.38 to 3.93]; admission to neonatal unit (two tri-als): RR 0.90 [95% CI 0.47 to 1.72]). No other findings relating to major outcomes were available.
Evidence statementThere is no evidence of differences in mode of birth, use of epidural, length of labour or neonatal outcomes between early routine amniotomy plus selective use of oxytocin, and more conserva-tive management.
Recommendation on routine amniotomy
In normally progressing labour, amniotomy should not be performed routinely.
7.7.4 Routine ‘amniotomy and oxytocin’
Early routine amniotomy and oxytocin
IntroductionEarly routine amniotomy and oxytocin was defined as routine use of oxytocin, in addition to early routine amniotomy for normal healthy women at the beginning of labour.
Description of included studiesOne US RCT was identified.323 The study population involved 150 (intervention n = 75; control n = 75) nulliparous women in labour with mixed ethnicity.
Review findingsThe results showed no evidence of a difference in mode of birth (spontaneous vaginal birth RR 0.97 [95% CI 0.82 to 1.14]; CS RR 0.91 [95% CI 0.41 to 2.01]). There was no strong evi-dence on duration of labour (latent phase MD −0.73 hours [95% CI −0.84 to −0.62 hours]; active phase MD 0.24 hours [95% CI 0.12 to 0.36 hours]; deceleration phase MD 0.00 hours [−0.02 to 0.02 hours]) and Apgar score (at 1 minute MD 0.35 [95% CI 0.30 to 0.40]; at 5 min-utes MD 0.02 [95% CI 0.00 to 0.04]). There was no other outcome available.
* Anonymous. World Health Organization partograph in management of labour. World Health Organization Maternal Health and Safe Motherhood Programme. Lancet 1994;343(8910):1399–404. See also www.who.int/reproductive-health/impac/Clinical_Principles/Normal_labour_C57_C76.html.
Normal labour: first stage
154
Intrapartum care
Evidence statementLimited evidence showed no substantial benefit for early amniotomy and routine use of oxytocin compared with conservative management of labour.
Recommendation on routine ‘amniotomy and oxytocin’
Combined early amniotomy with use of oxytocin should not be used routinely.
7.8 Fetal heart assessment and reasons for transfer to continuous EFM
IntroductionThe monitoring of the fetal heart rate (FHR) in labour aims to identify hypoxia before it is suf-ficient to lead to long-term poor neurological outcome for babies.
7.8.1 Admission test
For use of continuous EFM for admission test, refer to Section 7.4.8.
7.8.2 Continuous EFM versus intermittent auscultation
Clinical questionDo the following methods of fetal monitoring affect outcomes?
• admission CTG• intermittent auscultation (Pinard, Doppler)• intermittent electronic monitoring• continuous electronic monitoring.
Description of included studiesOne systematic review, including 12 trials, was identified.324 The systematic review compared effectiveness of continuous EFM for fetal assessment during labour with intermittent ausculta-tion or EFM. Among the 12 trials, only three targeted low-risk women in the USA, Ireland and Australia. The studies were of moderate to good quality.
Review findings
All women (including low- and high-risk pregnancies)There was evidence that women with continuous EFM were more likely to have CS (RR 1.70 [95% CI 1.32 to 2.20]), CS for abnormal FHR (RR 2.45 [95% CI 1.94 to 3.09]), instrumental vagi-nal birth (RR 1.26 [95% CI 1.05 to 1.50]) and need for analgesia (RR 1.09 [95% CI 1.02 to 1.15]), and less likely to have spontaneous vaginal birth (RR 1.28 [95% CI 1.20 to 1.36]), compared with those in the intermittent auscultation group, although there was no evidence of a difference in the use of epidural analgesia (RR 1.00 [95% CI 0.90 to 1.11]).
Although there was no evidence of a difference in perinatal mortality (RR 0.88 [95% CI 0.61 to 1.27]), there was evidence that fewer infants developed neonatal seizures from women with continuous EFM (RR 0.50 [95% CI 0.31 to 0.80]).
Only women with low-risk pregnanciesThere was evidence that women with continuous EFM were more likely to have CS for abnormal FHR pattern (RR 2.31 [95% CI 1.49 to 3.59]), instrumental vaginal birth (RR 1.29 [95% CI 1.02 to 1.62]) and all instrumental birth (including CS and instrumental vaginal birth; RR 1.35 [95% CI 1.09 to 1.67]), compared with those with intermittent auscultation. There was also evidence that women with continuous EFM were less likely to have babies with neonatal seizures (RR 0.36 [95% CI 0.16 to 0.81]) and more likely to have babies admitted to neonatal units (RR 1.37 [95% CI 1.01 to 1.87]), compared with those with intermittent auscultation, with no evidence of difference in perinatal mortality (RR 1.02 [95% CI 0.31 to 3.31]).

155
Doppler ultrasound versus Pinard stethoscope
Description of included studiesOne trial conducted in Zimbabwe compared the hand-held Doppler ultrasound and the Pinard stethoscope, used by the research midwife or attending midwife for monitoring of FHR during labour.325 The women were a mix of low and high risk. The trial was of a moderate quality.
Review findingsAlthough women monitored using a hand-held Doppler device had less spontaneous vaginal birth (RR 0.83 [95% CI 0.76 to 0.91]) and more CS (RR 1.95 [95% CI 1.47 to 2.60]), there was evidence that women monitored by Doppler were less likely to have babies with admissions to neonatal units (RR 0.65 [95% CI 0.46 to 0.94]), neonatal seizures (RR 0.06 [95% CI 0.00 to 1.07]), and hypoxic encephalopathy (RR 0.12 [95% CI 0.02 to 0.88]) than those monitored using a Pinard stethoscope. There was no evidence of differences in perinatal mortality (RR 0.29 [95% CI 0.07 to 1.25]) or low Apgar scores (Apgar score less than 6 at 5 minutes RR 0.37 [95% CI 0.11 to 1.24]).
Evidence statementThere is high-level evidence that continuous EFM reduces the rate of neonatal seizures but has no impact on rates of cerebral palsy. There is high-level evidence that continuous EFM increases the rates of instrumental and caesarean birth.
There is no high-level evidence about the value of auscultation of the fetal heart rate when women are in early labour.
There is moderate-level evidence from a single small study in a low income country, of both low- and high-risk women, which showed that assessing the fetal heart rate by hand-held Doppler is more effective than by Pinard stethoscope. In the opinion of the GDG this evidence was not robust enough to differentiate between the two techniques.
Recommendations on fetal heart assessment and reasons for transfer to continuous EFM
Intermittent auscultation of the FHR is recommended for low-risk women in established labour in any birth setting.
Initial auscultation of the fetal heart is recommended at first contact in early labour and at each further assessment undertaken to determine whether labour has become established.
Once a woman is in established labour, intermittent auscultation of the fetal heart after a con-traction should be continued as detailed in Section 7.6.
Intermittent auscultation can be undertaken by either Doppler ultrasound or Pinard stethoscope.
Changing from intermittent auscultation to continuous EFM in low-risk women should be advised for the following reasons:
• significant meconium-stained liquor, and this change should also be considered for light meconium-stained liquor (see recommendations in Section 12.1)
• abnormal FHR detected by intermittent auscultation (less than 110 beats per minute [bpm]; greater than 160 bpm; any decelerations after a contraction)
• maternal pyrexia (defined as 38.0 °C once or 37.5 °C on two occasions 2 hours apart)• fresh bleeding developing in labour• oxytocin use for augmentation• the woman’s request.
Normal labour: first stage
156
8 Normal labour: second stage
8.1 Definition of the second stage of labour
IntroductionDefinitions of the stages of labour need to be clear in order to ensure that women and the staff providing their care have an accurate and shared understanding of the concepts involved and can communicate effectively. In order to facilitate this, the guideline aims to provide practical definitions of the stages of labour.
Clinical questionWhat are the appropriate definitions of the latent and active phases of the first stage, the second stage, and the third stage of labour?
Previous guidelineNo previous guideline has considered definitions of the stages of labour.
Description of included studiesNo relevant study was identified that investigated outcomes of different definitions of labour. The GDG explored various definitions that have been used in practice and research. Definitions of stages of labour, used in six descriptive studies investigating duration of labour, were used to inform the discussion on definitions of labour.
Review findingsDefinitions of the second stage of labour may commence with a fully dilated cervix, e.g. from full dilatation of the cervix to the birth of the baby.277 Alternatively, they may take into account maternal effort e.g. from the commencement of maternal pushing and full dilatation of the cervix to the birth of the baby.280 The latter differentiates an active second stage from an early or passive second stage. This may be useful when a woman enters the second stage with the baby’s head still relatively high in the pelvis, i.e. with no urge to push, or with epidural analgesia.
Recommendations on definitions of the second stage of labour
For the purposes of this guideline, the following definitions of labour are recommended:
• Passive second stage of labour:
º the finding of full dilatation of the cervix prior to or in the absence of involuntary expulsive contractions.
• Onset of the active second stage of labour:
º the baby is visible
º expulsive contractions with a finding of full dilatation of the cervix or other signs of full dilatation of the cervix
º active maternal effort following confirmation of full dilatation of the cervix in the absence of expulsive contractions.
For definitions of the first and third stages of labour, refer to Sections 7.2 and 9.1.1, respectively.

157
8.2 Duration and definition of delay in the second stage of labour
IntroductionIn considering labour, it is important to define the boundaries that distinguish what is normal from what is abnormal. These boundaries can then be used to inform women and their carers about what to expect, and when it is appropriate for midwives to refer women to obstetricians for advice and support regarding the management of labour.
Clinical questionDo duration and progress of the first and second stages of labour affect outcomes?
Previous guidelineDuration of labour has not been considered in any previous guideline.
Description of included studiesTen observational studies that investigated the association between the duration of the second stage of labour and the defined outcomes were identified. The quality of the studies varied.
Review findingsA large US cross-sectional study (n = 15 759) investigated prolonged duration of the second stage (more than 4 hours) and the defined outcomes.326 [EL = 3] Logistic regression analysis, controlling for various confounders, showed that there was moderate evidence of an associa-tion between a prolonged second stage and chorioamnionitis (OR 1.79 [95% CI 1.44 to 2.22]), third- or fourth-degree lacerations (OR 1.33 [95% CI 1.07 to 1.67]), CS (OR 5.65 [95% CI 4.46 to 7.16]), instrumental vaginal birth (OR 2.83 [95% CI 2.38 to 3.36]), and low Apgar score (< 7 at 5 minutes OR 0.45 [95% CI 0.25 to 0.84]). There was no evidence of an association between prolonged second stage of labour and endomyometritis (OR 0.79 [95% CI 0.49 to 1.26]), PPH (OR 1.05 [95% CI 0.84 to 1.31]), meconium-stained liquor (OR 1.11 [95% CI 0.93 to 1.33]), or admission to the neonatal unit (OR 0.59 [95% CI 0.35 to 1.03]).
A large US cross-sectional study (n = 7818) compared prolonged second stage of labour (121+ minutes) with normal duration (1–120 minutes) on the defined outcomes. The associa-tions between two levels of prolonged second stage (121–240 minutes versus 241+ minutes) on the defined outcomes were also compared.327 [EL = 3] The analysis, which did not control for confounding variables, showed some evidence that a longer second stage of labour (more than 120 minutes) is associated with various medical interventions. For prolonged duration of second stage, the analysis (again without controlling for confounding factors) showed some evidence that duration of more than 240 minutes is associated with various medical interventions.
A German cross-sectional study (n = 1200) investigated prolonged second stage of labour (more than 2 hours) and intrapartum outcomes.328 [EL = 3] The results showed evidence of an associa-tion of prolonged second stage with a low Apgar score at 1 minute, PPH, perineal tears and postpartum fever, although the analyses did not control for confounding factors.
A cross-sectional study conducted in Taiwan (n = 1915) investigated prolonged second stage of labour and intrapartum outcomes.329 [EL = 3] The results showed no evidence of an association between a prolonged second stage and neonatal and maternal intrapartum outcomes, although the analyses did not control for any confounding factors.
One retrospective case–control study (n = 173) found no evidence of an association between stress urinary incontinence and the duration of the second stage of a woman’s first labour, when followed up 7–8 years following the birth (OR 1.07 [95% CI 0.9 to 1.3]).330 [EL = 2+] It is notable that the study was unable to evaluate parity as an independent risk factor for urinary incontinence.
A large Canadian cross-sectional study (n = 6041) investigated the duration of the second stage of labour and perinatal outcomes.331 [EL = 2+] There was no evidence of associations between the duration of second stage and low Apgar scores at 5 minutes, neonatal seizures or admission to neonatal units.
Normal labour: second stage

158
Intrapartum care
One large UK cross-sectional study (n = 25 069) investigated prolonged second stage of labour and perinatal outcomes.332,333 [EL = 2+] Logistic regression analysis showed that there was evidence of association between a longer duration and a higher rate of PPH (durations: 120–179 minutes OR 1.6 [95% CI 1.3 to 1.9]; 180–239 minutes 1.7 [95% CI 1.3 to 2.3]; 240+ minutes OR 1.9 [95% CI 1.2 to 2.8]), but there was no evidence of an association with postpartum infec-tion (120–179 minutes OR 1.1 [95% CI 0.9 to 1.4]; 180–239 minutes OR 1.1 [95% CI 0.7 to 1.6]; 240+ minutes OR 1.2 [95% CI 0.7 to 2.0]), or an Apgar score less than 7 at 5 minutes (120–179 minutes OR 1.3 [95% CI 0.8 to 2.0]; 180–239 minutes OR 0.9 [95% CI 0.3 to 2.3]; 240+ minutes OR 1.9 [95% CI 0.8 to 4.7]).
A US population-based study (n = 1432) investigated prolonged second stage of labour (more than 120 minutes) and intrapartum outcomes.334 [EL = 2+] Analysis, without controlling for con-founding factors, showed evidence of association with increased rates of CS and instrumental vaginal birth. There was no association with any adverse neonatal outcomes.
A small US longitudinal descriptive study (n = 30) investigated the association between the dura-tion of the second stage of labour (cervical dilatation 10 cm to birth) and anxiety scores.286 [EL = 2−] The study found no significant association between the duration of the second stage of labour and anxiety scores (inter-correlation −0.24).
A large cross-sectional study conducted in the USA (n = 4403) investigated different lengths of the second stage of labour and their association with intrapartum outcomes.335 [EL = 2−] The analyses, without controlling for confounding factors, showed no evidence of an association between the duration of the second stage and neonatal outcomes, apart from low Apgar scores at 1 minute (P < 0.03). Both puerperal haemorrhage and febrile morbidity showed evidence of an association with length of labour (P < 0.001 for both).
There are three studies that did not specify stages of labour.
A small, matched case–control study (n = 34) conducted in the UK investigated the association between length of labour and puerperal psychosis.287 [EL = 2−] It showed some evidence of a longer duration of labour being associated with puerperal psychosis (MD 4.6 hours, P < 0.05).
One US cross-sectional study (n = 198) investigated the impact of short labour (less than 3 hours of first and second stage of labour) upon perinatal outcomes, with matched controls (matched for maternal age, parity and birthweight).288 [EL = 3] There was no evidence of associations between short labour and major (defined as those of the external anal sphincter or of the rectal mucosa) perineal lacerations, PPH or Apgar scores less than 7 at 5 minutes.
One nested case–control study, performed in the USA, investigated the effects of prolonged labour on maternal complications in the intrapartum period.289 [EL = 2−] Both For women who had a vagi-nal birth or CS, prolonged labour was associated with maternal complications (women with vaginal birth RR 12.5 [95% CI 4.94 to 23.38]; women with CS RR 28.89 [95% CI 20.00 to 39.43]).
Descriptive studiesThree studies were identified for review that described the duration of the second stage of labour. In some cases, factors associated with the duration of labour were also investigated. By defini-tion, all studies in this subsection are evidence level 3.
A US study aimed to describe the duration of the active stages of labour and the clinical fac-tors associated with longer labours.283 Data were collected from 2511 women, in spontaneous labour at term, at low risk of developing complications during labour and who did not receive oxytocin or epidurals. The data were collected from nine US midwifery practices in 1996. The mean length of the second stage was 54 minutes for nulliparous women and 18 minutes for parous women (upper limits: 146 and 64 minutes, respectively). It should be noted, for this and other studies, that the use of means and SDs is inappropriate as data for the duration of labour is not normally distributed (it has a long right hand tail). Multivariate analysis by logistic regression showed that continuous electronic fetal monitoring and ambulation in labour were significantly associated with longer labour. The use of narcotic analgesia was significantly associated with longer labours in parous women. Maternal age over 30 years was associated with a longer second stage, particularly in women giving birth to a first baby. It should be remembered that these are associations only and do not imply causality.

159
Earlier work undertaken in the USA (1991–94) examined the duration of labour in 1473 low-risk women in an attempt to identify differences between ethnic groups.282 The three ethnic groups were non-Hispanic white, Hispanic and American Indian women. The mean duration of the second stage of labour was 53 minutes for nulliparous women and 17 minutes for parous women (upper limits: 147 and 57 minutes, respectively). American Indian women having their first baby had significantly shorter second stages than non-Hispanic white women giving birth for the first time (P < 0.05).
A secondary analysis carried out in the USA using birth data collected from 1976 to 1987 described lengths of labour for 6991 women.277 All included labours were at term, did not involve the use of oxytocin and babies were born spontaneously. Four subgroups were analysed, com-prising nulliparous and parous women with or without conduction anaesthesia (95% of which was epidural anaesthesia). The mean lengths and upper limits (95th percentile) of the second stage were as follows: nulliparous women – no conduction anaesthesia 54 minutes (132 min-utes), with conduction anaesthesia 79 minutes (185 minutes); parous women – no conduction anaesthesia 19 minutes (61 minutes), with conduction anaesthesia 45 minutes (131 minutes).
A summary showing mean duration and upper limits for the duration of the second stage of labour for women without epidural analgesia calculated using data from all three decriptive stud-ies discussed above is given in Table 8.1
Table 8.1 Summary table showing duration of the second stage of labour
Mean (SD) (minutes) Upper limit (mean + 2SDs) (minutes)
Nulliparous women (n = 3664) 54 (44) 142
Parous women (n = 6389) 18 (21) 60
n = 3 descriptive studies. Excludes women with epidural analgesia and/or oxytocin.
Evidence statementLimited quality of evidence makes it difficult to assess the significance of a prolonged second stage of labour on perinatal outcomes for both woman and baby. The woman’s position and whether pushing was directed or not are unclear from the studies.
GDG interpretation of the evidence (duration and definition of delay in the second stage of labour)Pooling findings from the descriptive studies summarised above, the range of upper limits for the normal duration of the active second stage of labour are as follows:
• women giving birth to their first baby – about 0.5–2.5 hours for women without epidural, and 1–3 hours for women with epidural
• women giving birth to second or subsequent babies – up to about 1 hour for women without epidural, and 2 hours for women with epidural.
Unfortunately, these figures are flawed since they are calculated using SDs, the use of which assumes a normal distribution, which is not the case when considering the duration of labour.
Recommendations on duration and definition of delay in the second stage of labour
Nulliparous women:• Birth would be expected to take place within 3 hours of the start of the active second
stage in most women.• A diagnosis of delay in the active second stage should be made when it has lasted 2 hours
and women should be referred to a healthcare professional trained to undertake an opera-tive vaginal birth if birth is not imminent.
Parous women:• Birth would be expected to take place within 2 hours of the start of the active second
stage in most women.• A diagnosis of delay in the active second stage should be made when it has lasted 1 hour
and women should be referred to a healthcare professional trained to undertake an opera-tive vaginal birth if birth is not imminent.
If full dilatation of the cervix has been diagnosed in a woman without epidural analgesia, but she does not get an urge to push, further assessment should take place after 1 hour.
For durations of the first and third stages of labour, refer to Sections 7.3 and 9.1.2, respectively.
Normal labour: second stage

160
Intrapartum care
8.3 Observations for women and babies in the second stage of labour
IntroductionFor many women, the physical demands and the psychological challenge of labour are increased during the second stage. For this reason, combined with the increased vulnerability of the baby, the second stage of labour has traditionally been associated with increased surveillance of the fetal condition and intensive support and encouragement for the labouring woman.
Clinical questionIs there evidence that the assessment of the following on admission, and throughout labour and the immediate postnatal period, affect outcomes?
• observation of vital signs• bladder care• palpation and presentation/position of baby• frequency and duration of contractions• membrane and liquor assessment/placental examination• maternal behaviour• vaginal examination• length, strength and frequency of contractions• assessment of cervical effacement, dilatation and position• presentation and descent of the presenting part• assessment of liquor if membranes ruptured.
8.3.1 Women’s observations (including women’s behaviour)
No relevant study was identified.
8.3.2 Palpation and presentation/position of baby
No relevant study was identified.
8.3.3 Contractions
No relevant study was identified.
8.3.4 Membrane and liquor assessment and assessment of liquor if membranes ruptured
No relevant study was identified.
8.3.5 Bladder care
No relevant study was identified.
8.3.6 Wellbeing of babies
No relevant good-quality study was identified.
Recommendations on observations during the second stage of labour
All observations should be documented on the partogram. Observations by a midwife of a woman in the second stage of labour include:
• hourly blood pressure and pulse• continued 4 hourly temperature• vaginal examination offered hourly in the active second stage or in response to the wom-
an’s wishes (after abdominal palpation and assessment of vaginal loss)• half-hourly documentation of the frequency of contractions• frequency of emptying the bladder• ongoing consideration of the woman’s emotional and psychological needs.
161
In addition:
• Assessment of progress should include maternal behaviour, effectiveness of pushing and fetal wellbeing, taking into account fetal position and station at the onset of the second stage. These factors will assist in deciding the timing of further vaginal examination and the need for obstetric review.
• Intermittent auscultation of the fetal heart should occur after a contraction for at least 1 minute, at least every 5 minutes. The maternal pulse should be palpated if there is sus-pected fetal bradycardia or any other FHR anomaly to differentiate the two heart rates.
• Ongoing consideration should be given to the woman’s position, hydration, coping strate-gies and pain relief throughout the second stage.
8.4 Women’s position and pushing in the second stage of labour
Clinical questionWhat is the effectiveness of the following interventions or techniques in labour on outcomes?
• pushing techniques in the second stage (including not pushing).
8.4.1 Position in the second stage of labour
Previous guidelinePosition in the second stage of labour was reviewed in the NICE Caesarean Section guideline.6 One systematic review (including 18 RCTs) was reviewed. The guideline recommended that women should be informed that adopting a non-supine position during the second stage of labour has not been shown to influence the likelihood of CS .
Description of included studies and review findingsEvidence for the effect of different positions and mobilisation during the second stage of labour on labour outcomes is drawn from one systematic review of 19 RCTs.336 One large (n = 2595) observational cohort study also informs this subsection regarding the use of the lateral position for birth.337 [EL = 2+] An important confounder may be the way the woman pushes and this infor-mation was not available.
A systematic review has been recently updated which assesses the benefits and risks of the use of different positions during the second stage of labour.336 [EL = 1+] The review included 19 trials involving 5764 women. Caution is advised in interpreting the findings, since the quality of the included trials is variable. Sources of potential bias include non-random allocation (three trials), random allocation on admission to the labour ward rather than late in the first stage of labour (seven trials) and the exclusion of subjects following randomisation in some trials. In addition, the data from most trials were not normally distributed, further contributing to possibly unreli-able findings. Upright positions included: sitting (including birthing chair/stool); semi-recumbent (trunk tilted backward 30 degrees to the vertical); squatting (unaided or using bars); squatting (using birthing cushion). For the purpose of this review, upright positions were combined with the lateral position for comparison with supine or lithotomy positions. The use of any upright or lateral position compared with supine or lithotomy was associated with: reduced duration of second stage of labour (ten trials): weighted mean reduction 4.29 minutes [95% CI 2.95 to 5.64 minutes] (this reduction was mainly attributable to the large reduction associated with use of the birthing cushion (two trials): weighted mean reduction in duration 16.9 minutes [95% CI 14.3 to 19.5 minutes]); a reduction in assisted births (18 trials): RR 0.84 [95% CI 0.73 to 0.98]; a reduction in episiotomies (12 trials): RR 0.84 [95% CI 0.79 to 0.91]; an increase in second-degree tears (11 trials): RR 1.23 [95% CI 1.09 to 1.39]; increased estimated blood loss greater than 500 ml (11 trials): RR 1.68 [95% CI 1.32 to 2.15]; reduced reporting of severe pain during the second stage (one trial): RR 0.73 [95% CI 0.60 to 0.90] and fewer abnormal FHR patterns (one trial): RR 0.31 [95% CI 0.08 to 0.98]. No significant differences were demonstrated for: analgesia or anaesthesia used during the second stage of labour (seven trials); third- or fourth-degree perineal tears (four trials); need for blood transfusion (two trials); manual removal of placenta (three trials); unpleasant birth experience (one trial); dissatisfaction with the second stage of labour (one trial); feeling out of control (one trial); admission to NICU (two trials); birth injuries (one trial); or and neonatal death (three trials).
Normal labour: second stage

162
Intrapartum care
A prospective cohort study undertaken in the USA, collected data for women cared for intra-partum at three nurse-midwifery services (all clinical teaching sites) during a 12 month period (n = 3049).337 [EL = 2+] Data collection was carried out using a standardised, validated tool. Multivariate analysis by logistic regression was used to identify predictors of episiotomy and spontaneous tears. Forty-four percent of women were having their first baby. Episiotomy was performed in 11.2% of births and tears occurred in 43.4%. Findings suggested that the lateral position for giving birth was associated with a lower incidence of spontaneous tears among nul-liparous women (n = 919) (OR 0.6 [95% CI 0.2 to 1.0]). This trend towards a protective value was not found for multiparous women (findings from statistical analysis not reported).
A multicentre RCT investigated the effects of a hands-and-knees position during the second stage of labour for nulliparous women with a baby in the occipitoposterior position in labour.338 [EL = 1+] Women allocated to the hands-and-knees position (n = 70) were asked to maintain this position for at least 30 minutes during a study period of 1 hour during the second stage of labour. The control group (n = 77) were actively discouraged from adopting this position during the 1 hour study period, and could adopt any other position they wished. The primary outcome was a baby in the occipitoanterior position (as determined by ultrasound) following the 1 hour study period. There was no significant difference between the two trial groups with respect to this main outcome (17% in intervention group versus 7% in control group; RR 2.4 [95% CI 0.88 to 6.62]). The secondary outcome of persistent back pain during the second stage was measured using three pain scores, all of which were lower for women allocated to the hands-and-knees group (VAS: mean difference −0.85 [95% CI −1.47 to −0.22], P = 0.0083; PPI score: mean differ-ence −0.50 [95% CI −0.89 to −0.10], P = 0.014; SF-MPQ score: mean difference −2.60 [95% CI −4.91 to −0.28], P = 0.028). There were no significant differences seen in any other maternal or neonatal outcomes.
A recent RCT undertaken in Sweden investigated the effects of a hands-and-knees position, com-pared with a sitting position, on the duration of the second stage of labour.339 [EL = 1+] Women were required to maintain their allocated position throughout the second stage, until the baby was crowning (hands-and-knees n = 138; sitting n = 133). There was no significant difference in the length of the second stage of labour between the two trial groups (kneeling 48.5 minutes [SD 27.6 minutes]; sitting 41 minutes [SD 23.4 minutes]). However, a number of positive out-comes were noted for the hands-and knees position regarding women’s experience of the second stage. Women allocated to the hands-and-knees position were more likely to report that they found the position comfortable for giving birth (OR 0.5 [95% CI 0.1 to 0.9], P = 0.030); were less likely to report their second stage as being long (despite there being no significant differ-ence in the actual length of second stage between the two groups) (OR 1.4 [95% CI 0.8 to 0.9], P = 0.002); reported the second stage as less painful (OR 1.3 [95% CI 1.1 to 1.9], P = 0.01); and reported less postpartum perineal pain in first 3 days following birth (OR 1.9 [95% CI 1.3 to 2.9], P = 0.001) compared with women in the control group. There were no significant differences in clinical outcomes for either women (including degree of perineal trauma) or their babies.
Evidence statementThere is high-level evidence that remaining supine in the second stage of labour increases vaginal instrumental birth, increases pain and may increase the incidence of fetal heart rate abnormalities although there is no information on how women pushed. There is no difference in the proportion of women who give birth with an intact perineum. There is also some high-level evidence that using the hands-and-knees position in the second stage of labour, reduces women’s reported pain and has no adverse effects on maternal or neonatal outcomes. The use of a rigid birthing chair or stool, but not upright positions per se, is associated with recorded blood loss greater than 500 ml.
Recommendation on position in the second stage of labour
Women should be discouraged from lying supine or semi-supine in the second stage of labour and should be encouraged to adopt any other position that they find most comfortable.
For advice on position of women with regional analgesia, refer to Section 6.4.3.
163
8.4.2 Pushing in the second stage
IntroductionThese studies considered women without epidural.
Description of included studiesTwo US RCTs of good quality compared coached with uncoached pushing in the second stage of labour.340,341 [both EL = 1+] Three further RCTs were also identified that investigated pushing in the second stage of labour.342–344 However, the methodological quality of these studies was poor [all EL = 1−].
Review findingsA recent US RCT compared coached and uncoached pushing in the second stage of labour.340 [EL = 1+] Nulliparous women who were allocated to the coached pushing group (n = 163) received standardised closed glottis coached pushing instructions during contractions and were encouraged to breathe normally between contractions. The uncoached group of women (n = 157) were attended by the same group of midwives who gave no instructions on pushing, and were encouraged to do ‘what comes naturally’. The mean duration of the second stage of labour was significantly shorter for women in the coached group compared with the uncoached group (46 minutes versus 59 minutes, P = 0.014). There were no differences noted in any other maternal or neonatal outcomes.
A US RCT was conducted to determine whether refraining from coaching second stage pushing affects postpartum urogynaecological measures of pelvic floor structure and function (n = 128).341 [EL = 1+] Women were randomised when they were found to be fully dilated, to receive either coached or uncoached pushing during the second stage of labour. Pelvic floor assessment was carried out 3 months postpartum by nurses blinded to the second stage management. There were no significant differences between the two groups regarding demographic factors, incidence of prolonged second stage of labour (> 2 hours), episiotomy, tears involving the anal sphincter, sec-ond stage epidural, forceps birth, oxytocin augmentation of the second stage or babies weighing over 4.0 kg. Urodynamic testing revealed decreased bladder capacity (P = 0.051) and decreased first urge to void (P = 0.025) in the coached group. No other significant differences were found.
A Danish RCT compared spontaneous pushing (n = 151) with a ‘forced’ breath-holding tech-nique (n = 155) in the late second stage of labour, in women giving birth vaginally for the first time (this sample included women who had had a previous caesarean section but the numbers involved were not given).342 [EL = 1−] The allocated method of pushing was not encouraged until the baby’s head was visible. Up until that point, women were able to push as they wished with-out direction or encouragement from the midwife. Recruitment into the study was difficult, with only 350 of the 1413 women eligible to join taking part. Reasons given for this include women’s reluctance to be allocated to the spontaneous pushing group with its perceived lack of midwifery guidance/encouragement, and midwives’ lack of support for the trial. A further 44 women were lost to follow-up, following randomisation, mainly because they gave birth by caesarean sec-tion. These difficulties undermine the reliability of the findings. The two study groups were well matched for maternal and baby characteristics. No significant differences were found between the two groups in length of labour, length of second stage, length of expulsive second stage (from vertex visible to birth of the baby), mode of birth, perineal trauma, Apgar scores, umbili-cal arterial pH or arterial standard base excess. The authors explain these similarities in terms of non-compliance with the allocated pushing technique. The frequent use of oxytocin (40.1% in the spontaneous group and 45.8% in the forced group) and episiotomy (36% in the spontaneous group and 30% in the forced group) may have also contributed to these findings.
A small UK RCT also investigated the effects of spontaneous (n = 15) versus directed, breath-hold-ing pushing (n = 17).343 [EL = 1−] The two groups were well matched for a number of maternal and baby characteristics, but these did not include fetal position or station. The duration of the first stage of labour was significantly longer in the spontaneous pushing group (means [SD]: 12.32 hours [5.13 hours] versus 7.88 hours [2.62 hours], P = 0.005). There were no other sig-nificant differences noted regarding the first stage of labour including use of Entonox, use of pethidine or the need for an intravenous infusion. No mention is made of the use of oxytocin augmentation. A researcher was present throughout the second stage in order to ensure trial
Normal labour: second stage
164
Intrapartum care
allocation was adhered to by the midwife providing care. Analysis was carried out on an inten-tion-to-treat basis. There was no difference in outcome between the two groups for type of birth, perineal trauma, estimated maternal blood loss, resuscitation of baby at birth, cord venous blood as levels and cord blood pH. Women’s views of the second stage of labour (e.g. ‘What was the pushing part of your labour like?’, ‘How satisfied do you feel with the way you coped during the pushing part of your labour?’), as expressed using a 10 cm visual analogue scale, were also similar for the two groups. The second stage of labour was significantly longer in the spontane-ous pushing group (means [SD]: 121.4 minutes [58.4 minutes] versus 58 minutes [42 minutes], P = 0.002). This may have been contributed to by differences which also led to significantly longer first stages of labour in this group, rather than be attributable to the different pushing techniques employed.
A small US randomised trial compared women encouraged to use a breath-holding pushing technique (n = 10) with those encouraged to use an exhalation pushing technique (n = 17).344 [EL = 1−] All women gave birth sitting on a birthing chair. This final sample of women represents a fairly small proportion of the 94 women who originally agreed to participate in the study. It is not clear from the paper when randomisation was carried out, but it appears that a number of women were dropped from the analysis after randomisation for not complying with the study protocol, e.g. for not using the birthing chair for the second stage (n = 20) or not using the designated style of pushing (n = 9). No significant differences were found in the length of the second stage of labour between the two groups (mean = 45.6 minutes for both groups). Some differences were described in FHR patterns between the two groups, e.g. an increase in variable decelerations being noted in the breath-holding pushing group (30% versus 17.6%, no P value given). However, the clinical significance of this is not discussed and no clinical outcomes were examined, e.g. Apgar scores, need for resuscitation, admission to NICU.
Evidence statementThere is no high-level evidence that directed pushing affects outcomes.
Recommendations on pushing in the second stage of labour
Women should be informed that in the second stage they should be guided by their own urge to push.
If pushing is ineffective or if requested by the woman, strategies to assist birth can be used, such as support, change of position, emptying of the bladder and encouragement.
For advice on pushing of women with regional analgesia, refer to Section 6.4.4.
8.5 Intrapartum interventions to reduce perineal trauma
Clinical questionWhat is the effectiveness on perineal or genital trauma (including previous third- or fourth-degree trauma or female genital mutilation) of the following techniques?
• perineal massage• hand position• heat• cold• maternal position• analgesia• episiotomy• operative vaginal delivery.
Previous guidelineNo previous guidelines have considered interventions related to perineal care during childbirth.
165
8.5.1 Intrapartum perineal massage
Description of included studiesOne RCT was identified which investigated the effects of perineal massage in the second stage of labour upon perineal outcomes.345 [EL = 1+] This Australian study enrolled 1340 women across three trial sites. For women allocated to the experimental group (n = 708), perineal massage was performed by the attending midwife during each contraction of the second stage of labour, unless this was uncomfortable for the woman in which case the massage would not be performed. Midwives at each hospital were instructed on perineal massage through use of verbal instruction, a specially made video and an illustrated pamphlet. Compliance with trial group allocation is not detailed.
Review findingsThere were no significant differences between groups for most perineal outcomes (massage group versus control group): intact perineum: 198/708 versus 171/632, RR 1.03 [95% CI 0.87 to 1.23]; first-degree tear: 122/708 versus 106/632, RR 1.03 [95% CI 0.81 to 1.30]; second-degree tear: 190/708 versus 164/632, RR 1.03 [95% CI 0.86 to 1.24]; episiotomy: 176/708 versus 170/632, RR 0.92 [95% CI 0.77 to 1.11]. There was a difference in incidence of third-degree tears, with these being less frequent in the massage group: 12/708 versus 23/632; RR 0.47 [95% CI 0.23 to 0.93], although the trial was underpowered to detect a statistically significant difference in this rare outcome. No significant differences were found between pain outcomes at 3 days, 10 days or 3 months postpartum: at 3 days: vaginal pain: 416/597 versus 359/499, RR 0.97 [95% CI 0.90 to 1.05]; at 10 days: vaginal pain: 184/632 versus 187/555, RR 0.86 [95% CI 0.73 to 1.02]; at 3 months: vaginal pain: 58/503 versus 54/436, RR 0.93 [95% CI 0.66 to 1.32]; dyspareunia: 78/503 versus 68/436; RR 0.9 [95% CI 0.74 to 1.34]; intercourse not resumed: 49/503 versus 60/436; RR 0.71 (0.50 to 1.01). There were also no significant differences regarding urinary and bowel control.
Recommendation on perineal massage
Perineal massage should not be performed by healthcare professionals in the second stage of labour.
8.5.2 Heat/cold
Description of included studiesA large observational cohort study conducted in the USA investigated perineal care measures that were associated with perineal trauma during childbirth.337 [EL = 2+] Statistical analysis was performed on a subset of births that included all spontaneous vaginal term births (n = 2595).
Review findingsData were collected for women cared for intrapartum, at three nurse-midwifery services (all clinical teaching sites) during a 12 month period. Multivariate analysis by logistic regression was used to identify predictors of episiotomy and spontaneous tears. Findings suggested (at borderline level of significance) that application of warm compresses to the perineum during the second stage of labour was protective against spontaneous tears in women who did not have an episi-otomy (n = 2363), for both nulliparous women (OR 0.7 [95% CI 0.4 to 1.0]) and multiparous women (OR 0.6 [0.3 to 0.9]). Application of warm compresses was also found to be protective against episiotomy for nulliparous women (OR 0.3 [95% CI 0.0 to 0.8]). For multiparous women, the findings are of borderline significance (OR 0.3 [95% CI 0.0 to 1.0]).
8.5.3 Hand position during birth of baby
Description of included studiesA large UK RCT (n = 5471) compared two methods of perineal management used during spontan-eous vaginal birth – a ‘hands on’ method whereby the midwife’s hands were used to put pressure on the baby’s head (to flex the head) and support (‘guard’) the perineum; and a ‘hands poised’ method where the midwife keeps her hands poised but not touching the head or perineum.346
Normal labour: second stage
166
Intrapartum care
[EL = 1+] A similar quasi-randomised trial conducted in Austria also investigated the effects of the hands on versus hands poised techniques of perineal care during birth (n = 1076).347 [EL = 1+]
An RCT conducted in the USA compared three perineal care measures undertaken during the second stage of labour: warm compresses to the perineal area; massage with lubricant; and no touching of the perineal area until the baby’s head was crowned.348 [EL = 1+] The study involved 1211 women allocated to midwife care during labour. Forty percent of participants were nullipa-rous women. Warm compresses or massage with lubricant were applied as continuously as possible until crowning of the baby’s head, unless the woman requested that they be stopped or the tech-nique changed. Data collection included details of allocated technique, what was actually done and for how long, also whether the woman asked for the technique to be stopped or changed.
Review findingsThe large UK RCT compared hands on with hands poised methods for midwife care during the birth of the baby.346 [EL = 1+] Compliance with the allocated trial group was very good for the hands on group (95.3%) and somewhat lower in the hands poised group (70.1%), reflecting the greater number of midwives who expressed a preference for the hands on technique. The main outcome measure for the trial was perineal pain in the previous 24 hours reported by the woman at 10 days. This was found to be significantly lower in the hands on group compared with the hands poised group: 910/2669 versus 823/2647, RR 1.10 [95% CI 1.01 to 1.18]. This represents an absolute difference of 3% [95% CI 0.5% to 5.0%]. The difference resides predominantly in the category of mild pain (23.5% versus 20.9%; moderate pain: 9.2% versus 8.8%; severe pain: 1.4% versus 1.4%). There were no other significant differences in pain outcomes, e.g. at 2 days: pain felt in previous 24 hours: some pain: 70.0% versus 71.3%, NS; mild: 27.5% versus 28.8%, NS; moderate: 37.0% versus 37.4%, NS; severe: 5.2% versus 5.1%, NS. Incidences of reported pain were also very similar at 3 months postpartum. Stratified analyses showed that more of the differences between groups for reported pain at 10 days were apparent for women having their first vaginal birth, for women without epidural analgesia in the second stage of labour and in the latter part of the trial (after the first 6 months). There was also evidence of an effect of midwives’ practice preferences biasing the findings to favour the expressed preference, with the hands on technique only being significantly better (in terms of reported pain at 10 days) when the midwife favoured this technique (heterogeneity test P = 0.03).
While the rates of second-degree trauma (including episiotomy) were similar between the two groups (36.9% versus 36.6%), the episiotomy rate was higher in the hands on group (10.2% versus 12.9%, RR 0.79 [99% CI 1.02 to 2.78]). The rates of third-degree trauma were similar for the two groups (1.5% versus 1.2%), as were incidences of vaginal and anterior genital trauma. The manual removal of the placenta was performed significantly more frequently for women in the hands poised group: n = 71 (2.6%) versus 42 (1.5%), RR 1.69 (99% CI 1.02 to 2.78). While this result is difficult to explain, the authors point out that the difference was evident in both trial centres, supporting its validity as a ‘true’ finding. A large number of other outcomes were investigated with no differences found between study groups. These included neonatal outcomes (Apgar scores, need for resuscitation at birth, additional neonatal care, breastfeeding at 2 days, 10 days and 3 months) and women’s outcomes at 3 months (dyspareunia, urinary problems, bowel problems, treatment for perineal trauma; postnatal depression).
A quasi-randomised trial conducted in Austria has also investigated this intervention (n = 1076).347 [EL = 1+] Only midwives who agreed with the aims of the trial participated in the study. Quasi-randomisation was carried out by alternating hands on and hands poised policies according to the date the woman entered the second stage of labour. Compliance with trial group allocation was high (92% and 94%). The rate of first- and second-degree perineal trauma was similar for the two trial groups (hands on 29.8%; hands poised 33.7%, NS), although there was a higher rate of third-degree trauma in the hands on group (n = 16 (2.7%) versus n = 5 (0.9%)). The study was underpowered to detect the statistical significance of this rare event. Women in the hands on group were more likely to have an episiotomy performed than women in the hands poised group: 17.9% versus 10.1%, P < 0.01. No difference was observed between groups regarding labial and vaginal trauma, length of the second stage of labour or manual removal of placenta (hands on n = 10 (1.7%) versus hands poised n = 7 (1.3%)). Neonatal outcomes were very similar between the two groups with only one baby in each group having an Apgar score < 7 at 5 minutes.

167
Findings from the US RCT comparing warm compresses, massage with lubricant and no touch-ing of the perineal area showed that overall compliance with the allocated technique was very high, 94.5% by self-report and 95.5% in an observed group (25% of whole study sample). In 5.8% of all births the midwife was asked by the woman to stop using the allocated technique; 75% of these requests were made by women allocated to the perineal massage with lubricant technique. The overall episiotomy rate was very low in the study (0.8%). Twenty-three percent of women (n = 278) had no genital trauma, and the genital tract trauma profiles were the same across all three study groups. Twenty percent of women (n = 242) experienced more severe levels of trauma (defined as second-, third- or fourth-degree perineal tear, a tear of the mid or inner vaginal vault, or a cervical tear), and 57% (n = 691) had minor trauma (defined as a first-degree perineal tear, outer vaginal or external genitalia tear). No differences were found when compar-ing warm compresses with the hands off technique: RR 1.04 [95% CI 0.81 to 1.35] or massage versus hands off technique: RR 1.05 [95% CI 0.81 to 1.35]. Stratified analysis and adjusted rela-tive risks controlling for parity, epidural usage, infant birthweight or first year versus later years of the study also showed no differences between study groups. For the warm compress group the mean time the technique was used was 17.8 minutes (SD 19.5 minutes) among women with trauma compared with 13.4 minutes (SD 16.1 minutes) for women without trauma (P = 0.06). For the massage group the mean time this technique was used was 11.6 minutes (SD 14.0 minutes) for women with trauma compared with 5.8 minutes (SD 6.8 minutes) among women without trauma (P < 0.01). A final regression model demonstrated two care measures that were protective for perineal trauma, a sitting position for birth and birth of the fetal head between (rather than during) contractions.
Evidence statementThere is high-level evidence that intrapartum perineal massage or application of warm com-presses in the second stage of labour does not improve perineal outcomes.
There is limited high-level evidence that women allocated to a ‘hands on’ perineal management group reported less mild pain at 10 days, compared with those allocated to a ‘hands poised’ group. The rates of reported perineal trauma (including episiotomy) were similar between the two groups but episiotomy was higher in the ‘hands on’ group.
Recommendation on hand position
Either the ‘hands on’ (guarding the perineum and flexing the baby’s head) or the ‘hands poised’ (with hands off the perineum and baby’s head but in readiness) technique can be used to facili-tate spontaneous birth.
8.5.4 Local anaesthetic spray
Description of included studies and review findingsOne RCT was reviewed which evaluated the effectiveness and acceptability of lidocaine spray in reducing perineal pain during spontaneous vaginal birth.349 [EL = 1+] Women were randomised to receive either an application (five sprays) of lidocaine spray to the perineum and inside aspect of the labia when birth was thought to be imminent (n = 93), or application of a placebo spray, identical in appearance to the treatment spray (n = 92).
The primary outcome for the trial was reported pain during birth, as measured using a 0–100 numeric scale.349 Trial groups were comparable for most obstetric and sociodemographic variables considered, although some differences did arise, namely parity, smoking, augmentation, induc-tion, use of pethidine prior to randomisation and birthweight. These differences were adjusted for in the secondary analyses. In both trial groups, the mean number of sprays received was 4.8 and approximately two-thirds of women in each group received the intervention as intended. No dif-ference was found between groups for the main outcome, pain during birth (mean [SD]: lidocaine: 76.9 [21.6] versus placebo 72.1 [22.2], difference between means 4.8 [95% CI −1.7 to 11.2], P = 0.14). A slightly larger difference between means is seen if adjustments are made for the dif-ferences between trial groups, but this still fails to reach statistical significance: 6.3 [95% CI −0.8 to 13.3], P = 0.081. Most secondary outcomes were similar between groups, including vaginal trauma, neonatal resuscitation, feelings during birth, overall rating of birth experience, sutured
Normal labour: second stage
168
Intrapartum care
after birth and perineal pain 1 week after birth. There was, however, a significantly lower inci-dence of second-degree perineal trauma in the lidocaine group: 28.0% versus 44.6%, RR 0.63 [95% CI 0.42 to 0.93], P = 0.019. Women in the lidocaine spray group were also less likely to report dyspareunia on resumption of sexual intercourse: 27.1% versus 52.7%, RR 0.52 [95% CI 0.35 to 0.76], P = 0.0004. The authors, however, pointed out that the large number of secondary analyses undertaken means these differences could be chance findings.
Evidence statementThere is a small amount of high-level evidence that the use of lidocaine spray during the second stage of labour is not associated with a reduction in perineal pain, but may be associated with a reduction in perineal trauma during birth.
Recommendation on local anaesthetic spray
Lidocaine spray should not be used to reduce pain in the second stage of labour.
8.5.5 Routine versus restricted use of episiotomy
Description of included studiesOne systematic review including seven RCTs and eight cohort studies, plus an additional RCT, inform this subsection. The findings from the systematic review supersede an earlier (1999) previ-ous systematic review including six of the seven RCTs.350
A recent systematic review has been published which considers maternal outcomes following routine, compared with restrictive, use of episiotomy.351 [EL = 1+] The review included evidence from seven RCTs involving a total of 5001 women and eight cohort studies involving 6463 women. Six of the trials studied mediolateral episiotomy and only one used midline episiotomy. Three trials included only women having their first baby. All studies focused on spontaneous vaginal births, although a small proportion of instrumental vaginal births were included in most trials (0–5% in four trials and 5–15% in three trials).
Review findingsEvidence from the trials is usually summarised descriptively rather than meta-analysed. All trials achieved a wide difference in episiotomy use, between the trial aims in the direction expected, ranging from 7.6% in the restrictive group to 93.7% in the routine group. In the trial judged by the authors to be the strongest (best quality) (n = 1000), the incidence of intact perineum was 33.9% in the restrictive group versus 24% in the routine group. In the largest trial (n = 2606), the need for surgical repair was reported as 63% in the restrictive group compared with 88% in the routine group. In the other five trials, the need for perineal repair was less frequent in the restrictive group: RR 0.46 [95% CI 0.30 to 0.70]. The need for any suturing was 26% higher in routine groups (three trials): RR 1.26 [95% CI 1.08 to 1.48].
All trials were underpowered to detect any differences in third- or fourth-degree tears, with an incidence of 105/5001 (seven trials).
Women’s experiences of pain were considered in five trials. In the largest trial, pain outcomes were found to be very similar between the two groups. Routine use group: mild pain 14.6%, moderate pain 7.8% and severe pain 0.2% versus restrictive use group: 14.1%, 7.5% and 0.9%, respectively (n = 885 and n = 1000, respectively). The use of oral analgesia and pain ratings at 3 months were also similar. Three other trials reported pain as higher in the routine use groups, each trial using a different pain outcome measure. The largest trial (n = 2422 and n = 2606, respectively) reported ‘pain on the day of discharge’. In the routine use of episiotomy group, this was found to be 42.5% of women reporting pain, compared with 30.7% in the restrictive group. A second trial assessed pain using a VAS for four activities (day 1 to 5 postpartum) as follows: bed rest: routine 39 mm (SD 28 mm) versus restrictive 22 mm (SD 21 mm); sitting down: 69 mm (SD 23 mm) versus 51 mm (SD 25 mm); walking: 56 mm (SD 24 mm) versus 37 mm (SD 24 mm); opening bowels: 36 mm (SD 30 mm) versus 21 mm (SD 21 mm). Across all activities, the restrictive use group experienced less perineal pain than the routine use group (P = 0.005 to 0.048).
169
Urinary incontinence was investigated by two RCTs. The largest trial (n = 895 and n = 1000, respectively) reported involuntary loss of urine at 3 months and use of a pad for incontinence. Both outcomes had very similar findings for the two study groups (involuntary loss of urine: routine 19.0% versus restrictive 18.9%). Meta-analysis of findings from the two trials shows no difference in incidence of urinary incontinence between routine versus restrictive use of episi-otomy: RR 1.02 [95% CI 0.83 to 1.26].
Five prospective cohort studies also examined self-reported urinary incontinence. No difference was found between groups of women who had an episiotomy versus those who had a spon-taneous tear (five studies): RR 0.88 [95% CI 0.72 to 1.07]. Four cohort studies asked women about rectal incontinence. None found episiotomy to be associated with a statistically significant reduced risk of incontinence of stool or flatus. Pooling of data from the two cohort studies with comparable outcome measures indicates an increase in risk associated with use of episiotomy: RR 1.91 [95% CI 1.03 to 3.56].
Two trials reported sexual function on an intention-to-treat basis. The largest trial (n = 895 and n = 1000, respectively) found that women allocated to the restrictive use of episiotomy group were more likely to have resumed sexual intercourse at 1 month compared with women allo-cated to the routine group: routine 27% versus restrictive 37%, P < 0.01. No differences were found between groups regarding resumption of sexual intercourse by 3 months, dyspareunia at 3 months, or ‘ever suffering painful intercourse’ at 3 years. Five prospective cohort studies found no differences in sexual function between women who had had an episiotomy and women with spontaneous tears. Dyspareunia at 3 months was also found to be similar between the two groups of women (two trials): RR 1.53 [95% CI 0.93 to 2.51].
A recent RCT conducted in Germany compared restrictive use of episiotomy (fetal indica-tions only) (n = 49) with more liberal use (fetal indications and if a tear was deemed imminent) (n = 60).352 [EL = 1+] Episiotomy rates were 41% in the restrictive group and 77% in the lib-eral group (RR 0.47 [95% CI 0.3 to 0.7]. The incidences of intact perinea and ‘minor’ perineal trauma (defined as intact perinea or first-degree tears) were more frequent in the restrictive policy group: intact perineum: 14/49 versus 6/60, RR 2.9 [95% CI 1.2 to 6.9]; intact perineum or first-degree tear: 19/49 versus 8/60, RR 2.9 [95% CI 1.6 to 10.5]. There was no significant difference regarding anterior trauma: 27/49 versus 25/60, RR 1.1 [95% CI 0.8 to 1.8]. Pain was found to be significantly lower for women allocated to the restrictive episiotomy group: sitting (mean): 51 mm [SD 25 mm] versus 69 mm [SD 23 mm]; mean difference 18 mm [95% CI 5 to 31 mm], P = 0.009; walking (mean): 37 mm [SD 24 mm] versus 56 mm [SD24 mm]; mean difference 19 mm [95% CI 6 to 33 mm], P = 0.005. No difference was noted between groups for babies’ Apgar scores or umbilical artery pH.
Owing to similarities between studies and outcome measures, it was possible to pool some of the findings from the single RCT352 and the 1999 systematic review350 and perform a meta-analysis. The meta-analysis was performed using a random effects model owing to the significant hetero-geneity between study outcome measures and uncertainty regarding reliability of classification of outcome measures, e.g. diagnosis of third-degree tears and ratings made on a pain VAS. Findings are as follows:
• severe perineal trauma (third- and fourth-degree tears): RR 0.74 [95% CI 0.42 to 1.28] (six trials, one with no incidents)
• any posterior perineal trauma: RR 0.87 [95% CI 0.83 to 0.91] (five trials)• anterior trauma: RR 1.75 [95% CI 1.52 to 2.01] (five trials)• Apgar score < 7 at 1 minute: RR 1.05 [95% CI 0.76 to 1.45].
Owing to differences in outcome measures, data relating to perineal pain could not be pooled.
Angle of episiotomy
Description of included studiesOne prospective observational study was identified which aimed to identify risk factors associated with third- and fourth-degree perineal tears following childbirth.353 [EL = 3] The study involved 241 women giving birth vaginally for the first time. Following birth an experienced researcher performed a perineal and rectal examination in order to identify and classify perineal trauma. Dimensions and direction of episiotomy was noted and obstetric variables recorded prospectively.
Normal labour: second stage
170
Intrapartum care
Review findingsOf the 241 women included in the study, 59 (25%) sustained anal sphincter injury. Multiple logis-tic regression identified higher birthweight (P = 0.021) and mediolateral episiotomy (OR 4.04 [range 1.71 to 9.56] as independent risk factors for sphincter injury. Further investigation revealed that episiotomies angled closer to the midline were significantly associated with anal sphincter injuries (26 versus 37 degrees, P = 0.01). No midwife and only 22% of obstetricians performed ‘true’ mediolateral episiotomies (defined as being at least 40 degrees from the midline).
Evidence statementThere is considerable high-level evidence that the routine use of episiotomy (trial mean 71.6%; range 44.9% to 93.7%) is not of benefit to women either in the short or longer term, compared with restricted use (trial mean 29.1%; range 7.6% to 53.0%).
Recommendations on episiotomy
A routine episiotomy should not be carried out during spontaneous vaginal birth.
Where an episiotomy is performed, the recommended technique is a mediolateral episiotomy originating at the vaginal fourchette and usually directed to the right side. The angle to the vertical axis should be between 45 and 60 degrees at the time of the episiotomy.
An episiotomy should be performed if there is a clinical need such as instrumental birth or suspected fetal compromise.
Tested effective analgesia should be provided prior to carrying out an episiotomy, except in an emergency due to acute fetal compromise.
8.5.6 Vaginal birth following previous third- or fourth-degree perineal trauma
Description of included studiesNo studies were found assessing care of women with genital mutilation.
Two descriptive studies were identified that investigated the incidence of repeat third- and fourth-degree perineal tears following previous severe trauma. A third retrospective cohort study examined the incidence of anal incontinence following previous third- or fourth-degree tears.
Review findingsA retrospective US population study described the incidence of recurrence of third- and fourth-degree perineal tears, in subsequent births, following a previous third- or fourth-degree tear.354 [EL = 3] All cases of third- and fourth-degree lacerations (termed ‘severe’ lacerations) for the 2 year period 1990–91 were identified (n = 18 888; 7.31% incidence rate). These women were then traced over the following 10 years, which included a further 16 152 births. Of these, 14 990 were vaginal births with an incidence rate of repeat severe laceration of 5.67% (n = 864), this being significantly lower than the original incidence rate (OR 1.29 [95% CI 1.2 to 1.4]). It should be noted, however, that all women in the second group were multiparous and over the same time period there was a 69% fall in the forceps birth rate (from 7.75% to 2.4%), a 28% fall in the rate of use of vacuum extraction, and a 24% reduction in the episiotomy rate. Women with a prior fourth-degree tear had a higher incidence of recurrent severe laceration than women with a previous third-degree tear (410/5306 (7.73%) versus 454/9684 (4.69%)). The association between a number of risk factors and recurrent severe perineal laceration was calculated. A number of significant associations were found: episiot-omy (global): OR 2.6 [95% CI 2.25 to 3.04]; episiotomy alone without instruments: OR 1.7 [95% CI 1.46 to 1.92]; all forceps: OR 3.0 [95% CI 2.2 to 4.0]; forceps + episiotomy: OR 3.6 [95% CI 2.6 to 5.1]; all vacuum: OR 2.2 [95% CI 1.76 to 2.69]; vacuum + episiotomy: OR 2.7 [95% CI 2.14 to 3.39]. The use of forceps or vacuum extraction without episiotomy was not found to be significantly associated with recurrent severe laceration: forceps, no episiotomy: OR 1.4 [95% CI 0.7 to 2.9]; vacuum, no episiotomy: OR 1.0 [95% CI 0.6 to 1.7]. Multivariate logistic regression was used to estimate the association of the use of forceps, vacuum extraction, episiotomy, woman’s age and year of birth as independent risk factors for recurrent laceration. All were found to be significant independent risk factors. The authors pointed out that some other important confounders were not included in the model, e.g. parity, birthweight and indication for instrumental vaginal birth.
171
A second prospective descriptive study has also investigated the risk of subsequent anal sphincter disruption following a previous severe laceration.355 [EL = 3] This study, conducted in Ireland, did not distinguish between third- and/or fourth-degree perineal trauma. From 20 111 consecutive vaginal births, 342 (1.7%) women were identified as having sustained a third-degree tear. Each of these women underwent a series of investigations at 3 months postpartum to ascertain perineal functioning (e.g. continence scoring and manometry) and identify anal defects (using ultrasound imaging). Fifty-six of these women gave birth to a subsequent child during the following 3 years and formed the study sample. Forty-two (75%) women had sustained the initial trauma during birth of their first child, 34 cases following extended mediolateral episiotomy. All of these 56 women underwent continence symptom scoring, anal manometry and endosonography during the last trimester of their subsequent pregnancy. Nine were identified as having an anal defect of greater than one quadrant of the external sphincter (deemed large), five had resting manometric pressures ≤ 25 mmHg and two had squeeze pressures ≤ 40 mmHg. Six of these 56 women had sig-nificant symptoms of faecal incontinence (scores of 5 or more on the continence scoring system). How symptoms related to manometric pressures and/or evidence of anal sphincter defect is not described. Four of these women gave birth by elective caesarean section, along with three other women who wished to avoid perineal trauma. Of this group of 45 women who gave birth vaginally, following previous third-degree trauma, the scores for faecal incontinence following previous birth versus following subsequent birth were as follows: score 0–2: 39 versus 33; score 3–4: 3 versus 4; score 5–6: 1 versus 0; score 6–10: 2 versus 3; not assessed: 0 versus 5. The episiotomy rate among this group was 62% (n = 28), 7% (n = 4) had an instrumental birth and 27% (n = 12) sustained a perineal tear of which two were third-degree tears (an incidence of 4.4%), both associated with spontaneous vaginal births. The authors reported that, following repair of a subsequent third-degree tear, the outcome for both women was ‘excellent’ in terms of faecal continence. Two women who had reported severe symptoms of faecal incontinence antenatally, and went on to give birth to the subsequent child vaginally, remained symptomatic (scoring in the 6–10 range). The one extra case of severe faecal incontinence following a subsequent birth was due to the development of irritable bowel syndrome rather than as a consequence of perineal trauma.
A retrospective cohort study conducted in Switzerland investigated the incidence of anal incon-tinence in women who had had a vaginal birth following a previous third- or fourth-degree tear.356 [EL = 3] Women were identified using the computer records of one hospital, and eligi-ble women were contacted by telephone to request their participation in the study. Of the 448 women identified, 208 (46%) were contacted. Of these, 177 agreed to participate (response rate = 86%). The mean age of the respondents was 40.7 years [range 32 to 54 years] and ten women considered themselves as menopausal. Of this sample, 114 had had subsequent vaginal births. Findings suggest that, while subsequent births are not associated with increased incidence of anal incontinence in women with previous third-degree perineal tears, there is a trend towards an increased incidence following previous fourth-degree tears. While 17/49 (34.7%) women with no subsequent births had symptoms of anal incontinence (incontinence or urgency), this was true of 12/80 (15%) women who went on to have more babies (P = 0.02). For women fol-lowing a fourth-degree tear, the reverse was seen. Symptoms of anal incontinence or urgency were reported by 2/14 (14.3%) women who had not given birth subsequently, compared with 16/34 (47.1%) who had had subsequent births (NS, P = 0.07). The authors noted that the major-ity of third- and fourth-degree tears in this study were extensions of midline episiotomies (third: 101/129; fourth: 45/48). They suggested that these tears might carry a different functional prog-nosis to sphincter tears, complicating a spontaneous tear or mediolateral episiotomy. They also pointed out that the questionnaire asked only for information regarding anal incontinence, and therefore mode of subsequent vaginal birth or any related perineal trauma is not known. It is also very surprising that only 15% women who sustained a third-degree tear and 21% who sustained a fourth-degree tear could remember this, suggesting little was done at the time of the trauma or postnatally to ensure the women had adequate knowledge of this fact.
Evidence statementFor women with previous severe perineal trauma, the rate of repeat severe trauma is similar to the original incidence.
There is no evidence about the use of episiotomy for birth following third- or fourth-degree trauma.
Normal labour: second stage

172
Intrapartum care
There is low-level evidence that in asymptomatic women a vaginal birth following previous severe perineal trauma does not increase the risk of subsequent urgency or continence symptoms.
There is low-level evidence that in symptomatic women vaginal birth following previous severe perineal trauma does increase the risk of subsequent urgency or continence symptoms.
Recommendations on vaginal birth following previous third- or fourth-degree perineal trauma
Women with a history of severe perineal trauma should be informed that their risk of repeat severe perineal trauma is not increased in a subsequent birth, compared with women having their first baby.
Episiotomy should not be offered routinely at vaginal birth following previous third- or fourth-degree trauma.
In order for a woman who has had previous third- or fourth-degree trauma to make an informed choice, discussion with her about the future mode of birth should encompass:
• current urgency or incontinence symptoms• the degree of previous trauma• risk of recurrence• the success of the repair undertaken• the psychological effect of the previous trauma• management of her labour.
Women with infibulated genital mutilation should be informed of the risks of difficulty with vaginal examination, catheterisation and application of fetal scalp electrodes. They should also be informed of the risks of delay in the second stage and spontaneous laceration together with the need for an anterior episiotomy and the possible need for defibulation in labour.
Research recommendation on prevention of perineal trauma
Studies are needed to investigate strategies to reduce the chance of having perineal trauma.
8.6 Water birth
IntroductionWhile the Winterton report recommended that all maternity units should provide women with the option to labour and give birth in water, the number of women in England and Wales who choose to actually give birth in water is not known.95 A survey between April 1994 and March 1996 identified 0.6% of births in England and Wales occurring in water, 9% of which were home births.126 It is known, however, that in some birth settings this proportion is much higher, with one birth centre reporting up to 79% of women giving birth in water.127
Clinical questionWhat is the effectiveness of the following interventions or techniques in labour on outcomes?
• water (including temperature regulation).
Description of included studiesThere was one systematic review, one RCT and one cross-sectional study identified for inclusion in the review. The systematic review included eight trials.128 [EL = 1+] Out of the eight trials, six examined immersion in water in the first stage of labour, one examined immersion in water in the second stage of labour and one investigated the timing of the use of water in the first stage of labour. Another RCT was conducted since the systematic review was updated.357 [EL = 1+] The RCT examined effectiveness of water birth in the second stage of labour. A population-based cross-sectional study in England and Wales investigated perinatal mortality and morbidity of babies, who were born in water, using a postal survey.126 [EL = 3]
173
Review findingsTwo trials evaluated immersion in water during the second stage of labour.128,357 In the latter trial, only 23 women out of 60 received the allocation to be immersed in water. There is no evidence of differences in interventions or complications for either women or their babies during labour.
The cross-sectional study reported a perinatal mortality of 1.2 [95% CI 0.4 to 2.9] per 1000 and an admission rate to the neonatal unit of 8.4 [95% CI 5.8 to 11.8] per 1000 for babies born in water, compared with three previously reported perinatal mortalities (from 0.8 to 4.6 per 1000) and an admission rate of (9.2 to 64 per 1000) from other studies of low-risk populations.126
Evidence statementThere is insufficient evidence on the use of water in the second stage of labour, particularly its effect on neonatal outcomes.
Recommendation on water birth
Women should be informed that there is insufficient high-quality evidence to either support or discourage giving birth in water.
Normal labour: second stage

174
9 Normal labour: third stage
9.1 Definition and duration of the third stage of labour
9.1.1 Definition of the third stage
IntroductionDefinitions of the stages of labour need to be clear in order to ensure that women and the staff providing their care have an accurate and shared understanding of the concepts involved and can communicate effectively. In order to facilitate this, the guideline aims to provide practical definitions of the stages of labour.
Clinical questionWhat are the appropriate definitions of the latent and active phases of the first stage, the second stage, and the third stage of labour?
Previous guidelineNo previous guideline has considered definitions of the stages of labour.
Description of included studiesNo relevant study was identified that investigated outcomes of different definitions of the third stage of labour.
Evidence statementThere is no high-level evidence to suggest any particular definition of the third stage of labour
GDG interpretation of the evidence (definition of the third stage of labour)The GDG explored various definitions that have been used in practice and research. Definitions of stages of labour used in the three descriptive studies investigating duration of labour were used to inform the discussion on definitions of labour.277,282,283 (Refer to Sections 7.2 and 8.1.)
No definitions were found in the literature for the third stage of labour, but a consensus of opin-ion of the GDG members was reached easily as this is a simple and easily recognisable stage of labour.
Recommendation on definition of the third stage of labour
For the purposes of this guideline, the following definition of the third stage of labour is recommended:
• The third stage of labour is the time from the birth of the baby to the expulsion of the placenta and membranes.
For definitions of the first and second stages of labour, refer to Sections 7.2 and 8.1, respectively.

175
9.1.2 Duration of the third stage of labour
Clinical questionWhat is the appropriate definition of retained placenta?
Description of included studiesThere were two observational studies identified (one cohort study358 and one cross-sectional study359) describing active management. Data from one systematic review 360 was also extracted for duration of the third stage for women with physiological management.
Review findingsThe cohort study was conducted in Australia between 2000 and 2002 (n = 6588).358 [EL = 2+] The study investigated the association between the duration of the third stage and risk of post-partum haemorrhage (PPH). All the study population was actively managed in the third stage of labour. The median duration of the third stage was similar in women with and without PPH. The risk of PPH, however, became significant at 10 minutes (at 10 minutes OR 2.1 [95% CI 1.6 to 2.6]; at 20 minutes OR 4.3 [95% CI 3.3 to 5.5]; at 30 minutes OR 6.2 [95% CI 4.6 to 8.2]). The best predictor for developing PPH from the receiver operating characteristic (ROC) curve was 18 minutes.
The cross-sectional study was conducted in the USA between 1975 and 1986, and included 12 979 singleton vaginal births.359 [EL = 3] The study investigated prolonged third stage and out-comes. The incidence of PPH and other complications remained constant in third stages less than 30 minutes, then rose progressively, reaching a plateau at 75 minutes. The increase in these com-plications was observed with both spontaneously delivered and manually extracted placentas.
There was one systematic review of the active management of the third stage.360 The review com-pared various outcomes between women with active management and those with physiological management of the third stage. Mean duration of third stage for women with expectant man-agement were reported from three included trials. [EL = 3] One trial conducted in Abu Dhabi reported mean duration of physiologically managed third stage (n = 821) as 14.0 minutes with SD of 2.5 minutes. The second trial of low-risk women conducted in Dublin reported mean dura-tion of physiologically managed third stage (n = 724) as 11.56 minutes with SD of 8.41 minutes. The third trial of low-risk women conducted in the UK reported mean duration of expectantly managed third stage (n = 764) as 20.81 minutes with SD of 20.46 minutes.
Evidence statementThere is a moderate level of evidence that an actively managed third stage of 30 minutes or longer is associated with increased incidence of PPH.
A physiological third stage has duration of less than 60 minutes in 95% of women.
Recommendations on duration of the third stage
For the purposes of this guideline, the following definitions are recommended:
• Active management of the third stage involves a package of care which includes all of these three components:
º routine use of uterotonic drugs
º early clamping and cutting of the cord
º controlled cord traction.• Physiological management of the third stage involves a package of care which includes all
of these three components:
º no routine use of uterotonic drugs
º no clamping of the cord until pulsation has ceased
º delivery of the placenta by maternal effort.
The third stage of labour is diagnosed as prolonged if not completed within 30 minutes of the birth of the baby with active management and 60 minutes with physiological management.
For durations of the first and second stages of labour, refer to Sections 7.3 and 8.2, respectively.
Normal labour: third stage

176
Intrapartum care
9.2 Observations in the third stage of labour
Clinical questionIs there evidence that the assessment of the following on admission, and throughout labour and the immediate postnatal period, affect outcomes?
• observation of vital signs• bladder care• palpation and presentation/position of baby• frequency and duration of contractions• membrane and liquor assessment/placental examination• maternal behaviour• vaginal examination• length, strength and frequency of contractions• assessment of cervical effacement, dilatation and position• presentation and descent of the presenting part• assessment of liquor if membranes ruptured.
9.2.1 Observations (including maternal behaviour)
No relevant study was identified.
9.2.2 Bladder care
No relevant study was identified.
Evidence statementThere is no high-level evidence on maternal observations in the third stage of labour.
Recommendation on observations in the third stage of labour
Observations by a midwife of a woman in the third stage of labour include:
• her general physical condition, as shown by her colour, respiration and her own report of how she feels
• vaginal blood loss.
In addition, in the presence of haemorrhage, retained placenta or maternal collapse, frequent observations to assess the need for resuscitation are required.
9.3 Physiological and active management of the third stage
IntroductionThe interventions below, targeting normal healthy women in the third stage of labour, were reviewed.
• physiological versus a package of active management of the third stage• timing of cord clamping• comparison of uterotonics for management of the third stage:
º ergot-alkaloids (ergometrine)
º oxytocin plus ergot-alkaloids (Syntometrine®)
º intramuscular or intravenous injection of oxytocin
º umbilical injection of oxytocin
º prostaglandin.
Clinical questionDoes the method of management of the third stage of labour affect outcomes?
• physiological management• active management• cord clamping.

177
Previous guidelineNo previous NICE clinical guideline has reviewed third stage management.
9.3.1 Physiological versus active management of the third stage of labour
IntroductionActive management of the third stage of labour comprises three components of care, as outlined below:
• use of uterotonics• early cord clamping/cutting• controlled cord traction.
Only trials that included all of the three components have been included.
Description of included studiesThere was one systematic review of this intervention identified.360 [EL = 1+] The systematic review was published in 2000, and included five trials with reasonable quality. Meta-analyses were conducted using data from all women in the included trials, as well as subgroup analysis of women at low risk of PPH.
Review findings
All womenMeta-analysis of the included trials showed that there was evidence that active management of the third stage of labour reduced the risk of PPH (clinically estimated blood loss greater than or equal to 500 ml, four trials, 6284 women, RR 0.38 [95% CI 0.32 to 0.46]; severe PPH, clinically estimated blood loss greater than or equal to 1000 ml, four trials, 6284 women, RR 0.33 [95% CI 0.21 to 0.51]; mean blood loss, two trials, 2941 women, WMD −79.33 ml [95% CI −94.29 to −64.37 ml]; maternal haemoglobin less than 9 g/dl 24–48 hours postpartum, four trials, 4255 women, RR 0.40 [95% CI 0.29 to 0.55]; blood transfusion, five trials, 6477 women, RR 0.34 [95% CI 0.22 to 0.53]; iron tablets during the puerperium, one trial, 1447 women, RR 0.60 [95% CI 0.49 to 0.74]). The analysis also showed evidence that active management of the third stage reduced the need for therapeutic oxytocics (five trials, 6477 women, RR 0.20 [95% CI 0.17 to 0.25]) and shortened the length of the third stage of labour (third stage longer than 20 minutes, three trials, 4637 women, RR 0.15 [95% CI 0.12 to 0.19]; third stage longer than 40 minutes, three trials, 4636 women, RR 0.18 [95% CI 0.14 to 0.24]; mean length of third stage, three trials, 4589 women, WMD −9.77 minutes [95% CI −10.00 to −9.53 minutes]), but there is no evidence of difference in rate of manual removal of placenta. However, it also showed evidence of increased maternal complications such as diastolic blood pressure higher than 100 mmHg between birth of the baby and discharge from the labour ward (three trials, 4636 women, RR 3.46 [95% CI 1.68 to 7.09]), vomiting between birth of the baby and discharge from the labour ward (three trials, 3407 women, RR 2.19 [95% CI 1.68 to 2.86]), nausea between birth of the baby and discharge from the labour ward (three trials, 3407 women, RR 1.83 [95% CI 1.51 to 2.23]) and headache between birth of the baby and discharge from the labour ward (three trials, 3405 women, RR 1.97 [95% CI 1.01 to 3.82]). There was no evidence of differences in other compli-cations including maternal pain during third stage of labour, secondary PPH, bleeding needing readmission or antibiotics, or maternal fatigue at 6 weeks. Women with the active management seemed to be less dissatisfied with the management than the expectant management (maternal dissatisfaction with third stage management, one trial, 1466 women, RR 0.56 [95% CI 0.35 to 0.90]). There was no evidence of differences in neonatal outcomes.
Women at a low risk of PPHThe analyses were repeated including only women at a low risk of PPH. There was evidence that the active management of the third stage significantly reduced the rate of PPH (PPH clinically estimated blood loss greater than or equal to 500 ml, three trials, 3616 women, RR 0.34 [95% CI 0.27 to 0.43]; severe PPH, clinically estimated blood loss greater than or equal to 1000 ml, three trials, 3616 women, RR 0.47 [95% CI 0.27 to 0.82]; mean blood loss, two trials, 2941 women, WMD −79.33 minutes [95% CI −94.29 to −64.37 minutes]; maternal haemoglobin lower than
Normal labour: third stage
178
Intrapartum care
9 g/dl 24–48 hours postpartum, four trials, 3417 women, RR 0.29 [95% CI 0.19 to 0.44]; need for blood transfusion, four trials, 3809 women, RR 0.27 [95% CI 0.13 to 0.55]; iron tablets dur-ing the puerperium, one trial, 1447 women, RR 0.60 [95% CI 0.49 to 0.74]). It also showed that active management of the third stage reduced use of therapeutic oxytocics (four trials, 3809 women, RR 0.16 [95% CI 0.12 to 0.21]), and shortened duration of the third stage (third stage longer than 20 minutes, three trials, 3617 women, RR 0.18 [95% CI 0.14 to 0.23]; third stage longer than 40 minutes, three trials, 3616 women, RR 0.20 [95% CI 0.14 to 0.28]; mean length of third stage, two trials, 2941 women, WMD −3.39 minutes [95% CI −4.66 to −2.13 minutes]), but required more manual removal of placenta (four trials, 3809 women, RR 2.05 [95% CI 1.20 to 3.51]) and increased the rate of hypertension (diastolic blood pressure higher than 100 mmHg between birth of the baby and discharge from the labour ward, three trials, 3616 women, RR 9.65 [95% CI 2.25 to 41.30]). There was no evidence of a significant difference in need for subse-quent surgical evacuation of retained products of conception (three trials, 3616 women, RR 0.73 [95% CI 0.36 to 1.49]). The analysis showed that women with the active management had more vomiting, nausea and headache (vomiting between birth of baby and discharge from labour ward, three trials, 2387 women, RR 2.21 [95% CI 1.50 to 3.27]; nausea between birth of baby and discharge from labour ward, three trials, 2387 women, RR 1.88 [95% CI 1.44 to 2.45]; head-ache between birth of baby and discharge from labour ward, three trials, 2385 women, RR 2.37 [95% CI 0.98 to 5.72]) although headache did not reach statistical significance. There was no evidence of differences in maternal pain during the third stage of labour (one trial, 200 women, RR 3.53 [95% CI 0.97 to 12.93]), secondary PPH (after 24 hours and before 6 weeks: two trials, 2104 women, RR 1.17 [95% CI 0.56 to 2.44]), bleeding needing readmission or antibiotics (one trial, 1429 women, RR 11.30 [95% CI 0.63 to 203.92]) or maternal fatigue at 6 weeks (one trial, 1507 women, RR 0.95 [95% CI 0.74 to 1.22]). Women with the active management seemed to be less dissatisfied with the management than the expectant management (maternal dissatisfac-tion with third stage management, one trial, 1466 women, RR 0.56 [95% CI 0.35 to 0.90]). There was no evidence of differences in neonatal outcomes.
Evidence statementActive management of the third stage of labour reduces rates of PPH (blood loss over 1000 ml), mean blood loss, the length of the third stage, postnatal maternal anaemia and the need for blood transfusions, and decreases maternal dissatisfaction. There are associated maternal side effects (nausea, vomiting and headache). There is no evidence of differences in neonatal outcomes.
9.3.2 Timing of cord clamping
IntroductionThe effect of delayed cord clamping (DCC), compared with early cord clamping (ECC), on well-being of women and babies was evaluated. The purpose of this review is to establish whether or not interfering with placental transfusion has any benefits or harms for the woman and baby. It is plausible that early cord clamping contributes to iron deficiency anaemia in babies.361 As part of this review, levels of maternal anaemia need also to be considered and may be different between the low to middle income countries and high income countries.
Description of included studiesOne systematic review361 and three trials conducted in low to middle income countries362–364 were included for this review. The systematic review contained four trials365–368 from high income countries and four from low to middle income countries.369–372 Since there was only one RCT from high income countries, three non-randomised controlled trials were also included in the review. A total of seven trials from low to middle income countries (five RCTs and one quasi-randomised trial) and four trials from high income countries (three controlled trials and one randomised trial) were included in the meta-analysis conducted by the NCC-WCH. Studies from low to middle income countries were analysed and interpreted separately because of the high level of anaemia in these countries. All trials compared ECC with DCC and showed reasonable homogeneity but the timing and description of DCC varied enormously. None of the trials was conducted in the UK.

179
Review findings
Trials in high income countriesInfant haematocrit level 24 hours after birth in two trials in high income countries365, 366 was sig-nificantly raised in the DCC group as compared with the ECC group: (WMD 14.19% [95% CI 11.27% to 17.12%]).
In four trials in high income countries,365–368 haematocrit at 2–4 hours after birth was significantly increased in the DCC group (WMD 13.12% [95% CI 11.21% to 15.03%]).
In three trials from high income countries,365–367 haematocrit at 120 hours after birth was signifi-cantly increased in the DCC group (WMD 10.46% [95% CI 8.31% to 12.61%]).
Table 9.1 Description and results of included studies on timing of cord clamping
Study, country Timing of DCC Infant haemoglobin (g/l) (mean [SD])
Infant haematocrit (%) (mean [SD])
2–4 hours after delivery
6 hours after delivery
Geethanath et al. (1997)369
India
After placental descent into vagina
ECC: 89 [16]
DCC: 83 [21]
(at 3 months) NS
Grajeda et al. (1997)370
Guatemala
When cord stopped pulsating
ECC: 100 [9]
DCC-1: 108 [11]
DCC-2: 106 [9]
(at 2 months)
ECC vs DCC-1:
P = 0.03
Gupta et al. (2002)371
India
After placental descent into vagina
ECC: 88 [8]
DCC: 99 [9]
(at 3 months) P < 0.001
Lanzkowsky (1960)372
South Africa
After signs of placental separation and after cord stripping 4–5 times
ECC: 111 [10]
DCC: 111 [9]
NS
Jose et al. (2006)362
Argentina
1 and 3 minutes after delivery
ECC: 53.5 [7.0]
DCC-1: 57.0 [5.8]
DCC-2: 59.4 [6.1]
Chaparro et al. (2006)363
Mexico
2 minutes after delivery
ECC: 127 [9]
DCC: 126 [11]
P = 0.61
Emhamed et al. (2004)364
Libya
After cord stopped pulsating
ECC: 17.1 [1.9]
DCC: 18.5 [2.1]
P = 0.0005
Linderkamp et al. (1992)365
Germany
3 minutes after delivery
ECC: 47 [5]
DCC: 63[5]
P < 0.005
Nelle et al. (1993)366
Germany
3 minutes after delivery
ECC: 48 [6]
DCC: 58 [6]
P < 0.05
Nelle et al. (1995/1996)367
Germany
3 minutes after delivery
ECC: 53 [7]
DCC: 61 [6]
P < 0.05
Saigal et al. (1972)368
Canada
1 and 5 minutes after delivery
ECC: 50 [4]
DCC-1: 63 [5]
DCC-2: 65 [5]
P < 0.005
DCC = delayed cord clamping; ECC = early cord clamping.
Normal labour: third stage

180
Intrapartum care
Three trials from high income countries365–367 showed a significant increase in proportion of infants with bilirubin > 15 mg/dl (OR 8.68 [95% CI 1.49 to 50.48]).
Trials in low to middle income countriesInfant haematocrit level 24 hours after birth in two trials from low to middle income countries362,364 was significantly raised in the DCC group as compared with the ECC group (WMD 4.56% [95% CI 3.01% to 6.10%]).
In six trials from low to middle income countries,363,364,369–372 infant mean haemoglobin measured was shown to be significantly increased (WMD 0.96 g/l [95% CI 0.29 to 1.64 g/l]) in the DCC group as compared with the ECC group.
In two trials from low to middle income countries,370,371 the proportions of infants with anaemia at follow-up were significantly reduced (OR 0.14 [95% CI 0.05 to 0.40]) in the DCC group.
One trial from a low to middle income country362 showed that there was a significant decrease in neonatal anaemia (haematocrit < 45%) at 6 hours (OR 0.05 [95% CI 0.00 to 0.92]) and at 24 hours (OR 0.17 [95% CI 0.05 to 0.61]) in the DCC group. The same trial showed an increase in neonatal polycythaemia at 6 hours and 24 hours of life (haematocrit > 65% at 6 hours of life: ECC group 4/93, delayed clamping for 1 minute group 5/91, delayed clamping for 3 minutes group 13/92; haematocrit > 65% at 24 hours of life: ECC group 2/93, delayed clamping for 1 minute group 3/91, delayed clamping for 3 minutes group 7/92).
There were no significant results for other outcomes: cord mean haemoglobin, infant mean fer-ritin, cord mean haematocrit or mean serum bilirubin.
Evidence statementThere is limited medium-level evidence from trials in high income countries that showed delayed cord clamping reduced the incidence of anaemia and increases in hyperbilirubinaemia in the baby. Other longer term outcomes are reported variably. There is high-level evidence from low to middle income countries that delayed cord clamping reduces the incidence of anaemia in the baby. Once again, other outcomes are reported variably.
GDG interpretation of the evidenceMost of the evidence is from low income countries where anaemia in babies is more prevalent, and studies from high income countries are, with one exception, not randomised trials. The highly variable descriptions of the timing of cord clamping further confuse the issue.
The impact on babies in high income countries where anaemia is less prevalent is not known.
9.3.3 Comparison of uterotonics in the management of the third stage of labour
IntroductionThe following comparisons of drugs and mode of routine uterotonics were evaluated:
• oxytocin versus no other uterotonics• umbilical oxytocin versus umbilical placebo• oxytocin versus ergot-alkaloids• oxytocin plus ergot-alkaloids versus ergot-alkaloids alone• oxytocin plus ergot-alkaloids versus oxytocin alone• prostaglandin versus other uterotonics• umbilical oxytocin versus intravenous oxytocin.
Description of included studiesOne systematic review was identified comparing the prophylactic use of oxytocin and no use of uterotonics for the active management of the third stage targeting normal healthy women.373 [EL = 1+] The study was published in 2001, included seven studies, and evaluated routine use of oxytocin for third stage management, compared with no use of uterotonics and ergot-alkaloids. Another systematic review was identified comparing routine use of ergot-alkaloids plus oxytocin with oxytocin.374 [EL = 1+] The study was published in 2004, and included six trials and 9332 women. Subgroup analysis was conducted by dose of oxytocin. There were six trials identified
181
evaluating umbilical injection of oxytocin.375–380 The included trials were of reasonable quality with similar study designs. Meta-analyses were conducted according to the two comparisons umbilical oxytocin versus intravenous oxytocin and umbilical oxytocin versus umbilical placebo. There were two systematic reviews381,382 and four trials383–386 identified for routine administration of prostaglandin, compared with another uterotonic (ergometrine and/or oxytocin), in the third stage of labour. The systematic reviews were of good quality and all the trials were reasonable quality with a reasonable level of homogeneity; hence a new meta-analysis of all included stud-ies was performed to obtain results.387–412 [EL = 1+]
Review findings
Oxytocin versus no uterotonicsThe meta-analysis373 including all trials showed less blood loss with oxytocin (PPH (clinically estimated blood loss 500 ml or greater), six trials, 3193 women, RR 0.50 [95% CI 0.43 to 0.59]; severe PPH (clinically estimated blood loss 1000 ml or greater), four trials, 2243 women, RR 0.61 [95% CI 0.44 to 0.87]) and less use of therapeutic uterotonics (five women, 2327 trials, RR 0.50 [95% CI 0.39 to 0.64]), but no evidence of a difference in mean length of the third stage (one trial, 52 women, WMD −1.80 minutes [95% CI −5.55 to 1.95 minutes]), need for manual removal of the placenta (four trials, 2243 women, RR 1.17 [95% CI 0.79 to 1.73]) or nausea between birth of the baby and discharge from the labour ward (one trial, 52 women, RR 0.29 [95% CI 0.01 to 6.74]).
When including randomised trials only, the analysis showed evidence that oxytocin seemed to reduce incidence of PPH defined as clinically estimated blood loss 500 ml or greater (four tri-als, 2213 women, RR 0.61 [95% CI 0.51 to 0.72]), but no evidence of difference in severe PPH (clinically estimated blood loss 1000 ml or greater, three trials, 1273 women, RR 0.72 [95% CI 0.49 to 1.05]).
One included trial compared active management of third stage with oxytocin versus only other two components of active management without oxytocin. The findings from the trial on blood loss showed an even higher significance level (PPH (clinically estimated blood loss 500 ml or greater), one trial, 970 women, RR 0.29 [95% CI 0.21 to 0.41]; severe PPH (clinically estimated blood loss 1000 ml or greater), one trial, 970 women, RR 0.33 [95% CI 0.14 to 0.77]), but there was no evidence of a difference in manual removal of the placenta (one trial, 970 women, RR 0.99 [95% CI 0.62 to 1.59]). However, analysis only including trials of women without any other components of active management of third stage and comparing routine use of oxytocin with no use of oxytocin showed evidence of significant reduction in incidence of PPH (defined as clinically estimated blood loss 500 ml or greater, two trials, 1221 women, RR 0.61 [95% CI 0.51 to 0.73], but no evidence of difference in severe PPH (clinically estimated blood loss 1000 ml or greater, two trials, 1221 women, RR 0.73 [95% CI 0.49 to 1.07].
When analysed including women who had been given oxytocin before placental birth only, the analysis also showed reduction in incidence of PPH of both definitions (clinically estimated blood loss 500 ml or greater, five trials, 2253 women, RR 0.50 [95% CI 0.42 and 0.58]; severe PPH (clinically estimated blood loss 1000 ml or greater, four trials, 2243 women, RR 0.61 [95% CI 0.44 to 0.87]) and use of therapeutic uterotonics (three trials, 1273 women, RR 0.64 [95% CI 0.47 to 0.87]). However, when analysed only including women who had been given oxytocin after placental birth, there was no significant difference in incidence of PPH defined as clinically estimated blood loss 500 ml or greater (one trial, 940 women, RR 0.60 [95% CI 0.32 to 1.12])
Umbilical oxytocin versus umbilical placeboThere were three trials included. One trial was conducted in Thailand, published in 1998.378 [EL = 1+] The study population included 50 normal healthy women in the third stage of labour. The intervention was oxytocin (20 IU) intra-umbilical injection, compared with intra-umbilical placebo injection. One trial was conducted in Turkey, published in 1996.379 [EL = 1+] The study population included 47 normal healthy women in the third stage of labour. The intervention was intra-umbilical injection of oxytocin (20 IU), compared with placebo. One trial was conducted in the USA, published in 1987.413 The study population included 50 normal healthy women in the third stage of labour. The intervention was oxytocin (10 IU) intra-umbilical injection, com-pared with umbilical placebo injection. The meta-analyses of the trials showed that there was
Normal labour: third stage

182
Intrapartum care
no evidence of difference in blood loss (pre-/postpartum haematocrit level difference, one trial, WMD −0.20% [−1.40% to 1.00%]; estimated blood loss, two trials, WMD −16.06 ml [−66.63 to 34.50 ml]) or duration of third stage (WMD −1.95 minutes [−5.54 to 1.64 minutes].
Oxytocin versus ergot-alkaloidsThe analysis including all trials showed there was no evidence of a difference in PPH (clinically estimated blood loss 500 ml or greater, five trials, 2719 women, RR 0.90 [95% CI 0.70 to 1.16]), severe PPH (clinically estimated blood loss 1000 ml or greater, three trials, 1746 women, RR 0.99 [95% CI 0.56 to 1.74]), use of therapeutic uterotonics (two trials, 1208 women, RR 1.02 [95% CI 0.67 to 1.55]), mean length of the third stage (one trial, 1049 women, WMD −0.80 minutes [95% CI −1.65 to 0.05 minutes]), but there was a reduction in need for manual removal of the placenta (three trials, 1746 women, RR 0.57 [95% CI 0.41 to 0.79]).
Neither an analysis including only randomised trials, nor including women with expectant man-agement, showed evidence of a difference in any of the outcomes above.
When analysed only including women who had been given oxytocics before placental delivery, there was also no evidence of a difference in blood loss, but there was a reduction in need for manual removal of the placenta (three trials, 1746 women, RR 0.57 [95% CI 0.41 to 0.79]). However, when analysed only including women who had been given oxytocics after placental delivery, there was no evidence of a difference in PPH.
Oxytocin plus ergot-alkaloids versus ergot-alkaloids alone
Oxytocin plus ergot alkaloids (Syntometrine) versus ergot alkaloids aloneWhen analysed including all trials, there was no evidence of a difference in blood loss (PPH (clinically estimated blood loss 500 ml or greater), five trials, 2891 women, RR 1.29 [95% CI 0.90 to 1.84]; severe PPH (clinically estimated blood loss 1000 ml or greater), one trial, 1120 women, RR 1.67 [95% CI 0.40 to 6.94]), duration of the third stage (longer than 20 minutes), three trials, 2281 women, RR 0.89 [95% CI 0.67 to 1.19]), but there was a reduction in the need for manual removal of the placenta with oxytocin plus ergot alkaloids, compared with ergot alkaloids only (two trials, 1927 women, RR 1.02 [95% CI 0.48 to 2.20]).
When analysed only including randomised trials, the intervention showed significant reduction in blood loss (PPH (clinically estimated blood loss 500 ml or greater), two trials, 1161 women, RR 0.44 [95% CI 0.20 to 0.94]) but no evidence of a difference in duration of the third stage (longer than 20 minutes, one trial, 354 women, RR 3.21 [95% CI 0.34 to 30.57]), compared with ergot alkaloids only.
Oxytocin plus ergot-alkaloids versus oxytocin aloneThe meta-analyses including all trials showed evidence of reduction of blood loss with ergometrine-oxytocin compared with oxytocin (blood loss 500 ml or greater, six trials, 9332 women, OR 0.82 [95% CI 0.71 to 0.95]) and need for therapeutic oxytocics (three trials, 5465 women, OR 0.83 [95% CI 0.72 to 0.96]). However, there was also evidence of maternal complications such as elevation of diastolic blood pressure (four trials, 7486 women, OR 2.40 [95% CI 1.58 to 3.64]), vomiting (three trials, 5458 women, OR 4.92 [95% CI 4.03 to 6.00]), nausea (nausea, three trials, 5458 women, OR 4.07 [95% CI 3.43 to 4.84]; vomiting and/or nausea, four trials, 7486 women, OR 5.71 [95% CI 4.97 to 6.57]). There was no evidence of other complications such as blood loss 1000 ml or greater, rate of blood transfusion, manual removal of the placenta or duration of the third stage. There was no evidence of differences in neonatal outcomes. Subgroup analysis by oxytocin dose (5 IU or 10 IU) showed that the analysis for both doses showed significant reduction by use of ergometrine-oxytocin in incidence of PPH defined as blood loss of 500 ml or greater, compared with use of oxytocin, although the effect was found to be greater when compared with 5 IU of oxytocin dose. Neither dose showed significant difference in incidence of PPH defined as blood loss 1000 ml or greater.
Prostaglandin versus other uterotonicsThe meta-analysis showed that use of prostaglandin was less effective in reducing risk of PPH (16 trials, severe PPH, OR 1.31 [95% CI 1.14 to 1.50]; 21 trials, moderate PPH, OR 1.49 [95% CI 1.39 to 1.59]) than use of other uterotonics, although women in the prostaglandin group experi-
183
enced more side effects than the control group (nausea, 12 trials, OR 0.86 [95% CI 0.74 to 1.06]; vomiting, 19 trials, OR 1.27 [95% CI 1.04 to 1.55]; diarrhoea, 15 trials, OR 1.97 [95% CI 1.44 to 2.70]; pyrexia, 12 trials, OR 6.67 [95% CI 5.57 to 7.99]; and shivering, 19 trials, OR 3.51 [95% CI 3.25 to 3.80]).
Umbilical oxytocin versus IV oxytocinThere are three trials included. One trial was conducted in India, published in 1995.376 [EL = 1+] The study population included 100 normal healthy women in the third stage of labour. The intervention was intra-umbilical oxytocin (10 IU) infusion compared with IV oxytocin (10 IU) infu-sion. One trial was conducted in the USA, published in 1991.377 [EL = 1+] The study population included 104 normal healthy women in the third stage of labour. The intervention was intra-umbilical oxytocin (20 IU) infusion compared with IV oxytocin infusion (20 IU). Another trial was conducted in the USA and published in 1989.375 [EL = 1+] The study population included 50 normal healthy women in the third stage of labour. The intervention was intra-umbilical oxy-tocin (20 IU) infusion, compared with IV oxytocin (20 IU) infusion. The Indian trial376 and Reddy trial375 showed a similar direction of results, and the Porter trial377 showed an opposite direction of results, although no particular difference in study design was found. The meta-analyses of the trials showed that there was no evidence of difference in blood loss (pre-/postpartum haematocrit level difference, three trials, WMD −1.24% [95% CI −5.16% to 2.67%]; pre-/postpartum haemo-globin level difference, three trials, WMD −0.08 g/dl [95% CI −1.41 to 1.26 g/dl]; estimated blood, loss two trials, WMD −134.92 ml [95% CI −255.01 to −14.83 ml]) or duration of third stage (three trials WMD −1.78 minutes [95% CI −4.68 to 1.11 minutes].
Evidence statementUse of oxytocin alone seemed to reduce the incidence of PPH, compared with no use of uteroton-ics, with no evidence of difference in incidence of nausea. When oxytocin alone was compared with ergot-alkaloid, there were no significant differences in incidence of PPH, although signifi-cant reduction in the need for manual removal of placenta was found in the oxytocin group. There was no evidence of difference between ergot-alkaloids plus oxytocin and single use of ergot-alkaloids. However, ergot-alkaloids plus oxytocin seemed to reduce incidence of PPH with increased incidences of vomiting and nausea, compared with use of single oxytocin. Single use of oxytocin 10 IU showed closer effect to ergot-alkaloids plus oxytocin on reduction in PPH than single use of oxytocin 5 IU. Use of prostaglandin, compared with other uterotonics, resulted in higher incidence of both PPH and adverse events. Routine umbilical injection of oxytocin, com-pared with intravenous oxytocin, showed significant reduction in estimated blood loss, although there was not enough information on adverse events.
GDG interpretation of the evidence (physiological and active management of the third stage of labour)Many of the studies do not fulfil the formal criteria of active management of third stage. In view of this, the evidence summarised above, and the side effects of ergometrine plus oxytocin, the GDG concluded that this is sufficient to warrant the recommendations below.
Recommendations on physiological and active management of the third stage of labour
Active management of the third stage is recommended, which includes the use of oxytocin (10 international units [IU] by intramuscular injection), followed by early clamping and cutting of the cord and controlled cord traction.*
Women should be informed that active management of the third stage reduces the risk of maternal haemorrhage and shortens the third stage.
Women at low risk of postpartum haemorrhage who request physiological management of the third stage should be supported in their choice.
* At the time of publication (September 2007), oxytocin did not have UK marketing authorisation for this indication. Informed consent should be obtained and documented.
Normal labour: third stage

184
Intrapartum care
Changing from physiological management to active management of the third stage is indicated in the case of:
• haemorrhage• failure to deliver the placenta within 1 hour• the woman’s desire to artificially shorten the third stage.
Pulling the cord or palpating the uterus should only be carried out after administration of oxy-tocin as part of active management.
In the third stage of labour neither umbilical oxytocin infusion nor prostaglandin should be used routinely.
Research recommendation on cord clamping
Studies should be carried out to investigate the timing of cord clamping and balance of risk/benefit to both mother and baby.

185
Tab
le 9
.2
Sum
mar
y o
f fi
nd
ings
on
man
agem
ent
of
the
thir
d s
tage
of
lab
ou
r
Inte
rven
tio
nC
om
par
ato
rB
loo
d l
oss
at
leas
t 5
00
ml
Blo
od
lo
ss a
t le
ast
10
00
ml
Ad
vers
e ev
ents
Oth
er o
utc
om
es
Act
ive
man
agem
ent
of
thir
d s
tage
(p
rop
hyl
acti
c u
tero
ton
ics,
ear
ly
cord
cla
mp
ing/
cutt
ing
and
co
ntr
oll
ed c
ord
tr
acti
on
)
Phys
iolo
gica
l m
anag
emen
t o
f th
ird
st
age
Wo
men
with
hig
h a
nd
low
ris
k
RR
0.3
8 [
95
% C
I 0
.32
to
0.4
6]
RR
0.3
3 [
95
% C
I 0
.21
to
0.5
1]
Hyp
erte
nsi
on
RR
3.4
6 [
95
% C
I 1
.68
to
7.0
9]
Vo
mit
ing
RR
2.1
9 [
95
% C
I 1
.68
to
2.8
6]
Nau
sea
RR
1.8
3 [
95
% C
I 1
.51
to
2.2
3]
Hea
dac
he
RR
1.9
7 [
95
% C
I 1
.01
to
3.8
2]
Mat
ern
al d
issa
tisf
acti
on
w
ith
th
ird
sta
ge
man
agem
ent
RR
0.5
6
[95
% C
I 0
.35
to
0.9
0]
Wo
men
with
low
ris
k
RR
0.3
4 [
95
% C
I 0
.27
to
0.4
3]
RR
0.4
7 [
95
% C
I 0
.27
to
0.8
2]
Hyp
erte
nsi
on
RR
9.6
5 [
95
% C
I 2
.25
to
41
.30
]
Vo
mit
ing
RR
2.2
1 [
95
% C
I 1
.50
to
3.2
7]
Nau
sea
RR
1.8
8 [
95
% C
I 1
.44
to
2.4
5]
Hea
dac
he
RR
2.3
7 [
95
% C
I 0
.98
to
5.7
2]
Mat
ern
al d
issa
tisf
acti
on
w
ith
th
ird
sta
ge
man
agem
ent
RR
0.5
6
[95
% C
I 0
.35
to
0.9
0]
Del
ayed
co
rd
clam
pin
gEa
rly
cord
cla
mp
ing
No
evi
den
ce o
f d
iffe
ren
ceN
o e
vid
ence
of
dif
fere
nce
Incr
ease
in
in
cid
ence
s o
f ja
un
dic
e an
d
po
lycy
thae
mia
Red
uct
ion
in
an
aem
ia
in b
abie
s in
dev
elo
pin
g co
un
trie
s
Co
mp
aris
on
of
ute
roto
nic
s
Oxy
toci
nN
o u
tero
ton
ics
RR
0.5
0 [
95
% C
I 0
.43
to
0.5
9]
RR
0.6
1 [
95
% C
I 0
.44
to
0.8
7]
Nau
sea
RR
0.2
9 [
95
% C
I 0
.01
to
6.7
4]
Um
bil
ical
oxy
toci
nN
o u
tero
ton
ics
No
in
form
atio
nN
o i
nfo
rmat
ion
No
in
form
atio
nB
loo
d l
oss
WM
D
−1
6.0
6 m
l
[95
% C
I −
66
.63
to
3
4.5
0 m
l]
Oxy
toci
nEr
got-
alka
loid
sR
R 0
.90
[9
5%
CI
0.7
0 t
o 1
.16
]R
R 0
.99
[9
5%
CI
0.5
6 t
o 1
.74
]N
o i
nfo
rmat
ion
Nee
d f
or
man
ual
rem
ova
l o
f th
e p
lace
nta
RR
0.5
7
[95
% C
I 0
.41
to
0.7
9]
Ergo
t-al
kalo
ids
plu
s o
xyto
cin
Ergo
t-al
kalo
ids
alo
ne
RR
1.2
9 [
95
% C
I 0
.90
to
1.8
4]
RR
1.6
7 [
95
% C
I 0
.40
to
6.9
4]
No
in
form
atio
n
Ergo
t-al
kalo
ids
plu
s o
xyto
cin
Oxy
toci
n a
lon
eO
R 0
.82
[9
5%
CI
0.7
1 t
o 0
.95
]O
R 0
.78
[9
5%
CI
0.5
8 t
o 1
.03
]V
om
itin
g O
R 4
.92
[9
5%
CI
4.0
3 t
o 6
.00
]
Nau
sea
OR
4.0
7 [
95
% C
I 3
.43
to
4.8
4]
Vo
mit
ing
and
/or
nau
sea
OR
5.7
1 [
95
% C
I 4
.97
to
6.5
7])
Oxy
toci
n 5
IU
on
lyO
R 0
.43
[0
.23
to
0.8
3]
OR
0.1
4 [
0.0
0 t
o 6
.85
]N
o i
nfo
rmat
ion
Oxy
toci
n 1
0 I
U o
nly
OR
0.8
5 [
0.7
3 t
o 0
.98
]O
R 0
.78
[0
.59
to
1.0
4]
Vo
mit
ing
OR
4.9
2 [
4.0
3 t
o 6
.00
]
Nau
sea
OR
4.0
7 [
3.4
3 t
o 4
.84
]
Vo
mit
ing
and
/or
nau
sea
OR
5.7
1 [
4.9
7 t
o 6
.57
]
Pro
stag
lan
din
Oth
er u
tero
ton
ics
OR
1.4
9 [
95
% C
I 1
.39
to
1.5
9]
OR
1.3
1 [
95
% C
I 1
.14
to
1.5
0]
Nau
sea
OR
0.8
6 [
95
% C
I 0
.74
to
1.0
6]
Vo
mit
ing
OR
1.2
7 [
95
% C
I 1
.04
to
1.5
5]
Um
bil
ical
oxy
toci
nIn
trav
eno
us
oxy
toci
nN
o i
nfo
rmat
ion
No
in
form
atio
nN
o i
nfo
rmat
ion
Esti
mat
ed b
loo
d l
oss
W
MD
−1
34
.92 m
l [9
5%
CI
−2
55
.01
to
−
14
.83
]
Normal labour: third stage

186
10 Normal labour: care of the baby and woman immediately after birth
10.1 Introduction
Birth is an immensely important, often life-changing, event. Not only does the process of labour and birth present challenges to the baby but there are also major rapid physiological changes that take place to enable the baby to adapt to life after birth. These include the establishment of respirations, changes to the cardiovascular system, the regulation of body temperature, digestion and absorption and the development of a resistance to infections.
The vast majority of babies make this transition uneventfully but vigilance on the part of health-care professionals, and timely intervention when necessary, can influence the baby’s longer term health and development.
Care of the baby immediately after birth in the intrapartum period is discussed in this chapter. Further care thereafter is discussed in the NICE clinical guideline on Postnatal Care,414 includ-ing promotion of breastfeeding, infant and mother bonding, and vitamin K supplementation for newborn babies.
Care of the woman immediately after birth includes assessment of her physical and emotional condition, as well as assessment (and possible repair) of trauma sustained during birth. It is also crucially important that appropriate assessment and treatment of any complications is under-taken, as failure to do so can have long-term consequences for the woman’s physical, emotional and psychological wellbeing. As with the immediate care of the newborn baby, this should be balanced between assessing the woman’s physical needs (and intervening should that be required) and giving the new mother/parents the opportunity to savour and enjoy this momen-tous and life-changing event.
10.2 Initial assessment of the newborn baby and mother–infant bonding
10.2.1 Apgar score
IntroductionThe Apgar score was developed in 1953 and has been widely adopted to assess the baby at the time of birth.415 It was first planned as an indicator for the need for resuscitation. It was not origi-nally intended to predict longer term prognosis and includes assessment of colour, heart rate, tone, respiratory rate and reflex irritability.415–417
Clinical questionWhat is the evidence that different methods of initial neonatal assessment and examination influ-ence outcomes?
• Including cardiovascular-respiratory and abnormalities assessment.
Description of included studiesA total of five cohort studies and one systematic review (containing 16 cohort studies) were identified.418–423 Only studies comparing the Apgar score with neonatal death and diagnosis were considered homogeneous enough to provide a new meta-analysis of the data. [EL = 2+]
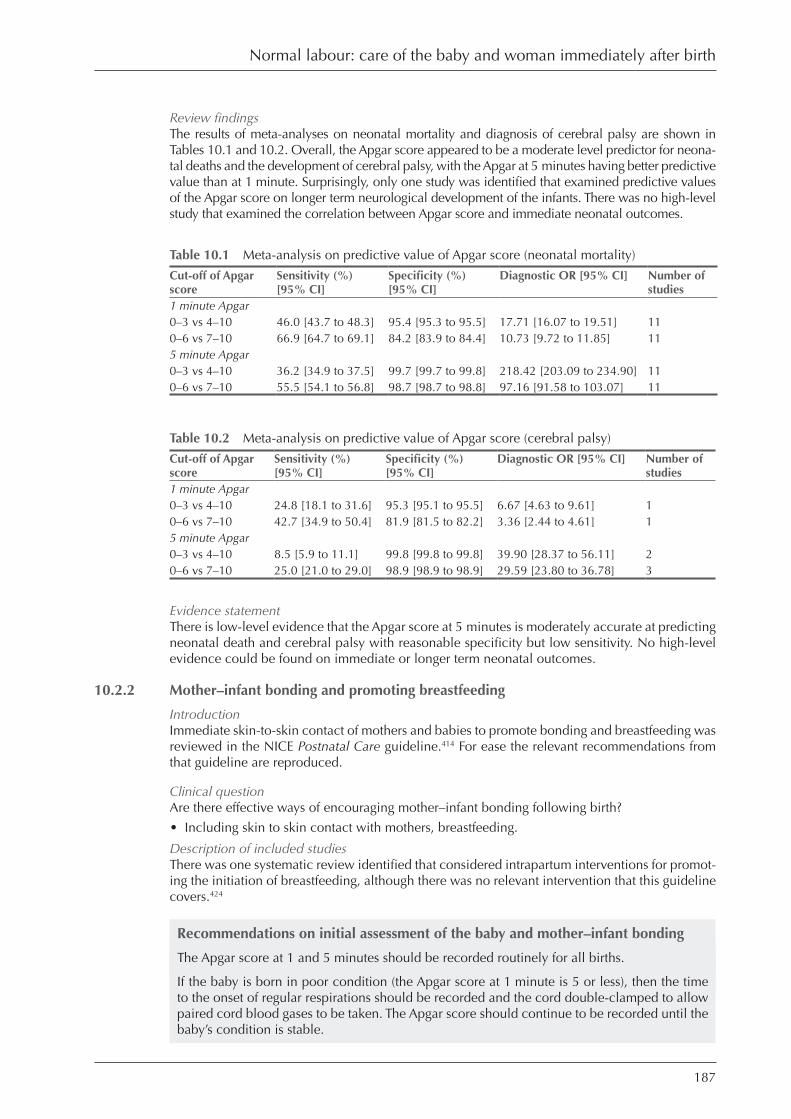
187
Review findingsThe results of meta-analyses on neonatal mortality and diagnosis of cerebral palsy are shown in Tables 10.1 and 10.2. Overall, the Apgar score appeared to be a moderate level predictor for neona-tal deaths and the development of cerebral palsy, with the Apgar at 5 minutes having better predictive value than at 1 minute. Surprisingly, only one study was identified that examined predictive values of the Apgar score on longer term neurological development of the infants. There was no high-level study that examined the correlation between Apgar score and immediate neonatal outcomes.
Table 10.1 Meta-analysis on predictive value of Apgar score (neonatal mortality)
Cut-off of Apgar score
Sensitivity (%) [95% CI]
Specificity (%) [95% CI]
Diagnostic OR [95% CI] Number of studies
1 minute Apgar
0–3 vs 4–10 46.0 [43.7 to 48.3] 95.4 [95.3 to 95.5] 17.71 [16.07 to 19.51] 11
0–6 vs 7–10 66.9 [64.7 to 69.1] 84.2 [83.9 to 84.4] 10.73 [9.72 to 11.85] 11
5 minute Apgar
0–3 vs 4–10 36.2 [34.9 to 37.5] 99.7 [99.7 to 99.8] 218.42 [203.09 to 234.90] 11
0–6 vs 7–10 55.5 [54.1 to 56.8] 98.7 [98.7 to 98.8] 97.16 [91.58 to 103.07] 11
Table 10.2 Meta-analysis on predictive value of Apgar score (cerebral palsy)
Cut-off of Apgar score
Sensitivity (%) [95% CI]
Specificity (%) [95% CI]
Diagnostic OR [95% CI] Number of studies
1 minute Apgar
0–3 vs 4–10 24.8 [18.1 to 31.6] 95.3 [95.1 to 95.5] 6.67 [4.63 to 9.61] 1
0–6 vs 7–10 42.7 [34.9 to 50.4] 81.9 [81.5 to 82.2] 3.36 [2.44 to 4.61] 1
5 minute Apgar
0–3 vs 4–10 8.5 [5.9 to 11.1] 99.8 [99.8 to 99.8] 39.90 [28.37 to 56.11] 2
0–6 vs 7–10 25.0 [21.0 to 29.0] 98.9 [98.9 to 98.9] 29.59 [23.80 to 36.78] 3
Evidence statementThere is low-level evidence that the Apgar score at 5 minutes is moderately accurate at predicting neonatal death and cerebral palsy with reasonable specificity but low sensitivity. No high-level evidence could be found on immediate or longer term neonatal outcomes.
10.2.2 Mother–infant bonding and promoting breastfeeding
IntroductionImmediate skin-to-skin contact of mothers and babies to promote bonding and breastfeeding was reviewed in the NICE Postnatal Care guideline.414 For ease the relevant recommendations from that guideline are reproduced.
Clinical questionAre there effective ways of encouraging mother–infant bonding following birth?
• Including skin to skin contact with mothers, breastfeeding.
Description of included studiesThere was one systematic review identified that considered intrapartum interventions for promot-ing the initiation of breastfeeding, although there was no relevant intervention that this guideline covers.424
Recommendations on initial assessment of the baby and mother–infant bonding
The Apgar score at 1 and 5 minutes should be recorded routinely for all births.
If the baby is born in poor condition (the Apgar score at 1 minute is 5 or less), then the time to the onset of regular respirations should be recorded and the cord double-clamped to allow paired cord blood gases to be taken. The Apgar score should continue to be recorded until the baby’s condition is stable.
Normal labour: care of the baby and woman immediately after birth
188
Intrapartum care
Women should be encouraged to have skin-to-skin contact with their babies as soon as pos-sible after the birth.*
In order to keep the baby warm, he or she should be dried and covered with a warm, dry blanket or towel while maintaining skin-to-skin contact with the woman.
Separation of a woman and her baby within the first hour of the birth for routine postnatal procedures, for example weighing, measuring and bathing, should be avoided unless these measures are requested by the woman, or are necessary for the immediate care of the baby.*
Initiation of breastfeeding should be encouraged as soon as possible after the birth, ideally within 1 hour.*
Head circumference, body temperature and birthweight should be recorded soon after the first hour following birth.
An initial examination should be undertaken by a healthcare professional to detect any major physical abnormality and to identify any problems that require referral.
Any examination or treatment of the baby should be undertaken with the consent and in the presence of the parents or, if this is not possible, with their knowledge.
10.3 Initial assessment of the mother following birth
IntroductionAppropriate maternal observations immediately after birth are discussed in this section. Advice on further appropriate maternal observations thereafter in the postnatal period are discussed in the NICE Postnatal Care guideline.414
Clinical questionIs there evidence that the assessment of the following, on admission, and throughout labour and the immediate postnatal period, affect outcomes?
• observation of vital signs.
Description of included studiesThere was no relevant study identified to investigate effectiveness of each component of maternal observations immediately following birth.
Evidence statementThere is no high-level study investigating appropriate maternal observations immediately after birth.
Recommendation on initial assessment of the mother
Observations taken following the birth of the baby should include:
• maternal observation – temperature, pulse, blood pressure, uterine contraction, lochia• examination of placenta and membranes – assessment of their condition, structure, cord
vessels and completeness• early assessment of maternal emotional/psychological condition in response to labour and
birth• successful voiding of the woman’s bladder.
* Recommendations relating to immediate postnatal care (within 2 hours of birth) have been extracted from ‘Postnatal care: routine postnatal care of women and their babies’ (NICE clinical guideline 37). Please see NICE clinical guideline 37 for further guidance on care after birth.

189
10.4 Perineal care
Previous guidelineNo previous guidelines have considered interventions related to perineal or genital care imme-diately following childbirth.
10.4.1 Definition of perineal or genital trauma
Clinical questionWhat is the appropriate definition of perineal or genital trauma?
Overview of available evidence and evidence statementThe GDG discussed this and reached consensus to use the following recommendation for the definition of perineal or genital trauma, taken from the Green Top Guideline by the Royal College of Obstetricians and Gynaecologists on methods and materials used in perineal repair.425
Recommendation on definition of perineal/genital trauma
Perineal or genital trauma caused by either tearing or episiotomy should be defined as follows:
• first degree – injury to skin only• second degree – injury to the perineal muscles but not the anal sphincter• third degree – injury to the perineum involving the anal sphincter complex:
º 3a – less than 50% of external anal sphincter thickness torn
º 3b – more than 50% of external anal sphincter thickness torn
º 3c – internal anal sphincter torn.• fourth degree – injury to the perineum involving the anal sphincter complex (external and
internal anal sphincter) and anal epithelium.
10.4.2 Assessment of perineal trauma
Clinical questionIs there evidence that the type of assessment used to identify perineal or genital trauma affects outcomes?
Description of available evidenceThree studies are reviewed in this subsection. The first is an evaluation of a perineal assessment and repair course. The other two prospective intervention studies examine the incidence of third- and fourth-degree perineal trauma and highlight under-diagnosis as a problem in this aspect of care.
Review findingsA recent UK before and after study evaluated the effectiveness of a perineal repair course.426 [EL = 2+] The one-day course included lectures, video demonstrations and hands-on teaching of rectal examination and suturing skills using foam pads and models. Participants completed a self-assessment questionnaire prior to the course and 8 weeks afterwards. Findings for the evaluation are based on responses to 147 pairs of pre- and post-course questionnaires (response rate = 71%). Most respondents were midwives (95%), 68% of whom had been qualified for more than 5 years. Seven junior doctors and three students also attended the courses. Following attendance at the course, self-assessed responses showed an improvement in the correct classification of tears depending upon degree of anal sphincter injury: external anal sphincter (EAS) partially torn: 77% versus 85%, P = 0.049; EAS completely torn: 70% versus 85%, P = 0.001; internal anal sphincter (IAS) exposed but not torn: 63% versus 82%, P < 0.001; IAS torn: 45% versus 67%, P < 0.001; anal sphincter and mucosa torn: 80% versus 89%, P = 0.031. There was also a significant change in practice reported with more respondents performing a rectal examination prior to repairing perineal trauma after attending the course: 28% versus 89%, P < 0.001, McNemar’s test). There was also a significant shift in favour of a continuous suture to the perineal muscle and skin: con-tinuous suture to muscle: 32% versus 84%, P < 0.001; continuous suture to skin 39% versus 81%, P < 0.001. The paper does not mention two-stage perineal repair as an option.
Normal labour: care of the baby and woman immediately after birth

190
Intrapartum care
A prospective intervention study recently conducted in the UK involved re-examination by an experienced research fellow of nulliparous women who sustained perineal trauma in order to ascertain the prevalence of clinically recognisable and true occult anal sphincter injuries.427 [EL = 2+] Women were initially assessed by the attending clinician. Where obstetric anal sphinc-ter injuries (OASIS) were identified, this was confirmed by a specialist registrar or consultant. All participating women (n = 241; response rate = 95%) had an endoanal ultrasound scan performed immediately following birth (prior to suturing). Most of these women (n = 208 (86%)) attended for a repeat ultrasound scan at 7 weeks postpartum. One hundred and seventy-three of the 241 births were attended by midwives, 75% of these births being attended by midwives with at least 5 years of experience. Of the 68 births attended by obstetricians, 63 were instrumental births. The prevalence of OASIS increased significantly from 11% to 24.5% when women were re-examined by the research fellow. Of the 173 births attended by midwives, eight women were diagnosed as having sustained an OASIS. Only four of these were confirmed by the research fellow. Of the remaining 26 women who sustained OASIS, the midwife made a diagnosis of second-degree tear in 25 cases and first-degree tear in one case. All 30 incidents of OASIS were confirmed by the specialist registrar/consultant. Of the 68 births attended by obstetricians, 22 women (32%) had OASIS diagnosed and confirmed by the research fellow. A further seven cases of OASIS were identified by the research fellow, three of these cases had been missed by the duty specialist registrar but were subsequently confirmed by the specialist consultant. Of the 68 births attended by an obstetrician, the midwife caring for the woman was also asked to perform an examina-tion. Only one of the 29 OASIS was identified by a midwife and no midwife performed a rectal examination. All women with OASIS had a defect detected by endoanal ultrasound performed immediately after birth. In addition, there were three defects seen on ultrasound that were not seen clinically. No additional defects were seen at the 7 week follow-up.
A UK prospective observational study was undertaken to assess whether clinical diagnosis of third-degree tears could be improved by increased vigilance in perineal assessment.428 [EL = 3] The study involved assessment of perineal trauma sustained by women having their first vagi-nal birth at one large teaching hospital. A group of 121 women were assessed initially by the obstetrician or midwife attending the birth and then again by a single independent assessor (a clinical research fellow). Findings from this group were compared with all other women giving birth over the same 6 month period who were assessed by the attending clinician only (i.e. usual care) (n = 362). Both groups were similar for a number of key characteristics, including gesta-tion, mode of birth, analgesia used, duration of labour, birthweight, and head circumference. Episiotomies which extended to involve the anal sphincter were classified as third-degree tears. There were significantly more third-degree tears identified in the assessed group, 14.9%, compared with 7.5% in the control group. The study was underpowered to show statistical significance. In the assessed group, only 11 of the 18 third-degree tears were identified by the clinician attending the birth. Once the diagnosis was made there was no disagreement between attending clinician and research fellow. Third-degree tears were most often associated with instrumental births, especially forceps births. The percentages of women sustaining a third-degree tear for each mode of birth was spontaneous vaginal birth 3.2%, ventouse 14.9% and forceps 22%. Comparing study data with findings for a similar group of women during the 6 months before and after the study period, the overall rates of third-degree tears were before 2.5%, during 9.3%, and after 4.6%, again suggesting that many third-degree tears go undiagnosed.
Evidence statementThere is low-level evidence that suggests the systematic assessment of the vagina, perineum and rectum is required to adequately assess the extent of perineal trauma.
There is low-level evidence that current training is inadequate regarding assessment of perineal trauma.
Practitioners who are appropriately trained are more likely to provide a consistent, high standard of perineal care.
191
Recommendations on assessment of perineal trauma
Before assessing for genital trauma, healthcare professionals should:
• explain to the woman what they plan to do and why• offer inhalational analgesia• ensure good lighting• position the woman so that she is comfortable and so that the genital structures can be
seen clearly.
The initial examination should be performed gently and with sensitivity and may be done in the immediate period following birth.
If genital trauma is identified following birth, further systematic assessment should be carried out, including a rectal examination.
Systematic assessment of genital trauma should include:
• further explanation of what the healthcare professional plans to do and why• confirmation by the woman that tested effective local or regional analgesia is in place• visual assessment of the extent of perineal trauma to include the structures involved, the
apex of the injury and assessment of bleeding• a rectal examination to assess whether there has been any damage to the external or inter-
nal anal sphincter if there is any suspicion that the perineal muscles are damaged.
The timing of this systematic assessment should not interfere with mother–infant bonding unless the woman has bleeding that requires urgent attention.
The woman should usually be in lithotomy to allow adequate visual assessment of the degree of the trauma and for the repair. This position should only be maintained for as long as is nec-essary for the systematic assessment and repair.
The woman should be referred to a more experienced healthcare professional if uncertainty exists as to the nature or extent of trauma sustained.
The systematic assessment and its results should be fully documented, possibly pictorially.
All relevant healthcare professionals should attend training in perineal/genital assessment and repair, and ensure that they maintain these skills.
10.4.3 Perineal repair
Clinical questionIs there evidence that undertaking repair, the timing, analgesia and method and material of peri-neal repair affect outcomes?
Previous guidelineNo previous guideline has considered performing perineal repair following childbirth.
Undertaking repair
Description of included studiesTwo studies are reviewed under this heading. One RCT compared suturing of first- and second-degree perineal tears with non-suturing, and one qualitative study explored women’s experiences of perineal repair.
Review findingsOne UK RCT compared suturing with non-suturing of first- and second-degree perineal tears (SUNS trial).429 [EL = 1+] Randomisation was carried out across two hospital labour wards with stratification for degree of tear to produce a group of nulliparous women who had perineal tears sutured (n = 33) and nulliparous women whose perineal trauma was not sutured (n = 41). Suturing was conducted in accordance with the hospital protocols, which included continuous subcuta-neous sutures to the perineal skin. No differences were apparent between trial groups at any time point postnatally regarding level of pain as measured using the McGill Pain Questionnaire. The
Normal labour: care of the baby and woman immediately after birth
192
Intrapartum care
median total pain scores and point difference in medians for sutured versus unsutured groups were: day 1: 11 [range 0 to 33] versus 10 [range 0 to 44]; 1 [95% CI −2 to 4.999]; day 10: 0 [range 0 to 18] versus 0 [range 0 to 33]; 0 [95% CI 0 to 0.001]; 6 weeks: 0 [range 0 to 28] versus 0 [range 0 to 7]; 0 [95% CI 0 to 0]. Scores obtained using a 10 cm VAS also showed no differences between groups. Healing was measured using a standardised and validated tool, the REEDA scale. Findings showed significantly better wound edge approximation for women in the sutured group (again expressed in terms of median for scores): day 1: 1 [range 0 to 3] versus 2 [range 1 to 3]; −1 [95% CI −1.0001 to 0], P < 0.001; day 10: 1 [range 0 to 2] versus 2 [range 0 to 3]; −1 [95% CI −1.0001 to −0.0003], P = 0.003; 6 weeks: 1 [range 0 to 1] versus 1 [range 0 to 3]; 0 [95% CI −0.9999 to 0.0001], P = 0.001. Total healing scores suggested a tendency towards better wound healing in the sutured group at days 1 and 10: day 1: [range 0 to 9] versus 5 [range 1 to 10]; −1 [95% CI −2 to 0], NS; day 10: 1 [range 0 to 6] versus 2 [range 0 to 8]; 0 [95% CI −1 to 0], NS. At 6 weeks women in the sutured group had significantly better healing scores than those in the unsutured group: 0 [range 0 to 3] versus 1 [range 0 to 3]; 0 [95% CI −1.0001 to −0.0003], P = 0.003. The authors conclude that, despite the small sample size for this trial, the findings show significantly improved healing following perineal suturing compared with non-suturing.
One qualitative study was identified which explored women’s experiences of perineal trauma both during its repair and in the immediate postnatal period.430 [EL = 3] This small (n = 6), in-depth, unstructured interview-based study is limited by its reliance on the snowballing technique, which tends to result in a sample of people with similar experiences and/or views. It does, how-ever, highlight the intense and far-reaching effects of bad experiences of care. The importance of interpersonal relationships between women and their carers was illustrated through four emer-gent themes:
• the importance of communication between women and health professional• the importance of good pain relief during suturing• women feeling ‘being patched up’• women having to endure a procedure that had to be ‘got through’.
Postnatally, women described the feelings associated with coming to terms with perineal trauma. The themes here comprised:
• the severity of negative emotions (anger, upset, frustration)• concerns about the degree of skill of practitioners• failing to be heard and taken seriously when there were problems with perineal healing.
Evidence statementThere is limited high-level evidence that not suturing first- or second-degree perineal trauma is associated with poorer wound healing at 6 weeks.
There is no evidence as to long-term outcomes.
Recommendations on perineal repair
Women should be advised that in the case of first-degree trauma, the wound should be sutured in order to improve healing, unless the skin edges are well opposed.
Women should be advised that in the case of second-degree trauma, the muscle should be sutured in order to improve healing.
Timing of repair
Description of included studiesNo study was identified which considered the timing of perineal repair following childbirth.
Evidence statementThere is no high-level evidence on timing of perineal repair following childbirth.
Recommendations on timing of repair
Repair of the perineum should be undertaken as soon as possible to minimise the risk of infec-tion and blood loss.

193
Analgesia used during perineal repair
Description of included studiesThere is no evidence regarding the use of analgesia during perineal repair.
Evidence statementThere is no high-level evidence on use of analgesia during perineal repair.
Recommendations on analgesia for perineal repair
Perineal repair should only be undertaken with tested effective analgesia in place using infil-tration with up to 20 ml of 1% lidocaine or equivalent, or topping up the epidural (spinal anaesthesia may be necessary).
If the woman reports inadequate pain relief at any point this should immediately be addressed.
Method of perineal repair
Description of included studiesA systematic review of four RCTs plus an additional RCT investigated the effects of continu-ous subcuticular with interrupted transcutaneous sutures for perineal repair. Two further RCTs compared a two-layer repair technique (leaving the skin unsutured) with a three-layer repair technique.
Review findingsOne systematic review (1998) was identified which compared the effects of continuous subcu-ticular with interrupted trancutaneous sutures for perineal repair.431 [EL = 1+] Four RCTs were included in the review involving a total of 1864 women. The continuous subcuticular method was found to be associated with less short-term pain (up to day 10 postpartum) compared with interrupted sutures (three trials): 160/789 versus 218/799, OR 0.68 [95% CI 0.53 to 0.86]. No other differences were apparent between the two trials groups for the outcomes tested: analgesia up to day 10 (two trials): 56/527 versus 65/541, OR 0.86 [95% CI 0.58 to 1.26]; reported pain at 3 months (one trial): 58/465 versus 51/451, OR 1.12 [95% CI 0.75 to 1.67]; removal of suture material (up to 3 months) (one trial): 121/465 versus 16/451, OR 0.61 [95% CI 0.46 to 0.80]; failure to resume pain-free intercourse (up to 3 months) (one trial): 157/465 versus 144/451, OR 1.09 [95% CI 0.82 to 1.43]; resuturing (up to 3 months) (two trials, one with no incidents): 3/487 versus 3/531, OR 1.11 [95% CI 0.22 to 5.53]; dyspareunia (up to 3 months) (three trials): 172/775 versus 184/749, OR 0.88 [95% 0.69 to 1.12]. The authors concluded that the continu-ous subcuticular technique of perineal repair may be associated with less pain in the immediate postpartum period than the interrupted suture technique. The long-term effects are less clear. It is also noted that, while three studies used the same suture material (Dexon) throughout the repair, one trial compared repair using chromic catgut with repair using Dexon. Also, there was considerable heterogeneity between studies regarding skill and training of persons carrying out the repair. The single trial that demonstrated a statistically significant reduction in short-term pain for women in the continuous subcuticular repair group was the trial that also ensured staff were trained and practised in this technique prior to the trial.
A recent UK RCT compared continuous versus interrupted perineal repair with standard or rapidly absorbed sutures.432 [EL = 1+] The study was a 2 × 2 factorial design to allow both comparisons to be made. Findings from the trial relating to method of repair will be reported here (see the next subsection for findings from the materials arm of the trial). A continuous suturing technique for perineal repair (vaginal wall, perineal muscle and skin repaired with one continuous suture) (n = 771) was compared with interrupted sutures (continuous suture to vaginal wall, interrupted sutures to perineal muscle and skin) (n = 771). The trial included women with first- or second-degree tears or an episiotomy following a spontaneous birth. Continuous subcuticular sutures were associated with significantly less short-term perineal pain compared with interrupted sutures: pain at 2 days: 530/770 versus 609/770, OR 0.59 [95% CI 0.44 to 0.79]; pain at 10 days: 204/770 versus 338/769, OR 0.47 [95% CI 0.35 to 0.61]. This reduction in pain at 10 days was noted while sitting, walking, passing urine and opening bowels. No difference was noted between
Normal labour: care of the baby and woman immediately after birth

194
Intrapartum care
groups regarding long-term pain measures, for example: pain at 3 months: 70/751 versus 96/741, OR 0.70 [95% CI 0.46 to 1.07]; pain at 12 months: 31/700 versus 47/689, OR 0.64 [95% CI 0.35 to 1.16]; dyspareunia at 3 months: 98/581 versus 102/593, OR 0.98 [95% CI 0.72 to 1.33]; dys-pareunia at 12 months: 94/658 versus 91/667, OR 1.05 [95% CI 0.77 to 1.43]. Fewer women with continuous sutures reported that the sutures were uncomfortable 2 days post-repair: 273/770 ver-sus 318/770, OR 0.78 [95% CI 0.64 to 0.96]. This difference was slightly more marked at 10 days (OR 0.58 [95% CI 0.46 to 0.74]). Significantly more women in the interrupted group reported tight sutures both at 2 and 10 days, although the numbers were quite small. The need for suture removal was significantly higher in the interrupted group: suture removal between 10 days and 3 months: 22/751 versus 63/741, OR 0.36 [95% CI 0.23 to 0.55]. Wound gaping was more frequent follow-ing repair using the continuous technique, although again the numbers were quite small (wound gaping at 10 days: 23/770 versus 50/769, OR 0.46 [95% CI 0.29 to 0.74]). Significantly more women were satisfied with their perineal repair following repair using a continuous suture tech-nique both at 3 months: 628/751 versus 560/741, OR 1.64 [95% CI 1.28 to 2.11] and 12 months: 603/700 versus 542/689, OR 1.68 [95%1.27 to 2.21]. Women in the continuous repair group were also more likely to report that they felt ‘back to normal’ at 3 months postpartum: 414/700 versus 332/689, OR 1.55 [95% CI 1.26 to 1.92]. It is noted that senior midwives (Grade G) were significantly more likely to use the continuous suturing technique compared with Grade E and F midwives. Subsequent analyses were undertaken taking this into consideration.
A UK RCT published in 1998 compared a two-stage perineal repair (n = 890) with the more usual three-stage repair (n = 890).433 [EL = 1+] This trial also employed a 2 × 2 factorial design compar-ing both the method of repair and suture material used (findings regarding the latter are reported in the following subsection). At 2 days no differences were noted between the trial groups for any of the pain measures investigated: any pain in last 24 hours: 545/885 (62%) versus 569/889 (64%); analgesia in last 24 hours: 400/885 (45%) versus 392/889 (44%); tight stitches:162/885 (18%) versus 196/889 (22%). Significantly more women in the two-stage repair group had a gap-ing perineal wound: 203/885 (23%) versus 40/889 (4%), P < 0.00001. At 10 days, while there were no significant differences in reported pain and analgesia use (reported pain in last 24 hours: 221/886 (25%) versus 244/885 (28%); analgesia in last 24 hours: 73/886 (8%) versus 69/885 (8%)), significantly more women in the three-stage repair group reported tight stitches: 126/886 (14%) versus 163/885 (18%), RR 0.77 [95% CI 0.62 to 0.96], P = 0.02. Incidence of perineal gaping was still higher in the two-stage repair group at 10 days: 227/886 (26%) versus 145/885 (16%), P < 0.00001. Women in the two-stage repair group were also significantly less likely to have had suture material removed: 26/886 (3%) versus 67/885 (8%), P < 0.0001. Incidences of repair breakdown were very low and similar for the two groups (n = 5 versus n = 7). At 3 months postpartum there were no differences in most pain measures, for example: any pain in last week: 64/828 (8%) versus 87/836 (10%); resumption of sexual intercourse: 704/828 (85%) versus 712/836 (85%); resumption of pain-free intercourse: 576/828 (70%) versus 551/836 (66%). There was, however, a difference in reported dyspareunia: 128/890 (14.3%) versus 162/890 (18.2%), RR 0.80 [95% CI 0.65 to 0.99], P = 0.04. The difference for removal of suture material was still apparent at 3 months in favour of the continuous method group: 59/828 (7%) versus 98/836 (11%), RR 0.61 [95% CI 0.45 to 0.83]. There was little resuturing required and no difference between groups (n = 4 versus n = 9).
A 1 year postal questionnaire follow-up study was carried out for the above trial, involving 793 women.434 [EL = 1+] The follow-up sample was deliberately biased to include 31% women who had had an instrumental birth (compared with 17% in the original sample). There was no differ-ence between groups regarding persistent pain at 1 year: 28/396 versus 26/396. Women who had undergone the three-stage perineal repair were significantly more likely to report that the perineal area ‘felt different’ than women who had undergone two-stage repair: 17/395 versus 157/396, RR 0.75 [95% CI 0.61 to 0.91]. Subgroup analyses showed this difference to be more marked fol-lowing spontaneous births compared with instrumental births: instrumental: 45/123 versus 55/124, RR 0.82 [95% CI 0.61 to 1.12]; spontaneous: 72/272 versus 102/272, RR 0.71 [95% CI 0.55 to 0.91]; and more marked following repair using interrupted sutures compared with mixed technique or subcuticular technique: interrupted technique: 57/209 versus 87/202, RR 0.63 [95% CI 0.48 to 0.83]; mixed technique: 46/133 versus 55/136, RR 0.86 [95% CI 0.63 to 1.17]; subcuticular: 14/53 versus 15/58, RR 1.02 [95% CI 0.55 to 1.91]. There were no significant differences between groups for dyspareunia, failure to resume pain-free intercourse or need for resuturing.

195
A second RCT conducted in Nigeria (2003) also compared two-stage repair with three-stage repair.435 [EL = 1+] The trial was conducted across four sites and recruited 1077 women, 823 of whom were followed up to 3 months postnatally (response rate = 76.4%). As with the UK trial, midwives and labour ward obstetricians were trained in the two-stage repair technique prior to the study. Where skin repair was undertaken, a continuous technique was taught and encour-aged. Most repairs were undertaken using chromic catgut. Postnatal assessments of wound healing were carried out by a researcher blinded to the trial allocation of the woman. Compared with three-stage repair, two-stage repair was associated with less pain and fewer reports of tight sutures at 48 hours postnatally (perineal pain: 57% versus 65%, RR 0.87 [95% CI 0.78 to 0.97); tight sutures: 25% versus 38%, RR 0.67 [95% CI 0.54 to 0.82)). Analgesia use and degree of inflammation and bruising were also significantly less in the two-stage group (analgesia use: 34% versus 49%, RR 0.71 [95% CI 0.60 to 0.83]; inflammation/bruising: 7% versus 14%, RR 0.50 [95% CI 0.33 to 0.77]). Wound gaping (skin edges > 0.5 cm apart) was more prevalent in the two-stage repair group: 26% versus 5%, RR 4.96 [95% CI 3.17 to 7.76]. The differences regard-ing perineal pain and analgesia were still apparent at 14 days and 6 weeks postpartum in favour of the two-stage repair group. The difference in wound gaping was much smaller by 14 days: 21% versus 17%, RR 1.25 [95% CI 0.94 to 1.67]. There was no difference in wound breakdown: 3% versus 2%, RR 1.27 [95% CI 0.56 to 2.85]. At 3 months postpartum, women in the two-stage repair group reported a lower incidence of dyspareunia compared with women in the three-stage repair group: 10% versus 17%, RR 0.61 [95% CI 0.43 to 0.87]. The authors pointed out that the differences in short-term pain found in this study may be due to the fact they used catgut for most of the perineal repairs rather than a synthetic absorbable suture material.
Evidence statementThere is high-level evidence that a continuous non-locked suturing technique for repair of peri-neal muscle is associated with less short-term pain More women who were repaired with a continuous non-locked technique were also satisfied with their perineal repair and felt back to normal at 3 months.
A two-stage repair (where the skin is opposed but not sutured) is associated with no differences in the incidence of repair breakdown but is associated with less dyspareunia at 3 months. There is some evidence that it is also associated with less short-term perineal pain when compared with skin repair undertaken using chromic catgut sutures.
Continuous subcuticular skin repair is associated with less short-term pain when compared with interrupted skin repair.
Recommendations on methods of perineal repair
If the skin is opposed following suturing of the muscle in second-degree trauma, there is no need to suture it.
Where the skin does require suturing, this should be undertaken using a continuous subcu-ticular technique.
Perineal repair should be undertaken using a continuous non-locked suturing technique for the vaginal wall and muscle layer.
Materials for perineal repair
Description of included studiesOne systematic review and two additional RCTs have compared the effects of absorbable syn-thetic suture material with catgut or chromic catgut. An additional UK RCT compared rapidly absorbed synthetic suture material with standard synthetic suture material.
Review findingsOne systematic review (1999) has been conducted to assess the effects of absorbable synthetic suture material compared with catgut on short- and long-term pain experienced by women fol-lowing perineal repair.436 [EL = 1+] The review included eight trials involving 3642 women. Seven trials used polyglycolic acid (Dexon) and one trial used polyglactin (Vicryl). Women allocated to groups using absorbable synthetic suture material reported significantly less short-
Normal labour: care of the baby and woman immediately after birth
196
Intrapartum care
term pain compared with those sutured using catgut: day 3 or before: OR 0.62 [95% CI 0.54 to 0.71], eight trials; days 4–10: OR 0.71 [95% CI 0.58 to 0.87], three trials; analgesia use up to day 10: OR 0.63 [95% CI 0.52 to 0.77], five trials. Women allocated to perineal repair using absorbable synthetic suture material also reported less suture dehiscence up to day 10: OR 0.45 [95% CI 0.29 to 0.70], five trials; and need for resuturing of the perineal wound up to 3 months: OR 0.26 [95% CI 0.10 to 0.66], four trials. However, the need for removal of suture material up to 3 months was greater in the absorbable synthetic group: OR 2.01 [95% CI 1.56 to 2.58], two trials. There was no difference reported for long-term pain: OR 0.81 [95% CI 0.61 to 1.08], two trials. The authors of the review noted that the skill level of clinicians may be very different between trials, e.g. suture dehiscence in one trial was 37/71 for the control group and 12/77 for the experimental group, while in another trial there were no incidents of suture dehiscence.
One additional RCT has been conducted in Australia comparing absorbable synthetic suture material (polyglactin) (n = 194) with chromic catgut (n = 197).437 [EL = 1+] Women with a third-degree tear or an instrumental birth were excluded from the trial. Owing to chance imbalance in the proportion of nulliparous women between the two trial groups, parity-adjusted odds ratios were calculated. There was a tendency towards reduced short-term pain in women allocated to the polyglactin group, but differences did not reach statistical significance: perineal pain at 1 day: adjusted OR 0.64 [95% CI 0.39 to 1.06]; perineal pain at 3 days: adjusted OR 0.70 [95% CI 0.46 to 1.08]. No significant differences were seen between groups for any of the longer-term pain outcomes (any perineal pain, resumed intercourse, dyspareunia) at 6 weeks, 3 months or 6 months. At 6 weeks postpartum, eight women repaired with polyglactin reported problems with their sutures compared with three women in the catgut group (one woman in each group reported infection at wound site, the remainder reported tight sutures that required removal) (adjusted OR 2.61 [95% CI 0.59 to 12.41]).
A recent US RCT compared the healing characteristics of chromic catgut with fast-absorbing polyglactin 910.438 [EL = 1+] Although women were recruited and randomised into trial groups during labour, analysis was only performed for those women requiring perineal repair (poly-glactin 910: 459/684; chromic catgut: 49/677). This study is unusual in that pain outcomes were measured both for the perineal area (referred to as ‘vaginal’ pain) and uterine cramping. No dif-ferences were found between groups for vaginal pain at 24–48 hours, 10–14 days or 6–8 weeks. There were, however, some differences in uterine pain, with significantly more women in the chromic catgut group reporting moderate/severe uterine pain at 24–48 hours: no pain: n = 81 (18%) versus n = 63 (14%), NS; a little/some pain: n = 264 (58%) versus n = 232 (52%), NS; moderate/severe pain: n = 114 (25%) versus n = 154 (34%), P = 0.006. This significant difference was also evident at 6–8 weeks. No differences in uterine pain were noted at 10–14 days. The authors have no explanation for the observed differences in uterine cramping between groups based on suture material used. Given that this difference was only seen at one of the two study sites they conclude that it may simply be an anomaly of the data. At 6–8 weeks no difference was found between groups for persistent suture material (n = 2 women in each group) or perineal wound breakdown (n = 4 versus n = 3).
A UK RCT compared rapidly absorbed synthetic suture material (n = 772) with a standard form of the synthetic suture material (n = 770) within a 2 × 2 factorial study design also comparing suture method.432 [EL = 1+] The study involved women who had sustained either a second-degree tear or an episiotomy. There was no significant difference between the two groups for the primary outcome of pain at 10 days postnatally, although findings favoured the rapidly absorbed suture material: OR 0.84 [95% CI 0.68 to 1.04]. There was, however, a significant reduction in anal-gesia used in the previous 24 hours reported at 10 days for women in the rapidly absorbed suture material group: OR 0.55 [95% CI 0.36 to 0.83]; and a significant reduction in pain on walking for this group: OR 0.74 [95% CI 0.56 to 0.97]. The need for removal of sutures in the 3 months following birth was also less for women sutured with the rapidly absorbed suture material: OR 0.26 [95% CI 0.18 to 0.37].
Evidence statementThere is high-level evidence that a rapidly absorbable synthetic suture material is associated with less short-term pain, less suture dehiscence and less need for resuturing of the perineum up to 3 months postpartum.
197
Recommendations on materials for perineal repair
An absorbable synthetic suture material should be used to suture the perineum.
The following basic principles should be observed when performing perineal repairs:
• Perineal trauma should be repaired using aseptic techniques.• Equipment should be checked and swabs and needles counted before and after the
procedure.• Good lighting is essential to see and identify the structures involved.• Difficult trauma should be repaired by an experienced practitioner in theatre under
regional or general anaesthesia. An indwelling catheter should be inserted for 24 hours to prevent urinary retention.
• Good anatomical alignment of the wound should be achieved, and consideration given to the cosmetic results.
• Rectal examination should be carried out after completing the repair to ensure that suture material has not been accidentally inserted through the rectal mucosa.
• Following completion of the repair, an accurate detailed account should be documented covering the extent of the trauma, the method of repair and the materials used.
• Information should be given to the woman regarding the extent of the trauma, pain relief, diet, hygiene and the importance of pelvic-floor exercises.
Research recommendation on analgesia during perineal repair
Research is needed into the optimum analgesia required during perineal repair.
Analgesia for perineal pain following perineal repair
Description of included studiesA systematic review of three RCTs and one additional RCT were identified which assessed the effec-tiveness of analgesic rectal suppositories for pain from perineal trauma following childbirth.
Review findingsA systematic review including 249 women assessed the effectiveness of analgesic rectal supposi-tories for pain from perineal trauma following childbirth.439 [EL = 1+] All trials used nonsteroidal anti-inflammatory analgesia suppositories, one trial (Saudi Arabia) compared indometacin with a placebo, while the other two trials (UK) compared diclofenac (Voltarol) with a placebo. All trials administered a suppository immediately after perineal repair was complete. In one UK trial, a sin-gle dose of 100 mg was given, in the second (Saudi) trial, 2 × 100 mg suppositories were inserted together immediately following perineal repair, and in the third trial (UK), one suppository was given immediately after suturing and another 12 hours later. Findings suggest that nonsteroidal anti-inflammatory drugs (NSAIDs) administered as rectal suppositories provide effective pain relief following perineal repair (two trials). For indometacin the incidence of perineal pain in the first 24 hours was 6/30 versus 30/30, RR 0.20 [95% CI 0.10 to 0.41]; for diclofenac: RR 0.65 [95% CI 0.50 to 0.85]. The meta-analysis of these two findings produces a wide confidence interval that crosses 1 (RR 0.37 [95% CI 0.10 to 1.38] (two trials)). Findings from the other trial are reported as median scores obtained using a VAS. Women in the diclofenac group reported significantly less pain at 24 hours than women in the placebo group (diclofenac: median 1 [range 0 to 2.5], placebo: median 1 [range 0 to 3], P < 0.05 using Mann–Whitney U test). Only one trial included the outcome of any pain experienced 24–72 hours after perineal repair, with the effect of treatment just failing to reach statistical significance: RR 0.73 [95% CI 0.53 to 1.02]. Findings from a stratified analysis for level of pain experienced within the first 24 hours following perineal repair suggest that NSAIDs have their best level of effect for moderate pain compared with mild or severe pain: mild: RR 1.12 [95% CI 0.70 to 1.80] (two trials); moderate: RR 0.13 [95% CI 0.02 to 0.76] (two trials); severe: RR 0.21 [95% CI 0.01 to 4.12] (two trials). Use of additional anal-gesia was also measured as an outcome in two trials, although not in a way that allows pooling of data. Both trials showed a significant reduction in use of additional analgesia up to 48 hours postpartum. None of the trials reported longer term outcomes such as breastfeeding, effects on mother–infant interactions, postnatal depression or return to pain-free intercourse. All three trials
Normal labour: care of the baby and woman immediately after birth

198
Intrapartum care
reported that there were no side effects associated with the treatment, although none investigated this as an identified outcome.
An RCT conducted in Australia (2004) also evaluated the effectiveness of rectal diclofenac com-pared with a placebo.440 [EL = 1+] Women in the treatment group (n = 67) received a diclofenac suppository immediately after perineal repair (of a second-degree tear, third-degree tear or episi-otomy). Women randomised to the control group received a placebo (Anusol) suppository. Both groups received a second suppository 12–24 hours later. Pain was measured in three ways – using the Short-form McGill Pain Questionnaire (SF-MPQ), using a 10 cm VAS and using the Present Pain Inventory (PPI). At 24 hours postnatally, women’s pain scores were significantly lower for the treatment group compared with the control group, although this was not evident across all measurement scales: at rest: SF-MPQ total score: median 6 [IQR 3 to 11] versus 7 [IQR 3 to 12], NS; VAS: mean 2.8 [SD 0.3] versus 3.9 [SD 0.3]: RR −1.1 [95% CI −1.9 to −0.3], P = 0.01; PPI: mean 31 [SD 53.4] versus 32 [57.1]; RR 0.9 [95% CI 0.7 to 1.3], P = 0.69. For pain scores with movement at 24 hours both the VAS and the PPI score were significantly lower in the treatment group, although this difference was not evident for total SF-MPQ scores. By 48 hours there were no differences in reported pain between the two groups for any of the pain outcome measures. There was also no difference between groups regarding the use of additional analgesia prior to discharge: 81% versus 86%, RR 0.9 [95% CI 0.8 to 1.1] or time from birth to first analgesia (hours): median 6.4 [IQR 3.5 to 10.5] versus 5.8 [IQR 2.9 to 10.2]. Pain outcomes during activi-ties at 10 days and 6 weeks postnatally were also similar for the two groups.
Evidence statementThere is high-level evidence that rectal NSAIDs reduce immediate perineal pain following repair.
Recommendation on analgesia for perineal pain following perineal repair
Rectal nonsteroidal anti-inflammatory drugs should be offered routinely following perineal repair of first- and second-degree trauma provided these drugs are not contraindicated.

199
11 Prelabour rupture of membranes at term
11.1 Prelabour rupture of membranes at term
IntroductionLittle guidance exists on what advice women should be given following prelabour rupture of membranes (PRoM) at term, including how long it is safe to await the onset of labour, the poten-tial role of prophylactic antibiotics and what observations should be carried out during this period. This section seeks to determine what should happen after contact with healthcare profes-sionals when a diagnosis of term PRoM has been made.
For guidance relating to method of induction following ProM, please refer to the NICE clinical guideline on Induction of Labour (2001).441 (Note that the update for this guideline is expected to be published in 2008.)
Clinical questionIs there evidence of factors or interventions that affect outcomes in term prelabour rupture of the membranes?
• Including septic screen for mother and baby.
Is there evidence that, following prelabour rupture of the membranes at term, the length of time from prelabour rupture of membranes (before onset of labour and total), digital vaginal examination, electronic fetal heart-rate monitoring, or frequency and type of maternal surveil-lance influence outcomes?
Following the birth of a healthy infant where there has been prelabour rupture of the membranes, is there evidence that the length of time from prelabour rupture of membranes (before onset and total), presence of pyrexia during or before labour, routine admission to neonatal units, frequency and type of neonatal observations, or frequency and type of neonatal investigations (including invasive tests) influence outcomes?
Is there evidence that the use of antibiotics before delivery in asymptomatic or symptomatic women with prelabour rupture of membranes influences outcomes?
What are the criteria for the use of antibiotics in healthy babies born following prelabour rupture of membranes?
Previous guideline(PRoM has been considered in the guideline Induction of Labour.441 Four systematic reviews were included. The summary of evidence concluded that there was no difference in instrumental birth rates (no distinction is made between vaginal instrumental births and caesarean sections) between induction versus a more conservative approach in women with term or near-term PRoM. Furthermore, a policy of induction of labour is associated with a reduction in infective sequelae for woman and baby. Two practice recommendations were made:
‘Women with prelabour rupture of membranes at term (over 37 weeks) should be offered a choice of immediate induction of labour or expectant management.’
‘Expectant management of labour of women with prelabour rupture of membranes at term should not exceed 96 hours following membrane rupture.’

200
Intrapartum care
11.1.1 Surveillance following term PRoM
Description of included studiesNo evidence was found regarding the effect of carrying out electronic fetal heart rate (FHR) monitoring, checking of maternal temperature and pulse, or carrying out infection screening on women following PRoM.
11.1.2 Length of waiting period following term PRoM with no additional complications
Description of included studiesOne systematic review (2006) of 12 trials involving 6814 women442 plus secondary analyses of findings from an international, multicentre trial involving 72 institutions in six countries (n = 5041 women)300 [EL = 2++] provides the evidence for this section.
Review findingsA systematic review has compared the effects of planned early birth (immediate induction of labour or induction within 24 hours) with expectant management (no planned intervention within 24 hours).442 [EL = 1+] All trials involved only healthy women with an uncomplicated pregnancy of at least 37 completed weeks. Meta-analysis of findings showed that women in the planned early birth groups had a significantly shorter period of time from rupture of membranes to birth compared with women in the expectant management groups (five trials): WMD −9.53 hours [95% CI −12.96 to −6.10 hours]. Women in the planned early birth groups were less likely to develop chorioamnionitis than women in the expectant management group: 226/3300 versus 327/3311; RR 0.74 [95% CI 0.56 to 0.97]. Endometritis was less common in women allocated to the planned early birth groups: 5/217 versus 19/228; RR 0.30 [95% CI 0.12 to 0.74], although there was no significant difference between groups regarding incidence of postpartum fever: 82/2747 versus 117/2774; RR 0.69 [95% CI 0.41 to 1.17]. There was no difference between groups regarding mode of birth: caesarean section (CS): 333/3401 versus 360/3413; RR 0.94 [95% CI 0.82 to 1.08]; instrumental vaginal birth: 487/2786 versus 502/2825; RR 0.98 [95% CI 0.84 to 1.16]. The largest trial in the review (n = 5041) also investigated women’s satisfaction with care. Women in the planned early birth group were significantly less likely to report that there was ‘nothing liked’ about the management of their care: 138/2517 versus 320/2524; RR 0.43 [95% CI 0.36 to 0.52]. Women in the planned early birth group were also more likely to say there was ‘nothing disliked’: 821/2517 versus 688/2524; RR 1.20 [95% CI 1.10 to 1.30]. It should be noted, however, that the comparison groups here were immediate induction of labour versus expectant management up to 96 hours. Babies born to women in the planned early birth groups were less likely to be admitted to neonatal intensive care unit (NICU) or special care baby unit (SCBU): 356/2825 versus 484/2854; RR 0.73 [95% CI 0.58 to 0.91]. However, this difference in admission rate may well reflect hospital policies rather than clinical need. No significant differences were found for any other investigated neonatal outcomes, including: fetal/perinatal mortality: 3/2946 versus 7/2924; RR 0.46 [95% CI 0.13 to 1.66]; Apgar score less than 7 at 5 minutes: 335/3000 versus 366/3005; RR 0.93 [95% CI 0.81 to 1.07]; mechanical ventilation: 25/2566 versus 28/2592; RR 0.99 [95% CI 0.46 to 2.12]; neonatal infection: 74/3210 versus 93/3196; RR 0.83 [95% CI 0.61 to 1.12].
Secondary analyses of data from an international, multicentre trial were performed to identify predictors of neonatal infection following term PRoM. Findings showed that longer periods of time from rupture of membranes to active labour were associated with a higher incidence of neonatal infection: 48 hours or longer versus 12 hours: OR 2.25 [95% CI 1.21 to 4.18]; 24 to 48 hours versus 12 hours: OR 1.97 [95% CI 1.11 to 3.48].
11.1.3 Place of care for women with term PRoM
Description of included studiesSecondary analyses of data from a large, international trial (n = 1670 women),443 one small UK RCT (n = 56)444 and a Danish prospective observational study (n = 276)445 provide the evidence for this section.
201
Review findingsThe term ProM study data set was also analysed to determine whether adverse effects of expect-ant management of term PRoM and women’s satisfaction were greater if women were cared for at home rather than in hospital.443 [EL = 2+] The analysis involved 653 women managed at home compared with 1017 managed as hospital inpatients. Multiple logistic regression analy-ses showed that women having their first baby were more likely to have antibiotics if they were cared for at home, compared with women having their first baby cared for in hospital: OR 1.52 [95% CI 1.04 to 2.24]. Women who were not colonised with group B streptococcus (GBS) were more likely to have CS if they were cared for at home rather than in hospital: OR 1.48 [95% CI 1.03 to 2.14]. Multiparous women were more likely to say they ‘would participate in the study again’ if they were cared for at home rather than in hospital: OR 1.80 [95% CI 1.27 to 2.54]. The risk of neonatal infection was higher if women were cared for at home compared with in hospi-tal: OR 1.97 [95% CI 1.00 to 3.90].
An RCT (2002) compared expectant management at home (n = 29) with expectant management in hospital (n = 27) for women with term PRoM.444 [EL = 1−] Women in both groups were induced if labour had not started by the time 24 hours had elapsed. There was no difference between groups regarding time from rupture of membranes to birth (home: 31.39 hours (SD 12.70 hours); hospital: 26.99 hours (SD 11.78 hours), t value = 1.34, P = 0.18). No differences were found between groups for: maternal infection on first admission (high vaginal swab on admission): 7/28 versus 9/27, ² = 0.46, P = 0.49; maternal infection at the onset of labour (high vaginal swab at onset of labour): 14/24 versus 11/23, ² = 0.521 P = 0.47, or neonatal infection (neonatal infection screen negative): 12/17 (12 not screened) versus 11/12 (15 not screened), ² = 2.98, P = 0.23. The authors acknowledge, however, that the trial is underpowered to detect a signifi-cant difference in these outcomes.
A prospective observational study compared outcomes for women managed at home with out-patient check-ups to await spontaneous onset of labour following term PRoM (n = 176) with a historical group of women managed as hospital inpatients with induction of labour between 6–12 hours (n = 100).445 [EL = 2−] Women managed at home were asked to check their tempera-ture twice daily and attend the antenatal clinic every other day for electronic FHR monitoring and to check for signs of infection. The range of time intervals from rupture of membranes to birth for women in the intervention group (10th–90th centile) was 14–85 hours. Although maternal infectious morbidity, fetal distress during labour and instrumental vaginal birth due to failure to progress were higher in the intervention group where there was longer elapsed time from rupture of membranes to birth, this did not reach statistical significance. The incidence of neonatal infec-tious morbidity was 2% in each study group. There were two neonatal deaths in the expectant management at home group; however, neither baby had positive cultures for infection.
11.1.4 Risk factors associated with maternal infection following term PRoM
Description of included studiesEvidence for this section is drawn from subgroup analyses carried out as part of the system-atic review of 12 trials described above442 [EL = 1+] plus secondary analyses of findings from the international, multicentre trial.443,446 [EL = 2++] One small quasi-RCT,447 [EL = 1−] one prospective observational study449 [EL = 2+] and a retrospective case–control study448 [EL = 2+] are also included.
Review findings
ParitySubgroup analyses of findings from the systematic review described above investigated the effects of parity on maternal and neonatal outcome following term PRoM.442 [EL = 1+] No significant differences were found between outcomes for nulliparous and multiparous women.
A retrospective case–control study of women with PRoM at 37 weeks of pregnancy or more has been conducted in Israel (2004) (n = 132 cases and n = 279 controls).448 [EL = 2+] The study compared three groups of women: those who had had labour induced immediately; women who had been managed expectantly up to 24 hours and then induced; and women who had been managed expectantly for over 24 hours. The primary outcome was chosen as all infection, no
Prelabour rupture of membranes at term
202
Intrapartum care
distinction being made between maternal and neonatal infection, although it is noted that the rate of neonatal infection overall was very low (less than 1%). Multivariate analysis by stepwise logistic regression revealed that nulliparity was independently associated with infections in the woman and the baby (maternal and neonatal): OR 1.92 [95% CI 1.19 to 3.00].
Unfavourable/favourable cervixThe systematic review also undertook a subgroup analysis to investigate the effects of an unfavourable versus a mixed state or unstated state of cervix.442 [EL = 1+] No significant differ-ences were found between outcomes when comparing these two subgroups.
A small US quasi-randomised RCT compared immediate induction of labour (n = 32) with expect-ant management (n = 35) for women with PRoM between 38 and 41 weeks of pregnancy.447 [EL = 1−] All women included in the study had a cervix which was deemed unfavourable for induction of labour (2 cm or less dilated and no more than 50% effaced). The incidence of endometritis was higher in the immediate induction group: 4/35 versus 10/32, P = 0.04 (Fisher’s Exact Test). This may be partly explained by the longer labours observed for women in this group: (mean) 10.44 hours (SD 5.5 hours) versus 14.1 hours (SD 6.0 hours); and the higher number of vaginal examinations performed during labour for women in this group: (mean) 3.9 versus 5.7. There were no incidents of neonatal sepsis in either group.
Vaginal examinationsThe international, multicentre trial of term PRoM also investigated predictors of clinical chorio-amnionitis and postpartum fever.443,446 [EL = 2++] The predictors were calculated using secondary analysis of trial data which compared immediate with expectant management for up to 4 days following term PRoM. Clinical chorioamnionitis was defined as one or more of the following: maternal fever greater than 37.5 °C on two or more occasions 1 hour or more apart, or a sin-gle temperature greater than 38 °C before giving birth; maternal white blood cell count greater than 20 000 cells/mm³ or foul-smelling amniotic fluid.446 [EL = 2++] Clinical chorioamnionitis occurred in 6.7% women (n = 335). The number of vaginal examinations (VEs) was found to be the most important independent predictor, the risk of infection rising as the number of VEs increases. For example: less than 3 VEs versus 3–4 VEs: OR 2.06 [95% CI 1.07 to 3.97]; while less than 3 VEs versus 7–8 VEs: OR 3.80 [95% CI 1.92 to 7.53], and the incidence of chorioam-nionitis increased from 2% to 13%.
The retrospective case–control study conducted in Israel also found number of vaginal examina-tions to be an independent predictor of infection (maternal and/or neonatal).448 [EL = III] Women who had undergone seven or more vaginal examinations during labour were found to be at increased risk of infection (themselves or their baby) compared with women who had been examined vaginally less than seven times (OR 2.70 [95% CI 1.66 to 4.34]).
Duration of labourSecondary analysis of data from the large, international multicentre trial of term PRoM also found that the effect of duration of active labour became very significant once labour duration exceeded 9 hours, with the incidence of chorioamnionitis being 12% compared with 2% where labour lasted less than 3 hours (OR 2.94 [95% CI 1.75 to 4.94]).446 [EL = 2++] The effect of the length of the latent interval becomes statistically significant for durations over 12 hours: 12 to less than 24 hours versus less than 12 hours, incidence of infection 10% (n = 115) OR 1.77 [95% CI 1.27 to 2.47]; greater than and equal to 48 hours versus less than 12 hours, incidence of infec-tion 10% (n = 68) OR 1.76 [95% CI 1.21 to 2.55]. Postpartum fever occurred in 3% of the study participants (n = 146).446 [EL = 2++] The most significant independent predictor of postpartum fever was clinical chorioamnionitis (OR 5.37 [95% CI 3.60 to 8.00]). Duration of labour was also an important predictor, with the incidence rising from 2% for labour 3 hours to less than 6 hours (OR 3.04 [95% CI 1.30 to 7.09]) to 8% for labour 12 hours or longer (OR 4.86 [95% CI 2.07 to 11.4]).
BathingA prospective observational study conducted in Sweden compared rates of maternal and neonatal infection between women who chose to bathe following PRoM (n = 538) and those who chose not to bathe (n = 847).449 [EL = 2+] All women in the study had PRoM at or after 34 weeks of

203
gestation: mean gestational age in each group 39 weeks (SD 1.5 and 1.6). Women were advised not to have a bath if there was meconium-stained liquor, fetal distress or any signs of infection (not defined). There were a significantly higher proportion of nulliparous women in the bath-ing group (78% versus 53%). There was a low frequency of maternal and neonatal infections. Chorioamnionitis during labour occurred in 1.1% (n = 6) women in the bath group and 0.2% (n = 2) in the no-bath group, P = 0.06. There were three incidents of endometritis in each group, 0.6% and 0.4%, respectively, P = 0.68. The frequency of neonates receiving antibiotics was 3.7% and 4.8%, respectively (P = 0.43).
Risk factors associated with neonatal infectionSecondary analyses of the findings from the international, multicentre trial of term PRoM trial were performed in order to identify independent predictors of neonatal infection.300 [EL = 2++] Neonatal infection was defined as either definite or probable based upon clinical signs supported by at least one of an extensive range of well-recognised laboratory tests. Definite or probable infection occurred in 2.6% of neonates (n = 133). The strongest predictor of neonatal infection following term PRoM was clinical chorioamnionitis (OR 5.89 [95% CI 2.02 to 4.68]). Other independent predictors identified included positive maternal GBS status (compared with unknown or negative) (OR 3.08 [95% CI 1 2.02 to 4.68]); 7 or 8 VEs (compared with 0 to 2) (OR 2.37 [95% CI 1.03 to 5.43]); and maternal antibiotics administered before birth (OR 1.63 [95% CI 1.01 to 2.62]).
11.1.5 Use of intrapartum prophylactic antibiotics
Description of included studiesA systematic review of two RCTs450 (n = 838 women) [EL = 1+] and subgroup analysis from a systematic review of 12 RCTs442 [EL = 1+] provide the evidence for this section.
Review findingsA systematic review has been conducted to assess the effects of antibiotics administered prophy-lactically to women with PRoM at 36 weeks or beyond.450 [EL = 1+] Two trials were included in the review, involving a total of 838 women. Both trials used management policies involving the administration of IV antibiotics and delayed induction of labour with oxytocin (up to 24 hours). The use of antibiotics resulted in a statistically significant reduction in: endometritis, RR 0.09 [95% CI 0.01 to 0.73]; chorioamnionitis and/or endometritis (3% versus 7%), RR 0.43 [95% CI 0.23 to 0.82]; and a reduction in the neonatal length of hospital stay (reported by one trial), mean difference −0.90 days [95% CI −1.34 to −0.46 days]. No other significant differences were found, including no significant differences in outcomes for neonatal morbidity.
Subgroup analysis from a second systematic review including 12 RCTs also examined the effects of administering prophylactic antibiotics.442 [EL = 1+] Because of the limitations of the included trials, the comparison groups were not usefully defined, with the resultant comparison being between trials where all women had received antibiotics versus trials where some women had received antibiotics. No differences were found between the two sets of trials for incidence of maternal or neonatal infection.
Evidence statementThere is high-level evidence that shows an increase in neonatal infection when membranes rupture at term before labour starts. This risk increases with the duration of membrane rupture and while neonatal infection is rare, it is potentially serious and can result in death or disability. Expectant management up to 24 hours shows no evidence of a significant increase in neonatal infection rates. There is absence of evidence on long-term outcomes.
For other neonatal outcomes or instrumental vaginal birth or CS rates, there are no differences between immediate induction and expectant management up to 96 hours after membrane rup-ture. There is significant increase in the risk of chorioamnionitis and endometritis in the mother with expectant management over 24 hours. There is no evidence for expectant management over 96 hours after membrane rupture, as the vast majority of women have given birth by then.
There is limited high-level evidence of the effect of routine maternal antibiotic prophylaxis for term PRoM on infection rates, but results are conflicting.
Prelabour rupture of membranes at term

204
Intrapartum care
RecommendationsSee the end of this chapter for all recommendations relating to prelabour rupture of membranes.
11.1.6 Prolonged rupture of membranes and intrapartum fever as risk factors of neonatal infection
Description of included studiesThere was one cohort study within a randomised controlled trial300 and six observational stud-ies that were identified.451–456 Among them, two were conducted in the UK.453,455 All the studies, except for one,456 investigated GBS-related disease as an outcome.
Review findingsBabies of women with PRoM, who enrolled in the international, multicentre RCT comparing induction of labour and expectant management, were observed to investigate various risk factors for developing neonatal infection.300 [EL = 2+] Multivariate analysis showed the following as risk factors for neonatal infection: clinical chorioamnionitis (OR 5.89, P < 0.001); positive maternal GBS status (versus negative or unknown, OR 3.08, P < 0.001); seven to eight vaginal digital examinations (versus 0 to 2, OR 2.37, P = 0.04); 24 to less than 48 hours from membrane rupture to active labour (versus less than 12 hours, OR 1.97, P = 0.02); 48 hours or less from membrane rupture to active labour (versus less than 12 hours, OR 2.25, P = 0.01); and maternal antibiotics before birth (OR 1.63, P = 0.05).
A UK cross-sectional study was conducted in 2000/2001 involving all babies with GBS disease in the UK and Ireland, younger than 90 days.453 [EL = 3] Among the total of 568 babies, incidence of GBS disease was assumed to be 0.72 per 1000 live births [95% CI 0.66 to 0.78]. Mothers of 140 babies (44%) had prolonged rupture of membranes.
A UK case–control study was conducted between 1998 and 2000.455 [EL = 2+] A total of 37 cases of early onset neonatal GBS sepsis were compared with 147 hospital controls. A logistic regres-sion analysis showed that risk of developing early onset neonatal GBS sepsis for babies from women with prolonged rupture of membranes longer than 18 hours was RR 4.8 [95% CI 0.98 to 23.1], and with rupture of membranes before onset of labour: RR 3.6 [95% CI 0.7 to 17.6].
A Danish cross-sectional study was conducted between 1992 and 2001.454 [EL = 3] A total of 61 babies with blood-culture-positive GBS sepsis/meningitis were investigated (incidence 0.76 per 1000 live births [95% CI 0.0 to 1.91]). Nineteen percent of the babies had a mother with prolonged rupture of membranes (longer than 18 hours) and 16% of those had maternal pyrexia (higher than 38 °C).
A Dutch case–control study was conducted between 1988 and 1995.451 [EL = 2+] A total of 41 neonatal early onset GBS-related cases were compared with 123 hospital controls. A multivariate analysis showed that there was an increased risk of developing early onset GBS-related disease when maternal temperature increased by 0.1 above 37.4 °C (OR 2.0 [95% CI 1.4 to 2.8]), but there was no evidence of association between interval from rupture of membranes to birth (OR per hour between 8 and 24 hours 1.0 [95% CI 0.92 to 1.1]) and prolonged rupture of membranes (OR 2.0 [95% CI 0.47 to 9.6]).
A US cohort study was conducted in 1987/88.456 [EL = 2−] Babies of 205 women with a history of prolonged rupture of membranes were compared with 8586 babies of women without a history of prolonged rupture of membranes. Among 175 out of 205 babies following prolonged rupture of membranes of 24 hours or more, 8.2% yielded positive blood culture. In comparison, 0.1% had positive blood culture from the remaining 8586 babies of women without prolonged rupture of membranes.
A US case–control study was conducted between 1991 and 1992.452 [EL = 2+] Ninety-nine cases of early onset GBS disease were compared with 253 matched hospital controls. A multivariate logistic regression analysis showed strong evidence of association between increased risk of developing early onset GBS disease and prolonged rupture of membranes (OR 8.7, P < 0.001) and intrapartum fever (OR 4.3, P < 0.05).

205
Evidence statementThere is medium-level evidence that risk of developing early onset GBS-related disease, for babies born to women with prolonged rupture of membranes, ranges between 2.0 and 8.7 times higher than those born to women without. The risk of developing fever is about four-fold higher in babies born to women with PRoM when compared with babies born to women without. Up to 40% of babies with early onset GBS-related disease were born to women with prolonged rupture of membranes in the UK.
11.1.7 Clinical manifestation of babies
Description of included studiesOne cohort study and two case series were identified, all of which were conducted in the USA,456–458 One study compared laboratory test results between symptomatic and asymptomatic babies.456 The other two studies investigated time of onset of symptoms for neonatal infection.
Review findings
Symptoms and laboratory testsOne cohort study was conducted in the USA.456 [EL = 2+] In the 175 babies born to women with prolonged rupture of membranes, using blood culture and complete blood counts results, six symptomatic infants were compared with nine asymptomatic babies. Out of the six symp-tomatic babies, all had abnormal complete blood counts (two with abnormal white blood cell counts; five with abnormal neutrophil count; four with high band/metamyelocyte count; four with increased immature to total neutrophil ratio). Of the nine asymptomatic babies, seven had abnormal complete blood counts, five with a high white blood cell count, five with a high neu-trophil count, two had a high band/metamyelocyte count and one with a high immature to total neutrophil ratio. The sensitivity of the complete blood count was 86% and specificity 66%.
Onset of symptomsThe other two studies investigated time of onset of symptoms for early onset neonatal GBS disease. The first study was conducted between 1995 and 1996, targeting babies with 2000 g birthweight or more.458 [EL = 3] The study reported that 75.8% of babies with sepsis were first noted to be at risk for sepsis before or at the moment of birth, and 91.2% were identified by 12 hours of age. The second study specifically investigated early onset GBS disease.457 [EL = 3] The population included 37% of preterm babies. The study reported that the median age at onset was 20 minutes ranging from 0 to 77 hours. Sixty-three percent of the babies showed clinical signs within 1 hour of age and 90% were symptomatic within 12 hours.
Evidence statementThere is low-level evidence that over 90% of neonatal sepsis presents within 12 hours of age. The majority of babies with sepsis were first noted to be at risk before or at the moment of birth. There is insufficient evidence on the diagnostic value of tests for neonatal sepsis.
11.1.8 Postnatal prophylactic antibiotics for babies
Description of included studiesOne systematic review with two trials459 and one observational study458 were identified. One of the trials included assessed effectiveness of prophylactic antibiotics on babies born to women with GBS colonisation, hence excluded from this review. The other trial investigated effectiveness of prophylactic antibiotics (intramuscular penicillin and kanamycin for 7 days, n = 24), com-pared with no prophylactics (n = 25).459 [EL = 1−] The second study, a population-based cohort study in the USA, investigated the relationship between predictors and neonatal bacterial infec-tion.458 [EL = 2+]
Review findingsThe trial that investigated the effectiveness of prophylactic antibiotics compared with no anti-biotics reported no neonatal mortality. It was underpowered to show any differences in incidence of neonatal sepsis (RR 0.12 [95% CI 0.01 to 2.04]).
Prelabour rupture of membranes at term

206
Intrapartum care
The US cohort study evaluated 2785 out of 18 299 newborns of 2000 g or more, without major abnormalities for sepsis, with a complete blood count and/or blood culture. Multivariate analysis showed that among 1568 babies whose mothers did not receive antibiotics, initial asymptomatic status was associated with decreased risk of infection (OR 0.27 [95% CI 0.11 to 0.65]). However, there was evidence of an increased risk of neonatal sepsis by antepartum fever (highest ante-partum temperature 101.5 °F (38.6 °C) or higher (OR 5.78 [95% CI 1.57 to 21.29]), rupture of membranes for 12 hours or longer (OR 2.05 [95% CI 1.06 to 3.96]), low absolute neutrophil count for age (OR 2.82 [95% CI 1.50 to 5.34]), and meconium in amniotic fluid (OR 2.24 [95% CI 1.19 to 4.22]).
Evidence statementThere is no high-level evidence from trials on prophylactic antibiotics for babies born to women with prolonged rupture of membranes at term.
There is medium-level evidence that, if the baby is asymptomatic at birth, there is a significantly lower risk of it developing neonatal sepsis.
Recommendations on prelabour rupture of membranes
There is no reason to carry out a speculum examination with a certain history of rupture of the membranes at term.
Women with an uncertain history of prelabour rupture of the membranes should be offered a speculum examination to determine whether their membranes have ruptured. Digital vaginal examination in the absence of contractions should be avoided.
Women presenting with prelabour rupture of the membranes at term should be advised that:
• the risk of serious neonatal infection is 1% rather than 0.5% for women with intact membranes
• 60% of women with prelabour rupture of the membranes will go into labour within 24 hours
• induction of labour* is appropriate approximately 24 hours after rupture of the membranes.
Until the induction is commenced or if expectant management beyond 24 hours is chosen by the woman:
• lower vaginal swabs and maternal C-reactive protein should not be offered• to detect any infection that may be developing women should be advised to record their
temperature every 4 hours during waking hours and to report immediately any change in the colour or smell of their vaginal loss
• women should be informed that bathing or showering are not associated with an increase in infection, but that having sexual intercourse may be.
Fetal movement and heart rate should be assessed at initial contact and then every 24 hours following rupture of the membranes while the woman is not in labour, and the woman should be advised to report immediately any decrease in fetal movements.
If labour has not started 24 hours after rupture of the membranes, women should be advised to give birth where there is access to neonatal services and advised to stay in hospital for at least 12 hours following the birth.
If there are no signs of infection in the woman, antibiotics should not be given to either the woman or the baby, even if the membranes have been ruptured for over 24 hours.
If there is evidence of infection in the woman, a full course of broad-spectrum intravenous antibiotics should be prescribed.
Women with prelabour rupture of the membranes should be asked to inform their healthcare professionals immediately of any concerns they have about their baby’s wellbeing in the first 5 days following birth, particularly in the first 12 hours when the risk of infection is greatest.
* Care of women who have their labour induced is covered by ‘Induction of labour’ (inherited clinical guideline D).
207
Blood, cerebrospinal fluid and/or surface culture tests should not be performed in an asymptomatic baby.
Asymptomatic term babies born to women with prelabour rupture of the membranes (more than 24 hours before labour) should be closely observed for the first 12 hours of life (at 1 hour, 2 hours and then 2 hourly for 10 hours). These observations should include:
• general wellbeing• chest movements and nasal flare• skin colour including perfusion, by testing capillary refill• feeding• muscle tone• temperature• heart rate and respiration.
A baby with any symptom of possible sepsis, or born to a woman who has evidence of chorio-amnionitis, should immediately be referred to a neonatal care specialist.
Research recommendations on routine antibiotics for women with prelabour rup-ture of membranes
A randomised controlled trial to evaluate the effect of routine administration of prophylactic antibiotics on neonatal infection, in women with term prelabour rupture of membranes, over 24 hours.
The investigation and management of babies born with risk factors for infection requires fur-ther evaluation.
For further advice on newborn care immediately after birth, refer to Chapters 10 and 16.
Prelabour rupture of membranes at term
208
12 Meconium-stained liquor
12.1 Monitoring and treatment of women with meconium-stained liquor
IntroductionBetween 15% and 20% of term pregnancies are associated with meconium-stained liquor (MSL), which, in the vast majority of labours, is not a cause of concern. However, in some circum-stances, the passage of meconium in utero is associated with significant increases in perinatal morbidity and mortality. The aspiration of meconium into the lungs during intrauterine gasping, or when the baby takes its first breath, can result in a life-threatening disorder known as meco-nium aspiration syndrome (MAS) and this accounts for 2% of perinatal deaths.
Four main types of intervention were found in the literature that may influence outcomes of labour where there is MSL, namely: use of a scoring system for MSL; amnioinfusion; prophylactic intrapartum antibiotics; and suctioning of the baby at birth (oropharyngeal, nasopharyngeal and endotracheal). The first three of these will be addressed in turn below, following review of a small study that was undertaken to determine the risk factors associated with MAS.
Clinical questionIs there any evidence that identification and management of meconium-stained liquor affect outcomes?
Previous guidelineMeconium-stained liquor has been considered in the guideline Use of Electronic Fetal Monitoring.460 It states: ‘Meconium-stained liquor was found to be associated with an increased risk of cerebral palsy and death in one case–control study but not with cerebral palsy in a large cohort study. Meconium-stained liquor is a significant risk factor for neonatal encephalopathy’.
12.1.1 Grading of meconium-stained liquor
Description of included studies and review findingsA retrospective cohort study has examined the use of a meconium scoring system and its impact on neonatal outcomes.461 [EL = 2+] Eighty meconium-stained babies were scored for: presence of fetal distress; meconium quality/thickness; performance of nasopharyngeal suctioning before first breath; and clinical condition in first minute of life. A low score (0 or 1) indicated the need for oropharyngeal suctioning only, while a score of 2 or more indicated that intubation and endotracheal suctioning should be performed. Outcomes for these babies were compared with a randomly selected sample from the previous year. Protocol for the comparison group was laryngoscopy to allow visualisation of the vocal cords followed by endotracheal intubation and suctioning if meconium was present at the cords. Outcomes investigated included Apgar scores, intubation and MAS. The comparison group comprised women who were significantly older and of a significantly higher parity than the intervention group. There was a significantly higher proportion of baby girls in the intervention group. Mode of birth, presence of fetal distress, Apgar scores, mean gestation and mean birthweight did not differ significantly between the two groups. While the use of the scoring system reduced the rate of endotracheal intubation (22.5% versus 30%), this difference is not statistically significant. No significant differences were noted for any of the outcomes studied.
A cross-sectional study assessed inter- and intra-observer agreement of grading of MSL in Australia.462 Four samples, each of clear, lightly (thin), moderately, and heavily (thick) meconium-stained amniotic fluid were divided in two portions, which were assessed by 20 midwives (a total of 320 samples). Although there was a good agreement in defining a clear sample, there is not a good agreement between midwives’ assessment and the standard agreed for the study. Mean kappa
209
values for inter-observer agreement were 0.52 [range 0.13 to 0.79] at the first assessment and 0.57 [range 0.21 to 0.75] at the second assessment, and that intra-observer agreement was 0.64 [range 0.24 to 0.91] and 0.63 [range 0.42 to 0.91], respectively.
A cross-sectional study of 106 women evaluated the diagnostic value of ‘meconiumcrit’ (percent-age by volume of the solid component of meconium) on umbilical artery pH and Apgar score in the USA.463 A 10 ml sample of amniotic fluid was collected by an intrauterine pressure catheter. The sample was centrifuged in a glass tube. The meconiumcrit was measured by diving the solid volume by the total volume, as with haematocrit, and the samples were graded as thin, moder-ate, and thick according to the solid component by volume (< 10%, 10% to 30%, and 30%, respectively). Meconium was also graded by physicians. There was good correlation between physicians’ subjective assessment and meconiumcrit (Spearman’s rho = 1.00, Pearson’s r = 0.997, P = 0.05). There was no correlation between the grading of meconium and umbilical artery pH < 7.20 (13%, 19% and 11%, respectively). There was no evidence of good correlation between the grading and Apgar score (less than 6 at 1 minute, 5%, 14% and 22%, P > 0.05; less than 6 at 5 minutes, 2%, 3% and 11%, respectively, P > 0.05). None of the babies with thin or moderate meconium had MAS, although there were two babies with MAS from thick meconium.
Evidence statementThere is limited poor-quality evidence of the use of grading for meconium-stained liquor and its impact on neonatal outcomes.
There is no evidence that shows good correlation of grading of meconium-stained liquor in rela-tion to inter/intra observer agreement.
12.1.2 Meconium-stained liquor, continuous EFM and babies’ outcomes
Description of included studiesNo studies were identified that looked at the effect on outcomes of using continuous EFM for women in labour with MSL. Seven observational studies were found that examined the relation-ship between MSL and abnormal fetal heart rate (FHR) tracings for women in labour with no medical or obstetric complications. The overall quality of reporting of the included studies is quite poor, making it difficult to determine the rigour with which they have been conducted. Where information is missing, it has been assumed that the underlying method was lacking in rigour.
Review findingsA UK cross-sectional study (data collected during 1984) was carried out to investigate the relation-ships between FHR patterns, MSL, umbilical cord artery pH and Apgar score.464 [EL = 2+] Over a 6-month period, a study group was defined retrospectively including all women who experienced labour and who had a complete data set recorded (i.e. FHR trace, cord artery pH, presence or absence of meconium and Apgar scores) (n = 698). Associations between all four variables were explored. MSL was present in 115/698 (16%). The MSL was not graded. No relationship was found between MSL and either cord artery pH or base deficit (figures not given). There was a sig-nificantly greater incidence of Apgar scores less than 7 at 1 minute for babies born through MSL compared with babies with clear amniotic fluid (41/115 (36%) versus 78/583 (13%), P = 0.0005). This difference was also evident for Apgar scores less than 7 at 5 minutes (7/115 (6%) versus 9/583 (1.5%), P < 0.005). When combining MSL and FHR tracings, if the FHR tracing was abnormal during the first stage of labour, the mean cord artery pH was significantly lower for babies with MSL than for those with clear liquor (pH 7.17 (SD 0.12) versus pH 7.22 (SD 0.10), P < 0.02). The association between MSL and low Apgar scores existed regardless of FHR tracing classification. Stepwise multiple regression analysis revealed that the major contributor to cord artery pH was an abnormal FHR tracing (r = 0.345). MSL did not correlate significantly (r = 0.039). Adding MSL to FHR tracing did not significantly improve the correlation. Of all the other variables considered for the model (woman’s age, parity, marital status, gestational age, mode of birth, length of labour and birthweight), only gestational age (pH falling with increasing gestational age, r = 0.13) and mode of birth (r = 0.14) correlated significantly with pH. For low Apgar scores at 1 minute, the major correlation was mode of birth (r = 0.25) and MSL (r = 0.224). FHR tracing classification was the next most important (r = 0.186). Adding MSL to the FHR tracing significantly increased the r value to 0.274, and adding mode of birth further improved it to 0.41.
Meconium-stained liquor
210
Intrapartum care
A cross-sectional US study compared measurements of wellbeing of 128 babies with late MSL (i.e. meconium observed in labour after an initial intrapartum period of clear liquor).465 [EL = 2+] The sample represents women with a complete data set drawn from a population of 166 women in labour with late MSL. The women next to labour and give birth without MSL formed a comparison group. One hundred and thirty-four women had a complete data set and were included in the final sample. Intrapartum and postpartum details were collected prospectively. FHR tracings were interpreted by an investigator blinded to study group allocation and classified according to prede-termined criteria. No significant difference was noted between women with late MSL and those with clear liquor for the following FHR and neonatal variables: periodic accelerations (> 10 bpm), non-periodic accelerations, good baseline variability, early decelerations, variable decelerations, late decelerations, repeated (> 20) late decelerations, Apgar score 7 or less at 1 minute, and Apgar score 7 or less at 5 minutes. Two variables were found to be associated with the presence of meconium: repeated early decelerations (17.2% versus 7.5%, P = 0.27) and repeated variable decelerations (28.9% versus 15.7%, P = 0.015). In babies born to women with late MSL, the absence of non-periodic accelerations increased the likelihood of an Apgar score 7 or less at 1 minute (53.8% versus 32.4%, P = 0.45), but not at 5 minutes (12.1% versus 0%, P > 0.05). The absence of good baseline variability increased the likelihood of an Apgar score 7 or less at 5 min-utes (19.4% versus 2.5%, P = 0.007), but not at 1 minute (61.3% versus 39.5%, P > 0.05). The presence of repeated variable decelerations increased the chance of an Apgar score 7 or less at 5 minutes (18.9% versus 4.4%, P = 0.02) but not at 1 minute (56.8% versus 44.0%, P > 0.05).
A UK prospective observational study (1992) investigated the validity of MSL as an indicator for fetal blood sampling (FBS).466 [EL = 3] Details were collected by obstetricians performing the FBS, who were asked to record the indication for the blood sampling and whether they felt the FHR tracing was normal or abnormal. The FHR tracing was also classified retrospectively by a senior obstetrician and classified as normal, abnormal or severely abnormal using a predeter-mined classification system. It is not stated whether or not this second classification process was blinded. No distinction was made between thin and thick meconium. At the time of FBS, meco-nium was present in 165 of the 401 women who took part in the study. In 77 of the 165 women, the FHR tracing was classified as normal both by the attending obstetrician and at second assess-ment by the senior obstetrician (group A). In 31 of the 165 women, the FHR tracing was recoded as normal by the attending obstetrician but was later classified as abnormal or severely abnormal by the senior obstetrician (group B). In 18 women, the reverse was true, where an FHR tracing identified as abnormal by the attending obstetrician was later classified as normal by the senior obstetrician (group C). For the remaining 39 women, both obstetricians classified the FHR tracing as abnormal or severely abnormal (group D). The fetal blood sample pH was significantly higher in group A compared with group D (median [IQR] 7.36 [7.33 to 7.39] versus 7.31 [7.27 to 7.35), P < 0.01). Fetal blood base excess was significantly greater in group D compared with group A [−4.5 (−6.4 to −1.5] versus −2.3 [−6.0 to −0.8], P = 0.01). Apgar scores at 1 minute were also significantly lower in group D as compared with babies in group A (8 [7 to 9] versus 9 [8 to 9], P = 0.01). No significant difference was found in cord artery pH values between the two groups. It should be noted, however, that only a small subsample of women had cord artery pH values measured (n = 15 in group A; n = 17 in group D).
A cross-sectional study collected details of all women with uncomplicated pregnancies who gave birth at one hospital in Jordan, during a 6-month period in 1997.467 [EL = 2+] Of the total sam-ple of 4068 births, 344 (8.5%) had MSL and, of these, 90.4% had particulate meconium. Birth by caesarean section (CS) was significantly more frequent in women with MSL (36/344 (10.5%) versus 31/3288 (0.94%)). Comparisons are made between babies who developed MAS (n = 19) and those who did not develop MAS but were born with MSL (n = 325). The incidence of FHR abnormality during labour was significantly higher in babies who developed MAS than in those who did not (10/19 (57.9%) versus 79/325 (24.3%), P = 0.002). Length of labour was also found to be significantly longer in those babies who developed MAS (7.2 hours (SD 9.2 hours) versus 4.1 hours (SD 3.1 hours), P = 0.0004).
A cohort study (described as prospective) conducted in Jordan (2000) compared neonatal out-comes of 390 babies with MSL with 400 babies in a matched comparison group with clear amniotic fluid.468 [EL = 2−] These study groups were identified from a study sample of 3850 live births undertaken at a single hospital in an 8-month period. Matching was not undertaken in a comprehensive way, but both groups included women in labour at term with a single baby

211
in a cephalic presentation. Women with diabetes and pregnancy-induced hypertension were excluded. Inclusion criteria also included umbilical cord gas analysis, birthweight heavier than 2500 g and absence of congenital abnormalities, which suggests a number of exclusions were made retrospectively, although the reporting of this is unclear. Indeed, few methodological details are given. Of the 390 babies with MSL, 215 were identified as having thick meconium. Moderate or thick meconium was associated with: a significantly greater risk of abnormal FHR tracing: in each stage of labour (64/215 (30%) versus n = 52/400 (13%), P = 0.01); umbilical artery pH less than 7.2 (45/215 (21%) versus 36/400 (9%)); and SCBU admission (28/215 (13%) versus 12/400 (3%)). No further analyses were undertaken to examine FHR tracings in relation to fetal intrapar-tum wellbeing or neonatal outcomes.
A cohort study conducted in Hong Kong between 1996 and 1999 was included.469 The study population was 9542 singleton pregnant women who had babies at a tertiary hospital. Birth attendants recorded the appearance of the liquor at artificial or spontaneous rupture of mem-branes, during vaginal examinations and at birth. Thin MSL was defined as green- or yellow-tinged fluid. Moderate MSL contained particulate matter in a thin green or yellow base. Thick MSL had ‘pea soup’ characteristics and was usually darker green or brown in colour. This information was collected prospectively. Thin to thick MSL was identified in 20.4% women. Continuous FHR monitoring was performed in 96% of the study women. Fetal distress was defined according to the abnormal CTG findings as defined in the guideline on FHR monitoring by the International Federation of Obstetrics and Gynecology (FIGO). There was no evidence of difference in inci-dence of fetal distress between all MSL and clear liquor up to 38 weeks of gestation (< 37 weeks, OR 1.00; 37 weeks, OR 0.54; 38 weeks, OR 0.30; all P values < 0.05), but there is strong evi-dence that babies with MSL were more likely to experience fetal distress compared with babies with clear liquor after 38 weeks of gestation (39 weeks, OR 1.8 [95% CI 2.6 to 12.0]; 40 weeks, OR 1.9 [95% CI 1.4 to 2.7]; 41 weeks, OR 1.7 [95% CI 1.1 to 2.6]).
A cohort study in Zimbabwe was identified.628 This study was to evaluate the role of meconium staining of the liquor in the low-risk obstetric population in terms of fetal distress and perinatal morbidity and mortality. Low-risk women with a singleton term gestation were included. Women in the study comprised those with meconium staining of the liquor and controls comprised similar women but with clear liquor. Meconium staining of the liquor was associated with poor outcome in all the outcome measures assessed. FHR abnormality was more closely associated with adverse outcome than meconium staining, and thin MSL alone was not associated with any adverse outcome except respiratory distress.
There are no good-quality studies that report the long-term consequences of newborn babies with MSL.
Evidence statementThere is limited quality evidence of an association between significant MSL and poor neonatal outcome.
GDG interpretation of the evidence (meconium-stained liquor)The unpredictable consequences of any degree of meconium-stained liquor are such that the GDG felt transfer for continuous fetal monitoring and specific neonatal care (see below) should be considered.
Recommendations on management of meconium-stained liquor before birth
Continuous EFM should be advised for women with significant meconium-stained liquor, which is defined as either dark green or black amniotic fluid that is thick or tenacious, or any meconium-stained amniotic fluid containing lumps of meconium.
Continuous EFM should be considered for women with light meconium-stained liquor depend-ing on a risk assessment which should include as a minimum their stage of labour, volume of liquor, parity, the FHR and, where applicable, transfer pathway.
Meconium-stained liquor

212
Intrapartum care
Research recommendation on a scoring system for degree of meconium staining
There is a need for development of a standardised scoring system for degree of meconium staining and association with neonatal outcomes.
12.1.3 Amnioinfusion
Amnioinfusion versus standard care
Description of included studies and review findingsOne systematic review was identified which considered the effects of amnioinfusion for MSL on perinatal outcome.470 [EL = 1+] The review includes 12 RCTs involving a total of 1807 women (number of participants in 11 of the 12 studies). Most studies involved 100 women or less. All studies used saline for amnioinfusion, although the rates of infusion varied. Most infusion proto-cols included an initial bolus of e.g. 500–600 ml over the first hour followed by a maintenance dose of, for example, 150–180 ml/hour. Trials were divided into two subgroups: those conducted with standard peripartum surveillance (continuous FHR monitoring, facilities for fetal blood sam-pling, paediatrician available for birth) (n = 11); and one larger study with limited peripartum surveillance (n = 652). Findings from meta-analysis of the 11 studies conducted under standard peripartum surveillance showed that amnioinfusion for MSL was associated with a reduction in: heavy meconium staining of the liquor (RR 0.03 [95% CI 0.01 to 0.15]); variable FHR decelera-tions (RR 0.65 [95% CI 0.49 to 0.88]); overall rate of CS (RR 0.82 [95% CI 0.69 to 0.97]); and CS for fetal distress (RR 0.34 [95% CI 0.21 to 0.55]). Measures of the neonatal outcome at birth tended to favour the amnioinfusion groups, although individual trial results often varied consid-erably. No perinatal deaths were reported. Under limited perinatal surveillance, the following reductions were noted: MAS (RR 0.24 [95% CI 0.12 to 0.48]); neonatal hypoxic ischaemic encephalopathy (RR 0.07 [95% CI 0.01 to 0.056]); and neonatal ventilation or NICU admission (RR 0.56 [95% CI 0.39 to 0.79]). There was a trend towards reduced perinatal mortality in this subgroup (RR 0.34 [95% CI 0.11 to 1.06]).
Three additional RCTs were identified that addressed the effectiveness of amnioinfusion for improving outcome when there is MSL. The first of these was an international, multicentre trial involving 56 centres in 11 countries (South Africa, Canada, Argentina, Uruguay, USA, France, UK, Tunisia, Belgium, Switzerland and Eire).471 [El 1++] The trial enrolled 1998 women with thick MSL in labour at 36 weeks or later. Women were randomly assigned to receive amnioinfusion or standard care. Randomisation was stratified according to the study centre and according to the presence or absence of variable decelerations (three or more in the 30 minutes prior to randomi-sation). Block randomisation was carried out, with block size varying randomly between two and four women. A total of 1975 women were included in the analysis (986 in the amnioinfu-sion group, 989 in the control group). Both groups were well matched, although women in the amnioinfusion group were more likely to undergo continuous electronic fetal heart monitoring (95.0% versus 92.4%, P = 0.02). Compliance with random allocation was also good, with analy-sis undertaken on an intention-to-treat basis. The composite primary outcome (perinatal death, moderate or severe MAS, or both) occurred in 44 infants in the amnioinfusion group (4.5%) and 35 infants in the control group (3.5%) (RR 1.26 [95% CI 0.82 to 1.95]). Moderate or severe MAS assessed on the basis of clinical criteria occurred in 43 infants in the amnioinfusion group (4.4%) and 31 in the control group (3.1%) (RR 1.39 [95% CI 0.88 to 2.19]). There were five perinatal deaths in each group (0.5%). The frequency of mild respiratory distress did not differ significantly between the two groups (2.9% amnioinfusion group versus 2.7% control group). A stratified analysis showed no significant effect of amnioinfusion on the rate of primary outcome regard-less of whether decelerations in FHR pattern were present (3.4% amnioinfusion group versus 3.2% control group; RR 1.05 [95% CI 0.84 to 3.99]). There were no differences between groups regarding rates of oropharyngeal suctioning, laryngoscopy and intubation immediately following birth, or proportions of infants with meconium seen below the vocal cords. Fetal umbilical artery pH was assessed in approximately half of the infants in each group. Again, no significant differ-ence was found between groups. Abnormal pH (less than 7.15) occurred in 69 cases (13.5%) in the amnioinfusion group and 57 (12.1) in the control group (RR 1.11 [95% CI 0.80 to 1.55]). Frequency of abnormal FHR patterns was also similar between the two groups, occurring in 14.1% (n = 111) of women in the amnioinfusion group and 13.9% (n = 107) of women in the

213
control group (RR 1.02 [95% CI 0.79 to 1.30]). Outcomes relating to maternal complications were also similar between the two groups. There were no significant differences in the rates of CS overall, CS for fetal distress, peripartum fever, maternal death or serious maternal morbidity (incidences of which were very low, n = 15 (1.5%) in each group).
An RCT conducted in Spain investigated the effect of amnioinfusion for moderate to very thick MSL.472 [EL = 1+] One hundred and three women were assigned to each study group, amnio-infusion and control. Groups were similar regarding maternal and labour characteristics, with over half the labours in each group being induced (57.3% versus 55.3%, respectively). The con-centration of meconium in the liquor was also tested objectively and found to be similar in the two groups. Two-thirds of women in each group were nulliparous, and a similar proportion used epidural analgesia. A number of significant differences were reported between the two groups, favouring amnioinfusion. The overall rate of CS was lower in the amnioinfusion group, 12% ver-sus 23% (RR 0.50 [95% CI 0.26 to 0.95], P = 0.043); as was the rate of CS for fetal distress, 2.9% versus 13% (RR 0.23 [95% CI 0.07 to 0.79], P = 0.019). There were also fewer abnormal FHR patterns noted in the amnioinfusion group: variable decelerations, 52.4% versus 70.9% (RR 0.74 [95% CI 0.59 to 0.92], P = 0.009); variable late decelerations, 12.6% versus 33.9% (RR 0.37 [95% CI 0.21 to 0.66], P < 0.001). There were also fewer incidents of low umbilical arterial pH (less than 7.2), 17.5% versus 30.1% (RR 0.58 [95% CI 0.35 to 0.97]); and meconium below the vocal cords, 10.7% versus 29.1% (RR 0.37 [95% CI 0.19 to 0.69], P = 0.001). It is noted that the high rates of abnormal FHR patterns may have been caused by the high proportion of umbilical cord complications present: 32% of the babies had the cord around their neck and 27.2% had a true knot in the cord (unusually high). Distribution of these complications across the two study groups is not described. No complications were observed, e.g. iatrogenic polyhydramnios or uterine hypertonicity, following amnioinfusion.
Further subgroup analysis of the trial data was undertaken in order to ascertain whether there was any difference in the usefulness of amnioinfusion in relation to the degree of meconium staining.473 [EL = 2+] The amount of meconium present in the liquor was measured following centrifugation and findings used to divide participants into two groups: less than or equal to 15% meconium (moderate meconium) and greater than 15% meconium (thick meconium). The frequency of variable, late and atypical variable decelerations were similar with or without amnioinfusion for babies with moderate and heavy MSL. Differences were found regarding late variable decelerations, where the effects of amnioinfusion, although significantly beneficial for both groups, were greater where there was heavy meconium staining. In women with moder-ate MSL, the frequency of variable decelerations was 12.7% in the amnioinfusion group versus 29.3% in the control group (P < 0.05). For women with heavy MSL, the figures were 12.5% and 40.0%, respectively (P < 0.01). The reduction in CS rate following amnioinfusion was signifi-cantly greater for women with heavy MSL compared with those with moderate MSL. For women with moderate MSL the CS rate in the amnioinfusion group was 14.3% versus 19.0% in the con-trol group (NS), and for women with heavy MSL, the CS rates were 7.5% and 28.9%, respectively (P < 0.05). In contrast, there was a significant reduction in the incidence of meconium below the cords for babies born through moderate MSL following amnioinfusion (6.4% versus 25.9%, P < 0.01), but this reduction was not statistically significant in the group with heavy MSL (17.5% versus 33.3%, respectively, NS). The authors concluded that there were benefits of amnioinfusion to be gained for both moderate and heavy MSL. However, because the subgroups were fairly small for these analyses, the reliability of the findings was undermined.
A third RCT again investigated the effectiveness of amnioinfusion for moderate or thick MSL.474 [EL = 1+] This trial involved 200 women (100 in each arm) and was carried out in India where there were no facilities for continuous FHR monitoring, FBS or the attendance of a paediatrician at birth. The amnioinfusion group and control group were well matched for maternal and labour characteristics. The overall CS rate was significantly lower for women in the amnioinfusion group compared with those in the control group, 21% versus 36% (RR 0.47 [95% CI 0.24 to 0.93]). CS for fetal distress was also significantly lower for women in the amnioinfusion group, 12% com-pared with 26% in the control group (RR 0.39 [95% CI 0.17 to 0.87]). The presence of meconium at the vocal cords was also lower in babies born to mothers in the amnioinfusion group, 10% versus 24% (RR 0.35 [95% CI 0.15 to 0.83]). Neonatal outcomes were also improved for babies born to women in the amnioinfusion group, although the numbers involved are small. There were three admissions to NICU from the amnioinfusion group compared with 11 from the con-
Meconium-stained liquor

214
Intrapartum care
trol group (RR 0.25 [95% CI 0.05 to 1.01]) and respiratory distress was diagnosed for one baby in the amnioinfusion group compared with 12 in the control group (RR 0.07 [95% CI 0.00 to 0.57]). Only one infant (in the control group) developed MAS. No maternal complications associated with amnioinfusion are reported.
A meta-analysis was conducted to include all identified RCTs in where it is likely that there are facilities for EFM, FBS and advanced life support. Eleven of the RCTs under standard peripartum surveillance that were included in the systematic review470 and two additional RCTs,471,472 a total of 13 RCTs, were included in the analysis. The analysis shows that there is a trend of reduction in overall CS rate (12 trials, RR 0.81 [95% CI 0.65 to 1.01]), but the reduction became significant in the rate of CS due to fetal distress (10 trials, RR 0.40 [95% CI 0.21 to 0.77]) by amnioinfusion, compared with standard care. There was no evidence of difference in incidences of MAS and admission to neonatal units between the two groups (MAS, 13 trials, RR 0.86 [95% CI 0.61 to 1.21]); admission to neonatal units, four trials, RR 0.70 [95% CI 0.44 to 1.10])
Methods of amnioinfusion
Description of included studiesTwo additional trials comparing different solutions for amnioinfusion and one non-systematic review investigating use of infusion pumps and solution warmer were identified.
Review findingsOne RCT has been carried out to investigate whether amnioinfusion with an antibiotic solu-tion decreased the rate of clinical chorioamnionitis and puerperal endometritis in women with MSL.475 [EL = 1+] The trial, conducted in the USA, involved 183 women in labour, at 36 weeks or more of gestation. Women in the intervention group received amnioinfusion with 1 g of cefazolin per litre of saline. Women in the control group received amnioinfusion using saline only. The incidence of suspected or proven neonatal infection was also examined. Clinical chorioamnio-nitis was diagnosed based on the presence of one or more of the following: maternal temperature 38 °C or higher, maternal or fetal tachycardia, uterine tenderness, and foul-smelling amniotic fluid. The diagnosis of puerperal endometritis was also made clinically, based on a maternal temperature of 38 °C or higher on two occasions postpartum, uterine tenderness or foul-smell-ing lochia. No statistically significant differences were found between study groups for any of the outcome variables investigated. Incidences of chorioamnionitis were 7.8% for women in the antibiotic group and 8.6% for women in the control group; endometritis 10.0% versus 11.8%, respectively; suspected neonatal infection 17.8% versus 21.5%, respectively and proven neona-tal infection 0.0% versus 2.2%, respectively.
A small prospective RCT was identified that was carried out to determine whether the use of normal saline or lactated Ringer’s solution for amnioinfusion in cases of MSL was associated with significant changes in neonatal plasma electrolyte concentrations or pH.476 [EL = 1+] Two inter-vention groups of women in labour at term with particulate (thick) MSL were allocated to receive amnioinfusion using lactated Ringer’s solution (n = 20) or normal saline (n = 20). A control group received no amnioinfusion (n = 21). Immediately after birth, cord blood arterial samples were taken for laboratory analysis to determine pH, sodium chloride and potassium plasma concentra-tions. No significant differences were found between the three study groups for neonatal plasma pH or electrolyte concentrations.
One non-systematic review was identified which was undertaken to determine whether infusion pumps or solution warmers were beneficial during amnioinfusion.477,478 [EL = 1−] The review included 14 studies (13 RCTs and one prospective cohort study) involving 1543 women. Studies were excluded if they involved less than 40 participants or did not have a comparison group. None of the studies were designed to investigate outcomes associated with warmers and/or infusion pumps as their primary objective. Seven of the trials had MSL as the indication for amnioinfusion. There was a significant lack of homogeneity between studies. No benefits were demonstrated for the use of infusion pumps or solution warmers. In multiple regression analysis, pumps were associated with a significantly increased risk of fetal distress (R = 0.83, P = 0.01).

215
Evidence statementWhere there are facilities for EFM, FBS and advanced life support, there is no evidence that amnioinfusion for moderate to thick meconium staining improves neonatal outcomes or reduces CS, although there is high-level evidence that it reduces the rate of CS due to fetal distress.
GDG interpretation of the evidence (amnioinfusion)Although there was reduction in CS due to fetal distress, there was no statistically significant dif-ference in overall CS rate, and no improvement in neonatal outcomes.
Recommendation on amnioinfusion
Amnioinfusion should not be used for the treatment of women with meconium-stained liquor.
12.2 Resuscitation of babies with meconium-stained liquor
Description of included studiesA systematic review has been undertaken to determine whether endotracheal intubation and suc-tion of the airways at birth, in vigorous term babies with meconium staining, is more beneficial than routine resuscitation including aspiration of the oropharynx.479 RCTs were included in the review if they compared routine versus no, or selective, endotracheal intubation and aspiration in the immediate care of vigorous babies born through MSL. [EL = 1+] Four RCTs were identified and included 2884 babies (most from one large multicentre trial, n = 2094). Clinical outcomes included: mortality, MAS, respiratory symptoms, pneumothorax, need for oxygen, stride, hypoxic ischaemic encephalopathy and convulsions.
Review findingsMeta-analysis of the four trials provided no evidence that endotracheal intubation at birth had an effect on any of the outcomes studied: mortality (RR 1.73 [95% CI 0.37 to 8.1]); (intubated group n = 4, control group n = 2); MAS (RR 1.29 [95% CI 0.80 to 2.08]); other respiratory symptoms or disorders (two studies RR 0.87 [95% CI 0.58 to 1.31], n = 2763); need for oxygen (three studies RR 1.49 [95% CI 0.86 to 2.60], n = 790).479 For all other outcome variables, the number of cases was too low to provide a reliable estimate of treatment effect. In the large multicentre trial, com-plications of intubation were also recorded. Of the 1098 successfully intubated infants, the total number of complications was 42 (3.8%), the most common being bradycardia, larygospasm and hoarseness. Most complications were transient, lasting 15 to 60 seconds.
A multicentre RCT conducted predominantly in Argentina (11 centres, 1 US centre) enrolled 2514 women in labour at term with MSL (of any consistency) to one of two groups: an interven-tion group where the baby would receive suctioning of the oropharynx and nasopharynx before the birth of the shoulders and trunk (n = 1263), or a control group where no suctioning was car-ried out (n = 1251).480 14 [EL = 1+] The primary outcome was MAS. No significant difference was found between the suctioning and no-suctioning groups regarding incidence of MAS, it being 4% in each group (n = 52 and 47, respectively) (RR 0.9 [95% CI 0.6 to 1.3]) or the need for mechani-cal ventilation for MAS, 2% (n = 24) versus 1% (n = 18), respectively (RR 0.8 [95% CI 0.4 to 1.4]). Nine babies died in the suction group versus four in the no-suction group (RR 0.4 [95% CI 0.1 to 1.5]). Duration of oxygen treatment, duration of mechanical ventilation and duration of hospital stay were also similar for the two groups.
Evidence statementThere is insufficient high-level evidence that the use of routine endotracheal intubation and aspi-ration, for babies that are vigorous and have meconium staining, improves neonatal outcomes.
There is no evidence to support suctioning of the nasopharynx before the birth of the baby’s shoulders and trunk.
Meconium-stained liquor
216
Intrapartum care
Recommendations on resuscitation of babies with meconium-stained liquor
If significant meconium-stained liquor is identified, healthcare professionals trained in FBS should be available in labour and healthcare professionals trained in advanced neonatal life support should be readily available for the birth.
Suctioning of the nasopharynx and oropharynx prior to birth of the shoulders and trunk should not be carried out.
The upper airways should only be suctioned if the baby has thick or tenacious meconium present in the oropharynx.
If the baby has depressed vital signs, laryngoscopy and suction under direct vision should be carried out by a healthcare professional trained in advanced neonatal life support.
If there has been significant meconium staining and the baby is in good condition, the baby should be closely observed for signs of respiratory distress. These observations should be per-formed at 1 and 2 hours of age and then 2 hourly until 12 hours of age, and should include:
• general wellbeing• chest movements and nasal flare• skin colour including perfusion, by testing capillary refill• feeding• muscle tone• temperature• heart rate and respiration.
If there has been light meconium staining, the baby should be similarly observed by the health-care professional at 1 and 2 hours and should be reviewed by a neonatologist if the baby’s condition causes concern at any time.

217
13 Complicated labour: monitoring babies in labour
13.1 Introduction
The monitoring of babies in labour aims to identify hypoxia before it is sufficient to lead to damag-ing acidosis and long-term neurological adverse outcome for the baby. The limitations of the tests of wellbeing of babies mean that, in order to avoid significant hypoxia, other interventions such as caesarean section are undertaken when there is concern. This leads to higher rates of intervention. Whichever method of monitoring is undertaken, there needs to be a balance between correctly identifying the babies who have given rise to an appropriate cause for concern, and over-identify-ing babies as having problems when they do not, leading to higher rates of intervention.
This chapter will consider what is the appropriate monitoring method of babies in labour for low-risk women, when to use electronic fetal monitoring (EFM), how to interpret electronic mon-itoring and when to intervene on the basis of EFM.
Clinical questionDo the following methods of fetal monitoring affect outcomes?
• none• intermittent auscultation (Pinard, Doppler)• intermittent electronic monitoring• continuous electronic monitoring (including method of interpretation)• ST analysis• fetal blood sampling• fetal blood gas analysis• fetal lactate.
13.2 Women’s views on fetal monitoring and mobility
IntroductionIt is important to understand and take into consideration women’s views on monitoring fetal wellbeing.
Description of included studiesThere were two trials identified, which assessed women’s views and attitudes to continuous fetal monitoring compared with intermittent auscultation.481,482 The Danish trial included 385 women, and investigated women’s views by interviewing them before and after their labour.481 The Irish trial included 200 women, and investigated women’s views by semi-structured interviews after their labour.482 No other relevant studies were identified.
Review findings
EFM and auscultation
The Danish trialWomen who preferred auscultation before labour but had EFM became more positive towards the method and a significant number were positively influenced by the EFM signal/trace and found the method promoted their partner’s involvement in labour. Enforced immobility, however, was a major disadvantage, as was the technical milieu.

218
Intrapartum care
The Irish trialMore women allocated to EFM reported that they felt restricted in their movements than those allocated to intermittent auscultation. On the other hand, there was no evidence that the method of monitoring influenced the support the women had. There was a suggestion that women moni-tored with EFM were more likely to be left alone for short periods.
Evidence statementThere is qualitative evidence from two trials that shows women’s concern about restricted move-ment with continuous fetal monitoring.
GDG interpretation of the evidenceThe GDG considered the above evidence, as well as other evidence from this chapter and devel-oped an example of information for women regarding fetal wellbeing.
Recommendation on women’s view on fetal monitoring and mobility
Women should be informed that continuous fetal monitoring will restrict their mobility.
13.3 Indications for continuous EFM
IntroductionWhen risk factors develop in labour, continuous EFM is generally considered and discussed. Reviews were undertaken to consider the evidence for this with specific risk factors. The lack of high-level evidence meant that reviews of each separate risk factor were undertaken.
13.3.1 The use of continuous EFM for meconium-stained liquor
For continuous EFM and meconium-stained liquor, refer to Section 12.1.2.
13.3.2 The use of continuous EFM with augmentation of labour
For continuous EFM and augmentation of labour, refer to Section 14.2.5 in the chapter on the first stage of labour.
13.4 EFM and record-keeping
This guideline updates and replaces The Use of Electronic Fetal Monitoring: the Use and Interpretation of Cardiotocography in Intrapartum Fetal Surveillance (inherited clinical guideline C),460 issued in 2001.
Recommendations on EFM and record-keeping
In order to ensure accurate record-keeping regarding EFM:
• The date and time clocks on the EFM machine should be correctly set.• Traces should be labelled with the mother’s name, date and hospital number.• Any intrapartum events that may affect the FHR should be noted at the time on the FHR
trace, which should be signed and the date and time noted (for example, vaginal examina-tion, FBS or siting of an epidural).
• Any member of staff who is asked to provide an opinion on a trace should note their find-ings on both the trace and the woman’s medical records along with the date, time and signature.
• Following birth, the healthcare professional should sign and note the date, time and mode of birth on the FHR trace.
• The FHR trace should be stored securely with the woman’s medical records at the end of the monitoring process.
219
13.5 Interpretation of FHR traces
IntroductionThe interpretation of a fetal heart rate (FHR) trace should take into consideration the stage of labour, progress in labour, maternal and fetal condition, and prior or additional risk factors present as well as the features of the FHR trace and the availability of extra tests or assessments.
13.5.1 Specific features and categorisation of FHR patterns and outcome
IntroductionThe specific features and classification of FHR abnormalities were reviewed in the EFM guide-line, and no new studies have been added.460 The detail is available in this guideline.460 The evidence summaries detailed the following.
Description of included studies and review findingsMost FHR features in isolation, with the exception of late decelerations, are poor at predict-ing poor neonatal outcome. Uncomplicated baseline tachycardia (161–180 bpm) or bradycardia (100–109 bpm) does not appear to be associated with poor neonatal outcome. The predictive value of reduced baseline variability alone is unclear. The presence of FHR accelerations is asso-ciated with a good outcome. Repeated late decelerations are associated with an increased risk of cerebral palsy, umbilical artery acidosis and an Apgar score of less than 7 at 5 minutes. Reduced baseline variability, together with late or variable decelerations, is associated with an increased risk of cerebral palsy. Atypical variable decelerations alone are associated with an increased risk of umbilical artery acidosis and an Apgar score of less than 7 at 5 minutes. Prolonged decelerations are associated with poor neonatal outcome. When all abnormal FHR patterns are combined, those traces classified as ‘abnormal’, by whichever system, appear to be associated with an increase in neonatal encephalopathy, cerebral palsy rates, neonatal acidosis and Apgar scores of less than 7 at 5 minutes.
GDG interpretation of the evidence (specific features and categorisation of FHR patterns)The intrapartum care GDG felt that the categorisation of the FHR trace as defined in the EFM guideline has been invaluable in improving the interpretation of monitoring. However, clarifica-tion of some areas of the classification was thought to add value, so extra recommendations and clarification has been made.
Recommendations on specific features and categorisation of FHR patterns
The recommended definitions and classifications of the FHR trace/cardiotocograph produced during EFM are shown in Tables 13.1 and 13.2.
Table 13.1 Definition of normal, suspicious and pathological FHR traces
Category Definition
Normal An FHR trace in which all four features are classified as reassuring
Suspicious An FHR trace with one feature classified as non-reassuring and the remaining features classified as reassuring
Pathological An FHR trace with two or more features classified as non-reassuring or one or more classified as abnormal
Complicated labour: monitoring babies in labour

220
Intrapartum care
Further information about classifying FHR traces is given below.
• If repeated accelerations are present with reduced variability, the FHR trace should be regarded as reassuring.
• True early uniform decelerations are rare and benign, and therefore they are not significant.
• Most decelerations in labour are variable.• If a bradycardia occurs in the baby for more than 3 minutes, urgent medical aid should be
sought and preparations should be made to urgently expedite the birth of the baby, clas-sified as a category 1 birth. This could include moving the woman to theatre if the fetal heart has not recovered by 9 minutes. If the fetal heart recovers within 9 minutes the deci-sion to deliver should be reconsidered in conjunction with the woman if reasonable.
• A tachycardia in the baby of 160–180 bpm, where accelerations are present and no other adverse features appear, should not be regarded as suspicious. However, an increase in the baseline heart rate, even within the normal range, with other non-reassuring or abnor-mal features should increase concern.
For women having continuous EFM, a documented systematic assessment based on these definitions and classifications should be undertaken every hour.
During episodes of abnormal FHR patterns when the woman is lying supine she should be advised to adopt the left-lateral position.
Prolonged use of maternal facial oxygen therapy may be harmful to the baby and should be avoided. There is no research evidence evaluating the benefits or risks associated with the short-term use of maternal facial oxygen therapy in cases of suspected fetal compromise.
In the presence of abnormal FHR patterns and uterine hypercontractility not secondary to oxytocin infusion, tocolysis should be considered. A suggested regimen is subcutaneous terbutaline 0.25 mg.*
In cases of suspected or confirmed acute fetal compromise, delivery should be accomplished within a time appropriate for the clinical condition.
Continuous EFM in the presence of oxytocin:
• If the FHR trace is normal, oxytocin may be continued until the woman is experiencing 4 or 5 contractions every 10 minutes. Oxytocin should be reduced if contractions occur more frequently than 5 contractions in 10 minutes.
* At the time of publication (September 2007), terbutaline did not have UK marketing authorisation for this indication. Informed consent should be obtained and documented.
Table 13.2 Classification of FHR trace features
Feature Baseline (bpm) Variability (bpm) Decelerations Accelerations
Reassuring 110–160 ≥ 5 None Present
Non-reassuring 100–109
161–180
< 5 for 40–90 minutes
Typical variable decelerations with over 50% of contractions, occurring for over 90 minutes
Single prolonged deceleration for up to 3 minutes
The absence of accelerations with otherwise normal trace is of uncertain significance
Abnormal < 100
> 180
Sinusoidal pattern ≥ 10 minutes
< 5 for 90 minutes Either atypical variable decelerations with over 50% of contractions or late decelerations, both for over 30 minutes
Single prolonged deceleration for more than 3 minutes
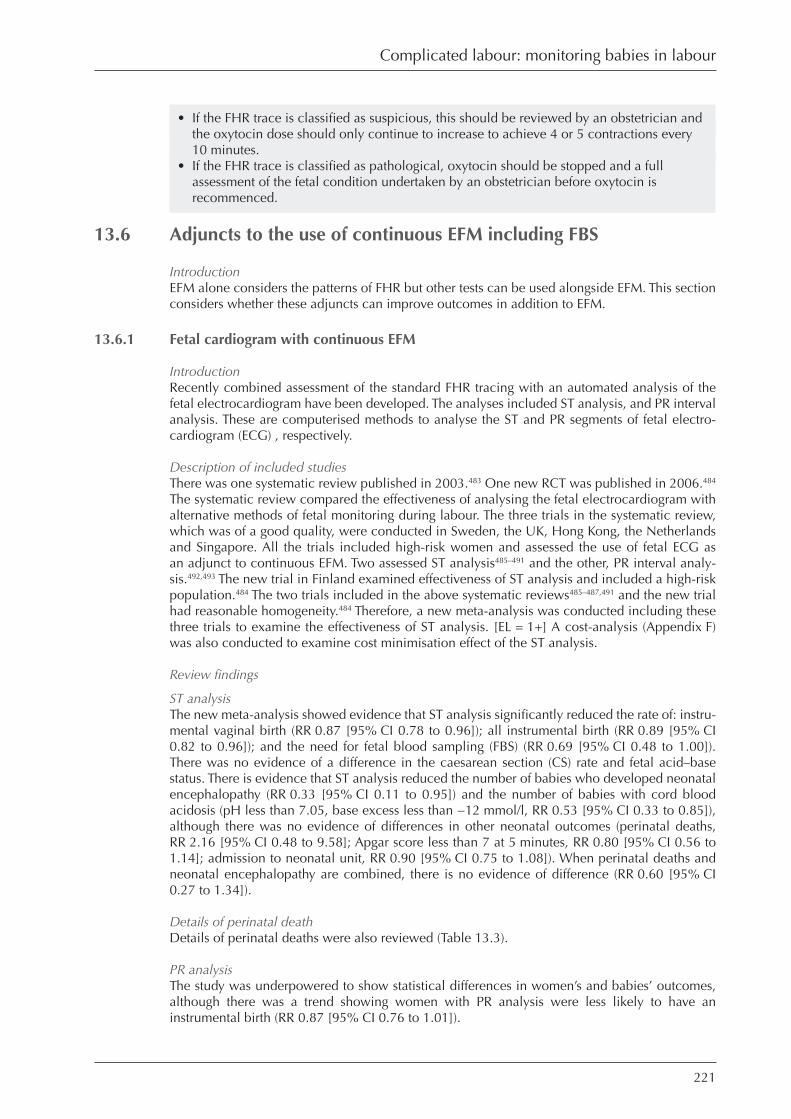
221
• If the FHR trace is classified as suspicious, this should be reviewed by an obstetrician and the oxytocin dose should only continue to increase to achieve 4 or 5 contractions every 10 minutes.
• If the FHR trace is classified as pathological, oxytocin should be stopped and a full assessment of the fetal condition undertaken by an obstetrician before oxytocin is recommenced.
13.6 Adjuncts to the use of continuous EFM including FBS
IntroductionEFM alone considers the patterns of FHR but other tests can be used alongside EFM. This section considers whether these adjuncts can improve outcomes in addition to EFM.
13.6.1 Fetal cardiogram with continuous EFM
IntroductionRecently combined assessment of the standard FHR tracing with an automated analysis of the fetal electrocardiogram have been developed. The analyses included ST analysis, and PR interval analysis. These are computerised methods to analyse the ST and PR segments of fetal electro-cardiogram (ECG) , respectively.
Description of included studiesThere was one systematic review published in 2003.483 One new RCT was published in 2006.484 The systematic review compared the effectiveness of analysing the fetal electrocardiogram with alternative methods of fetal monitoring during labour. The three trials in the systematic review, which was of a good quality, were conducted in Sweden, the UK, Hong Kong, the Netherlands and Singapore. All the trials included high-risk women and assessed the use of fetal ECG as an adjunct to continuous EFM. Two assessed ST analysis485–491 and the other, PR interval analy-sis.492,493 The new trial in Finland examined effectiveness of ST analysis and included a high-risk population.484 The two trials included in the above systematic reviews485–487,491 and the new trial had reasonable homogeneity.484 Therefore, a new meta-analysis was conducted including these three trials to examine the effectiveness of ST analysis. [EL = 1+] A cost-analysis (Appendix F) was also conducted to examine cost minimisation effect of the ST analysis.
Review findings
ST analysisThe new meta-analysis showed evidence that ST analysis significantly reduced the rate of: instru-mental vaginal birth (RR 0.87 [95% CI 0.78 to 0.96]); all instrumental birth (RR 0.89 [95% CI 0.82 to 0.96]); and the need for fetal blood sampling (FBS) (RR 0.69 [95% CI 0.48 to 1.00]). There was no evidence of a difference in the caesarean section (CS) rate and fetal acid–base status. There is evidence that ST analysis reduced the number of babies who developed neonatal encephalopathy (RR 0.33 [95% CI 0.11 to 0.95]) and the number of babies with cord blood acidosis (pH less than 7.05, base excess less than −12 mmol/l, RR 0.53 [95% CI 0.33 to 0.85]), although there was no evidence of differences in other neonatal outcomes (perinatal deaths, RR 2.16 [95% CI 0.48 to 9.58]; Apgar score less than 7 at 5 minutes, RR 0.80 [95% CI 0.56 to 1.14]; admission to neonatal unit, RR 0.90 [95% CI 0.75 to 1.08]). When perinatal deaths and neonatal encephalopathy are combined, there is no evidence of difference (RR 0.60 [95% CI 0.27 to 1.34]).
Details of perinatal deathDetails of perinatal deaths were also reviewed (Table 13.3).
PR analysisThe study was underpowered to show statistical differences in women’s and babies’ outcomes, although there was a trend showing women with PR analysis were less likely to have an instrumental birth (RR 0.87 [95% CI 0.76 to 1.01]).
Complicated labour: monitoring babies in labour

222
Intrapartum care
Evidence statementThere was high-level evidence from three trials of high-risk women that ST analysis reduces instrumental vaginal birth and neonatal encephalopathy, although there was no difference in fetal acid–base.
There was no high-level evidence on PR analysis.
Economic evidenceUsing baseline assumptions, the net cost of ST analysis is approximately £3.45 million per annum. This result is sensitive to the relative risk of CS and instrumental vaginal birth with ST analysis, and ST analysis produces net cost savings in a ‘best case’ sensitivity analysis (Appendix F).
GDG interpretation of the evidence (ST analysis)ST analysis seems to add value to the use of EFM and reduce intervention. While associated with a lower neonatal encephalopathy rate in surviving infants, when combined with perinatal deaths, there is no significant difference in outcome. It comes at added cost and also requires the use of fetal scalp electrodes and extra staff training. If used when fetal heart rate abnormalities are present, it may be necessary to perform a fetal blood sample before using ST analysis.
Research recommendation on ST analysis
A further randomised controlled trial of ST segment analysis should be undertaken.
13.6.2 Intrapartum fetal stimulation tests
IntroductionThe use of intrapartum fetal stimulation tests as an adjunct to EFM is evaluated in this section. These include fetal scalp puncture and digital stimulation of the fetal scalp. Fetal scalp puncture is incidental to obtaining fetal scalp pH. Digital scalp stimulation is performed by gentle digital stroking of the fetal scalp. For any of the methods of scalp stimulation, a reassuring response is defined as acceleration in the FHR. However, the absence of acceleration is not always associ-ated with fetal acidosis.
Table 13.3 Details of perinatal deaths in included trials of ST analysis
Study ECG + EFM EFM only
Westgate 1993485,486 2 perinatal deaths
1 neonatal encephalopathy
Details not given
0 perinatal deaths
4 neonatal encephalopathy
Details not given
Amer-Wahlin 2001488–491 3 perinatal deaths
3 neonatal encephalopathy (excluding perinatal death cases)
1) Congenital malformation
2) Metabolic acidosis at birth. Maternal fever occurred during labour, and EFM showed a pre-terminal pattern without ST waveform changes. CS was done after an undue delay, and the baby died 36 hours after birth with clinical signs of neonatal encephalopathy and sepsis.
3) Metabolic acidosis at birth. Second-stage FHR and ST changes were not recognised; the scalp electrode was disconnected during ventouse extraction for failure to progress, and a severely asphyxiated baby was delivered.
2 perinatal deaths
8 had neonatal encephalopathy (excluding perinatal death cases)
1) Congenital malformation
2) The recorder disconnected for unknown reasons 2 hours and 11 minutes before an operative vaginal birth for non-reassuring FHR. The baby was severely asphyxiated at birth and died after 24 hours.
Ojala 2006484 0 perinatal deaths
0 neonatal encephalopathy
0 perinatal deaths
1 neonatal encephalopathy
Details not given
CS = caesarean section; ECG = electrocardiogram; EFM = electronic fetal monitoring; FHR = fetal heart rate.

223
Description of included studiesOne systematic review published in 2002 was identified.494 The review assessed predictive values of four intrapartum fetal stimulation tests including fetal scalp puncture (six studies) and digital stimulation of the fetal scalp (two studies). The primary outcome was babies’ acidaemia. The study was of a moderate quality. [EL = III]
Review findings
Fetal scalp punctureThere were six studies included. The pooled likelihood ratio of acidosis for a negative test was 0.12 [95% CI 0.02 to 0.78], and for a positive test, it was 8.54 [95% CI 1.28 to 56.96].
Digital stimulation of the fetal scalpThere were two studies included. The pooled likelihood ratio for acidosis of a negative test was 0.06 [95% CI 0.01 to 0.31], and for a positive test, it was 15.68 [95% CI 3.22 to 76.24].
Evidence statementThere is observational evidence that response to digital stimulation of the fetal scalp is a good predictive test, and response to fetal scalp puncture during FBS is a moderately predictive test for fetal acidaemia.
Recommendation on intrapartum fetal stimulation tests
Digital stimulation of the fetal scalp by the healthcare professional during a vaginal examina-tion should be considered as an adjunct to continuous EFM.
13.6.3 Computerised systems versus human interpretation
IntroductionA new review of computerised systems in FHR trace interpretation was undertaken.
Previous guidelineThe Use of Electronic Fetal Monitoring guideline includes computerised interpretation of FHR tracings.460 The same six studies are included as are reviewed here. The summary of evidence concludes that: The use of computerised systems for FHR analysis improves consistency of interpretation. A research recommendation was for further evaluation of the effectiveness of com-puterised analysis, or decision analysis programs, in the interpretation of the CTG.
Description of included studiesSix studies were identified for review in this section. Five of these studies compared computer-ised interpretation of FHR tracings with expert interpretation. All studies included women with pregnancy and/or intrapartum complications.
Review findingsA rigorous multicentre comparative study undertaken in the UK investigated whether a computer-ised system could obtain a performance in labour management comparable with experts when using FHR tracings, obstetric information and FBS. It also investigated the degree of agreement between experts.495 [EL = II] Seventeen peer-nominated experts were selected from 16 UK maternity units to review 50 complete intrapartum FHR tracings. The 50 tracings were selected to represent a range of possible variables and outcomes and all were obtained from women with high-risk labours. The expert reviewers were also given clinical information pertaining to the progress of labour, and could request findings from FBS to supplement this information. Each expert performed the assessments twice (in a different order), with an interim period of 1 month in order to assess intra-rater reliabil-ity. Consistency (intra-rater reliability) of ratings for each reviewer was high, ranging from 73.18% to 89.04% (kappa 0.43 to 0.77). Consistency of ratings for the computerised system was 99.16%. Agreement between reviewers (inter-rater reliability) ranged from 58.17% to 74.27% (kappa 0.12 to 0.46). Agreement between the computerised system and the obstetricians was 67.33% (kappa 0.31). In the 11 cases where the computerised system recommended CS, on average 18/34 (52.9%) of the expert reviews also recommended CS within 15 minutes of the system. An average of 23/34
Complicated labour: monitoring babies in labour

224
Intrapartum care
(67.6%) did so within 30 minutes of the system. Only two reviewers and the computerised system consistently recommended no unnecessary intervention. Twelve examples of poor outcome were included in the sample. Poor outcome fell into one of three categories as follows: birth asphyxia (cord arterial pH < 7.05 and base deficit ≥ 12, Apgar score at 5 minutes ≤ 7 with neonatal morbid-ity); metabolic acidosis (cord arterial pH < 7.05 and base deficit ≥ 12, Apgar score at 5 minutes > 7 with no neonatal morbidity); acidosis (cord arterial pH < 7.05 and base deficit < 12 with neonatal morbidity). The system detected two of the three incidents of birth asphyxia, two of the four inci-dents of metabolic acidosis and two of the five incidents of acidosis with no significant metabolic component. This was as good as the majority of experts for birth asphyxia, but fewer than for all reviewers for metabolic acidosis, and fewer than all but one of the reviewers for acidosis.
A small prospective observational study (UK, 2000) compared computerised interpretation of 24 intrapartum FHR tracings with expert ratings.496 [EL = II] Analysis was performed on 25 minute sections of tracing.
Inter-rater reliability between the seven experts was good for baseline FHR (r = 0.93), number of decelerations (r = 0.93) and type of decelerations (r = 0.93). Inter-rater reliability for base-line variability was poor (kappa = 0.27), as it was for accelerations (r = 0.27). Computerised interpretation of the tracings showed good agreement with the experts regarding baseline FHR (r = 0.91 to 0.98) and the number of decelerations (r = 0.82 to 0.91). Intra-class correlations were lower for the number of late decelerations (r = 0.68 to 0.85) and the number of accelerations (r = 0.06 to 0.80). There was no agreement between computerised interpretation and expert interpretation for baseline variability (kappa = 0.00 to 0.34).
A similar observational study conducted in Italy (1996) compared interpretations of 63 FHR trac-ings made by two experts (obstetric consultants), two non-experts (obstetricians with 1 year of experience) and a computerised system.497 [EL = III] The study population included women with pregnancy complications and preterm labour. ‘Randomly’ selected 25 minute sections of tracing were used for analysis. Reliability between expert and non-expert observers for FHR, baseline variability, number of accelerations and number of decelerations was fair to good (kappa ratings ranging from 0.38 to 0.67). Only 17 tracings included decelerations. Agreement regarding type of deceleration was poor (kappa = 0.05). Agreement between computerised interpretation and observers was fair to good for most ratings of variability (kappa = 0.16 to 0.74), number of acceler-ations (0.37 to 0.64) and number of decelerations (0.41 to 0.54). Agreement for FHR baseline and type of decelerations was poor (kappa = 0.18 to 0.48 and kappa = 0.01 to 0.25, respectively).
A UK retrospective observational study assessed the ability of a computerised system for FHR trac-ing analysis to predict fetal acidosis at birth.498 [EL = III] Analysis was undertaken of 73 complete FHR tracings for labours lasting more than 3 hours. An umbilical artery pH of < 7.15 was used to define acidosis at birth. Using this definition, 8/73 babies (11%) were found to have acidosis and 65 (89%) were classified as normal. The computer system classified 50 babies (69%) as normal, of whom 49 (98%) had an umbilical artery pH > 7.15. Of the 23 babies (31%) identified by the computer system as having acidosis, 7 (30%) had a pH < 7.15. The overall accuracy of the com-puter system was 77%, with a sensitivity of 88% and a specificity of 75%. Similar calculations were performed for base excess, with < −8 mmol/l as the cut-off point. Fifty-six of the 73 babies (77%) had a normal base excess and 17 (23%) were classified as abnormal. The computer system identified 50 (69%) babies as normal, 46 (92%) of whom had a base excess of ≥ −8 mmol/l. Of the 23 babies (31%) classified by the computer system as abnormal, 13 (57%) had a base excess < −8 mmol/l. The overall accuracy was 81% with a sensitivity of 76% and a specificity of 82%.
A retrospective observational study (Denmark, 1988) compared interpretations of FHR tracings made by four experienced obstetricians with those made by a computerised system.499 [EL = III] 50 FHR tracings of the last 30 minutes of the first stage of labour were used for the study. These were classified as either normal or abnormal. The obstetricians were informed of the number of compromised babies within the sample (n = 16), the criterion by which a baby was judged to be compromised and the length of the pregnancies. Babies were considered to be compromised if the 1 minute Apgar score was < 7, the umbilical artery pH was < 7.15 or the standard base excess was < −10 mEq/l, or primary resuscitation was needed. Based on the 30 minute segment of FHR tracing, the computer system was able to indicate whether a baby would be born in a healthy state or compromised with 86% accuracy. However, while the system has a high specificity (94%), pos-itive predictive value (85%) and negative predictive value (86%), its sensitivity is quite low (69%),

225
i.e. it did not identify five of the 16 compromised babies. This was higher than that obtained from the four obstetricians, the best of whom achieved the same degree of sensitivity but only 59% specificity, i.e. correctly identifying 20 of the 34 healthy babies from their FHR tracing.
A retrospective observational study compared FHR tracing interpretations of 12 clinical experts with computerised interpretation (UK/Hong Kong, 1997).500 [EL = III] Sixty 40 minute sections were classified to determine the baseline FHR. There was high concordance between expert ratings and between computer interpretation and that of experts (r > 0.9). The 95% confidence interval for the difference between computer and expert ratings was −12 to 15 bpm compared with −10 to 10 bpm for the difference between experts.
Evidence statementComputerised systems have not been demonstrated to be superior to expert interpretation of the FHR trace and no comparisons have been undertaken with routine care.
Research recommendation on computerised system
Further study investigating computerised expert systems should be undertaken.
13.6.4 Fetal blood sampling
Predictive value of fetal scalp pH
Description of included studiesThere were 28 observational studies that assessed predictive values of fetal scalp pH during labour for the Apgar score.501–515 Among them, 12 studies assessed predictive value of fetal scalp pH below 7.20 for the Apgar score, four studies did that for pH below 7.25, and the remaining 12 did studies of both pH values. The studies used Apgar score of below 4 and below 8 as cut-off points. All studies were of reasonable quality. The studies showed reasonable heterogeneity. Thresholds of above 10 for positive likelihood ratio and 0.1 for negative likelihood ratio were used. [EL = II]
Review findingsMeta-analysis of 24 studies for pH below 7.20 showed summary likelihood ratios of 4.51 [95% CI 3.66 to 5.56] for positive and 0.58 [95% CI 0.46 to 0.73] for negative. Meta-analysis of 16 studies for pH below 7.25 showed summary likelihood ratios of 2.46 [95% CI 1.95 to 3.12] for positive and 0.66 [95% CI 0.55 to 0.79] for negative.
Evidence statementThere was no available evidence of a correlation between fetal scalp pH and improved longer term outcomes.
Predictive values of fetal acid–base, fetal–maternal pH difference and fetal–maternal base defi-cit difference
Description of included studiesThere are two observational studies that reported predictive values of fetal acid–base,516 fetal–maternal pH difference and fetal–maternal base deficit difference517 during labour for Apgar score. Both studies showed reasonable quality. [EL = II]
Review findings
Fetal acid–baseLinear regression analysis showed that there is some evidence that fetal acid–base status corre-lated with a high Apgar score at 1 minute (r = −0.15, P < 0.05), although there was no evidence to show the correlation between low Apgar score at 1 minute and fetal acid–base status (r = 0.039, P > 0.05). There was some evidence that there was correlation of fetal acid–base with a high Apgar score at 5 minutes (r = −0.092, P < 0.05) and a low Apgar score at 5 minutes (r = −0.32, P < 0.05).
Complicated labour: monitoring babies in labour

226
Intrapartum care
Fetal–maternal pH differenceLinear regression analysis showed that there is some evidence that fetal–maternal arterial pH difference correlated with a low Apgar score at 1 minute (r = 0.5503, P < 0.005), although there was no evidence to show the correlation between a high Apgar score at 1 minute and fetal base (r = 0.0029, P > 0.05). There was also some evidence that there was correlation of fetal–maternal arterial pH difference with a low Apgar score at 5 minutes (r = 0.4959, P < 0.05), although not with a high Apgar score at 5 minutes (r = −0.1282, P > 0.05).
Fetal–maternal base deficit differenceLinear regression analysis showed that there was some evidence that fetal–maternal acid–base difference correlated with a low Apgar score at 1 minute (r = −0.4274, P < 0.05), although with no evidence of correlation with a high Apgar score at 1 minute (r = −0.0993, P > 0.05). There were similar findings on Apgar scores at 5 minutes (fetal–maternal base deficit difference and high Apgar score at 5 minute, r = −0.0647, P > 0.05; fetal–maternal base deficit difference and low Apgar score at 5 minute, r = −0.7313, P < 0.05)
Evidence statementThere was limited evidence of a correlation between fetal base deficit and longer-term out-comes. There was no evidence of an advantage of calculating fetal–maternal pH or base deficit differences.
Continuous EFM versus continuous EFM plus FBS
Description of included studiesThere was one systematic review, which compared continuous EFM with intermittent ausculta-tion and assessed the effect of FBS on continuous EFM by subgroup analysis.324 [EL = 2+] There was one observational study with historical controls that compared the effectiveness of FBS plus continuous EFM with continuous EFM.518 [EL = 2+] Both showed reasonable quality, although there was no statistical analysis or subgroup analysis in the systematic review and therefore, the findings from the study are only suggestive.
Review findingsThe systematic review, including all low- and high-risk women, showed a difference in effects on incidence of instrumental vaginal birth (continuous EFM plus FBS versus intermittent aus-cultation, RR 1.47 [95% CI 1.11 to 1.93]; continuous EFM without FBS versus intermittent auscultation, RR 1.10 [95% CI 0.87 to 1.40]) and neonatal seizures (continuous EFM plus FBS versus intermittent auscultation, RR 0.49 [95% CI 0.29 to 0.83]; continuous EFM without FBS versus intermittent auscultation, RR 0.54 [95% CI 0.20 to 1.44]).324 A meta-analysis only includ-ing low-risk women, showed a difference in only neonatal seizures (continuous EFM plus FBS versus intermittent auscultation, RR 0.37 [95% CI 0.15 to 0.87]; continuous EFM without FBS versus intermittent auscultation, RR 0.54 [95% CI 0.03 to 3.22]). There was no evidence of a dif-ference in effects, on other outcomes.
The cohort study518 compared continuous EFM with continuous EFM plus FBS and showed evi-dence that the use of FBS reduced the incidence of instrumental birth for fetal distress (RR 0.33, P = 0.007), although there was no evidence of a difference in CS for fetal distress (RR 0.5, P = 0.5), an Apgar score less than 8 at 1 minute (RR 0.50, P = 0.15) and an Apgar score less than 8 at 5 minutes (with = 0/72, without = 2/70, P = 0.25).
Evidence statementThere was only low-level evidence on the use of FBS for continuous EFM. This showed that the use of FBS with continuous EFM may reduce the rate of instrumental vaginal birth, but there was no evidence of differences in other outcomes.
ST analysis versus fetal scalp pH monitoring
Description of included studiesThere was one cohort study identified.519 [EL = II] The study assessed diagnostic value of ST analysis compared with FBS. The study was of reasonable quality.
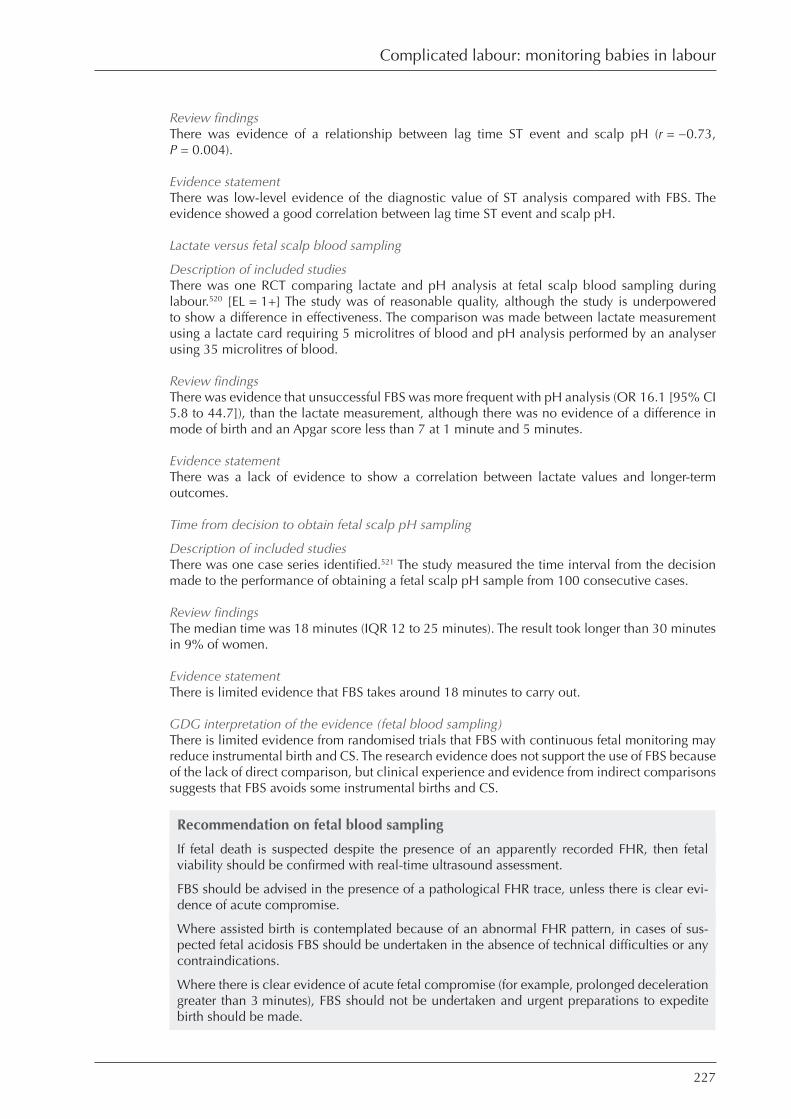
227
Review findingsThere was evidence of a relationship between lag time ST event and scalp pH (r = −0.73, P = 0.004).
Evidence statementThere was low-level evidence of the diagnostic value of ST analysis compared with FBS. The evidence showed a good correlation between lag time ST event and scalp pH.
Lactate versus fetal scalp blood sampling
Description of included studiesThere was one RCT comparing lactate and pH analysis at fetal scalp blood sampling during labour.520 [EL = 1+] The study was of reasonable quality, although the study is underpowered to show a difference in effectiveness. The comparison was made between lactate measurement using a lactate card requiring 5 microlitres of blood and pH analysis performed by an analyser using 35 microlitres of blood.
Review findingsThere was evidence that unsuccessful FBS was more frequent with pH analysis (OR 16.1 [95% CI 5.8 to 44.7]), than the lactate measurement, although there was no evidence of a difference in mode of birth and an Apgar score less than 7 at 1 minute and 5 minutes.
Evidence statementThere was a lack of evidence to show a correlation between lactate values and longer-term outcomes.
Time from decision to obtain fetal scalp pH sampling
Description of included studiesThere was one case series identified.521 The study measured the time interval from the decision made to the performance of obtaining a fetal scalp pH sample from 100 consecutive cases.
Review findingsThe median time was 18 minutes (IQR 12 to 25 minutes). The result took longer than 30 minutes in 9% of women.
Evidence statementThere is limited evidence that FBS takes around 18 minutes to carry out.
GDG interpretation of the evidence (fetal blood sampling)There is limited evidence from randomised trials that FBS with continuous fetal monitoring may reduce instrumental birth and CS. The research evidence does not support the use of FBS because of the lack of direct comparison, but clinical experience and evidence from indirect comparisons suggests that FBS avoids some instrumental births and CS.
Recommendation on fetal blood sampling
If fetal death is suspected despite the presence of an apparently recorded FHR, then fetal viability should be confirmed with real-time ultrasound assessment.
FBS should be advised in the presence of a pathological FHR trace, unless there is clear evi-dence of acute compromise.
Where assisted birth is contemplated because of an abnormal FHR pattern, in cases of sus-pected fetal acidosis FBS should be undertaken in the absence of technical difficulties or any contraindications.
Where there is clear evidence of acute fetal compromise (for example, prolonged deceleration greater than 3 minutes), FBS should not be undertaken and urgent preparations to expedite birth should be made.
Complicated labour: monitoring babies in labour
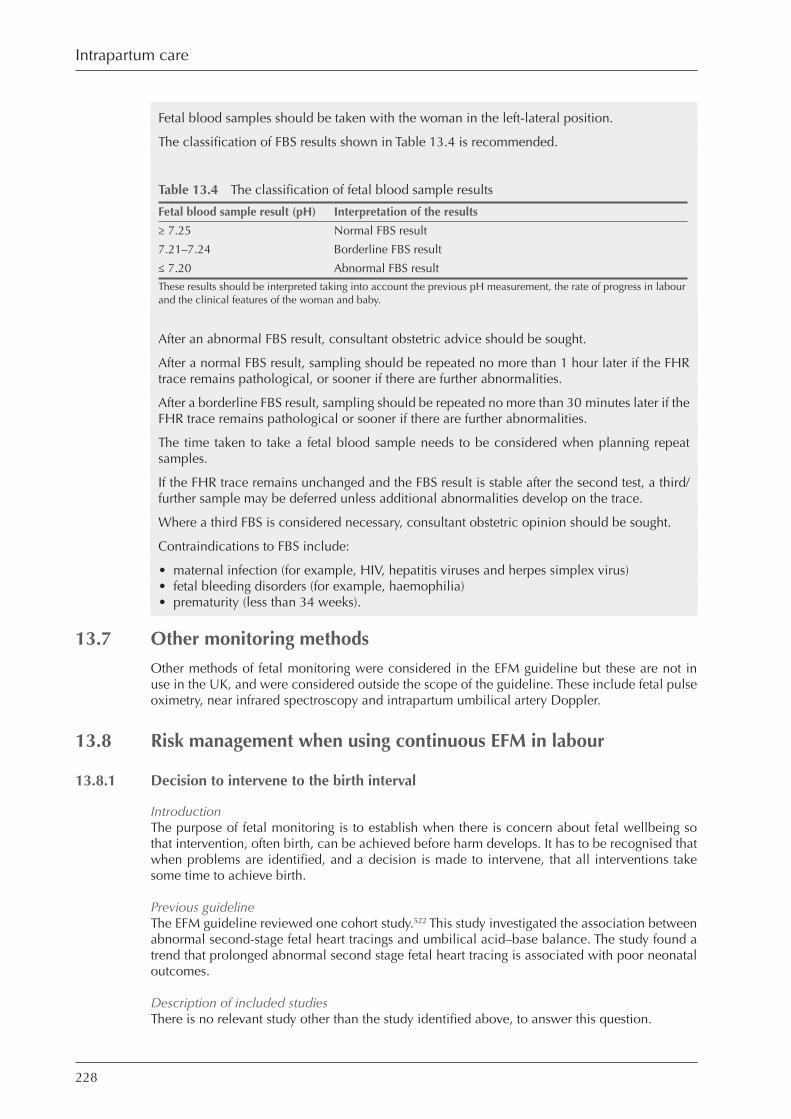
228
Intrapartum care
Fetal blood samples should be taken with the woman in the left-lateral position.
The classification of FBS results shown in Table 13.4 is recommended.
Table 13.4 The classification of fetal blood sample results
Fetal blood sample result (pH) Interpretation of the results
≥ 7.25 Normal FBS result
7.21–7.24 Borderline FBS result
≤ 7.20 Abnormal FBS result
These results should be interpreted taking into account the previous pH measurement, the rate of progress in labour and the clinical features of the woman and baby.
After an abnormal FBS result, consultant obstetric advice should be sought.
After a normal FBS result, sampling should be repeated no more than 1 hour later if the FHR trace remains pathological, or sooner if there are further abnormalities.
After a borderline FBS result, sampling should be repeated no more than 30 minutes later if the FHR trace remains pathological or sooner if there are further abnormalities.
The time taken to take a fetal blood sample needs to be considered when planning repeat samples.
If the FHR trace remains unchanged and the FBS result is stable after the second test, a third/further sample may be deferred unless additional abnormalities develop on the trace.
Where a third FBS is considered necessary, consultant obstetric opinion should be sought.
Contraindications to FBS include:
• maternal infection (for example, HIV, hepatitis viruses and herpes simplex virus)• fetal bleeding disorders (for example, haemophilia)• prematurity (less than 34 weeks).
13.7 Other monitoring methods
Other methods of fetal monitoring were considered in the EFM guideline but these are not in use in the UK, and were considered outside the scope of the guideline. These include fetal pulse oximetry, near infrared spectroscopy and intrapartum umbilical artery Doppler.
13.8 Risk management when using continuous EFM in labour
13.8.1 Decision to intervene to the birth interval
IntroductionThe purpose of fetal monitoring is to establish when there is concern about fetal wellbeing so that intervention, often birth, can be achieved before harm develops. It has to be recognised that when problems are identified, and a decision is made to intervene, that all interventions take some time to achieve birth.
Previous guidelineThe EFM guideline reviewed one cohort study.522 This study investigated the association between abnormal second-stage fetal heart tracings and umbilical acid–base balance. The study found a trend that prolonged abnormal second stage fetal heart tracing is associated with poor neonatal outcomes.
Description of included studiesThere is no relevant study other than the study identified above, to answer this question.

229
Evidence statementThere is no high-quality evidence of association between duration of abnormal fetal heart trace and neonatal outcomes.
Decision to instrumental vaginal birth
Description of included studiesTwo UK studies were identified, investigating the interval of decision to birth for instrumental vaginal birth.523,524 [EL = 3] The study by Okunwobi was published in 2000, and 225 women were included.523 The study by Eldridge was published in 2004, and 49 women were included.524
Review findingsThe Okunwobi study showed averages of decision to birth interval as a mean of 34.4 min-utes (SD 28.3 minutes), ranging from 5 to 101 minutes, and that for fetal distress as a mean of 26.5 minutes (SD 14.0 minutes); while without fetal distress, the mean was 39.5 minutes (SD 19.0 minutes). The study also showed a mean decision to birth interval with ventouse of 29.2 minutes (SD 13.2 minutes) and with forceps of 23.3 minutes (SD 14.3 minutes). The Eldridge study showed a median decision to birth interval of 19.0 minutes [range 6 to 85 minutes] and a mean of 26.0 minutes [95% CI 20 to 31 minutes], while for fetal distress, the median was 16.0 minutes [range 6 to 61 minutes], with a mean of 22.0 minutes [95% CI 16 to 25 minutes].
Evidence statementThe average interval between decision and childbirth for instrumental vaginal birth due to presumed fetal compromise in the UK, in the study context, seems to range between 20 and 30 minutes.
Decision to caesarean section
Description of included studiesThree UK studies525–527 and one US study528 were identified.
The UK national audit of caesarean sections published in October 2001, collected data from all maternity hospitals in England and Wales between May and July 2000.527 This was estimated to represent 99% of all CS in the defined area/population. [EL = 3]
The second UK study assessed interval of decision to birth by CS in a large district hospital.525 [EL = 3] The third UK study assessed interval of decision to CS birth with or without fetal dis-tress.526 Both studies are cross-sectional surveys. [EL = 3] In the US study, CS performed due to non-reassuring EFM was classified as emergent or urgent based on EFM findings and compared decision to birth intervals and other outcomes between the two groups.528 [EL = 3]
Review findingsThe national audit of 29 488 CS showed a median interval of decision to birth by CS for England and Wales as: 26 minutes (IQR 20 to 36 minutes) for cases with fetal blood pH less than 7.20 (n = 424); 26 minutes (IQR 17 to 40 minutes) for cases with severely abnormal FHR trace (n = 1530); 17 minutes (IQR 12 to 26 minutes) for cases with cord prolapse (n = 147); 29 min-utes (IQR 20 to 44 minutes) for cases with placenta abruption (n = 253); and 27 minutes (IQR 18 to 40 minutes) for urgency cases (n = 1) and any of the indications above (n = 2385).527
In the second UK study, 66.3% women had an interval of less than 30 minutes from decision to CS birth, 88.3% with an interval less than 40 minutes and 4.0% with more than 50 minutes. There was no evidence of a difference in the incidence of babies who were admitted to neonatal units.
The third UK study showed a significant reduction of the interval for women with fetal distress, com-pared with those without (time interval for fetal distress, mean 42.9 minutes (SD 24.1 minutes); time interval without fetal distress, mean 71.1 minutes (SD 42.3 minutes), P < 0.0001).
The US study showed a significant difference in decision to birth interval between emergent CS (mean 23.0 minutes (SD 15.3 minutes)) and urgent CS (mean 36.7 minutes (SD 14.9 minutes)) (P < 0.001). There was a significant association between the interval and umbilical arterial pH (linear regression r = 0.22, P = 0.02) and between the interval and umbilical base excess (linear regression r = 0.33, P < 0.001). Although there was evidence of a difference between
Complicated labour: monitoring babies in labour

230
Intrapartum care
emergent and urgent groups in umbilical arterial pH (emergent = 7.12 (SD 0.16), urgent = 7.22 (SD 0.08), P < 0.001); umbilical arterial base excess (emergent = −8.8 mmol/l (SD 4.3 mmol/l), urgent = −3.9 mmol/l (SD 2.4 mmol/l), P < 0.001); cord arterial pH < 7.1 (emergent = 6/34, urgent = 2/83, P = 0.007); and cord base excess < −12.0 mmol/l (emergent = 8/34, urgent = 1/83, P < 0.001); there was no evidence of differences in neonatal outcomes: 1 minute Apgar less than 7 (emergent = 15/34, urgent = 27/83, P = 0.24); 5 minute Apgar less than 7 (emergent = 3/34, urgent = 8/83, P = 1.00); intra-ventricular haemorrhage (emergent = 2/34, urgent = 5/83, P = 1.0); and neonatal death (emergent = 1/34, urgent = 0/83, P = 0.64).
Evidence statementThe average interval between decision and childbirth for CS for fetal concern in the UK, in the study context, seems to range between 30 and 40 minutes.
Recommendation on decision to intervene to the birth interval
Clinicians should take into account the time that it will take to achieve birth by both instru-mental vaginal birth and caesarean section when making decisions regarding concern over fetal wellbeing during labour.
13.8.2 Risk management in monitoring babies in labour
IntroductionObstetric litigation is expensive because of the number of cases and the costs of each case. The majority of obstetric litigation claims revolve around FHR trace abnormalities and interpretation. Litigation can ensue many years after alleged harm has been suffered. In order to provide a fair assessment of a case for all parties, FHR traces need to be available and as much information as possible obtained about the causes of poor outcome.
Storage of FHR traces
Description of included studiesThis was reviewed in the EFM guideline.460 No new studies were identified.
Evidence statement (from the NICE EFM guideline)Storage of FHR traces is complicated due to issues of security, retrieval, space and conservation. FHR traces related to an adverse outcome for mother or baby are more likely to go missing. The quality of some FHR traces deteriorates over time. This could be due to a number of factors including poor quality storage, paper, intense heat, light or moisture.
Recommendations on risk management in monitoring babies in labour
FHR traces should be kept for 25 years and, where possible, stored electronically.
In cases where there is concern that the baby may suffer developmental delay, FHR traces should be photocopied and stored indefinitely in case of possible adverse outcomes.
Tracer systems should be available for all FHR traces if stored separately from women’s records.
Tracer systems should be developed to ensure that FHR traces removed for any purpose (such as risk management or for teaching purposes) can always be located.
13.8.3 Cord blood gas analysis
Clinical questionIs there evidence that routine taking of cord blood gases influences outcomes?
Description of included studiesA total of eight cohort studies and one systematic review that examined predictive values of cord blood gas were identified.418,529–536 The systematic review included 12 cohort studies. Studies on
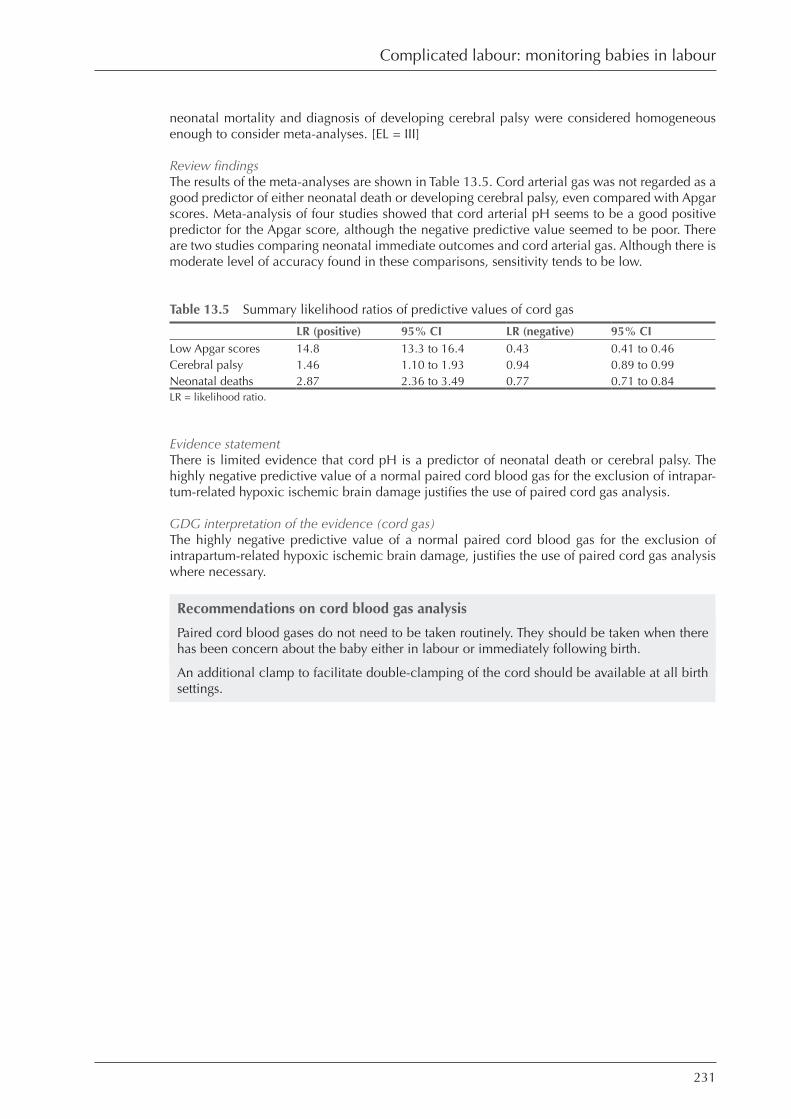
231
neonatal mortality and diagnosis of developing cerebral palsy were considered homogeneous enough to consider meta-analyses. [EL = III]
Review findingsThe results of the meta-analyses are shown in Table 13.5. Cord arterial gas was not regarded as a good predictor of either neonatal death or developing cerebral palsy, even compared with Apgar scores. Meta-analysis of four studies showed that cord arterial pH seems to be a good positive predictor for the Apgar score, although the negative predictive value seemed to be poor. There are two studies comparing neonatal immediate outcomes and cord arterial gas. Although there is moderate level of accuracy found in these comparisons, sensitivity tends to be low.
Table 13.5 Summary likelihood ratios of predictive values of cord gas
LR (positive) 95% CI LR (negative) 95% CI
Low Apgar scores 14.8 13.3 to 16.4 0.43 0.41 to 0.46
Cerebral palsy 1.46 1.10 to 1.93 0.94 0.89 to 0.99
Neonatal deaths 2.87 2.36 to 3.49 0.77 0.71 to 0.84
LR = likelihood ratio.
Evidence statementThere is limited evidence that cord pH is a predictor of neonatal death or cerebral palsy. The highly negative predictive value of a normal paired cord blood gas for the exclusion of intrapar-tum-related hypoxic ischemic brain damage justifies the use of paired cord gas analysis.
GDG interpretation of the evidence (cord gas)The highly negative predictive value of a normal paired cord blood gas for the exclusion of intrapartum-related hypoxic ischemic brain damage, justifies the use of paired cord gas analysis where necessary.
Recommendations on cord blood gas analysis
Paired cord blood gases do not need to be taken routinely. They should be taken when there has been concern about the baby either in labour or immediately following birth.
An additional clamp to facilitate double-clamping of the cord should be available at all birth settings.
Complicated labour: monitoring babies in labour
232
14 Complicated labour: first stage
14.1 Definition of delay in the first stage of labour
IntroductionDelay in the first stage of labour has been defined in a number of ways and there is no universal consensus. It has been traditional to define delay largely by the rate of cervical progress without taking into account either maternal uterine activity or descent or rotation of the fetal head during labour. Although it is acknowledged that the duration of labour is dependent on parity, clinical practice and local labour guidelines rarely make that distinction.
Clinical questionDo duration and progress of the first and second stages of labour affect outcomes?
DiscussionThe GDG discussed the definition of delay in the first stage of labour, based on the evidence presented in Chapter 7 and made the following recommendation.
Recommendation on definition of delay in the first stage of labour
A diagnosis of delay in the established first stage of labour needs to take into consideration all aspects of progress in labour and should include:
• cervical dilatation of less than 2 cm in 4 hours for first labours• cervical dilatation of less than 2 cm in 4 hours or a slowing in the progress of labour for
second or subsequent labours• descent and rotation of the fetal head• changes in the strength, duration and frequency of uterine contractions.
14.2 Interventions for perceived delay in the first stage of labour
Clinical questionWhat is the effectiveness of the following interventions or techniques in labour on outcomes?
• amniotomy• oxytocin.
Previous guidelineThe NICE clinical guideline Caesarean Section6 reviewed evidence from one RCT and two obser-vational studies on oxytocin, as well as one systematic review on amniotomy. The guideline recommended that the following aspects of intrapartum care have not been shown to influence the likelihood of caesarean section (CS) for ‘failure to progress’ and should not be offered for this reason, although they may affect other outcomes which are outside the scope of this guideline: early amniotomy. A research recommendation was also developed as more RCTs are required to determine the effect of oxytocin augmentation as single interventions or as part of a package of interventions (such as ‘active management of labour’) on the likelihood of CS and other outcomes including women’s satisfaction with care. Further research on the short- and longer-term health impacts of CS during the second stage, compared with instrumental vaginal birth, is needed.

233
14.2.1 Amniotomy versus expectant management
Description of included studiesOne systematic review including nine trials, published in 1999, was identified. The review was of good quality.537 The results were stratified by parity of the women. The intervention was amniotomy targeting women in labour who required augmentation, compared with expectant management.
Review findings
Nulliparous womenMeta-analysis of included trials showed strong evidence that amniotomy significantly reduced the time to birth: randomisation and birth interval (two trials, n = 117 women): MD −53.67 minutes [95% CI −66.50 to −40.83 minutes]; randomisation and full dilatation interval (three trials, n = 298 women): MD −39.45 minutes [95% CI −50.10 to −28.80 minutes]; rate of dystocia (one trial, n = 925 women): OR 0.63 [95% CI 0.48 to 0.82]); rate of cord prolapse (one trial, n = 925 women): OR 0.14 [95% CI 0.00 to 6.84]); and the proportion of women whose labour pain was unbearable (three trials, n = 1283 women): OR 0.76 [95% CI 0.60, 0.97]. There was no evidence of differences in any other maternal variable: oxytocin use, use of analgesia, CS rate, instrumental birth rate, incidence of abnormal or suspect fetal heart rate (FHR), maternal febrile morbidity, maternal blood transfusion, or maternal satisfaction (see evidence tables). For the babies, there was no evidence of differences in: malrotation of the fetal head (one trial, n = 32 women): OR 0.47 [95% CI 0.12 to 1.89]; Apgar score less than 7 at 5 minutes (five trials, n = 2518 women): OR 0.94 [95% CI 0.67 to 1.33]; neonatal jaundice (three trials, n = 2383 women): OR 1.05 [95% CI 0.70 to 1.58]; rate of admission to special care nursery (four trials, n = 1996 women): OR 1.13 [95% CI 0.78 to 1.62]; incidence of cephalhaematoma (two trials, n = 1022 women): OR 1.66 [95% CI 0.86 to 3.21]; and neonatal infective morbidity (two trials, n = 1353 women): OR 1.43 [95% CI 0.85 to 2.41].
Parous womenThe evidence for multiparous women is limited, although it showed significant reduction in the interval between randomisation and full dilatation (one trial, n = 269 women): MD −54.00 min-utes [95% CI −101.37, −6.63 minutes]. Otherwise, there was no evidence of differences in the: use of oxytocin (one trial, n = 940 women): OR 1.22 [95% CI 0.67 to 2.21]; use of analgesia (epidural/narcotics) (one trial, 940 women): OR 1.14 [95% CI 0.80 to 1.63]; rate of CS (one trial 940 women): OR 2.65 [95% CI 0.75 to 9.29]; rate of instrumental vaginal birth (one trial 940 women): OR 1.20 [95% CI 0.65 to 2.21]; or incidence of neonatal jaundice (one trial 531 women): OR 3.61 [95% CI 0.89 to 14.75].
Evidence statementWhen there is delay in the established first stage of labour, there is high-level evidence that the duration is shortened by amniotomy.
14.2.2 Amniotomy and oxytocin versus oxytocin
Description of included studiesOne RCT conducted in the USA was identified (n = 118: amniotomy = 58; control = 60).538 The study population involved both nulliparous and parous women with active phase arrest. The intervention of routine amniotomy followed by oxytocin was compared with oxytocin followed by selective amniotomy.
Review findingsThere is no evidence of a difference in the interval between randomisation and birth (MD −0.70 hours [−1.55 to 0.15 hours]); rate of CS (RR 1.21 [95% CI 0.34 to 4.28]) and neonatal infection (RR 4.83 [95% CI 0.58 to 40.13]), although there was significantly more women with postpartum infection in the intervention group than in the control group (amniotomy = 7/60; control = 0/58, P = 0.01).
Complicated labour: first stage

234
Intrapartum care
14.2.3 Amniotomy versus amniotomy plus oxytocin
Description of included studiesThree UK trials were identified. The first study involved 926 nulliparous and parous women requiring augmentation (oxytocin = 465; control = 461).539 The second trial involved 61 nullipa-rous women progressing slowly (amniotomy + high-dose oxytocin = 19; amniotomy + low-dose oxytocin = 21; control = 20).540 The third trial involved nulliparous and multiparous women requiring augmentation (oxytocin + amniotomy = 21; amniotomy only = 20).541
Review findingsMeta-analysis of the trials showed no evidence of differences in the rate of CS (three trials, RR 0.82 [95% CI 0.47 to 1.40]); use of epidural (two trials, RR 1.01 [95% CI 0.79 to 1.30]); pro-portion of the babies with an Apgar score less than 7 at 5 minutes (two trials, RR 0.95 [95% CI 0.13 to 7.09]); admissions to the neonatal unit (one trial, RR 3.00 [95% CI 0.12 to 78.04]); and maternal satisfaction score (one trial, MD 9.00 [95% CI −6.73 to 24.73]).
14.2.4 Amniotomy and oxytocin versus delayed amniotomy and oxytocin
Description of included studiesThe UK trial included in the above review also investigated this comparison.541 The population comprised 61 nulliparous and multiparous women requiring augmentation (oxytocin and amni-otomy = 21; expectant = 19).
Review findingsThe trial showed a significant reduction in the interval between randomisation and giving birth (intervention = 266 minutes (SD 166), control = 463 minutes (SD 164 minutes), P < 0.001) and an increase in maternal satisfaction (satisfaction score intervention = 149 (SD 23), control = 118 (SD 33), P = 0.002), although there was no evidence of differences in the use of epidural (RR 0.55 [95% CI 0.12 to 2.4]), rate of CS (RR 2.6 [95% CI 0.4 to 30.9]) and neonatal outcomes (Apgar < 7 at 5 minutes intervention = 1/21, control = 0/19; admission to SCBU, intervention = 1/21, control = 0/19).
Evidence statementThere is evidence that where labour is delayed, amniotomy followed by an oxytocin infusion with a low-dose regimen (0–3 mU per minute) shortens the duration of the first stage of labour but it does not appear to improve the chance of vaginal birth or any other outcome. Where rup-tured membranes have occurred, there is no evidence that giving oxytocin in the first 8 hours after this alters anything except the duration of labour.
14.2.5 Effect of augmentation on electronic FHR abnormalities
Amniotomy for delay in labour
Description of included studiesThere is one systematic review including nine trials identified.537 The systematic review was of good quality. [EL = 1+] Among the included studies, three trials assessed effect of amniotomy for shortening labour on FHR tracing.
Review findingsThere was no evidence of a difference in incidence of abnormal or suspect FHR trace (all women including nulliparous and multiparous RR 1.06 [95% CI 0.80 to 1.42]; only nulliparous women RR 0.93 [95% CI 0.67 to 1.31]).
Evidence statementThere is no evidence of a difference in abnormal FHR tracing following amniotomy for delay in the first stage of labour.
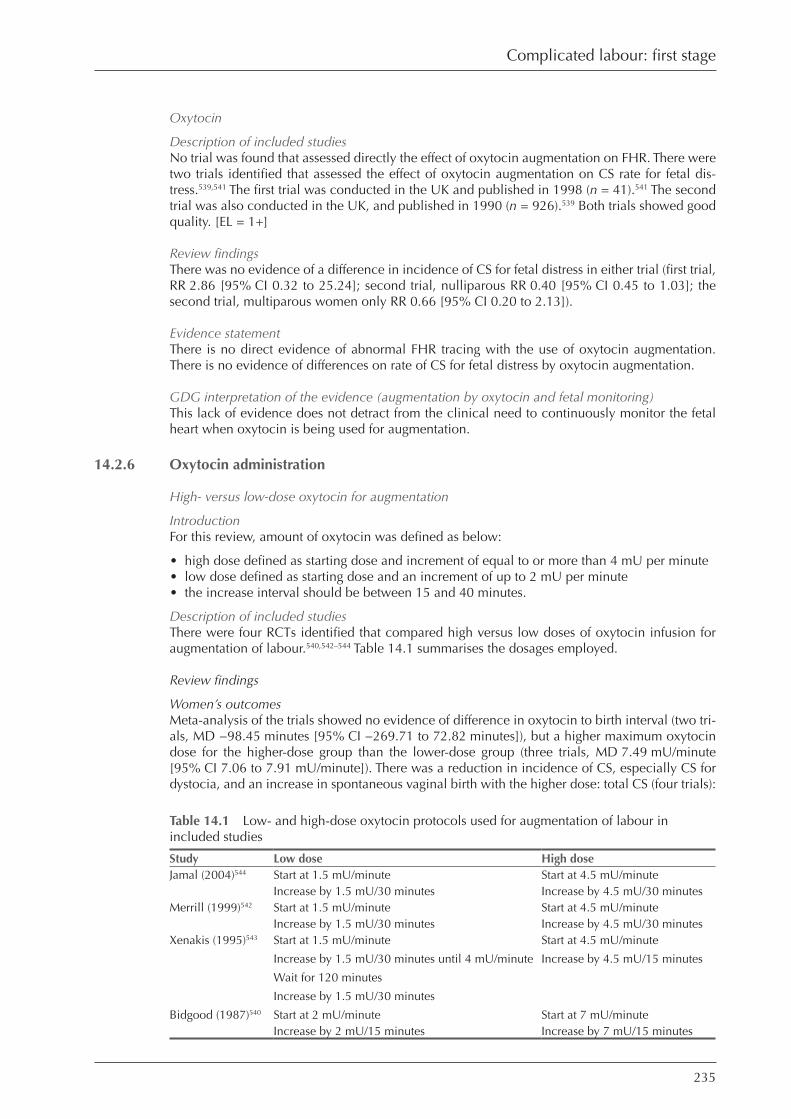
235
Oxytocin
Description of included studiesNo trial was found that assessed directly the effect of oxytocin augmentation on FHR. There were two trials identified that assessed the effect of oxytocin augmentation on CS rate for fetal dis-tress.539,541 The first trial was conducted in the UK and published in 1998 (n = 41).541 The second trial was also conducted in the UK, and published in 1990 (n = 926).539 Both trials showed good quality. [EL = 1+]
Review findingsThere was no evidence of a difference in incidence of CS for fetal distress in either trial (first trial, RR 2.86 [95% CI 0.32 to 25.24]; second trial, nulliparous RR 0.40 [95% CI 0.45 to 1.03]; the second trial, multiparous women only RR 0.66 [95% CI 0.20 to 2.13]).
Evidence statementThere is no direct evidence of abnormal FHR tracing with the use of oxytocin augmentation. There is no evidence of differences on rate of CS for fetal distress by oxytocin augmentation.
GDG interpretation of the evidence (augmentation by oxytocin and fetal monitoring)This lack of evidence does not detract from the clinical need to continuously monitor the fetal heart when oxytocin is being used for augmentation.
14.2.6 Oxytocin administration
High- versus low-dose oxytocin for augmentation
IntroductionFor this review, amount of oxytocin was defined as below:
• high dose defined as starting dose and increment of equal to or more than 4 mU per minute• low dose defined as starting dose and an increment of up to 2 mU per minute• the increase interval should be between 15 and 40 minutes.
Description of included studiesThere were four RCTs identified that compared high versus low doses of oxytocin infusion for augmentation of labour.540,542–544 Table 14.1 summarises the dosages employed.
Review findings
Women’s outcomesMeta-analysis of the trials showed no evidence of difference in oxytocin to birth interval (two tri-als, MD −98.45 minutes [95% CI −269.71 to 72.82 minutes]), but a higher maximum oxytocin dose for the higher-dose group than the lower-dose group (three trials, MD 7.49 mU/minute [95% CI 7.06 to 7.91 mU/minute]). There was a reduction in incidence of CS, especially CS for dystocia, and an increase in spontaneous vaginal birth with the higher dose: total CS (four trials):
Table 14.1 Low- and high-dose oxytocin protocols used for augmentation of labour in included studies
Study Low dose High dose
Jamal (2004)544 Start at 1.5 mU/minute Start at 4.5 mU/minute
Increase by 1.5 mU/30 minutes Increase by 4.5 mU/30 minutes
Merrill (1999)542 Start at 1.5 mU/minute Start at 4.5 mU/minute
Increase by 1.5 mU/30 minutes Increase by 4.5 mU/30 minutes
Xenakis (1995)543 Start at 1.5 mU/minute Start at 4.5 mU/minute
Increase by 1.5 mU/30 minutes until 4 mU/minute Increase by 4.5 mU/15 minutes
Wait for 120 minutes
Increase by 1.5 mU/30 minutes
Bidgood (1987)540 Start at 2 mU/minute Start at 7 mU/minute
Increase by 2 mU/15 minutes Increase by 7 mU/15 minutes
Complicated labour: first stage

236
Intrapartum care
RR 0.76 [95% CI 0.62 to 0.92]; CS for dystocia (three trials): RR 0.72 [95% CI 0.57 to 0.91]; CS for fetal distress (three trials): RR 0.91 [95% CI 0.58 to 1.40]; and spontaneous vaginal birth (two trials): RR 1.13 [95% CI 1.07 to 1.20]). There were more women with hyperstimulation (four tri-als): RR 1.35 [95% CI 1.21 to 1.50]) but less women with chorioamnionitis (three trials): RR 0.71 [95% CI 0.56 to 0.90]) with the higher dose, while there was no evidence of a difference in inci-dence of shoulder dystocia (two trials): RR 1.36 [95% CI 0.63 to 2.95]).
Newborn outcomesThere was no evidence of differences in the proportion of: babies who were admitted to neo-natal units (two trials, RR 0.95 [95% CI 0.68 to 1.32]); babies with Apgar scores less than 7 at 5 minutes (four trials, RR 0.98 [95% CI 0.42 to 2.28]); and perinatal deaths (four trials, RR 1.45 [95% CI 0.37 to 5.74]).
Women’s satisfaction and other psychological outcomesNo identified study investigated these outcomes.
Evidence statementThere is reasonable quality evidence on high- or low- doses of oxytocin. Women with high dose of oxytocin for augmentation complete their labours quicker but had higher maximum oxytocin dose than those with the lower dose.
Women with high-dose oxytocin for augmentation had less CS, most of which contributed by CS for dystocia, more spontaneous vaginal birth, and less chorioamnionitis, but had more hyper-stimulation than those with the lower dose. The studies are underpowered to examine serious neonatal morbidity or mortality.
There is no evidence on women’s satisfaction and long-term outcomes.
GDG interpretation of evidence (high- versus low-dose of oxytocin for augmentation)There is evidence on high- versus low-dose oxytocin, but studies are heterogeneous. Women whose labours are augmented with high-dose oxytocin may have shorter labours, less CS and more spontaneous vaginal birth than those receiving a low dose. However, the GDG remain cau-tious about the use of higher doses of oxytocin because there is insufficient evidence on neonatal outcomes and none on pain for women receiving high-dose oxytocin (4 mU/minute or greater) for augmentation.
Comparing different oxytocin dosage regimens
Description of included studiesThere are five RCTs identified investigating different oxytocin dosages apart from the above studies.545–549 Because of the heterogeneity of the studies, it was not possible to conduct a meta-analysis, hence a descriptive summary is presented.
Review findingsA trial conducted in Zimbabwe (2001) involved 258 nulliparous women who required augmen-tation in labour, and compared different high doses of oxytocin use.545 [EL = 1−] The lower dose started at 4 mU/minute, doubled every 30 minutes until 16 mU/minute, and then 64 mU/minute, while the higher dose started at 10 mU/minute and doubled every 60 minutes until 40 mU/minute. The trial showed a significant reduction in the proportion of women with more than 6 hours from augmentation to giving birth (RR 0.36 [95% CI 0.21 to 0.62]). No difference was found for CS rate (RR 0.95 [95% CI 0.42 to 2.15]) or neonatal outcomes.
A US RCT (1994) involving 1167 women who required augmentation in labour, compared women’s and babies’ outcomes for different increment times of oxytocin: 20 minute dose (start at 6 mU/minute, increase by 6 mU/20 minutes until 42 mU/minute) versus 40 minute dose (start at 6 mU/minute, increase by 6 mU/40 minutes until 42 mU/minute).546 [EL = 1+] The findings showed a reduction in incidence of CS for dystocia with quicker dosage than slower dosage (OR 0.65 [95% CI 0.43 to 0.97]), and there was borderline evidence of more uterine hyper-stimulation with faster rates (OR 1.3 [95% CI 0.98 to 1.7]), but there is no evidence of difference

237
in chorioamnionitis (OR 0.97 [95% CI 0.66 to 1.4]) and babies admitted to the neonatal unit (OR 1.3 [95% CI 0.77 to 2.4])
A second US RCT involving 487 women who required augmentation in labour, compared a 15 minute dose (start at 1 mU/minute, increase 1 mU/15 minutes until 5 mU/minute, increase by 1–2 mU/15 minutes) and a 40 minute dose (start at 1 mU/minute, increase 1.5 mU/40 minutes until 7 mU/minute, then increase by 1.5–3.0 mU/40 minutes).547 [EL = 1+]
The results showed more women reached higher maximum dose of oxytocin (mean 15 min-utes = 8.2 mU/minute; 40 minutes = 6.5 mU/minute, P < 0.001), and experienced fetal distress (RR 1.68, P < 0.005) and uterine hyperstimulation (RR 1.69, P < 0.001) with the 15 minute dose, compared with the 40 minute dose.
A third RCT conducted in the USA (n = 94) compared continuous infusion of oxytocin (start at 1 mU/minute, increase by 1 mU/20 minutes) and repeated pulsatile injection of oxytocin (start at 1 mU per pulse (10 seconds every 8 minutes), doubled every 24 minutes).548 [EL = 1+] Women with the pulsatile regimen required less amount of oxytocin: average level of oxytocin pulsa-tile = 2.1 mU/minute (SD 0.4 mU/minute), continuous = 4.1 mU/minute (SD 0.4 mU/minute), P < 0.001; total amount of oxytocin pulsatile = 1300 mU (SD 332 mU), continuous = 1803 mU (SD 302 mU), P < 0.001); compared with the continuous regimen, with no differences in dys-functional contractions (RR 1.04, NS).
There was one RCT in the UK identified.549 [EL = 1−] The study population consisted of 68 nulliparous women who required augmentation in labour. The oxytocin was started at 2.5 mU/minute, and increased by 2.5 mU/30 minutes for both arms. The comparison was made as the oxytocin was increased either until uterine contraction was 6 in 15 minutes or until uterine activ-ity was 1750 kPas/15 minute measured by an intrauterine catheter. The study was underpowered and found no difference in: maximum oxytocin dose frequency = 8.3 mU/minute (SD 3.7 mU/minute); uterine activity = 8.0 mU/minute (SD 3.1 mU/minute); hyperstimulation (RR 0.54, NS); rate of CS (RR 2.00, NS); and Apgar score < 5 at 1 minute (RR 0.33, NS).
Evidence statementThe evidence on different oxytocin dosage regimens for augmentation is limited as the studies tended to be underpowered and use too many different regimens. Women with quicker incre-ments of oxytocin dose for augmentation appeared to have more hyperstimulation, compared with those with slower increments. Women with quicker increments of a high dose of oxytocin seemed to have less CS for dystocia than those with a slower dose, but there is no evidence of a difference in this comparison for low dose. Women with quicker increments of low doses of oxy-tocin seemed to experience fetal distress, compared with those with the slower increments. There was limited evidence on pulsatile oxytocin compared with continuous infusion. The limited evi-dence showed a smaller amount of oxytocin was required with pulsatile injections, but there was no evidence of differences in other outcomes. There was insufficient evidence on other outcomes including neonatal outcomes and women’s satisfaction on different oxytocin regimens.
GDG interpretation of the evidence (different doses of oxytocin for augmentation)The evidence on dose regimens for augmentation is limited as the studies are underpowered and use different comparisons. Increasing the rate more frequently than every 20 minutes may be asso-ciated with more uterine hyperstimulation and more non-reassuring fetal heart rate patterns.
Recommendations on interventions for perceived delay in first stage of labour
Where delay in the established first stage is suspected the following should be considered:
• parity• cervical dilatation and rate of change• uterine contractions• station and position of presenting part• the woman’s emotional state• referral to the appropriate healthcare professional,
and women should be offered support, hydration, and appropriate and effective pain relief.
Complicated labour: first stage
238
Intrapartum care
If delay in the established first stage of labour is suspected, amniotomy should be considered for all women with intact membranes, following explanation of the procedure and advice that it will shorten her labour by about an hour and may increase the strength and pain of her contractions.
Whether or not a woman has agreed to an amniotomy, all women with suspected delay in the established first stage of labour should be advised to have a vaginal examination 2 hours later, and if progress is less than 1 cm a diagnosis of delay is made.
In women with intact membranes in whom delay in the established first stage of labour is confirmed, amniotomy should be advised to the woman, and she should be advised to have a repeat vaginal examination 2 hours later whether her membranes are ruptured or intact.
When delay in the established first stage of labour is confirmed in nulliparous women, advice should be sought from an obstetrician and the use of oxytocin should be considered. The woman should be informed that the use of oxytocin following spontaneous or artificial rupture of the membranes will bring forward her time of birth but will not influence the mode of birth or other outcomes.
Multiparous women with confirmed delay in the first stage should be seen by an obstetrician who should make a full assessment, including an abdominal palpation and vaginal examina-tion, before making a decision about the use of oxytocin.
All women with delay in the established first stage of labour should be offered support and effective pain relief.
Women should be informed that oxytocin will increase the frequency and strength of their contractions and that its use will mean their baby should be monitored continuously. Women should be offered an epidural before oxytocin is started.
Where oxytocin is used, the time between increments of the dose should be no more fre-quent than every 30 minutes. Oxytocin should be increased until there are 4–5 contractions in 10 minutes. (See also Chapter 13 on monitoring babies in labour.)
The woman should be advised to have a vaginal examination 4 hours after commencing oxy-tocin in established labour. If there is less than 2 cm progress after 4 hours of oxytocin, further obstetric review is required to consider caesarean section. If there is 2 cm or more progress, vaginal examinations should be advised 4 hourly.
Amniotomy alone for suspected delay in the established first stage of labour is not an indica-tion to commence continuous EFM.
Where a diagnosis of delay in the established first stage of labour is made, continuous EFM should be offered.
Continuous EFM should be used when oxytocin is administered for augmentation.
Research recommendation on oxytocin for augmentation of labour
The start dose of oxytocin for augmentation, and the increments, should be the subject of further research.
Studies are needed that investigate the effectiveness of any strategies to increase spontaneous vaginal birth where diagnosis is made of delay in the first stage of labour.
239
15 Complicated labour: second stage
15.1 Delay in the second stage of labour
IntroductionDelay in the second stage of labour has been defined in a number of ways and there is no uni-versal consensus. This is discussed in Chapter 8.
The definition of the onset of the active second stage of labour: (from Chapter 8)
• the baby is visible• expulsive contractions with a finding of full dilatation of the cervix, or other signs of full dila-
tation of the cervix• there is active maternal effort, following confirmation of full dilatation of the cervix, in the
absence of expulsive contractions.
Clinical questionDo duration and progress of the first and second stages of labour affect outcomes?
Discussion
The GDG discussed the definition of delay in the first stage of labour based on the evidence presented in Chapter 8 and made the following recommendations.
Recommendations on duration and definition of delay in the second stage of labour
Nulliparous women:
• Birth would be expected to take place within 3 hours of the start of the active second stage in most women.
• A diagnosis of delay in the active second stage should be made when it has lasted 2 hours and women should be referred to a healthcare professional trained to undertake an opera-tive vaginal birth if birth is not imminent. [repeated from Section 8.2]
Parous women:
• Birth would be expected to take place within 2 hours of the start of the active second stage in most women.
• A diagnosis of delay in the active second stage should be made when it has lasted 1 hour and women should be referred to a healthcare professional trained to undertake an opera-tive vaginal birth if birth is not imminent. [repeated from Section 8.2]
15.1.1 Indication for instrument-assisted vaginal birth
Overview of available evidenceNo randomised controlled trial was identified.
Evidence statementThere is no high-quality evidence to compare indications for assisted vaginal birth.

240
Intrapartum care
15.1.2 Interventions for delay in the second stage
IntroductionThe review refers to women without epidural analgesia, and who have not had a previous cae-sarean section.
Oxytocin versus expectant management
Description of included studiesThere is no study identified comparing oxytocin infusion with expectant management, for man-agement of women without epidural analgesia who have a delayed second stage of labour.
Evidence statementThere are no high-quality studies looking at the use of oxytocin for delay in the second stage of labour, for women without epidural analgesia.
Oxytocin versus instrumental births
Description of included studiesThere is no study identified comparing these two interventions.
Evidence statementThere is no high-level evidence on effectiveness and safety of oxytocin infusion for management of the second stage of labour, compared with instrumental vaginal birth.
GDG interpretation of the evidenceWhile there is no evidence on starting oxytocin in the second stage of labour for parous women, the GDG consider the potential risks of uterine rupture are such that we cannot recommend it.
Recommendations on interventions for delay in the second stage of labour
Where there is delay in the second stage of labour, or if the woman is excessively distressed, support and sensitive encouragement and the woman’s need for analgesia/anaesthesia are particularly important.
Consideration should be given to the use of oxytocin, with the offer of regional analgesia, for nulliparous women if contractions are inadequate at the onset of the second stage
In nulliparous women, if after 1 hour of active second stage progress is inadequate, delay is suspected. Following vaginal examination, amniotomy should be offered if the membranes are intact.
Women with confirmed delay in the second stage should be assessed by an obstetrician but oxytocin should not be started.
Following initial obstetric assessment for women with delay in the second stage of labour, ongoing obstetric review should be maintained every 15–30 minutes.
15.1.3 Instrument to be used
Clinical questionWhat are the indications for the use of ventouse or forceps?
Ventouse versus forceps
Description of included studiesThe evidence for this subsection was drawn from a good quality systematic review550 including ten trials, plus three additional recent trials.551–553 [EL = 1+] The systematic review was published in April 1999, and the last search was performed in February 1999. The trials included in the systematic review were conducted in USA, Denmark, Sweden, UK, South Africa and Greece. The recent trials were conducted in Sri Lanka,551 Pakistan552 and Ireland.553 There are two follow-up studies of trials using the same population that were included in the systematic review, which investigated long-term outcomes of mothers and their children. These studies were conducted in the UK (published in 1999 and 1998).554,555

241
Review findings
Labour eventsMeta-analysis of nine trials showed that ventouse-assisted birth was more likely to be associ-ated with failed birth with selected instruments compared with forceps-assisted birth (n = 2849, OR 1.69 [95% CI 1.31, 2.19]).556 Another recent trial in Pakistan showed the same association (n = 442, RR 2.04 [95% CI 1.14, 3.70]).552 There was no evidence of differences in rates of CS (meta-analysis of seven trials, n = 1662, OR 0.56 [95% CI 0.31, 1.02]). Meta-analysis of 12 trials showed a significant reduction of the use of anaesthesia with ventouse-assisted birth (n = 5051, OR 0.59 [95% CI 0.51, 0.68]).
Women’s complicationsMeta-analysis of trials in the systematic review showed that ventouse-assisted birth significantly reduced significant maternal injury (seven trials, n = 2582): OR 0.41 [95% CI 0.33 to 0.50] and severe perineal pain at 24 hours (two trials, n = 495): OR 0.54 [95% CI 0.31 to 0.93]. The Pakistani trial showed that ventouse-assisted birth significantly reduced cervical tears (n = 442: RR 0.19 [95% CI 0.04 to 0.86]) and third-degree perineal trauma (n = 442): RR 0.58 [95% CI 0.04 to 0.86]) compared with forceps-assisted birth.
Newborn outcomesMeta-analysis of trials in the systematic reviews showed that ventouse-assisted birth increased incidence of cephalhaematoma (six trials, n = 1966): OR 2.38 [95% CI 1.68 to 3.37] and retinal haemorrhage (five trials, n = 445): OR 1.99 [95% CI 1.35 to 2.96]. The Pakistani trial also showed an increase in the incidence of cephalhaematoma with the use of ventouse (n = 442): RR 7.14 [95% CI 1.59 to 33.33]. There was a non-significant increase in the number of babies whose birth was assisted with ventouse who had a lower Apgar score at 5 minutes (five trials, n = 1545): OR 1.67 [95% CI 0.99 to 2.81]. Meta-analysis of trials showed that there was no evidence of a difference in Apgar score less than 7 at 1 minute (meta-analysis of three trials, n = 822): OR 1.13 [95% CI 0.76 to 1.68]; and the Sri Lanka trial (n = 50): RR 0.85 [95% CI 0.24 to 3.03]; scalp or face injuries (not cephalhaematoma) (six trials, n = 2330): OR 0.89 [95% CI 0.70 to 1.13]; use of phototherapy (four trials, n = 1648): OR 1.08 [95% CI 0.66 to 1.77]; perinatal death (seven trials, n = 1800): OR 0.80 [95% CI 0.18 to 3.52]; follow-up/re-admission by hospital (one trial,557 n = 232): OR 1.33 [95% CI 0.58 to 3.05]; hearing abnormal (confirmed/suspected) (one trial,557 n = 232):OR 1.66 [95% CI 0.54 to 5.06]; and strabismus or vision abnormality suspected (one trial,557 n = 232): OR 1.38 [95% CI 0.47 to 4.05]. The Sri Lanka study also showed no evidence of differences in neonatal complications (n = 50): RR 1.00 [95% CI 0.72 to 1.39].
Mental and psychological outcomes and women’s satisfactionMeta-analysis of three trials showed that maternal worries about the baby, significantly increased with ventouse-assisted birth (n = 561): OR 2.17 [95% CI 1.19 to 3.94]. The Irish study investigated wom-en’s satisfaction and showed no evidence of a difference (would choose CS for next birth): RR 0.53 [95% CI 0.23 to 1.27]. In the systematic review, only two trials included women’s assessment of pain during birth.558,559 One trial comparing methods of instrumental birth contained a substudy of the views of women and obstetric and midwifery staff.559 A subsample of 66 of the 304 women participating in the trial were interviewed between the first and eighth day postpartum. Women scored the pain of the birth itself on a 4-point scale ranging from ‘not painful at all’ to ‘extremely painful’. Despite receiving more analgesia, 12 of the 33 women who had undergone a forceps birth considered the birth had been ‘very’ or ‘extremely’ painful compared with seven of the 33 who had undergone a vacuum extraction. Similar findings were reported by another study, which found 27% (n = 28) of women considered their forceps birth to have been ‘unbearable’ compared with 18% (n = 19) of women who had undergone vacuum extraction: OR 1.5 [95% CI 0.5 to 4.2].558
A third study concluded that there were significantly fewer women in the vacuum extractor group requiring epidural or spinal anaesthesia (25.4% versus 32.7%) or general anaesthetics (1% versus 4%) compared with the forceps group.560 The authors concluded that less analgesia is required for vacuum extraction compared with the use of forceps. However, the results reflect the choice of analgesia made prior to the start of the procedure by the attending anaesthetist and obstetrician rather than that requested or desired by the women themselves. No assessment was made of the pain experienced during the procedure and the women’s views on the type of anal-gesia provided were not recorded.
Complicated labour: second stage

242
Intrapartum care
Medium- and long-term outcomeThe UK follow-up study of the trial showed a significantly lower incidence with use of ventouse of anal sphincter defects (RR 0.58 [95% CI 0.32 to 0.92]); and higher maximum anal squeeze pressure (ventouse mean = 38, forceps mean = 53, P = 0.02); but no evidence of difference in anal incontinence (RR 1.47 [95% CI 0.44 to 4.92]); and maximum anal resting pressure (ven-touse mean = 55, forceps mean = 60, P = 0.32) at the end of the 5-year follow-up period.555 Another study using the same population showed no evidence of differences in both bowel and urinary habits of the women after 5 years.554 This study also investigated long-term outcome of the babies, and showed no evidence of differences in visual problems among the children (OR 0.9 [95% CI 0.38 to 2.5]) or child development.
The Irish long-term study (follow-up = 3 months) showed that there was a significant reduction in altered continence (RR 0.35 [95% CI 0.17 to 0.71]) and a tendency of higher anal pressure among women who had given birth assisted by ventouse compared with forceps-assisted birth: rest-ing pressure (mmHg) (ventouse median = 63, forceps median = 54, P = 0.05); squeeze pressure (mmHg) (ventouse median = 96, forceps median = 86, P = 0.11); squeeze increment (mmHg) (ventouse median = 25, forceps median = 27, P = 0.12); vector symmetry index (RR 0.77 [95% CI 0.39 to 1.54]). There was no evidence of differences in continence score (ventouse mean = 3, forceps mean = 3, P = 0.17); faecal urgency less than 5 minutes (RR 0.72 [95% CI 0.34 to 1.54]); and perineal discomfort (RR 0.78 [95% CI 0.37 to 1.64]).
Soft ventouse versus hard ventouse
Description of included studiesOne good quality systematic review including nine trials and 1375 women was identified.561 [EL = 1+] This was published in February 2000 and the last search was performed in February 2000. The included trials were conducted in Saudi Arabia, Nepal, the UK, Sweden, South Africa, the Netherlands, Malaysia, Greece and Thailand.
Review findings
Labour eventsMeta-analysis of nine trials showed there was a significant increase of failure to deliver when the instrument chosen was with the soft cups, as oppose to the hard cups (n = 1368 women): OR 1.65 [95% CI 1.19 to 2.29]. No other outcome was reported.
Women’s outcomesMeta-analysis of six trials showed there was no evidence of a difference in significant maternal injury (n = 1137 women): OR 0.85 [95% CI 0.57 to 1.27].
Newborn outcomesMeta-analysis of eight trials showed that use of soft cups significantly reduced significant scalp trauma (n = 1337): OR 0.45 [95% CI 0.34 to 0.60]. Otherwise, meta-analysis showed no evi-dence of a difference in Apgar score less than 7 at 1 minute (four trials, n = 866): OR 1.21 [95% CI 0.80 to 1.83]; less than 7 at 5 minutes (five trials, n = 765): OR 0.68 [95% CI 0.35 to 1.33]; incidence of cephalhaematoma (four trials, n = 538): OR 0.70 [95% CI 0.34 to 1.44]; incidence of phototherapy or jaundice (six trials, n = 1137): OR 0.73 [95% CI 0.50 to 1.07]; severe retinal/intracranial haemorrhage (two trials, n = 218): OR 0.84 [95% CI 0.27 to 2.64]; and neonatal death (one trial, n = 72): OR 1.26 [95% CI 0.08 to 20.85].
Evidence statementThere is high-quality evidence comparing ventouse- and forceps-assisted birth. Ventouse is asso-ciated with a lower incidence of success, less perineal/genital injury, less perineal pain in the short- and long-term, but with more cephalhaematoma and retinal haemorrhage in babies. When there is failure to achieve birth with the first instrument, there is an increased risk of trauma to the baby with the use of sequential instruments.
There is no evidence of differences between ventouse and forceps in CS rate, long-term babies’ outcomes and women’s satisfaction and psychological outcomes.

243
There is moderate level of evidence on soft versus hard ventouse-assisted birth. Soft cup ventouse seems to be associated with higher failure to achieve vaginal birth, but with lower significant scalp trauma on babies. There is no evidence of differences in other major outcomes including long-term outcomes.
Failed/successful instrumental vaginal birth and CS
Description of included studiesOne UK cohort study compared women with successful instrumental vaginal birth (n = 184), immediate CS (n = 102) and attempted instrumental vaginal birth and then CS (n = 107).562 [EL = 2+]
Review findings
CS versus assisted vaginal birthThe UK study showed that women with CS had more blood loss (blood loss more than 1 litre) (OR 2.82 [95% CI 1.10 to 7.62]); more opiates required (OR 10.93 [95% CI 6.44 to 18.91]); more incidents of urinary catheter required for longer than 24 hours (OR 3.09 [95% CI 1.39 to 6.88]); and a longer hospital stay (6 days or more) (OR 3.47 [95% CI 1.58 to 7.62]); com-pared with instrumental birth, controlling for various confounders. More babies born via CS were admitted to a neonatal unit (OR 2.64 [95% CI 1.16 to 6.02]); but less babies with CS had trauma from the birth (OR 0.37 [95% CI 0.20 to 0.70]; or serious trauma OR 0.34 [95% CI 0.08 to 1.42]), compared with babies who had had an instrumental birth. There is no evidence of a difference in Apgar score < 7 at 5 minutes (OR 2.81 [95% CI 0.48 to 16.74]).
Evidence statementThere is limited evidence on assisted vaginal birth on women’s and babies’ outcomes, compared with CS. Limited evidence showed women with CS were more likely to lose more blood, and stay in hospital longer, while babies born with CS were more likely to be admitted to a neonatal unit, but less likely to have trauma, compared with assisted vaginal birth.
Recommendations on instruments used for delay in the second stage of labour
Instrumental birth should be considered if there is concern about fetal wellbeing, or for pro-longed second stage.
On rare occasions, the woman’s need for help in the second stage may be an indication to assist by offering instrumental birth when supportive care has not helped.
The choice of instrument depends on a balance of clinical circumstance and practitioner experience.
Instrumental birth is an operative procedure that should be undertaken with tested effective anaesthesia.
If a woman declines anaesthesia, a pudendal block combined with local anaesthetic to the perineum can be used during instrumental birth.
Where there is concern about fetal compromise, either tested effective anaesthesia or, if time does not allow this, a pudendal block combined with local anaesthetic to the perineum can be used during instrumental birth.
Caesarean section should be advised if vaginal birth is not possible.*
* See ‘Caesarean section’ (NICE clinical guideline 13).
Complicated labour: second stage
244
16 Complicated labour: immediate care of newborn
16.1 Basic neonatal resuscitation
Clinical questionWhat is the evidence that different methods of neonatal resuscitation influence outcomes?
• Including use of oxygen at the time of birth?
Use of 100% oxygen or room air
Description of included studiesThere was one systematic review found involving five trials and 1302 babies563 and one recently conducted quasi-randomised trial564 identified. [EL = 2+] A new meta-analysis including all six trials was conducted. Among included studies, three trials included low birthweight babies in their populations. Only two trials successfully blinded interventions. Four trials were conducted in low income countries.
Review findingsMeta-analysis of the six trials showed that there was a 25% reduction in neonatal mortality by use of room air (five trials, RR 0.74 [95% CI 0.57 to 0.95]). Use of room air also showed a short-ened time to onset of spontaneous respiration (one trial, n = 106): WMD −1.50 minutes [95% CI −2.02 to −0.98 minutes]; time to first breath more than 3 minutes (one trial, n = 605): RR 0.53 [95% CI 0.35 to 0.80]; and borderline evidence of less babies with a 5 minute Apgar score < 7 (one trial, n = 609): RR 0.78 [95% CI 0.60 to 1.00]. There was no evidence of a difference in: incidence of hypoxic ischemic encephalopathy (Grade 2 or 3, four trials): RR 0.90 [95% CI 0.69 to 1.16]: heart rate at 5 minutes (two trials): WMD 0.06 bpm [95% CI −0.09 to 0.22 bpm]; and failure of resuscitation (five trials): RR 0.96 [95% CI 0.81 to 1.14]. There was also no evidence of differences in adverse neurodevelopmental outcomes, although there was more than 30% of loss of follow-up. In the six trials, 23.7% of 700 babies allocated to room air group received extra oxygen.
Other aspects of basic neonatal resuscitation
Description of included studiesThere is no other high-level evidence on other aspects of basic neonatal resuscitation.
Evidence statementMortality of the babies at 1 month seems to be reduced by use of room air, compared with 100% oxygen, without evidence of differences in other adverse outcomes, although there are some methodological flaws in the included studies.
There is no high-level evidence on other components, in basic neonatal resuscitation.

245
Recommendations on basic neonatal resuscitation
All relevant healthcare professionals caring for women during birth should attend a course in neonatal resuscitation at least annually, which is consistent with the algorithm adopted in the ‘Newborn life support course’ developed by the Resuscitation Council (UK).*
Basic resuscitation of newborn babies should be initiated with air.
Oxygen should be available for babies who do not respond once adequate ventilation has been established.
Emergency referral pathways for both the woman and the baby should be developed and implemented for all birth settings.
* Available from www.resus.org.uk/siteindx.htm.
Complicated labour: immediate care of newborn
246
17 Complicated labour: third stage
17.1 Definition of delay in the third stage of labour
IntroductionDelay in the third stage of labour has been defined in a number of ways and there is no universal consensus. This is discussed in Chapter 9.
DefinitionThird stage of labour: (from Chapter 9)
• from the birth of the baby to the expulsion of the membranes and placenta.
Clinical questionWhat is the appropriate definition of retained placenta?
DiscussionThe GDG discussed the definition of delay in the third stage of labour and made the following recommendations.
Recommendation on definition of delay in the third stage of labour
Prolonged third stage:
The third stage of labour is diagnosed as prolonged if not completed within 30 minutes of the birth of the baby with active management and 60 minutes with physiological management. [repeated from Section 9.1]
17.2 Treatment of women with a retained placenta
IntroductionPlacenta is defined as retained when it has not been delivered within 30 minutes of birth when the third stage is actively managed, and longer than 1 hour when physiologically managed, with-out signs of postpartum haemorrhage (PPH) or maternal collapse.
Clinical questionWhat is the effective management of delay in the third stage?
17.2.1 Manual removal of placenta
Description of included studiesThere was no relevant study comparing manual removal of placenta with any alternative method on effectiveness of management of retained placenta.
Evidence statementThere is no high-level evidence on the effectiveness of manual removal of placenta for the man-agement of retained placenta compared with other forms of management.

247
17.2.2 Oxytocin infusion
Overview of available evidenceNo relevant study was identified.
Evidence statementThere is no study identified which considers oxytocin intravenous infusion to reduce the need for manual removal of placenta.
17.2.3 Nitro-glycerine for retained placenta
Description of included studiesThere was one RCT identified investigating the effectiveness of nitro-glycerine for management of retained placenta compared with placebo.565 The trial was conducted in Sweden, involving 24 low-risk women diagnosed with retained placenta following active management of the third stage by 10 IU oxytocin. If the placenta still remained undelivered 30 minutes after birth, an additional dose of 10 IU oxytocin was given intravenously, and 5 minutes of cord traction was carried out after 5 minutes of the second administration of oxytocin. Diagnosis of retained placenta was made and either nitro-glycerine tablets or placebo was given, if the placenta remained undeliv-ered within approximately 50 minutes of procedure above. If the placenta remained undelivered after 5 minutes of observation and another 5 minutes of cord traction, operative manual removal was conducted. The primary outcome was need for manual removal of placenta. The trial was good quality. [EL = 1+]
Review findingsWomen in the treatment group had more successful delivery of the placenta by controlled cord trac-tion (RR 12.0, P < 0.001) and reduced total blood loss (treatment group, 400 ml (SD 108.71 ml), control group, 662.50 ml (SD 144.80 ml) (P < 0.001). Although there was no evidence of dif-ference in systolic blood pressure between the two groups before and after administration of the trial drug, diastolic blood pressure in women in the treatment group was reduced more than in the placebo group (treatment, −5.00 mmHg (SD 3.69 mmHg), placebo, −1.25 mmHg (SD 3.11 mmHg) (P = 0.01).
Evidence statementThere is high-level evidence from one small study that nitro-glycerine is effective in treating retained placenta, although the risk of reduction in diastolic blood pressure is more, compared with placebo, and this treatment is not used in the UK
17.2.4 Umbilical injection for retained placenta
Description of included studiesThere were one systematic review566 and one RCT567 identified. These studies investigated effec-tiveness of umbilical injection as a treatment of retained placenta, compared with expectant management or placebo between the two groups. The systematic review included 12 trials. Both showed good quality. [EL = 1+] The RCT was compared saline solution plus oxytocin versus saline solution.
Review findings
Saline solution versus expectant managementA total of four trials were included.566 There was no evidence of difference in effectiveness or adverse events between the two groups (manual removal of placenta, RR 0.97 [95% CI 0.83 to 1.14]; PPH, RR 0.37 [95% CI 0.02 to 8.71]; blood loss 500 ml or greater, RR 1.04 [95% CI 0.55 to 1.96]; blood loss 1000 ml or greater, RR 0.73 [95% CI 0.17 to 3.11]; curettage, RR 0.79 [95% CI 0.51 to 1.22]; infection, RR 0.48 [95% CI 0.09 to 2.54]; and stay at hospital more than 2 days, RR 1.19 [95% CI 0.66 to 2.15]).
Saline solution plus oxytocin versus expectant managementA total of five trials were included.566 There was no evidence of difference in effectiveness or adverse events between the two groups (manual removal of placenta, RR 0.86 [95% CI 0.72
Complicated labour: third stage

248
Intrapartum care
to 1.01]; PPH, RR 1.12 [95% CI 0.07 to 16.95]; blood loss 500 ml or greater, RR 1.53 [95% CI 0.88 to 2.67]; blood loss 1000 ml or greater, RR 1.29 [95% CI 0.38 to 4.34]; curettage, RR 0.69 [95% CI 0.44 to 1.09]; infection, RR 1.16 [95% CI 0.32 to 4.16]; and stay at hospital more than 2 days, RR 1.09 [95% CI 0.60 to 1.97]).
Saline solution plus oxytocin versus saline solutionA total of ten trials were included in the systematic review.566 The meta-analysis in the systematic review showed that there was significant reduction in the rate of manual removal of placenta with saline plus oxytocin compared with placebo, although there was no evidence of difference in effectiveness as well as adverse events between the two groups (manual removal of placenta, RR 0.79 [95% CI 0.69 to 0.91]; PPH, RR 3.00 [95% CI 0.13 to 70.42]; blood loss 500 ml or greater, RR 1.43 [95% CI 0.83 to 2.45]; blood loss 1000 ml or greater, RR 1.71 [95% CI 0.45 to 6.56]; curettage, RR 0.88 [95% CI 0.54 to 1.43]; infection, RR 2.42 [95% CI 0.48 to 12.15]; and stay at hospital more than 2 days, RR 0.91 [95% CI 0.52 to 1.59]). The recent trial567 that was not included in the meta-analysis also showed reduction in the need for manual removal of placenta by the use of saline plus oxytocin compared with placebo (RR 0.76 [95% CI 0.41 to 1.39]).
Saline solution plus oxytocin versus plasma expanderOnly one trial investigated this comparison. The study is underpowered to show any difference in need for manual removal of placenta (RR 1.34 [95% CI 0.97 to 1.85]) and incidence of PPH (blood loss more than 500 ml, RR 0.88 [95% CI 0.52 to 1.50] and blood loss more than 1000 ml, RR 0.96 [95% CI 0.34 to 2.75]) between the two groups.
Saline solution plus prostaglandin versus saline solutionOnly one small trial (n = 17) investigated this comparison. Saline plus prostaglandin showed a significant reduction in need for manual removal of placenta (RR 0.05 [95% CI 0.00 to 0.73]) com-pared with placebo, while there was no evidence of difference in blood loss (WMD −21.00 ml [95% CI −120.18 to 78.18 ml]) and other adverse events (fever, RR 2.18 [95% CI 0.10 to 46.92], and abdominal pain, RR 5.09 [95% CI 0.30 to 85.39]) between the two groups.
Saline solution plus prostaglandin versus saline solution plus oxytocinOnly one small trial (n = 21) investigated this comparison. There was significant reduction by use of prostaglandin in duration from injection to delivery of the placenta (WMD −6.00 minutes [95% CI −8.78 to −3.22 minutes]) compared with oxytocin, while there was no evidence of difference in need for manual removal placenta (RR 0.10 [95% CI 0.01 to 1.59]), blood loss (WMD −19.00 ml [95% CI −118.19 to −80.19 ml]) and other adverse events (fever, RR 1.10 [95% CI 0.08 to 15.36], and abdominal pain, RR 3.30 [95% CI 0.58 to 3.00]) between the two groups.
Evidence statementThere was a limited amount of high-level evidence regarding umbilical injection for the treatment of retained placenta. There was no evidence of effectiveness of saline solution versus expectant management, saline solution plus oxytocin versus expectant management, saline solution plus oxytocin versus plasma expander, saline solution plus prostaglandin versus saline solution or saline solution plus prostaglandin versus saline solution plus oxytocin.
High-level evidence from a variety of settings shows that umbilical injection of saline solution plus oxytocin is effective at reducing the need for manual removal of placenta compared with saline alone, although there is limited evidence on other relevant outcomes including effect on incidence of PPH. However, the optimal regimen was not clear in the included studies.
Recommendations on treatment for retained placenta
Intravenous access should always be secured in women with a retained placenta.
Intravenous infusion of oxytocin should not be used to assist the delivery of the placenta.
For women with a retained placenta oxytocin injection into the umbilical vein with 20 IU of oxytocin in 20 ml of saline is recommended, followed by proximal clamping of the cord.
If the placenta is still retained 30 minutes after oxytocin injection, or sooner if there is concern about the woman’s condition, women should be offered an assessment of the need to remove the placenta. Women should be informed that this assessment can be painful and they should be advised to have analgesia or even anaesthesia for this assessment.

249
Research recommendation on use of nitro-glycerine for retained placenta
Further randomised controlled trials investigating the effectiveness of the use of nitro-glycerine in the treatment of retained placenta should be conducted.
17.2.5 Analgesia for retained placenta
Description of included studiesNo relevant study was identified.
Evidence statementThere is no evidence as to the most effective analgesia for assessment of delayed in the third stage.
Recommendations on analgesia during interventions for retained placenta
If a woman reports inadequate pain relief during the assessment, the healthcare professional must immediately stop the examination and address this need.
If manual removal of the placenta is required, this must be carried out under effective regional anaesthesia (or general anaesthesia when necessary).
17.3 Risk factors for postpartum haemorrhage
IntroductionRisk factors for developing PPH were reviewed.
Clinical questionAre there effective ways of identifying women at increased risk of postpartum haemorrhage ante-natally and during labour?
What is the effective management of women at increased risk of postpartum haemorrhage to minimise this risk?
17.3.1 Multiple factors study
Description of included studiesThere were seven studies (two case–control studies571,572 and five cross-sectional studies573–577) looking at multiple risk factors for PPH in high income countries, although three of them were inconclusive.
Review findingsA population based cross-sectional study was conducted in the Netherlands including 3464 nulliparous women between 1990 and 1994.573 [EL = 3] The study investigated risk factors for standard (more than or equal to 500 ml of blood loss) and severe (more than or equal to 1000 ml of blood loss) PPH. Multivariate logistic regression analyses showed significant risk factors for standard PPH as: retained placenta (adjusted OR 7.83 [95% CI 3.78 to 16.22]); prolonged third stage (longer than 30 minutes) (adjusted OR 2.61 [95% CI 1.83 to 3.72]); multiple pregnancy (adjusted OR 2.60 [95% CI 1.06 to 6.39]); episiotomy (adjusted OR 2.18 [95% CI 1.68 to 2.81]); macrosomia (weight more than or equal to 4 kg) (adjusted OR 2.11 [95% CI 1.62 to 2.76]); perineal trauma (laceration severer than or equal to first-degree) (adjusted OR 1.40 [95% CI 1.04 to 1.87]); and West European race (adjusted OR 1.32 [95% CI 1.00 to 1.73]). Risk factors for severe PPH were reported as: retained placenta (adjusted OR 11.73 [95% CI 5.67 to 24.1]); prolonged third stage (longer than or equal to 30 minutes) (adjusted OR 4.90 [95% CI 2.89 to 8.32]); macrosomia (adjusted OR 2.55 [95% CI 1.57 to 4.18]); and perineal trauma (laceration severer than or equal to first-degree) (adjusted OR 1.82 [95% CI 1.01 to 3.28]). When stratified by background risk of the women, a multiple regression model showed risk factors of severe PPH for low-risk women were: retained placenta (adjusted OR 21.6 [95% CI 5.99 to 78.00]);
Complicated labour: third stage
250
Intrapartum care
and prolonged third stage (longer than 30 minutes) (adjusted OR 3.59 [95% CI 1.60 to 8.03]); while those for high-risk women were reported as retained placenta (adjusted OR 9.29 [95% CI 3.69 to 23.4]); prolonged third stage (longer than 30 minutes) (adjusted OR 6.11 [95% CI 2.94 to 12.7]); macrosomia (adjusted OR 2.75 [95% CI 1.52 to 4.97]); induction (adjusted OR 1.74 [95% CI 1.06 to 2.87]); and prolonged second stage (more than or equal to 30 minutes) (adjusted OR 2.74 [95% CI 1.37 to 5.49]).
A cross-sectional study was conducted in the USA including 763 pregnancy related deaths from haemorrhage associated with intrauterine pregnancies between 1979 and 1992.574 [EL = 3] Although the study found black race and increased age were related to risk of death from haem-orrhage, analysis did not control confounding factors and hence this study was inconclusive.
A case–control study was conducted in the UK including 86 PPH cases and 351 non-PPH con-trols.571 [EL = 2−] Although the study suggested significant risk factors were nulliparous, labour induction, forceps birth, prolonged first and second stages, and oxytocin compared with oxytocin with ergometrine as significant risk factors, the analysis did not properly control confounding fac-tors with unmatched controls and hence was inconclusive.
A cross-sectional study was conducted in the UK including 36 312 women between 1967 and 1981.575 [EL = 3] The study investigated complications of the third stage. Although the study reported nulliparous and induction of labour as risk factors for PPH, the analysis did not control confounding factors and hence was inconclusive.
A case–control study was conducted in Australia including 125 PPH cases versus 125 controls in 2003.572 [EL = 2+] Multivariate logistic regression analyses showed risk factors for developing PPH (blood loss 500 ml or greater) were: past history of PPH (adjusted OR 14.11 [95% CI 1.62 to 123.06]); prolonged second stage (longer than or equal to 60 minutes) (adjusted OR 2.68 [95% CI 1.27 to 5.64]); forceps birth (adjusted OR 3.47 [95% CI 1.35 to 8.91]); and incomplete/ragged membranes (adjusted OR 3.56 [95% CI 1.52 to 8.36]).
A cross-sectional study was conducted in Australia including 13 868 women between 1998 and 2002.576 [EL = 3] The study investigated risk factors for developing PPH (blood loss 1000 ml or greater and/or need for a transfusion). Multivariate logistic regression analyses showed risk fac-tors as: Asian race (adjusted OR 1.8 [95% CI 1.4 to 2.2]); maternal blood disorders (adjusted OR 1.3 [95% CI 1.1 to 1.6]); prior PPH (adjusted OR 1.8 [95% CI 1.4 to 2.2]); history of retained placenta (adjusted OR 6.2 [95% CI 4.6 to 8.2]); multiple pregnancy (adjusted OR 2.2 [95% CI 1.5 to 3.2]); antepartum haemorrhage (adjusted OR 1.8 [95% CI 1.3 to 2.3]); genital tract lac-erations (adjusted OR 1.7 [95% CI 1.4 to 2.1]); macrosomia (4 kg or greater) (adjusted OR 1.8 [95% CI 1.4 to 2.3]); induction of labour (adjusted OR 1.8 [95% CI 1.4 to 2.2]); chorioamnionitis (adjusted OR 1.3 [95% CI 1.1 to 1.7]); intrapartum haemorrhage (adjusted OR 1.5 [95% CI 1.0 to 2.3]); intrauterine fetal deaths (adjusted OR 2.6 [95% CI 1.1 to 5.7]); compound fetal pres-entation (adjusted OR 3.0 [95% CI 1.1 to 7.3]); epidural anaesthesia (adjusted OR 1.3 [95% CI 1.0 to 1.6]); prolonged first/second stage of labour (first stage) (adjusted OR 1.6 [95% CI 1.0 to 1.6]); second stage (adjusted OR 1.6 [95% CI 1.1 to 2.1]); and forceps birth after failed vacuum-assisted birth (adjusted OR 1.9 [95% CI 1.1 to 3.2]).
A cross-sectional study was conducted in the UK including 37 497 women in 1988, investigat-ing risk factors for PPH (blood loss 1000 ml or greater).577 [EL = 3] Although the study reported placental abruption, placenta praevia, multiple pregnancy, retained placenta, labour induction, episiotomy and macrosomia, the analysis did not control confounding factors and hence was inconclusive.
17.3.2 Anaemia
Description of included studies and review findingsA cohort study was conducted in New Zealand in 1996 comparing haemoglobin levels at 4 weeks prior to birth on PPH (blood loss 600 ml or greater within 24 hours of birth).578 [EL = 2−] Although the study reported no difference, the analysis did not control confounding factors and hence was inconclusive.

251
17.3.3 Low-lying placenta
Description of included studies and review findingsA cross-sectional study was conducted in Canada between 1997 and 1999 investigating obstetric implications of low-lying placentas diagnosed in the second trimester.579 [EL = 3] Multivariate logistic regression analysis showed significant increased risk of PPH (blood loss 500 ml or greater for vaginal birth, 100 ml or greater) for caesarean section (adjusted OR 1.72 [95% CI 1.12 to 2.66], adjusted for maternal age and birthweight).
17.3.4 Smoking
Description of included studies and review findingsA cohort study was conducted in the UK comparing obstetric outcomes of 400 smoking women with 400 non-smoking women.580 [EL = 2−] Although the study reported higher incidence of PPH for smoking women, the analysis did not control for major confounding factors and hence was inconclusive.
17.3.5 Prolonged second stage of labour
Description of included studiesThere were five observational studies identified (five cross-sectional studies)327,328,332,333,335 on duration of second stage of labour on the defined outcomes with various quality.
Review findingsA cross-sectional study (n = 15 759) in the USA investigated prolonged duration of second stage (more than 4 hours) on the defined outcomes.326 [EL = 3] Logistic regression analysis controlling various confounders showed there was no evidence of associations of prolonged second stage of labour with PPH (RR 1.05 [95% CI 0.84 to 1.31]).
One cross-sectional study in the Germany (n = 1200) investigated prolonged second stage of labour (more than 2 hours) on intrapartum outcomes.328 [EL = 3] The results showed evidence of association of prolonged second stage with low Apgar score at 1 minute, PPH, perineal tears and postpartum fever, although the analyses did not control confounding factors.
One cross-sectional study (n = 25 069) in the UK investigated prolonged second stage of labour on perinatal outcomes.332,333 [EL = 3] Logistic regression analysis showed that there was evidence of association between longer duration and higher rate of PPH (duration: 120–179 minutes, OR 1.6 [95% CI 1.3 to 1.9]; 180–239 minutes, 1.7 [95% CI 1.3 to 2.3]; 240 or more minutes, OR 1.9 [95% CI 1.2 to 2.8]).
One cross-sectional study in the USA (n = 4403) investigated different length of labour on intra-partum outcomes.335 [EL = 3] The analyses without controlling confounding factors showed no evidence of association of length of second stage with neonatal outcomes apart from low Apgar score at 1 minute (P < 0.03). Both puerperal haemorrhage and febrile morbidity showed evi-dence of association with length of labour (P < 0.001 for both), but analysis did not consider confounding effects.
One cross-sectional study was conducted in the USA (n = 7818) investigated maternal and neo-natal outcomes in women with prolonged second stage of labour.327 [EL = 3] Although the analysis of women with longer than 120 minutes of second stage had higher incidence of PPH (RR 2.70, P < 0.001), the analysis did not control confounding factors and hence was inconclusive.
17.3.6 Prolonged third stage of labour
Refer to Section 9.1.2 on duration of the third stage of labour.
17.3.7 Body mass index and body weight
Description of included studiesThere were four cross-sectional studies (three studies investigated overweight women581–583 and one study investigated underweight women584) identified.
Complicated labour: third stage

252
Intrapartum care
Review findingsOne cross-sectional study was conducted in the UK between 1990 and 1999 including 60 167 childbirths.582 [EL = 3] The study investigated outcome of pregnancy in a woman with an increased body mass index (BMI) (greater than 30 kg/m²). The study reported significant increased risk of developing PPH (blood loss greater than 500 ml) with BMI over 30 kg/m² (OR 1.5 [95% CI 1.2 to 1.8]), although the analysis did not control any confounding.
One cross-sectional study was conducted in Canada between 1988 and 2002, including 142 404 women.583 [EL = 3] Multivariate logistic regression analyses showed that moderately overweight women (90 – 120 kg) had increased risk of PPH (adjusted OR 1.12 [95% CI 1.02 to 1.22]), but there is no evidence of difference in incidence of PPH by severely overweight women (heavier than 120 kg) (adjusted OR 1.07 [95% CI 0.80 to 1.42]).
One cross-sectional study was conducted in the UK between 1989 and 1997, including 325 395 pregnancies.581 [EL = 3] Multivariate logistic regression analyses showed increased risk of PPH (greater than 1000 ml) with increased BMI: BMI 25–30 kg/m², adjusted OR 1.16 [99% CI 1.12 to 1.21]; BMI more than 30 kg/m², adjusted OR 1.39 [99% CI 1.32 to 1.46], controlling for other factors including ethnicity, parity, age and history of hypertension.
Another cross-sectional study was conducted in the UK between 1988 and 1997 by using the same population as the study above581 including 215 105 women.584 [EL = 3] Multivariate logistic regression analysis showed that women with low BMI (BMI 20–25 kg/m²) have less PPH (PPH, adjusted OR 0.85 [99% CI 0.80 to 0.90]; severe PPH, adjusted OR 0.83 [99% CI 0.72 to 0.95]).
17.3.8 Post-term birth
Description of included studies and review findingsOne cross-sectional study was identified.585 [EL = 3] The data were collected between 1978 and 1993 to investigate association between post-term birth and maternal complication. Multivariate logistic regression analysis showed significantly higher risk of developing PPH in post-term preg-nancy (adjusted OR 1.37 [95% CI 1.28 to 1.46]).
17.3.9 Macrosomia
Description of included studiesThere were four observational studies identified.586–589
Review findingsOne cross-sectional study was conducted in the UK.586 [EL = 3] The study investigated risk fac-tors and clinical consequences of macrosomia, involving 350 311 pregnancies, between 1988 and 1997. Multivariate logistic regression analysis showed that women with babies whose birth-weight were more than 4 kg had higher risk of developing PPH (adjusted OR 2.01 [99% CI 1.93 to 2.10]), and the analysis also showed that women with babies whose birthweight was more than the 90th centile had higher risk of developing PPH (adjusted OR 1.63 [99% CI 1.56 to 1.71]) compared with women whose babies were of normal weight.
One cross-sectional study conducted in the UK was identified.587 [EL = 3] The study investigated clinical consequences of oversized babies, involving 7992 births between 1963 and 1964. Although the study reported double the risk of developing PPH for women with oversized babies than nor-mal sized ones, the analysis did not control confounding factors and hence was inconclusive.
One US cross-sectional study was identified.588 [EL = 3] The study investigated obstetric complica-tions associated with macrosomia, including 146 526 live births. Multivariate logistic regression analysis showed higher risk of developing PPH by increased birthweight of babies (4000–4499 g birthweight, adjusted OR 1.69 [95% CI 1.58 to 2.10]; 4500–4999 g birthweight, adjusted OR 2.15 [95% CI 1.86 to 2.48]; 5000 g or greater birthweight, adjusted OR 2.03 [95% CI 1.33 to 3.09]).
One cross-sectional study conducted in Germany was identified.589 [EL = 3] The study described maternal complications of fetal macrosomia, involving 956 between 1990 and 1997. Although the study reported association between macrosomia and PPH, the analysis did not control any confounding and hence was inconclusive.

253
17.3.10 Age
Description of included studiesThere were two cross-sectional studies identified.590,591 Both studies showed moderate quality. [EL = 3] One study was conducted in the UK590 and the other study was conducted in Japan.591
Review findingsThe UK study590 investigated obstetric risk of women aged 35 years or greater, including 385 120 pregnancies. Multivariate logistic regression analysis showed significant positive association of women’s age and risk of developing PPH (age 35–40 years and moderate PPH, adjusted OR 1.14 [99% CI 1.09 to 1.19]; age greater than 40 years and moderate PPH, adjusted OR 1.27 [99% CI 1.15 to 1.39]; age 35–40 years and severe PPH, adjusted OR 1.28 [99% CI 1.16 to 1.41]; age greater than 40 years and severe PPH, adjusted OR 1.55 [99% CI 1.29 to 1.88]).
The Japanese study591 also investigated effect of maternal age on blood loss, involving 10 053 women. Multivariate regression analysis showed that women of 35 years or more had higher risk of developing: PPH (vaginal birth, adjusted OR 1.5 [95% CI 1.2 to 1.9]; CS, adjusted OR 1.8 [95% CI 1.2 to 2.7]) compared with women under 30 years.
17.3.11 Parity
Description of included studiesThere were eight cross-sectional studies identified.592–599 [EL = 3] Three of them were conducted in the UK,593,595,597 three were in the USA,592,598,599 and two in Australia.594,596
Review findingsOne US study592 investigated effect of parity on obstetric risk factors in 133 great-grandparous (defined as parity more than ten), 314 grandparous and 2195 parous women. Although the study reported significant increased incidence of PPH in grandparous than parous women, the analysis did not control important confounding factors such as age and hence is inconclusive.
One control-matched study in the UK was identified,593 which compared 397 grandparous women with 397 age-matched parous women to investigate effect of parity on obstetric risk fac-tors. The study reported that there was no evidence of difference in incidence of PPH between these two groups (OR 1.18 [95% CI 0.6 to 2.4]).
One Australian study was conducted between 1974 and 1975 to investigate obstetric perform-ance of grand multiparous women.594 Although the study reported no evidence of difference in incidence of PPH by parity, the analysis did not control confounding factors and hence is inconclusive.
One UK study was published in 1987, compared 216 grandparous women with lesser parity matched for age and ethnicity.595 There was a higher incidence of developing PPH (blood loss greater than 500 ml) for grandparous women compared with parous women (P < 0.01), although there was significant difference in gestational age at booking.
One Australian study was conducted between 1992 and 2001.596 The study investigated obstet-ric risk of 653 grand multiparous women, compared with 15 255 women with lower parity. Multivariate logistic regression analyses showed borderline increased risk of developing PPH by high parity (OR 1.36 [95% CI 0.99 to 1.87]).
One UK study investigated obstetric risk of 229 grand multiparous women with controls matched for age with one parity, between 1990 and 1991.597 The study reported no evidence of difference in incidence of PPH, although the proportion of women who had oxytocin administration in the third stage was different and hence the analysis was inconclusive.
One US study investigated obstetric outcomes of 382 grandparous women, compared with age-matched controls with parity of between two and four, between 1989 and 1991.598 There was no evidence of difference in incidence of PPH between these two groups (OR 0.97 [95% CI 0.57 to 1.63]).
Complicated labour: third stage
254
Intrapartum care
A third US study investigated perinatal outcomes of 25 512 grandparous women, compared with 265 060 parous women aged 30 years or greater between 1997 and 1998.599 Multivariate logistic regression analysis showed increased risk of developing PPH by grand multiparity, compared with multiparity (adjusted OR 1.2 [1.1 to 1.3]).
A second UK study investigated complications of the third stage of vaginal birth among 36 312 women between 1967 and 1981. There was evidence that higher incidence of PPH in nullipa-rous women and after induced labour. Analysis of the risks of 6615 women with two or three live births between 1967 and 1980 showed women with a history of PPH and/or retained placenta had higher risks of PPH in a subsequent birth, by between two and four times as much, compared with women without such a history.
Evidence statement (all risk factors for postpartum haemorrhage)The following conditions are associated with increased risk of postpartum haemorrhage. The list is not exhaustive.
Antenatal: previous retained placenta, or PPH, maternal haemoglobin less than 8.5 g/dl at onset of labour; increased BMI; grand multiparity (parity four or more); antepartum haemorrhage; over-extension of the uterus (e.g. multiple pregnancy, polyhydramnios, macrosomia), existing uterine abnormalities; low-lying placenta; and age (35 years or older).
In labour: induction, prolonged first, second or third stage of labour, oxytocin use, precipitate labour, operative birth or caesarean section.
Recommendations on risk factors for postpartum haemorrhage
Women with risk factors for postpartum haemorrhage should be advised to give birth in an obstetric unit where more emergency treatment options are available.
• Antenatal risk factors:
º previous retained placenta or postpartum haemorrhage
º maternal haemoglobin level below 8.5 g/dl at onset of labour
º body mass index greater than 35 kg/m²
º grand multiparity (parity 4 or more)
º antepartum haemorrhage
º overdistention of the uterus (for example, multiple pregnancy, polyhydramnios or macrosomia)
º existing uterine abnormalities
º low-lying placenta
º maternal age (35 years or older).• Risk factors in labour:
º induction
º prolonged first, second or third stage of labour
º oxytocin use
º precipitate labour
º operative birth or caesarean section.
If a woman has risk factors for postpartum haemorrhage, these should be highlighted in her notes and a care plan covering the third stage of labour should be made and discussed with the woman.
The unit should have strategies in place in order to respond quickly and appropriately should a postpartum haemorrhage occur.
17.4 Management of postpartum haemorrhage
IntroductionThe interventions below were considered:
• uterotonics• uterine packing

255
• vessel ligation• hysterectomy• uterine compression• radiological embolisation.
Any trials or studies to compare two of the above interventions were considered.
Clinical questionWhat is the most effective way of managing postpartum haemorrhage?
17.4.1 Uterotonics
Description of included studiesThere was one systematic review investigating effectiveness of treatment for primary PPH.568 The review identified two trials investigating use of prostaglandin (misoprostol) for treatment of PPH, compared with placebo or oxytocin/ergometrine after treatment with conventional uterotonics. [EL = 1+]
Review findings
Misoprostol versus oxytocin/ergometrineThere was one included trial that investigated this comparison. A total of 64 women were included. There was significant reduction by misoprostol in persistent haemorrhage (RR 0.18 [95% CI 0.04 to 0.76]) and need for additional uterotonics (RR 0.18 [95% CI 0.04 to 0.76]), while there was no evidence of difference in incidence of hysterectomy (RR 0.33 [95% CI 0.01 to 7.89]) and surgical co-intervention excluding hysterectomy (RR 1.00 [95% CI 0.15 to 6.67]).
Misoprostol versus placeboThere were two trials included. A total of 398 women were included. There was significant reduction in incidence of blood loss 500 ml or greater (RR 0.51 [95% CI 0.28 to 0.94]) by miso-prostol, although there was an increased number of women with shivering (RR 3.56 [95% CI 2.23 to 5.69]) and maternal pyrexia (RR 6.93 [95% CI 1.79 to 26.83]), compared with placebo. There was no evidence of difference in incidence of hysterectomy (RR 1.38 [95% CI 0.31 to 6.18]), additional uterotonics (RR 0.96 [95% CI 0.58 to 1.57]), blood loss 1000 ml or greater (RR 0.64 [95% CI 0.17 to 2.50], nausea (RR 0.60 [95% CI 0.14 to 2.60]), headache (RR 0.62 [95% CI 0.23 to 1.69]), manual removal of placenta (7.43 [95% CI 0.38 to 145.39]), and blood transfusion (RR 1.40 [95% CI 0.79 to 2.48]).
Evidence statementThere was high-level evidence from a systematic review that included three studies evaluating misoprostol for the treatment of PPH in the developing world. Two studies were placebo-control-led and the third compared misoprostol with a combination of oxytocin and/or ergometrine.
The review showed misoprostol is associated with a reduced measured blood loss and increased maternal pyrexia but not with decreases in maternal mortality, hysterectomy rates, the additional use of uterotonics and blood transfusion.
There was no high-level evidence identified evaluating other drugs or drug combinations for the treatment of primary PPH.
Recommendations on management of postpartum haemorrhage
Immediate treatment for postpartum haemorrhage should include:
• calling for appropriate help• uterine massage• intravenous fluids• uterotonics.
No particular uterotonic drug can be recommended over another for the treatment of post-partum haemorrhage.
Complicated labour: third stage
256
Intrapartum care
Treatment combinations for postpartum haemorrhage might include repeat bolus of oxytocin (intravenous), ergometrine (intramuscular, or cautiously intravenously), intramuscular oxytocin with ergometrine (Syntometrine), misoprostol,* oxytocin infusion (Syntocinon) or carboprost (intramuscular).
Additional therapeutic options for the treatment of postpartum haemorrhage include tran-examic acid (intravenous) and rarely, in the presence of otherwise normal clotting factors, rFactor VIIa, after seeking advice from a haematologist.*
If possible, a member of the healthcare team should be allocated to remain with the woman and her partner during postpartum haemorrhage to ensure communication and offer support throughout the emergency situation.
Research recommendation on management of postpartum haemorrhage
Further research should identify the best drug combinations, route and dose for the treatment of postpartum haemorrhage
17.4.2 Other procedures
Description of included studiesThere were two observational studies included.569,570 Both were of poor quality. One study was conducted in the USA with cross-sectional study design.569 [EL = 3] The other was conducted in Saudi Arabia with also cross-sectional design.570 [EL = 3] There was no other relevant study iden-tified that investigated other procedures.
Review findings
Vessel ligation versus hysterectomyIn the US study, 19 women underwent bilateral hypogastric artery ligation for the control of otherwise intractable obstetric haemorrhage, compared with 59 women undergoing emer-gency hysterectomy for obstetric haemorrhage without prior ligation of the hypogastric arteries. Hypogastric artery ligation was successful in 42% of the 19 women. The mean blood loss for the unsuccessful ligation group was 5125 ml, while that for the hysterectomy group was 3209 ml (P > 0.05). The mean operating time for women undergoing ligation before hysterectomy was 4.2 hours, while that for women without ligation was 3.0 hours (P < 0.05). There was increased incidence of both ureteric injury and cardiac arrest secondary to hypovolaemia among the liga-tion group than the hysterectomy group (P < 0.05).
In the Saudi Arabian study, 29 women undergoing bilateral hypogastric artery ligation were com-pared with 35 women undergoing hysterectomy for severe postpartum haemorrhage (PPH).570 The ligation failed to control PPH in 34% of the ligation group, while 13.3% of the hysterectomy group required re-exploration. There was a trend that women in the ligation group required shorter operative time (mean 20 minutes versus 55 minutes), estimated blood loss (mean 2230 ml versus 3500 ml) and incidence of intra-operative hypotension (9/19 versus 33/45), although summary statistics were not obtained.
Evidence statementThere was no high-level evidence of the effectiveness of second-line interventions such as uterine packing (including balloons), vessel ligation, hysterectomy, uterine compression or radiological embolisation.
Recommendation on surgical procedures for postpartum haemorrhage
No particular surgical procedure can be recommended above another for the treatment of postpartum haemorrhage.
* At the time of publication (September 2007), misoprostol and rFactor VIIa did not have UK marketing authorisation for this indication. Informed consent should be obtained and documented; however, if this is not possible, follow the Department of Health guidelines – ‘Reference guide to consent for examination or treatment’ (2001) (available from www.dh.gov.uk). It may be appropriate to get consent in the antenatal period.

257
Appendix ADeclarations of interest
Table A.1 Declarations of interests for GDG members
Tony Ducker Trial and development of new ventilator, payment to departmental research funds from SLE organisation. Research into the use of KL4 (Surfactant) Protocol 04, payment to departmental research funds by Discovery Laboratories Inc. Trial into the use of Numax RSV antibody, payment to departmental research funds, by PPD/Medimmune. Trial into the use of nitric oxide in pre-term babies for the prevention of chronic lung disease, payment to departmental research funds by Innovo.
Simon Grant Involved with developing a research protocol around high- and low-dose oxytocin which was submitted to the MRC.
Gill Gyte No interests declared.
Jayne Jempson No interests declared.
Sara Kenyon Involved with developing a research protocol around high- and low-dose oxytocin which was submitted to the MRC.
Carolyn Markham Works as a breastfeeding specialist at the Baby Café in Northampton a salary is paid from a grant received from Northampton PCT. Involved with developing a research protocol around high- and low-dose oxytocin which was submitted to the MRC.
Geraldine O’Sullivan No interests declared.
Julia Sanders No interests declared.
Maureen Treadwell No interests declared.
Derek Tuffnell Department has had funding for 20 months from Ferring Pharmaceuticals to support an administrative assistant to audit preterm labour cases in Yorkshire. Ferring Pharmaceuticals have also funded attendance at the European preterm labour meeting in Montreal in 2004 and paid for accommodation and travel. Involved with developing a research protocol around high- and low-dose oxytocin which was submitted to the MRC. Involved with a trial looking at the timing of cord clamping.
Steve Walkinshaw Involved with developing a research protocol around high and low dose oxytocin which was submitted to the MRC. Involved with a study on partograms at the Liverpool Women’s Hospital.
Marina Wells No interests declared.

258
Appendix BClinical questions
Outcomes:• labour events (length of labour, interventions, complications)• birth events (mode or place of birth, complications of birth, perineal trauma)• newborn events (condition at birth, birth injuries, admission to neonatal units)• women’s satisfaction and women’s assessment of birth experience• women’s mental and psychological health• long-term women’s or babies’ outcomes (more than 28 days)• women’s and babies’ mortality.
1. What are the outcomes (benefits and harms) and costs related to each birth setting?2. What are the risk factors which should be included in assessment to determine the most
appropriate place of birth for women during pregnancy and in labour?3. What effect does communication have on a woman’s perception of her birth experience?
• Interventions include the effect of control, choice and decision making on psychosocial wellbeing in the medium and long term.
• Outcomes include postnatal depression and post-traumatic stress disorder.4. Is there evidence that support in labour for women improves outcomes? Interventions
include:• any support from partners• other birth supporters• health professionals• continuity of care.
6. What are the indications for the use of ventouse or forceps?7. Are there effective hygiene strategies for vaginal birth out of water to protect both women
and babies, and healthcare professionals?• Strategies include vaginal examination and antisepsis.• Outcomes include infection control and rates of infection.
8. Are there effective hygiene strategies for vaginal birth in water to protect both women and babies, and healthcare professionals?• Strategies include vaginal examination and antisepsis.• Outcomes include infection control and rates of infection.
9. What are the appropriate definitions of the latent and active phases of the first stage, the second stage, and the third stage of labour?
10. Do duration and progress of the first and second stages of labour affect outcomes?11. Is there evidence that the timing of admission to maternity units, and of cervical dilatation,
affects outcomes?• Subgroups include nulliparous women and multiparous women.
12. Is there evidence that midwife assessment at home affects outcomes?• Subgroups include nulliparous women and multiparous women.
13. Is there evidence that the assessment of the following, on admission, and throughout labour and the immediate postnatal period, affects outcomes?• observation of vital signs• bladder care• palpation and presentation/position of baby• frequency and duration of contractions• membrane and liquor assessment/placental examination• maternal behaviour• vaginal examination

259
• length, strength and frequency of contractions• assessment of cervical effacement, dilatation and position• presentation and descent of the presenting part• assessment of liquor if membranes ruptured.
14. Do the following methods of fetal monitoring affect outcomes?• none• admission CTG• intermittent auscultation (Pinard, Doppler)• intermittent electronic monitoring• continuous electronic monitoring (including method of interpretation)• ST analysis• fetal blood sampling• fetal blood gas analysis• fetal lactate.
15. Is there evidence of factors or interventions that affect outcomes in term prelabour rupture of the membranes?• Including septic screen for mother and baby.
• Is there evidence that, following prelabour rupture of the membranes at term, the length of time from prelabour rupture of membranes (before onset of labour and total), digital vaginal examination, electronic fetal heart-rate monitoring, or frequency and type of maternal sur-veillance influence outcomes?
• Following the birth of a healthy infant where there has been prelabour rupture of the mem-branes, is there evidence that the length of time from prelabour rupture of membranes (before onset and total), presence of pyrexia during or before labour, routine admission to neonatal units, frequency and type of neonatal observations, or frequency and type of neo-natal investigations (including invasive tests) influence outcomes?
• Is there evidence that the use of antibiotics before delivery in asymptomatic or symptomatic women with prelabour rupture of membranes influences outcomes?
• What are the criteria for the use of antibiotics in healthy babies born following prelabour rupture of membranes?
16. Is there any evidence that identification and management of meconium-stained liquor affect outcomes?
17. What is the effectiveness of the following interventions or techniques in labour on outcomes?• positions including:
– ‘freedom to choose’ option– standing– squatting– kneeling– semi-recumbent– lying on back– left lateral– birth stool, etc
• breathing and relaxation• massage• complementary therapies• birth balls• injected water papules• water (including temperature regulation)• mobilisation• pushing techniques in the second stage (including not pushing)• formal charting of fetal and maternal observations)• restricting fluids and nutrition (aspiration vomiting and Mendelson syndrome)• active management• amniotomy• oxytocin.
Appendix B

260
Intrapartum care
18. Is there evidence that the type, frequency and mode of administration of the following pharmacological and non-pharmacological pain relief and regional analgesia influence outcomes?• pharmacological pain relief:
– Entonox®– PCAs– pethidine– diamorphine– meptazinol (Meptid®)– epidural
• non-pharmacological pain relief:– TENS
• analgesia– spinal– combined spinal–epidural– epidural– mobile epidural
19. When is use of each of these methods of regional analgesia appropriate?20. What observations, above baseline care, should be undertaken on both mother and baby
while using regional analgesia?21. What IV fluids should be used to maintain blood pressure during labour while using
regional analgesia?22. What is the most effective use of regional analgesia to minimise instrumental delivery rates
and optimise pain relief in the second stage of labour?23. Does the method of management of the third stage of labour affect outcomes?:
• cord clamping• active management• physiological management.
24. What is the appropriate definition of retained placenta?25. What is the effective management of delay in the third stage?26. Are there effective ways of identifying women at increased risk of postpartum haemorrhage
antenatally and during labour?27. What is the effective management of women at increased risk of postpartum haemorrhage
to minimise this risk?28. What is the most effective way of managing postpartum haemorrhage?29. What is the appropriate definition of perineal or genital trauma?30. What is the effectiveness on perineal or genital trauma (including previous third- or fourth-
degree trauma or female genital mutilation) of the following techniques?• perineal massage• hand position• heat• cold• maternal position• analgesia• episiotomy• operative vaginal delivery
31. Is there evidence that the type of assessment used to identify perineal or genital trauma affects outcomes?
32. Is there evidence that undertaking repair, the timing, analgesia and method and material of perineal repair affect outcomes?
33. What is the evidence that different methods of initial neonatal assessment and examination influence outcomes?• Including cardiovascular-respiratory and abnormalities assessment.
34. What is the evidence that different methods of neonatal resuscitation influence outcomes?• Including use of oxygen at the time of birth.

261
35. Are there effective ways of encouraging mother–infant bonding following birth?• Including skin to skin contact with mothers, breastfeeding.
36. Is there evidence that routine taking of cord blood gases influences outcomes?
Appendix B

262
Appendix CSelection criteria and validity scores for included and excluded studies for the systematic review comparing planned home birth and planned hospital birth and the systematic review comparing planned standalone midwife-led unit and obstetric unit birth
Method used for this review
The difficulty of conducting a randomised controlled trial (RCT) to evaluate effectiveness and safety of planned home birth and planned standalone midwife-led unit birth, compared with planned obstetric unit birth, is evident from the literature. The paucity of good-quality evidence necessitated the inclusion of studies using a range of methodologies as described in Chapter 1 (methodology section). The details of the search strategies employed are provided on the accom-panying CD-ROM.
Inclusion/exclusion criteria
The best study design to address the effectiveness of an intervention is an RCT. However, there is a higher incidence/prevalence of benefits than adverse events, especially serious outcomes, in many clinical contexts, and therefore an RCT will not necessarily be the best method to use to demonstrate safety of an intervention.
Studies that employed an adequate randomised design were regarded as having the highest valid-ity [++]. Any study that considered planned birth populations with an additional adequate study design which controlled for background medical and/or obstetric risks between different places of birth and/or reported relevant outcomes was also included and assigned as having acceptable internal validity [+]. Any study that did not report relevant outcomes or that did not meet the criteria above was considered invalid and excluded ([−]). Use of regression analysis, matched control design, and/or any other means to control the risks of these two groups was regarded as relevant.
Women who planned birth at a place outside hospital settings (e.g. home birth and/or standalone midwife-led unit birth) but had adverse outcomes were more likely to have been transferred to hospital before birth and therefore be considered as an obstetric unit birth. To compensate for this required that any observational study comparing clinical outcomes between births outside and within obstetric units should consider women who planned birth outside an obstetric unit with those who planned hospital birth. Controlling for risk factors of these two groups is critical.
Transfer rates were obtained from any study where the validity was regarded as [++] or [+].
Applicability to UK setting
Any study conducted in the UK since 1980 was regarded as having the highest applicability to the current UK setting. Clinical practice in the UK was considered to have been significantly different before 1980. Any study conducted in high income countries since 1980 was also con-sidered valid, and therefore included if there was no UK study available or when the included UK studies could not provide enough information to make a conclusion.

263
Outcome measures
Another important factor is the availability of appropriate outcomes.
For effectiveness, relevant outcomes included mode of birth, incidence of obstetric interventions and any other relevant clinical outcomes as defined in the guideline questions.
Primary outcomes for safety were defined as intrapartum-related perinatal mortality (IPPM), and maternal mortality.
IPPM, defined as death from intrapartum ‘asphyxia’, ‘anoxia’ or ‘trauma’, (Wigglesworth clas-sification 3),600 was considered to be the most important outcome to assess safety of place of birth. IPPM includes stillbirths and death in the first week but excludes deaths of low birthweight infants or as a result of multiple abnormalities. If there was no relevant single study that reported IPPM, perinatal mortality was used. Similarly, maternal mortality was considered the most impor-tant outcome to assess safety of place of birth for mothers (women). If no relevant single study reported this outcome, other important maternal morbidities such as incidence of postpartum haemorrhage (PPH) were reported.
Where there is no single study reported IPPM and/or maternal mortality, perinatal mortality, neo-natal morbidities and maternal morbidities were considered as proxy and hence reported.
Note: For further details of included studies, please refer to the evidence tables in the accompa-nying CD-ROM.
Planned home versus hospital birth
Table C.1 Included studies (planned home birth versus planned hospital birth)
Authors Year Country Study design Validity
NRPMSCG45 1981–1994
UK Women planned home birth in the Northern Region was compared with all births in the region.
+
Dowswell26 1994 UK A randomised controlled trial including only 11 women to assess feasibility of such a study design.
+
NCC-WCH
(Appendix D)
1999–2003
UK The number of women who booked home birth in all England and Wales was calculated from reported transfer rates with sensitivity. The estimated IPPM rate for booked home birth was compared with overall England and Wales figures.
+
1994–1998
UK +
Janssen29 1998–1999
Canada Planned home birth at the onset of labour was compared with planned obstetric unit and planned midwife-led unit birth at the onset of labour in a matched control design.
+
Ackermann-Liebrich32
1989–1992
Switzerland The review only included outcomes that were based on an analysis of matched pairs.
+
Bastian30 1985–1990
Australia Outcomes for women who planned home birth at the onset of labour were compared with outcomes of all births in Australia.
+
Woodcock35,36 1981–1987
Australia Booked home and hospital births were compared. +
NRPMSCG = Northern Region Perinatal Mortality Survey Coordinating Group.
Appendix C

264
Intrapartum care
Table C.2 Excluded studies (planned home birth versus planned hospital birth)
Authors Year Country Reasons for exclusion Validity
Chamberlain31 1994 UK Although reported as matched by age, lone parent status, parity and hospital, the sizes of the two groups were significantly different. There were over 1000 unmatched planned home birth women, but these women were included in the analysis. Socio-economic status and obstetric backgrounds of these two groups were reported as statistically significantly different; hence, the comparison was invalid. No regression analysis was used. The study reported perinatal mortality, but did not report IPPM.
−
Davies43 1993 UK This was a case series without a control group. −
Caplan38 1980–1981
UK Women who gave birth at home were compared with a random sample of women who gave birth in hospital. Use of actual place of birth , rather than planned place of birth , and the lack of any controlling for background risk of these two groups made the comparison invalid.
−
Ford44 1977–1989
UK This was a case series without a control group. −
Shearer39 1978–1983
UK 202 women who planned home birth were compared with 185 women who planned hospital birth. No control of background obstetric risks was attempted.
−
Tew37 1970 UK Although regression modelling was used to control some of the confounding factors, these were comparing actual home birth with actual hospital birth. The study was conducted prior to 1980.
−
Johnson42 2000 North America
This was a case series without a control group. −
Wiegers33 1990–1993
Netherlands The study employed matched control design, comparing planned home birth and planned hospital birth women, although the outcome reported was ‘perinatal outcome index’ defined by the authors, and each relevant clinical outcome was not obtained.
−
Duran34 1971–1989
USA Although regression modelling controlled some of the confounding factors, these were comparing actual home birth with actual hospital birth with completely different backgrounds. The control group was drawn from the 1980 US National Natality/National Fetal Mortality Survey, in which low birthweights and fetal deaths were deliberately oversampled.
−
Mehl40,41 1970s USA Although regression modelling controlled some of the confounding factors, these were comparing actual home birth with actual hospital birth with significantly different backgrounds. The study was conducted prior to 1980.
−
Olsen27 2005 N/A This systematic review only included the Dowswell study.26 The included RCT does not report relevant outcomes for the clinical questions.
−
Olsen28 1997 N/A The author conducted meta-analyses of six observational studies, of which five are listed above.29,32–35 The other study was in a foreign language. The majority of the included studies had significant risk of introducing bias and/or confounding factors as above. In particular, the study by Duran34 was weighted the most in the meta-analysis owing to the size of the studies. The original study conducted a regression analysis, attempting to control background of these two different populations, although the raw data were used for this Olsen meta-analysis (see above).
−

265
Planned standalone midwife-led unit versus obstetric unit birth
Table C.3 Included studies (planned standalone midwife-led versus obstetric unit birth)
Authors Year Country Study design Validity
Saunders52 1990s UK Booked standalone unit birth was compared with booked home and obstetric unit birth.
+
David56 1992–1994
Germany Planned standalone unit birth at the onset of labour was compared with obstetric unit birth.
+
Feldman53 1981 USA Planned standalone unit birth at the onset of labour was compared with obstetric unit birth.
+
Scupholme54 1980s USA Planned standalone unit birth at the onset of labour was compared with obstetric unit birth.
+
Stone55 1990s USA Planned standalone unit birth at the onset of labour was compared with obstetric unit birth.
+
Table C.4 Excluded studies (planned standalone midwife-led versus obstetric unit birth)
Authors Year Country Reasons for exclusion Validity
Walker601 1997 UK Case series: no control group −
Fraser46 2003 UK Case series: no control group −
Eakins602 1984 USA Case series: no control group −
Rooks48–51,603 1985–1987
USA Case series: no control group −
Holz604 1985–1988
USA Case series: no control group −
Waldenstrom46 1991–1995
Australia Case series: no control group −
Moster605,606 1967–1996
Norway Actual places of birth were compared according to different size of maternity units on perinatal mortality. The definition of standalone midwife-led unit is significantly different from the current UK setting. Although antenatal risk factor was controlled, use of actual place of birth makes the comparison invalid.
−
Bennetts46 1972–1979
USA Case series: no control group −
Appendix C

266
Appendix DNCC-WCH analysis to obtain the best estimate of intrapartum-
related perinatal mortality in England and Wales
Background
A systematic review on risks and benefits of home birth showed increased intrapartum-related perinatal mortality (IPPM) in planned home birth groups in one Australian study30 but no other study has been sufficient to address this issue. The Guideline Development Group was con-cerned about the lack of UK data and requested the NCC-WCH to conduct an analysis to obtain the best estimate of the IPPM rate in the UK.
Method
Study design
Population-based cross-sectional data were analysed. The primary focus was on booked home births with the outcome established by comparing IPPM rates derived from the Confidential Enquiry into Maternal and Child Health (CEMACH; previously the Confidential Enquiry into Stillbirths and Deaths in Infancy (CESDI)) with overall national IPPM rates. Data about all women who gave birth at home either intentionally or unintentionally in England and Wales between 1994 and 2003 were included. For the purpose of the study, the years were divided into two equal periods: an early period (1994–1998) and a late period (1999–2003). The cut-off, which made both periods equal in length, was arbitrary and not based on any particular clinical implications.
Definitions
Definitions of the terms used in this appendix are as follows:
• IPPM rate:– The IPPM rate is defined as deaths from intrapartum ‘asphyxia’, ‘anoxia’ or ‘trauma’,
derived from the extended Wigglesworth classification 3,600 which is used by CEMACH.607,608 This includes stillbirths and death in the first week. The denominator was all births (live births and stillbirths).
• Booked, unintended and actual home birth:– Booked home birth refers to the intended place of birth at the time of the first antenatal
visit (booking). This includes women who intended a home birth at booking but who may have later transferred her care during pregnancy or labour.
– Unintended home birth refers to women who gave birth at home but at booking had actu-ally intended to give birth elsewhere.
– Actual home birth refers to all births (intended and unintended) that occurred at home.• Unintended home birth rate and transfer rate:
– The unintended home birth rate is the proportion of unintended home births among the total of actual home births.
– The transfer rate is the proportion of all women who intended a home birth at booking but who gave birth in hospital or elsewhere, among the total of women who intended a home birth at booking. The transfer includes those that occurred during pregnancy as well as in labour.
• Completed home birth group, unintended home birth group and transferred group (sub-groups of home birth):– Completed home birth group refers to women who intended to have a home birth at
booking and had babies at home.

267
– Unintended home birth group refers to women who did not intend to have a home birth at booking but had babies at home.
– Transferred group refers to women who intended to have a home birth at booking but had babies in hospital or elsewhere.
Data collection
IPPM
The numbers for the overall IPPM and those for each subgroup of home births in England and Wales, between 1994 and 2003, were obtained from CEMACH, which collects data for all deaths by intended place of birth at booking.608
Unintended home birth and transfer rates
Unintended home births and transfer rates were extracted from previous studies identified through a systematic search of medical databases (Medline, The Cochrane Library, EMBASE, BNI, CINAHL and MIDIRS), using keywords such as ‘home birth’ and reference lists of relevant articles. Inclusion criteria stipulated that studies:
• were conducted in the UK• were population based, which was defined as a study that reflects women at low risk in a
certain defined area• used the same definition of unintended home birth and transfer as above. Details of the system-
atic reviews are available from the authors. These rates were used to obtain weighted means and to set ranges for sensitivity analysis to calculate denominators for booked home birth.
Denominators (birth numbers) for all national births and actual home births
The numbers of all births and actual home births between 1994 and 2003 in England and Wales were obtained from the Office for National Statistics.19,20,609–617
Denominators (birth numbers) for booked home birth
The number of births from the Office for National Statistics, which relates to the actual place of birth, has been modified by removing the unintended home births and then adding back the likely transfers to provide an estimated number of women who had an intended home birth at booking.
Statistical analysis
IPPM rates were calculated from the data described above. ² tests were performed to test for trends and applied to a comparison of IPPM rates when appropriate. Confidence intervals were also calculated when appropriate. Sensitivity analyses were performed using the pre-set ranges derived from previous studies.
Results
Overall IPPM rate
A total of 4991 intrapartum perinatal deaths occurred in England and Wales between 1994 and 2003 among 6 314 315 births. The IPPM rates improved significantly during this period (test for trend: ² value = 100.92, degrees of freedom = 1, P < 0.001). The IPPM rate for the late period (0.68 per 1000 births [95% CI 0.65 to 0.71/1000]) was significantly lower than that for the early period (0.90 per 1000 births [95% CI 0.86 to 0.93/1000]) ( ² value = 100.09, degrees of free-dom = 1, P < 0.001; data not shown).
IPPM rate for actual home births
There were 75 intrapartum-related deaths among the 66 115 home births in England and Wales in the early period, while 50 intrapartum-related deaths occurred in the 64 585 home births in
Appendix D

268
Intrapartum care
the late period. The IPPM rate of 0.77 per 1000 births [95% CI 0.56 to 0.99/1000] for the later period was significantly better than the rate of 1.13 per 1000 births [95% CI 0.88 to 1.39/1000] ( ² value = 4.43, degrees of freedom = 1, P = 0.04) for the early years. The IPPM rate for actual home births in the early period was significantly higher than that for all births ( ² value = 4.04, degrees of freedom = 1, P = 0.04), but there was no evidence of difference in IPPM rates between actual home birth and all births in the later period ( ² value = 0.90, degrees of freedom = 1, P = 0.34).
Unintended home birth rates from previous studies
Unintended home birth rates were taken from previous studies conducted in England and Wales (Table D.1).
Table D.1 Unintended home birth and transfer rates from previous studies conducted in England and Wales
Author Period conducted Region Unintended ratea Transfer rateb
Ford44 1977–1989 London Not reported 18.8%
Shearer39 1978–1983 Essex Not reported 11.9%
NRPMSCG45 1983 Northern Region 56.0% (35.0%)c
NRPMSCG618,619 1988 Northern Region 47.0% Not reported
Davies43 1993 Northern Region 45.0% 43.0%
Chamberlain31 1994 England and Wales Not reported 16.0%
Weighted mean 50.7% 14.3%
Sensitivity analysis Lower 45.0% 11.9%
Upper 56.0% 43.0%
NRPMSCG = Northern Region Perinatal Mortality Survey Coordinating Group.a Proportion of women who did not book a home birth but had babies at home divided by all actual home births.b Proportion of women who booked home births but did not have babies at home divided by all home birth bookings.c No denominator was obtained; hence this was not included to calculate the weighted mean.
The unintended home birth rates ranged from 45.0% to 56.0%. The weighted mean of all the included studies was 50.7%. As a result, ranges for sensitivity analyses were set as 45% to 56%.
Transfer rates from previous studies
Transfer rates were also extracted from previous studies in England and Wales (Table D.1). The transfer rates ranged from 11.9% to 43.0%. The weighted mean of all the included studies was 14.3%. As a result, ranges for sensitivity analyses were arbitrarily set as 11.9% to 43.0%.
Estimation of IPPM rates for home birth
The sensitivity analyses (Table D.2) were used to estimate the number of births occurring in both the early and late periods for women in:
• the completed home birth group• the transferred group• the unintended home birth group• the booked home birth group.
The IPPM rate was calculated using the estimated number of births for each subgroup (Table D.2).
In the early period, the completed home birth group had a lower IPPM rate (0.46 per 1000 births [range 0.41 to 0.52]), while both the unintended home birth group (1.79 per 1000 births [range 1.62 to 2.02/1000]) and the transferred group (5.52 per 1000 births [range 1.92 to 8.67/1000]) had higher rates compared with the overall IPPM rate. In the early period, there was no evidence of a difference in IPPM rate between the booked home birth group (1.18 per 1000 births [range 0.71 to 1.36/1000]) and the overall IPPM rate.
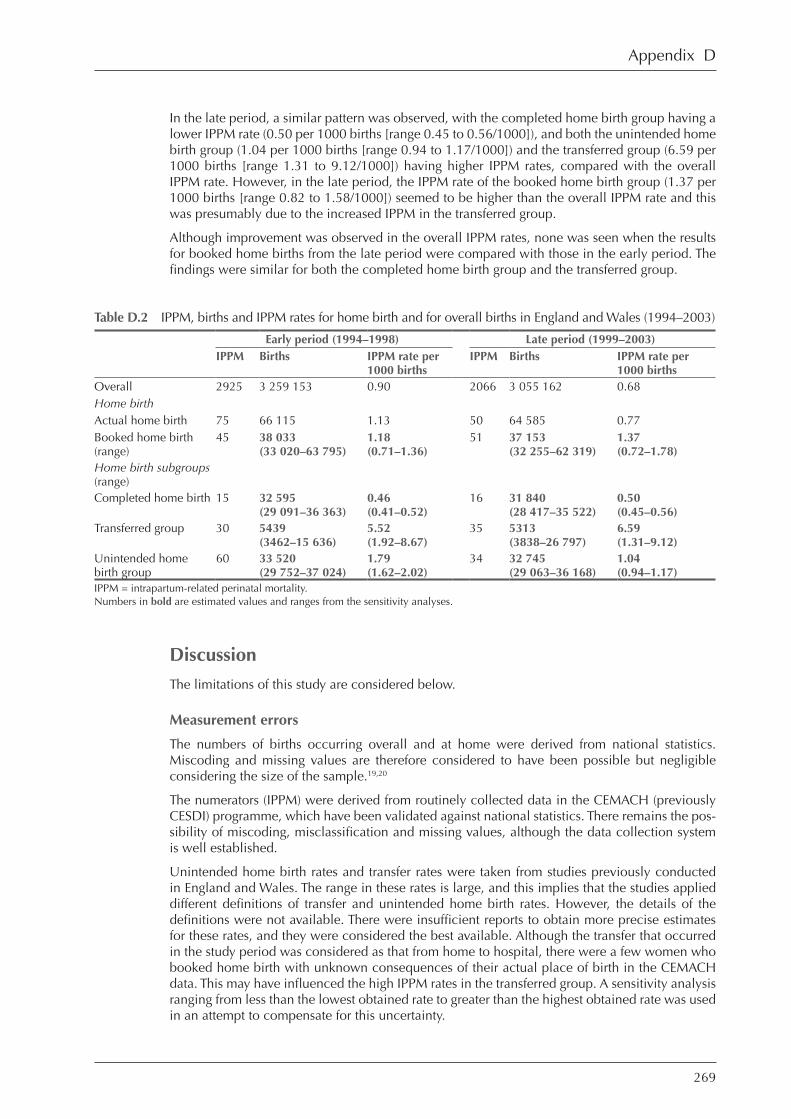
269
In the late period, a similar pattern was observed, with the completed home birth group having a lower IPPM rate (0.50 per 1000 births [range 0.45 to 0.56/1000]), and both the unintended home birth group (1.04 per 1000 births [range 0.94 to 1.17/1000]) and the transferred group (6.59 per 1000 births [range 1.31 to 9.12/1000]) having higher IPPM rates, compared with the overall IPPM rate. However, in the late period, the IPPM rate of the booked home birth group (1.37 per 1000 births [range 0.82 to 1.58/1000]) seemed to be higher than the overall IPPM rate and this was presumably due to the increased IPPM in the transferred group.
Although improvement was observed in the overall IPPM rates, none was seen when the results for booked home births from the late period were compared with those in the early period. The findings were similar for both the completed home birth group and the transferred group.
Table D.2 IPPM, births and IPPM rates for home birth and for overall births in England and Wales (1994–2003)
Early period (1994–1998) Late period (1999–2003)
IPPM Births IPPM rate per 1000 births
IPPM Births IPPM rate per 1000 births
Overall 2925 3 259 153 0.90 2066 3 055 162 0.68
Home birth
Actual home birth 75 66 115 1.13 50 64 585 0.77
Booked home birth (range)
45 38 033 (33 020–63 795)
1.18 (0.71–1.36)
51 37 153 (32 255–62 319)
1.37 (0.72–1.78)
Home birth subgroups (range)
Completed home birth 15 32 595 (29 091–36 363)
0.46 (0.41–0.52)
16 31 840 (28 417–35 522)
0.50 (0.45–0.56)
Transferred group 30 5439 (3462–15 636)
5.52 (1.92–8.67)
35 5313 (3838–26 797)
6.59 (1.31–9.12)
Unintended home birth group
60 33 520 (29 752–37 024)
1.79 (1.62–2.02)
34 32 745 (29 063–36 168)
1.04 (0.94–1.17)
IPPM = intrapartum-related perinatal mortality.Numbers in bold are estimated values and ranges from the sensitivity analyses.
Discussion
The limitations of this study are considered below.
Measurement errors
The numbers of births occurring overall and at home were derived from national statistics. Miscoding and missing values are therefore considered to have been possible but negligible considering the size of the sample.19,20
The numerators (IPPM) were derived from routinely collected data in the CEMACH (previously CESDI) programme, which have been validated against national statistics. There remains the pos-sibility of miscoding, misclassification and missing values, although the data collection system is well established.
Unintended home birth rates and transfer rates were taken from studies previously conducted in England and Wales. The range in these rates is large, and this implies that the studies applied different definitions of transfer and unintended home birth rates. However, the details of the definitions were not available. There were insufficient reports to obtain more precise estimates for these rates, and they were considered the best available. Although the transfer that occurred in the study period was considered as that from home to hospital, there were a few women who booked home birth with unknown consequences of their actual place of birth in the CEMACH data. This may have influenced the high IPPM rates in the transferred group. A sensitivity analysis ranging from less than the lowest obtained rate to greater than the highest obtained rate was used in an attempt to compensate for this uncertainty.
Appendix D

270
Intrapartum care
Bias
Selection bias could be introduced because only the 10 year period of 1994–2003 was evalu-ated. The study years were selected because the CEMACH data were available for these years. There might have been further changes since 2003, as there were changes observed between the early and later years. Otherwise, there was no sampling procedure involved and the data were based on the whole population of England and Wales.
Selection bias could be introduced for the studies that reported both unintended home birth and transfer rates. These were conducted between 1977 and 1994, before the time period in this study. Not all of the studies reported results for all of England and Wales and three of the six included studies were conducted in the Northern Region. However, although there was neither evidence of a temporal trend in rates nor any obvious regional effect, there is still a possibility of selection bias.
Data were collected after birth and the intended place of birth at booking was recorded retro-spectively. This means that recall bias may have been introduced.
Confounding
Background obstetric and medical risk is highly likely to have been different between the groups and these confounding factors would be likely to have influenced the outcomes, including IPPM. Current practice in the UK means that women with known risk factors are likely to be advised to book for a hospital birth and previous studies support this.29,31,32,34,35,39,42 White women, those with multiparity and those in higher socio-economic groups are more likely to book a home birth29,31,32,34,35,39,42 than those from other ethnicities, with single parity and of lower socio-economic status. This means that a lower IPPM rate would be expected among the women who book home births compared with hospital births.
Data had been anonymised and it was not possible to remove data for women who had had more than one birth in the study period, including multiple births. Some regions may have had higher home birth rates with lower IPPM rates. We considered these as a potential effect modifier, rather than a confounding factor, and unlikely to be relevant to the interpretation of these results.
However, the potential for confounding means that the results of the present study must be inter-preted with caution.
Possible explanations
The improvement in overall IPPM rates could have resulted from advances in clinical care, includ-ing use of more sophisticated strategies for identifying and acting upon risk, or improvements in staffing levels and training. For example, the fourth CESDI report (1994–1995)608 reported the poor quality of the interpretation of intrapartum fetal heart rate traces and highlighted the need for better education in this area.
However, the IPPM rate for booked home birth in the late period appeared to be higher than the overall IPPM rate and had not improved from the early period and this seemed to arise from the worsening of the outcome in the transferred group over the two periods. Thus, although those women who had intended to give birth at home and did so had a generally good outcome, those requiring transfer of care appeared to do significantly worse and indeed had IPPM rates well in excess of the overall rate. It is not possible to tell from the available data when transfer occurred, i.e. whether during pregnancy or at labour onset.
Acknowledgments
We appreciate and thank CEMACH for providing us with access to aggregated data for analysis.
We are also grateful to Dr Peter Brocklehurst (National Perinatal Epidemiology Unit), Professor Rona McCandlish (National Perinatal Epidemiology Unit and National Collaborating Centre for Women’s and Children’s Health Board), Professor Pat Doyle (London School of Hygiene & Tropical Medicine), Dr Paul C Taylor (University of Hertfordshire), Dr Moira Mugglestone (National Collaborating Centre for Women’s and Children’s Health) and Miss Kate Fleming (CEMACH) who reviewed this paper and provided us with valuable comments.

271
Appendix EDecision tree modelling framework to assess cost-effectiveness for place of birth
Introduction
This guideline considers four birth settings:
• home birth• standalone midwife-led unit• alongside midwife-led unit• obstetric unit.
The NHS is publicly funded with finite resources and it is not possible, within this resource constraint, to provide all types of health care that would be clinically effective. Economic evalu-ation is thus used to try to allocate resources in such a way so as to maximise benefit from scarce resources. In considering recommendations for place of birth, it was thought that a comparison of the cost-effectiveness of the various alternatives for place of birth for low-risk women who live in England and Wales was important to inform a recommendation about their use.
Unfortunately, the poor quality of the UK data on health outcomes by place of birth makes it extremely difficult to make meaningful comparisons across different birth settings at the current time. These limitations in the data mean that good evidence-based conclusions about the relative cost-effectiveness of different birth settings in the UK cannot be made.
Nevertheless, publishing the framework for an economic model as part of the guideline can still fulfil a useful function. In particular, it adds weight to the research recommendations of the guideline by highlighting the need for better data if priorities in this area are to be determined with regard to their economic efficiency.
Ideally, an economic model of place of birth would use a measure of health-related quality of life (such as quality-adjusted life years (QALYs)) as its clinical outcome to capture the multidi-mensional nature of relevant outcomes – infant/maternal mortality and morbidity – in a single comparable generic measure. However, current data limitations do not allow such a comparison across different place of birth settings and the initial preference of the GDG was to use perinatal mortality as the single clinical outcome in the economic modelling. The reasoning for this was as follows:
• wide availability – perinatal mortality is a commonly used outcome measure of perinatal health worldwide
• avoidance of misclassification of stillbirth*
• death is always a primary outcome when it occurs• frequency of event – perinatal deaths are much more common than maternal deaths• the study/trial data were based on planned place of birth rather than actual place of birth and
thus the whole package of care may affect outcomes that might be missed using intrapartum-related perinatal mortality (IPPM) instead, which only captures what happens in labour.
Nevertheless, it was recognised that, while using IPPM as an outcome might not capture differ-ences in outcome attributable to the whole package of care arising from a certain planned place of birth, IPPM is a better marker than perinatal mortality in measuring attributable differences in outcome due to actual place of birth.
* Use of neonatal mortality often misses babies who died soon after birth from perinatal asphyxia diagnosed as stillbirth. Perinatal mortality includes stillbirth after 28 weeks of gestation.
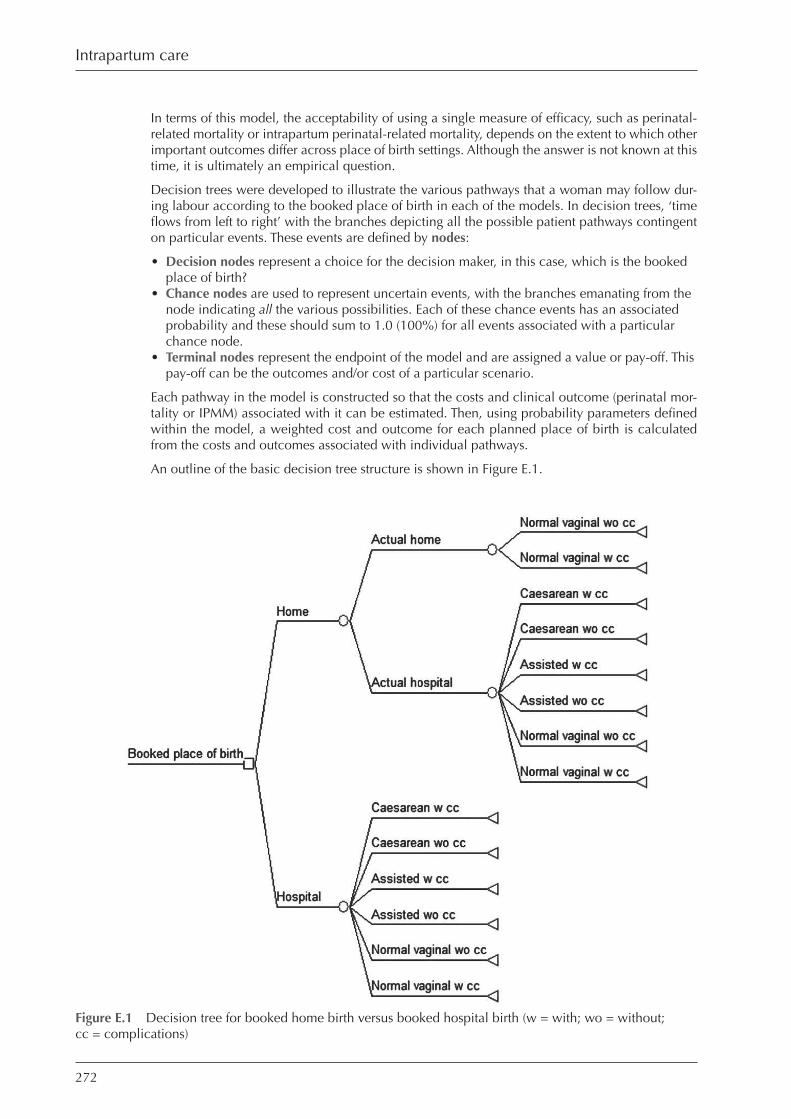
272
Intrapartum care
In terms of this model, the acceptability of using a single measure of efficacy, such as perinatal-related mortality or intrapartum perinatal-related mortality, depends on the extent to which other important outcomes differ across place of birth settings. Although the answer is not known at this time, it is ultimately an empirical question.
Decision trees were developed to illustrate the various pathways that a woman may follow dur-ing labour according to the booked place of birth in each of the models. In decision trees, ‘time flows from left to right’ with the branches depicting all the possible patient pathways contingent on particular events. These events are defined by nodes:
• Decision nodes represent a choice for the decision maker, in this case, which is the booked place of birth?
• Chance nodes are used to represent uncertain events, with the branches emanating from the node indicating all the various possibilities. Each of these chance events has an associated probability and these should sum to 1.0 (100%) for all events associated with a particular chance node.
• Terminal nodes represent the endpoint of the model and are assigned a value or pay-off. This pay-off can be the outcomes and/or cost of a particular scenario.
Each pathway in the model is constructed so that the costs and clinical outcome (perinatal mor-tality or IPMM) associated with it can be estimated. Then, using probability parameters defined within the model, a weighted cost and outcome for each planned place of birth is calculated from the costs and outcomes associated with individual pathways.
An outline of the basic decision tree structure is shown in Figure E.1.
Figure E.1 Decision tree for booked home birth versus booked hospital birth (w = with; wo = without; cc = complications)
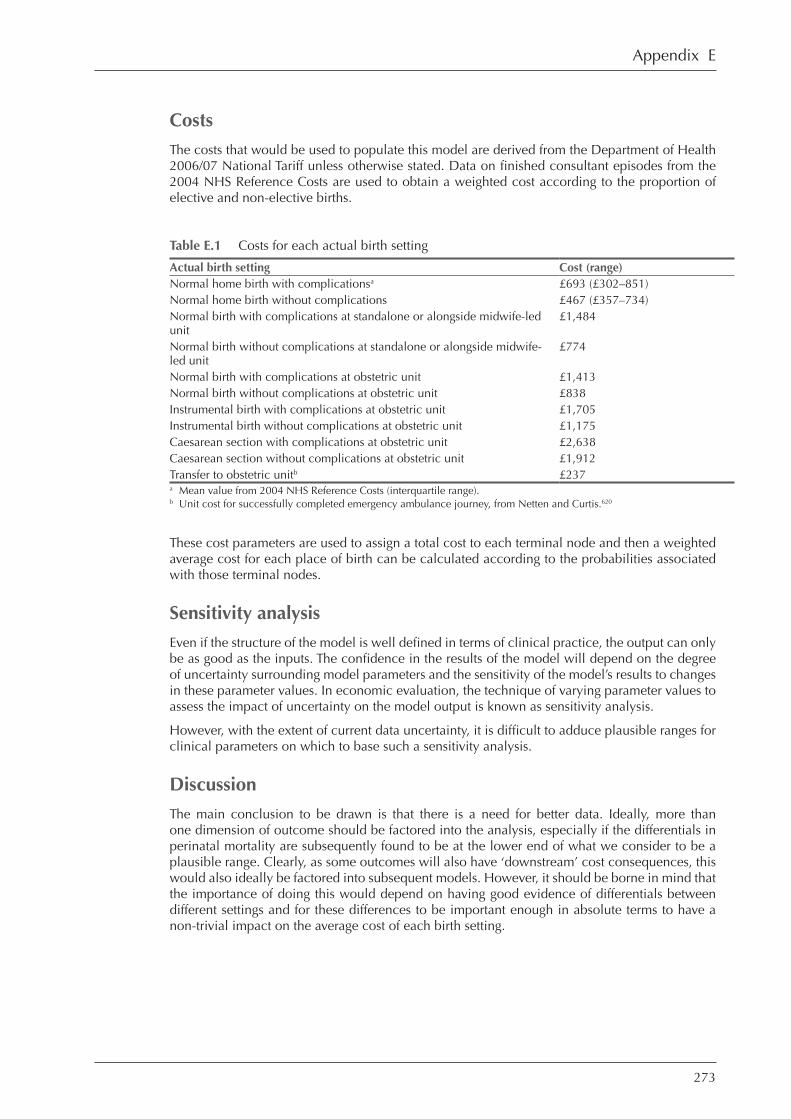
273
Costs
The costs that would be used to populate this model are derived from the Department of Health 2006/07 National Tariff unless otherwise stated. Data on finished consultant episodes from the 2004 NHS Reference Costs are used to obtain a weighted cost according to the proportion of elective and non-elective births.
Table E.1 Costs for each actual birth setting
Actual birth setting Cost (range)
Normal home birth with complicationsa £693 (£302–851)
Normal home birth without complications £467 (£357–734)
Normal birth with complications at standalone or alongside midwife-led unit
£1,484
Normal birth without complications at standalone or alongside midwife-led unit
£774
Normal birth with complications at obstetric unit £1,413
Normal birth without complications at obstetric unit £838
Instrumental birth with complications at obstetric unit £1,705
Instrumental birth without complications at obstetric unit £1,175
Caesarean section with complications at obstetric unit £2,638
Caesarean section without complications at obstetric unit £1,912
Transfer to obstetric unitb £237a Mean value from 2004 NHS Reference Costs (interquartile range).b Unit cost for successfully completed emergency ambulance journey, from Netten and Curtis.620
These cost parameters are used to assign a total cost to each terminal node and then a weighted average cost for each place of birth can be calculated according to the probabilities associated with those terminal nodes.
Sensitivity analysis
Even if the structure of the model is well defined in terms of clinical practice, the output can only be as good as the inputs. The confidence in the results of the model will depend on the degree of uncertainty surrounding model parameters and the sensitivity of the model’s results to changes in these parameter values. In economic evaluation, the technique of varying parameter values to assess the impact of uncertainty on the model output is known as sensitivity analysis.
However, with the extent of current data uncertainty, it is difficult to adduce plausible ranges for clinical parameters on which to base such a sensitivity analysis.
Discussion
The main conclusion to be drawn is that there is a need for better data. Ideally, more than one dimension of outcome should be factored into the analysis, especially if the differentials in perinatal mortality are subsequently found to be at the lower end of what we consider to be a plausible range. Clearly, as some outcomes will also have ‘downstream’ cost consequences, this would also ideally be factored into subsequent models. However, it should be borne in mind that the importance of doing this would depend on having good evidence of differentials between different settings and for these differences to be important enough in absolute terms to have a non-trivial impact on the average cost of each birth setting.
Appendix E

274
Appendix FEconomic evaluation for ST analysis
Meta-analysis of three RCTs of high-risk women that investigated effectiveness of ST analysis showed that it reduces instrumental vaginal birth and neonatal encephalopathy, although there was no difference in fetal acid–base. However, while associated with lower neonatal encepha-lopathy rate in surviving infants, there is no significant difference in outcome when combined perinatal deaths. It comes at added cost and also requires the use of fetal scalp electrodes and extra staff training. If used when fetal heart rate abnormalities are present it may be necessary to perform a fetal blood sample before using ST analysis.
In the light of this evidence, a costing of ST analysis for intrapartum fetal monitoring using auto-matic STAN® was undertaken. This was done to assess whether the technology was potentially cost saving from an NHS perspective when ‘downstream’ resource use is considered.
The purchase of the STAN equipment represents a capital costs, requiring an up-front payment (or investment) before the service can be offered. This payment represents a fixed cost of STAN and does not vary with the quantity of service provided. This capital can then be used over a number of years before it needs to be replaced.
In general, capital costs have two facets:
• Opportunity cost – the money spent on the equipment could have been invested in some other venture yielding positive benefits. This is calculated by applying an interest rate on the sum invested in the equipment.
• Depreciation cost – the equipment has a certain lifespan and depreciates over time. Eventually the equipment has to be replaced. In economic evaluation, the usual practice is to annuitise the initial capital outlay over the expected life of equipment. This gives an ‘annual equivalent cost’ which can then be divided by the number of patients treated annu-ally to assign a unit cost of using that equipment. Calculating the ‘annual equivalent cost’ means making allowance for the differential timing of costs which involves discounting.
The formula for calculating the equivalent annual cost is given below.
where:
E = equivalent annual costK = purchase price of equipmentS = resale valuer = discount (interest rate)n = equipment lifespanA(n,r) = annuity factor* (n years at interest rate r)
The equipment cost also includes some training and consumables† but the analysis does not include any replenishment of consumables needed over the lifespan of the equipment. Nor does the costing include further training costs and the opportunity costs of the time of those being trained.
* Converts a present value into an annuity, a series of equal annual payments.
† The cost of STAN includes the cost of trolley, training, electronic archiving and consumables (fetal scalp electrodes: £231 box of 50).
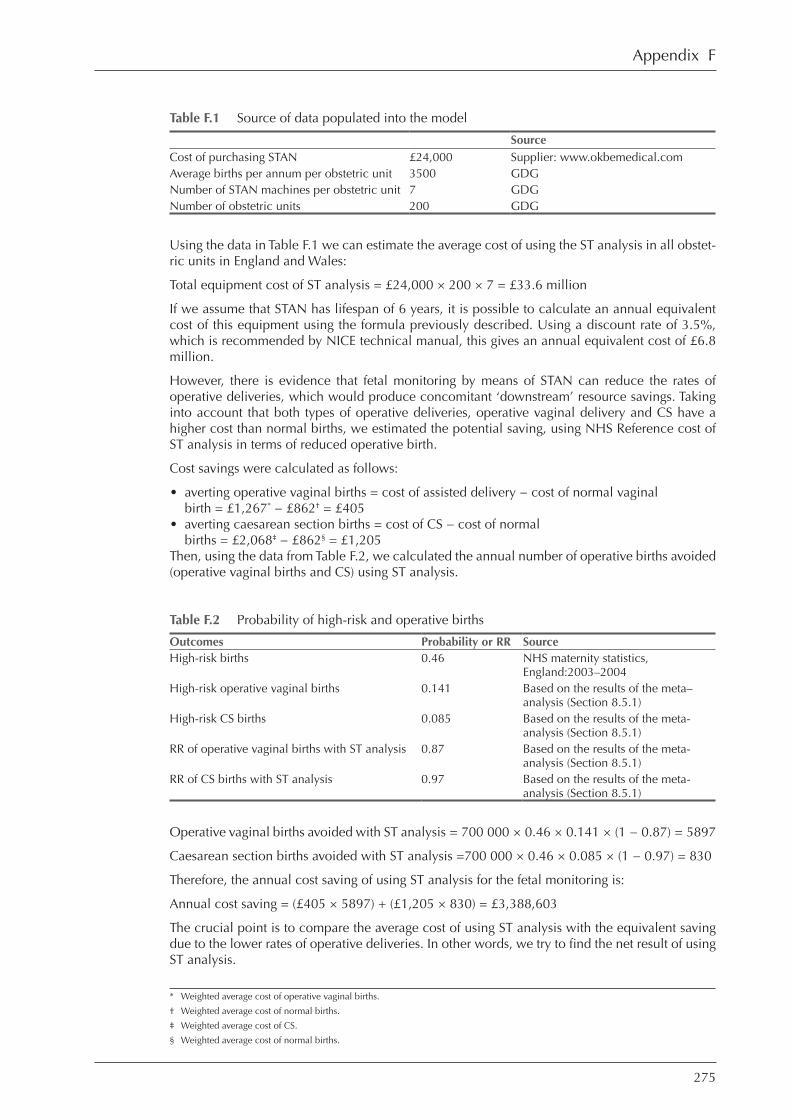
275
Table F.1 Source of data populated into the model
Source
Cost of purchasing STAN £24,000 Supplier: www.okbemedical.com
Average births per annum per obstetric unit 3500 GDG
Number of STAN machines per obstetric unit 7 GDG
Number of obstetric units 200 GDG
Using the data in Table F.1 we can estimate the average cost of using the ST analysis in all obstet-ric units in England and Wales:
Total equipment cost of ST analysis = £24,000 × 200 × 7 = £33.6 million
If we assume that STAN has lifespan of 6 years, it is possible to calculate an annual equivalent cost of this equipment using the formula previously described. Using a discount rate of 3.5%, which is recommended by NICE technical manual, this gives an annual equivalent cost of £6.8 million.
However, there is evidence that fetal monitoring by means of STAN can reduce the rates of operative deliveries, which would produce concomitant ‘downstream’ resource savings. Taking into account that both types of operative deliveries, operative vaginal delivery and CS have a higher cost than normal births, we estimated the potential saving, using NHS Reference cost of ST analysis in terms of reduced operative birth.
Cost savings were calculated as follows:
• averting operative vaginal births = cost of assisted delivery − cost of normal vaginal birth = £1,267* − £862† = £405
• averting caesarean section births = cost of CS − cost of normal births = £2,068‡ − £862§ = £1,205
Then, using the data from Table F.2, we calculated the annual number of operative births avoided (operative vaginal births and CS) using ST analysis.
Table F.2 Probability of high-risk and operative births
Outcomes Probability or RR Source
High-risk births 0.46 NHS maternity statistics, England:2003–2004
High-risk operative vaginal births 0.141 Based on the results of the meta–analysis (Section 8.5.1)
High-risk CS births 0.085 Based on the results of the meta-analysis (Section 8.5.1)
RR of operative vaginal births with ST analysis 0.87 Based on the results of the meta-analysis (Section 8.5.1)
RR of CS births with ST analysis 0.97 Based on the results of the meta-analysis (Section 8.5.1)
Operative vaginal births avoided with ST analysis = 700 000 × 0.46 × 0.141 × (1 − 0.87) = 5897
Caesarean section births avoided with ST analysis =700 000 × 0.46 × 0.085 × (1 − 0.97) = 830
Therefore, the annual cost saving of using ST analysis for the fetal monitoring is:
Annual cost saving = (£405 × 5897) + (£1,205 × 830) = £3,388,603
The crucial point is to compare the average cost of using ST analysis with the equivalent saving due to the lower rates of operative deliveries. In other words, we try to find the net result of using ST analysis.
* Weighted average cost of operative vaginal births.
† Weighted average cost of normal births.
‡ Weighted average cost of CS.
§ Weighted average cost of normal births.
Appendix F

276
Intrapartum care
So, the net result of ST analysis is:
Cost of ST analysis: £6.8 million
Saving of averted operating deliveries £3.4 million
Net cost £3.4 million
Using baseline estimates, it is evident that the cost of purchasing the equipment is higher than the potential cost saving from reduced operative delivery with a net increase in the NHS expen-ditures of £3.4 million.
To take account of variance and uncertainty in the estimates of some of the cost inputs, a sensi-tivity analysis was performed. A sensitivity analysis showed that the net result of the model was particularly sensitive to changes in the assumptions about RR of operative vaginal delivery and CS birth. With a ‘best case scenario’ for ST analysis, using the lower 95% CI RR for both opera-tive vaginal birth (0.78) and CS births (0.84), there was a net saving to the NHS of £2.5 million. Whereas, the sensitivity analysis of the ‘worst case scenario’, using the upper 95% CI RR for operative vaginal birth (0.96) and CS (1.11), resulted in a net cost of £9.8 million.
The cost analysis presented above can only be considered an indicative estimate of the true cost of routinely using ST analysis for the fetal monitoring in all obstetric units in England and Wales. This analysis does not take into account all consumable and training costs associated with technique. On the other hand, we have assumed that the only source of cost saving is the reduc-tion of operative deliveries. It is possible that ST analysis can reduce other costly interventions e.g. there is evidence that ST analysis can reduce the number of babies who develop neonatal encephalopathy.
Current evidence suggests that ST analysis may be more effective than the alternative. Had there been strong evidence that the technology was also cost saving, that would have suggested that ST analysis was most likely cost-effective. In the absence of strong evidence that the technology is cost saving, a full economic evaluation is required in order to assess cost-effectiveness. A simple costing approach was undertaken because a cost-effectiveness analysis was felt to be difficult within the constraints of this guideline.

277
References
1. Government Statistical Service and Department of Health. NHS Maternity Statistics, England: 2002–03. Statistical Bulletin 2004/10. London: Department of Health; 2004.
2. National Assembly for Wales. Maternity Statistics, Wales: Methods of Delivery, 1995–2003. No. SDR 40/2004. Cardiff: National Assembly for Wales; 2004.
3. Royal College of Obstetricians and Gynaecologists: Clinical Effectiveness Support Unit. The Care of Women Requesting Induced Abortion. Evidence-based guideline No. 7. London: RCOG; 2000.
4. NHS Executive. Clinical Guidelines: Using Clinical Guidelines to Improve Patient Care Within the NHS. London: HMSO; 1996.
5. National Institute for Clinical Excellence. Induction of Labour. Clinical guideline D. London: National Institute for Clinical Excellence; 2001.
6. National Collaborating Centre for Women’s and Children’s Health. Caesarean Section. Clinical Guideline. London: RCOG Press; 2004.
7. National Institute for Clinical Excellence. Infection Control: Prevention of Healthcare-Associated Infection in Primary and Community Care. London: National Institute for Clinical Excellence; 2003.
8. National Institute for Clinical Excellence. Antenatal Care: Routine Care for the Healthy Pregnant Woman. Clinical Guideline 6. London: National Institute for Clinical Excellence; 2003.
9. National Institute for Health and Clinical Excellence. Guideline Development Methods: Information for National Collaborating Centres and Guideline Developers. London: National Institute for Health and Clinical Evidence; 2005.
10. Oxman AD, Sackett DL, Guyatt GH. Users’ guides to the medical literature. I. How to get started. The Evidence-Based Medicine Working Group. JAMA: the Journal of the American Medical Association 1993;270(17):2093–5.
11. Guyatt GH, Sackett DL, Cook DJ. Users’ guides to the medical literature. II. How to use an article about therapy or prevention. A. Are the results of the study valid? Evidence-Based Medicine Working Group. JAMA: the Journal of the American Medical Association 1993;270(21):2598–601.
12. Guyatt GH, Sackett DL, Cook DJ. Users’ guides to the medical literature. II. How to use an article about therapy or prevention. B. What were the results and will they help me in caring for my patients? Evidence-Based Medicine Working Group. JAMA: the Journal of the American Medical Association 1994;271(1):59–63.
13. Jaeschke R, Guyatt G, Sackett DL. Users’ guides to the medical literature. III. How to use an article about a diagnostic test. A. Are the results of the study valid? Evidence-Based Medicine Working Group. JAMA: the Journal of the American Medical Association 1994;271(5):389–91.
14. Jaeschke R, Guyatt GH, Sackett DL. Users’ guides to the medical literature. III. How to use an article about a diagnostic test. B. What are the results and will they help me in caring for my patients? The Evidence-Based Medicine Working Group. JAMA: the Journal of the American Medical Association 1994;271(9):703–7.
15. Sackett DL, Straus SE, Richardson WS, et al. Evidence-Based Medicine. How to practice and teach EBM. 2nd ed. Edinburgh: Churchill Livingstone; 2000.
16. Scottish Intercollegiate Guidelines Network. SIGN 50: A Guideline Developers’ Handbook. No. 50. Edinburgh: Scottish Intercollegiate Guideline Network; 2001.
17. Drummond MF, O’Brien B, Stoddart GL, Torrance GW. Methods for the Economic Evaluation of Health Care Programmes. Oxford University Press; 1997.
18. Resuscitation Council (UK). Resuscitation Guidelines 2005. London: Resuscitation Council (UK); 2005.
19. Macfarlane A, Mugford M. Birth Counts: Statistics of pregnancy & childbirth. Vol 2. 2nd ed. London: The Stationary Office; 2000.
20. Macfarlane A, Mugford M, Henderson J, et al. Birth Counts: Birth Counts: Statistics of pregnancy & childbirth. Volume 2. 2nd ed. London: The Stationary Office; 2000.
21. Standing Maternity and Midwifery Advisory Committee. Domiciliary Midwifery and Maternity Beds Needed. London: HMSO; 1970.
22. Expert Maternity Group. Changing Childbirth. London: HMSO; 1993.
23. Department of Health. National Service Framework for Children, Young People and Maternity Services – Maternity. No. 40498. London: Department of Health; 2004.
24. Welsh Assembly Government. National Service Framework for Children, Young People and Maternity Services in Wales. Cardiff: Welsh Assembly Government; 2005.
25. National Health Service. NHS Maternity Statistics, England: 2004–05. London: National Health Service; 2006.
26. Dowswell T, Thornton JG, Hewison J, et al. Should there be a trial of home versus hospital delivery in the United Kingdom? British Medical Journal 1996;312(7033):753–7.
27. Olsen O, Jewell MD. Home versus hospital birth. (Cochrane Review). In: Cochrane Database of Systematic Reviews, Issue 1, 2005. Oxford: Update Software.
28. Olsen O. Meta-analysis of the safety of home birth. Birth 1997;24(1):4–13.
29. Janssen PA, Lee SK, Ryan EM, et al. Outcomes of planned home births versus planned hospital births after regulation of midwifery in British Columbia. Canadian Medical Association Journal 2002;166(3):315–23.
30. Bastian H, Keirse MJ, Lancaster PA. Perinatal death associated with planned home birth in Australia: population based study. British Medical Journal 1998;317(7155):384–8.
31. Chamberlain G, Wraight A, Crowley P. Home Births – The Report of the 1994 Confidential Enquiry by the National Birthday Trust Fund. Parthenon; 1997.
32. Ackermann-Liebrich U, Voegeli T, Gunter-Witt K, et al. Home versus hospital deliveries: Follow up study of matched pairs for procedures and outcome. British Medical Journal 1996;313(7068):1313–18.

278
Intrapartum care
33. Wiegers TA, Keirse MJ, van der ZJ, et al. Outcome of planned home and planned hospital births in low risk pregnancies: prospective study in midwifery practices in The Netherlands. British Medical Journal 1996;313(7068):1309–13.
34. Duran AM. The safety of home birth: the farm study. American Journal of Public Health 1992;82(3):450–3.
35. Woodcock HC, Read AW, Bower C, et al. A matched cohort study of planned home and hospital births in Western Australia 1981–1987. Midwifery 1994;10(3):125–35.
36. Woodcock HC, Read AW, Moore DJ, et al. Planned homebirths in Western Australia 1981–1987: a descriptive study. Medical Journal of Australia 1990;153(11–12):672–8.
37. Tew M. Safer Childbirth: A Critical History of Maternity Care. 3rd ed. London: Free Association Books Ltd; 1998.
38. Caplan M, Madeley RJ. Home deliveries in Nottingham 1980–81. Public Health 1985;99(5):307–13.
39. Shearer JM. Five year prospective survey of risk of booking for a home birth in Essex. British Medical Journal 1985;291(6507):1478–80.
40. Mehl LE. Research on alternatives in childbirth: what can it tell us about hospital practice? In: Stewart L, Stewart D, eds. 21st Century Obstetrics Now. Marble Hill, MO: NAPSAC; 1977. p. 171–207.
41. Mehl LE, Peterson GH, Whitt M, et al. Outcomes of elective home births: a series of 1,146 cases. Journal of Reproductive Medicine 1977;19(5):281–90.
42. Johnson KC, Daviss BA. Outcomes of planned home births with certified professional midwives: large prospective study in North America. British Medical Journal 2005;330(7505):1416–22.
43. Davies J, Hey E, Reid W, et al. Prospective regional study of planned home births. British Medical Journal 1996;313(7068):1302–6.
44. Ford C, Iliffe S, Franklin O. Outcome of planned home births in an inner city practice. British Medical Journal 1991;303(6816):1517–19.
45. Northern Region Perinatal Mortality Survey Coordinating Group. Collaborative survey of perinatal loss in planned and unplanned home births. British Medical Journal 1996;313(7068):1306–9.
46. Stewart M, McCandlish R, Henderson J, Brocklehurst P. Report of a Structured Review of Birth Centre Outcomes. Oxford: National Perinatal Epidemiology Unit; 2004.
47. Walsh D, Downe SM. Outcomes of free-standing, midwife-led birth centers: a structured review. Birth 2004;31(3):222–9.
48. Rooks JP, Weatherby NL, Ernst EK, et al. Outcomes of care in birth centers. The National Birth Center Study. New England Journal of Medicine 1989;321(26):1804–11.
49. Rooks JP, Weatherby NL, Ernst EKM. The National Birth Center Study: Part 1 – methodology and prenatal care and referrals. Journal of Nurse-Midwifery 1992;37(4):222–53.
50. Rooks JP, Weatherby NL, Ernst EK. The National Birth Center Study: Part III – Intrapartum and immediate postpartum and neonatal complications and transfers, postpartum and neonatal care, outcomes, and client satisfaction. Journal of Nurse-Midwifery 1992;37(6):361–97.
51. Rooks JP, Weatherby NL, Ernst EK. The National Birth Center Study: Part II – Intrapartum and immediate postpartum and neonatal care. Journal of Nurse-Midwifery 1992;37(5):301–30.
52. Saunders D, Boulton M, Chapple J, et al. Evaluation of the Edgware Birth Centre. London: Barnet Health Authority; 2000.
53. Feldman E, Hurst M. Outcomes and procedures in low risk birth: a comparison of hospital and birth center settings. Birth 1987;14(1):18–24.
54. Scupholme A, McLeod AGW, Robertson EG. A birth center affiliated with the tertiary care center: Comparison of outcome. Obstetrics and Gynecology 1986;67(4):598–603.
55. Stone PW. Maternity care outcomes: assessing a nursing model of care for low risk pregnancy. Outcomes Manag Nurs Pract 1998;2:71–5.
56. David M, von Schwarzenfeld HK, Dimer JA, et al. Perinatal outcome in hospital and birth center obstetric care. International Journal of Gynaecology and Obstetrics 1999;65(2):149–56.
57. Hodnett ED. Home-like versus conventional institutional settings for birth. (Cochrane Review). In: Cochrane Database of Systematic Reviews, Issue 2, 2003. Oxford: Update Software.
58. MacVicar J, Dobbie G, Owen-Johnstone L, et al. Simulated home delivery in hospital: a randomised controlled trial. BJOG: an international journal of obstetrics & gynaecology 1993;100(4):316–23.
59. Hundley VA, Cruickshank FM, Lang GD, et al. Midwife managed delivery unit: a randomized controlled comparison with consultant led care. British Medical Journal 1994;309(6966):1400–4.
60. Chapman MG, Jones M, Springs JE. The use of a birthroom: a randomised controlled trial comparing delivery with that in the labour ward. BJOG: an international journal of obstetrics & gynaecology 1986;93(2):182–7.
61. Mahmood TA. Evaluation of an experimental midwife-led unit in Scotland. Journal of Obstetrics and Gynaecology 2003;23(2):121–9.
62. Gould D, Lupton B, Marks M, et al. Outcomes of an alongside birth centre in a tertiary referral centre. RCM Midwives 2004;7(6):252–6.
63. Waldenstrom U, Nilsson CA, Winbladh B. The Stockholm birth centre trial: maternal and infant outcome. BJOG: an international journal of obstetrics & gynaecology 1997;104(4):410–18.
64. Waldenstrom U, Nilsson CA. MW vs OBA Randomized controlled study of birth center care versus standard maternity care: effect’s on women’s health. Birth 1997;24(1):17–26.
65. Stone PW, Walker PH. Cost-effectiveness analysis: birth center vs. hospital care. Nursing Economics 1995;13(5):299–308.
66. Anderson RE, Anderson DA. The cost-effectiveness of home birth. Journal of Nurse-Midwifery 1999;44(1):30–5.
67. Hodnett ED. Pain and women’s satisfaction with the experience of childbirth: a systematic review. American Journal of Obstetrics and Gynecology 2002;186(5 Suppl Nature):S160–72.
68. Waldenstrom U, Hildingsson I, Rubertsson C. A negative birth experience: prevalence and risk factors in a national sample. Birth 2004;31(1):17–27.
69. Green JM, Baston HA. Feeling in control during labor: concepts, correlates, and consequences. Birth 2003;30(4):235–47.
70. Lavender T, Stephen A, Walkinshaw SA, et al. A prospective study of women’s views of factors contributing to a positive birth experience. Midwifery 1999;15:40–6.

279
71. Waldenstrom U. Experience of labor and birth in 1111 women. Journal of Psychosomatic Research 1999;47(5):471–82.
72. Waldenstrom U, Borg IM, Olsson B, et al. The childbirth experience: a study of 295 new mothers. Birth 1996;23(3):144–53.
73. Brown S, Lumley J. Satisfaction with care in labor and birth: a survey of 790 Australian women. Birth 1994;21(1):4–13.
74. Brown S, Lumley J. Changing childbirth: lessons from an Australian survey of 1336 women. BJOG: an international journal of obstetrics & gynaecology 1998;105(2):143–55.
75. Creedy DK, Shochet IM, Horsfall J. Childbirth and the development of acute trauma symptoms: incidence and contributing factors. Birth 2000;27(2):104–11.
76. Tarkka MT, Paunonen M, Laippala P. Importance of the midwife in the first-time mother’s experience of childbirth. Scandinavian Journal of Caring Sciences 2000;14(3):184–90.
77. VandeVusse L. Decision making in analyses of women’s birth stories. Birth 1999;26(1):43–50.
78. Berg M, Lundgren I, Hermansson E, et al. Women’s experience of the encounter with the midwife during childbirth. Midwifery 1996;12(1):11–15.
79. Halldorsdottir S, Karlsdottir SI. Journeying through labour and delivery: perceptions of women who have given birth. Midwifery 1996;12(2):48–61.
80. Halldorsdottir S, Karlsdottir SI. Empowerment or discouragement: women’s experience of caring and uncaring encounters during childbirth. Health Care for Women International 1996;17(4):361–79.
81. McKay S, Smith SY. “What are they talking about? Is something wrong?” Information sharing during the second stage of labor. Birth 1993;20(3):142–7.
82. McKay S. Shared power: The essence of humanized childbirth. Journal of Prenatal and Perinatal Psychology and Health 1991;5(4):283–95.
83. Adams M. A Study of Communication in the Labour Ward. Research and the Midwife Conference Proceedings 1989. Manchester: Research and the Midwife;1990. p. 2–18.
84. Manogin TW, Bechtel GA, Rami JS. Caring behaviors by nurses: women’s perceptions during childbirth. Journal of Obstetric, Gynecologic and Neonatal Nursing 2000;29(2):153–7.
85. Cheung NF. Choice and control as experienced by Chinese and Scottish childbearing women in Scotland. Midwifery 2002;18(3):200–13.
86. Simkin PP, O’Hara M. Nonpharmacologic relief of pain during labor: systematic reviews of five methods. American Journal of Obstetrics and Gynecology 2002;186(5 Suppl):S131–59.
87. Bloom SL, McIntire DD, Kelly MA, et al. Lack of effect of walking on labor and delivery. New England Journal of Medicine 1998;339(2):76–9.
88. MacLennan AH, Crowther C, Derham R. Does the option to ambulate during spontaneous labour confer any advantage or disadvantage? Journal of Maternal-Fetal Investigation 1994;3(1):43–8.
89. Flynn AM, Kelly J, Hollins G, et al. Ambulation in labour. British Medical Journal 1978;2(6137):591–3.
90. Molina FJ, Sola PA, Lopez E, et al. Pain in the first stage of labor: relationship with the patient’s position. Journal of Pain and Symptom Management 1997;13(2):98–103.
91. Andrews CM, Chrzanowski M. Maternal position, labor, and comfort. Applied Nursing Research 1990;3(1):7–13.
92. Hodnett ED, Gates S, Hofmeyr GJ, Sakala C. Continuous support for women during childbirth. (Cochrane Review). In: Cochrane Database of Systematic Reviews, 2004. Oxford: Update Software.
93. Hodnett ED, Lowe NK, Hannah ME, et al. Effectiveness of nurses as providers of birth labor support in North American hospitals: A randomized controlled trial. JAMA: the Journal of the American Medical Association 2002;288(11):1373–81.
94. Langer A, Campero L, Garcia C, et al. Effects of psychosocial support during labour and childbirth on breastfeeding, medical interventions, and mothers’ wellbeing in a Mexican public hospital: a randomised clinical trial. BJOG: an international journal of obstetrics & gynaecology 1998;105(10):1056–63.
95. House of Commons Health Committee. Second Report on Maternity Services (Winterton Report). London: HMSO; 1992.
96. Department of Health. Changing Childbirth: Part 1 Report of the Expert Maternity Group. London: HMSO; 1993.
97. North Staffordshire Changing Childbirth Research Team. A randomised study of midwifery caseload care and traditional ‘shared-care’. Midwifery 2000;16(4):295–302.
98. Sandall J. Occupational burnout in midwives: new ways of working and the relationship between organisational factors and psychological health and well-being. Risk, Decision and Policy 1998;3(3):213–32.
99. National Collaborating Centre for Women’s and Children’s Health. Antenatal Care: Routine Care for the Healthy Pregnant Woman. London: RCOG Press; 2003.
100. Hodnett ED. Continuity of caregivers for care during pregnancy and childbirth. (Cochrane Review). In: Cochrane Database of Systematic Reviews, 2004. Oxford: Update Software.
101. Waldenstrom U, Turnbull D. A systematic review comparing continuity of midwifery care with standard maternity services. BJOG: an international journal of obstetrics & gynaecology 1998;105(11):1160–70.
102. Hicks C, Spurgeon P, Barwell F. Changing Childbirth: a pilot project. Journal of Advanced Nursing 2003;42(6):617–28.
103. Homer CS, Davis GK, Brodie PM, et al. Collaboration in maternity care: a randomised controlled trial comparing community-based continuity of care with standard hospital care. BJOG: an international journal of obstetrics & gynaecology 2001;108(1):16–22.
104. Homer CS, Davis GK, Cooke M, et al. Womens’ experiences of continuity of midwifery care in a randomised controlled trial in Australia. Midwifery 2002;18(2):102–12.
105. Biro MA, Waldenstrom U. Team midwifery care in a tertiary level obstetric service: a randomized controlled trial. Birth 2000;27(3):168–73.
106. Biro MA, Waldenstrom U, Brown S, et al. Satisfaction with team midwifery care for low- and high-risk women: a randomized controlled trial. Birth 2003;30(1):1–10.
107. Waldenstrom U. Does team midwife care increase satisfaction with antenatal, intrapartum, and postpartum care? A randomized controlled trial. Birth 2000;27(3):156–67.
108. Waldenstrom U, McLachlan H, Forster D, et al. Team midwife care: maternal and infant outcomes. Australian and New Zealand Journal of Obstetrics and Gynaecology 2001;41(3):257–64.
References

280
Intrapartum care
109. Sandall J. Team midwifery and burnout in midwives in the UK: practical lessons from a national study. MIDIRS Midwifery Digest 1999;9(2):147–52.
110. Turnbull D, Holmes A, Shields N, et al. Randomised, controlled trial of efficacy of midwife-managed care. Lancet 1996;348(9022):213–18.
111. Gyte G, Richens Y. Routine prophylactic drugs in normal labour for reducing gastric aspiration and its effects. (Cochrane Review). In: Cochrane Database of Systematic Reviews, 2006. Oxford: Update Software.
112. Scrutton MJ, Metcalfe GA, Lowy C. Eating in labour: a randomised controlled trial assessing the risks and benefits. Anaesthesia 1999;54(4):329–34.
113. Scheepers HC, de Jong PA, Essed GG, et al. Carbohydrate solution intake during labour just before the start of the second stage: a double-blind study on metabolic effects and clinical outcome. BJOG: an international journal of obstetrics & gynaecology 2004;111(12):1382–7.
114. Scheepers HC, Thans MC, de Jong PA, et al. The effects of oral carbohydrate administration on fetal acid base balance. Journal of Perinatal Medicine 2002;30(5):400–4.
115. Scheepers H, Thans MCJ, de Jong PA, et al. A double-blind, randomised, placebo controlled study on the influence of carbohydrate solution intake during labour. BJOG: an international journal of obstetrics & gynaecology 2002;109(2):178–81.
116. Kubli M, Scrutton MJ, Seed PT, et al. An evaluation of isotonic “sport drinks” during labor. Anesthesia and Analgesia 2002;94(2):404–8.
117. Lumbiganon P, Thinkhamrop J, Thinkhamrop B, Tolosa JE. Vaginal chlorhexidine during labour for preventing maternal and neonatal infections (excluding Group B Streptococcal and HIV). (Cochrane Review). In: Cochrane Database of Systematic Reviews, Issue 1, 2005. Oxford: Update Software.
118. Keane HE, Thornton JG. A trial of cetrimide/chlorhexidine or tap water for perineal cleaning. British Journal of Midwifery 1998;6(1):34–7.
119. Kovavisarach E, Jaravechson S. Comparison of perforation between single and double-gloving in perineorrhaphy after vaginal delivery: a randomized controlled trial. Australian and New Zealand Journal of Obstetrics and Gynaecology 1998;38(1):58–60.
120. Punyatanasakchai P, Chittacharoen A, Ayudhya NI. Randomized controlled trial of glove perforation in single- and double-gloving in episiotomy repair after vaginal delivery. Journal of Obstetrics and Gynaecology Research 2004;30(5):354–7.
121. Kabukoba JJ, Pearce JM. The design, effectiveness and acceptability of the arm sleeve for the prevention of body fluid contamination during obstetric procedures. BJOG: an international journal of obstetrics & gynaecology 1993;100(8):714–16.
122. Dickinson JE, Paech MJ, McDonald SJ, et al. Maternal satisfaction with childbirth and intrapartum analgesia in nulliparous labour. Australian and New Zealand Journal of Obstetrics and Gynaecology 2003;43(6):463–8.
123. Ranta P, Spalding M, Kangas-Saarela T, et al. Maternal expectations and experiences of labour pain – options of 1091 Finnish parturients. Acta Anaesthesiologica Scandinavica 1995;39(1):60–6.
124. Capogna G, Alahuhta S, Celleno D, et al. Maternal expectations and experiences of labour pain and analgesia: A multicentre study of nulliparous women. International Journal of Obstetric Anesthesia 1996;5(4):229–35.
125. Huntley AL, Coon JT, Ernst E. Complementary and alternative medicine for labor pain: a systematic review. American Journal of Obstetrics and Gynecology 2004;191(1):36–44.
126. Gilbert RE, Tookey PA. Perinatal mortality and morbidity among babies delivered in water: surveillance study and postal survey. British Medical Journal 1999;319(7208):483–7.
127. Beech BL. Waterbirth – time to move forward. Aims Journal 2000;12(2):1–2.
128. Cluett ER, Nikodem VC, McCandlish RE, Burns EE. Immersion in water in pregnancy, labour and birth. (Cochrane Review). In: Cochrane Database of Systematic Reviews, Issue 2, 2004. Oxford: Update Software.
129. Cluett ER, Pickering RM, Getliffe K, et al. Randomised controlled trial of labouring in water compared with standard of augmentation for management of dystocia in first stage of labour. British Medical Journal 2004;328(7435):314–18.
130. Eriksson M, Mattsson L, Ladfors L. Early or late bath during the first stage of labour: a randomised study of 200 women. Midwifery 1997;13(3):146–8.
131. Martensson L, Nyberg K, Wallin G. Subcutaneous versus intracutaneous injections of sterile water for labour analgesia: a comparison of perceived pain during administration. BJOG: an international journal of obstetrics & gynaecology 2000;107(10):1248–51.
132. Lee MK, Chang SB, Kang DH. Effects of SP6 acupressure on labor pain and length of delivery time in women during labor. Journal of Alternative and Complementary Medicine 2004;10(6):959–65.
133. Ramnero A, Hanson U, Kihlgren M. Acupuncture treatment during labour--a randomised controlled trial. BJOG: an international journal of obstetrics & gynaecology 2002;109(6):637–44.
134. Skilnand E, Fossen D, Heiberg E. Acupuncture in the management of pain in labor. Acta Obstetricia et Gynecologica Scandinavica 2002;81(10):943–8.
135. Nesheim BI, Kinge R, Berg B, et al. Acupuncture during labor can reduce the use of meperidine: a controlled clinical study. Clinical Journal of Pain 2003;19(3):187–91.
136. Cyna AM, McAuliffe GL, Andrew MI. Hypnosis for pain relief in labour and childbirth: a systematic review. British Journal of Anaesthesia 2004;93(4):505–11.
137. Smith CA, Collins CT, Cyna AM, Crowther CA. Complementary and alternative therapies for pain management in labour. (Cochrane Review). In: Cochrane Database of Systematic Reviews, Issue 2, 2005. Oxford: Update Software.
138. Phumdoung S, Good M. Music reduces sensation and distress of labor pain. Pain Management Nursing 2003;4(2):54–61.
139. Carroll D, Moore RA, Tramer MR, et al. Transcutaneous electrical nerve stimulation does not relieve labor pain: Updated systematic review. Contemporary Reviews in Obstetrics and Gynaecology 1997;9(3):195–205.
140. Rosen MA. Nitrous oxide for relief of labor pain: a systematic review. American Journal of Obstetrics and Gynecology 2002;186(5 Suppl Nature):S110–26.
141. Bricker L, Lavender T. Parenteral opioids for labor pain relief: a systematic review. American Journal of Obstetrics and Gynecology 2002;186(5 Suppl Nature):S94–109.
142. Elbourne D, Wiseman RA. Types of intra-muscular opiods for maternal pain relief in labour. (Cochrane Review). In: Cochrane Database of Systematic Reviews, Issue 3, 2000. Oxford: Update Software.
143. Tsui MH, Ngan Kee WD, Ng FF, et al. A double blinded randomised placebo-controlled study of intramuscular pethidine for pain relief in the first stage of labour. BJOG: an international journal of obstetrics & gynaecology 2004;111(7):648–55.
281
144. Keskin HL, Keskin EA, Avsar AF, et al. Pethidine versus tramadol for pain relief during labor. International Journal of Gynaecology and Obstetrics 2003;82(1):11–16.
145. Fairlie FM, Marshall L, Walker JJ, et al. Intramuscular opioids for maternal pain relief in labour: a randomised controlled trial comparing pethidine with diamorphine. BJOG: an international journal of obstetrics & gynaecology 1999;106(11):1181–7.
146. Sosa CG, Balaguer E, Alonso JG, et al. Meperidine for dystocia during the first stage of labor: A randomized controlled trial. American Journal of Obstetrics and Gynecology 2004;191(4):1212–18.
147. Soontrapa S, Somboonporn W, Komwilaisak R, et al. Effectiveness of intravenous meperidine for pain relief in the first stage of labour. Journal of the Medical Association of Thailand 2002;85(11):1169–75.
148. Olofsson C, Ekblom A, Ekman-Ordeberg G, et al. Analgesic efficacy of intravenous morphine in labour pain: A reappraisal. International Journal of Obstetric Anesthesia 1996;5(3):176–80.
149. Isenor L, Penny-MacGillivray T. Intravenous meperidine infusion for obstetric analgesia. Journal of Obstetric, Gynecologic and Neonatal Nursing 1993;22(4):349–56.
150. Nelson KE, Eisenach JC. Intravenous butorphanol, meperidine, and their combination relieve pain and distress in women in labor. Anesthesiology 2005;102(5):1008–13.
151. Blair JM, Dobson GT, Hill DA, et al. Patient controlled analgesia for labour: a comparison of remifentanil with pethidine. Anaesthesia 2005;60(1):22–7.
152. Volikas I, Male D. A comparison of pethidine and remifentanil patient-controlled analgesia in labour. International Journal of Obstetric Anesthesia 2001;10(2):86–90.
153. Morley-Forster PK, Reid DW, Vandeberghe H. A comparison of patient-controlled analgesia fentanyl and alfentanil for labour analgesia. Canadian Journal of Anaesthesia 2000;47(2):113–19.
154. McInnes RJ, Hillan E, Clark D, et al. Diamorphine for pain relief in labour : a randomised controlled trial comparing intramuscular injection and patient-controlled analgesia. BJOG: an international journal of obstetrics & gynaecology 2004;111(10):1081–9.
155. Thurlow JA, Laxton CH, Dick A, et al. Remifentanil by patient-controlled analgesia compared with intramuscular meperidine for pain relief in labour. British Journal of Anaesthesia 2002;88(3):374–8.
156. Anim-Somuah M, Smyth R, Howell C. Epidural versus non-epidural or no analgesia in labour. (Cochrane Review). In: Cochrane Database of Systematic Reviews, 2005. Oxford: Update Software.
157. Morgan-Ortiz F, Quintero-Ledezma JC, Perez-Sotelo JA, et al. Evolution and quality of care during labor and delivery in primiparous patients who underwent early obstetrical analgesia. [Spanish]. Ginecologia y Obstetricia de Mexico 1999;67:522–6.
158. Leighton BL, Halpern SH. The effects of epidural analgesia on labor, maternal, and neonatal outcomes: a systematic review. American Journal of Obstetrics and Gynecology 2002;186(5 Suppl Nature):S69–77.
159. Reynolds F, Sharma SK, Seed PT. Analgesia in labour and fetal acid-base balance: a meta-analysis comparing epidural with systemic opioid analgesia. BJOG: an international journal of obstetrics & gynaecology 2002;109(12):1344–53.
160. Philip J, Alexander JM, Sharma SK, et al. Epidural analgesia during labor and maternal fever. Anesthesiology 1999;90(5):1271–5.
161. Lieberman E, Davidson K, Lee-Parritz A, et al. Changes in fetal position during labor and their association with epidural analgesia. Obstetrics and Gynecology 2005;105(5 I):974–82.
162. Alexander JM, Sharma SK, McIntire DD, et al. Epidural analgesia lengthens the Friedman active phase of labor. Obstetrics and Gynecology 2002;100(1):46–50.
163. Macarthur A, MacArthur C, Weeks S. Epidural anaesthesia and low back pain after delivery: a prospective cohort study. British Medical Journal 1995;311(7016):1336–9.
164. Eriksson SL, Olausson PO, Olofsson C. Use of epidural analgesia and its relation to caesarean and instrumental deliveries-a population-based study of 94,217 primiparae. European Journal of Obstetrics, Gynecology and Reproductive Biology 2005; E-print ahead of print.
165. Capogna G, Celleno D, Lyons G, et al. Minimum local analgesic concentration of extradural bupivacaine increases with progression of labour. British Journal of Anaesthesia 1998;80(1):11–13.
166. Chen L-K, Hsu H-W, Lin C-J, et al. Effects of epidural fentanyl on labor pain during the early period of the first stage of induced labor in nulliparous women. Journal of the Formosan Medical Association 2000;99(7):549–53.
167. Chestnut DH, Vincent Jr RD, McGrath JM, et al. Does early administration of epidural analgesia affect obstetric outcome in nulliparous women who are receiving intravenous oxytocin? Anesthesiology 1994;80(6):1193–200.
168. Chestnut DH, McGrath JM, Vincent Jr RD, et al. Does early administration of epidural analgesia affect obstetric outcome in nulliparous women who are in spontaneous labor? Anesthesiology 1994;80(6):1201–8.
169. Luxman D, Wolman I, Groutz A, et al. The effect of early epidural block administration on the progression and outcome of labor. International Journal of Obstetric Anesthesia 1998;7(3):161–4.
170. Wong CA, Scavone BM, Peaceman AM, et al. The risk of cesarean delivery with neuraxial analgesia given early versus late in labor. New England Journal of Medicine 2005;352(7):655–65.
171. Ohel G, Gonen R, Vaida S, et al. Early versus late initiation of epidural analgesia in labor: does it increase the risk of cesarean section? A randomized trial. American Journal of Obstetrics and Gynecology 2006;194(3):600–5.
172. Hofmeyr GJ. Prophylactic intravenous preloading for regional analgesia in labour. (Cochrane Review). In: Cochrane Database of Systematic Reviews, Issue 3, 2000. Oxford: Update Software.
173. Mayberry LJ, Clemmens D, De A. Epidural analgesia side effects, co-interventions, and care of women during childbirth: a systematic review. American Journal of Obstetrics and Gynecology 2002;186(5 Suppl Nature):S81-S93.
174. Roberts CL, Algert CS, Olive E. Impact of first-stage ambulation on mode of delivery among women with epidural analgesia. Australian and New Zealand Journal of Obstetrics and Gynaecology 2004;44(6):489–94.
175. Roberts CL, Algert CS, Cameron CA. A meta-analysis of upright positions in the second stage to reduce instrumental deliveries in women with epidural analgesia. Acta Obstetricia et Gynecologica Scandinavica 2005;84(8):794–8.
176. Downe S, Gerrett D, Renfrew MJ. A prospective randomised trial on the effect of position in the passive second stage of labour on birth outcome in nulliparous women using epidural analgesia. Midwifery 2004;20(2):157–68.
177. Torvaldsen S, Roberts CL, Bell JC, Raynes-Greenow CH. Discontinuation of epidural analgesia late in labour for reducing the adverse delivery outcomes associated with epidural analgesia. (Cochrane Review). In: Cochrane Database of Systematic Reviews, Issue Oxford, 2005. Oxford: Update Software.
References

282
Intrapartum care
178. Roberts CL, Torvaldsen S, Cameron CA, et al. Delayed versus early pushing in women with epidural analgesia: a systematic review and meta-analysis. BJOG: an international journal of obstetrics & gynaecology 2004;111(12):1333–40.
179. Simpson KR, James DC. Effects of immediate versus delayed pushing during second-stage labor on fetal well-being: a randomized clinical trial. Nursing Research 2005;54(3):149–57.
180. Gleeson NC, Griffith AP. The management of the second stage of labour in primiparae with epidural analgesia. British Journal of Clinical Practice 1991;45(2):90–1.
181. Saunders NJ, Spiby H, Gilbert L, et al. Oxytocin infusion during second stage of labour in primiparous women using epidural analgesia: a randomised double blind placebo controlled trial. British Medical Journal 1989;299(6713):1423–6.
182. Hill JB, Alexander JM, Sharma SK, et al. A comparison of the effects of epidural and meperidine analgesia during labor on fetal heart rate. Obstetrics and Gynecology 2003;102(2):333–7.
183. Sharma SK, Alexander JM, Messick G, et al. Cesarean delivery: a randomized trial of epidural analgesia versus intravenous meperidine analgesia during labor in nulliparous women. Anesthesiology 2002;96(3):546–51.
184. Sharma SK, Sidawi JE, Ramin SM, et al. Cesarean delivery: a randomized trial of epidural versus patient-controlled meperidine analgesia during labor. Anesthesiology 1997;87(3):487–94.
185. Mardirosoff C, Dumont L, Boulvain M, et al. Fetal bradycardia due to intrathecal opioids for labour analgesia: a systematic review. BJOG: an international journal of obstetrics & gynaecology 2002;109(3):274–81.
186. Beilin Y, Bodian CA, Weiser J, et al. Effect of labor epidural analgesia with and without fentanyl on infant breast-feeding: a prospective, randomized, double-blind study. Anesthesiology 2005;103(6):1211–17.
187. Jordan S, Emery S, Bradshaw C, et al. The impact of intrapartum analgesia on infant feeding. BJOG: an international journal of obstetrics & gynaecology 2005;112(7):927–34.
188. Chua SM, Sia AT. Automated intermittent epidural boluses improve analgesia induced by intrathecal fentanyl during labour. Canadian Journal of Anaesthesia 2004;51(6):581–5.
189. D’Athis F, Macheboeuf M, Thomas H, et al. Epidural analgesia with a bupivacaine-fentanyl mixture in obstetrics: comparison of repeated injections and continuous infusion. Canadian Journal of Anaesthesia 1988;35(2):116–22.
190. Eddleston JM, Maresh M, Horsman EL, et al. Comparison of the maternal and fetal effects associated with intermittent or continuous infusion of extradural analgesia. British Journal of Anaesthesia 1992;69(2):154–8.
191. Hicks JA, Jenkins JG, Newton MC, et al. Continuous epidural infusion of 0.075% bupivacaine for pain relief in labour. A comparison with intermittent top-ups of 0.5% bupivacaine. Anaesthesia 1988;43(4):289–92.
192. Lamont RF, Pinney D, Rodgers P, et al. Continuous versus intermittent epidural analgesia. A randomised trial to observe obstetric outcome. Anaesthesia 1989;44(11):893–6.
193. Smedstad KG, Morison DH. A comparative study of continuous and intermittent epidural analgesia for labour and delivery. Canadian Journal of Anaesthesia 1988;35(3):234–41.
194. Wong CA, Ratliff JT, Sullivan JT, et al. A randomized comparison of programmed intermittent epidural bolus with continuous epidural infusion for labor analgesia. Anesthesia and Analgesia 2006;102(3):904–9.
195. Lim Y, Sia AT, Ocampo C. Automated regular boluses for epidural analgesia: a comparison with continuous infusion. International Journal of Obstetric Anesthesia 2005;14(4):305–9.
196. van der Vyver M, Halpern S, Joseph G. Patient-controlled epidural analgesia versus continuous infusion for labour analgesia: a meta-analysis. British Journal of Anaesthesia 2002;89(3):459–65.
197. Saito M, Okutomi T, Kanai Y, et al. Patient-controlled epidural analgesia during labor using ropivacaine and fentanyl provides better maternal satisfaction with less local anesthetic requirement. Journal of Anesthesia 2005;19(3):208–12.
198. Gambling DR, McMorland GH, Yu P, et al. Comparison of patient-controlled epidural analgesia and conventional intermittent ‘top-up’ injections during labor. Anesthesia and Analgesia 1990;70(3):256–61.
199. Paech MJ. Epidural analgesia in labour: Constant infusion plus patient-controlled boluses. Anaesthesia and Intensive Care 1991;19(1):32–9.
200. Paech MJ, Pavy TJG, Sims C, et al. Clinical experience with patient-controlled and staff-administered intermittent bolus epidural analgesia in labour. Anaesthesia and Intensive Care 1995;23(4):459–63.
201. Halonen P, Sarvela J, Saisto T, et al. Patient-controlled epidural technique improves analgesia for labor but increases cesarean delivery rate compared with the intermittent bolus technique. Acta Anaesthesiologica Scandinavica 2004;48(6):732–7.
202. Gambling DR, Huber CJ, Berkowitz J, et al. Patient-controlled epidural analgesia in labour: varying bolus dose and lockout interval. Canadian Journal of Anaesthesia 1993;40(3):211–17.
203. Bernard JM, Le RD, Vizquel L, et al. Patient-controlled epidural analgesia during labor: the effects of the increase in bolus and lockout interval. Anesthesia and Analgesia 2000;90(2):328–32.
204. Siddik-Sayyid SM, Aouad MT, Jalbout MI, et al. Comparison of three modes of patient-controlled epidural analgesia during labour. European Journal of Anaesthesiology 2005;22(1):30–4.
205. Stratmann G, Gambling DR, Moeller-Bertram T, et al. A randomized comparison of a five-minute versus fifteen-minute lockout interval for PCEA during labor. International Journal of Obstetric Anesthesia 2005;14(3):200–7.
206. Anonymous. Review of recommendations for labor and birth care. American Family Physician 1992;45(2):927.
207. Hughes D, Simmons SW, Brown J, Cyna AM. Combined spinal-epidural versus epidural analgesia in labour. (Cochrane Review). In: Cochrane Database of Systematic Reviews, Issue Oxford, 2005. Oxford: Update Software.
208. Zeidan AZ. Combined spinal-epidural compared with low dose epidural during ambulatory labour analgesia in nulliparous women. Egyptian Journal of Anaesthesia 2004;20(3):273–81.
209. MacArthur C. A randomised controlled trial of mobile and non-mobile techniques of regional analgesia for labour, evaluating short and long term outcomes [www.ReFeR.nhs.uk/ViewRecord.asp?ID=1210], 2004.
210. Wong CA, Scavone BM, Slavenas JP, et al. Efficacy and side effect profile of varying doses of intrathecal fentanyl added to bupivacaine for labor analgesia. International Journal of Obstetric Anesthesia 2004;13(1):19–24.
211. Lim Y, Sia AT, Ocampo CE. Comparison of intrathecal levobupivacaine with and without fentanyl in combined spinal epidural for labor analgesia. Medical Science Monitor 2004;10(7):I87–91.
212. Bucklin BA, Chestnut DH, Hawkins JL. Intrathecal opioids versus epidural local anesthetics for labor analgesia: a meta-analysis. Regional Anesthesia and Pain Medicine 2002;27(1):23–30.

283
213. Chan SY, Chiu JW. Intrathecal labor analgesia using levobupivacaine 2.5 mg with fentanyl 25 microg--would half the dose suffice? Medical Science Monitor 2004;10(10):I110–14.
214. Lee BB, Ngan Kee WD, Hung VY, et al. Combined spinal-epidural analgesia in labour: comparison of two doses of intrathecal bupivacaine with fentanyl. British Journal of Anaesthesia 1999;83(6):868–71.
215. Palmer CM, Cork RC, Hays R, et al. The dose-response relation of intrathecal fentanyl for labor analgesia. Anesthesiology 1998;88(2):355–61.
216. Stocks GM, Hallworth SP, Fernando R, et al. Minimum local analgesic dose of intrathecal bupivacaine in labor and the effect of intrathecal fentanyl. Anesthesiology 2001;94(4):593–8.
217. Palmer CM, Van Maren G, Nogami WM, et al. Bupivacaine augments intrathecal fentanyl for labor analgesia. Anesthesiology 1999;91(1):84–9.
218. Celeski DC, Heindel L, Haas J, et al. Effect of intrathecal fentanyl dose on the duration of labor analgesia. AANA Journal 1999;67(3):239–44.
219. Beilin Y, Galea M, Zahn J, et al. Epidural ropivacaine for the initiation of labor epidural analgesia: a dose finding study. Anesthesia and Analgesia 1999;88(6):1340–5.
220. Christiaens F, Verborgh C, Dierick A, et al. Effects of diluent volume of a single dose of epidural bupivacaine in parturients during the first stage of labor. Regional Anesthesia and Pain Medicine 1998;23(2):134–41.
221. Plaat FS, Royston P, Morgan BM. Comparison of 15 mg and 25 mg of bupivacaine both with 50 mug fentanyl as initial dose for epidural analgesia. International Journal of Obstetric Anesthesia 1996;5(4):240–3.
222. Comparative Obstetric Mobile Epidural Trial (COMET) Study Group. Effect of low-dose mobile versus traditional epidural techniques on mode of delivery: a randomised controlled trial. Lancet 2001;358(9275):19–23.
223. Huch A, Huch R. Physiological insights based on fetal tcPO2 monitoring. Journal of Perinatal Medicine 1981;9(4):184–8.
224. Elliott RD. Continuous infusion epidural analgesia for obstetrics: Bupivacaine versus bupivacaine-fentanyl mixture. Canadian Journal of Anaesthesia 1991;38(3):303–10.
225. Enever GR, Noble HA, Kolditz D, et al. Epidural infusion of diamorphine with bupivacaine in labour. A comparison with fentanyl and bupivacaine. Anaesthesia 1991;46(3):169–73.
226. Russell R, Quinlan J, Reynolds F. Motor block during epidural infusions for nulliparous women in labour. A randomized double-blind study of plain bupivacaine and low dose bupivacaine with fentanyl. International Journal of Obstetric Anesthesia 1995;4(2):82–8.
227. Russell R, Reynolds F. Epidural infusion of low-dose bupivacaine and opioid in labour: Does reducing motor block increase the spontaneous delivery rate? Anaesthesia 1996;51(3):266–73.
228. Reynolds F, Russell R, Porter J, et al. Does the use of low dose bupivacaine/opioid epidural infusion increase the normal delivery rate? International Journal of Obstetric Anesthesia 2003;12(3):156–63.
229. Porter J, Bonello E, Reynolds F. Effect of epidural fentanyl on neonatal respiration. [Erratum appears in Anesthesiology 1998 Dec;89(6):1615]. Anesthesiology 1998;89(1):79–85.
230. Chestnut DH, Owen CL, Bates JN, et al. Continuous infusion epidural analgesia during labor. A randomized, double-blind comparison of 0.0625% bupivacaine/0.0002% fentanyl versus 0.125% bupivacaine. Anesthesiology 1988;68(5):754–9.
231. Burke D, Henderson DJ, Simpson AM, et al. Comparison of 0.25% S(-)-bupivacaine with 0.25% RS-bupivacaine for epidural analgesia in labour. British Journal of Anaesthesia 1999;83(5):750–5.
232. Camorcia M, Capogna G, Columb MO. Minimum local analgesic doses of ropivacaine, levobupivacaine, and bupivacaine for intrathecal labor analgesia. Anesthesiology 2005;102(3):646–50.
233. El-Moutaz H, El-Said A, Fouad M. Comparative study between 0.25% levobupivacaine and 0.25% racemic bupivacaine for epidural analgesia in labour. Egyptian Journal of Anaesthesia 2003;19(4):417–21.
234. Lim Y, Ocampo CE, Sia AT. A comparison of duration of analgesia of intrathecal 2.5 mg of bupivacaine, ropivacaine, and levobupivacaine in combined spinal epidural analgesia for patients in labor. Anesthesia and Analgesia 2004;98(1):235–9.
235. Lyons G, Columb M, Wilson RC, et al. Epidural pain relief in labour: potencies of levobupivacaine and racemic bupivacaine. [erratum appears in Br J Anaesth 1999;82(3):488]. British Journal of Anaesthesia 1998;81(6):899–901.
236. Sah N, Vallejo MC, Ramanathan S, et al. Bupivacaine versus L-bupivacaine for labor analgesia via combined spinal-epidural: A randomized, double-blinded study. Journal of Clinical Anesthesia 2005;17(2):91–5.
237. Polley LS, Columb MO, Naughton NN, et al. Relative analgesic potencies of levobupivacaine and ropivacaine for epidural analgesia in labor. Anesthesiology 2003;99(6):1354–8.
238. Benhamou D, Ghosh C, Mercier FJ. A randomized sequential allocation study to determine the minimum effective analgesic concentration of levobupivacaine and ropivacaine in patients receiving epidural analgesia for labor. Anesthesiology 2003;99(6):1383–6.
239. Purdie NL, McGrady EM. Comparison of patient-controlled epidural bolus administration of 0.1% ropivacaine and 0.1% levobupivacaine, both with 0.0002% fentanyl, for analgesia during labour. Anaesthesia 2004;59(2):133–7.
240. Sia AT, Goy RW, Lim Y, et al. A comparison of median effective doses of intrathecal levobupivacaine and ropivacaine for labor analgesia. Anesthesiology 2005;102(3):651–6.
241. Supandji M, Sia ATH, Ocampo CE. 0.2% Ropivacaine and levobupivacaine provide equally effective epidural labour analgesia. Canadian Journal of Anaesthesia 2004;51(9):918–22.
242. Asik I, Goktug A, Gulay I, et al. Comparison of bupivacaine 0.2% and ropivacaine 0.2% combined with fentanyl for epidural analgesia during labour. European Journal of Anaesthesiology 2002;19(4):263–70.
243. Campbell DC, Zwack RM, Crone LA, et al. Ambulatory labor epidural analgesia: bupivacaine versus ropivacaine. Anesthesia and Analgesia 2000;90(6):1384–9.
244. Chua NP, Sia AT, Ocampo CE. Parturient-controlled epidural analgesia during labour: Bupivacaine vs. ropivacaine. Anaesthesia 2001;56(12):1169–73.
245. Dresner M, Freeman J, Calow C, et al. Ropivacaine 0.2% versus bupivacaine 0.1% with fentanyl: a double blind comparison for analgesia during labour. British Journal of Anaesthesia 2000;85(6):826–9.
246. Eddleston JM, Holland JJ, Griffin RP, et al. A double-blind comparison of 0.25% ropivacaine and 0.25% bupivacaine for extradural analgesia in labour. British Journal of Anaesthesia 1996;76(1):66–71.
247. Evron S, Glezerman M, Sadan O, et al. Patient-controlled epidural analgesia for labor pain: Effect on labor, delivery and neonatal outcome of 0.125% bupivacaine vs 0.2% ropivacaine. International Journal of Obstetric Anesthesia 2004;13(1):5–10.
References

284
Intrapartum care
248. Fernandez-Guisasola J, Serrano ML, Cobo B, et al. A comparison of 0.0625% bupivacaine with fentanyl and 0.1% ropivacaine with fentanyl for continuous epidural labor analgesia. Anesthesia and Analgesia 2001;92(5):1261–5.
249. Finegold H, Mandell G, Ramanathan S. Comparison of ropivacaine 0.1%-fentanyl and bupivacaine 0.125%-fentanyl infusions for epidural labour analgesia. Canadian Journal of Anaesthesia 2000;47(8):740–5.
250. Gaiser RR, Venkateswaren P, Cheek TG, et al. Comparison of 0.25% Ropivacaine and bupivacaine for epidural analgesia for labor and vaginal delivery. Journal of Clinical Anesthesia 1997;9(7):564–8.
251. Halpern SH, Breen TW, Campbell DC, et al. A multicenter, randomized, controlled trial comparing bupivacaine with ropivacaine for labor analgesia. Anesthesiology 2003;98(6):1431–5.
252. Hughes D, Hill D, Fee JP. Intrathecal ropivacaine or bupivacaine with fentanyl for labour. British Journal of Anaesthesia 2001;87(5):733–7.
253. Irestedt L, Ekblom A, Olofsson C, et al. Pharmacokinetics and clinical effect during continuous epidural infusion with ropivacaine 2.5 mg/ml or bupivacaine 2.5 mg/ml for labour pain relief. Acta Anaesthesiologica Scandinavica 1998;42(8):890–6.
254. Lee BB, Ngan Kee WD, Ng FF, et al. Epidural Infusions of Ropivacaine and Bupivacanie for Labor Analgesia: A Randomized, Double-Blind Study of Obstetric Outcome. Anesthesia and Analgesia 2004;98(4):1145–52.
255. McCrae AF, Jozwiak H, McClure JH. Comparison of ropivacaine and bupivacaine in extradural analgesia for the relief of pain in labour. British Journal of Anaesthesia 1995;74(3):261–5.
256. McCrae AF, Westerling P, McClure JH. Pharmacokinetic and clinical study of ropivacaine and bupivacaine in women receiving extradural analgesia in labour. British Journal of Anaesthesia 1997;79(5):558–62.
257. Meister GC, D’Angelo R, Owen M, et al. A comparison of epidural analgesia with 0.125% ropivacaine with fentanyl versus 0.125% bupivacaine with fentanyl during labor. Anesthesia and Analgesia 2000;90(3):632–7.
258. Merson N. A comparison of motor block between ropivacaine and bupivacaine for continuous labor epidural analgesia. AANA Journal 2001;69(1):54–8.
259. Muir HA, Writer D, Douglas J, et al. Double-blind comparison of epidural ropivacaine 0.25% and bupivacaine 0.25%, for the relief of childbirth pain. Canadian Journal of Anaesthesia 1997;44(6):599–604.
260. Owen MD, D’Angelo R, Gerancher JC, et al. 0.125% ropivacaine is similar to 0.125% bupivacaine for labor analgesia using patient-controlled epidural infusion. Anesthesia and Analgesia 1998;86(3):527–31.
261. Owen MD, Thomas JA, Smith T, et al. Ropivacaine 0.075% and Bupivacaine 0.075% with Fentanyl 2 mug/mL are equivalent for labor epidural analgesia. Anesthesia and Analgesia 2002;94(1):179–83.
262. Parpaglioni R, Capogna G, Celleno D. A comparison between low-dose ropivacaine and bupivacaine at equianalgesic concentrations for epidural analgesia during the first stage of labor. International Journal of Obstetric Anesthesia 2000;9(2):83–6.
263. Pirbudak L, Tuncer S, Kocoglu H, et al. Fentanyl added to bupivacaine 0.05% or ropivacaine 0.05% in patient-controlled epidural analgesia in labour. European Journal of Anaesthesiology 2002;19(4):271–5.
264. Shah MK, Sia ATH, Chong JL. The effect of the addition of ropivacaine or bupivacaine upon pruritus induced by intrathecal fentanyl in labour. Anaesthesia 2000;55(10):1003–13.
265. Stienstra R, Jonker TA, Bourdrez P, et al. Ropivacaine 0.25% versus bupivacaine 0.25% for continuous epidural analgesia in labor: A double-blind comparison. Anesthesia and Analgesia 1995;80(2):285–9.
266. Bolukbasi D, Sener EB, Sarihasan B, et al. Comparison of maternal and neonatal outcomes with epidural bupivacaine plus fentanyl and ropivacaine plus fentanyl for labor analgesia. International Journal of Obstetric Anesthesia 2005;14(4):288–93.
267. Beilin Y, Nair A, Arnold I, et al. A comparison of epidural infusions in the combined spina epidural technique for labor analgesia. Anesthesia and Analgesia 2002;94(4):927–32.
268. Benhamou D, Hamza J, Eledjam J-J, et al. Continuous extradural infusion of ropivacaine 2 mg ml-1 for pain relief during labour. British Journal of Anaesthesia 1997;78(6):748–50.
269. Bernard JM, Le RD, Frouin J. Ropivacaine and fentanyl concentrations in patient-controlled epidural analgesia during labor: a volume-range study. Anesthesia and Analgesia 2003;97(6):1800–7.
270. Cascio MG, Gaiser RR, Camann WR, et al. Comparative evaluation of four different infusion rates of ropivacaine (2 mg/mL) for epidural labor analgesia. Regional Anesthesia and Pain Medicine 1998;23(6):548–53.
271. Ewen A, McLeod DD, MacLeod DM. Continuous infusion epidural analgesia in obstetrics. A comparison of 0.08% and 0.25% bupivacaine. Anaesthesia 1986;41(2):143–7.
272. Li DF, Rees GA, Rosen M. Continuous extradural infusion of 0.0625% or 0.125% bupivacaine for pain relief in primigravid labour. British Journal of Anaesthesia 1985;57(3):264–70.
273. Noble HA, Enever GR, Thomas TA. Epidural bupivacaine dilution for labour. A comparison of three concentrations infused with a fixed dose of fentanyl. Anaesthesia 1991;46(7):549–52.
274. Stoddart AP, Nicholson KEA, Popham PA. Low dose bupivacaine/fentanyl epidural infusions in labour and mode of delivery. Anaesthesia 1994;49(12):1087–90.
275. Thorburn J, Moir DD. Extradural analgesia: The influence of volume and concentration of bupivacaine on the mode of delivery, analgesic efficacy and motor block. British Journal of Anaesthesia 1981;53(9):933–9.
276. Sia AT, Ruban P, Chong JL, et al. Motor blockade is reduced with ropivacaine 0.125% for parturient-controlled epidural analgesia during labour. Canadian Journal of Anaesthesia 1999;46(11):1019–23.
277. Kilpatrick SJ, Laros RK. Characteristics of normal labor. Obstetrics and Gynecology 1989;74(1):85–7.
278. Chelmow D, Kilpatrick SJ, Laros RK, Jr. Maternal and neonatal outcomes after prolonged latent phase. Obstetrics and Gynecology 1993;81(4):486–91.
279. Friedman EA. The graphic analysis of labor. American Journal of Obstetrics and Gynecology 1954;68(6):1568–75.
280. Gross MM, Drobnic S, Keirse MJN. Influence of fixed and time-dependent factors on duration of normal first stage labor. Birth 2005;32(1):27–33.
281. Chamberlain G, Steer P. Turnbull’s Obstetrics. 3rd ed. London: Harcourt; 2001.
282. Albers LL, Schiff M, Gorwoda JG. The length of active labor in normal pregnancies. Obstetrics and Gynecology 1996;87(3):355–9.
283. Albers LL. The duration of labor in healthy women. Journal of Perinatology 1999;19(2):114–19.
284. Zhang J, Troendle JF, Yancey MK. Reassessing the labor curve in nulliparous women. American Journal of Obstetrics and Gynecology 2002;187(4):824–8.
285
285. World Health Organization and Department of Reproductive Health. Care in Normal Birth: a practical guide. Report of a technical working group. Geneva: World Health Organization; 1999.
286. Lederman RP, Lederman E, Work BA Jr. et al. The relationship of maternal anxiety, plasma catecholamines, and plasma cortisol to progress in labor. American Journal of Obstetrics and Gynecology 1978;132(5):495–500.
287. Sharma V, Smith A, Khan M. The relationship between duration of labour, time of delivery, and puerperal psychosis. Journal of Affective Disorders 2004;83(2–3):215–20.
288. Mahon TR, Chazotte C, Cohen WR. Short labor: characteristics and outcome. Obstetrics and Gynecology 1994;84(1):47–51.
289. Abitbol MM, Castillo I, Udom-Rice I, et al. Maternal complications following prolonged or arrested labor. Journal of Maternal-Fetal Investigation 1994;4(1):9–13.
290. Lavender T, Hart A, Walkinshaw S, et al. Progress of first stage of labour for multiparous women: an observational study. BJOG: an international journal of obstetrics & gynaecology 2005;112(12):1663–5.
291. Maul H, Maner WL, Olson G, et al. Non-invasive transabdominal uterine electromyography correlates with the strength of intrauterine pressure and is predictive of labor and delivery. Journal of Maternal-Fetal and Neonatal Medicine 2004;15(5):297–301.
292. Blix E, Reiner LM, Klovning A, et al. Prognostic value of the labour admission test and its effectiveness compared with auscultation only: a systematic review. BJOG: an international journal of obstetrics & gynaecology 2005;112(12):1595–604.
293. McNiven PS, Wiliams JI, Hodnett E, et al. An early labour assessment program: a randomised controlled trial. Birth 1998;25(1):5–10.
294. Holmes P, Oppenheimer LW, Wen SW. The relationship between cervical dilatation at initial presentation in labour and subsequent intervention. BJOG: an international journal of obstetrics & gynaecology 2001;108(11):1120–4.
295. Klein MC, Kelly A, Kaczorowski J, et al. The effect of family physician timing of maternal admission on procedures in labour and maternal and infant morbidity. Journal of Obstetrics and Gynaecology Canada 2004;26(7):641–5.
296. Bailit JL, Dierker L, Blanchard MH, et al. Outcomes of women presenting in active versus latent phase of spontaneous labor. Obstetrics and Gynecology 2005;105(1):77–9.
297. Janssen PA, Iker CE, Carty EA. Early labour assessment and support at home: a randomized controlled trial. Journal of Obstetrics and Gynaecology Canada 2003;25(9):734–41.
298. Abukhalil IH, Kilby MD, Aiken J, et al. Can the frequency of vaginal examinations influence the duration of labour? A prospective randomised study. Journal of Obstetrics and Gynaecology 1996;16(1):22–5.
299. Ahlden S, Andersch B, Stigsson L, et al. Prediction of sepsis neonatorum following a full-term pregnancy. Gynecologic and Obstetric Investigation 1988;25(3):181–5.
300. Seaward PG, Hannah ME, Myhr TL, et al. International multicenter term PROM study: evaluation of predictors of neonatal infection in infants born to patients with premature rupture of membranes at term. Premature Rupture of the Membranes. American Journal of Obstetrics and Gynecology 1998;179(3 Pt 1):635–9.
301. Anonymous. World Health Organization partograph in management of labour. World Health Organization Maternal Health and Safe Motherhood Programme. Lancet 1994;343(8910):1399–404.
302. Lavender T, Alfirevic Z, Walkinshaw S. Partogram action line study: a randomised trial. BJOG: an international journal of obstetrics & gynaecology 1998;105(9):976–80.
303. Pattinson RC, Howarth GR, Mdluli W, et al. Aggressive or expectant management of labour: a randomised clinical trial. BJOG: an international journal of obstetrics & gynaecology 2003;110(5):457–61.
304. Price DD, Harkins SW, Baker C. Sensory-affective relationships among different types of clinical and experimental pain. Pain 1987;28(3):297–307.
305. Bonnel AM, Boureau F. Labor pain assessment: Validity of a behavioral index. Pain 1985;22(1):81–90.
306. Brown ST, Campbell D, Kurtz A. Characteristics of labor pain at two stages of cervical dilation. Pain 1989;38(3):289–95.
307. Gross MM, Hecker H, Keirse MJ. An evaluation of pain and “fitness” during labor and its acceptability to women. Birth 2005;32(2):122–8.
308. Beilin Y, Hossain S, Bodian CA. The numeric rating scale and labor epidural analgesia. Anesthesia and Analgesia 2003;96(6):1794–8.
309. Sittner B, Hudson DB, Grossman CC, et al. Adolescents’ perceptions of pain during labor. Clinical Nursing Research 1998;7(1):82–93.
310. Revill SI, Robinson JO, Rosen M, et al. The reliability of a linear analogue for evaluating pain. Anaesthesia 1976;31(9):1191–8.
311. Wuitchik M, Bakal D, Lipshitz J. The clinical significance of pain and cognitive activity in latent labor. Obstetrics and Gynecology 1989;73(1):35–42.
312. Baker A, Ferguson SA, Roach GD, et al. Perceptions of labour pain by mothers and their attending midwives. Journal of Advanced Nursing 2001;35(2):171–9.
313. Lowe NK, Roberts JE. The convergence between in-labor report and postpartum recall of parturition pain. [Erratum appears in Res Nurs Health 1988;11(3):following 209]. Research in Nursing and Health 1988;11(1):11–21.
314. Niven C, Gijsbers K. A study of labour pain using the McGill Pain Questionnaire. Social Science and Medicine 1984;19(12):1347–51.
315. Sheiner EK, Sheiner E, Shoham-Vardi I, et al. Ethnic differences influence care giver’s estimates of pain during labour. Pain 1999;81(3):299–305.
316. Frigoletto FD, Jr., Lieberman E, Lang JM, et al. A clinical trial of active management of labor. New England Journal of Medicine 1995;333(12):745–50.
317. Rogers R, Gilson GJ, Miller AC, et al. Active management of labor: Does it make a difference? American Journal of Obstetrics and Gynecology 1997;177(3):599–605.
318. Sadler LC, Davison T, McCowan LM. A randomised controlled trial and meta-analysis of active management of labour. BJOG: an international journal of obstetrics & gynaecology 2000;107(7):909–15.
319. Tabowei TO, Oboro VO. Active management of labour in a district hospital setting. Journal of Obstetrics and Gynaecology 2003;23(1):9–12.
320. Lavender T, Alfirevic Z, Walkinshaw S. Effect of different partogram action lines on birth outcomes: A randomized controlled trial. Obstetrics and Gynecology 2006;108(2):295–302.
References
286
Intrapartum care
321. Cammu H, Van Eeckhout E. A randomised controlled trial of early versus delayed use of amniotomy and oxytocin infusion in nulliparous labour. BJOG: an international journal of obstetrics & gynaecology 1996;103(4):313–18.
322. Lopez-Zeno JA, Peaceman AM, Adashek JA, et al. A controlled trial of a program for the active management of labor. New England Journal of Medicine 1992;326(7):450–4.
323. Cohen GR, O’Brien WF, Lewis L, et al. A prospective randomized study of the aggressive management of early labor. American Journal of Obstetrics and Gynecology 1987;157(5):1174–7.
324. Alfirevic Z, Devane D, Gyte G. Continuous cardiotocography (CTG) monitoring for fetal assessment during labour. (Cochrane Review). In: Cochrane Database of Systematic Reviews, 2005. Oxford: Update Software.
325. Mahomed K, Nyoni R, Mulambo T, et al. Randomised controlled trial of intrapartum fetal heart rate monitoring. British Medical Journal 1994;308(6927):497–500.
326. Cheng YW, Hopkins LM, Caughey AB. How long is too long: does a prolonged second stage of labor in nulliparous women affect maternal and neonatal outcomes? American Journal of Obstetrics and Gynecology 2004;191(3):933–8.
327. Myles TD, Santolaya J. Maternal and neonatal outcomes in patients with a prolonged second stage of labor. Obstetrics and Gynecology 2003;102(1):52–8.
328. Janni W, Schiessl B, Peschers U, et al. The prognostic impact of a prolonged second stage of labor on maternal and fetal outcome. Acta Obstetricia et Gynecologica Scandinavica 2002;81(3):214–21.
329. Kuo YC, Chen CP, Wang KG. Factors influencing the prolonged second stage and the effects on perinatal and maternal outcomes. Journal of Obstetrics and Gynaecology Research 1996;22(3):253–7.
330. van Kessel K, Reed S, Newton K, et al. The second stage of labor and stress urinary incontinence. American Journal of Obstetrics and Gynecology 2001;184(7):1571–5.
331. Menticoglou SM, Manning F, Harman C, et al. Perinatal outcome in relation to second-stage duration. American Journal of Obstetrics and Gynecology 1995;173(3 Part 1):906–12.
332. Saunders NS, Paterson CM, Wadsworth J. Neonatal and maternal morbidity in relation to the length of the second stage of labour. BJOG: an international journal of obstetrics & gynaecology 1992;99(5):381–5.
333. Paterson CM, Saunders NS, Wadsworth J. The characteristics of the second stage of labour in 25,069 singleton deliveries in the North West Thames Health Region, 1988. BJOG: an international journal of obstetrics & gynaecology 1992;99(5):377–80.
334. Moon JM, Smith CV, Rayburn WF. Perinatal outcome after a prolonged second stage of labor. Journal of Reproductive Medicine 1990;35(3):229–31.
335. Cohen WR. Influence of the duration of second stage labor on perinatal outcome and puerperal morbidity. Obstetrics and Gynecology 1977;49(3):266–9.
336. Gupta JK, Hofmeyr GJ. Position in the second stage of labour for women without epidural anaesthesia. (Cochrane Review). In: Cochrane Database of Systematic Reviews, 2005. Oxford: Update Software.
337. Albers LL, Anderson D, Cragin L, et al. Factors related to perineal trauma in childbirth. Journal of Nurse-Midwifery 1996;41(4):269–76.
338. Stremler R, Hodnett E, Petryshen P, et al. Randomized controlled trial of hands-and-knees positioning for occipitoposterior position in labor. Birth 2005;32(4):243–51.
339. Ragnar I, Altman D, Tyden T, et al. Comparison of the maternal experience and duration of labour in two upright delivery positions – A randomised controlled trial. BJOG: an international journal of obstetrics & gynaecology 2006;113(2):165–70.
340. Bloom SL, Casey BM, Schaffer JI, et al. A randomized trial of coached versus uncoached maternal pushing during the second stage of labor. American Journal of Obstetrics and Gynecology 2006;194(1):10–13.
341. Schaffer JI, Bloom SL, Casey BM, et al. A randomized trial of the effects of coached vs uncoached maternal pushing during the second stage of labor on postpartum pelvic floor structure and function. American Journal of Obstetrics and Gynecology 2005;192(5):1692–6.
342. Parnell C, Langhoff-Roos J, Iversen R, et al. Pushing method in the expulsive phase of labor. A randomized trial. Acta Obstetricia et Gynecologica Scandinavica 1993;72(1):31–5.
343. Thomson AM. Pushing techniques in the second stage of labour. Journal of Advanced Nursing 1993;18(2):171–7.
344. Knauth DG, Haloburdo EP. Effect of pushing techniques in birthing chair on length of second stage of labor. Nursing Research 1986;35(1):49–51.
345. Stamp G, Kruzins G, Crowther C. Perineal massage in labour and prevention of perineal trauma: randomised controlled trial. British Medical Journal 2001;322(7297):1277–80.
346. McCandlish R, Bowler U, van Asten H, et al. A randomised controlled trial of care of the perineum during second stage of normal labour. BJOG: an international journal of obstetrics & gynaecology 1998;105(12):1262–72.
347. Mayerhofer K, Bodner-Adler B, Bodner K, et al. Traditional care of the perineum during birth. A prospective, randomized, multicenter study of 1,076 women. Journal of Reproductive Medicine 2002;47(6):477–82.
348. Albers LL, Sedler KD, Bedrick EJ, et al. Midwifery care measures in the second stage of labor and reduction of genital tract trauma at birth: A randomized trial. Journal of Midwifery and Women’s Health 2005;50(5):365–72.
349. Sanders J, Peters TJ, Campbell R. Does lidocaine spray reduce perineal pain during spontaneous vaginal delivery? A randomised controlled trial. Current Controlled Trials 2006 [www.controlled-trials.com/isrctn/trial/ISRCTN99732966/0/99732966.html].
350. Carroli G, Belizan J. Episiotomy for vaginal birth. (Cochrane Review). In: Cochrane Database of Systematic Reviews, Issue 3, 1998. Oxford: Update Software.
351. Hartmann K, Viswanathan M, Palmieri R, et al. Outcomes of routine episiotomy: a systematic review. JAMA: the Journal of the American Medical Association 2005;293(17):2141–8.
352. Dannecker C, Hillemanns P, Strauss A, et al. Episiotomy and perineal tears presumed to be imminent: randomized controlled trial. Acta Obstetricia et Gynecologica Scandinavica 2004;83(4):364–8.
353. Andrews V, Sultan AH, Thakar R, et al. Risk factors for obstetric anal sphincter injury: a prospective study. Birth 2006;33(2):117–22.
354. Dandolu V, Gaughan JP, Chatwani AJ, et al. Risk of recurrence of anal sphincter lacerations. Obstetrics and Gynecology 2005;105(4):831–5.
355. Harkin R, Fitzpatrick M, O’Connell PR, et al. Anal sphincter disruption at vaginal delivery: Is recurrence predictable? European Journal of Obstetrics, Gynecology and Reproductive Biology 2003;109(2):149–52.

287
356. Sangalli MR, Floris L, Faltin D, et al. Anal incontinence in women with third or fourth degree perineal tears and subsequent vaginal deliveries. Australian and New Zealand Journal of Obstetrics and Gynaecology 2000;40(3):244–8.
357. Woodward J, Kelly SM. A pilot study for a randomised controlled trial of waterbirth versus land birth. BJOG: an international journal of obstetrics & gynaecology 2004;111(6):537–45.
358. Magann EF, Evans S, Chauhan SP, et al. The length of the third stage of labor and the risk of postpartum hemorrhage. Obstetrics and Gynecology 2005;105(2):290–3.
359. Combs CA, Laros Jr RK. Prolonged third stage of labor: Morbidity and risk factors. Obstetrics and Gynecology 1991;77(6):863–7.
360. Prendiville WJ, Elbourne D, McDonald S. Active versus expectant management in the third stage of labour. (Cochrane Review). In: Cochrane Database of Systematic Reviews, Issue 2, 2005. Oxford: Update Software.
361. Van RP, Brabin BJ. Late umbilical cord-clamping as an intervention for reducing iron deficiency anaemia in term infants in developing and industrialised countries: a systematic review. Annals of Tropical Paediatrics 2004;24(1):3–16.
362. Ceriani Cernadas JM, Carroli G, Pellegrini L, et al. The effect of timing of cord clamping on neonatal venous hematocrit values and clinical outcome at term: a randomized, controlled trial. Pediatrics 2006;117(4):e779–86.
363. Chaparro CM, Neufeld LM, Tena AG, et al. Effect of timing of umbilical cord clamping on iron status in Mexican infants: a randomised controlled trial.[see comment]. Lancet 2006;367(9527):1997–2004.
364. Emhamed MO, Van RP, Brabin BJ. The early effects of delayed cord clamping in term infants born to Libyan mothers. Tropical Doctor 2004;34(4):218–22.
365. Linderkamp O, Nelle M, Kraus M, et al. The effect of early and late cord-clamping on blood viscosity and other hemorheological parameters in full-term neonates. Acta Paediatrica 1992;81(10):745–50.
366. Nelle M, Zilow EP, Kraus M, et al. The effect of Leboyer delivery on blood viscosity and other hemorheologic parameters in term neonates. American Journal of Obstetrics and Gynecology 1993;169(1):189–93.
367. Nelle M, Zilow EP, Bastert G, et al. Effect of Leboyer childbirth on cardiac output, cerebral and gastrointestinal blood flow velocities in full-term neonates. American Journal of Perinatology 1995;12(3):212–16.
368. Saigal S, O’Neill A, Surainder Y, et al. Placental transfusion and hyperbilirubinemia in the premature. Pediatrics 1972;49(3):406–19.
369. Geethanath RM, Ramji S, Thirupuram S, et al. Effect of timing of cord clamping on the iron status of infants at 3 months. Indian Pediatrics 1997;34(2):103–6.
370. Grajeda R, Perez-Escamilla R, Dewey KG. Delayed clamping of the umbilical cord improves hematologic status of Guatemalan infants at 2 mo of age. American Journal of Clinical Nutrition 1997;65(2):425–31.
371. Gupta R, Ramji S. Effect of delayed cord clamping on iron stores in infants born to anemic mothers: a randomized controlled trial. Indian Pediatrics 2002;39(2):130–5.
372. Lanzkowsky P. Effects of early and late clamping of umbilical cord on infant’s haemoglobin level. British Medical Journal 1960;2:1777–82.
373. Elbourne DR, Prendiville WJ, Carroli G, Wood J, McDonald S. Prophylactic use of oxytocin in the third stage of labour. (Cochrane Review). In: Cochrane Database of Systematic Reviews, Issue 2, 2005. Oxford: Update Software.
374. McDonald S, Abbott JM, Higgins SP. Prophylactic ergometrine-oxytocin versus oxytocin for the third stage of labour. (Cochrane Review). In: Cochrane Database of Systematic Reviews, Issue 2, 2005. Oxford: Update Software.
375. Reddy VV, Carey JC. Effect of umbilical vein oxytocin on puerperal blood loss and length of the third stage of labor. American Journal of Obstetrics and Gynecology 1989;160(1):206–8.
376. Dahiya P, Puri M, Rathee S. Influence of intraumbilical oxytocin on the third stage of labour. Indian Journal of Medical Sciences 1995;49(2):23–7.
377. Porter KB, O’Brien WF, Collins MK, et al. A randomized comparison of umbilical vein and intravenous oxytocin during the puerperium. Obstetrics and Gynecology 1991;78(2):254–6.
378. Kovavisarach E, Rojsangruang S. Effect of umbilical vein oxytocin injection on the third stage of labor: A randomized controlled study. Journal of the Medical Association of Thailand 1998;81(9):693–7.
379. Ozcan T, Sahin G, Senoz S. The effect of intraumbilical oxytocin on the third stage of labour. Australian and New Zealand Journal of Obstetrics and Gynaecology 1996;36(1):9–11.
380. Young SB, Martelly PD, Greb L, et al. The effect of intraumbilical oxytocin on the third stage of labor. Obstetrics and Gynecology 1988;71(5):736–8.
381. Gulmezoglu AM, Forna F, Villar J, Hofmeyr GJ. Prostaglandins for prevention of postpartum haemorrhage. (Cochrane Review). In: Cochrane Database of Systematic Reviews, Issue 2, 2005. Oxford: Update Software.
382. Langenbach C. Misoprostol in preventing postpartum hemorrhage: A meta-analysis. International Journal of Gynecology and Obstetrics 2006;92(1):10–18.
383. Lam H, Tang OS, Lee CP, et al. A pilot-randomized comparison of sublingual misoprostol with syntometrine on the blood loss in third stage of labor. Acta Obstetricia et Gynecologica Scandinavica 2004;83(7):647–50.
384. Vimala N, Mittal S, Kumar S, et al. Sublingual misoprostol versus methylergometrine for active management of the third stage of labor. International Journal of Gynaecology and Obstetrics 2004;87(1):1–5.
385. Zachariah ES, Naidu M, Seshadri L. Oral misoprostol in the third stage of labor. International Journal of Gynecology and Obstetrics 2006;92(1):23–6.
386. Garg P, Batra S, Gandhi G. Oral misoprostol versus injectable methylergometrine in management of the third stage of labor. International Journal of Gynaecology and Obstetrics 2005;91(2):160–1.
387. Cock C-M, Spurrett B, Murray H. A randomized clinical trial comparing oral misoprostol with synthetic oxytocin or syntometrine in the third stage of labour. Australian and New Zealand Journal of Obstetrics and Gynaecology 1999;39(4):414–19.
388. Amant F, Spitz B, Timmerman D, et al. Misoprostol compared with methylergometrine for the prevention of postpartum haemorrhage: a double-blind randomised trial. BJOG: an international journal of obstetrics & gynaecology 1999;106(10):1066–70.
389. Karkanis SG, Caloia D, Salenieks ME, et al. Randomized controlled trial of rectal misoprostol versus oxytocin in third stage management. Journal of Obstetrics and Gynaecology Canada 2002;24(2):149–54.
390. Abdel-Aleem H, bol-Oyoun EM, Moustafa SA, et al. Carboprost trometamol in the management of the third stage of labor. International Journal of Gynaecology and Obstetrics 1993;42(3):247–50.
References

288
Intrapartum care
391. Walley RL, Wilson JB, Crane JM, et al. A double-blind placebo controlled randomised trial of misoprostol and oxytocin in the management of the third stage of labour. BJOG: an international journal of obstetrics & gynaecology 2000;107(9):1111–15.
392. Poeschmann RP, Doesburg WH, Eskes TKAB. A randomized comparison of oxytocin, sulprostone and placebo in the management of the third stage of labour. BJOG: an international journal of obstetrics & gynaecology 1991;98(6):528–30.
393. Van Selm M, Kanhai HH, Keirse MJ. Preventing the recurrence of atonic postpartum hemorrhage: a double-blind trial. Acta Obstetricia et Gynecologica Scandinavica 1995;74(4):270–4.
394. Ng PS, Chan AS, Sin WK, et al. A multicentre randomized controlled trial of oral misoprostol and i.m. syntometrine in the management of the third stage of labour. Human Reproduction 2001;16(1):31–5.
395. Bhattacharya P, Devi PK, Jain S, et al. Prophylactic use of 15(S)15 methyl PGF(2alpha) by intramuscular route for control of postpartum bleeding – A comparative trial with methylergometrine. Acta Obstetricia et Gynecologica Scandinavica – Supplement 1988;67(145):13–15.
396. Bugalho A, Daniel A, Faundes A, et al. Misoprostol for prevention of postpartum hemorrhage. International Journal of Gynaecology and Obstetrics 2001;73(1):1–6.
397. Oboro VO, Tabowei TO. A randomised controlled trial of misoprostol versus oxytocin in the active management of the third stage of labour. Journal of Obstetrics and Gynaecology 2003;23(1):13–16.
398. Chua S, Chew SL, Yeoh CL, et al. A randomized controlled study of prostaglandin 15-methyl F2 alpha compared with syntometrine for prophylactic use in the third stage of labour. Australian and New Zealand Journal of Obstetrics and Gynaecology 1995;35(4):413–16.
399. Bamigboye AA, Merrell DA, Hofmeyr GJ, et al. Randomized comparison of rectal misoprostol with Syntometrine for management of third stage of labor. Acta Obstetricia et Gynecologica Scandinavica 1998;77(2):178–81.
400. Hofmeyr GJ, Nikodem VC, de Jager M, et al. A randomised placebo controlled trial of oral misoprostol in the third stage of labour. BJOG: an international journal of obstetrics & gynaecology 1998;105(9):971–5.
401. Bamigboye AA, Hofmeyr GJ, Merrell DA. Rectal misoprostol in the prevention of postpartum hemorrhage: a placebo-controlled trial. American Journal of Obstetrics and Gynecology 1998;179(4):1043–6.
402. Hofmeyr GJ, Nikodem VC, de JM, et al. Side-effects of oral misoprostol in the third stage of labour – A randomised placebo-controlled trial. South African Medical Journal 2001;91(5):432–5.
403. Surbek DV, Fehr PM, Hosli I, et al. Oral misoprostol for third stage of labor: A randomized placebo- controlled trial. Obstetrics and Gynecology 1999;94(2):255–8.
404. Caliskan E, Meydanli MM, Dilbaz B, et al. Is rectal misoprostol really effective in the treatment of third stage of labor? A randomized controlled trial. American Journal of Obstetrics and Gynecology 2002;187(4):1038–45.
405. Caliskan E, Dilbaz B, Meydanli MM, et al. Oral misoprostol for the third stage of labor: A randomized controlled trial. Obstetrics and Gynecology 2003;101(5):921–8.
406. El-Refaey H, Nooh R, O’Brien P, et al. The misoprostol third stage of labour study: a randomised controlled comparison between orally administered misoprostol and standard management. BJOG: an international journal of obstetrics & gynaecology 2000;107(9):1104–10.
407. Khan RU, El-Refaey H. Pharmacokinetics and adverse-effect profile of rectally administered misoprostol in the third stage of labor. Obstetrics and Gynecology 2003;101(5 Pt 1):968–74.
408. Gerstenfeld TS, Wing DA. Rectal misoprostol versus intravenous oxytocin for the prevention of postpartum hemorrhage after vaginal delivery. American Journal of Obstetrics and Gynecology 2001;185(4):878–82.
409. Lumbiganon P, Hofmeyr J, Gulmezoglu AM, et al. Misoprostol dose-related shivering and pyrexia in the third stage of labour. WHO Collaborative Trial of Misoprostol in the Management of the Third Stage of Labour. BJOG: an international journal of obstetrics & gynaecology 1999;106(4):304–8.
410. Gulmezoglu AM, Villar J, Ngoc NT, et al. WHO multicentre randomised trial of misoprostol in the management of the third stage of labour. Lancet 2001;358(9283):689–95.
411. Lumbiganon P, Villar J, Piaggio G, et al. Side effects of oral misoprostol during the first 24 hours after administration in the third stage of labour. BJOG: an international journal of obstetrics & gynaecology 2002;109(11):1222–6.
412. Kundodyiwa TW, Majoko F, Rusakaniko S. Misoprostol versus oxytocin in the third stage of labor. International Journal of Gynecology and Obstetrics 2001;75:235–41.
413. Chestnut DH, Wilcox LL. Influence of umbilical vein administration of oxytocin on the third stage of labor: A randomized, double-blind, placebo-controlled study. American Journal of Obstetrics and Gynecology 1987;157(1):160–2.
414. National Collaborating Centre for Primary Care. Postnatal Care: Routine Postnatal Care of Women and Their Babies. London,: National Institute for Health and Clinical Excellence; 2006.
415. Apgar V. Proposal for new method of evaluation of newborn infant. Anesthesia and Analgesia 1953;32:260–7.
416. Apgar V. Evaluation of the newborn infant – second report. JAMA: the Journal of the American Medical Association 1958;168(15):1985–8.
417. Apgar V, James LS. Further observation on the newborn scoring system. American Journal of Diseases of Children 1962;104:419–28.
418. van de Riet JE, Vandenbussche FP, Le Cessie S, et al. Newborn assessment and long-term adverse outcome: a systematic review. American Journal of Obstetrics and Gynecology 1999;180(4):1024–9.
419. Chong DS, Karlberg J. Refining the Apgar score cut-off point for newborns at risk. Acta Paediatrica 2004;93(1):53–9.
420. Gaffney G, Sellers S, Flavell V, et al. Case-control study of intrapartum care, cerebral palsy, and perinatal death. British Medical Journal 1994;308(6931):743–50.
421. Moster D, Lie RT, Markestad T. Joint association of Apgar scores and early neonatal symptoms with minor disabilities at school age. Archives of Disease in Childhood Fetal and Neonatal Edition 2002;86(1):F16–21.
422. Moster D, Lie RT, Irgens LM, et al. The association of Apgar score with subsequent death and cerebral palsy: A population-based study in term infants. Journal of Pediatrics 2001;138(6):798–803.
423. Casey BM, McIntire DD, Leveno KJ. The continuing value of the Apgar score for the assessment of newborn infants. New England Journal of Medicine 2001;344(7):467–71.
424. Dyson L, McCormick F, Renfrew MJ. Interventions for promoting the initiation of breastfeeding. (Cochrane Review). In: Cochrane Database of Systematic Reviews, Issue 2, 2005. Oxford: Update Software.

289
425. Royal College of Obstetricians and Gynaecologists. Peritoneal closure. Green Top Guideline No. 15. London: RCOG Press; 1998. p. 1–6
426. Andrews V, Thakar R, Sultan AH, et al. Clinical issues. Can hands-on perineal repair courses affect clinical practice? British Journal of Midwifery 2005;13(9):562–6.
427. Andrews V, Sultan AH, Thakar R, et al. Occult anal sphincter injuries—myth or reality? BJOG: an international journal of obstetrics & gynaecology 2006;113(2):195–200.
428. Groom KM, Paterson-Brown S. Can we improve on the diagnosis of third degree tears? European Journal of Obstetrics, Gynecology and Reproductive Biology 2002;101(1):19–21.
429. Fleming VE, Hagen S, Niven C. Does perineal suturing make a difference? The SUNS trial. BJOG: an international journal of obstetrics & gynaecology 2003;110(7):684–9.
430. Salmon D. A feminist analysis of women’s experiences of perineal trauma in the immediate post-delivery period. Midwifery 1999;15(4):247–56.
431. Kettle C, Johanson RB. Continuous versus interrupted sutures for perineal repair. (Cochrane Review). In: Cochrane Database of Systematic Reviews, Issue 1, 2006. Oxford: Update Software.
432. Kettle C, Hills RK, Jones P, et al. Continuous versus interrupted perineal repair with standard or rapidly absorbed sutures after spontaneous vaginal birth: a randomised controlled trial. Lancet 2002;359(9325):2217–23.
433. Gordon B, Mackrodt C, Fern E, et al. The Ipswich Childbirth Study: 1. A randomised evaluation of two stage postpartum perineal repair leaving the skin unsutured. BJOG: an international journal of obstetrics & gynaecology 1998;105:435–40.
434. Grant A, Gordon B, Mackrodat C, et al. The Ipswich childbirth study: one year follow up of alternative methods used in perineal repair. BJOG: an international journal of obstetrics & gynaecology 2001;108(1):34–40.
435. Oboro VO, Tabowei TO, Loto OM, et al. A multicentre evaluation of the two-layered repair of postpartum perineal trauma. Journal of Obstetrics and Gynaecology 2003;23(1):5–8.
436. Kettle C, Johanson RB. Absorbable synthetic versus catgut suture material for perineal repair. (Cochrane Review). In: Cochrane Database of Systematic Reviews, Issue 1, 2006. Oxford: Update Software.
437. Upton A, Roberts CL, Ryan M, et al. A randomised trial, conducted by midwives, of perineal repairs comparing a polyglycolic suture material and chromic catgut. Midwifery 2002;18(3):223–9.
438. Greenberg JA, Lieberman E, Cohen AP, et al. Randomized comparison of chromic versus fast-absorbing polyglactin 910 for postpartum perineal repair. Obstetrics and Gynecology 2004;103(6):1308–13.
439. Hedayati H, Parsons J, Crowther CA. Rectal analgesia for pain from perineal trauma following childbirth. (Cochrane Review). In: Cochrane Database of Systematic Reviews, Issue 3, 2003. Oxford: Update Software.
440. Dodd JM, Hedayati H, Pearce E, et al. Rectal analgesia for the relief of perineal pain after childbirth: a randomised controlled trial of diclofenac suppositories. BJOG: an international journal of obstetrics & gynaecology 2004;111(10):1059–64.
441. Royal College of Obstetricians and Gynaecologists: Clinical Effectiveness Support Unit. Induction of Labour. No.9. London: RCOG Press; 2001.
442. Dare MR, Middleton P, Crowther CA, Flenady V, Varatharaju B. Planned early birth versus expectant management (waiting) for prelabour rupture of membranes at term (37 weeks or more). (Cochrane Review). In: Cochrane Database of Systematic Reviews, Issue 1, 2006. Oxford: Update Software.
443. Hannah ME, Hodnett ED, Willan A, et al. Prelabor rupture of the membranes at term: expectant management at home or in hospital? The TermPROM Study Group. Obstetrics and Gynecology 2000;96(4):533–8.
444. Jomeen J, Martin CR. The impact of clinical management type on maternal and neo-natal outcome following pre-labour rupture of membranes at term. Clinical Effectiveness in Nursing 2002;6(1):3–9.
445. Hagskog K, Nisell H, Sarman I, et al. Conservative ambulatory management of prelabor rupture of the membranes at term in nulliparous women. Acta Obstetricia et Gynecologica Scandinavica 1994;73(10):765–9.
446. Seaward PG, Hannah ME, Myhr TL, et al. International Multicentre Term Prelabor Rupture of Membranes Study: evaluation of predictors of clinical chorioamnionitis and postpartum fever in patients with prelabor rupture of membranes at term. American Journal of Obstetrics and Gynecology 1997;177(5):1024–9.
447. Apuzzio JJ, Fenmore B, Ganesh V. Conservative versus aggressive management of premature rupture of membranes at term with an unfavorable cervix. International Journal of Feto-Maternal Medicine 1990;3(4):205–8.
448. Ezra Y, Michaelson-Cohen R, Abramov Y, et al. Prelabor rupture of the membranes at term: When to induce labor? European Journal of Obstetrics, Gynecology and Reproductive Biology 2004;115(1):23–7.
449. Eriksson M, Ladfors L, Mattsson LA, et al. Warm tub bath during labor. A study of 1385 women with prelabor rupture of the membranes after 34 weeks of gestation. Acta Obstetricia et Gynecologica Scandinavica 1996;75(7):642–4.
450. Flenady V, King J. Antibiotics for prelabour rupture of membranes at or near term. (Cochrane Review). In: Cochrane Database of Systematic Reviews, Issue 3, 2002. Oxford: Update Software.
451. Bramer S, Heidy van WF, Mol BWJ, et al. Risk indicators for neonatal early-onset GBS-related disease. A case-control study. Journal of Perinatal Medicine 1997;25(6):469–75.
452. Schuchat A, aver-Robinson K, Plikaytis BD, et al. Multistate case-control study of maternal risk factors for neonatal Group B streptococcal disease. Pediatric Infectious Disease Journal 1994;13(7):623–9.
453. Heath PT, Balfour G, Weisner AM, et al. Group B streptococcal disease in UK, Irish infants younger than 90 days. Lancet 2004;363(9405):292–4.
454. Andersen J, Christensen R, Hertel J. Clinical features and epidemiology of septicaemia and meningitis in neonates due to Streptococcus agalactiae in Copenhagen county, Denmark: A 10 year survey from 1992 to 2001. Acta Paediatrica 2004;93(10):1334–9.
455. Oddie S, Embleton ND. Risk factors for early onset neonatal group B streptococcal sepsis: case-control study. British Medical Journal 2002;325(7359):308–12.
456. Marlowe SE, Greenwald J, Anwar M, et al. Prolonged rupture of membranes in the term newborn. American Journal of Perinatology 1997;14(8):483–6.
457. Lin FY, Brenner RA, Johnson YR, et al. The effectiveness of risk-based intrapartum chemoprophylaxis for the prevention of early-onset neonatal group B streptococcal disease. American Journal of Obstetrics and Gynecology 2001;184(6):1204–10.
458. Escobar GJ, Li DK, Armstrong MA, et al. Neonatal sepsis workups in infants >/=2000 grams at birth: A population-based study. Pediatrics 2000;106(2 Pt 1):256–63.
References

290
Intrapartum care
459. Ungerer RLS, Lincetto O, McGuire W, Saloojee H, Gulmezoglu AM. Prophylactic versus selective antibiotics for term newborn infants of mothers with risk factors for neonatal infection. (Cochrane Review). In: Cochrane Database of Systematic Reviews, Issue 1, 2006. Oxford: Update Software.
460. Royal College of Obstetricians and Gynaecologists. The Use of Electronic Fetal Monitoring: The Use and Interpretation of Cardiotocography in Intrapartum Fetal Monitoring. No 8. London: RCOG Press; 2001.
461. Morad Y, Kaplan B, Zangen S, et al. Management of meconium-stained neonates. Journal of Obstetrics and Gynaecology 1998;18(3):223–6.
462. van Heijst ML, van RG, Keirse MJ. Classifying meconium-stained liquor: is it feasible? Birth 1995;22(4):191–5.
463. Trimmer KJ, Gilstrap LC, III. “Meconiumcrit” and birth asphyxia. American Journal of Obstetrics and Gynecology 1991;165(4 Pt 1):1010–13.
464. Steer PJ, Eigbe F, Lissauer TJ, et al. Interrelationships among abnormal cardiotocograms in labor, meconium staining of the amniotic fluid, arterial cord blood pH, Apgar scores. Obstetrics and Gynecology 1989;74(5):715–21.
465. Meis PJ, Hobel CJ, Ureda JR. Late meconium passage in labor--a sign of fetal distress? Obstetrics and Gynecology 1982;59(3):332–5.
466. Baker PN, Kilby MD, Murray H. An assessment of the use of meconium alone as an indication for fetal blood sampling. Obstetrics and Gynecology 1992;80(5):792–6.
467. Alchalabi HA, Abu-Heija AT, El-Sunna E, et al. Meconium-stained amniotic fluid in term pregnancies – A clinical view. Journal of Obstetrics and Gynaecology 1999;19(3):262–4.
468. Ziadeh SM, Sunna E. Obstetric and perinatal outcome of pregnancies with term labour and meconium-stained amniotic fluid. Archives of Gynecology and Obstetrics 2000;264(2):84–7.
469. Wong SF, Chow KM, Ho LC. The relative risk of ‘fetal distress’ in pregnancy associated with meconium-stained liquor at different gestation. Journal of Obstetrics and Gynaecology 2002;22(6):594–9.
470. Hofmeyr GJ. Amnioinfusion for meconium-stained liquor in labour. (Cochrane Review). In: Cochrane Database of Systematic Reviews, Issue 2, 2005. Oxford: Update Software.
471. Fraser WD, Hofmeyr J, Lede R, et al. Amnioinfusion for the prevention of the meconium aspiration syndrome. New England Journal of Medicine 2005;353(9):909–17.
472. Puertas A, Paz CM, Molto L, et al. Meconium-stained amniotic fluid in labor: a randomized trial of prophylactic amniofusion. European Journal of Obstetrics, Gynecology and Reproductive Biology 2001;99(1):33–7.
473. Puertas A, Carrillo MP, clvarez M, et al. Meconium concentration and amniotic fluid index influence the outcome of amnioinfusion. Minerva Ginecologica 2001;53(5):321–30.
474. Rathore AM, Singh R, Ramji S, et al. Randomised trial of amnioinfusion during labour with meconium stained amniotic fluid. BJOG: an international journal of obstetrics & gynaecology 2002;109(1):17–20.
475. Edwards RK, Duff P. Prophylactic cefazolin in amnioinfusions administered for meconium-stained amniotic fluid. Infectious Diseases in Obstetrics and Gynecology 1999;7(3):153–7.
476. Gonzalez JL, Mooney S, Gardner MO, et al. The effects of amnioinfused solutions for meconium-stained amniotic fluid on neonatal plasma electrolyte concentrations and pH. Journal of Perinatology 2002;22(4):279–81.
477. Glantz JC, Letteney DL. Pumps and warmers during amnioinfusion: is either necessary? Obstetrics and Gynecology 1996;87(1):150–5.
478. Centre for Reviews and Dissemination. Pumps and warmers during amnioinfusion: is either necessary? (Structured abstract). (Cochrane Review). In: Database of Abstracts of Reviews of Effects, 2005. Oxford: Update Software.
479. Halliday HL, Sweet D. Endotracheal intubation at birth for preventing morbidity and mortality in vigorous, meconium-stained infants born at term. (Cochrane Review). In: Cochrane Database of Systematic Reviews, 2005. Oxford: Update Software.
480. Vain NE, Szyld EG, Prudent LM, et al. Oropharyngeal and nasopharyngeal suctioning of meconium-stained neonates before delivery of their shoulders: multicentre, randomised controlled trial. Lancet 2004;364(9434):597–602.
481. Hansen PK, Smith SF, Nim J, et al. Maternal attitudes to fetal monitoring. European Journal of Obstetrics, Gynecology and Reproductive Biology 1985;20(1):43–51.
482. Garcia J, Corry M, MacDonald D, et al. Mothers’ views of continuous electronic fetal heart monitoring and intermittent auscultation in a randomized controlled trial. Birth 1985;12(2):79–86.
483. Neilson JP. Fetal electrocardiogram (ECG) for fetal monitoring during labour. (Cochrane Review). In: Cochrane Database of Systematic Reviews, Issue 4, 2005. Oxford: Update Software.
484. Ojala K, Vaarasmaki M, Makikallio K, et al. A comparison of intrapartum automated fetal electrocardiography and conventional cardiotocography – a randomised controlled study. BJOG: an international journal of obstetrics & gynaecology 2006;113(4):419–23.
485. Westgate J, Harris M, Curnow JS, et al. Plymouth randomized trial of cardiotocogram only versus ST waveform plus cardiotocogram for intrapartum monitoring in 2400 cases. American Journal of Obstetrics and Gynecology 1993;169(5):1151–60.
486. Westgate J, Harris M, Curnow JS, et al. Randomised trial of cardiotocography alone or with ST waveform analysis for intrapartum monitoring. Lancet 1992;340(8813):194–8.
487. Amer-Wahlin I, Hellsten C, Noren H, et al. Cardiotocography only versus cardiotocography plus ST analysis of fetal electrocardiogram for intrapartum fetal monitoring: a Swedish randomised controlled trial. Lancet 2001;358(9281):534–8.
488. Ross MG, Devoe LD, Rosen KG. ST-segment analysis of the fetal electrocardiogram improves fetal heart rate tracing interpretation and clinical decision making. Journal of Maternal-Fetal and Neonatal Medicine 2004;15(3):181–5.
489. Luzietti R, Erkkola R, Hasbargen U, et al. European Community Multi-Center Trial ‘Fetal ECG Analysis During Labor’: ST plus CTG analysis. Journal of Perinatal Medicine 1999;27(6):431–40.
490. Noren H, mer-Wahlin I, Hagberg H, et al. Fetal electrocardiography in labor and neonatal outcome: data from the Swedish randomized controlled trial on intrapartum fetal monitoring. American Journal of Obstetrics and Gynecology 2003;188(1):183–92.
491. Amer-Wahlin I, Ingemarsson I, Marsal K, et al. Fetal heart rate patterns and ECG ST segment changes preceding metabolic acidaemia at birth. BJOG: an international journal of obstetrics & gynaecology 2005;112(2):160–5.
492. Strachan BK, van Wijngaarden WJ, Sahota D, et al. Cardiotocography only versus cardiotocography plus PR-interval analysis in intrapartum surveillance: a randomised, multicentre trial. Lancet 2000;355(9202):456–9.
291
493. Luzietti R, Erkkola R, Hasbargen U, et al. European Community Multicentre Trial “Fetal ECG Analysis During Labour”: the P-R interval. Journal of Perinatal Medicine 1997;25(1):27–34.
494. Skupski DW, Rosenberg CR, Eglinton GS. Intrapartum fetal stimulation tests: a meta-analysis. Obstetrics and Gynecology 2002;99(1):129–34.
495. Keith RD, Beckley S, Garibaldi JM, et al. A multicentre comparative study of 17 experts and an intelligent computer system for managing labour using the cardiotocogram. BJOG: an international journal of obstetrics & gynaecology 1995;102(9):688–700.
496. Taylor GM, Mires GJ, Abel EW, et al. The development and validation of an algorithm for real-time computerised fetal heart rate monitoring in labour. BJOG: an international journal of obstetrics & gynaecology 2000;107(9):1130–7.
497. Todros T, Preve CU, Plazzotta C, et al. Fetal heart rate tracings: observers versus computer assessment. European Journal of Obstetrics, Gynecology and Reproductive Biology 1996;68(1–2):83–6.
498. Chung TK, Mohajer MP, Yang ZJ, et al. The prediction of fetal acidosis at birth by computerised analysis of intrapartum cardiotocography. BJOG: an international journal of obstetrics & gynaecology 1995;102(6):454–60.
499. Nielsen PV, Stigsby B, Nickelsen C, et al. Computer assessment of the intrapartum cardiotocogram. II. The value of computer assessment compared with visual assessment. Acta Obstetricia et Gynecologica Scandinavica 1988;67(5):461–4.
500. Mongelli M, Dawkins R, Chung T, et al. Computerised estimation of the baseline fetal heart rate in labour: the low frequency line. BJOG: an international journal of obstetrics & gynaecology 1997;104(10):1128–33.
501. Bowen LW, Kochenour NK, Rehm NE, et al. Maternal-fetal pH difference and fetal scalp pH as predictors of neonatal outcome. Obstetrics and Gynecology 1986;67(4):487–95.
502. Murphy KW, MacDonald D. Fetal blood sampling in Dublin. A year’s review. Journal of Obstetrics and Gynaecology 1990;10(3):194–8.
503. Suidan JS, Young BK. Outcome of fetuses with lactic acidemia. American Journal of Obstetrics and Gynecology 1984;150(1):33–7.
504. Young DC, Gray JH, Luther ER, et al. Fetal scalp blood pH sampling: its value in an active obstetric unit. American Journal of Obstetrics and Gynecology 1980;136(3):276–81.
505. Weber T. Continuous fetal pH monitoring and neonatal Apgar score. Journal of Perinatal Medicine 1980;8(3):158–63.
506. Ayromlooi J, Tobias M, Berg P. Correlation of ominous fetal heart rate pattern and scalp blood pH with one-minute Apgar score. International Journal of Gynaecology and Obstetrics 1979;17(2):185–9.
507. Wood C. Diagnostic and therapeutic implications of intrapartum fetal pH measurement. Acta Obstetricia et Gynecologica Scandinavica 1978;57(1):13–18.
508. Coltart TM, Trickey NR, Beard RW. Foetal blood sampling. Practical approach to management of foetal distress. British Medical Journal 1969;1(640):342–6.
509. McDonald JS. Evaluation of fetal blood pH as a reflection of fetal well-being. American Journal of Obstetrics and Gynecology 1967;97(7):912–18.
510. Weber T. The validity of discontinuous pH-measurements on fetal blood and of cardiotocography in predicting neonatal Apgar score. Danish Medical Bulletin 1979;26(4):186–91.
511. Hon EH, Khazin AF, Paul RH. Biochemical studies of the fetus. II. Fetal pH and apgar scores. Obstetrics and Gynecology 1969;33(2):237–55.
512. Beard RW, Morris ED, Clayton SG. pH of foetal capillary blood as an indicator of the condition of the foetus. Journal of Obstetrics and Gynaecology of the British Commonwealth 1967;74(6):812–22.
513. Galloway RK. Clinical experience with fetal blood pH measurement in fetal distress. Journal of Obstetrics and Gynaecology of the British Commonwealth 1970;77(7):587–90.
514. De La Rama FE Jr, Merkatz IR. Evaluation of fetal scalp pH with a proposed new clinical assessment of the neonate. American Journal of Obstetrics and Gynecology 1970;107(1):93–9.
515. Tejani N, Mann LI, Bhakthavathsalan A. Correlation of fetal heart rate patterns and fetal pH with neonatal outcome. Obstetrics and Gynecology 1976;48(4):460–3.
516. Khazin AF, Hon EH, Quilligan EJ. Biochemical studies of the fetus. III. Fetal base and Apgar scores. Obstetrics and Gynecology 1969;34(4):592–609.
517. Khazin AF, Hon EH. Biochemical studies of the fetus. IV. Fetal-maternal pH and base deficit difference versus Apgar scores. Biology of the Neonate 1971;18(3):225–42.
518. Weber T. Cardiotocography supplemented with continuous fetal pH monitoring during labor. Effect on rate of obstetrical interventions and neonatal condition. Acta Obstetricia et Gynecologica Scandinavica 1982;61(4):351–5.
519. Luttkus AK, Noren H, Stupin JH, et al. Fetal scalp pH and ST analysis of the fetal ECG as an adjunct to CTG. A multi-center, observational study. Journal of Perinatal Medicine 2004;32(6):486–94.
520. Westgren M, Kruger K, Ek S, et al. Lactate compared with pH analysis at fetal scalp blood sampling: a prospective randomised study. BJOG: an international journal of obstetrics & gynaecology 1998;105(1):29–33.
521. Tuffnell D, Haw W. How long does a fetal scalp blood sample take? BJOG: an international journal of obstetrics & gynaecology 2006;113:1–3.
522. Cardoso CG, Graca LM, Clode N. A study on second-stage cardiotocographic patterns and umbilical blood acid-base balance in cases with first-stage normal fetal heart rates. Journal of Maternal-Fetal Investigation 1995;5(3):144–7.
523. Okunwobi-Smith Y, Cooke I, MacKenzie IZ. Decision to delivery intervals for assisted vaginal vertex delivery. BJOG: an international journal of obstetrics & gynaecology 2000;107:467–71.
524. Eldridge A, Johnson N. How long does it take to perform an operative vaginal delivery? Journal of Obstetrics and Gynaecology 2004;24(3):230–2.
525. Tuffnell DJ, Wilkinson K, Beresford N. Interval between decision and delivery by caesarean section-are current standards achievable? Observational case series. British Medical Journal 2001;322(7298):1330–3.
526. MacKenzie IZ, Cooke I. Prospective 12 month study of 30 minute decision to delivery intervals for “emergency” caesarean section. British Medical Journal 2001;322(7298):1334–5.
527. Thomas J, Paranjothy S, Royal College of Obstetricians and Gynaecologists: Clinical Effectiveness Support Unit. The National Sentinel Caesarean Section Audit Report. London: RCOG Press; 2001.
References

292
Intrapartum care
528. Holcroft CJ, Graham EM, ina-Mumuney A, et al. Cord gas analysis, decision-to-delivery interval, and the 30-minute rule for emergency cesareans. Journal of Perinatology 2005;25(4):229–35.
529. Yudkin PL, Johnson A, Clover LM, et al. Clustering of perinatal markers of birth asphyxia and outcome at age five years. BJOG: an international journal of obstetrics & gynaecology 1994;101(9):774–81.
530. Valentin L, Ekman G, Isberg P-E, et al. Clinical evaluation of the fetus and neonate: Relation between intra-partum cardiotocography, Apgar score, cord blood acid-base status and neonatal morbidity. Archives of Gynecology and Obstetrics 1993;253(2):103–15.
531. Melone PJ, Ernest JM, O’Shea MD, Jr, et al. Appropriateness of intrapartum fetal heart rate management and risk of cerebral palsy. American Journal of Obstetrics and Gynecology 1991;165(2):272–6.
532. Gilstrap LC, III, Leveno KJ, Burris J, et al. Diagnosis of birth asphyxia on the basis of fetal pH, Apgar score, and newborn cerebral dysfunction. American Journal of Obstetrics and Gynecology 1989;161(3):825–30.
533. Thorp JA, Sampson JE, Parisi VM, et al. Routine umbilical cord blood gas determinations? American Journal of Obstetrics and Gynecology 1989;161(3):600–5.
534. Ruth VJ, Raivio KO. Perinatal brain damage: predictive value of metabolic acidosis and the Apgar score. British Medical Journal 1988;297(6640):24–7.
535. Page FO, Martin JN, Palmer SM, et al. Correlation of neonatal acid-base status with Apgar scores and fetal heart rate tracings. American Journal of Obstetrics and Gynecology 1986;154(6):1306–11.
536. Sykes GS, Molloy PM, Johnson P, et al. Do Apgar scores indicate asphyxia? Lancet 1982;1(8270):494–6.
537. Fraser WD, Turcot L, Krauss I, Brisson-Carrol G. Amniotomy for shortening spontaneous labour. (Cochrane Review). In: Cochrane Database of Systematic Reviews, Issue 2, 2005. Oxford: Update Software.
538. Rouse DJ, McCullough C, Wren AL, et al. Active-phase labor arrest: a randomized trial of chorioamnion management. Obstetrics and Gynecology 1994;83(6):937–40.
539. Cardozo L, Pearce JM. Oxytocin in active-phase abnormalities of labor: a randomized study. Obstetrics and Gynecology 1990;75(2):152–7.
540. Bidgood KA, Steer PJ. A randomized control study of oxytocin augmentation of labour. 1. Obstetric outcome. BJOG: an international journal of obstetrics & gynaecology 1987;94(6):512–17.
541. Blanch G, Lavender T, Walkinshaw S, et al. Dysfunctional labour: A randomised trial. BJOG: an international journal of obstetrics & gynaecology 1998;105(1):117–20.
542. Merrill DC, Zlatnik FJ. Randomized, double-masked comparison of oxytocin dosage in induction and augmentation of labor. [see comments]. Obstetrics and Gynecology 1999;94(3):455–63.
543. Xenakis EM, Langer O, Piper JM, et al. Low-dose versus high-dose oxytocin augmentation of labor--a randomized trial. American Journal of Obstetrics and Gynecology 1995;173(6):1874–8.
544. Jamal A, Kalantari R. High and low dose oxytocin in augmentation of labor. International Journal of Gynaecology and Obstetrics 2004;87(1):6–8.
545. Majoko F. Effectiveness and safety of high dose oxytocin for augmentation of labour in nulliparous women. [Erratum appears in Cent Afr J Med 2002;48(5–6):74]. Central African Journal of Medicine 2001;47(11–12):247–50.
546. Satin AJ, Leveno KJ, Sherman L, et al. High-dose oxytocin: 20- versus 40-minute dosage interval. Obstetrics and Gynecology 1994;83(2):234–8.
547. Lazor LZ, Philipson EH, Ingardia CJ, et al. A randomized comparison of 15- and 40-minute dosing protocols for labor augmentation and induction. Obstetrics and Gynecology 1993;82(6):1009–12.
548. Cummiskey KC, Gall SA, Yusoff DM. Pulsatile administration of oxytocin for augmentation of labor. Obstetrics and Gynecology 1989;74(6):869–72.
549. Arulkumaran S, Yang M, Ingemarsson PS, et al. Augmentation of labour: does oxytocin titration to achieve preset active contraction area values produce better obstetric outcome? Asia-Oceania Journal of Obstetrics and Gynaecology 1989;15(4):333–7.
550. Johanson RB, Menon V. Vacuum extraction versus forceps for assisted vaginal delivery. (Cochrane Review). In: Cochrane Database of Systematic Reviews, Issue 2, 2000. Oxford: Update Software.
551. Weerasekera DS, Premaratne S. A randomised prospective trial of the obstetric forceps versus vacuum extraction using defined criteria. Journal of Obstetrics and Gynaecology 2002;22(4):344–5.
552. Mustafa R, Mustafa R. Perinatal and maternal outcome in ventouse versus forceps delivery. Journal of the College of Physicians and Surgeons Pakistan 2002;12(6):345–8.
553. Fitzpatrick M, Behan M, O’Connell PR, et al. Randomised clinical trial to assess anal sphincter function following forceps or vacuum assisted vaginal delivery. BJOG: an international journal of obstetrics & gynaecology 2003;110(4):424–9.
554. Johanson RB, Heycock E, Carter J, et al. Maternal and child health after assisted vaginal delivery: Five-year follow up of a randomised controlled study comparing forceps and ventouse. BJOG: an international journal of obstetrics & gynaecology 1999;106(6):544–9.
555. Sultan AH, Johanson RB, Carter JE. Occult anal sphincter trauma following randomized forceps and vacuum delivery. International Journal of Gynaecology and Obstetrics 1998;61(2):113–19.
556. Johanson R, Pusey J, Livera N, et al. North Staffordshire/Wigan assisted delivery trial. BJOG: an international journal of obstetrics & gynaecology 1989;96(5):537–44.
557. Carmody F, Grant A, Mutch L. Follow up of babies delivered in a randomized controlled comparison of vacuum extraction and forceps delivery. Acta Obstetricia et Gynecologica Scandinavica 1986;65(7):763–6.
558. Pusey J, Hodge C, Wilkinson P, et al. Maternal impressions of forceps or the Silc-cup. BJOG: an international journal of obstetrics & gynaecology 1991;98(5):487–8.
559. Garcia J, Anderson J, Vacca A. Views of women and their medical and midwifery attendants about instrumental delivery using vacuum extraction and forceps. Journal of Psychosomatic Obstetrics and Gynecology 1985;4(1):1–9.
560. Johanson RB, Rice C, Doyle M, et al. A randomised prospective study comparing the new vacuum extractor policy with forceps delivery. BJOG: an international journal of obstetrics & gynaecology 1993;100(6):524–30.
561. Johanson R, Menon V. Soft versus rigid vacuum extractor cups for assisted vaginal delivery. (Cochrane Review). In: Cochrane Database of Systematic Reviews, Issue 2, 2000. Oxford: Update Software.
562. Murphy DJ, Liebling RE, Verity L, et al. Early maternal and neonatal morbidity associated with operative delivery in second stage of labour: a cohort study. Lancet 2001;358(9289):1203–7.
293
563. Tan A, Schulze A, O’Donnell CPF, Davis PG. Air versus oxygen for resuscitation of infants at birth. (Cochrane Review). In: Cochrane Database of Systematic Reviews, Issue Oxford, 2005. Oxford: Update Software.
564. Bajaj N, Udani RH, Nanavati RN. Room air vs. 100 per cent oxygen for neonatal resuscitation: a controlled clinical trial. Journal of Tropical Pediatrics 2005;51(4):206–11.
565. Bullarbo M, Tjugum J, Ekerhovd E. Sublingual nitroglycerin for management of retained placenta. International Journal of Gynecology and Obstetrics 2005;91(3):228–32.
566. Carroli G, Bergel E. Umbilical vein injection for management of retained placenta. (Cochrane Review). In: Cochrane Database of Systematic Reviews, 2006. Oxford: Update Software.
567. Sivalingam N, Surinder S. Is there a place for intra-umbilical oxytocin for the management of retained placenta? Medical Journal of Malaysia 2001;56(4):451–9.
568. Mousa HA, Alfirevic Z. Treatment for primary postpartum haemorrhage. (Cochrane Review). In: Cochrane Database of Systematic Reviews, 2006. Oxford: Update Software.
569. Clark SL, Phelan JP, Yeh SY, et al. Hypogastric artery ligation for obstetric hemorrhage. Obstetrics and Gynecology 1985;66(3):353–6.
570. Chattopadhyay SK, Deb RB, Edrees YB. Surgical control of obstetric hemorrhage: Hypogastric artery ligation or hysterectomy? International Journal of Gynecology and Obstetrics 1990;32(4):345–51.
571. Gilbert L, Porter W, Brown VA. Postpartum haemorrhage--a continuing problem. BJOG: an international journal of obstetrics & gynaecology 1987;94(1):67–71.
572. Henry A, Birch M-R, Sullivan EA, et al. Primary postpartum haemorrhage in an Australian tertiary hospital: A case-control study. Australian and New Zealand Journal of Obstetrics and Gynaecology 2005;45(3):233–6.
573. Bais JMJ, Eskes M, Pel M, et al. Postpartum haemorrhage in nulliparous women: incidence and risk factors in low and high risk women. A Dutch population-based cohort study on standard (> or = 500 ml) and severe (> or = 1000 ml) postpartum haemorrhage. European Journal of Obstetrics, Gynecology and Reproductive Biology 2004;115(2):166–72.
574. Chichakli LO, Atrash HK, MacKay AP, et al. Pregnancy-related mortality in the United States due to hemorrhage: 1979–1992. Obstetrics and Gynecology 1999;94(5):721–5.
575. Hall MH, Halliwell R, Carr-Hill R. Concomitant and repeated happenings of complications of the third stage of labour. BJOG: an international journal of obstetrics & gynaecology 1985;92(7):732–8.
576. Magann EF, Evans S, Hutchinson M, et al. Postpartum hemorrhage after vaginal birth: An analysis of risk factors. Southern Medical Journal 2005;98(4):419–22.
577. Stones RW, Paterson CM, Saunders NJ. Risk factors for major obstetric haemorrhage. European Journal of Obstetrics, Gynecology and Reproductive Biology 1993;48(1):15–18.
578. Dewar MJ. Antenatal anaemia and postpartum haemorrhage. Australian and New Zealand Journal of Obstetrics and Gynaecology 1969;9(1):18–20.
579. Ogueh O, Morin L, Usher RH, et al. Obstetric implications of low-lying placentas diagnosed in the second trimester. International Journal of Gynaecology and Obstetrics 2003;83(1):11–17.
580. Guirgis RR, Clark AD, Hogston P, et al. The effects of smoking on labour after uncomplicated pregnancy: A comparison between the progress and outcome of labour in 400 smokers and 400 matched non-smokers. Journal of Obstetrics and Gynaecology 1997;17(2):149–52.
581. Sebire NJ, Jolly M, Harris JP, et al. Maternal obesity and pregnancy outcome: A study of 287 213 pregnancies in London. International Journal of Obesity 2001;25(8):1175–82.
582. Usha Kiran TS, Hemmadi S, Bethel J, et al. Outcome of pregnancy in a woman with an increased body mass index. BJOG: an international journal of obstetrics & gynaecology 2005;112(6):768–72.
583. Robinson HE, O’Connell CM, Joseph KS, et al. Maternal outcomes in pregnancies complicated by obesity. Obstetrics and Gynecology 2005;106(6):1357–64.
584. Sebire NJ, Jolly M, Harris J, et al. Is maternal underweight really a risk factor for adverse pregnancy outcome? A population-based study in London. BJOG: an international journal of obstetrics & gynaecology 2001;108(1):61–6.
585. Olesen AW, Westergaard JG, Olsen J. Perinatal and maternal complications related to postterm delivery: a national register-based study, 1978–1993. American Journal of Obstetrics and Gynecology 2003;189(1):222–7.
586. Jolly MC, Sebire NJ, Harris JP, et al. Risk factors for macrosomia and its clinical consequences: A study of 350,311 pregnancies. European Journal of Obstetrics, Gynecology and Reproductive Biology 2003;111(1):9–14.
587. McEwan HP, Murdoch R. The oversized baby. A study of 169 cases. Journal of Obstetrics and Gynaecology of the British Commonwealth 1966;73(5):734–41.
588. Stotland NE, Caughey AB, Breed EM, et al. Risk factors and obstetric complications associated with macrosomia. [Erratum appears in Int J Gynaecol Obstet 2005;90(1):88]. International Journal of Gynaecology and Obstetrics 2004;87(3):220–6.
589. Wollschlaeger K, Nieder J, Koppe I, et al. A study of fetal macrosomia. Archives of Gynecology and Obstetrics 1999;263(1–2):51–5.
590. Jolly M, Sebire N, Harris J, et al. The risks associated with pregnancy in women aged 35 years or older. Human Reproduction 2000;15(11):2433–7.
591. Ohkuchi A, Onagawa T, Usui R, et al. Effect of maternal age on blood loss during parturition: a retrospective multivariate analysis of 10,053 cases. Journal of Perinatal Medicine 2003;31(3):209–15.
592. Babinszki A, Kerenyi T, Torok O, et al. Perinatal outcome in grand and great-grand multiparity: effects of parity on obstetric risk factors. American Journal of Obstetrics and Gynecology 1999;181(3):669–74.
593. Bugg GJ, Atwal GS, Maresh M. Grandmultiparae in a modern setting. BJOG: an international journal of obstetrics & gynaecology 2002;109(3):249–53.
594. Chang A, Larkin P, Esler EJ, et al. The obstetric performance of the grand multipara. Medical Journal of Australia 1977;1(10):330–2.
595. Henson GL, Knott PD, Colley NV. The dangerous multipara: Fact or fiction? Journal of Obstetrics and Gynaecology 1987;8(2):130–4.
596. Humphrey MD. Is grand multiparity an independent predictor of pregnancy risk? A retrospective observational study. Medical Journal of Australia 2003;179(6):294–6.
References

294
Intrapartum care
597. Irvine LM, Otigbah C, Crawford A, et al. Grand multiparity – An obstetric problem in Great Britain in the 90s? Journal of Obstetrics and Gynaecology 1996;16(4):217–23.
598. Toohey JS, Keegan Jr KA, Morgan MA, et al. The ‘dangerous multipara’: Fact or fiction? American Journal of Obstetrics and Gynecology 1995;172(2 I):683–6.
599. Yasmeen S, Danielsen B, Moshesh M, et al. Is grandmultiparity an independent risk factor for adverse perinatal outcomes? Journal of Maternal-Fetal and Neonatal Medicine 2005;17(4):277–80.
600. Hey EN, Lloyd DJ, Wigglesworth JS. Classifying perinatal death: fetal and neonatal factors. BJOG: an international journal of obstetrics & gynaecology 1986;93(12):1213–23.
601. Walker DS, Koniak-Griffin D. Evaluation of a reduced-frequency prenatal visit schedule for low-risk women at a free-standing birthing center. Journal of Nurse-Midwifery 1997;42(4):295–303.
602. Eakins PS. The rise of the free standing birth center: principles and practice. Women and Health 1984;9(4):49–64.
603. Rooks JP, Ernst EK. Outcomes of care in Birth Centers. Birth 1990;17(4):234.
604. Holz K, Cooney C, Marchese T. Outcomes of mature primiparas in an out-of-hospital birth center. Journal of Nurse-Midwifery 1989;34(4):185–9.
605. Moster D, Lie RT, Markestad T. Neonatal mortality rates in communities with small maternity units compared with those having larger maternity units. BJOG: an international journal of obstetrics & gynaecology 2001;108(9):904–9.
606. Moster D, Lie RT, Markestad T. Relation between size of delivery unit and neonatal death in low risk deliveries: population based study. Archives of Disease in Childhood Fetal and Neonatal Edition 1999;80(3):F221–25.
607. Confidential Enquiry into Maternal and Child Health (CEMACH). All Wales Perinatal Survey & Confidential Enquiry into Stillbirths and Deaths in Infancy: Summary of 2002 Annual Report. Cardiff: All Wales Perinatal Survey; 2004.
608. Confidential Enquiry into Stillbirths and Deaths in Infancy (CESDI). The Confidential Enquiry Into Stillbirths and Deaths in Infancy (CESDI) : 4th Annual Report 1 January – 31 December 1995: Concentrating on Intrapartum Related Deaths 1994–95. CESDI; 1997.
609. Office for National Statistics. Birth Statistics: Review of the Registrar General on Births and Patterns of Family Building in England and Wales, 2000. No. 29. London: Office for National Statistics; 2001.
610. Office for National Statistics. Birth Statistics: Review of the Registrar General on Births and Patterns of Family Building in England and Wales, 2002. No. 31. London: Office for National Statistics; 2004.
611. Office for National Statistics. Birth Statistics: Review of the Registrar General on Births and Patterns of Family Building in England and Wales, 2003. No. 32. London: 2004.
612. National Statistics. Mortality Statistics. Office for National Statistics [online] 2000.
613. National Statistics. Mortality Statistics. Office for National Statistics [online] 2001.
614. National Statistics. Mortality Statistics. Office for National Statistics [online] 2002.
615. National Statistics. Mortality Statistics. Office for National Statistics [online] 2003.
616. National Statistics. Mortality Statistics. Office for National Statistics [online] 2004.
617. National Statistics. Mortality Statistics. Office for National Statistics [online] 2005.
618. Fergusson DM, Horwood LJ, Shannon FT. Early solid feeding and recurrent childhood eczema: a 10-year longitudinal study. Pediatrics 1990;86(4):541–6.
619. Northern Regional Health Authority. Collaborative Survey of Perinatal, Late Neonatal and Infant Death in the Northern Region, 1990. Newcastle upon Tyne: Northern Regional Health Authority; 1991.
620. Curtis L, Netten A. Unit Costs of Health & Social Care 2005. Canterbury: Personal Social Services Research Unit (PSSRU), University of Kent; 2005.
621. Ratcliffe J. The economic implications of the Edgware birth centre. In: Kirkham M, ed. Birth Centres: A Social Model for Maternity Care. London: Books for Midwives; 2003.
622. Chuong CJ, Lee CY, Chuong MC, et al. Does 24-hour supervisory staff coverage in the labour and delivery area change the emergency caesarean section rate? BJOG: an international journal of obstetrics & gynaecology 1986;93(9):938–42.
623. Meydanli MM, Dilbaz B, Caliskan E, et al. Risk factors for meconium aspiration syndrome in infants born through thick meconium. International Journal of Gynecology and Obstetrics 2001;72(1):9–15.
624. Adair CD, Ernest JM, Sanchez-Ramos L, et al. Meconium-stained amniotic fluid-associated infectious morbidity: a randomized, double-blind trial of ampicillin-sulbactam prophylaxis. Obstetrics and Gynecology 1996;88(2):216–20.
625. Department of Health. Maternity Matters: Choice, Access and Continuity of Care in a Safe Service. No.278867. London: Department of Health; 2007.
626. Campbell R, Macfarlane AJ, Hempsall V, Hatchard K. Evaluation of midwife-led care provided at the Royal Bournemouth Hospital. Midwifery 1999;15(3):183–93.
627. Smith LFP, Smith CP. UK childbirth delivery options: alternatives to consultant unit booking and delivery. British Journal of General Practice 2005;55:292–97.
628, Mahomed K, Nyoni R, Masona D. Meconium staining of the liquor in a low risk population. Paediatric and Perinatal Epidemiology 1994;8(3):292–300.
295
NotesAbbreviations used are listed on page ix.All entries refer to intrapartum care, unless otherwise noted.vs denotes comparisons.
absolute risk, xabsolute risk reduction (ARR), xacid–base, fetal, 225
epidural vs non-epidurals in labour, 111acidosis
metabolic, computerised systems in FHR, 224acupuncture/acupressure, 99acute sector, xacute trust, x, xxadmission CTG. see cardiotocography (CTG)admission to place of birth, timing, 143, 144advised, definition, xairway suction, infants after meconium-stained liquor, 215, 216alfentanil, PCA, vs fentanyl PCA, 106allied health professionals, xalongside unit. see midwife-led unit (birth centre)amnioinfusion, 212
avoidance in meconium-stained liquor, 24degree of meconium staining effect, 213evidence statement, 215GDG interpretation, 215meta-analysis, 214methods, 214
infusion pumps vs solution warmers, 214protocols, 212RCTs, 212standard care vs, 212thick/moderate meconium-stained liquor, 213
amniotomy, xexpectant management vs, 233
evidence statement, 233nulliparous women, 233parous women, 233
indications, 232recommendations, 28, 238
oxytocin with vs amniotomy only, 234routine, 153
evidence statement, 153oxytocin with, 153
anaemiapostpartum haemorrhage risk factor, 250
anaesthesia in labour, 1, see also local anaestheticanal sphincter injury. see also faecal incontinence
extent, perineal repair effectiveness, 189third/fourth perineal tears, 189
analgesia. see individual strategies/methods, see pain reliefantacids, 84Antenatal Care clinical guideline, NICE, 76antibiotics
intrapartum prophylactic, PRoM, 203, 206postnatal prophylactic, for infants, after PRoM, 205
anticardiolipin syndrome, 88anti-emetics, diamorphine or pethidine with, 102anxiety
during labour, 68touch and massage effect, 94
Apgar score, 186background to, 186evidence statement, 187ketosis prevention effect, 85
midwife-led unit (birth centre) vs obstetric unitalongside unit, 58standalone unit, 57
outcome after meconium-stained liquor, 210recommendations, 21, 187review findings, 187
applicability, definition, xappraisal of evidence, xaromatherapy, 98audio-analgesia, 98audits, place of birth, 9augmentation, labour. see also oxytocin, see also amniotomy
alongside midwife-led unit vs obstetric unit, 59effect on FHR abnormalities, 234water use/immersion vs, 96
back pain, 104epidural analgesia as risk factor, 112
Behavioural Index of Pain (BIP), 148best available evidence, xbias, x
information, xvNCC-WCH IPPM analysis, 270performance, xviipublication, xviiselection, xix
birthcare immediately after. see care after birthinstrumental. see instrumental birthsnormal, definition, 1place of. see place of birthstatistics, 1
birth attendants, 73birth balls, 93birth centre. see midwife-led unit (birth centre)birth experience, women’s evaluation. see women’s views, see
women’s satisfactionbirthing pool, 93, see also water birth
hygiene/maintenance, 96warning with opioid use, 108
birthweight, postpartum haemorrhage risk factor, 252bladder care
observations at first stage of labour, 145observations at second stage of labour, 160
bladder catheterisation, 116blinding (masking), xblood counts, neonatal, after prelabour rupture of membranes,
205blood gas analysis, cord blood. see cord blood gas analysisblood loss, postpartum. see postpartum haemorrhage (PPH)blood samples, fetal. see fetal blood sampling (FBS)bradycardia, fetal, 26
intrathecal opioids associated, 128observations at second stage of labour, 161
breastfeedingEntonox effect, 123epidural fentanyl effect, 122
evidence statement, 123studies and review findings, 122
initiation, recommendations, 21, 188promotion, mother–infant bonding and, 187
breath-holding techniqueexhalation pushing technique vs, 164spontaneous pushing vs, 163
breathing and relaxation, 93, 94recommendations, 94
bupivacainecombined spinal–epidural (CSE), dose comparisons, 129
Index

296
bupivacaine (cont.) epidural
continuous infusion vs intermittent bolus, 124intrathecal opioids with, 128maintenance dose comparisons, 135
extradural, timing of administration, 114burnout
measurement, 77
caesarean section (CS)after prelabour rupture of membrane, 201computerised vs human interpretation of FHR before, 223decision to birth by, interval for, 229indications, 229positions (maternal) in second stage of labour and, 161rate
alongside midwife-led unit vs obstetric unit, 59amnioinfusion effect, 214
Caesarean Section, NICE guideline, 48, 54, 71complementary/alternative therapies, 97one-to-one care, 73positions in second stage of labour, 161water birth, 95
calorific intake, in labour, 85, 86carbohydrate, placebo vs, ketosis prevention, 85cardiogram, fetal. see electrocardiogram (ECG), fetalcardiotocography (CTG). see also fetal heart rate (FHR), see also
electronic fetal monitoring (EFM), continuousadmission, 143, 144
recommendations, 17, 145continuous vs intermittent auscultation
evidence statement, 155low-risk pregnancies, 154
care after birth, 186guideline coverage, 2initial assessment. see also neonatal assessment, see also
maternal assessmentof infant, 186of mother, 186, 188recommendations, 21
research recommendations, 33summary of recommendations, 21
care during labour, 67communication. see communication (women and caregivers)continuity. see continuity of careeating and drinking. see eating and drinking during labourguideline coverage, 1hygiene. see hygiene measures during labouridentification of need for additional care, 89in regional analgesia. see regional analgesia in labourmobilisation. see mobilisation during labourresearch recommendations, 32summary of recommendations, 12support. see support in labour
care pathway, intrapartum care, 34caregivers, 73, see also midwife
continuity of. see also continuity of carehusbands/partners, 73
touch and massage by, 94perception as being unhelpful, 68positive attitude, women’s perception of birth and, 68, 92
caring behaviourof midwives, 69of nurses, 70
case report (case study), xcase series, xicase–control study, x
retrospective, xcaseload midwifery, 75, 80
effect on birth events, 80evidence statement, 83review findings, 80studies reviewed, 80, 81women’s satisfaction and experience, 80
catgut suture material. see perineal repair, materialscausal relationship, definition, xicephalhaematoma, 241
cerebral palsy, Apgar score predictive of, 187cervical dilatation
first stage of labour, 138, 141initial presentations (3cm vs 4cm), intrapartum outcomes,
143latent phase of labour, 138
fullrecommendations after epidural, 15second stage of labour definition, 156
rate, epidural vs non-epidurals effect, 112timing of epidural analgesia, 114
cetrimide/chlorhexidine perineal cleaning, 88Changing Childbirth (1993), 48, 75charting of labour observations. see partogramChildren’s National Service Framework (NSF), 3, 48chlorhexidine vaginal douching
newborn outcomes, 87studies and review findings, 87women’s outcomes, 87
chorioamnionitis, 24clinical diagnosis, 214
chromic catgut suture material. see perineal repair, materialsclinical audit, xiclinical effectiveness, xi
synthesis of evidence, 4clinical governance, xi
planning of place of birthall settings, 9, 62not obstetric units, 9, 63
clinical impact, xiclinical importance, xiclinical question, xiclinical trial, xi, see also randomised controlled trials (RCT)
controlled, xiiclinician, xiclonidine, 116cluster design, xicluster randomisation, xicluster, definition, xiCochrane Collaboration, xiCochrane Library, xicohort study, xiicohort, definition, xicombined mortality, definition, xiicombined spinal–epidural (CSE). see regional analgesia in labourCOMET trial, 127commercial ‘in confidence’ material, xiicommunication (women and caregivers), 67
evidence statement, 70impact on birth experience, 67, see also women’s satisfaction
encouraging and educating approach, 70studies and findings, 67types of communication, 69
importance, 67for pain relief, 93for vaginal examinations, 142
key practice recommendations, 7recommendations, 12
community midwife, role in caseload midwifery, 80co-morbidity, xiicomplementary and alternative therapies, 97
acupuncture/acupressure, 97evidence statement, 99music, 98
complicated labourfirst stage, 232, see also first stage of labour, delay
alongside midwife-led unit vs obstetric unit, 59definition, 28, 232perceived, interventions, 28, 232, see also oxytocin, see
also amniotomyrecommendations, 28, 237research recommendations, 33summary of recommendations, 28
immediate care of newborn. see neonatal resuscitationmonitoring of infants/fetus. see fetal monitoringsecond stage, 239, see also second stage of labour, delay/pro-
longed
Intrapartum care
297
Index
alongside midwife-led unit vs obstetric unit, 59definition and duration of delay, 29, 239instrumental birth and delay, 239interventions, 240, see also instrumental births
instrument choice, 240oxytocin vs instrumental births, 240
summary of recommendations, 29third stage, 246, see also third stage of labour
delayed, definition, 30postpartum haemorrhage. see postpartum haemorrhage
(PPH)research recommendations, 34retained placenta, 31, see also placenta, retainedsummary of recommendations, 30
computerised systems in FHRevidence statement, 225fetal acidosis detection, 224
confidence interval, xii, xviiConfidential Enquiry into Maternal and Child Health (CEMACH),
53, 61Confidential Enquiry into Maternal Deaths, 48confounding factor (confounder), xii, xviiconsensus development conference, xiiconsensus methods, xiiconsensus statement, xiiconsidered judgement, definition, xiiconsistency, definition, xiicontinuity of care, 75
caseload midwifery system. see caseload midwiferydefinition, 75evidence statement, 83previous guideline, 76team midwifery system. see team midwifery
continuous EFM. see electronic fetal monitoring (EFM), continu-ous
contractions. see first stage of labourcontrol event rate (CER), xivcontrol group, xiicontrolled clinical trial (CCT), xiicord blood gas analysis, 28, 230
GDG interpretation, 231predictive values, likelihood ratios, 231
cord clampingdelayed vs early, 178, 185timing, 178
evidence statement, 180GDG interpretation, 180review findings, 179studies included, 178, 179
cord traction, 247cost–benefit analysis, xiiicost-effectiveness
definition, xiiiof place of birth, decision tree modelling framework, 271
sensitivity analysis, 273ST segment analysis, 274
cost-effectiveness analysis, xiiicosts
of birth settings, 273ST segment analysis, 275
cost-utility analysis, xiiiCranbrook Report (1959), 48crossover study design, xiiicross-sectional study, xiiicutaneous water injections. see water injections, cutaneous
data set, definition, xiiidecision analysis
definition, xiiidecision tree, xiii, 272
nodes, 272pathways, 272
decision-makingshared with professionals
recommendations, 70women’s satisfaction, 69
women’s feelings of lack of control, 68declaration of interest, xiii, 3, 257Delphi method, xiiidepression, postpartum. see postpartum depressionDexon, 193diagnostic study, xiiidiagnostic tests
evaluation studies, 5hierarchy for evidence of accuracy, 5
diamorphine, 108disadvantages, 93intramuscular, IV PCA vs, 107recommendations, 14
diclofenac, pain relief after perineal repair, 198digital stimulation of fetal scalp, 27, 222
studies and review findings, 223district general hospital (DGH), definition, xiiidominance (health economics), definition, xiiidopamine antagonists, 84double-blind study, xiiidouble-gloving, in episiotomy. see episiotomydrinking during labour. see eating and drinking during labourdyspareunia, 168, 194
eating and drinking during labour, 13, 83evidence statement, 85gastric aspiration reduction. see gastric aspirationGDG interpretation of evidence, 86ketosis prevention. see ketosis, preventionreview findings, 84studies reviewed, 84
economic evaluation, xiii, see also cost-effectivenessmidwifery service, 82planning place of birth, 273
evidence statement, 61team midwifery vs conventional, 80
efficacy, definition, xiiielective, definition, xiiielectrocardiogram (ECG), fetal
PR interval analysis, 221ST segment analysis, 221
costs, 222GDG interpretation, 222perinatal deaths, 222
with continuous EFM, 221economic evidence, 222evidence statement, 222
electronic fetal monitoring (EFM), continuous. see also fetal heart rate (FHR), see also cardiotocography (CTG)
adjuncts to, 221, see also electrocardiogram (ECG), fetal, see also computerised systems in FHR
fetal blood sampling. see fetal blood sampling (FBS)intrapartum fetal stimulation tests, 222summary of recommendations, 27
conducting, summary of recommendations, 25duration of first stage of labour and, 140in delayed first stage of labour, 29in meconium-stained liquor, 211
recommendation, 24in presence of oxytocin, 220in regional analgesia. see regional analgesia in labourindications, 218reasons for in first stage of labour, 18record-keeping
summary of recommendations, 25risk management
recommendations, 28women’s views
Danish trial, 217evidence statement, 218GDG interpretation, 218Irish trial, 218
empirical, definition, xiiiempowerment of women
midwives blocking, 69encephalopathy, neonatal, 9, 63, 274

298
endometritis, postpartumafter prelabour rupture of membrane (PRoM), 203chlorhexidine vaginal douching effect, 87IV antibiotics after PRoM, 203reduction, amnioinfusion effect, 214
endotracheal intubation, infants after meconium-stained liquor, 208
enemas, 87Entonox®. see also nitrous oxide
advantages and disadvantages, 93recommendations, 14, 100
epidemiology, xiiiepidural analgesia. see regional analgesia in labourepinephrine, 125episiotomy
alongside midwife-led unit vs obstetric unit, 59angle, 169double gloves use, 88
evidence statement, 89mediolateral, 20, 170one-to-one care, standard care vs, 74rates, 168
‘hands on’ position and, 166recommendations, 20routine vs restricted use, 168
evidence statement, 170meta-analysis findings, 169studies and review findings, 168urinary incontinence after, 169
ergot-alkaloids, active management of third stage, 180evidence statement, 183summary, 185
error, systematic, xxevent rate, xivevidence
appraisal, xbest available, xhierarchy of, xiv, xvlevel. see levels of evidencestatements. see specific topics
evidence based, definition, xivevidence table, xivevidence-based clinical practice, xivexamination of neonate. see neonatal assessmentexpectant management, xivexperimental event rate (EER), xivexperimental study, xivexperimental treatment, xivexternal validity, xivextrapolation, definition, xiv
faecal incontinence, 170ventouse vs forceps use, 242
fatty acids, non-esterified, 84, 86fentanyl
combined spinal–epidural (CSE), dose comparisons, 129epidural
combined spinal–epidural vs, 127dose comparisons, 130effect on breastfeeding. see breastfeedingmodern vs traditional regimen, 131patient-controlled vs intermittent, 125
fetal acid–base. see acid–base, fetalfetal blood sampling (FBS), 225
borderline results, xiiclassification of results, 27, 228continuous EFM with, vs continuous EFM only, 226contraindications, 28, 227, 228GDG interpretation, 227indications, 227position of mother, 27, 228recommendations, 25, 27repeat samples, 27, 228ST analysis vs fetal scalp pH, 226time from decision to obtaining, 227
fetal bradycardia. see bradycardia, fetal
fetal compromisedelivery recommendations, 27urgent delivery recommendations, 27
fetal death, suspected, ultrasound recommendation, 27, 227fetal distress
caesarean section birth interval, 229home vs hospital births, 50
fetal head positionsabnormal, epidurals vs non-epidurals, 111occiput posterior (OP), epidural vs non-epidurals, 112
fetal heart auscultation. see also fetal heart rate (FHR)at second stage of labour, 19in first stage of labour
Doppler ultrasound vs Pinard stethoscope, 155methods affecting outcomes, 154recommendations, 18
fetal heart rate (FHR). see also fetal heart auscultation, see also electronic fetal monitoring (EFM), continuous
abnormal, 220mother’s position, 26, 220
amnioinfusion impact, 213assessment in first stage of labour, 144
aim, 154continuous CTG vs intermittent, 154recommendations, 18
at presentation of suspected labour, 17augmentation (labour) effect on
amniotomy, 234GDG interpretation, 235
classification of features, 26, 220information required, 220
decelerations, detected by computerised system, 224in established first stage of labour, 17interpretation, 26, 219, see also computerised systems in FHR
computerised systems vs human, 223in complicated labour, summary of recommendations, 26
late decelerations, outcome, 219monitoring after prelabour rupture of membrane, 206outcome after meconium-stained liquor, 209, 210, 211pathological, 26, 219patterns
fetal outcome and, 219GDG interpretation, 219recommendations, 26
prolonged decelerations, outcome, 219reasons for transfer to continuous EFM, 154
recommendations, 155recording during complicated labour, 25storage of traces
recommendation, 28fetal monitoring
in normal labour. see fetal heart rate (FHR), see fetal heart auscultation
fetal monitoring, in complicated labour, 217, see also electronic fetal monitoring (EFM), continuous
aim, 228decision to intervene in birth interval, 228
recommendations, 28effect on outcome, 217health economics, 6methods, 228research recommendations, 33risk management, 228, 230
continuous EFM, recommendations, 28decision to intervene. see above
summary of recommendations, 25women’s views, 25
fetal movement, assessment, in PRoM, 24fetal scalp pH
predictive value, 225fetal scalp puncture, 222
studies and review findings, 223fetal scalp, digital stimulation. see digital stimulation of fetal scalpfetal stimulation tests, intrapartum. see also fetal scalp puncture,
see also digital stimulation of fetal scalpevidence statement, 223
fetal wellbeing, monitoring. see fetal monitoring
Intrapartum care
299
Index
fetal–maternal base deficit difference, 226fever
maternal, epidural analgesia association, 111co-factors (risk factors), 111
first stage of labouractive management, 18, 151
components included, 151evidence statement, 151GDG interpretation, 152
active stage. see first stage of labour, established/active stagecare during, 138
onset, interval between onset of labour, 140complicated labour. see complicated labour: first stagecontractions
assessment in suspected labour, 142‘true’ and ‘false’ labour, 142
definition, 16, 138GDG interpretation, 138
delay. see also complicated labour: first stagedefinition, 28definition recommendations, 16interventions. see complicated labour: first stagekey practice recommendations, 8key research recommendations, 8
duration, 16, 139active management effect, 151clinical factors associated, 140effect on outcomes, 139evidence statement, 141factors affecting, 140mean/median duration, 140puerperal psychosis and, 139recommendations, 16upper limits and ranges, 141
established/active stage, 138, 139definition, 16delay, management, 29duration, 140, 141observations during, 17
failure to progress, 232fetal heart assessment. see fetal heart rate (FHR)latent, 139
definition, 16duration, 140, 141observations. see first stage of labour, observations on
presentationpresentation, intrapartum outcomes, 144prolonged, effect on outcomes, 139
maternal positions during, 71normal, 138
duration, 139research recommendations, 33summary of recommendations, 16
observations during established stage, 145, see also partogramassessments, 145, 150charting, 146evidence statements, 146monitoring fetus. see fetal monitoringvaginal examinations, 146
observations on presentation in suspected labour, 17, 141assessments, 142early assessment vs direct admission, 143evidence statement, 144initial assessment, 144recommendations, 17telephone triage vs visit from nurse, 144
pain without cervical change, 145routine interventions, 151
active management. see aboverecommendations, 153, 154summary of recommendations, 18
walking during. see mobilisation during labourfluid restriction in labour, 83focus group, xivfocused question, xi, xivfood restriction. see also eating and drinking during labourforceps, ventouse vs see also ventouse
forest plot, xivfunnel plot, xiv, xvii‘gas and air’. see Entonox®
gastric acidity, control, recommendations, 13gastric aspiration, reduction in labour, 83
evidence statement, 84general practitioners (GPs), role in caseload midwifery, 80generalisability of study results, xivgenital mutilation, 170
risks associated, 172second stage of labour, summary of recommendations, 20
genital trauma. see perineal tears/traumagloves, use in episiotomy. see episiotomyglucose, plasma, 86gold standard, xivgowns, sterile, 88grandparous women, PPH risk factor, 253grey literature, xiv, 4group B streptococcal disease, neonatal
after prelabour rupture of membranes, 204onset of symptoms, 205
guideline (current)aim, 1areas outside remit, 2areas within remit, 1development group, 3, see also Guideline Development
Groupdevelopment methodology, 3
levels of evidence, 4questions asked, 258
documents complemented by, 3intended readership, 3major theme, communication, 1presentation, 5schedule for updating, 6version for women/families and public, 3
Guideline Development Group, 3identification of women/babies in needing additional care, 89interpretation of evidence. see individual topicsmembership, v, 3
guideline recommendation, definition, xivguideline, definition, xiv
H2-receptor antagonists, 84haematocrit, infant, delayed vs early cord clamping, 179hand position, during birth, 165
evidence statement, 167‘hands off’ vs massage or warm compresses, 166, 167‘hands on’ vs ‘hands poised’ methods, 165, 166, 167
headache, active management of third stage, 177, 178health economics, xiv, see also economic evaluation
guideline development, 6health technology, xvhealth technology appraisal (HTA), xvhealthcare professionals
allied health professionals, xguideline intended for, 3infection transmission prevention, 87rotating between units, 62wellbeing, team midwifery effect, 77
heat, perineal trauma prevention, 165heterogeneity, definition, xvhierarchy of evidence, xiv, xvhome births
hospital vs see also planning place of birthafter PRoM, 201
intrapartum-related perinatal mortality (IPPM) rate, 267statistics, 48transferred group, definition, 266unintended
definition, 266rates (UK), 268
homogeneity, definition, xvhospital births. see obstetric unitshospitals, midwifery schemes. see team midwiferyhydromorphine, intravenous, intrathecal fentanyl vs, 114

300
hygiene measures during labour, 87, see also specific measuresarm sleeve use, 89chlorhexidine vaginal douching, 87double gloves during episiotomy. see episiotomyperineal cleaning, 88recommendations, 13
hyperbilirubinaemia, increased, delayed cord clamping, 180hypnosis, 93, 98, 99hypotension, maternal
epidural analgesia associationincidence, 116
hypoxia, fetal, identification, 217hysterectomy, vessel ligation vs in haemorrhage, 256
in-depth interview, xvInduction of Labour (2001), NICE clinical guideline, 199Infection Control, NICE guideline, 87infections. see also sepsis
in prelabour rupture of membranes, 24maternal. see maternal infectionsneonatal. see neonatal infections
information bias, xvinformation for women. see also communication (women and
caregivers)pain relief, non-epidural
epidural vs, 113inhalational analgesia, 100, see also nitrous oxide
summary of recommendations, 14injected water papules. see water injections, cutaneousinstrumental births
alongside midwife-led unit vs obstetric unit, 59caesarean section vs, 243
evidence statement, 243decision to birth time, 229effect of epidural discontinuation on, 119key practice recommendations, 8NHS Reference Costs, 82numbers, 1probability, 275rate
continuous CTG effect, 154epidural analgesia effect, 113
recommendations, 30ventouse vs forceps, 240, see also ventousewater immersion and, 95
insulin, 84intention-to-treat analysis, xvinternal validity, xvintervention studies, levels of evidence. see levels of evidenceintervention, definition, xvinterventional procedure, xvinterview
in-depth, xvsemi-structured, xixstructured, xix
intrapartum fetal monitoring. see fetal monitoringintrapartum fetal stimulation tests. see fetal stimulation tests,
intrapartumintrapartum perineal massage. see perineal massage, intrapartumintrapartum transfer. see transfer of women to obstetric unitsintrapartum-related perinatal mortality (IPPM), 263
causes and definition, 51cost-effectiveness of place of birth, 271home vs hospital births, 51
Australian, 51, 52summary, 52UK estimate by NCC-WCH, 52, 53, 267, 268UK rate (1983 NRPMSCS study), 51, 52UK rate (1994-2003), 53, 269
midwife-led unit (birth centre) vs obstetric unitalongside unit, 58, 59standalone unit, 55, 57
national registries, 9, 63NCC-WCH analysis. see NCC-WCH analysis, of IPPMrate
definition, 266UK, 267
IPPM. see intrapartum-related perinatal mortality (IPPM)isotonic sports drink. see also ketosis, prevention
recommendations, 13
ketosis, prevention, 85carbohydrate solution vs placebo
evidence statement, 86review findings of study, 85studies reviewed, 85
isotonic sports drink vs waterevidence statement, 86review findings, 86
labouraugmentation. see augmentation, labourcomplicated. see complicated labourduration
home vs hospital births, 50risk factors after PRoM, 202
eating during. see eating and drinking during labourinduction, alongside midwife-led unit vs obstetric unit, 59information for women. see also information for womenmonitoring of fetus during. see fetal monitoringnormal, key practice recommendations, 7risk factors for postpartum haemorrhage, 31stages, 138, see also third stage of labour, see also second
stage of labour, see also first stage of laboursupport in. see support in labour
Labour Ward Forum, 9, 62labouring in water. see water birth, see birthing poollactate/lactic acid, 85
fetal scalp blood sampling vs, 227levels of evidence
definition, xivdiagnostic tests, 5economic evaluation, 5intervention studies, 4, 5
levobupivacaine, 128combined spinal–epidural (CSE), dose comparisons, 129epidural
advantages, 133bupivacaine maintenance vs, 133
lidocaine spray, second stage of labour, 167liquor, meconium-stained. see meconium-stained liquorliterature review, xvliterature search strategy, 4litigation, obstetric, 230local anaesthetic
for perineal repair, 193high-dose, preloading with IV infusion for epidurals, 115in patient-controlled epidural analgesia, 124
longitudinal study, xiii, xv
macrosomia, PPH risk factor, 252management trials, ximasking. see blinding (masking)maternal age, postpartum haemorrhage risk factor, 253maternal assessment
initial assessment after birthsummary of recommendations, 22
maternal care. see perineal care, see care during labour, see care after birth
maternal complications. see also individual complicationscaesaean section, 243home vs hospital, 50midwife-led unit (birth centre) vs obstetric unit
alongside unit, 58standalone unit, 55
prolonged first stage of labour, 140maternal hypotension. see hypotension, maternalmaternal infections. see also fever, maternal
chlorhexidine vaginal douching effect, 87home vs hospital births, 50, 51perineal cleaning effect, 88risk after PRoM, 206risk factors after PRoM, 201
Intrapartum care
301
Index
maternal mortalityhistorical aspects, 87home vs hospital births, 51midwife-led unit (birth centre) vs obstetric unit
standalone unit, 57PPH causing, 250sepsis causing, 87
maternal positions during labour. see also mobilisation during labour
epidural analgesia. see regional analgesia in labourin second stage of labour. see second stage of labourupright vs recumbent (supine, later), 72vertical vs horizontal position, pain perception, 72
meconiumin vocal cords, 213
meconium aspiration syndrome (MAS), 208, 210amnioinfusion impact, 212resuscitation of infants with meconium-stained liquor, 215
‘meconiumcrit’, 209meconium-stained liquor (MSL), 208
amnioinfusion. see amnioinfusionas indicator for fetal blood sampling, 210fetal distress, 211grading, 208, 211
evidence statement, 209intervention types, 208management
research recommendations, 33summary of recommendations, 24
monitoring/treatment of women, 24neonatal outcomes. see also fetal heart rate (FHR)
clear amniotic fluid vs, 210effects of amnioinfusion, 212evidence statement, 211GDG interpretation, 211
observation of infant, 25after significant staining, 216impact, 212
previous guideline, 208resuscitation of infants, 215
endotracheal intubation effect, 215evidence statement, 215recommendations, 25
membranesartificial rupturing. see amniotomyprelabour rupture. see prelabour rupture of membrane (at
term)Mendelson syndrome, 84meningitis, neonatal, 87mental health of women. see also psychological health
one-to-one care effect, 74mental health trust, xv, xxmeperidine, 121Meptid®. see meptazinolmeta-analysis, xv, xviimethodological quality, xvimethodology, xvmidwife
hand position. see hand position, during birthnamed, continuity of care, 75, 76, see also caseload midwiferyuncaring, traits, 69women’s pain perception comparison with, 149
midwife-led unit (birth centre)alongside unit vs obstetric unit, 55
evidence statement, 60maternal mortality/complications, 59obstetric interventions, 58, 59outcome/findings, 59staffing arrangements affecting, 60systematic review and studies, 55transfer rates, 60women’s satisfaction and psychological health, 59
definition, 54duration of first stage of labour, 140obstetric unit vs
cost-effectiveness, 61standalone unit vs obstetric unit, 54
applicability of studies to UK, 262cohort studies, 54, 56evidence statement, 55literature search, 54maternal mortality/complications, 57method for review of, 262mode of birth/interventions, 55, 56outcome/findings, 56RCT difficulties, 54selection criteria and validity scores of studies, 262studies excluded, 265studies included, 265transfer rates, 55women’s satisfaction and psychological health, 55, 57
midwifery servicemodels. see also team midwifery, see also caseload midwifery
misoprostol, postpartum hemorrhage managementplacebo vs, 255
mobilisation during labour, 71, see also maternal positions during labour
effect on women’s satisfaction of birth, 93epidural analgesia. see also regional analgesia in labourevidence statement, 72previous guideline, 71recommendations, 13review findings, 71walking, 71
advantages/benefits, 72epidural analgesia effect, 118vs no walking, 71
women’s views, 217morphine, intravenous, 104
sedative effects, 104mortality
maternal. see maternal mortalityperinatal. see perinatal mortality
mother. see entries beginning maternalmotor power, evaluation in epidural analgesia, 116multicentre study, xvimusic, 93Mylanta II®, 84naloxone, 102
epidural analgesia and, 110National Birth Centre Study, 54National Patient Safety Agency (NPSA), 9, 62nausea. see also vomiting (and nausea)
epidural analgesia association, 116NCC-WCH analysis, of IPPM, 266
background, 266confounding, 270data collection, 267discussion and analysis, 269measurement errors, 269method and definitions, 266results. see also intrapartum-related perinatal mortality (IPPM)statistical analysis, 267
negative predictive value (NP), xvi, xixneonatal assessment. see also Apgar score
after regional analgesiain maternal fever, 111
initial (after birth), recommendations, 21measurements, 188
neonatal examination, recommendations, 22, 188neonatal infections, 87, see also group B streptococcal disease
perineal cleaning effect, 88prediction after PRoM, 200risk factors after PRoM, 203, 205
duration and intrapartum fever, 204risk increased after PRoM, 203
postnatal prophylactic antibiotics effect, 205vaginal examinations associated, 146water births and, 96
neonatal mortalityApgar score predictive of, 187reduced by basic resuscitation, 244
neonatal outcomesafter prelabour rupture of membranes, 203

302
neonatal outcomes (cont. caseload midwifery effect, 80effect of fetal monitoring. see fetal monitoring, in complicated
labourepidural fentanyl effect on breastfeeding, 123fetal heart rate patterns, 219meconium-stained liquor, 209, see also meconium-stained
liquor (MSL)impact of, 208
one-to-one care effect, 74pethidine dosage effects, 103prolonged second stage of labour, 157, 158, 251soft vs hard ventouse, 242team midwifery effect, 77, 80ventouse vs forceps use, 241water birth, 96
at second stage of labour, 173neonatal respiratory depression, 101neonatal resuscitation, 244
basic, 244evidence statement, 244recommendations, 30
meconium-stained liquor. see meconium-stained liquoroxygen (100%) vs room air, 244summary of recommendations, 30
newborn assessment. see neonatal assessment‘Newborn life support course’, 245newborn outcomes. see neonatal outcomesNHS Economic Evaluations Database (NHS EED), 4NHS trust, x, xx
acute trust, x, xxmental health, xv, xxprimary care. see primary care trust (PCT)
nitro-glycerine, for retained placenta, 247nitrous oxide, 100, see also Entonox®
evidence statement, 100studies and review findings, 100
nominal group technique, xvi, 6non-experimental study, xvinon-systematic review. see reviewnulliparous women. see individual topicsnumber needed to harm (NNH). see number needed to treat
(NNT)number needed to treat (NNT), xviNurses, Midwives and Health Visitors Act 1997, 75
OASIS. see anal sphincter injuryobjective measure, definition, xviobservation(s)
at second stage of labour, 19, 160definition, xviin established first stage of labour, 17in regional analgesia. see regional analgesia in labourin third stage of labour, 176
summary of recommendations, 21term babies
after PRoM, 24, 207observational study, xvi, 27obstetric units
definitions, 54home births vs see planning place of birthmidwife burnout, 77midwife-led unit (birth centre) vs, 54, see also midwife-led unit
(birth centre)timing of admission to, 143transfer to. see transfer of women to obstetric units
odds ratio (OR), xvioffered (interventions), definition, xvioff-label prescribing, xvione-to-one care, 73, 76
caregiver status/types, 73effect on birth events, 74effect on labour events, 73evidence statement, 74GDG interpretation of evidence, 75long-term outcomes, 74
previous guideline, 73studies reviewed, 73
opioid analgesia. see also pethidinealongside midwife-led unit vs obstetric unit, 59epidural analgesia maintenance, 16
local anaesthetic with/without, 132epidural analgesia vs, 110evidence statement, 108intramuscular, 100, 101
comparison of different opioids, 101dosage effects, 103IV PCA vs, 107recommendations, 14
intrathecalepidural local anaesthetics vs, 129with/without local anaesthetic vs no opioids, 122, 128
intravenous, 103, see also patient-controlled analgesia (PCA), opioid
comparison between opioids, 105dose-finding, 104intramuscular pethidine vs, 105recommendations, 14
neuraxial, 109prolonged second stage of labour, 158
outcome measures, used in guideline, 6outcome, definition, xvioverweight, maternal, PPH risk factor, 251oxygen
desaturation, immediate vs delayed pushing with epidurals, 120
therapy, prolonged use, harmful effects, 26, 220oxytocin
active management of third stage, 21, 180evidence statement, 183no uterotonics vs, 181recommendations, 183summary, 185umbilical, vs umbilical placebo, 181
augmentation, in epidural analgesia, 121recommendations, 15
continuous EFM with, 27for delay in first stage of labour, 235
amniotomy with vs delayed amniotomy with oxytocin, 234amniotomy with vs oxytocin only, 233continuous vs pulsatile, 237dosage regimens, 238dosage regimens, comparisons, 236dosage regimens, effects on outcome, 236dosage regimens, evidence statement, 237dosage regimens, GDG interpretation, 237dose effect on newborn outcomes, 236dose effect on women’s outcomes, 235effect on FHR abnormalities, 235high vs low dose, 235high vs low dose, evidence statement, 236high vs low dose, GDG interpretation, 236increasing dosage, 237information for women, 238research recommendations, 238single action line in partogram and, 152
for delay in second stage of labourexpectant management vs, 240
for retained placenta, 248, see also oxytocin, umbilical injec-tion
umbilical injection, 180, 185intravenous oxytocin vs, 183saline solution with vs expectant management, 247saline solution with vs saline only, 248saline with vs prostaglandin plus saline, 248summary, 185
P value, xvi, xixpain
assessment. see pain scales/scoresdescriptors, 149feeling of ‘fitness’ relationship, 148first stage of labour, 17
Intrapartum care

303
Index
assessment, 147focus of attention and, 148
measurement, 148, see also pain scales/scoresreduction in water births, 95routine vs restricted episiotomy use, 168scales. see pain scales/scores‘schools of thought’ about, 90sensory and emotional aspects, 148severe, women’s views on pain relief in, 92women’s views on. see women’s views
pain relief, 94, see also individual strategieschoice, 90, 93for retained placenta, 249for/after perineal repair. see perineal repairkey practice recommendations, 8one-to-one care effect, 73regional analgesia. see regional analgesia in laboursummary of recommendations, 14vacuum extraction vs forceps, 241women’s views on, 90, see also women’s views
pain relief, non-epidural, 90birth balls, 96breathing/relaxation. see breathing and relaxationcomplementary/alternative. see complementary and alternative
therapiescutaneous water injections, 96epidurals vs see under regional analgesia in labourin standalone unit vs obstetric unit, 56inhalational. see inhalational analgesianon-invasive, research recommendations, 99non-pharmacological, 99, see also transcutaneous electrical
nerve stimulation (TENS)summary of recommendations, 14
opioids. see opioid analgesiaprioritised by evidence of effectiveness, 93strategies, summary of recommendations, 14summary of recommendations, 14touch and massage, 94water immersion. see water birthwomen’s views and experiences, 14
pain scales/scores, 147acceptability of use during labour, 149evidence statement, 150GDG interpretation, 150impact on outcome, 147impact on women’s experience of labour, 147intrapartum and postnatal scores, 149predictive value, 148self-ratings vs observer ratings, 149
ethnic factors, 149validity and reliability, 148
different scales, 149pethidine effect, 148self-ratings, 149
parityeffect on birth experience, 68postpartum haemorrhage risk factor, 253
partogram, 145, 146action (alert) line in, 18, 146
2 hour vs 3 hour, 1522 hour vs 4 hour, 152comparison of placements, 152evidence statement, 152placement, comparisons, 152
benefits, 147evidence statement, 147GDG interpretation, 147observations during second stage of labour, 160previous guidelines, 146recommendations, 17WHO, 153
patient-controlled analgesia (PCA), epidural. see regional analge-sia in labour
patient-controlled analgesia (PCA), opioid, 105peer review, xviipentazocine, 108performance bias, xvii
perinatal mortality. see also intrapartum-related perinatal mortality (IPPM)
home vs hospital births, 51, 271perineal care, 189, see also perineal tears/trauma, intrapartum
interventions to reducekey practice recommendations, 8previous guideline, 189summary of recommendations, 22
perineal cleaningnewborn outcomes, 88studies and review findings, 88women’s outcomes, 88
perineal massage, intrapartum, 165advice against, 165
recommendation, 19studies and review findings, 165
perineal pain. see also perineal repair, analgesiaafter repair, 197ventouse vs forceps use, 241
perineal repair, 191analgesia for (during), 192
recommendations, 23research recommendations, 197
analgesia for pain afterevidence statement, 198NSAIDs, 197rectal suppositories, 197review findings, 197
basic principles, 23first/second degree tears
evidence statement, 192materials, 195
absorbable synthetic sutures vs catgut, 195absorbable synthetic sutures vs chromic catgut, 196evidence statement, 196rapidly absorbed synthetic vs standard synthetic, 196review findings, 195
method, 193continuous non-locked technique, 195continuous vs interrupted (standard vs rapidly absorbed
sutures), 193evidence statement, 195follow-up, 194recommendations, 23review findings, 193two stage vs three stage, 194, 195
summary of recommendations, 23timing, 192undertaking, effect on outcome, 191
review findings, 191women’s views, 192wound gaping, 194
perineal tears/trauma. see also anal sphincter injuryassessment/defining extent, 189
evidence statement, 190method, 191review findings, 189summary of recommendations, 22
episiotomy angle affecting, 170first/second degree
suturing vs non-suturing, 191history of, summary of recommendations, 20home vs hospital births, 50, 51intrapartum interventions to reduce, 164, see also hand posi-
tion, during birthepisiotomy. see episiotomysummary of recommendations, 19techniques, 164
midwife-led unit (birth centre) vs obstetric unit, 57one-to-one care vs standard care, 74prevalence, 190repair. see perineal repairroutine vs restricted episiotomy use, 169severe, vaginal birth after, 170systematic assessment
position for, 22summary of recommendations, 22

304
perineal tears/trauma (cont.)third degree tears, diagnosis and increased vigilance, 190third/fourth degree
faecal incontinence after, 171incidence of incontinence, 171information for informed choice after, 172recommendations, 20risk factors, 170
third/fourth degree, vaginal birth after, 170evidence statement, 171recurrence of tears, 171
water immersion and, 96perphenazine, 84pethidine
adverse effects, 104background to use, 100butorphanol vs and butorphanol + pethidine vs, 105intramuscular
40-50 vs 80-100mg dosage effects, 103diamorphine vs, 102meptazinol vs, 102pentazocine vs, 102placebo vs, 101
intravenousPCA, remifentanil PCA vs, 105placebo vs, 103
pHfetal scalp. see fetal scalp pHfetal–maternal differences, 225, 226umbilical artery. see umbilical artery pHumbilical cord, outcome after meconium-stained liquor, 209
pharmacological treatment. see also individual drugs, see also pain relief
gastric aspiration reduction, 83guideline coverage, 2postpartum haemorrhage management, 31
physiological changes at birth, 186pilot study, xviiplace of birth
assessment for choosing, 10, 63factors indicating individual assessment, 12, 66factors indicating risk and need for obstetric unit, 11, 65medical conditions indicating individual assessment, 11,
65medical conditions indicating obstetric unit, 10, 64
economic focus, 6in prelabour rupture of membranes, 24national surveillance scheme, 9, 63obstetric unit vs home. see planning place of birthplanning. see planning place of birthstatistics, 48
placebo, xii, xviiplacebo effect, xviiplacenta
expulsion. see third stage of labourmanual removal, 246retained
definition, 246home vs hospital births, 50
retained, management, 246, see also umbilical injection, for retained placenta
oxytocin, 247recommendations, 31
planning place of birth, 48advantages and disadvantages (GDG interpretation), 61assessment for choosing. see place of birthbenefits and risks, 8, 48birth centre vs obstetric unit. see also midwife-led unit (birth
centre)clinical governance. see clinical governanceeconomic evaluation, 60economic modelling, 61historical aspect and background, 48, 73home vs hospital, 48
advantages, 62cohort study, 51cross-sectional studies, 49, 51
evidence statement, 53inclusion/exclusion criteria for studies, 262intrapartum outcomes (low-risk women), 143literature search, 49mode of birth, 50observational studies, 48, 49outcome measures, 263outcomes, 50perinatal mortality. see intrapartum-related perinatal mor-
tality (IPPM)pilot RCT, 49population-based UK study, 49previous guideline, 48review findings, 49safety aspects, 62studies excluded, 264systematic reviews, 49transfer rates. see transfer of women to obstetric units
key practice recommendations, 7key research recommendations, 8midwife-led units vs obstetric units. see midwife-led unit (birth
centre)research recommendations, 32summary of recommendations, 8terminology, 48transfer from planned to actual place. see also transfer of
women to obstetric unitspoint estimate, xviipolyglactin, 196positions during labour. see maternal positions during labourpositive predictive value (PPV), xvii, xixpostnatal care. see care after birthPostnatal Care, NICE clinical guideline, 186, 188postpartum depression
one-to-one care effect, 74postpartum fever
predictors after prelabour rupture of membranes, 202prolonged second stage of labour, 157
postpartum haemorrhage (PPH)duration of third stage of labour and, 175home vs hospital births, 50management, 254
evidence statement, 255, 256recommendations, 31
midwife-led unit (birth centre) vs obstetric unitalongside unit, 59standalone unit, 57
prolonged second stage of labour, 251reduced/risk reduction. see also uterotonics
oxytocin use, 181oxytocin use vs no uterotonics, 181
risk factors, 31, 249age, 250antenatal, 31, 254evidence statement, 254in labour, 254low-lying placenta, 251multiple factors study, 249nulliparous women, 250, 254
post-term birth, PPH risk factor, 252post-traumatic stress disorder, 68PPH. see postpartum haemorrhage (PPH)prelabour rupture of membrane (at term)(PRoM), 199
clinical manifestation of babies, 205onset of symptoms, 205symptoms and laboratory tests, 205
immediate induction vs expectant management, 200length of waiting with no complications, 200management
recommendations, 24, 206neonatal infection
vaginal examinations associated, 146out-patient checks, 201place of care, 200postnatal prophylactic antibiotics for infants
evidence statement, 206previous guidance/guidelines, 199
Intrapartum care

305
Index
research recommendations, 33risk factors for maternal infections
bathing, 202evidence statement, 203length of waiting period, 201parity, 201unfavourable/favourable cervix, 202
risk factors for neonatal infections, 204evidence statement, 205prolonged rupture, 204
summary of recommendations, 23surveillance after, 200
prescribing, off-label, xviprimary care, xviiprimary care trust (PCT), xvii, xxprobability, xviiprognostic factor, xviiprognostic marker, xviiPRoM. see prelabour rupture of membrane (at term)promethazine, 104prospective study, xii, xviiprostaglandin, active management of third stage, 181, 182
evidence statement, 183saline solution with/vs, 248summary, 185
protocol, xviiproton pump inhibitors, 83pruritus
combined spinal–epidural causing, 127intrathecal opioids associated, 128
psychological healtheffect of team midwifery, 77home vs hospital births, 51midwife-led unit (birth centre) vs obstetric unit
alongside units, 58, 68outcome of birth experience, 68
psychological trauma, extreme pain causing, 90publication bias, xiv, xviipudendal block, instrumental births, 243puerperal sepsis. see sepsispulse, maternal, 150pushing, during second stage. see second stage of labour
qualitative research, xiv, xv, xviiiquality-adjusted life years (QALYs), xviii, 271quantitative research, xviiiquasi-experimental study, xviii
random allocation. see randomisationrandomisation, xviii
cluster, xirandomised controlled trials (RCT), xviii, see also clinical trial
causal relationship assessment, xiCochrane Collaboration, xi
recommendations (in guideline)amnioinfusion, 215choosing place of birth, 64complementary and alternative therapies, 99continuity of care, 83cord blood gas analysis, 231cutaneous water injections, 97decision to intervene in birth interval, 230EFM and record-keeping, 218epidural analgesia
continuous EFM, 122effect on breastfeeding, 123establishing and maintaining, 137maternal observations, 117mode of administration, 126oxytocin augmentation, 121position and pushing, 121preloading infusions, 115
episiotomy, 170double-gloving, 89
fetal blood sampling (FBS), 227fetal heart rate patterns, 219fetal stimulation tests, intrapartum, 223
first stage of labour, 138active management, 152definition, 139delay, 232duration, 141fetal heart rate, 150initial observations, 144observations during, 150partogram use, 150verbal assessment of pain, 150
forming and grading, 6hand position during birth, 167infant monitoring during labour, 230initial assessment of mother, 188instrumental births, 243intrapartum transfer, 66key practices, 7key priorities for implementation, 7meconium-stained liquor management, 211mother–infant bonding, 187nitrous oxide, 100observations
during second stage of labour, 160during third stage of labour, 176
on communication, 70on eating/drinking in labour, 86on gastric aspiration prevention, 84on mobilisation, 73on one-to-one care, 75on vaginal douching and perineal cleaning, 88opioid analgesia, 108perineal repair
analgesia for pain after, 198basic principles, 197first/second-degree tears, 192materials, 197method, 195timing, 192
perineal traumaassessment, 191definition, 189
planning a place of birth, 62postpartum haemorrhage management, 255
surgical procedures, 256postpartum haemorrhage risk factors, 254research. see research recommendationsresuscitation of infants
basic neonatal resuscitation, 245meconium-stained liquor, 216
retained placenta treatment, 248analgesia, 249
second stage of labourdefinition, 156delayed/duration, 239interventions for delay, 240local anaesthetic spray in, 168
storage of fetal heart rate traces, 230summary, 7, 8, see also individual considerations (e.g. plan-
ning place of birth)TENS, 100third stage of labour
active vs physiological management, 183definition, 174delayed, definition, 246duration, 175
touch and massage, 95vaginal birth after third/fourth degree perineal trauma, 172water birth, 96
at second stage of labour, 173women’s views
on fetal monitoring and mobility, 218on pain/pain relief, 93
record-keeping, electronic fetal monitoring (EFM), 218rectal examination
after perineal repair, recommendations, 23assessment for perineal trauma, 22perineal trauma assessment, 191

306
referral pathwaysclinical governance on place of birth, 9, 62continuity of care and, 76
regional analgesia in labour, 109adverse effects, 110
as outcomes, systematic review, 116hypotension. see hypotension, maternalpruritus, 116risk of instrumental births/delays, 110shivering, 116voiding difficulties, 116
alongside midwife-led unit vs obstetric unit, 59alternative analgesia vs, 15background to use, 109bupivacaine. see bupivacainecare and observation, 115
adverse effects. see aboveevidence statement, 117maternal observations, 116summary of recommendations, 15
combined spinal–epidural (CSE)adverse effects, 127different initiation doses, 129epidural vs, 127outcomes, 127preloading infusion, 115summary of recommendations, 16
comparison with other analgesia types, 109epidural vs no analgesia, 109epidural vs non-epidural. see belowevidence statement, 113Mexican RCT, 109
continuous CTG use, 121GDG interpretation, 122recommendations, 15
delays in first/second stages, 110effect on breastfeeding. see breastfeedingepidural vs non-epidural analgesia
continuous CTG with, 121effect on mode of birth, 113epidural vs no analgesia, 110PCA pethidine vs, 111, 112women’s perception of pain relief, 91
establishing, 127dose comparisons, 130evidence statements, 128, 129, 130recommendations, 16
fentanyl. see fentanylinformation for women, 15low-dose epidurals, non-epidurals vs, 110maintenance, 131
bupivacaine vs ropivacaine, 135comparison of drugs, 133dose comparisons, 135epidural drug comparisons, 133evidence statements, 131, 132, 133, 134, 136GDG interpretation, 136local anaesthetic dose comparisons, 132modern epidural vs traditional regimen, 131outcomes, 131recommendations, 16
maternal fever association. see fever, maternalmode of administration, 124
continuous infusion vs intermittent bolus, 124GDG interpretation, 126patient-controlled different lockout doses, 126summary of recommendations, 16
oxytocin augmentation requirement, 112pain scales before/after, 148patient-controlled (PCEA)
continuous infusion vs, 124intermittent bolus vs, 125
positions and mobilisation, 117ambulation effect on mode of birth, 117lateral vs sitting (second stage), 118review findings, 118second stage position, 118
upright vs supine, 117preloading with intravenous infusions, 115
evidence statement, 115low-dose anaesthetic, 115
pushing in second stage, 118discontinuation of epidural effect on mode of birth, 118,
120evidence statement, 120GDG interpretation, 120immediate vs delayed, 120studies and review findings, 118
research recommendations, 33summary of recommendations, 15time from administration to pain relief, 110timing, 114
early vs delayed, 114evidence statement, 115recommendations, 15, 115
women’s views on pain relief by, 92relative risk (RR), xviiirelaxation methods. see breathing and relaxationreliability, definition, xviiiremifentanil PCA
intramuscular pethidine vs, 108research recommendations, 32
care after birth, 33care during labour, 32complicated labour, third stage, 34computerised systems in FHR, 225continuity of care, 83fetal monitoring in complicated labour, 33first stage of labour
charting of observations (partogram use), 147duration, 141initial observations, 145normal, 33
gastric aspiration reduction, 84hygiene measures during labour, 89key recommendations, 8meconium-stained liquor, 33, 212nitro-glycerine for retained placenta, 249one-to-one care, 75opioid analgesia, 108pain assessment methods, 150pain relief, regional analgesia, 33perineal trauma, 172planning place of birth, 32, 63postpartum haemorrhage management, 256prelabour rupture of membrane, 33, 207second stage of labour, normal, 33ST segment analysis (fetal), 222third stage of labour, normal, 33timing of cord clamping, 184
‘respiratory autogenic training’, 94resuscitation of infants. see neonatal resuscitationretained placenta. see placenta, retainedretrospective study, xii, xviii
case–control study, xreview
definition, xviiiexternal, 6
risk ratio, xviiiropivacaine, epidural
bupivacaine maintenance vs, 134dose comparisons, 130fentanyl dose comparisons with, 136levobupivacaine maintenance vs, 133
Royal Colleges, xviiirupture of membrane, prelabour. see prelabour rupture of mem-
brane (at term)
saline solutionamnioinfusion, vs lactated Ringer’s solution, 214for retained placenta
expectant management vs, 247sample, definition, xviiisampling, xviii
Intrapartum care

307
Index
sampling frame, xviiiScottish Intercollegiate Guidelines Network (SIGN), xixScunthorpe, team midwifery, 82second stage of labour
active, 18, 156care during, guideline coverage, 2definition, 18, 156delay/prolonged. see also complicated labour: second stage
benefits/harm and effect of epidurals, 119definition, 29, 157, 239definition, recommendations, 19, 29, 159GDG interpretation, 159instrumental birth and, 30, 158outcomes, 157
durationdescriptive studies, 158ethnic factors, 159evidence statement, 159factors affecting, 158nulliparous vs parous women, 29, 159, 239recommendations, 19review findings, 157spontaneous vs breath-holding pushing, 163
episiotomy. see episiotomymaternal positions
evidence statement, 162hands-and-knees, 162hands-and-knees vs sitting, 162perineal tear risk, 162recommendations, 19, 162studies and review findings, 161upright/lateral vs supine/lithotomy, 161
normal, 156research recommendations, 33summary of recommendations, 18
observation of women/babiesrecommendations, 19
pain relief, local anaesthetic spray, 167passive, 18, 156perineal trauma. see perineal tears/traumapushing, 19, 161, 163
coached vs uncoached, 163in epidural analgesia. see regional analgesia in labourpelvic floor assessments, 163recommendations, 164spontaneous vs ‘forced’ breath-holding, 163studies and review findings, 163
water birth. see water birthsecondary care, xixseizures, neonatal, 154, 155selection bias, xixselection criteria, xixself-esteem, postpartum, one-to-one care effect, 74semi-structured interview, xixsensitivity, definition, xixsepsis
neonatalchlorhexidine vaginal douching effect, 87
sexual function, routine vs restricted episiotomy use, 169shared responsibility, team midwifery, 76shoulder dystocia, home vs hospital births, 50, 51single-blind study, xixsmoking, postpartum haemorrhage risk factor, 251specific indication, xixspecificity, definition, xixspinal–epidural analgesia. see regional analgesia in laboursports drink, isotonic, water vs, ketosis prevention, 86ST segment analysis. see electrocardiogram (ECG), fetalstaff, rotation between different units, 9stakeholder organisations, v, 4STAN®, 274standalone midwife-led unit. see midwife-led unit (birth centre)standard deviation, xixstatistical power, xixstorage, fetal heart rate traces, 230streptococcal infection. see group B streptococcal disease, neo-
natal
structured interview, xixstudy checklist, xixstudy population, xixstudy type, xixsubject (of study), definition, xixsufentanil, 116supine position in labour, 71support in labour
continuity of care. see continuity of careeffect on outcome, 73emotional, information, physical and advocacy, 73key practice recommendations, 7one-to-one care. see one-to-one caresummary of recommendations, 13
supported in their choice, definition, xixsurgical procedures, PPH management, 256survey, xixsuturing. see perineal repairSyntometrine, ergot alkaloids vs, 182systematic error, xxsystematic review, xxsystematic searches, 4systematic, definition, xxsystemic, definition, xx
tachycardia, fetal, 26outcome, 219
target population, xxteam midwifery, 75, 76
aim and team sizes, 75concerns over, 76effect on birth events, 77effect on labour events, 76evidence statement, 83interventions reduced, cost impact, 82long-term outcomes, 77problems and disadvantages, 82recommendations, 13review findings, 76studies reviewed, 76, 78women’s satisfaction and experience, 77
temperature, maternal, risk of neonatal infections after PRoM, 204tertiary centre, xxtherapeutic touch. see touch and massagethird stage of labour, 174
active management, 20, 175, 176, 177benefits, 177evidence statement, 178GDG interpretation, 183low risk of PPH, 177maternal complication risk, 178physiological management vs, outcomes, 177PPH risk reduced, 177recommendations, 21
care in, guideline coverage, 2complicated. see complicated labour: third stagedefinition, 20, 174, 246
GDG interpretation, 174delay/prolonged, definition, 30, 175, 246duration, 175
definition, recommendations, 20evidence statement, 175
normalresearch recommendations, 33summary of recommendations, 20
observations insummary of recommendations, 21
physiological management, 20, 175active management vs, outcomes, 175, 185change to active management, 21, 184recommendations, 21
summary of findings, 185timing of cord clamping. see cord clampinguterotonics. see uterotonics
tramadol50 vs 100mg dosage effects, 103pethidine vs, 101
308
tranexamic acid, PPH management, 32transcutaneous electrical nerve stimulation (TENS), 99
not recommended, 14, 93transfer of women to obstetric units
clinical governance, 9, 63indications, 12rates (UK), 49, 53, 268
definitions, 266trauma symptoms, in birth experience, 68triangulation, xxtriple-blind study, xxtrust. see NHS trust
ultrasoundDoppler. see Doppler ultrasoundsuspected fetal death. see fetal death
umbilical artery pHamnioinfusion impact, 212computerised systems in FHR and, 224
umbilical cord. see also entries beginning cordcomplications, fetal heart rate affected by, 213
umbilical injection, for retained placenta, 247evidence statement, 248saline with oxytocin vs plasma expander, 248
urinary incontinenceepidural analgesia and, 110episiotomy vs spontaneous tear, 169stress, prolonged second stage of labour, 157
Use of Electronic Fetal Monitoring Guideline, 208, 223uterine activity, alternation of positions affecting, 71uterine hypercontractility, 27uterotonics
normal third stage of labour, comparisons, 180evidence statement, 183oxytocin + ergot-alkaloids vs ergot-alkaloids, 182oxytocin + ergot-alkaloids vs oxytocin, 182oxytocin vs ergot-alkaloids, 182review findings, 181studies, 180summary, 185
postpartum haemorrhage management, 255drug choices, 256misoprostol vs oxytocin/ergometrine, 255
vacuum extraction. see ventousevaginal birth
instrumental. see instrumental birthsspontaneous, alongside midwife-led unit vs obstetric unit, 59
vaginal douching. see chlorhexidine vaginal douchingvaginal examinations
at first stage of labourrecommendations, 17, 144
at second stage of labour, 19, 160delay in first stage of labour, 29
oxytocin administration, 238in suspected labour, 142prelabour rupture of membranes, 23, 202, 206
number of examinations, 202vaginal tears. see also perineal tears/trauma
alongside midwife-led unit vs obstetric unit, 59validity
definition, xxexternal, xivinternal, xv
variable, definition, xxventouse
forceps use vsevidence statement, 242labour events and failed birth, 241medium and long-term outcome, 242psychological outcome and satisfaction, 241women’s complications, 241
soft vs hard, 242evidence statement, 243labour events and women’s outcomes, 242
verbal rating scale (VRS), of pain, 148Vicryl (polyglactin), 195
vomiting (and nausea), 86active management of third stage, 178diamorphine vs pethidine effects, 102food intake effect, 85meptazinol vs pethidine effects, 102nitrous oxide use, 100pentazocine vs pethidine effects, 102pethidine dosage effects, 103tramadol causing, 101
walking during labour. see mobilisation during labourwarm compresses, perineal trauma prevention, 165water birth, 93
evidence statement, 96previous guideline, 95recommendations, 20review findings, 95second stage of labour, 172
evidence statement, 173statistics, 95, 172studies reviewed, 95timing of use, 96water temperature, 96water vs other methods, 95women’s outcomes, 95
water injections, cutaneous (water papules)disadvantages (pain), 97
wellbeing of women, key research recommendations, 8Winterton Report
water birth, 95women’s satisfaction. see also psychological health
on birth experiencecaregivers’ views vs, 69communication role. see communication (women and
caregivers)continuous vs intermittent epidural analgesia, 124cultural issues, 70decision-making. see decision-makingfactors influencing, 67, 68, 69, 92factors related to dissatisfaction, 68IV PCA diamorphine vs intramuscular diamorphine, 107one-to-one care effect, 74pain relief and, 91, 92patient-controlled epidural lockout doses, 126patient-controlled epidural vs intermittent epidural, 125prelabour rupture of membrane, 200risk factors, 67timing of interventions, 68
women’s views, 67on electronic fetal monitoring, 217, see also electronic fetal
monitoring (EFM), continuouson fetal monitoring and mobility in complicated labour, 25on pain and pain relief, 14, 90
antenatal vs postnatal views, 92assessment methods, 91evidence statement, 92factors involved, 91GDG interpretation, 93pain ratings vs pain relief ratings, 91review findings, 91studies reviewed, 90use of pain scales, 149
on pushing stage, 164World Health Organization (WHO), partogram, 17, 146, 150
Intrapartum care


RCOG Press
Other NICE guidelines produced by the NationalCollaborating Centre for Women’s and Children’sHealth include:
• Antenatal care: routine care for the healthypregnant woman
• Fertility: assessment and treatment for peoplewith fertility problems
• Caesarean section• Type 1 diabetes: diagnosis and management of
type 1 diabetes in children and young people• Long-acting reversible contraception: the effective
and appropriate use of long-acting reversiblecontraception
• Urinary incontinence: the management of urinaryincontinence in women
• Heavy menstrual bleeding• Feverish illness in children: assessment and initial
management in children younger than 5 years
Guidelines in production include:• Diabetes in pregnancy• Induction of labour (update)• Antenatal care (update)• Management of atopic eczema in children• When to suspect child maltreatment• Diarrhoea and vomiting• Surgical management of otitis media with effusion• Surgical site infection
Enquiries regarding the above guidelines can beaddressed to:
National Collaborating Centre for Women’s andChildren’s HealthKing’s Court, Fourth Floor2–16 Goodge StreetLondonW1T [email protected]
A version of this guideline for the public is available from the NICEwebsite (www.nice.org.uk/CG055) or from the NHS Response Line(0870 1555 455); quote reference number N1327.
Published by the Royal College ofObstetricians and Gynaecologists.To purchase further copies and for
a complete list of RCOG Press titles,visit: www.rcogbookshop.com
• Urinary tract infection in children: diagnosis,treatment and long-term management