analysis of flows and speeds of urban transit systems for consideration … · urban transit...
TRANSCRIPT

Analysis of flows and speeds of urban transit systems for consideration of modal transition in a corridor
R. S. Thilakaratne, S. C. Wirasinghe & J. Hubbell
Department of Civil Engineering, Schulich School of Engineering, University of Calgary, Canada
Abstract
As a transit corridor evolves with time (over several decades) due to land use and other changes, the public transit mode (or mix of modes) that serves it may have to transition from one to another several times. Two of the significant characteristics that must be considered in the transition are the capacity and average speed of each mode, since they impact passenger waiting times and in-vehicle travel times, respectively, as well as operating costs. Data on stated, as well as observed, maximum flows and average speeds of routes have been collected from many sources and analysed. In addition to intrinsic variations, there is considerable scatter in the data caused, in part, by the lack of information about the differences in the transit systems for which data are available, e.g. the number of transit routes passing through a corridor. Various modes considered suitable for the south Calgary corridor are ranked in terms of line capacity and average speed. The thresholds are those at which a mode transition is essential. However, mode transitions may occur well in advance of such thresholds, if a new modal mix is optimal for the corridor in terms of minimizing the sum of the costs to the users and the operator. Some preliminary results on the optimal mix of regular and express bus services in a given corridor are discussed, including the travel demand estimates and transit system parameters under which a transition from the regular bus mode to an optimal mix is mandated. Keywords: transit modes, transit corridors, mode selection, transit decision criteria, capacity, travel time.
www.witpress.com, ISSN 1743-3509 (on-line) WIT Transactions on The Built Environment, Vol 116, © 2011 WIT Press
Urban Transport XVII 251
doi:10.2495/UT110221

1 Introduction
In terms of public transportation, a corridor is a more densely populated strip of land connecting two or more urban areas served with a bundle of transit routes [1]. It can be viewed as a linear or curvilinear concentration of land use activities in which significant travel takes place via public transit [2]. The land use concentration along a corridor has a significant interaction with the transit infrastructure and services provided. The relationship between transit and land use evolves over a long period of time. Concentrations of appropriate land use and an urban form that encourages passenger activities are the basic foundations for the provision of public transit. Transit corridors exhibit levels of demand at near capacity; and, the users who make longer trips and place higher premiums on travel time, convenience and comfort seek a better quality of transit travel than conventional bus service. The provision of permanent transit services with well-organized service intensity and an appropriate transit mode that satisfies the passenger demand are equally important as a corridor intensifies and lengthens over time [2]. There are many transit modes, technologies and operating strategies to apply within developing transit corridors [2, 3]. The selection of a mode has a significant impact on level of service, capital and operating costs, energy use, environmental impacts and transit market development [4, 5]. The mode selection and evaluation at the best possible transition points can be explored, in terms of the transit system requirements of users, operator and community, for a given growing corridor over time. The users must be considered as the most important party, since they are the customers for whom the system is provided. The transit system operator (transit agency) must cater to the users. The requirements of the transit agency are the maximization of the efficiency of the system and minimization of the operator costs of the service. All these parties are unified in acquiring a sustainable public transit service. A systematic mode evaluation process is necessary to assess and sustain high-quality modes of transit. The main concept explored in this study is the provision of a systematic framework for public transit mode progression from low-performance to high-performance transit technologies. Regular bus, limited-stop (express) bus, bus rapid transit (BRT), busways, light rail transit (LRT) and metro are considered as the candidate public transit modes in this analysis. Practical line capacity and average speed ranges of each mode reported from actual public transit routes are explored. The strategy of this research is to begin with the simplest mode evaluation scenario, building on the results for more complex problems. Consequently, moving from regular bus service to regular plus express bus service is analysed as the initial baseline. The review of previous literature included general evaluation and optimization of transportation systems, performance measurement frameworks, and evolution of modes with case studies. There is a substantial amount of peer-reviewed literature on the general design and optimization of transit service in a
www.witpress.com, ISSN 1743-3509 (on-line) WIT Transactions on The Built Environment, Vol 116, © 2011 WIT Press
252 Urban Transport XVII
given corridor [5–11]. The relationship between rail line location within a corridor and land use was explored in [3] and, [12]. On that basis, the establishment of the optimal termini locations and pre-calculation of the line extensions with future land use changes for a rail line within a corridor at a given time were investigated. However, generic study of the evolution of transit services within a corridor via mode changes over time has not been directly addressed. A number of descriptive studies have been carried out on the evaluation of the performance of transportation systems in public transit corridors, from regular bus service to BRT [13–15] and busways to LRT [16–20].
2 Mode transition considerations (observed capacity and average speed)
Long-term transit planning is needed for expanding existing transit systems or developing a new capital intensive facility [21]. One of the most important reasons for the evaluation of public transit modes is a change in ridership. The operator of a transit system makes sure that the system can provide capacity for the required services. However, when ridership pressures the available service volume; and, if it is not further expanded, many service qualities of the transit line, such as operating speed, comfort and reliability, will be negatively affected. Thus, the cut-off limit of ridership (or capacity) for a particular public transit mode is a key factor for introducing a new transit mode in a corridor. Capacity is defined as the maximum number of passengers that a transit line can carry per unit of time. It’s generally measured by passengers per hour per direction (pphpd). The observed maximum directional transit passenger flows in a public transit line is, therefore, of great importance. The ridership is also a reflection of land use activities (employment, places of residences, commercial centres, etc.) within the service area of the transit corridor. The average speed is related to the amount of average in-vehicle travel time required to traverse a unit of distance in a transit corridor and is generally measured in kilometres per hour (kph). The passengers are interested in high operating speeds, which result in shorter passenger travel times, influencing the mode’s appeal to passengers. Thus, speed is one of the basic elements that determines the level of service with respect to passengers. It also influences the operator’s cost within the transit corridor. The operator pays particular attention to the speed on the lines, due to the impact on fleet size, labour costs, maintenance and fuel consumption [22]. Different transit modes have varying travel speeds when climbing grades, carrying heavy loads, turning through a curve, or travelling in mixed traffic. This analysis focuses on average speed to relate to the prospective trip time. The other significant factors that have a major influence on observed passenger flows and speeds are also taken into account, i.e. headway, vehicle sizes (standard, articulated, bi-articulated or combined types), number of vehicles per train, number of shared routes and the right of way and signal priority
www.witpress.com, ISSN 1743-3509 (on-line) WIT Transactions on The Built Environment, Vol 116, © 2011 WIT Press
Urban Transport XVII 253

utilized by the urban transit systems. However, there can still be wide variations in speeds and observed flows, due to other factors, such as the fare collection and boarding method and the traffic congestion, etc. These have not been considered in this analysis because of the lack of accurate information. The study also implies that further categorization, where the observations are tied with similar features, will cause the variance to be further narrowed down. A database was developed from all available sources for transit line speeds and capacities or observed maximum flows. Figures 1 and 2 illustrate the observed minimum/maximum speed and capacity of various modes, respectively, in ascending order from main line bus to metro. This information is illustrative only, as there is great variability in system capacities and speeds.
Figure 1: Speed ranges by mode.
Figure 2: Line capacity ranges by mode.
Ave
rage
Spe
ed (
kph)
10 14 10 10 11
3026
45 4050 54
60
0102030405060708090
Reg_Bus Exp_Bus BRT Busway LRT Metro
1100 1150 1750 1000 1310110004000
784015000
2790018892
81000
0100002000030000400005000060000700008000090000
Reg_Bus Exp_Bus BRT Busway LRT Metro
Lin
e C
apac
ity (
pphp
d)
www.witpress.com, ISSN 1743-3509 (on-line) WIT Transactions on The Built Environment, Vol 116, © 2011 WIT Press
254 Urban Transport XVII
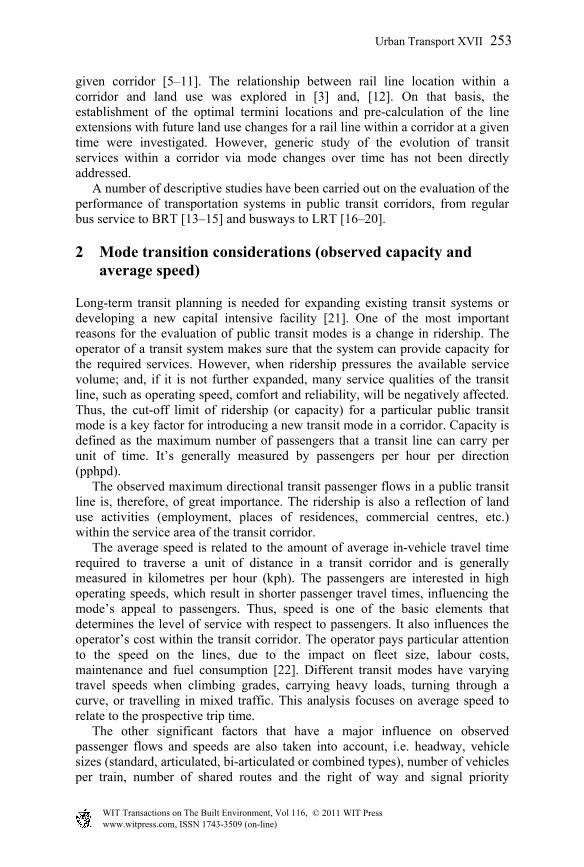
3 Data analysis
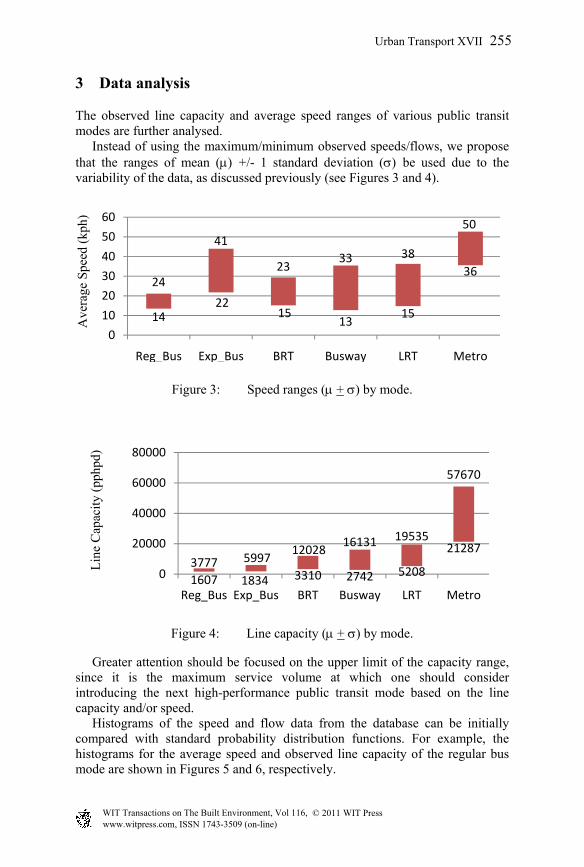
The observed line capacity and average speed ranges of various public transit modes are further analysed. Instead of using the maximum/minimum observed speeds/flows, we propose that the ranges of mean (+/- 1 standard deviation (be used due to the variability of the data, as discussed previously (see Figures 3 and 4).
Figure 3: Speed ranges ( + ) by mode.
Figure 4: Line capacity ( + ) by mode.
Greater attention should be focused on the upper limit of the capacity range, since it is the maximum service volume at which one should consider introducing the next high-performance public transit mode based on the line capacity and/or speed. Histograms of the speed and flow data from the database can be initially compared with standard probability distribution functions. For example, the histograms for the average speed and observed line capacity of the regular bus mode are shown in Figures 5 and 6, respectively.
1422
1513 15
3624
41
2333 38
50
0102030405060
Reg_Bus Exp_Bus BRT Busway LRT Metro
Ave
rage
Spe
ed (
kph)
1607 1834 3310 2742 5208
212873777 5997 12028 16131 19535
57670
0
20000
40000
60000
80000
Reg_Bus Exp_Bus BRT Busway LRT Metro
Lin
e C
apac
ity (
pphp
d)
www.witpress.com, ISSN 1743-3509 (on-line) WIT Transactions on The Built Environment, Vol 116, © 2011 WIT Press
Urban Transport XVII 255

Figure 5: Histogram for the average speed of “regular bus”.
Figure 6: Histogram for the observed line capacity of “regular bus”.
A goodness of fit measure is a key indicator for matching observed frequencies with a theoretical model. In other words, it indicates whether or not it is reasonable to assume that the data can be described by a specific distribution. The chi-squared values for testing statistical distributions that fit the data for line capacity and average speed of each public transit mode were determined. How well a distribution fits a statistical variable was ranked accordingly. Some of the best fits are not familiar among user groups in real practice. There would be, however, a most familiar closest (next best) fit that would be familiar among the user groups (Tables 1 and 2).
Probability Density Function
Histogram Normal
x262422201816141210
f(x)
0.32
0.28
0.24
0.2
0.16
0.12
0.08
0.04
0
Probability Density Function
Histogram Gamma
x400035003000250020001500
f(x)
0.36
0.32
0.28
0.24
0.2
0.16
0.12
0.08
0.04
0
Average Speed (kph)
Observed Line Capacity (pphpd)
www.witpress.com, ISSN 1743-3509 (on-line) WIT Transactions on The Built Environment, Vol 116, © 2011 WIT Press
256 Urban Transport XVII

Table 1: The best and most familiar closest fits for the average speed data.
Transit Mode The Best Fit The Most Familiar
Closest Fit
Regular Bus Pareto Normal
Express Bus Gen. Extreme Value Normal
Bus Rapid Transit Burr Beta
Busway Gen. Logistic Gamma
Light Rail Transit Frechet Beta
Metro Wakeby ChiSqr
Table 2: The best and most familiar closest fits for the observed line capacity data.
Transit Mode The Best Fit The Most Familiar
Closest Fit
Regular Bus Gumbel Max Gamma
Express Bus Weibull Gamma
Bus Rapid Transit Weibull Normal
Busway Phased Bi-Weibull Gamma
Light Rail Transit Burr Beta
Metro Log-Pearson3 Beta
Fine-tuned mean values with narrowed standard deviations can be obtained if the mode-related classes can be further subcategorized according to characteristics for which data is not currently available.
4 Ranking order (order of performance) of public transit modes
The relationship among public transit modes is illustrated in Figure 7, which plots transit productive capacity in terms of commercial (operating) speeds versus functional line capacity. The productive capacity is the product of
www.witpress.com, ISSN 1743-3509 (on-line) WIT Transactions on The Built Environment, Vol 116, © 2011 WIT Press
Urban Transport XVII 257

operating speed and capacity of the line. It is a very convenient performance indicator for mode evaluation. This composite indicator incorporates capacity, which concerns the operator, and speed, which affects both the passengers and the operator. The boxes interpret the lower and upper bounds from the literature [23]. The trend line produced by the mean values shows the general order of mode evaluation on a public transit corridor. The connected dotted lines show the + and + 2 ranges for each candidate public transit mode for further comparison. These capacity ranges derived from the transit database are within the ranges suggested by [5, 23].
Figure 7: Comparative transit productive capacity.
5 Mode succession example – south Calgary corridor
The City of Calgary, in Alberta, Canada, has a history of successful transit services that have evolved in pace with community growth around the central downtown core and residential and industrial developments in other parts of the city. The evolution of transit modes suitable for the south Calgary corridor (Figure 8), ranked in terms of the line capacity over the decades, is considered here. A study in 1958 reported that the transit system in the south Calgary corridor served 29% of downtown travel during peak periods [2, 24]. The increase in south corridor peak-hour ridership for transit over the decades from 1964 (Table 3) is shown in Figure 9 and illustrated by a polynomial function (3rd order, R2 = 0.987) (blue coloured line) and by a linear function (R2 = 0.943) (red coloured line). The functions can be considered as good fits, since the R-squared values fall close to 1 [25].
Ave
rage
Spe
ed (
kph)
Line Capacity (pphpd)
www.witpress.com, ISSN 1743-3509 (on-line) WIT Transactions on The Built Environment, Vol 116, © 2011 WIT Press
258 Urban Transport XVII

Figure 8: South Calgary transit corridor.
In Figure 9, the X-axis indicates the flow of time in decades, while capacity values are shown on the Y-axis. The increase in demand (maximum load per hour in the corridor) for transit over the decades is shown as an exponentially increasing function of time. The thresholds are drawn with horizontal lines numbered for each transit mode. The points at which the demand function crosses the modal capacity thresholds are the times at which mode transition is needed. The strategy of this research is to begin with the simplest mode evaluation scenario and build on these results for more complex problems. Moving from regular bus service to express bus service is consequently analysed as the initial baseline of the systematic framework. Some preliminary steps on the optimal mix of regular and express bus services in a given corridor are discussed.
Table 3: South corridor ridership and demographic history.
Peak Period / Peak
Direction at Downtown
All Day Downtown
Trips In and Out
South Corridor
Total Daily Passengers
South Corridor
Population
Downtown Employment
1964 n/a 4,000 6,000 45,100 40,000 1973 4,000 8,000 10,000 130,000 50,000 1982 7,000 28,300 42,000 137,000 82,000 1990 8,000 30,000 44,000 168,000 92,000 2000 13,000 38,200 54,500 190,000 103,000 2008 17,600 61,500 82,000 230,000 120,000
Peak Period = 6 to 9 am, 3 to 6 pm
www.witpress.com, ISSN 1743-3509 (on-line) WIT Transactions on The Built Environment, Vol 116, © 2011 WIT Press
Urban Transport XVII 259

Figure 9: Matching line capacity to demand over decades.
6 Transition from regular bus service to regular plus express service
It can be difficult to accurately evaluate the success of express bus service with existing parallel regular bus service if the evaluation process does not recognize differences in the contribution of each service. This lack of clarity impedes the efforts of transit agencies to implement competitive express bus services in areas where they can be most effective. Combined regular/express bus operation may be more efficient than a regular bus system by on average making fewer stops, running at higher average operating speeds and offering greater comfort to passengers. If the only concern is about the level of service given to passengers, every local bus route can be improved with additional express service. However, consideration of the cost of operations causes the provision of such services to be limited. We consider the beginning and ending points of the express route within the regular route, the stops at which express service is provided, the frequency of the express buses and the capacity of the vehicles. Since express bus service will take away some of the demand from the regular service, the frequency of that service must be re-evaluated. One also has to take in account whether the express buses are to be run to a timetable or at a given frequency. The optimal combined system, which will minimize the sum of passenger costs and operating costs, can range from no express service to significant express service. In theory, one may have even more than one express service – say a regular bus line, a blue express line and a red express line, where the two express lines serve almost distinct sets of stops.
www.witpress.com, ISSN 1743-3509 (on-line) WIT Transactions on The Built Environment, Vol 116, © 2011 WIT Press
260 Urban Transport XVII

There are additional operating costs with express bus service, while the operating cost of the regular route is decreased. The candidate express bus route can be built up gradually by considering and adding bus stop pairs that have the highest amount of passenger hours of travel time; and, at some point, the combined regular/express bus operation may become optimal, compared to the original regular bus route. Thus, express bus service on a portion of the route may be considered as a natural mode progression.
7 Conclusion
The results of this investigation suggest that the relative performances of urban transit systems can be ranked in the order of regular bus, express bus, BRT, busways, LRT and metro. The knowledge gained from this study explores avenues for further work in comparing empirical data and obtaining improved values for line capacity and average speed. It can be noted that the move from conventional bus service towards express bus service can minimize the total system cost and also facilitate retention of ridership. However, it leaves an unanswered question: Under what conditions is express bus service warranted on existing local bus routes and from where to where? The configuration of regular/express bus service can be viewed as the initial baseline for the mode propagation.
References
[1] Merriam-Webster Online Dictionary, (2010). Retrieved August 6, 2010, from http://www.merriam-webster.com/dictionary/corridor
[2] Hubbell, J., Wirasinghe, S.C., McKendrick, N.,Morgan, D., Wong, F. and Thilakaratne, R. (2009). Mode Succession in a Public Transit Corridor. Urban Transport XV. Urban Transport and the Environment (pp. 23-24). Bologna, Italy: WIT Press.
[3] Wirasinghe, S.C. (2002). Optimal Terminus Location for a Rail Line with Many to Many Travel Demand. Proceedings of the 15th ISTTT On Transportation and Traffic Theory in the 21st Century, (pp. 75-98). Pergammon.
[4] Parajuli, P.M. and Wirasinghe, S.C. (2001). A line haul transit technology selection model. Transportation Planning and Technology, 24(4), 271-308.
[5] Vuchic, V. (2007). Urban Transit Systems and Technology. Hoboken, NJ: John Wiley & Sons, Inc.
[6] Chang S.K. and Schonfeld P.M. (1991). Multiple Period Optimization of Bus Transit. Transportation Res. B, 25B(6), 453-478.
[7] Liu, G. and Wirasinghe, S.C. (2001). A Simulation Model of Schedule Design for a Fixed Transit Route. Journal of Advanced Transportation, 35(2), 145-174.
www.witpress.com, ISSN 1743-3509 (on-line) WIT Transactions on The Built Environment, Vol 116, © 2011 WIT Press
Urban Transport XVII 261

[8] Wirasinghe, S. (1990). Re-Examination of Newell’s Dispatching Policy and Extension To a Bus Route with Many to Many Time Varying Demand. The Eleventh International Symposium On Transportation and Traffic Theory (pp. 363-378). M. Koshi, Elsevier.
[9] Anderson, J. (1984). Optimization of Transit-System Characteristics. Journal of Advanced Transportation, 18(1), 77-111.
[10] Hurdle, V.A. (1980). Location of Rail Stations for many to One Travel Demand and Several Feeder Modes. Journal of Advanced Transportation, 29-46.
[11] Newell, G.F. (1973). Scheduling, location, transportation and continuous mechanics:some simple approximations to optimization problems. SIAM Journal of Applied Mathematics, 25(3), 346-360.
[12] Wirasinghe, S.C. and Seneviratne P. (1986). Rail Line Length in an Urban Transportation Corridor. Transportation Science, 20(4), 237-245.
[13] (FTA), Federal Transit Administration. (1999). FTA Announces Projects Selected for Bus Rapid Transit Demonstration Program. Retrieved from http://www.fta.dot.gov
[14] Jarzab, J.T., Lightbody, J. and Maeda, E. (2002). Characteristics of Bus Rapid Transit Projects: An Overview. Journal of Public Transportation, 5(2).
[15] Callagham, L. and Vincent, W. (2007). Preliminary Evaluation of Metro Orange Line Bus Rapid Transit Project. Journal of the Transportation Research Board, No. 2034 , 37-44.
[16] Morris, J. (1975). Comparison of Busway and Light Rail Modes. Transportation Research Board, Issue Number: 161.
[17] Spencer, A.A. (1996). Light rail or busway? A comparative evaluation for a corridor in Beijing. Journal of Transport Geography, 4(4), 239-251.
[18] Maternelli, D. (1996). A systematic review of busways. Journal of Transportation Engineering, 122(3), Paper No. 9762.
[19] Rathwell, S.A. (2002). Ottawa and Brisbane: Comparing a Mature Busway System with Its State-of-the-Art Progeny. Journal of Public Transportation, 5(2), 163-182.
[20] James, D. (2008). Ottawa’s Transitway: From Busway to Light Rail. MSC Thesis, UofC.
[21] Weant, R.A. and Levinson H.S. (1990). Parking. Eno Foundation for Transportation. Inc., Westport, CT.
[22] Wirasinghe, S. (1987). Optimization and Analytical Modeling in Transit Planning – Application to a Commuter Bus Route with Uniform Stop Spacing. Transportation System Analysis and Policy Studies, 182-188.
[23] Vuchic, V. (2005). Urban Transit Operations, Planning, and Economics. Hoboken, NJ: John Wiley & Sons, Inc.
[24] Ewens, E. (1958). Transit Report of the Calgary Transportation Study. Calgary, Canada.
[25] Hazewinkel, M. (2002). Encyclopaedia of Mathematics. Retrieved from SpringerLink: http://eom.springer.de/default.htm
www.witpress.com, ISSN 1743-3509 (on-line) WIT Transactions on The Built Environment, Vol 116, © 2011 WIT Press
262 Urban Transport XVII