analysis of ecg signal for detection of cardiac arrhythmias
TRANSCRIPT
5/11/2018 Analysis of ECG Signal for Detection of Cardiac Arrhythmias - slidepdf.com
http://slidepdf.com/reader/full/analysis-of-ecg-signal-for-detection-of-cardiac-arrhythmia
Analysis of ECG signal for Detection of
Cardiac Arrhythmias
A THESIS SUBMITTED IN PARTIAL FULFILLMENT
OF THE REQUIREMENTS FOR THE DEGREE OF
Master of Technology
in
Telematics and Signal Processing
By
JAYA PRAKASH SAHOO
Roll No: 209EC117
Department of Electronics and Communication Engineering
National Institute Of Technology, Rourkela
Orissa 769 008, INDIA
2011
5/11/2018 Analysis of ECG Signal for Detection of Cardiac Arrhythmias - slidepdf.com
http://slidepdf.com/reader/full/analysis-of-ecg-signal-for-detection-of-cardiac-arrhythmia
Analysis of ECG signal for Detection of
Cardiac Arrhythmias
A THESIS SUBMITTED IN PARTIAL FULFILLMENT
OF THE REQUIREMENTS FOR THE DEGREE OF
Master of Technology
in
Telematics and Signal Processing
By
JAYA PRAKASH SAHOO
Roll No: 209EC117
Under the Guidance of
Dr. Samit AriAssistant Professor
Department of Electronics and Communication Engineering
National Institute Of Technology, Rourkela
Orissa 769 008, INDIA
2011

5/11/2018 Analysis of ECG Signal for Detection of Cardiac Arrhythmias - slidepdf.com
http://slidepdf.com/reader/full/analysis-of-ecg-signal-for-detection-of-cardiac-arrhythmia
Dedicated to
To My Parents, My brother and My Sister

5/11/2018 Analysis of ECG Signal for Detection of Cardiac Arrhythmias - slidepdf.com
http://slidepdf.com/reader/full/analysis-of-ecg-signal-for-detection-of-cardiac-arrhythmia
This is to certify that the t
Arrhythmias” submitted by
for the award of Master of
with specialization in “Tel
National Institute Of Techno
and guidance.
To the best of my knowledg
other university / institute for
Date:
ATIONAL INSTITUTE OF TECHNOLOGY
ROURKELA
CERTIFICATECERTIFICATECERTIFICATECERTIFICATE
esis titled “Analysis of ECG signal for
Mr. Jaya Prakash Sahoo in partial fulfillm
echnology degree Electronics & Commu
matics and Signal Processing” during
logy, Rourkela is an authentic work by his
, the matter embodied in the thesis has not
the award of any Degree or Diploma.
Dept. of Electronics
National I
Detection of Cardiac
nt of the requirements
nication Engineering
session 2009-2011 at
under my supervision
been submitted to any
Dr. Samit AriAssistant Professor
& Comm. Engineering
nstitute of Technology
Rourkela-769008

5/11/2018 Analysis of ECG Signal for Detection of Cardiac Arrhythmias - slidepdf.com
http://slidepdf.com/reader/full/analysis-of-ecg-signal-for-detection-of-cardiac-arrhythmia
Acknowledgement
I would like to express my gratitude to my supervisor Prof. Samit Ari for his guidance,
advice and constant support throughout my thesis work. I would like to thank him for being my
advisor here at National Institute of Technology, Rourkela.
Next, I want to express my respects to Prof. S.K. Patra, Prof. K. K. Mahapatra, Prof. S.
Meher, Prof. S. K. Behera, Prof. Poonam Singh, Prof. A. K. Sahoo, Prof. D. P. Acharya, prof.
S.K. Das and Prof. N. V. L. N. Murty for teaching me and also helping me how to learn. They
have been great sources of inspiration to me and I thank them from the bottom of my heart.
I would like to thank all faculty members and staff of the Department of Electronics and
Communication Engineering, N.I.T. Rourkela for their generous help in various ways for the
completion of this thesis.
I would also like to mention the names of Manab, Dipak, Trilochan, Upendra and Sudhansu
all the PhD student of DSP lab for helping me a lot during the thesis period.
I would like to thank all my friends and especially my classmates for all the thoughtful and
motivating discussions we had, which encouraged me to think beyond the observable. I have
enjoyed their companionship so much during my stay at NIT, Rourkela.
I am especially grateful to my parents for their love and support and would like to thank my
parents for raising me in a way to believe that I can achieve anything in life with hard work and
dedication.
Date: Jaya Prakash Sahoo
Place: Roll No: 209EC117
Dept of ECE, NIT, Rourkela
5/11/2018 Analysis of ECG Signal for Detection of Cardiac Arrhythmias - slidepdf.com
http://slidepdf.com/reader/full/analysis-of-ecg-signal-for-detection-of-cardiac-arrhythmia
Table of Contents ABSTRACT ................................................................................................................................. i
LIST OF FIGURES ..................................................................................................................... ii LIST OF TABLES ..................................................................................................................... iv LIST OF ABBREVIATIONS ..................................................................................................... v
CHAPTER 1 .................................................................................................................................. 1 Introduction ................................................................................................................................... 1
1.1 Electrocardiogram ................................................................................................................. 2 1.2 The heart anatomy ................................................................................................................. 2 1.3 Leads in ECG ........................................................................................................................ 3 1.4 ECG waves and interval ........................................................................................................ 5 1.5 Noise in ECG Signal ............................................................................................................. 7
1.5.1 Power line interferences ................................................................................................. 7 1.5.2 Baseline drift................................................................................................................... 7
1.5.3 Motion artifacts............................................................................................................... 8 1.5.4 Muscle contraction (EMG) ............................................................................................. 8
1.6 Arrhythmias in ECG signal ................................................................................................... 9 1.6.1 Sinus Node Arrhythmias .............................................................................................. 10 1.6.2 Atrial Arrhythmias ........................................................................................................ 10 1.6.3 Junctional Arrhythmias................................................................................................. 11 1.6.4 Ventricular arrhythmias ................................................................................................ 12 1.6.5 Atrioventricular Blocks ................................................................................................ 13 1.6.6 Bundle Branch blocks ................................................................................................... 13
1.7 ECG Database ..................................................................................................................... 14 1.7.1 MIT-BIH Arrhythmias database ................................................................................... 14 1.7.2 AAMI Standard ............................................................................................................ 14
1.8 Motivation ........................................................................................................................... 15
5/11/2018 Analysis of ECG Signal for Detection of Cardiac Arrhythmias - slidepdf.com
http://slidepdf.com/reader/full/analysis-of-ecg-signal-for-detection-of-cardiac-arrhythmia
1.9 Thesis Outline ..................................................................................................................... 16 References ................................................................................................................................. 16
CHAPTER 2 ................................................................................................................................ 18 QRS Complex Detection............................................................................................................. 18
2.1 Introduction ......................................................................................................................... 19 2.2 Hilbert transform ................................................................................................................. 19 2.3Methodology ........................................................................................................................ 20
2.3.1 Filtering ........................................................................................................................ 21 2.3.2 Differentiation .............................................................................................................. 21 2.3.4 Period calculation using autocorrelation ...................................................................... 22 2.3.5 Sub window creation .................................................................................................... 23 2.3.6 High slope point detection using Hilbert transform ..................................................... 23 2.3.7 Adaptive threshold for noise removing ........................................................................ 24 2.3.8 T wave discrimination .................................................................................................. 25 2.3.9 Second stage detector to find Q and S point ................................................................. 25
2.4 Result and discussion .......................................................................................................... 25 2.5 Conclusion ........................................................................................................................... 28 References ................................................................................................................................. 28
CHAPTER 3 ................................................................................................................................ 30 Feature Extraction of ECG Signal ............................................................................................ 30
3.1 Introduction ......................................................................................................................... 31 3.2 Methodology ....................................................................................................................... 31
3.2.1 RR-Interval Features ..................................................................................................... 32 3.2.2 Heartbeat Interval Features ........................................................................................... 32 3.2.3 ECG Morphology Features ........................................................................................... 33
3.4 Simulation result ................................................................................................................. 34 2.5 Conclusion ........................................................................................................................... 38

5/11/2018 Analysis of ECG Signal for Detection of Cardiac Arrhythmias - slidepdf.com
http://slidepdf.com/reader/full/analysis-of-ecg-signal-for-detection-of-cardiac-arrhythmia
References ................................................................................................................................. 38 CHAPTER 4 ................................................................................................................................ 40 Classification of Cardiac Arrhythmias ..................................................................................... 40
4.1 Introduction ......................................................................................................................... 41 4.2 Multilayer perception back propagation (MLP-BP) neural network .................................. 42 4.3 Radial basis function neural network (RBFNN) ................................................................. 43 4.4 Performance matrix ............................................................................................................. 45 4.5 Classification Performance ................................................................................................. 46 4.6 Conclusion ........................................................................................................................... 51 References ................................................................................................................................. 52
CHAPTER 5 ................................................................................................................................ 54 Conclusion and Future work ..................................................................................................... 54
5.1 Conclusion ........................................................................................................................... 55 5.2 Future scope ........................................................................................................................ 56 5.3 References ........................................................................................................................... 56
5/11/2018 Analysis of ECG Signal for Detection of Cardiac Arrhythmias - slidepdf.com
http://slidepdf.com/reader/full/analysis-of-ecg-signal-for-detection-of-cardiac-arrhythmia
i
ABSTRACT
Electrocardiogram (ECG), a noninvasive technique is used as a primary diagnostic tool for cardiovascular diseases.
A cleaned ECG signal provides necessary information about the electrophysiology of the heart diseases and
ischemic changes that may occur. It provides valuable information about the functional aspects of the heart and
cardiovascular system. The objective of the thesis is to automatic detection of cardiac arrhythmias in ECG signal.
Recently developed digital signal processing and pattern reorganization technique is used in this thesis for detection
of cardiac arrhythmias. The detection of cardiac arrhythmias in the ECG signal consists of following stages:
detection of QRS complex in ECG signal; feature extraction from detected QRS complexes; classification of beats
using extracted feature set from QRS complexes. In turn automatic classification of heartbeats represents the
automatic detection of cardiac arrhythmias in ECG signal. Hence, in this thesis, we developed the automatic
algorithms for classification of heartbeats to detect cardiac arrhythmias in ECG signal.
QRS complex detection is the first step towards automatic detection of cardiac arrhythmias in ECG signal. A novel
algorithm for accurate detection of QRS complex in ECG signal is proposed in chapter 2 of this thesis. The detection
of QRS complex from continuous ECG signal is computed using autocorrelation and Hilbert transform based
technique. The first differential of the ECG signal and its Hilbert transformed is used to locate the R-peaks in the
ECG waveform. The autocorrelation based method is used to find out the period of one cardiac cycle in ECG signal.
The advantage of proposed method is to minimize the large peak of P-wave and T-wave, which helps to identify the
R-peaks more accurately. Massachusetts Institute of Technology Beth Israel Hospital (MIT-BIH) arrhythmias
database has been used for performance analysis. The experimental result shows that the proposed method shows
better performance as compared to the other two established techniques like Pan-Tompkins (PT) method and thetechnique which uses the difference operation method (DOM).
For detection of cardiac arrhythmias, the extracted features in the ECG signal will be input to the classifier. The
extracted features contain both morphological and temporal features of each heartbeat in the ECG signal. Twenty six
dimension feature vector is extracted for each heartbeat in the ECG signal which consist of four temporal features,
three heartbeat interval features, ten QRS morphology features and nine T-wave morphology features.
Automatic classification of cardiac arrhythmias is necessary for clinical diagnosis of heart disease. Many researchers
recommended Association for the Advancement of Medical Instrumentation (AAMI) standard for automatic
classification of heartbeats into following five beats: normal beat (N), supraventricular ectopic beat (S), ventricular
ectopic beat (V), fusion beat (F) and unknown beat (Q). The beat classifier system is adopted in this thesis by first
training a local-classifier using the annotated beats and combines this with the global-classifier to produce an
adopted classification system. The Multilayer perceptron back propagation (MLP-BP) neural network and radial
basis function (RBF) neural network are used to classify the cardiac arrhythmias. Several experiments are performed
on the test dataset and it is observed that MLP-BP neural network classifies ECG beats better as compared to RBF
neural network.
5/11/2018 Analysis of ECG Signal for Detection of Cardiac Arrhythmias - slidepdf.com
http://slidepdf.com/reader/full/analysis-of-ecg-signal-for-detection-of-cardiac-arrhythmia
ii
LIST OF FIGURES
Fig. 1.1 The Heart conduction system [1]. 3 Fig. 1.2 Precordial chest electrodes are normally placed on the left side of the chest [1]. 4 Fig. 1.3 Schematic representation of normal ECG waveform. 5 Fig. 1.4 60 Hz Power line interference [6]. 7 Fig. 1.5 Baseline drifts in ECG signal. 8 Fig. 1.6 Motion artifacts in ECG signal [6]. 8 Fig. 1.7 Muscle contraction. 9 Fig. 1.8 (A) Normal sinus rhythm, (B) Sinus tachycardia 9 Fig. 1.9 Artial arrhythmias, (A) Premature Atrial Contractions, (B) atrial tachycardia, (C) Atrial
Flutter, (D) atrial fibrillation 11 Fig. 1.10 Junctional arrhythmias. 11 Fig. 1.11 Junctional arrhythmias (A) Premature Ventricular Contractions, (B) Ventricular
Tachycardia, (C) Ventricular Fibrillation [1]. 12
Fig. 0.12 Atrioventricular Blocks (A) first degree AV block, (B) Second degree AV block, (C)
Third degree AV blocks. 13 Fig. 1.13 Bundle Branch blocks. 13 Fig. 2.1 Block diagram representation of the proposed method for detection of QRS complex. 20 Fig. 2.2 ECG signal in the database MIT-BIH tape #100 in the range (0-1000) samples. (a)
channel-1output, (b) channel-2output, (c) band pass filter output. 21 Fig. 2.3 Sample beats from ECG signal of tape #100 in MIT-BIH database (a) band pass filter
output, (b) derivative output. 22 Fig. 2.4 ( a) filtered signal in the database MIT-BIH tape #100 in range 0-3s, (b) shifted version
of above signal with a time lag (step size) of 0.02s. 22
5/11/2018 Analysis of ECG Signal for Detection of Cardiac Arrhythmias - slidepdf.com
http://slidepdf.com/reader/full/analysis-of-ecg-signal-for-detection-of-cardiac-arrhythmia
iii
Fig. 2.5 Autocorrelation output between the signals of fig. 2.4. (a) and (b). The maximum
amplitude shows where two signals are correlated. The position where amplitude is maximum
shows the period of one cardiac cycle. 23 Fig. 2.6 The maximum peak of Hilbert transform output is the zero crossing of differentiation
output. 24 Fig. 2.7 The detected QRS point of signal tape #100 28
Fig. 3.1 (a) after getting fudicial point (FP), the QRS onset and offset and t-wave offset points
are found, b) after determining the FP nine samples of the ECG between FP-50 ms and FP + 100
ms and nine samples between FP+150 ms and FP+500 ms are extracted [7] 33 Fig. 3.2 Ten fixed interval morphology features of QRS complex (left) and nine fixed interval
morphology features of T-wave (right) of tape#100 in MIT/BIH database 34 Fig. 4.1 General Structure of multilayer neural network. 43 Fig. 4.2 General structure of the radial basis function neural network. 44 Fig. 4.3 Block diagram representation of ECG beat classifier. 45

5/11/2018 Analysis of ECG Signal for Detection of Cardiac Arrhythmias - slidepdf.com
http://slidepdf.com/reader/full/analysis-of-ecg-signal-for-detection-of-cardiac-arrhythmia
iv
LIST OF TABLES
Table 1.1 Types of leads used in ECG monitoring 4 Table 1.2 Amplitude and duration of waves, intervals and segments [6], [7], [8] of ECG signal. 6 Table 1.3 Mapping the MIT-BIH arrhythmia database heartbeat types to the AAMI heartbeat classes [15]
15 Table 2.1 The result of the proposed method for the signals in MIT-BIH database 26 Table 2.2 The comparison of the proposed method with the Pan-Tompkins (PT) method and difference
operation method (DOM). 27 Table 3.1 Feature groups considered in this study 32 Table 3.2 Cardiac arrhythmia beat types in MIT/BIH database 34 Table 3.3 Patient by patient report of each tape according to AAMI recommendation excluding the tape
contains paced beat 37 Table 3.4 Beat summery of MIT-BIH heartbeat types 38 Table 4.1ECG classes and representation of desired neural network output 46 Table 4.2 Comprehensive results for testing files of 24 records in MIT/BIH arrhythmia database 47 Table 4.3 Summary table of beat-by-beat classification of 24 records in MIT/BIH arrhythmia database 48 Table 4.4 Classification performance of 24 records in MIT/BIH arrhythmia database 48 Table4.5 SVEB result for testing files of 14 records in MIT/BIH arrhythmia database using MLP 48 Table 4.6 VEB result for testing files of 11 records in MIT/BIH arrhythmia database using MLP 49 Table 4.7 SVEB result for testing files of 14 records in MIT/BIH arrhythmia database using RBF 49
Table 4.8 VEB result for testing files of 11 records in MIT/BIH arrhythmia database using RBF 50 Table 4.9 SVEB and VEB comparison result are based on 14 and 11 common testing records respectively
50 Table 4.10 VEB and SVEB comparison result are based on 24 common testing records 51

5/11/2018 Analysis of ECG Signal for Detection of Cardiac Arrhythmias - slidepdf.com
http://slidepdf.com/reader/full/analysis-of-ecg-signal-for-detection-of-cardiac-arrhythmia
v
LIST OF ABBREVIATIONS
ECG Electrocardiogram
MIT-BIH Massachusetts Institute of Technology Beth Israel Hospital database
N Normal beat
L Left bundle branch block beat
R Right bundle branch block beat
A Atrial premature beat
a Aberrated atrial premature beat
J Nodal (junctional) premature beat
S Supraventricular premature beat
V Premature ventricular contraction
F Fusion of ventricular and normal beat
e Atrial escape beat j Nodal (junctional) escape beat
E Ventricular escape beat
/ Paced beat
F Fusion of paced and normal beat
Q Unclassifiable beat
MLP-BP Multilayer Perceptron back propagation
RBF Radial Basis Function
NaN Not a Number
N/A Not Analysed
AAMI Association for the Advancement of Medical Instrumentation

5/11/2018 Analysis of ECG Signal for Detection of Cardiac Arrhythmias - slidepdf.com
http://slidepdf.com/reader/full/analysis-of-ecg-signal-for-detection-of-cardiac-arrhythmia
1
CHAPTER 1
Introduction

5/11/2018 Analysis of ECG Signal for Detection of Cardiac Arrhythmias - slidepdf.com
http://slidepdf.com/reader/full/analysis-of-ecg-signal-for-detection-of-cardiac-arrhythmia
2
1.1 Electrocardiogram
Electrocardiogram (ECG) is a diagnosis tool that reported the electrical activity of
heart recorded by skin electrode. The morphology and heart rate reflects the cardiac health of
human heart beat [1]. It is a noninvasive technique that means this signal is measured on the
surface of human body, which is used in identification of the heart diseases [2]. Any disorder of
heart rate or rhythm, or change in the morphological pattern, is an indication of cardiac
arrhythmia, which could be detected by analysis of the recorded ECG waveform. The amplitude
and duration of the P-QRS-T wave contains useful information about the nature of disease
afflicting the heart. The electrical wave is due to depolarization and re polarization of Na+ and k -
ions in the blood [2].The ECG signal provides the following information of a human heart [3]:
• heart position and its relative chamber size
• impulse origin and propagation
• heart rhythm and conduction disturbances
• extent and location of myocardial ischemia
• changes in electrolyte concentrations
• drug effects on the heart.
ECG does not afford data on cardiac contraction or pumping function.
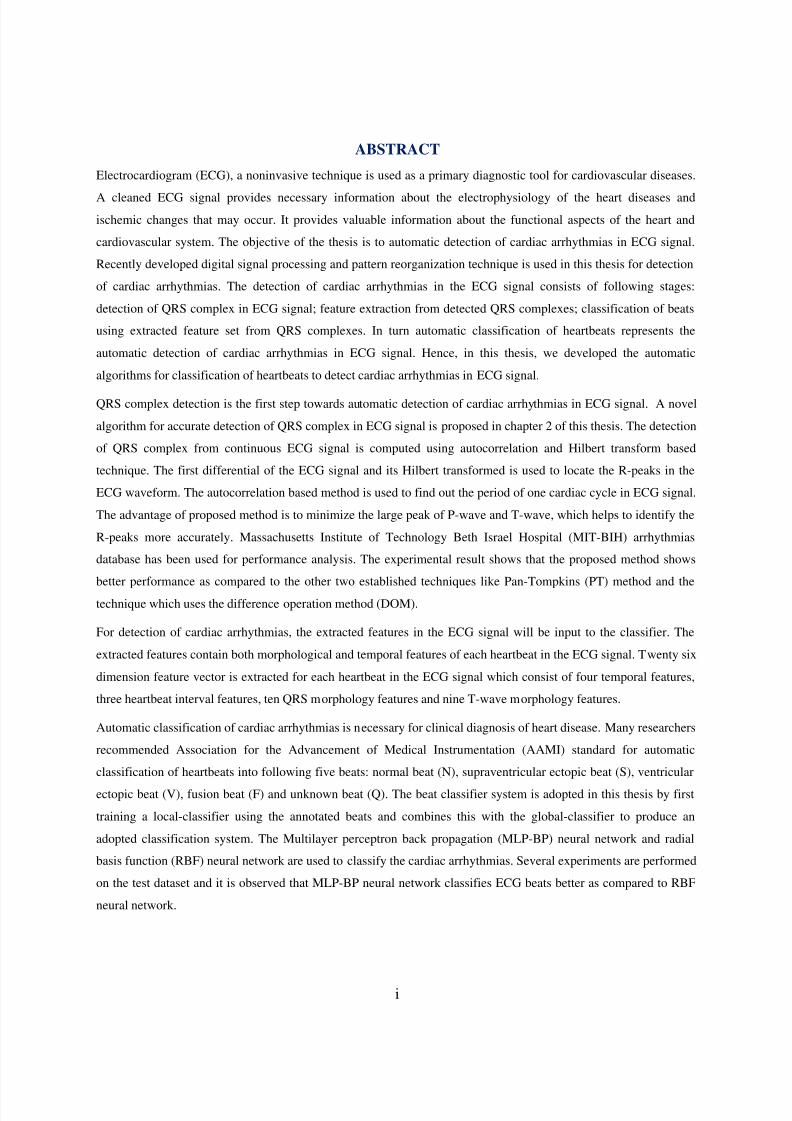
1.2 The heart anatomy
The heart contains four chambers that is right atrium, left atrium, right ventricle, left
ventricle and several atrioventricular and sinoatrial node as shown in the fig1.1 [1]. The two
upper chambers are called the left and right atria, while the lower two chambers are called the
left and right ventricles. The atria are attached to the ventricles by fibrous, non-conductive tissue
that keeps the ventricles electrically isolated from the atria. The right atrium and the rightventricle together form a pump to the circulate blood to the lungs. Oxygen-poor blood is received
through large veins called the superior and inferior vena cava and flows into the right atrium.
The right atrium contracts and forces blood into the right ventricle, stretching the ventricle and
maximizing its pumping (contraction) efficiency. The right ventricle then pumps the blood to the
lungs where the blood is oxygenated. Similarly, the left atrium and the left ventricle together
5/11/2018 Analysis of ECG Signal for Detection of Cardiac Arrhythmias - slidepdf.com
http://slidepdf.com/reader/full/analysis-of-ecg-signal-for-detection-of-cardiac-arrhythmia
3
form a pump to circulate oxygen-enriched blood received from the lungs (via the pulmonary
veins) to the rest of the body [4].
Fig. 1.1 The Heart conduction system [1].
In heart Sino-atrial (S-A) node spontaneously generates regular electrical impulses,
which then spread through the conduction system of the heart and initiate contraction of the
myocardium. Propagation of an electrical impulse through excitable tissue is achieved through a
process called depolarization. Depolarization of the heart muscles collectively generates a strong
ionic current [1]. This current flows through the resistive body tissue generating a voltage drop.The magnitude of the voltage drop is sufficiently large to be detected by electrodes attached to
the skin. ECGs are thus recordings of voltage drops across the skin caused by ionic current flow
generated from myocardial depolarisations[5]. Atrial depolarisation results in the spreading of
the electrical impulse through the atrial myocardium and appears as the P-wave. Similarly,
ventricular depolarisation results in the spreading of the electrical impulse throughout the
ventricular myocardium.
1.3 Leads in ECGThe standard ECG has 12 leads: which includes 3 - bipolar leads, 3 - augmented unipolar
leads and 3 - chest (precordial) leads. A lead is a pair of electrodes (+ve & -ve) placed on the
body in designated anatomical locations & connected to an ECG recorde [3].
Bipolar leads: record the potential difference between two points (+ve & -ve poles).
Unipolar leads: record the electrical potential at a particular point by means of a single exploring
electrode.
5/11/2018 Analysis of ECG Signal for Detection of Cardiac Arrhythmias - slidepdf.com
http://slidepdf.com/reader/full/analysis-of-ecg-signal-for-detection-of-cardiac-arrhythmia
4
Leads I, II and III are commonly referred to bipolar leads as they use only two electrodes to
derive a view. One electrode acts as the positive electrode while the other as the negative
electrode (hence bipolar) [1].
Table 1.1 Types of leads used in ECG monitoring
Einthoven leads:
Lead I: records potentials between the left and right arm,
Lead II: between the right arm and left leg, and
Lead III: those between the left arm and left leg
Goldberger leads are unipolar augmented limb leads in the frontal plane.
Unipolar Limb leads: (when the +ve terminal is on the right arm: aVR, left arm aVL, or left leg,
aVF)
One lead connected to +ve terminal acts as the different electrode, while the other two limbs are
connected to the –ve terminal serve as the indifferent (reference) electrode [5]. Wilson leads
(V1–V6) are unipolar chest leads positioned on the left side of the thorax in a nearly horizontal
plane. The indifferent electrode is obtained by connecting the 3 standard limb leads. When used
in combination with the unipolar limb leads in the frontal plane, they provide a three-
dimensional view of the integral vector.
Fig. 1.2 Precordial chest electrodes are normally placed on the left side of the chest [1].
Standard
LeadsLimb Leads Chest Leads
Bipolar leads Unipolar leads Unipolar leads
Lead I
Lead II
Lead III
AVR
AVL
AVF
V1V2
V3
V4
V5

5/11/2018 Analysis of ECG Signal for Detection of Cardiac Arrhythmias - slidepdf.com
http://slidepdf.com/reader/full/analysis-of-ecg-signal-for-detection-of-cardiac-arrhythmia
5
Chest (precordial) leads
V1: 4th intercostal space, right sternal edge.
V2: 4th intercostal space, left sternal edge.
V3: between the 2nd and 4th electrodes.
V4: 5th intercostal space in the midclavicular line.
V5: on 5th rib, anterior axillary line.
V6: in the midaxillary line.
To make recordings with the chest leads (different electrode), the three limb leads are
connected to form an indifferent electrode with high resistances. The chest leads mainly detect
potential vectors directed towards the back. These vectors are hardly detectable in the frontal
plane [1]. Since the mean QRS vector is usually directed downwards and towards the left back
region, the QRS vectors recorded by leads V1–V3 are usually negative, while those detected by
V5 and V6 are positive [5]. In leads V1 and V2, QRS = -ve because, the chest electrode in these
leads is nearer to the base of the heart, which is the direction of electronegativity during most of
the ventricular depolarization process. In leads V4, V5, V6, QRS = +ve because the chest
electrode in these leads is nearer the heart apex, which is the direction of electropositivity during
most of depolarization [3].
1.4 ECG waves and interval
Fig. 1.3 Schematic representation of normal ECG waveform.

5/11/2018 Analysis of ECG Signal for Detection of Cardiac Arrhythmias - slidepdf.com
http://slidepdf.com/reader/full/analysis-of-ecg-signal-for-detection-of-cardiac-arrhythmia
6
Waves Representation
P wave the amplitude level of this voltage signal wave is low (approximately 1
mV) and represent depolarization and contraction of the right and left atria
[2].
A clear P wave before the QRS complex represents sinus rhythm.
Absence of P waves may suggest atrial fibrillation, junctional rhythm or
ventricular rhythm.
It is very difficult to analyze P waves with a high signal-to-noise ratio in
ECG signal.
QRS complex The QRS complex is the largest voltage deflection of approximately 10–
20 mV but may vary in size depending on age, and gender. The voltage
amplitude of QRS complex may also give information about the cardiac
disease [6].
Duration of the QRS complex indicates the time for the ventricles to
depolarize and may give information about conduction problems in the
ventricles such as bundle branch block.
T wave Represents ventricular repolarization [3]
Large T waves may represent ischemia, and Hyperkalaemia
Table 1.2 Amplitude and duration of waves, intervals and segments [6], [7], [8] of ECG signal.
Sl. no. Features Amplitude (mV) Duration (ms)
1 P wave 0.1-0.2 60-80
2 PR-segment - 50-120
3 PR- interval - 120-200
4 QRS complex 1 80-120
5 ST-segment - 100-120
6 T –wave 0.1-0.3 120-160
7 ST-interval - 320
8 RR-interval - (0.4-1.2)s

5/11/2018 Analysis of ECG Signal for Detection of Cardiac Arrhythmias - slidepdf.com
http://slidepdf.com/reader/full/analysis-of-ecg-signal-for-detection-of-cardiac-arrhythmia
7
The Table1.2 shows features of P-wave, QRS complex and T wave in maximum
amplitude and its duration. According to medical definition [7], the duration of each RR-interval
is about 0.4-1.2s.
1.5 Noise in ECG Signal
Generally the recorded ECG signal is often contaminated by different types of noises and
artifacts that can be within the frequency band of ECG signal, which may change the
characteristics of ECG signal. Hence it is difficult to extract useful information of the signal. The
corruption of ECG signal is due to following major noises:
1.5.1 Power line interferencesPower line interferences contains 60 Hz pickup (in U.S.) or 50 Hz pickup (in India)
because of improper grounding [9]. It is indicated as an impulse or spike at 60 Hz/50 Hz
harmonics, and will appear as additional spikes at integral multiples of the fundamental
frequency. Its frequency content is 60 Hz/50 Hz and its harmonics, amplitude is up to 50 percent
of peak-to-peak ECG signal amplitude [9]. A 60 Hz notch filter can be used remove the power
line interferences [7].
Fig. 1.4 60 Hz Power line interference [6].
1.5.2 Baseline drift
Base-line drift may be caused in chest-lead ECG signals by coughing or breathing with
large movement of the chest, or when an arm or leg is moved in the case of limb-lead ECG
acquisition [10]. Base-line drift can sometimes caused by variations in temperature and bias in
the instrumentation and amplifiers. Its frequency range generally bellows 0.5 Hz. To remove
baseline drift a high pass filter with cut-off frequency 0.5 Hz is used [7].

5/11/2018 Analysis of ECG Signal for Detection of Cardiac Arrhythmias - slidepdf.com
http://slidepdf.com/reader/full/analysis-of-ecg-signal-for-detection-of-cardiac-arrhythmia
8
Fig. 1.5 Baseline drifts in ECG signal.
1.5.3 Motion artifacts
Motion artifacts are transient baseline change due to electrode skin impedance withelectrode motion. It can generate larger amplitude signal in ECG waveform [7]. The peak
amplitude of this artifact is 500 percent of Peak to Peak ECG amplitude and its duration is about
100 – 500 ms [9]. An adaptive filter can be used to remove the interference of motion artifacts.
Fig. 1.6 Motion artifacts in ECG signal [6].
1.5.4 Muscle contraction (EMG)
Generally muscle contraction is produced due to muscle electrical activity. The signals
resulting from muscle contraction is assumed to be transient bursts of zero-mean band-limited
Gaussian noise [9]. Elecrtomyogram (EMG) interferences generate rapid fluctuation which is
very faster than ECG wave. Its frequency content is dc to 10 KHz and duration is 50 ms [9]. To
remove the interference of due to EMG a morphological filter of a unit square-wave structuring
(best width is 0.07 s) is used [7].

5/11/2018 Analysis of ECG Signal for Detection of Cardiac Arrhythmias - slidepdf.com
http://slidepdf.com/reader/full/analysis-of-ecg-signal-for-detection-of-cardiac-arrhythmia
9
Fig. 1.7 Muscle contraction.
1.6 Arrhythmias in ECG signal
The normal rhythm of the heart where there is no disease or disorder in the morphology
of ECG signal is called Normal sinus rhythm (NSR). The heart rate of NSR is generally
characterized by 60 to 100 beats per minute. The regularity of the R-R interval varies slightly
with the breathing cycle.
When the heart rate increases above 100 beats per minute, the rhythm is known as sinus
tachycardia. This is not an arrhythmia but a normal response of the heart which demand for
higher blood circulation [1]. If the heart rate is too slow then this is known as bradycardia and
this can adversely affect vital organs. When the heart rate is too fast, the ventricles are notcompletely filled before contraction for which pumping efficiency drops, adversely affecting
perfusion.
Fig. 1.8 (A) Normal sinus rhythm, (B) Sinus tachycardia
Arrhythmias are may be categories in the following manner:

5/11/2018 Analysis of ECG Signal for Detection of Cardiac Arrhythmias - slidepdf.com
http://slidepdf.com/reader/full/analysis-of-ecg-signal-for-detection-of-cardiac-arrhythmia
10
1.6.1 Sinus Node Arrhythmias
This type of arrhythmia arises from the S-A node of heart. As the electrical impulse is
generated from the normal pacemaker, the characteristic feature of these arrhythmias is that P-
wave morphology of the ECG is normal. These arrhythmias are the following types: Sinus
arrhythmia, Sinus bradycardia, and Sinus arrest etc.
1.6.2 Atrial Arrhythmias
Atrial arrhythmias originate outside the S-A node but within the atria in the form of
electrical impulses. These arrhythmias types are given bellow,
Premature Atrial Contractions (PAC)
This arrhythmias results an abnormal P-wave morphology followed by a normal QRS-
complex and a T-wave. This happens because of an ectopic pacemaker firing before the S-A
node. PACs may occur as a couplet where two PACs are generated consecutively. When three or
more consecutive PACs occur, the rhythm is considered to be atrial tachycardia.
Atrial Tachycardia
The heart rate atrial tachycardia is fast and ranges from 160 to 240 beats per minute in
atrial tachycardia. Frequently atrial tachycardia is accompanied by feelings of palpitations,
nervousness, or anxiety.
Atrial Flutter
In atrial flutter, the atrial rate is very fast, ranging from 240 to 360 per minute. The
abnormal P-waves occur regularly and so quickly that they take morphology of saw-tooth
waveform which is called flutter (F) waves.
Atrial Fibrillation
The atrial rate exceeds 350 beats per minute in this type of arrhythmias. This arrhythmia
occurs because of uncoordinated activation and contraction of different parts of the atria. The
higher atria rate and uncoordinated contraction leads to ineffective pumping of blood into the
ventricles. Atrial fibrillation may be intermittent, occurring in paroxysms (short bursts) or
chronic [1].
5/11/2018 Analysis of ECG Signal for Detection of Cardiac Arrhythmias - slidepdf.com
http://slidepdf.com/reader/full/analysis-of-ecg-signal-for-detection-of-cardiac-arrhythmia
11
Fig. 1.9 Artial arrhythmias, (A) Premature Atrial Contractions, (B) atrial tachycardia, (C) Atrial Flutter, (D) atrialfibrillation
1.6.3 Junctional Arrhythmias
Junctional arrhythmias are originated within the A-V junction in the form of the impulse
comprising the A-V node and it’s Bundle. The abnormal in P wave morphology occurs because
of this arrhythmias [1]. The polarity of the abnormal P-wave would be opposite to that of the
normal sinus P-wave since depolarisation is propagated in the opposite direction – from the A-V
node towards the atria.
Premature Junctional Contractions (PJC)
It is a ventricular contraction initiated by an ectopic pacemaker in the atrioventricular (A-
V) node. In premature junctional escape contraction, a normal-looking QRS complex
prematurely appears, but without a preceding P-wave, but the morphology of T-wave is normal
[1].
Fig. 1.10 Junctional arrhythmias.

5/11/2018 Analysis of ECG Signal for Detection of Cardiac Arrhythmias - slidepdf.com
http://slidepdf.com/reader/full/analysis-of-ecg-signal-for-detection-of-cardiac-arrhythmia
12
1.6.4 Ventricular arrhythmias
In this type of arrhythmias, the impulses originate from the ventricles and move outwards
to the rest of the heart. In Ventricular arrhythmias, the QRS-complex is wide and bizarre in
shape.
Premature Ventricular Contractions (PVC)
In PVC the abnormality is originated from ventricles. PVCs usually do not depolarise the
atria or the S-A node and hence the morphology of P-waves maintain their underlying rhythm
and occur at the expected time. PVCs may occur anywhere in the heart beat cycle. PVCs are
described as isolated if they occur singly, and as couplets if two consecutive PVCs occur.
Fig. 1.11 Junctional arrhythmias (A) Premature Ventricular Contractions, (B) Ventricular Tachycardia, (C)
Ventricular Fibrillation [1].
Ventricular Tachycardia (VT)
The heart rate of ventricular tachycardia is 110 to 250 beats per minute. In VT the QRS
complex is abnormally wide, out of the ordinary in shape, and of a different direction from the
normal QRS complex. VT is considered life-threatening as the rapid rate may prevent effective
ventricular filling and result in a drop in cardiac output.
5/11/2018 Analysis of ECG Signal for Detection of Cardiac Arrhythmias - slidepdf.com
http://slidepdf.com/reader/full/analysis-of-ecg-signal-for-detection-of-cardiac-arrhythmia
13
Ventricular Fibrillation
Ventricular fibrillation occurs when numerous ectopic pacemakers in the ventricles cause
different parts of the myocardium to contract at different times in a non-synchronised fashion.
Ventricular flutter exhibits a very rapid ventricular rate with a saw-tooth like ECG waveform.
1.6.5 Atrioventricular Blocks
It is the normal propagation of the electrical impulse along the conduction pathways to
the ventricles, but the block may delay or completely prevent propagation of the impulse to the
rest of the conduction system.
A first-degree AV block is occurred when all the P-waves are conducted to the ventricles,
but the PR-interval is prolonged. Second-degree AV blocks are occurred when some of the P-
waves fail to conduct to the ventricles. In third-degree AV block, the rhythm of the P-waves is
completely dissociated from the rhythm of the QRS-complexes. Each beat at their own rate [1].
Fig. 0.12 Atrioventricular Blocks (A) first degree AV block, (B) Second degree AV block, (C) Third degree AV
blocks.
1.6.6 Bundle Branch blocks
Bundle branch block, cease in the conduction of the impulse from the AV-node to the
whole conduction system. Due to this block there may occur myocardial infarction or cardiac
surgery [1].
Fig. 1.13 Bundle Branch blocks.

5/11/2018 Analysis of ECG Signal for Detection of Cardiac Arrhythmias - slidepdf.com
http://slidepdf.com/reader/full/analysis-of-ecg-signal-for-detection-of-cardiac-arrhythmia
14
The bundle branch block beat is categories into two types. These are Left bundle branch
block beat (LBBB) and Right bundle branch block beat (RBBB). In LBBB the left bundle branch
will prevent the electrical impulses from the A-V node from depolarising the left ventricular
myocardium in the normal way. When the right bundle branch is blocked, the electrical impulse
from the AV node is not able propagate to the conduction network to depolarise the right
ventricular myocardium.
1.7 ECG Database
1.7.1 MIT-BIH Arrhythmias database
The MIT/BIH arrhythmia database [10] is used in the study for performance evaluation.
The database contains 48 records, each containing two-channel ECG signals for 30 min duration
selected from 24-hr recordings of 47 individuals. There are 116,137 numbers of QRS complexes
in the database [11].The subjects were taken from, 25 men aged 32 to 89 years, and 22 women
aged 23 to 89 years and the records 201 and 202 came from the same male subject. Each
recording includes two leads; the modified limb lead II and one of the modified leads V1, V2,
V4 or V5. Continuous ECG signals are band pass-filtered at 0.1–100 Hz and then digitized at
360 Hz. Twenty-three of the recordings (numbered in the range of 100–124) are intended to
serve as a representative sample of routine clinical recordings and 25 recordings (numbered in
the range of 200–234) contain complex ventricular, junctional, and supraventricular arrhythmias.
The database contains annotation for both timing information and beat class information verified
by independent experts [12].
1.7.2 AAMI Standard
MIT-BIH heartbeat types are combined according to Association for the Advancement of
Medical Instrumentation (AAMI) recommendation [13]. AAMI standard emphasize the problem
of classifying ventricular ectopic beats (VEBs) from the non- ventricular ectopic beats [14].
AAMI also recommends that each ECG beat can be classified into the following five heartbeat
types [15]:
i. N (Normal beat)
ii. S (supraventricular ectopic beats (SVEBs))
iii. V (ventricular ectopic beats (VEBs) )
5/11/2018 Analysis of ECG Signal for Detection of Cardiac Arrhythmias - slidepdf.com
http://slidepdf.com/reader/full/analysis-of-ecg-signal-for-detection-of-cardiac-arrhythmia
15
iv. F(fusion beats)
v. Q (unclassifiable beats)
Each class includes heartbeats of one or more types as shown in Table 1.2. Class N contains
normal and bundle branch block beat types and escape beat, class S contains supraventricular
ectopic beats (SVEBs), class V contain Premature ventricular contraction beats and ventricular
escape beat, class F contains beats that result from fusing normal and VEBs, and class Q contains
unknown beats including paced beats.
Table 1.3 Mapping the MIT-BIH arrhythmia database heartbeat types to the AAMI heartbeat classes [15]
AAMI
beat classdescription
Normal
beat(N)
Supraventricular
ectopic beat (S)
ventricular
ectopicbeat(V)
Fusion
beat (F)
Unknown
beat (Q)
MIT-BIH
heart beat
types
Normal beat
(N)
Atrial premature
beat (A)
Prematureventricular
contraction
(V)
Fusion of ventricular
and normal
beat (F)
Paced beat
(/)
Left bundlebranch block
beat (L)
Aberrated atrial
premature beat (a)
ventricularescape beat
(E)
Fusion of
paced and
normal beat(f)
Right bundle
branch block beat (R)
Nodal ( junctional
) premature beat(J)
Unclassified
beat (Q)
Atrial escape
beat (e)
Supraventricular
premature beat (S)
Nodal( junctional )
escape beat
(j)
1.8 Motivation
The state of cardiac heart is generally reflected in the shape of ECG waveform and heart rate.
ECG, if properly analyzed, can provide information regarding various diseases related to heart.
However, ECG being a non-stationary signal, the irregularities may not be periodic and may not
show up all the time, but would manifest at certain irregular intervals during the day. Clinical
observation of ECG can hence take long hours and can be very tedious. Moreover, visual
analysis cannot be relied upon and the possibility of the analyst missing the vital information is
high. Hence, computer based analysis and classification of diseases can be very helpful in
5/11/2018 Analysis of ECG Signal for Detection of Cardiac Arrhythmias - slidepdf.com
http://slidepdf.com/reader/full/analysis-of-ecg-signal-for-detection-of-cardiac-arrhythmia
16
diagnosis. Various contributions have been made in literature regarding beat detection and
classification of ECG signal. Most of them use either time or frequency domain representation of
the ECG waveforms, on the basis of which many specific features are defined, allowing the
recognition between the beats belonging to different classes. The most difficult problem faced by
today’s automatic ECG analysis is the large variation in the morphologies of ECG waveforms.
Moreover, we have to consider the time constraints as well. Thus our basic objective is to come
up with a simple method having less computational time without compromising with the
efficiency. This objective has motivated me to search and experiment with various techniques. In
this thesis, R-peak detection of ECG signal is implemented using the properties of
autocorrelation and Hilbert transform and classification has been done using multilayer
perceptron (MLP) and radial basis function (RBF), taking the features as temporal features, heart
beat interval features and ECG morphological features.
1.9 Thesis Outline
The Chapter 1 of the thesis explains the basic of ECG and ECG morphology. Different
modes of lead placement and the MIT-BIH arrhythmias database are discussed. This chapter also
explains the different types of arrhythmias in ECG signal.
In Chapter 2 a new method is developed using autocorrelation and Hilbert transform for
detection of QRS complex in ECG signal which is the first step of ECG signal analysis.
The various characteristics features of ECG are extracted, which contains both temporal and
morphological features of each heart beat. In Chapter 3 feature extraction methodology of above
features are discussed.
ECG arrhythmias beat classification using multilayer perceptron (MLP) neural network and
Radial basis function neural network (RBF) are discussed in Chapter 4
Chapter 5 gives the conclusion and future work of the thesis.
References
[1] R. Acharya, J. S. Suri, J. A.E. Spaan and S .M. Krishnan, Advances in Cardiac Signal Processing, springer, pp.
1-50.
[2] W. J. Germann and C. L. Standield, “Principles of Human Physiology,” Benjamin Cummings, San Francisco,
2002.
5/11/2018 Analysis of ECG Signal for Detection of Cardiac Arrhythmias - slidepdf.com
http://slidepdf.com/reader/full/analysis-of-ecg-signal-for-detection-of-cardiac-arrhythmia
17
[3] A. J. Moss and S. Stern., “Noninvasive Electro cardiology,” Clinical Aspects of Holter, London, Philadelphia,
W.B. Saunders, 1996.
[4] M. Gabriel Khan, “Rapid ECG interpretation” Third edition, 2003.
[5] Francis Morris, June Edhouse, William J Brady, John Camm, “ABC of Clinical Electrocardiography,” BMJ
Books, 2003.
[6] http://en.wikipedia.org/wiki/Electrocardiography.
[7] Y.C. Yeha, and W. J. Wang, “QRS complexes detection for ECG signal The Difference Operation Method
(DOM),” Computer methods and programs in biomedicine, vol. 9, pp. 245–254, 2008.
[8] R.M. Rangayyan, Biomedical Signal Analysis: A Case-study Approach, Wiley–Interscience, New York, pp.
18–28, 2001.
[9] G.M. Friesen, T.C. Jannett, M.A. Jadallah, S.L. Yates, S.R. Quint, and H.T. Nagle, “A comparison of the noise
sensitivity of nine QRS detection algorithm,” IEEE Trans. Biomed. Eng. Vol. 37, pp. 85–98, 1990.
[10] MIT-BIH Database distribution, Massachusetts Institute of Technology, 77 Massachusetts Avenue, Cambridge,
MA 02139,1998.http://www.physionet.org/physiobank/database/mitdb/
[11] B.U. Kohler, C. Henning, and R. Orglmeister, “The principles of software QRS detection,” IEEE Eng. Med.
Biol. Vol. 21, pp. 42–57, 2002.
[12] T.Ince, S. Kiranyaz, and M. Gabbouj, “A generaric and robust system for automated patient-specific
classification of ECG signals,” IEEE Trans. Biomed. Eng. vol. 56, pp. 1415-1426, 2009.
[13] American National Standard for Ambulatory Electrocardiographs, publication ANSI/AAMI EC38-1994,
Association for the Advancement of Medical Instrumentation, 1994.
[14] Omern T. Inan. L. Giovangrandi, and T. A. Kovacs, “Robust Neural network based classification of Premature
Ventricular Contraction using wavelet transform and time interval features,” IEEE Trans. Biomed. Eng. vol. 53,
pp. 2507-2515, 2006.
[15] P.de Chazal, M.O. Duyer, and R.B. Reilly, “Automatic classification of heartbeat using ECG morphology and
heart beat interval features,” IEEE Trans. Biomed. Eng. vol. 51, pp. 1196-1206, 2004.

5/11/2018 Analysis of ECG Signal for Detection of Cardiac Arrhythmias - slidepdf.com
http://slidepdf.com/reader/full/analysis-of-ecg-signal-for-detection-of-cardiac-arrhythmia
18
CHAPTER 2
QRS Complex Detection
5/11/2018 Analysis of ECG Signal for Detection of Cardiac Arrhythmias - slidepdf.com
http://slidepdf.com/reader/full/analysis-of-ecg-signal-for-detection-of-cardiac-arrhythmia
19
2.1 Introduction
The detection of QRS complex is the first step towards automated computer-based ECG
signal analysis. To detect the QRS complex more accurately it is necessary to identify the exact
R-peak location from the recorded data. Morphological differences in the ECG waveform
increase the complexity of QRS detection, due to the high degree of heterogeneity in the QRS
waveform and the difficulty in differentiating the QRS complex from tall peaked P or T waves
[1].
Several techniques are reported to improve the accuracy of QRS complex detection from
ECG signal because the exact detection of QRS complex is difficult, as the ECG signal is added
with different types of noise like electrode motion, power-line interferences, baseline wander,
muscles noise etc. [2]. Pan and Tompkins [3] reported a technique where, the detection of QRS
complex was achieved by linear filtering, non-linear transformation and decision rule algorithm.
In another method [4] the QRS complex of ECG signal was found out using multi rate signal
processing and filter banks. As reported in [3] the QRS complex can be found after finding the
R-peak by differential operation in ECG signal. The first differentiation of ECG signal and its
Hilbert transform is used to find the location of R-peak in the ECG signal [5].
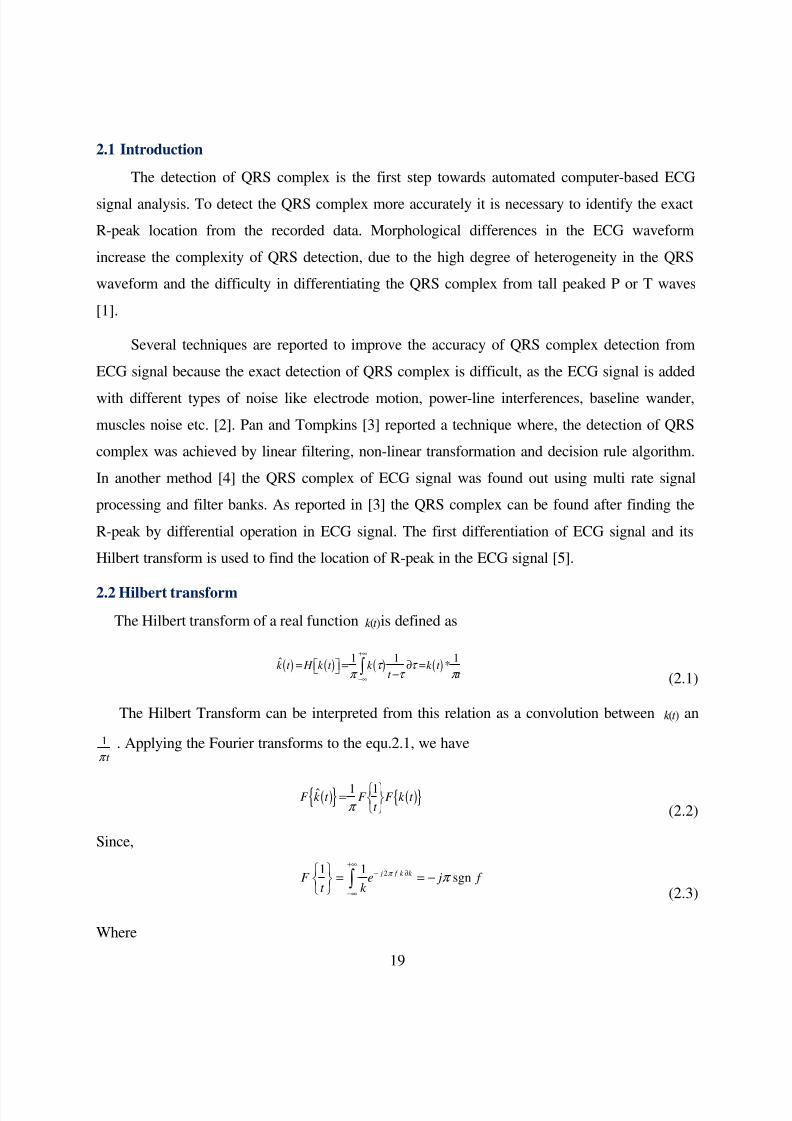
2.2 Hilbert transform
The Hilbert transform of a real function ( )k t is defined as
( ) ( ) ( ) ( )1 1 1ˆ *k t H k t k k t
t t τ τ
π τ π
+∞
−∞
= = ∂ = −∫ (2.1)
The Hilbert Transform can be interpreted from this relation as a convolution between ( )k t an
1
t π . Applying the Fourier transforms to the equ.2.1, we have
( ){ } ( ){ }1 1ˆF k t F F k t
t π
= (2.2)
Since,
21 1sgn j f k k F e j f
t k
π π +∞
− ∂
−∞
= = −
∫
(2.3)
Where

5/11/2018 Analysis of ECG Signal for Detection of Cardiac Arrhythmias - slidepdf.com
http://slidepdf.com/reader/full/analysis-of-ecg-signal-for-detection-of-cardiac-arrhythmia
20
1 ; 0
s g n 0 ; 0
1 ; 0
f
f f
f
+ >
= = − <
then the Fourier transform of (2.2) can be written as
( ){ } ( ){ }ˆ sg nF k t j f F k t = −(2.4)
In the frequency domain, the result is then obtained by multiplying the spectrum of the ( )k t by
j (+90) for negative frequencies and –j (-90) for positive frequencies. The time domain result can
be obtained after performing an inverse Fourier transform. The Hilbert transform of the original
function represents its harmonic conjugate.
The pre-envelope of a real signal can be described by the expression:
( ) ( ) ( )ˆe t k t jk t = + (2.5)
Where, ( )k t = real value signal
( )k t ⌢
= complex value function which is the Hilbert transforms pair of ( )k t
The envelope ( ) E t of ( )e t is defined by
( ) ( ) ( )2 2ˆ E t k t k t = +(2.6)
The envelope determined using (2.6) will have the same slope and magnitude of the
original signal ( )k t at or near its local maxima. From (2.6) it can be observed that ( ) E t is always a
positive function. Hence the maximum contribution to ( ) E t at points where ( )k t =0 is given by the
Hilbert transform.
2.3Methodology
Fig. 2.1 Block diagram representation of the proposed method for detection of QRS complex.

5/11/2018 Analysis of ECG Signal for Detection of Cardiac Arrhythmias - slidepdf.com
http://slidepdf.com/reader/full/analysis-of-ecg-signal-for-detection-of-cardiac-arrhythmia
21
A new approach to QRS detection using the Hilbert transform and autocorrelation function is
proposed. The block diagram of the proposed method is shown in the fig.2.1. The detail
description of the proposed method is given bellow
2.3.1 Filtering
The main function of the stage is to increase the signal to noise ratio of ECG signal by
emphasizing the QRS complex. A band pass FIR Butterworth filter of pass band frequencies of
5-15 Hz is used to remove the power-line interference and high frequency noises from the
original signal. The approximate popular pass band to maximize the QRS energy is 5-15Hz [3].
Fig. 2.2 ECG signal in the database MIT-BIH tape #100 in the range (0-1000) samples. (a) channel-1output, (b)
channel-2output, (c) band pass filter output.
2.3.2 Differentiation
The first order differentiation of filtered ECG signal is taken to remove motion artifacts and
baseline drifts [18]. The main function of first order differentiation is to indicate high slope
points which show that the rising of signal from Q to R is the maximum slope and the falling of
signal from R to S is the minimum slope of ECG signal. Therefore R peak is the zero crossing
between these two positive and negative peaks, which is shown in fig.2.3.
The first differential of the given ECG signal in discrete domain can be obtained by,
( )1
( ) 1 ( 1)2
z n k n k nt
= + − − ∆ (2.7)

5/11/2018 Analysis of ECG Signal for Detection of Cardiac Arrhythmias - slidepdf.com
http://slidepdf.com/reader/full/analysis-of-ecg-signal-for-detection-of-cardiac-arrhythmia
22
where, n= 2, 3 … , m-1
m is the total number of samples and t ∆ is the sampling time.
The first order differentiation given by (2.7) shifts the sample by one unit.
Fig. 2.3 Sample beats from ECG signal of tape #100 in MIT-BIH database (a) band pass filter output, (b) derivative
output.
2.3.4 Period calculation using autocorrelation
In the proposed method 3s duration of ECG signal is extracted from the filtered ECG signal
to find the exact duration of one cardiac cycle in that particular ECG signal. The approximate R-
R interval between two cardiac cycles is 0.4s to 1.2s [4], [7]. So an array lag_sec is created by
taking a fixed length signal of 3s duration whose sampling frequency ( f s) =360 Hz. The array
length is lies in between the range 0.4s to 1.2s with a time lag 0.02s. The number of samples
corresponding to each lag_sec is found out by multiplying the sampling frequency ( f s) and store
these values in an array lag_index as illustrated in (2.8).
_ ( ) ( _ sec( ) * )slag index i floor lag i f =
(2.8)
Then the autocorrelation of ECG signal is determined by the algorithm-1
Fig. 2.4 ( a) filtered signal in the database MIT-BIH tape #100 in range 0-3s, (b) shifted version of above signal
with a time lag (step size) of 0.02s.
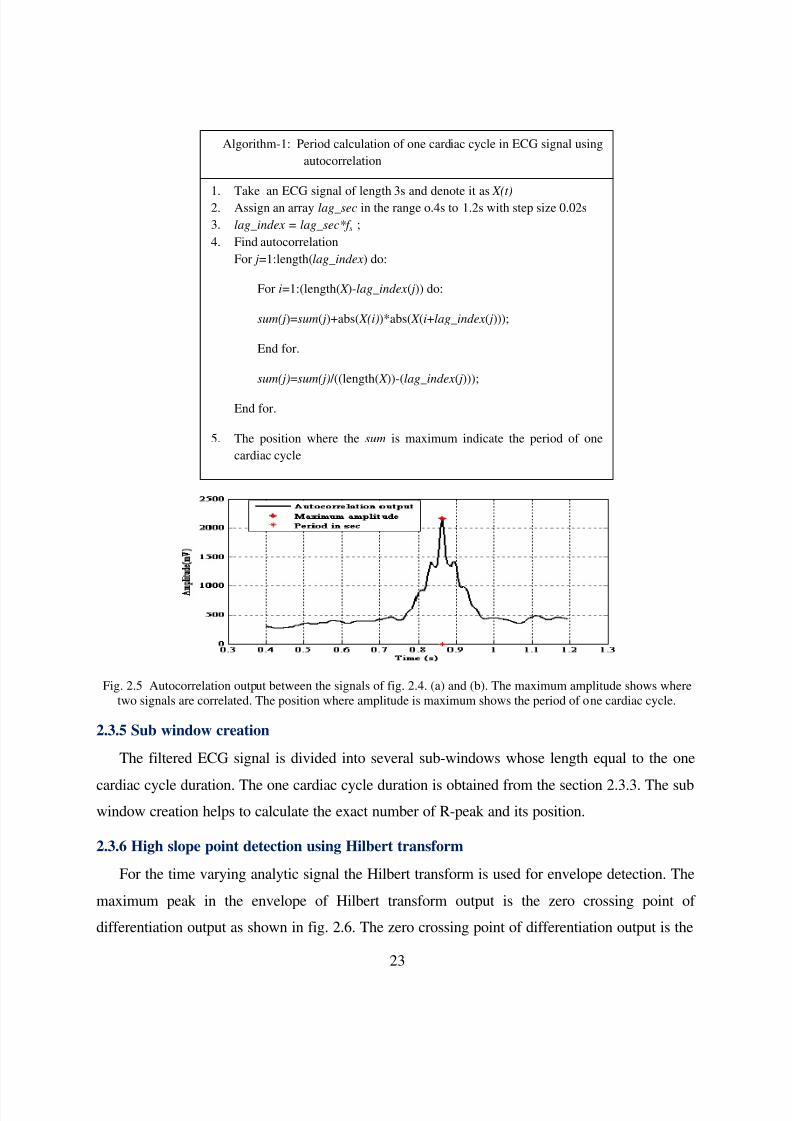
5/11/2018 Analysis of ECG Signal for Detection of Cardiac Arrhythmias - slidepdf.com
http://slidepdf.com/reader/full/analysis-of-ecg-signal-for-detection-of-cardiac-arrhythmia
23
Fig. 2.5 Autocorrelation output between the signals of fig. 2.4. (a) and (b). The maximum amplitude shows where
two signals are correlated. The position where amplitude is maximum shows the period of one cardiac cycle.
2.3.5 Sub window creation
The filtered ECG signal is divided into several sub-windows whose length equal to the one
cardiac cycle duration. The one cardiac cycle duration is obtained from the section 2.3.3. The sub
window creation helps to calculate the exact number of R-peak and its position.
2.3.6 High slope point detection using Hilbert transform
For the time varying analytic signal the Hilbert transform is used for envelope detection. The
maximum peak in the envelope of Hilbert transform output is the zero crossing point of
differentiation output as shown in fig. 2.6. The zero crossing point of differentiation output is the
Algorithm-1: Period calculation of one cardiac cycle in ECG signal using
autocorrelation
1.
Take an ECG signal of length 3s and denote it as X(t) 2. Assign an array lag_sec in the range o.4s to 1.2s with step size 0.02s
3. lag_index = lag_sec*f s ;
4. Find autocorrelation
For j=1:length(lag_index) do:
For i=1:(length( X )-lag_index( j)) do:
sum(j)=sum( j)+abs( X(i))*abs( X (i+lag_index( j)));
End for.
sum(j)=sum(j) /((length( X ))-(lag_index( j)));
End for.
5. The position where the sum is maximum indicate the period of one
cardiac cycle
5/11/2018 Analysis of ECG Signal for Detection of Cardiac Arrhythmias - slidepdf.com
http://slidepdf.com/reader/full/analysis-of-ecg-signal-for-detection-of-cardiac-arrhythmia
24
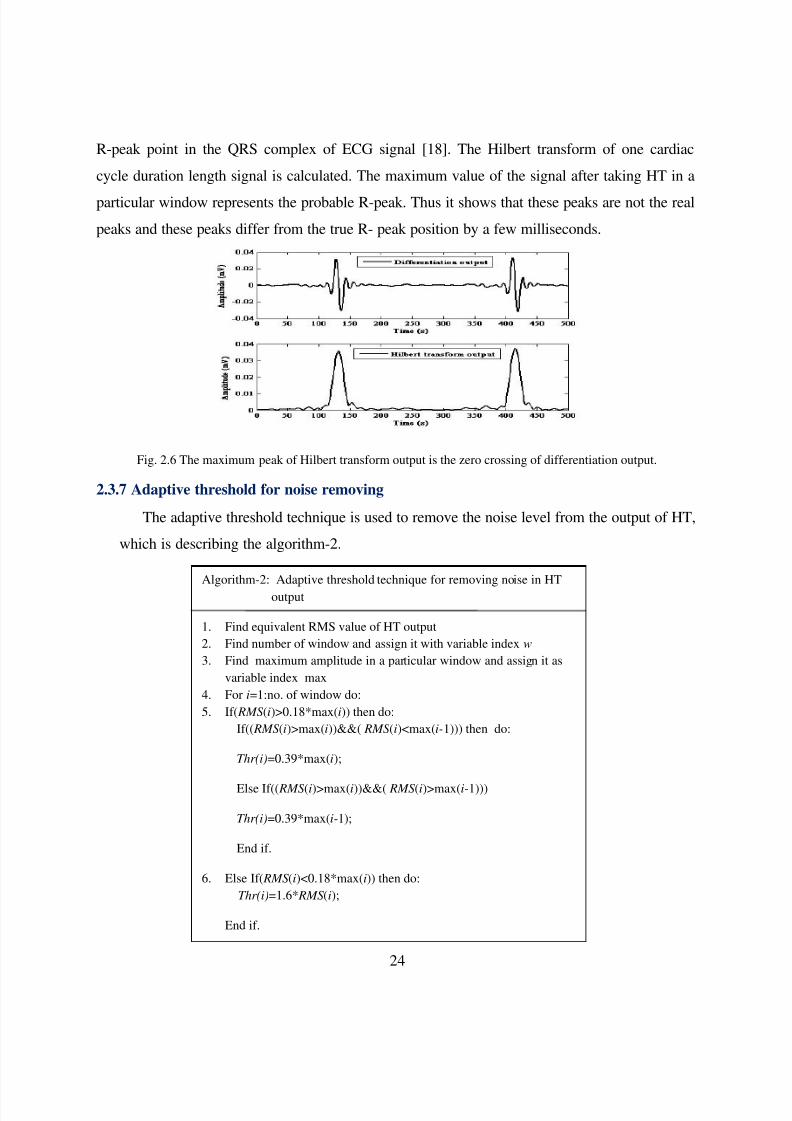
R-peak point in the QRS complex of ECG signal [18]. The Hilbert transform of one cardiac
cycle duration length signal is calculated. The maximum value of the signal after taking HT in a
particular window represents the probable R-peak. Thus it shows that these peaks are not the real
peaks and these peaks differ from the true R- peak position by a few milliseconds.
Fig. 2.6 The maximum peak of Hilbert transform output is the zero crossing of differentiation output.
2.3.7 Adaptive threshold for noise removing
The adaptive threshold technique is used to remove the noise level from the output of HT,
which is describing the algorithm-2.
Algorithm-2: Adaptive threshold technique for removing noise in HT
output
1. Find equivalent RMS value of HT output
2. Find number of window and assign it with variable index w
3. Find maximum amplitude in a particular window and assign it as
variable index max
4. For i=1:no. of window do:
5. If( RMS(i)>0.18*max(i)) then do:
If(( RMS(i)>max(i))&&( RMS(i)<max(i-1))) then do:
Thr(i)=0.39*max(i);
Else If(( RMS(i)>max(i))&&( RMS(i)>max(i-1)))
Thr(i)=0.39*max(i-1);
End if.
6. Else If( RMS(i)<0.18*max(i)) then do:
Thr(i)=1.6* RMS(i);
End if.
5/11/2018 Analysis of ECG Signal for Detection of Cardiac Arrhythmias - slidepdf.com
http://slidepdf.com/reader/full/analysis-of-ecg-signal-for-detection-of-cardiac-arrhythmia
25
2.3.8 T wave discrimination
After finding the probable R-peaks search back technique is used to discriminate the T
wave. The maximum amplitude within a 200ms window length is set to find the real R-peaks
from probable R-peaks.
2.3.9 Second stage detector to find Q and S point
A second stage detector is used to locate the Q & S point in ECG. A window containing
±10 sample from the location of the R-peak is selected in the original ECG waveform to
locate these points.
2.4 Result and discussionIn order to evaluate the performance, the proposed algorithm was tested using MIT-BIH
Arrhythmia database [8]. The algorithm is able to detect the QRS complex more accurately as
shown in the Fig.7. The total performance is shown in the form of tabulation in Table 2.1.
The performance is analyzed using the following parameters
1. Sensitivity (Se): This indicates the percentage of true beats that were correctly
detected by the algorithm.
( )%
TP
Sensitivity TP FN = + (2.8)
1. Positive Predictivity (+p): It gives the percentage of heart beat detection which are
reality true beats.
( )%TP
Positive predictiveTP FP
=+ (2.9)
2. Detection error rate (%):
( )%FP FN
Detection error rate
To ta l number o f QRS complex
+=
(2.10)
Where, TP=Number of true positive beat detected
FP= Number of false positive beat
FN= Number of false negative beat
TN=Number of true negative beat
5/11/2018 Analysis of ECG Signal for Detection of Cardiac Arrhythmias - slidepdf.com
http://slidepdf.com/reader/full/analysis-of-ecg-signal-for-detection-of-cardiac-arrhythmia
26
Table 2.1 The result of the proposed method for the signals in MIT-BIH database
MIT-BIH
records
True
PositiveBeat (TP)
False
PositiveBeat (FP)
False
NegativeBeat (FN)
Failed
detection(FP+FN)
Sensitivity
(Se)
Positive
predictivity(%)
Detection
error rate(%)
100 2273 0 0 0 100.00 100.00 0.00
101 1865 2 1 3 99.95 99.89 0.16
102 2187 3 1 4 99.95 99.86 0.18
103 2084 0 0 0 100.00 100.00 0.00
104 2230 2 1 3 99.96 99.91 0.13
105 2572 3 7 10 99.73 99.88 0.39
106 2027 2 2 4 99.90 99.90 0.20
107 2137 2 4 6 99.81 99.91 0.28
108 1763 6 0 6 100.00 99.66 0.34
109 2532 2 3 5 99.88 99.92 0.20
111 2124 0 1 1 99.95 100.00 0.05
112 2539 0 0 0 100.00 100.00 0.00
113 1795 0 0 0 100.00 100.00 0.00114 1879 2 1 3 99.95 99.89 0.16
115 1953 0 0 0 100.00 100.00 0.00
116 2412 5 1 6 99.96 99.79 0.25
117 1535 0 1 1 99.93 100.00 0.07
118 2275 0 1 1 99.96 100.00 0.04
119 1987 1 0 1 100.00 99.95 0.05
121 1863 0 1 1 99.95 100.00 0.05
122 2476 0 0 0 100.00 100.00 0.00
123 1518 0 0 0 100.00 100.00 0.00
124 1619 0 0 0 100.00 100.00 0.00
200 2607 0 1 1 99.96 100.00 0.04
201 1963 0 4 4 99.80 100.00 0.20
202 2136 0 5 5 99.77 100.00 0.23
203 2982 0 2 2 99.93 100.00 0.07205 2656 4 2 6 99.92 99.85 0.23
207 1862 0 2 2 99.89 100.00 0.11
208 2956 3 2 5 99.93 99.90 0.17
209 3004 0 0 0 100.00 100.00 0.00
210 2647 1 3 4 99.89 99.96 0.15
212 2748 0 0 0 100.00 100.00 0.00
213 3251 1 6 7 99.82 99.97 0.22
214 2262 3 1 4 99.96 99.87 0.18
215 3363 2 0 2 100.00 99.94 0.06
217 2208 1 3 4 99.86 99.95 0.18
219 2154 2 0 2 100.00 99.91 0.09
220 2048 0 1 1 99.95 100.00 0.05
221 2427 0 5 5 99.79 100.00 0.21
222 2484 2 5 7 99.80 99.92 0.28223 2605 0 4 4 99.85 100.00 0.15
228 2053 0 3 3 99.85 100.00 0.15
230 2256 3 0 3 100.00 99.87 0.13
231 1186 2 0 2 100.00 99.83 0.17
232 1780 1 4 5 99.78 99.94 0.28
233 3079 0 5 5 99.84 100.00 0.16
234 2735 0 0 0 100.00 100.00 0.00
48
patients116,137 55 83 138 99.93 99.95 0.12
5/11/2018 Analysis of ECG Signal for Detection of Cardiac Arrhythmias - slidepdf.com
http://slidepdf.com/reader/full/analysis-of-ecg-signal-for-detection-of-cardiac-arrhythmia
27
Table 2.2 The comparison of the proposed method with the Pan-Tompkins (PT) method and difference operation
method (DOM).
Tape #Total
beats
PT method DOM method Proposed method
FP FNFailed
detection %FP FN
Failed
detection %FP FN
Failed
detection
%
100 2273 0 0 0.00 0 1 0.04 0 0 0.00
101 1865 5 3 0.43 0 1 0.05 2 1 0.16
102 2187 0 0 0.00 0 1 0.05 3 1 0.18
103 2084 0 0 0.00 0 0 0.00 0 0 0.00
104 2230 1 0 0.04 2 0 0.09 2 1 0.13
105 2572 67 22 3.46 0 17 0.66 3 7 0.39
106 2027 5 2 0.35 0 6 0.30 2 2 0.20
107 2137 0 2 0.09 0 3 0.14 2 4 0.28
108 1763 199 22 12.54 6 0 0.34 6 0 0.34
109 2532 0 1 0.04 0 3 0.12 2 3 0.20
111 2124 1 0 0.05 0 1 0.05 0 1 0.05112 2539 0 1 0.04 1 0 0.04 0 0 0.00
113 1795 0 0 0.00 9 0 0.50 0 0 0.00
114 1879 3 17 1.06 0 1 0.05 2 1 0.16
115 1953 0 0 0.00 0 0 0.00 0 0 0.00
116 2412 3 22 1.04 0 17 0.70 5 1 0.25
117 1535 1 1 0.13 2 0 0.13 0 1 0.07
118 2275 1 0 0.04 10 0 0.44 0 1 0.04
119 1987 1 0 0.05 0 0 0.00 1 0 0.05
121 1863 4 7 0.59 0 2 0.11 0 1 0.05
122 2476 1 1 0.08 0 0 0.00 0 0 0.00
123 1518 0 0 0.00 0 0 0.00 0 0 0.00
124 1619 0 0 0.00 1 0 0.06 0 0 0.00
200 2607 6 3 0.35 5 0 0.19 0 1 0.04
201 1963 0 10 0.51 0 20 1.02 0 4 0.20202 2136 0 4 0.19 1 0 0.05 0 5 0.23
203 2982 53 30 2.78 16 2 0.60 0 2 0.07
205 2656 0 2 0.08 0 16 0.60 4 2 0.23
207 1862 4 4 0.43 0 1 0.05 0 2 0.11
208 2956 4 14 0.60 0 14 0.47 3 2 0.17
209 3004 3 0 0.10 1 0 0.03 0 0 0.00
210 2647 2 8 0.38 0 14 0.53 1 3 0.15
212 2748 0 0 0.00 1 0 0.04 0 0 0.00
213 3251 1 2 0.09 0 3 0.09 1 6 0.22
214 2262 2 4 0.26 0 4 0.18 3 1 0.18
215 3363 0 1 0.03 0 4 0.12 2 0 0.06
217 2208 4 6 0.45 0 2 0.09 1 3 0.18
219 2154 0 0 0.00 0 0 0.00 2 0 0.09
220 2048 0 0 0.00 0 0 0.00 0 1 0.05221 2427 2 0 0.08 0 1 0.04 0 5 0.21
222 2484 101 81 7.33 0 5 0.20 2 5 0.28
223 2605 1 0 0.04 1 0 0.04 0 4 0.15
228 2053 25 5 1.46 0 2 0.10 0 3 0.15
230 2256 1 0 0.04 2 0 0.09 3 0 0.13
231 1186 0 0 0.00 0 15 0.80 2 0 0.17
232 1780 6 1 0.39 0 0 0.00 1 4 0.28
233 3079 0 1 0.03 0 9 0.29 0 5 0.16
234 2735 0 0 0.00 0 1 0.04 0 0 0.00
Total116,
137507 277 0.68 58 166 0.19 55 83 0.12
5/11/2018 Analysis of ECG Signal for Detection of Cardiac Arrhythmias - slidepdf.com
http://slidepdf.com/reader/full/analysis-of-ecg-signal-for-detection-of-cardiac-arrhythmia
28
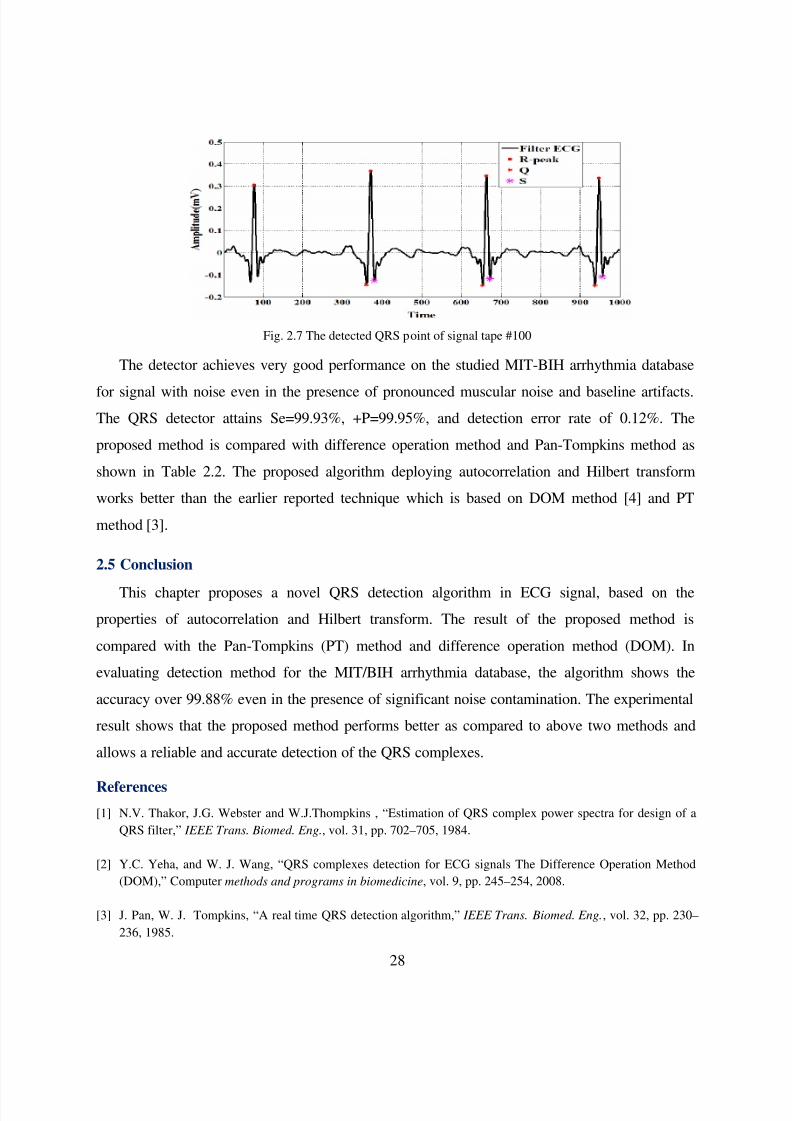
Fig. 2.7 The detected QRS point of signal tape #100
The detector achieves very good performance on the studied MIT-BIH arrhythmia database
for signal with noise even in the presence of pronounced muscular noise and baseline artifacts.
The QRS detector attains Se=99.93%, +P=99.95%, and detection error rate of 0.12%. The
proposed method is compared with difference operation method and Pan-Tompkins method as
shown in Table 2.2. The proposed algorithm deploying autocorrelation and Hilbert transform
works better than the earlier reported technique which is based on DOM method [4] and PT
method [3].
2.5 Conclusion
This chapter proposes a novel QRS detection algorithm in ECG signal, based on the
properties of autocorrelation and Hilbert transform. The result of the proposed method is
compared with the Pan-Tompkins (PT) method and difference operation method (DOM). In
evaluating detection method for the MIT/BIH arrhythmia database, the algorithm shows the
accuracy over 99.88% even in the presence of significant noise contamination. The experimental
result shows that the proposed method performs better as compared to above two methods and
allows a reliable and accurate detection of the QRS complexes.
References
[1] N.V. Thakor, J.G. Webster and W.J.Thompkins , “Estimation of QRS complex power spectra for design of a
QRS filter,” IEEE Trans. Biomed. Eng., vol. 31, pp. 702–705, 1984.
[2] Y.C. Yeha, and W. J. Wang, “QRS complexes detection for ECG signals The Difference Operation Method
(DOM),” Computer methods and programs in biomedicine, vol. 9, pp. 245–254, 2008.
[3] J. Pan, W. J. Tompkins, “A real time QRS detection algorithm,” IEEE Trans. Biomed. Eng., vol. 32, pp. 230–
236, 1985.
5/11/2018 Analysis of ECG Signal for Detection of Cardiac Arrhythmias - slidepdf.com
http://slidepdf.com/reader/full/analysis-of-ecg-signal-for-detection-of-cardiac-arrhythmia
29
[4] X. Afonso, W.J. Tompkins, T. Nguyen, S. Luo, “ECG beat detection using filter banks,” IEEE Trans. Biomed.
Eng., vol. 46, pp. 230-236, 1999.
[5] D. Beniteza, P.A. Gaydeckia, A. Zaidib, and A.P. Fitzpatrick, “The use of the Hilbert transform in ECG signal
analysis,” Computers in Biology and Medicine, vol. 31, pp.399–406, 2001.
[6] S.Ari, K. Sensharma, and G. Saha, “DSP implementation of a heart valve disorder detection system from a
phonocardiogram signal,” Journal of Medical Engineering & Technology, vol. 32, no. 2, pp.122 – 132, 2008.
[7] R.M. Rangayyan, Biomedical Signal Analysis: A Case-study Approach, Wiley–Interscience, New York, pp.18-
28, 2001.
[8] MIT-BIH Database distribution, Massachusetts Institute of Technology, 77 Massachusetts Avenue, Cambridge,
MA 02139,1998.http://www.physionet.org/physiobank/database/mitdb/
[9] American National Standard for Ambulatory Electrocardiographs, publication ANSI/AAMI EC38-1994,
Association for the Advancement of Medical Instrumentation, 1994.
[10] N.M. Arzeno, Z. Deng and C.S. Poon, “Analysis of First –Derivative base QRS detection algorithms,” IEEE
Trans. Biomed. Eng., vol. 55, pp. 478–484, 2008.
[11] B.U. Kohler, C. Henning, and R. Orglmeister, “The principles of software QRS detection,” IEEE Eng. Med.
Biol. Vol. 21, pp. 42–57, 2002.
[12] Y.H. Hu, J. Tompkins, J.L. Urrusti, and V.X. Afonso, “Application of artificial neural networks for ECG signal
detection and classification,” Jornal of Electrocardiology, vol. 26, pp. 66–73, 1993.
[13] R.J. Bolton, L.C. Westphal, “Hilbert transform processing of ECG’s,” 1981 IREECON International
Convention Digest, IREE, Melbourne, pp. 281–283,1981.
[14] Q. Xue, Y.H. Hu, W.J. Tompkins, “Neural-network-based adaptive matched filtering for QRS detection,” IEEE
Trans. Biomed. Eng. 39, pp.315–329, 1992.
[15] Kleydis V. Suarez, Jesus C. Silva, Yannick Berthoumieu, Pedro Gomis, and Mohamed Najim, “ECG Beat
Detection using a Geometrical Matching Approach,” IEEE Transactions Biomed. Engg., vol. 54, no. 4, 2007.
[16] R.J. Bolton, L.C. Westphal, “On the use of the Hilbert Transform for ECG waveform processing, in:
Computers in Cardiology,” IEEE Computer Society, Silver Spring, MD, pp. 533–536, 1984.
[17] S. G. Guillen, M. T. Arredondo, G. Martin, and J. M. F. Corral, “Ventricular fibrillation detection by
autocorrelation function peak analysis,” J. Electrocardiol., vol. 22, pp. 253–262, 1989.
5/11/2018 Analysis of ECG Signal for Detection of Cardiac Arrhythmias - slidepdf.com
http://slidepdf.com/reader/full/analysis-of-ecg-signal-for-detection-of-cardiac-arrhythmia
30
CHAPTER 3
Feature Extraction of ECG Signal
5/11/2018 Analysis of ECG Signal for Detection of Cardiac Arrhythmias - slidepdf.com
http://slidepdf.com/reader/full/analysis-of-ecg-signal-for-detection-of-cardiac-arrhythmia
31
3.1 Introduction
The classification of cardiac arrhythmias can be achieve after extracting the features of each
heart beat in the ECG signal. A good feature extraction methodology can accurately classify
cardiac abnormalities. Several methods have been proposed for extracting features of one cardiac
cycle. The features of one cardiac cycle may be time domain features or frequency domain
features. In [1] Inan et al. found that morphological information along with timing information
can provide high classification accuracy for larger dataset. The combining of wavelet domain
feature with RR- interval features can achieve high classification accuracy as reported in [2] .
The morphological feature along with the temporal feature of each patient specific data can give
high classification accuracy [3]. Khazaee et al. [4] extracted power spectral density (PSD)
features of each heart beat with three timing interval features classifying cardiac abnormalities in
MIT-BIH database. The Hermit basis function can provide an effective approach for
characterizing ECG heart beat and have been widely used in ECG signal classification [5]. As
reported in [6], the authors Dutta et al. has proposed cross-correlation based feature for
classifying PVC beats from non-PVC beats. They have used cross-correlation between each
ECG heart beat signal with the normal heart beat signal which is chosen as reference signal.
In the study the time domain features of each heart beat have been extracted for classifying
SVEBs and VEBs from non-SVEBs and non- VEBs followed by AAMI standard. The feature
vector contains four temporal features; three heart beat interval features and nineteen fixed
interval morphological features. Hence in total there are twenty six feature vectors are extracted
for each heart beats which can be used for classification of cardiac arrhythmias using different
classifiers. All the features are considered for single channel in the MIT-BIH arrhythmias
database.
3.2 Methodology
Automatic classification ECG signal consist of different features of ECG in one cardiac
cycle. Features relating to fiducial point intervals were considered for each heartbeat. Features
relating to heartbeat intervals and ECG morphology were also calculated separately for each
heartbeat in the ECG signals. The features are extracted for one cardiac cycle [7] as follows:
5/11/2018 Analysis of ECG Signal for Detection of Cardiac Arrhythmias - slidepdf.com
http://slidepdf.com/reader/full/analysis-of-ecg-signal-for-detection-of-cardiac-arrhythmia
32
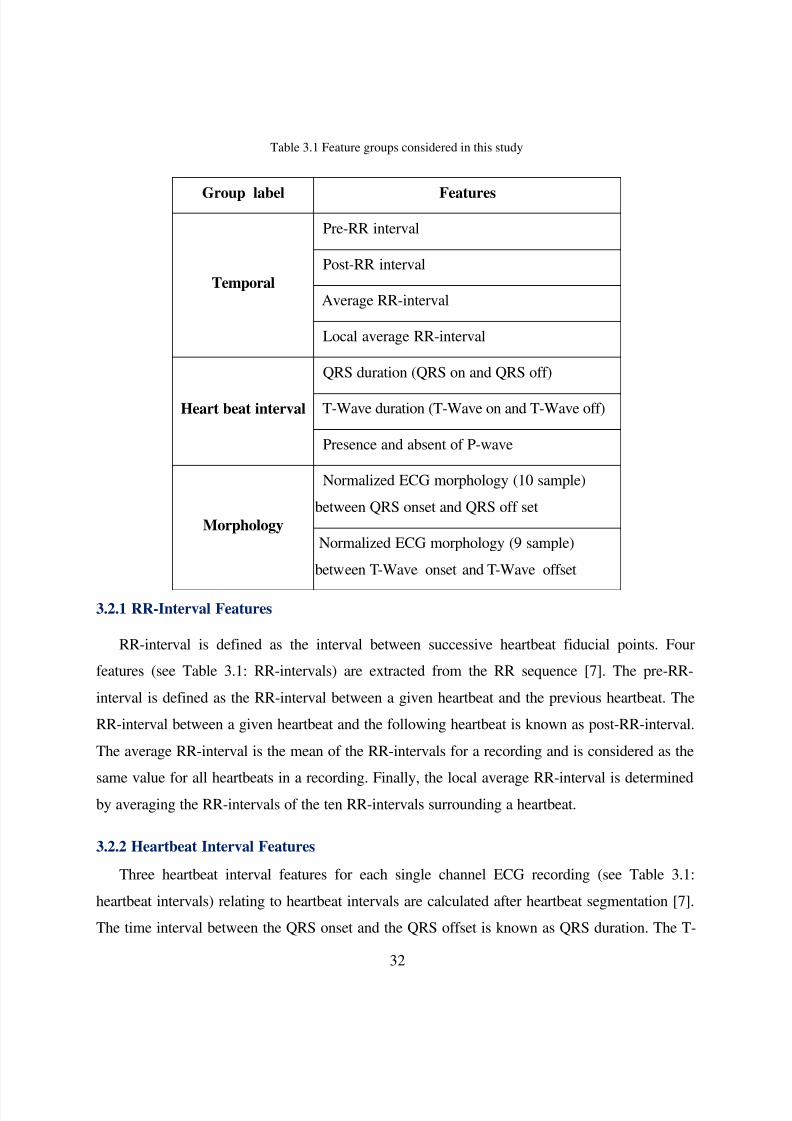
Table 3.1 Feature groups considered in this study
Group label Features
Temporal
Pre-RR interval
Post-RR interval
Average RR-interval
Local average RR-interval
Heart beat interval
QRS duration (QRS on and QRS off)
T-Wave duration (T-Wave on and T-Wave off)
Presence and absent of P-wave
Morphology
Normalized ECG morphology (10 sample)
between QRS onset and QRS off set
Normalized ECG morphology (9 sample)
between T-Wave onset and T-Wave offset
3.2.1 RR-Interval Features
RR-interval is defined as the interval between successive heartbeat fiducial points. Four
features (see Table 3.1: RR-intervals) are extracted from the RR sequence [7]. The pre-RR-
interval is defined as the RR-interval between a given heartbeat and the previous heartbeat. The
RR-interval between a given heartbeat and the following heartbeat is known as post-RR-interval.
The average RR-interval is the mean of the RR-intervals for a recording and is considered as the
same value for all heartbeats in a recording. Finally, the local average RR-interval is determinedby averaging the RR-intervals of the ten RR-intervals surrounding a heartbeat.
3.2.2 Heartbeat Interval Features
Three heartbeat interval features for each single channel ECG recording (see Table 3.1:
heartbeat intervals) relating to heartbeat intervals are calculated after heartbeat segmentation [7].
The time interval between the QRS onset and the QRS offset is known as QRS duration. The T-
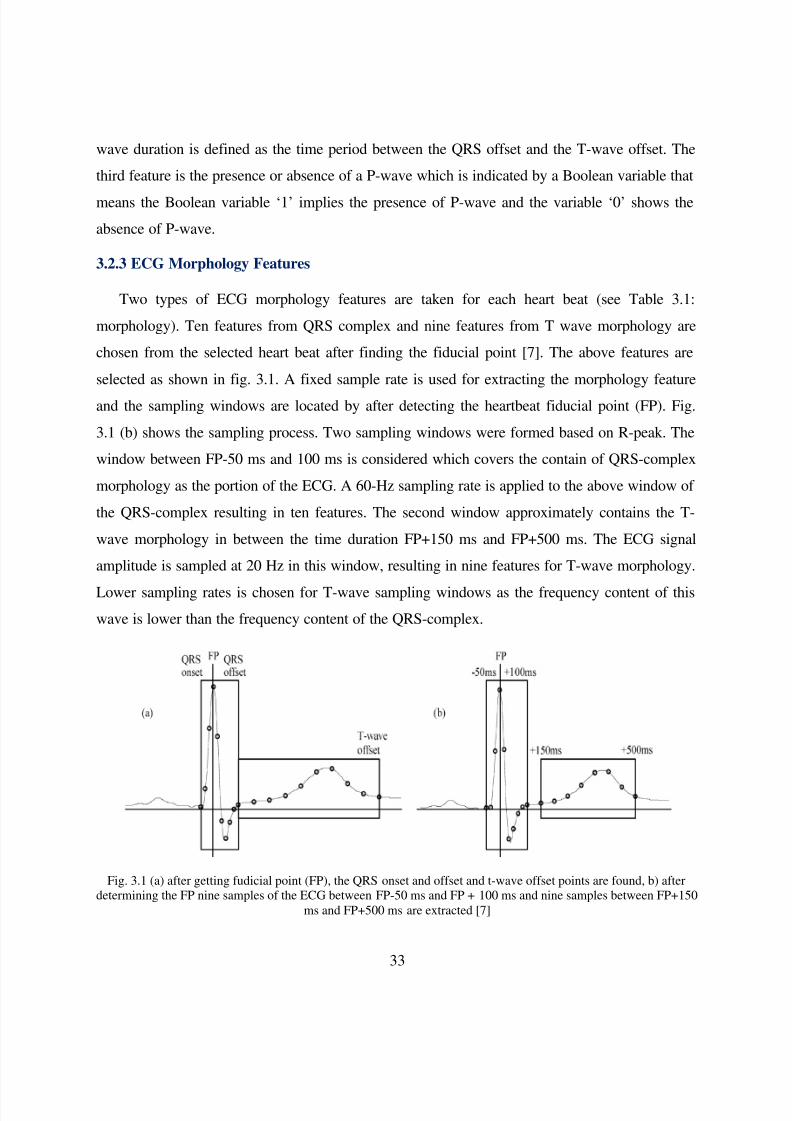
5/11/2018 Analysis of ECG Signal for Detection of Cardiac Arrhythmias - slidepdf.com
http://slidepdf.com/reader/full/analysis-of-ecg-signal-for-detection-of-cardiac-arrhythmia
33
wave duration is defined as the time period between the QRS offset and the T-wave offset. The
third feature is the presence or absence of a P-wave which is indicated by a Boolean variable that
means the Boolean variable ‘1’ implies the presence of P-wave and the variable ‘0’ shows the
absence of P-wave.
3.2.3 ECG Morphology Features
Two types of ECG morphology features are taken for each heart beat (see Table 3.1:
morphology). Ten features from QRS complex and nine features from T wave morphology are
chosen from the selected heart beat after finding the fiducial point [7]. The above features are
selected as shown in fig. 3.1. A fixed sample rate is used for extracting the morphology feature
and the sampling windows are located by after detecting the heartbeat fiducial point (FP). Fig.
3.1 (b) shows the sampling process. Two sampling windows were formed based on R-peak. The
window between FP-50 ms and 100 ms is considered which covers the contain of QRS-complex
morphology as the portion of the ECG. A 60-Hz sampling rate is applied to the above window of
the QRS-complex resulting in ten features. The second window approximately contains the T-
wave morphology in between the time duration FP+150 ms and FP+500 ms. The ECG signal
amplitude is sampled at 20 Hz in this window, resulting in nine features for T-wave morphology.
Lower sampling rates is chosen for T-wave sampling windows as the frequency content of this
wave is lower than the frequency content of the QRS-complex.
Fig. 3.1 (a) after getting fudicial point (FP), the QRS onset and offset and t-wave offset points are found, b) after
determining the FP nine samples of the ECG between FP-50 ms and FP + 100 ms and nine samples between FP+150
ms and FP+500 ms are extracted [7]

5/11/2018 Analysis of ECG Signal for Detection of Cardiac Arrhythmias - slidepdf.com
http://slidepdf.com/reader/full/analysis-of-ecg-signal-for-detection-of-cardiac-arrhythmia
34
3.4 Simulation result
The experimental results are found out after MATLAB simulation. The visualization
results of ten QRS morphology features and nine T-wave morphology feature features of the
#tape 100 in the MIT-BIH database is shown in fig.3.2. The tabulation result (see table 3.2)
shows the visualization result which indicates the total number of arrhythmias present in the
MIT-BIH arrhythmia database. The result implies the pictorial representation of each beat types,
one cardiac feature and the corresponding twenty six feature waveform. It also indicates the
#tape number as well as the beat position of which the feature is taken from the MIT-BIH
arrhythmia database after reference from annotation file.
Fig. 3.2 Ten fixed interval morphology features of QRS complex (left) and nine fixed interval morphology features
of T-wave (right) of tape#100 in MIT/BIH database
Table 3.2 Cardiac arrhythmia beat types in MIT/BIH database
Sl.
No.
Cardiac
arrhythmia
type
MIT-
BIH
Tape
No.
One cardiac Feature
(271 sample)
QRS feature (10
morphological
feature)
26 feature
Waveform
Beat
position
1Normal beat
(N)#100 2998
2
Premature
ventricular
contraction
beat (V)
#100 546789
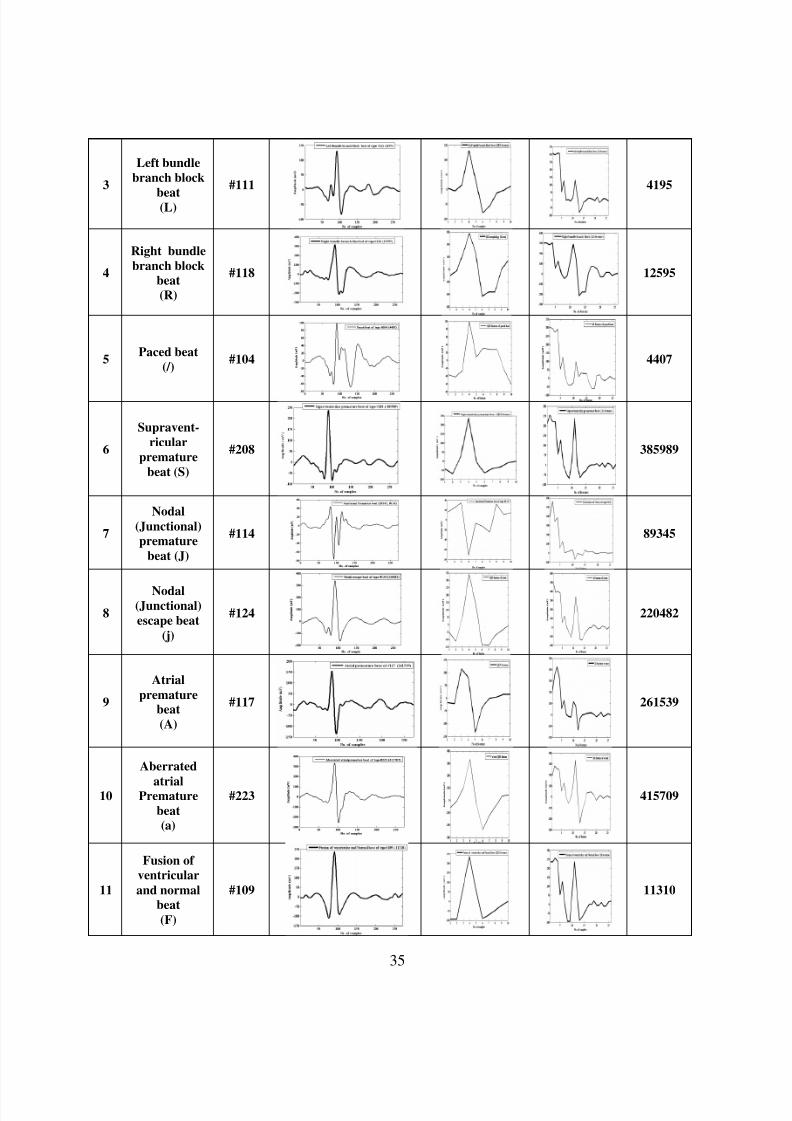
5/11/2018 Analysis of ECG Signal for Detection of Cardiac Arrhythmias - slidepdf.com
http://slidepdf.com/reader/full/analysis-of-ecg-signal-for-detection-of-cardiac-arrhythmia
35
3
Left bundle
branch block
beat(L)
#111 4195
4
Right bundle
branch block
beat
(R)
#118 12595
5Paced beat
(/)#104 4407
6
Supravent-
ricular
premature
beat (S)
#208 385989
7
Nodal
(Junctional)
premature
beat (J)
#114 89345
8
Nodal(Junctional)
escape beat
(j)
#124 220482
9
Atrial
prematurebeat
(A)
#117 261539
10
Aberrated
atrialPremature
beat
(a)
#223 415709
11
Fusion of
ventricular
and normal
beat
(F)
#109 11310
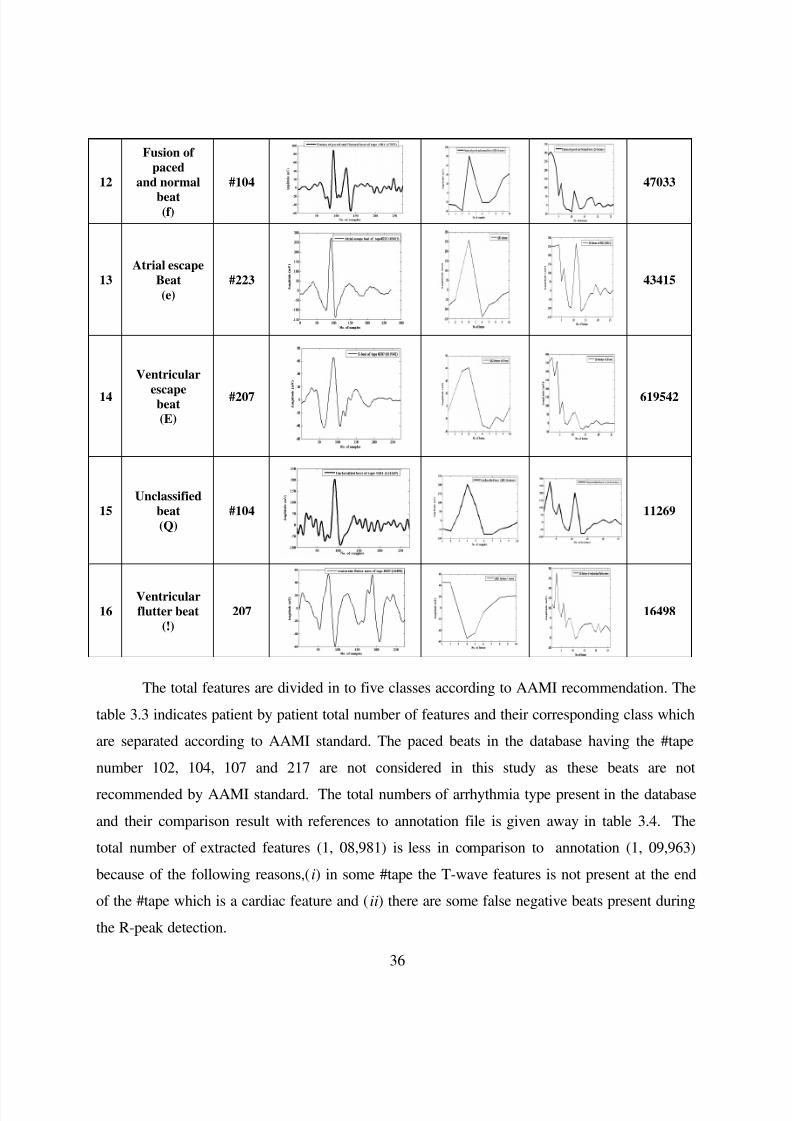
5/11/2018 Analysis of ECG Signal for Detection of Cardiac Arrhythmias - slidepdf.com
http://slidepdf.com/reader/full/analysis-of-ecg-signal-for-detection-of-cardiac-arrhythmia
36
12
Fusion of
paced
and normal
beat(f)
#104 47033
13
Atrial escape
Beat
(e)
#223 43415
14
Ventricular
escapebeat
(E)
#207 619542
15
Unclassified
beat
(Q)
#104 11269
16
Ventricular
flutter beat
(!)
207 16498
The total features are divided in to five classes according to AAMI recommendation. The
table 3.3 indicates patient by patient total number of features and their corresponding class which
are separated according to AAMI standard. The paced beats in the database having the #tape
number 102, 104, 107 and 217 are not considered in this study as these beats are not
recommended by AAMI standard. The total numbers of arrhythmia type present in the database
and their comparison result with references to annotation file is given away in table 3.4. The
total number of extracted features (1, 08,981) is less in comparison to annotation (1, 09,963)
because of the following reasons,(i) in some #tape the T-wave features is not present at the end
of the #tape which is a cardiac feature and (ii) there are some false negative beats present during
the R-peak detection.

5/11/2018 Analysis of ECG Signal for Detection of Cardiac Arrhythmias - slidepdf.com
http://slidepdf.com/reader/full/analysis-of-ecg-signal-for-detection-of-cardiac-arrhythmia
37
Table 3.3 Patient by patient report of each tape according to AAMI recommendation excluding the tape contains
paced beat
AAMI standardMIT-BIH
recordN S V F Q Total
100 2238 33 1 2272
101 1859 3 1 1863
103 2080 2 2082
105 2517 41 5 2563
106 1507 505 2012
108 1702 4 17 2 1725
109 2490 35 2 2527
111 2119 1 2120
112 2536 2 2538
113 1788 6 1794
114 1817 12 43 4 1876
115 1952 1952116 2278 1 108 2387
117 1532 1 1533
118 2166 95 16 2277
119 1543 443 1986
121 1858 1 1 1860
122 2474 2474
123 1514 3 1517
124 1535 31 45 5 1616
total normal 39505 191 1259 13 6 40974
200 1743 30 813 1 2587
201 1633 110 198 2 1943
202 2061 48 17 1 2127
203 2512 2 409 1 1 2925
205 2569 3 10 2582207 1540 107 207 1854
208 1586 2 961 368 2 2919
209 2621 374 1 2996
210 2379 16 144 6 2545
212 2741 2741
213 2638 28 76 347 3089
214 2003 245 1 1 2250
215 3187 3 148 3338
219 2080 7 2087
220 1953 94 2047
221 2031 374 2405
222 2268 207 2475
223 2034 68 404 14 2520
228 1680 3 360 2043230 2255 1 2256
231 1567 1 2 1570
232 398 1381 1779
233 2222 7 809 11 3049
234 2695 50 2745
total
abnormal50396 2541 5169 762 4 58872
Total 89901 2732 6428 775 10 99846
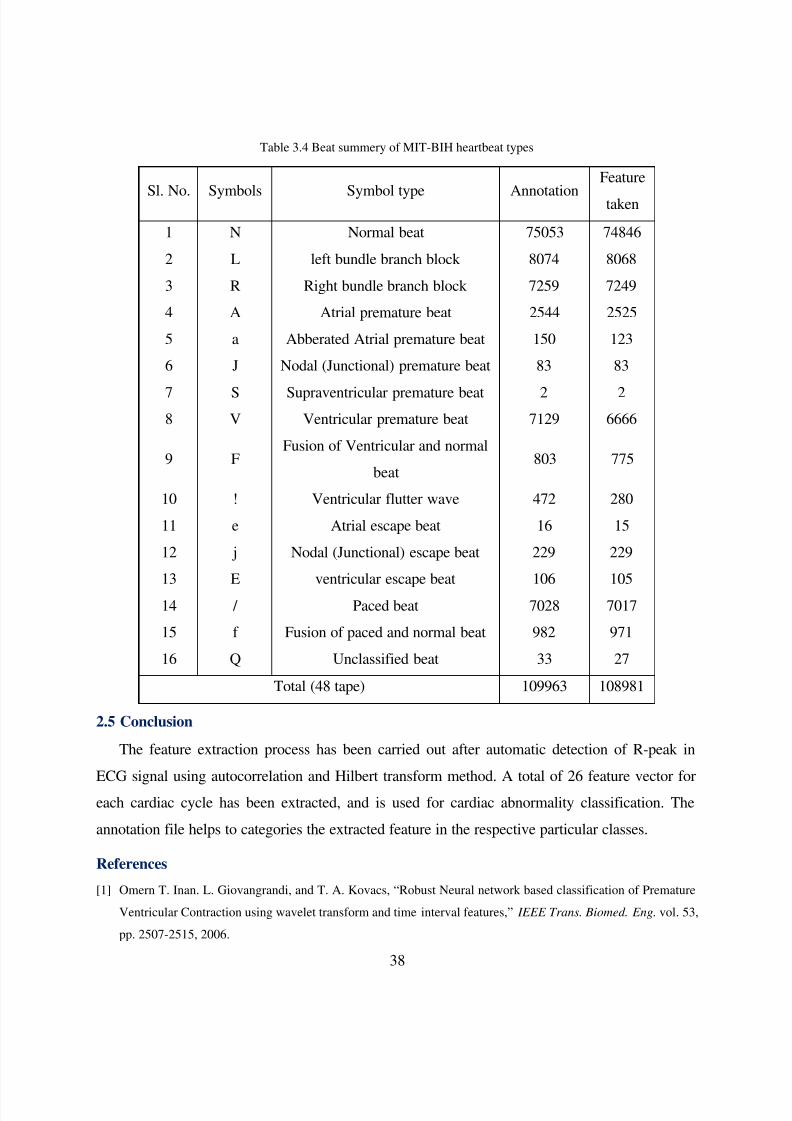
5/11/2018 Analysis of ECG Signal for Detection of Cardiac Arrhythmias - slidepdf.com
http://slidepdf.com/reader/full/analysis-of-ecg-signal-for-detection-of-cardiac-arrhythmia
38
Table 3.4 Beat summery of MIT-BIH heartbeat types
Sl. No. Symbols Symbol type Annotation
Feature
taken
1 N Normal beat 75053 74846
2 L left bundle branch block 8074 8068
3 R Right bundle branch block 7259 7249
4 A Atrial premature beat 2544 2525
5 a Abberated Atrial premature beat 150 123
6 J Nodal (Junctional) premature beat 83 83
7 S Supraventricular premature beat 2 2
8 V Ventricular premature beat 7129 6666
9 FFusion of Ventricular and normal
beat803 775
10 ! Ventricular flutter wave 472 280
11 e Atrial escape beat 16 15
12 j Nodal (Junctional) escape beat 229 229
13 E ventricular escape beat 106 105
14 / Paced beat 7028 7017
15 f Fusion of paced and normal beat 982 971
16 Q Unclassified beat 33 27
Total (48 tape) 109963 108981
2.5 Conclusion
The feature extraction process has been carried out after automatic detection of R-peak in
ECG signal using autocorrelation and Hilbert transform method. A total of 26 feature vector foreach cardiac cycle has been extracted, and is used for cardiac abnormality classification. The
annotation file helps to categories the extracted feature in the respective particular classes.
References
[1] Omern T. Inan. L. Giovangrandi, and T. A. Kovacs, “Robust Neural network based classification of Premature
Ventricular Contraction using wavelet transform and time interval features,” IEEE Trans. Biomed. Eng. vol. 53,
pp. 2507-2515, 2006.
5/11/2018 Analysis of ECG Signal for Detection of Cardiac Arrhythmias - slidepdf.com
http://slidepdf.com/reader/full/analysis-of-ecg-signal-for-detection-of-cardiac-arrhythmia
39
[2] T.Ince, S. Kiranyaz, and M. Gabbouj, “A generaric and robust system for automated patient-specific
classification of ECG signals,” IEEE Trans. Biomed. Eng. vol. 56, pp. 1415-1426, 2009.
[3] P. de Chazal, R.B. Reilly, “A patient-adapting heartbeat classifier using ECG morphology and heartbeat interval
feature,” IEEE Trans. Biomed. Eng. vol. 53, pp. 2535-2543, 2006.
[4] A. khazaee, A. Ebrahimzadeh, “classification of Electrocardiogram Signal with support vector machines and
genetic algorithms using power spectral features,” Biomedical signal and control, vol. 5, pp. 252-263, 2010.
[5] W. Jiang and S. G. Kong, “Block-based neural networks for personalized ECG signal classification,” IEEE
Trans. Neural Netw., vol. 18, no. 6 , pp. 1750–1761, Nov. 2007.
[6] S. Dutta, A chatterjee, and S. Munchi, “Correlation technique and least square support vector machine
combined for frequency domain based ECG beat classification,” Medicl Engineering & Physics, vol. 32, pp.
1161-1169, 2010.
[7] P.de Chazal, M.O. Duyer, and R.B. Reilly, “Automatic classification of heartbeat using ECG morphology and
heart beat interval features,” IEEE Trans. Biomed. Eng. vol. 51, pp. 1196-1206, 2004.
[8] M.Stridh, A. Bollmann, S.B. OLSSON, and L. Sornmo, “Detection and Feature Extraction of Atrial
Tachyarrhythmias,” IEEE Engg. In Medicine and Biology Magazine, pp. 31–39, Nov. 2006.
[9] B.A. Eisenstein, and R. J. Vaccaro, “ Feature Extraction by System Identification,” IEEE Transactions on
Systems, Man, And Cybernetics, vol.-12, No. 1, 1982.
[10] G. D. Fei, H.B. Pin and X. X. Jian, “Study of Feature Extraction Based on Autoregressive Modeling in ECG
Automatic Diagnosis,” ACTA AUTOMATICA SINICA, vol. 33, No. 5, pp. 462-466, 2007.
[11] S. C. Saxena, V. Kumar, and S. Hamde. Feature extraction from ECG signals using wavelet transform for
disease diagnostics. IJSS, 33:1073– 1085, 2002.
[12] K.P. Lil and W.H. Chang, “QRS Feature Extraction Using Linear Prediction,” IEEE Trans. Biomed. Eng. vol.
36, No. 10, 1989.
[13] P. Laguna, R. Jané, and P. Caminal, “Automatic detection of wave boundaries in multilead ECG signals:
Validation with the CSE database,”Comput. Biomed. Res., vol. 27, no. 1, pp. 45–60, 1994.
[14] S. C. Saxena, A. Sharma, and S. C. Chaudhary, “ International Journal of Systems Science,” vol. 28, No. 5, pp.
483-498, 1997.
5/11/2018 Analysis of ECG Signal for Detection of Cardiac Arrhythmias - slidepdf.com
http://slidepdf.com/reader/full/analysis-of-ecg-signal-for-detection-of-cardiac-arrhythmia
40
CHAPTER 4
Classification of Cardiac Arrhythmias
5/11/2018 Analysis of ECG Signal for Detection of Cardiac Arrhythmias - slidepdf.com
http://slidepdf.com/reader/full/analysis-of-ecg-signal-for-detection-of-cardiac-arrhythmia
41
4.1 Introduction
Automatic ECG beat classification is essential to timely dangerous heart condition. It is a
very time consuming job for doctors to analyze long ECG records. Therefore, many computer
based methods have been proposed for automatically diagnosis of the ECG beat abnormalities.
The main principles of such methods are based on pattern recognition techniques.
Several techniques have been proposed for cardiac arrhythmias classification. Among them
the most recently published work are presented [1]-[5]. Inan et al. [1] presented an approach for
classifying beats of a large dataset by training a neural network (NN) classifier using wavelet and
timing features. Inan et al. found that the fourth scale of a dyadic wavelet transform with a
quadratic spline wavelet together with the pre-/post RR-interval ratio is effective for
distinguishing normal and premature ventricular contraction (PVC) from other beats. In [2], an
approach for personalized ECG heartbeat pattern classification is presented. It is based on block-
based NNs, where a 2-D array of modular component NNs with flexible structures and internal
configurations is implemented using reconfigurable digital hardware. Network structure and
connection weights are optimized using local gradient-based search and evolutionary operators
with the rates changing adaptively according to their effectiveness in the earlier evolution period.
Two classification systems based on the support vector machine (SVM) approach has been found
in literature [3]. The first system exploits the features based on high-order statistics, while the
second uses the coefficients of Hermite polynomials. In [4], a patient-adapting heartbeat
classifier system based on linear discriminants is proposed. The system then adapts by first
training a local classifier using the newly annotated beats, and combines both local and global
classifiers to form an adapted classification system. In [5] Hu et al. combined a local classifier as
well as a global classifier using a mixture of experts (MOE) approach.
The performance result of cardiac arrhythmias beat classification algorithm has beenstandardized by the AAMI standard [9]. The AAMI standard emphasize on classifying VEB
from non-VEBs and SVEB from non- SVEBs. MIT-BIH arrhythmias [8] database has been used
for performance analysis.
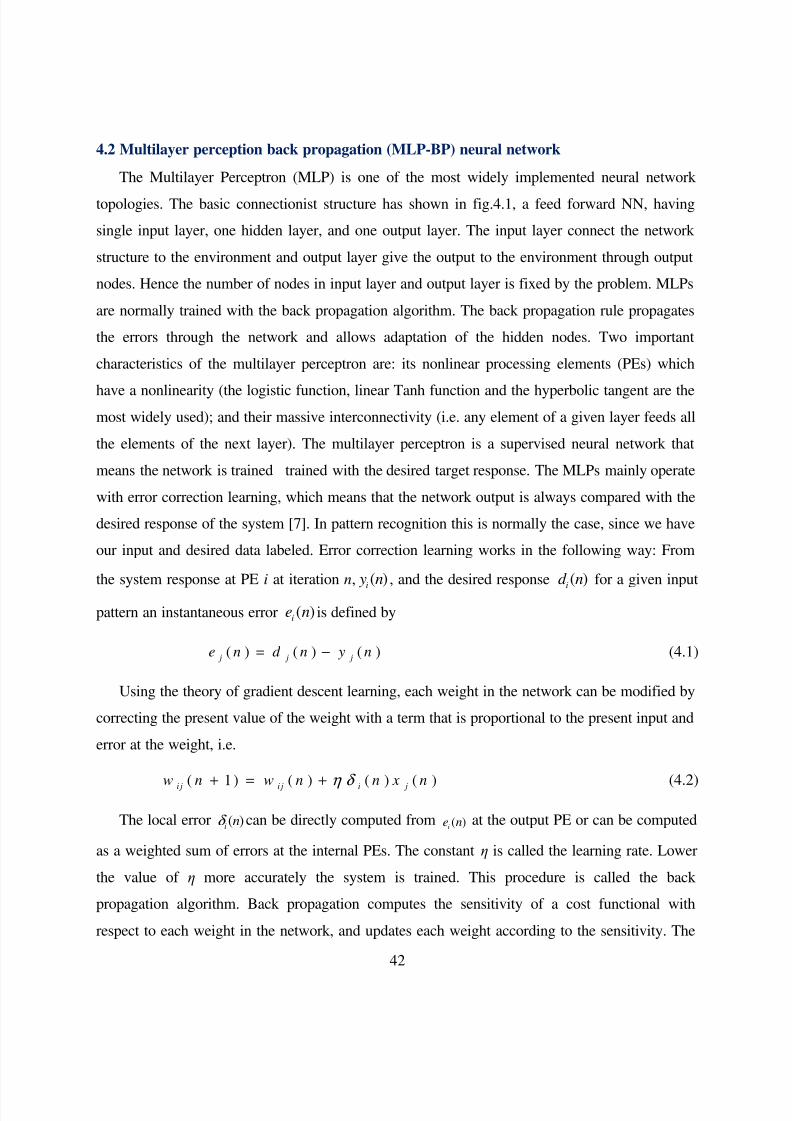
5/11/2018 Analysis of ECG Signal for Detection of Cardiac Arrhythmias - slidepdf.com
http://slidepdf.com/reader/full/analysis-of-ecg-signal-for-detection-of-cardiac-arrhythmia
42
4.2 Multilayer perception back propagation (MLP-BP) neural network
The Multilayer Perceptron (MLP) is one of the most widely implemented neural network
topologies. The basic connectionist structure has shown in fig.4.1, a feed forward NN, having
single input layer, one hidden layer, and one output layer. The input layer connect the network
structure to the environment and output layer give the output to the environment through output
nodes. Hence the number of nodes in input layer and output layer is fixed by the problem. MLPs
are normally trained with the back propagation algorithm. The back propagation rule propagates
the errors through the network and allows adaptation of the hidden nodes. Two important
characteristics of the multilayer perceptron are: its nonlinear processing elements (PEs) which
have a nonlinearity (the logistic function, linear Tanh function and the hyperbolic tangent are the
most widely used); and their massive interconnectivity (i.e. any element of a given layer feeds all
the elements of the next layer). The multilayer perceptron is a supervised neural network that
means the network is trained trained with the desired target response. The MLPs mainly operate
with error correction learning, which means that the network output is always compared with the
desired response of the system [7]. In pattern recognition this is normally the case, since we have
our input and desired data labeled. Error correction learning works in the following way: From
the system response at PEi
at iterationn
,( )
i y n
, and the desired response( )
id n
for a given input
pattern an instantaneous error ( )ie n is defined by
( ) ( ) ( ) j j je n d n y n= −
(4.1)
Using the theory of gradient descent learning, each weight in the network can be modified by
correcting the present value of the weight with a term that is proportional to the present input and
error at the weight, i.e.
( 1 ) ( ) ( ) ( )i j i j i jw n w n n x nη δ + = + (4.2)
The local error ( )i nδ can be directly computed from ( )ie n at the output PE or can be computed
as a weighted sum of errors at the internal PEs. The constant η is called the learning rate. Lower
the value of η more accurately the system is trained. This procedure is called the back
propagation algorithm. Back propagation computes the sensitivity of a cost functional with
respect to each weight in the network, and updates each weight according to the sensitivity. The
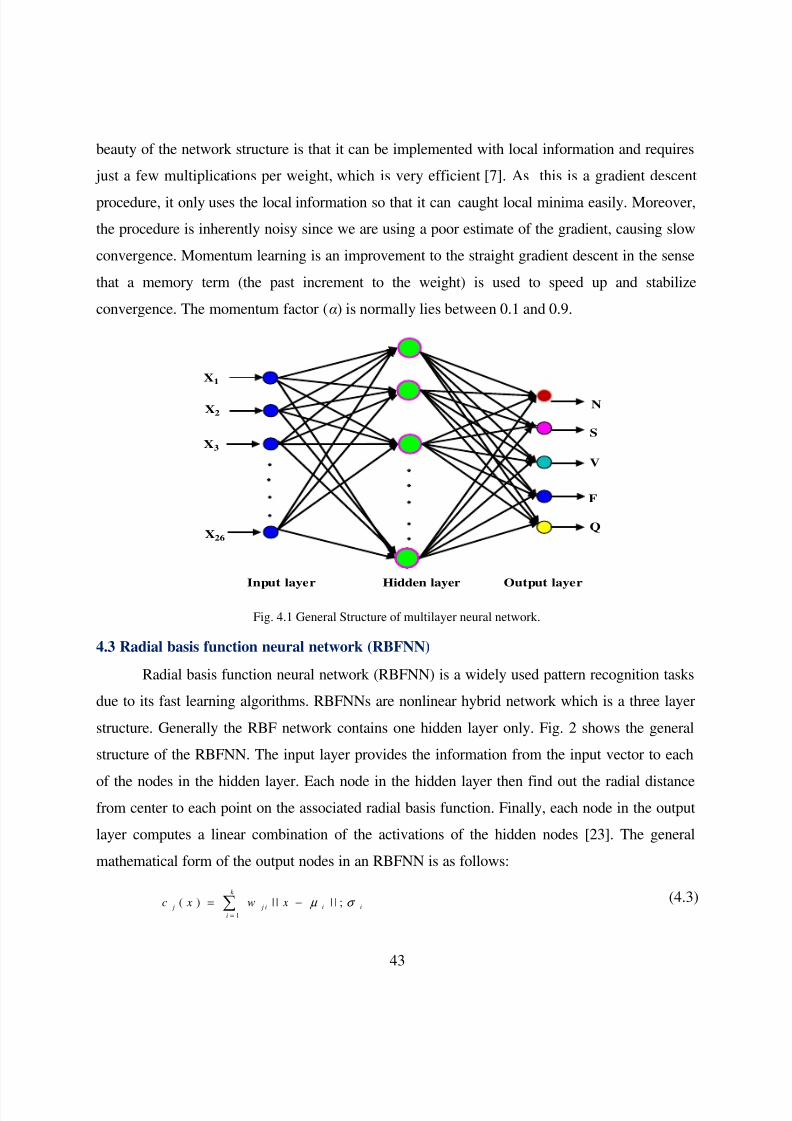
5/11/2018 Analysis of ECG Signal for Detection of Cardiac Arrhythmias - slidepdf.com
http://slidepdf.com/reader/full/analysis-of-ecg-signal-for-detection-of-cardiac-arrhythmia
43
beauty of the network structure is that it can be implemented with local information and requires
just a few multiplications per weight, which is very efficient [7]. As this is a gradient descent
procedure, it only uses the local information so that it can caught local minima easily. Moreover,
the procedure is inherently noisy since we are using a poor estimate of the gradient, causing slow
convergence. Momentum learning is an improvement to the straight gradient descent in the sense
that a memory term (the past increment to the weight) is used to speed up and stabilize
convergence. The momentum factor (α) is normally lies between 0.1 and 0.9.
N
F
V
S
X1
X2
X3
X26
Input layer Output layerHidden layer
Q
Fig. 4.1 General Structure of multilayer neural network.
4.3 Radial basis function neural network (RBFNN)
Radial basis function neural network (RBFNN) is a widely used pattern recognition tasks
due to its fast learning algorithms. RBFNNs are nonlinear hybrid network which is a three layer
structure. Generally the RBF network contains one hidden layer only. Fig. 2 shows the general
structure of the RBFNN. The input layer provides the information from the input vector to each
of the nodes in the hidden layer. Each node in the hidden layer then find out the radial distance
from center to each point on the associated radial basis function. Finally, each node in the output
layer computes a linear combination of the activations of the hidden nodes [23]. The general
mathematical form of the output nodes in an RBFNN is as follows:
1
( ) | | | | ;k
j j i i i
i
c x w x µ σ =
= −∑
(4.3)
5/11/2018 Analysis of ECG Signal for Detection of Cardiac Arrhythmias - slidepdf.com
http://slidepdf.com/reader/full/analysis-of-ecg-signal-for-detection-of-cardiac-arrhythmia
44
where ( ) jc x is the function corresponding to the j
th output unit (class- j) and is a linear
combination of k radial basis functions (.)φ with center i µ and bandwidth i
σ . Also, j
w is the
weight vector of class- j and jiw is the weight corresponding to the j
th class and i
thcenter.
In pattern recognition problems usually a Gaussian function is used as the basis function of
the RBFNN [23]. So, the Eq. (4.3) becomes:
2
21
| | | |( ) e x p
2
k i
j j i
i i
xc x w
µ
σ =
−=
∑
(4.4)
From the Eq. (4.4) it can be clearly seen that the output of the RBFNN is dependent to the
total number of neurons k , the weights between the output and the hidden layer of the network
jiw , centers of the each neuron i µ and finally bandwidth of the each neuron i
σ . So the
classification performance of the RBFNN lies in determining the correct parameters for the
network that means (center and spread).
N
F
V
S
X1
X2
X3
X26
Input layer Output layerHidden layer
Q
Fig. 4.2 General structure of the radial basis function neural network.
The centers and widths of the RBFNN are the two parameters which can affect the
classification performance. Several methods have been proposed to find the centers of the
RBFNN. This are usually clustering based methods that find center locations between the input
feature vector locations or some of the input feature vectors directly can be used as the centers of
the neurons. Hence it has been confirmed that the best center locations may not be necessarily

5/11/2018 Analysis of ECG Signal for Detection of Cardiac Arrhythmias - slidepdf.com
http://slidepdf.com/reader/full/analysis-of-ecg-signal-for-detection-of-cardiac-arrhythmia
45
located inside the input feature vectors. The most common algorithm to determine the neuron
centers of the RBFNN are the K-Means algorithm.
Fig. 4.3 Block diagram representation of ECG beat classifier.
4.4 Performance matrix
The performance of the classifier is estimated four statistical indices [22]: classification
accuracy (Acc), sensitivity (Se), specificity (Sp), and positive predictivity (Pp), which are
defined in the following Eqs. (4.5) – (4.8), respectively.
1. Classification Accuracy ( Acc)
Classification accuracy measures the overall system performance over all classes of
beats. It is the ratio of correctly classified patterns to the total number of pattern classified.
( )% 100TP TN
AccTP TN FP FN
+= ×
+ + + (4.5)
2. Sensitivity (Se)
It is the ratio of correctly classified event among all events.
( )% 100TP
SeTP FN
= ×+ (4.6)
3. Specificity (Spe)
The specificity is the ratio of the number of correctly rejected nonevents, TN (true
negatives), to the total number of nonevents and is given by
( )% 100TP
SpeT N FP
= ×+ (4.7)
4. Positive predictivity (Ppr )
Positive predictivity is the ratio of the number of correctly detected events, TP, to the
total number of events detected by the analyzer and is given by
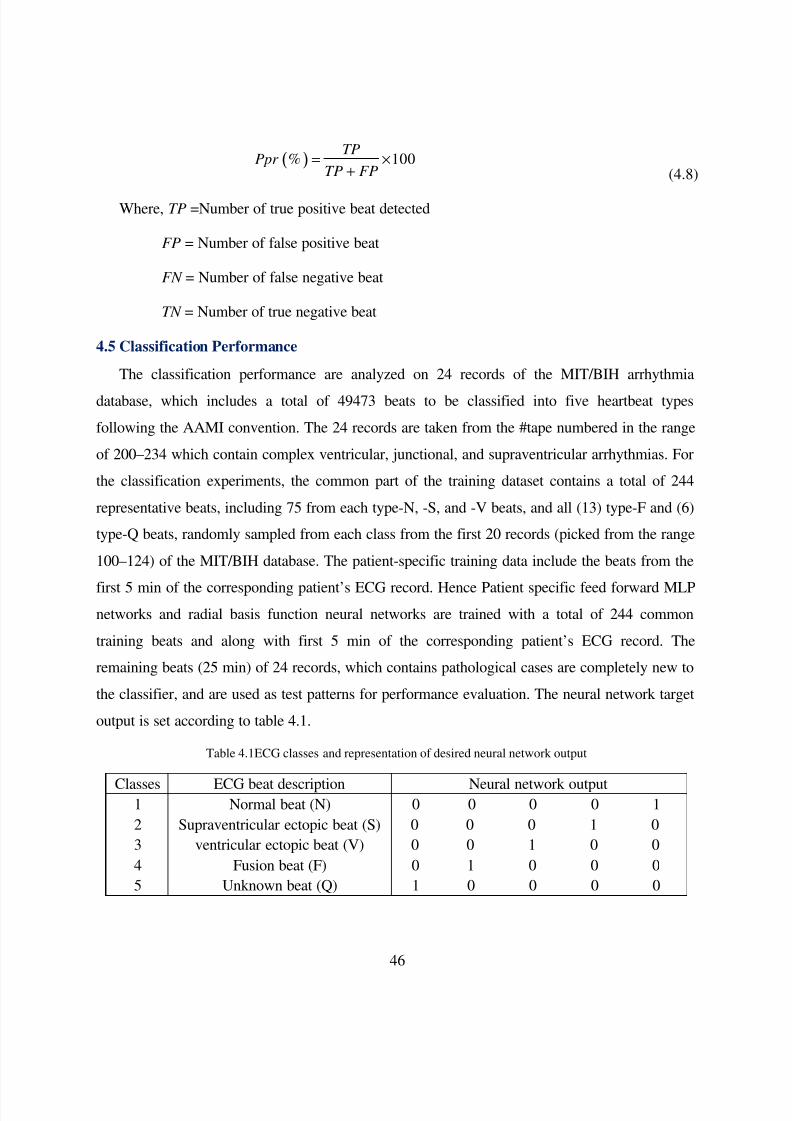
5/11/2018 Analysis of ECG Signal for Detection of Cardiac Arrhythmias - slidepdf.com
http://slidepdf.com/reader/full/analysis-of-ecg-signal-for-detection-of-cardiac-arrhythmia
46
( )% 100TP
Ppr TP FP
= ×+ (4.8)
Where, TP =Number of true positive beat detected
FP = Number of false positive beat
FN = Number of false negative beat
TN = Number of true negative beat
4.5 Classification Performance
The classification performance are analyzed on 24 records of the MIT/BIH arrhythmia
database, which includes a total of 49473 beats to be classified into five heartbeat types
following the AAMI convention. The 24 records are taken from the #tape numbered in the range
of 200–234 which contain complex ventricular, junctional, and supraventricular arrhythmias. For
the classification experiments, the common part of the training dataset contains a total of 244
representative beats, including 75 from each type-N, -S, and -V beats, and all (13) type-F and (6)
type-Q beats, randomly sampled from each class from the first 20 records (picked from the range
100–124) of the MIT/BIH database. The patient-specific training data include the beats from the
first 5 min of the corresponding patient’s ECG record. Hence Patient specific feed forward MLP
networks and radial basis function neural networks are trained with a total of 244 common
training beats and along with first 5 min of the corresponding patient’s ECG record. The
remaining beats (25 min) of 24 records, which contains pathological cases are completely new to
the classifier, and are used as test patterns for performance evaluation. The neural network target
output is set according to table 4.1.
Table 4.1ECG classes and representation of desired neural network output
Classes ECG beat description Neural network output1 Normal beat (N) 0 0 0 0 1
2 Supraventricular ectopic beat (S) 0 0 0 1 0
3 ventricular ectopic beat (V) 0 0 1 0 0
4 Fusion beat (F) 0 1 0 0 0
5 Unknown beat (Q) 1 0 0 0 0
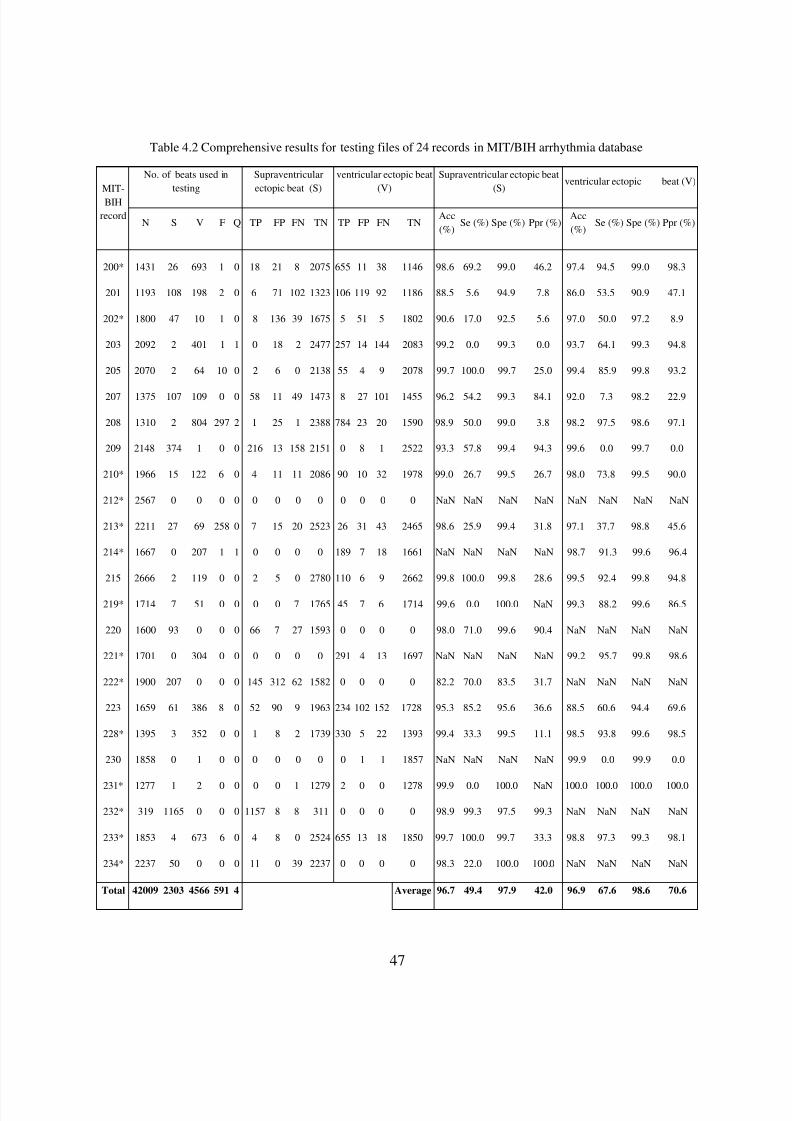
5/11/2018 Analysis of ECG Signal for Detection of Cardiac Arrhythmias - slidepdf.com
http://slidepdf.com/reader/full/analysis-of-ecg-signal-for-detection-of-cardiac-arrhythmia
47
Table 4.2 Comprehensive results for testing files of 24 records in MIT/BIH arrhythmia database
MIT-
BIH
record
No. of beats used in
testing
Supraventricular
ectopic beat (S)
ventricular ectopic beat
(V)
Supraventricular ectopic beat
(S)ventricular ectopic beat (V)
N S V F Q TP FP FN TN TP FP FN TNAcc
(%)Se (%) Spe (%) Ppr (%)
Acc
(%)Se (%) Spe (%) Ppr (%)
200* 1431 26 693 1 0 18 21 8 2075 655 11 38 1146 98.6 69.2 99.0 46.2 97.4 94.5 99.0 98.3
201 1193 108 198 2 0 6 71 102 1323 106 119 92 1186 88.5 5.6 94.9 7.8 86.0 53.5 90.9 47.1
202* 1800 47 10 1 0 8 136 39 1675 5 51 5 1802 90.6 17.0 92.5 5.6 97.0 50.0 97.2 8.9
203 2092 2 401 1 1 0 18 2 2477 257 14 144 2083 99.2 0.0 99.3 0.0 93.7 64.1 99.3 94.8
205 2070 2 64 10 0 2 6 0 2138 55 4 9 2078 99.7 100.0 99.7 25.0 99.4 85.9 99.8 93.2
207 1375 107 109 0 0 58 11 49 1473 8 27 101 1455 96.2 54.2 99.3 84.1 92.0 7.3 98.2 22.9
208 1310 2 804 297 2 1 25 1 2388 784 23 20 1590 98.9 50.0 99.0 3.8 98.2 97.5 98.6 97.1
209 2148 374 1 0 0 216 13 158 2151 0 8 1 2522 93.3 57.8 99.4 94.3 99.6 0.0 99.7 0.0
210* 1966 15 122 6 0 4 11 11 2086 90 10 32 1978 99.0 26.7 99.5 26.7 98.0 73.8 99.5 90.0
212* 2567 0 0 0 0 0 0 0 0 0 0 0 0 NaN NaN NaN NaN NaN NaN NaN NaN
213* 2211 27 69 258 0 7 15 20 2523 26 31 43 2465 98.6 25.9 99.4 31.8 97.1 37.7 98.8 45.6
214* 1667 0 207 1 1 0 0 0 0 189 7 18 1661 NaN NaN NaN NaN 98.7 91.3 99.6 96.4
215 2666 2 119 0 0 2 5 0 2780 110 6 9 2662 99.8 100.0 99.8 28.6 99.5 92.4 99.8 94.8
219* 1714 7 51 0 0 0 0 7 1765 45 7 6 1714 99.6 0.0 100.0 NaN 99.3 88.2 99.6 86.5
220 1600 93 0 0 0 66 7 27 1593 0 0 0 0 98.0 71.0 99.6 90.4 NaN NaN NaN NaN
221* 1701 0 304 0 0 0 0 0 0 291 4 13 1697 NaN NaN NaN NaN 99.2 95.7 99.8 98.6
222* 1900 207 0 0 0 145 312 62 1582 0 0 0 0 82.2 70.0 83.5 31.7 NaN NaN NaN NaN
223 1659 61 386 8 0 52 90 9 1963 234 102 152 1728 95.3 85.2 95.6 36.6 88.5 60.6 94.4 69.6
228* 1395 3 352 0 0 1 8 2 1739 330 5 22 1393 99.4 33.3 99.5 11.1 98.5 93.8 99.6 98.5
230 1858 0 1 0 0 0 0 0 0 0 1 1 1857 NaN NaN NaN NaN 99.9 0.0 99.9 0.0
231* 1277 1 2 0 0 0 0 1 1279 2 0 0 1278 99.9 0.0 100.0 NaN 100.0 100.0 100.0 100.0
232* 319 1165 0 0 0 1157 8 8 311 0 0 0 0 98.9 99.3 97.5 99.3 NaN NaN NaN NaN
233* 1853 4 673 6 0 4 8 0 2524 655 13 18 1850 99.7 100.0 99.7 33.3 98.8 97.3 99.3 98.1
234* 2237 50 0 0 0 11 0 39 2237 0 0 0 0 98.3 22.0 100.0 100.0 NaN NaN NaN NaN
Total 42009 2303 4566 591 4 Average 96.7 49.4 97.9 42.0 96.9 67.6 98.6 70.6
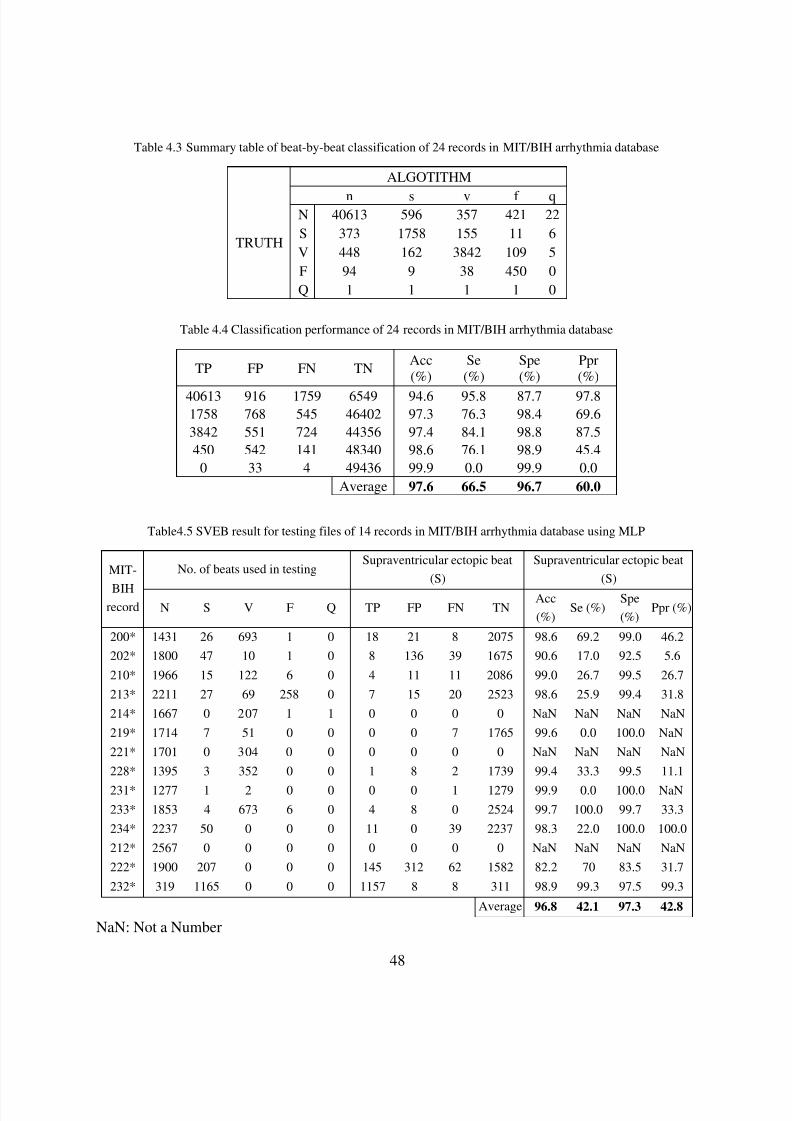
5/11/2018 Analysis of ECG Signal for Detection of Cardiac Arrhythmias - slidepdf.com
http://slidepdf.com/reader/full/analysis-of-ecg-signal-for-detection-of-cardiac-arrhythmia
48
Table 4.3 Summary table of beat-by-beat classification of 24 records in MIT/BIH arrhythmia database
ALGOTITHM
TRUTH
n s v f q N 40613 596 357 421 22
S 373 1758 155 11 6
V 448 162 3842 109 5
F 94 9 38 450 0
Q 1 1 1 1 0
Table 4.4 Classification performance of 24 records in MIT/BIH arrhythmia database
TP FP FN TN Acc
(%) Se
(%) Spe
(%) Ppr
(%)
40613 916 1759 6549 94.6 95.8 87.7 97.8 1758 768 545 46402 97.3 76.3 98.4 69.6
3842 551 724 44356 97.4 84.1 98.8 87.5
450 542 141 48340 98.6 76.1 98.9 45.4
0 33 4 49436 99.9 0.0 99.9 0.0
Average 97.6 66.5 96.7 60.0
Table4.5 SVEB result for testing files of 14 records in MIT/BIH arrhythmia database using MLP
MIT-
BIH
record
No. of beats used in testingSupraventricular ectopic beat
(S)
Supraventricular ectopic beat
(S)
N S V F Q TP FP FN TNAcc
(%)Se (%)
Spe
(%)Ppr (%)
200* 1431 26 693 1 0 18 21 8 2075 98.6 69.2 99.0 46.2
202* 1800 47 10 1 0 8 136 39 1675 90.6 17.0 92.5 5.6
210* 1966 15 122 6 0 4 11 11 2086 99.0 26.7 99.5 26.7
213* 2211 27 69 258 0 7 15 20 2523 98.6 25.9 99.4 31.8
214* 1667 0 207 1 1 0 0 0 0 NaN NaN NaN NaN
219* 1714 7 51 0 0 0 0 7 1765 99.6 0.0 100.0 NaN
221* 1701 0 304 0 0 0 0 0 0 NaN NaN NaN NaN
228* 1395 3 352 0 0 1 8 2 1739 99.4 33.3 99.5 11.1
231* 1277 1 2 0 0 0 0 1 1279 99.9 0.0 100.0 NaN
233* 1853 4 673 6 0 4 8 0 2524 99.7 100.0 99.7 33.3
234* 2237 50 0 0 0 11 0 39 2237 98.3 22.0 100.0 100.0
212* 2567 0 0 0 0 0 0 0 0 NaN NaN NaN NaN
222* 1900 207 0 0 0 145 312 62 1582 82.2 70 83.5 31.7
232* 319 1165 0 0 0 1157 8 8 311 98.9 99.3 97.5 99.3
Average 96.8 42.1 97.3 42.8
NaN: Not a Number

5/11/2018 Analysis of ECG Signal for Detection of Cardiac Arrhythmias - slidepdf.com
http://slidepdf.com/reader/full/analysis-of-ecg-signal-for-detection-of-cardiac-arrhythmia
49
Table 4.6 VEB result for testing files of 11 records in MIT/BIH arrhythmia database using MLP
MIT-
BIH
record
No. of beats used in testing Ventricular ectopicbeat (V)
Ventricular ectopicbeat (V)
N S V F Q TP FP FN TNAcc
(%)
Se
(%)
Spe
(%)
Ppr
(%)
200* 1431 26 693 1 0 655 11 38 1146 97.4 94.5 99.0 98.3
202* 1800 47 10 1 0 5 51 5 1802 97.0 50.0 97.2 8.9
210* 1966 15 122 6 0 90 10 32 1978 98.0 73.8 99.5 90.0
213* 2211 27 69 258 0 26 31 43 2465 97.1 37.7 98.8 45.6
214* 1667 0 207 1 1 189 7 18 1661 98.7 91.3 99.6 96.4
219* 1714 7 51 0 0 45 7 6 1714 99.3 88.2 99.6 86.5
221* 1701 0 304 0 0 291 4 13 1697 99.2 95.7 99.8 98.6
228* 1395 3 352 0 0 330 5 22 1393 98.5 93.8 99.6 98.5
231* 1277 1 2 0 0 2 0 0 1278 100.0 100.0 100.0 100.0
233* 1853 4 73 0 55 13 18 1850 98.8 97.3 99.3 98.1
234* 2237 50 0 0 0 0 0 0 0 NaN NaN NaN NaN
Average 98.4 82.2 99.2 82.1
Table 4.7 SVEB result for testing files of 14 records in MIT/BIH arrhythmia database using RBF
MIT-
BIH
record
No. of beats used in testingSupraventricular ectopic beat
(S)Supraventricular ectopic beat (S)
N S V F Q TP FP FN TNAcc
(%)Se(%) Spe(%) Ppr(%)
200* 1431 26 693 1 0 14 71 12 2054 96.14 53.85 0.66 16.47
202* 1800 47 10 1 0 37 540 10 1271 70.40 78.72 2.04 6.41
210* 1966 15 122 6 0 6 76 9 2018 95.97 40.00 0.29 7.32
212* 2567 0 0 0 0 0 233 0 2334 90.92 NaN 0.00 0.00
213* 2211 27 69 258 0 16 142 11 2396 59.26 59.26 0.63 10.13
214* 1667 0 207 1 1 0 86 0 1790 NaN NaN 0.00 0.00
219* 1714 7 51 0 0 3 96 4 1669 42.86 42.86 0.17 3.03
221* 1701 0 304 0 0 0 96 0 1909 NaN NaN 0.00 0.00
222* 1900 207 0 0 0 195 83 12 1817 94.20 94.20 10.26 70.14
228* 1395 3 352 0 0 3 10 0 1737 100.00 100.00 0.17 23.08
231* 1277 1 2 0 0 1 17 0 1262 100.00 100.00 0.08 5.56
232* 319 1165 0 0 0 1026 20 139 299 88.07 88.07 321.63 98.09
233* 1853 4 673 6 0 4 157 0 2375 100.00 100.00 0.16 2.48
234* 2237 50 0 0 0 26 81 24 2156 52.00 52.00 1.16 24.30
Average 82.49 73.54 30.66 24.27
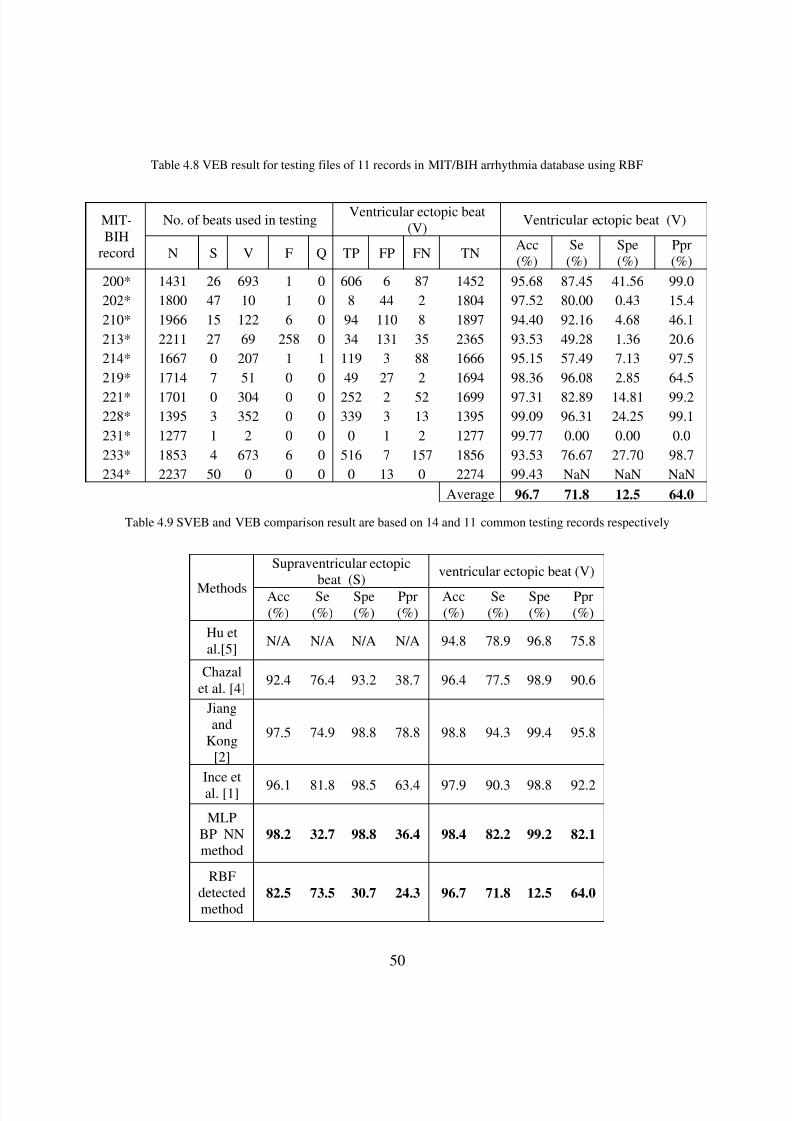
5/11/2018 Analysis of ECG Signal for Detection of Cardiac Arrhythmias - slidepdf.com
http://slidepdf.com/reader/full/analysis-of-ecg-signal-for-detection-of-cardiac-arrhythmia
50
Table 4.8 VEB result for testing files of 11 records in MIT/BIH arrhythmia database using RBF
MIT-
BIH
record
No. of beats used in testing Ventricular ectopic beat
(V) Ventricular ectopic beat (V)
N S V F Q TP FP FN TN Acc
(%) Se
(%) Spe
(%) Ppr
(%)
200* 1431 26 693 1 0 606 6 87 1452 95.68 87.45 41.56 99.0
202* 1800 47 10 1 0 8 44 2 1804 97.52 80.00 0.43 15.4
210* 1966 15 122 6 0 94 110 8 1897 94.40 92.16 4.68 46.1
213* 2211 27 69 258 0 34 131 35 2365 93.53 49.28 1.36 20.6
214* 1667 0 207 1 1 119 3 88 1666 95.15 57.49 7.13 97.5
219* 1714 7 51 0 0 49 27 2 1694 98.36 96.08 2.85 64.5
221* 1701 0 304 0 0 252 2 52 1699 97.31 82.89 14.81 99.2
228* 1395 3 352 0 0 339 3 13 1395 99.09 96.31 24.25 99.1
231* 1277 1 2 0 0 0 1 2 1277 99.77 0.00 0.00 0.0
233* 1853 4 673 6 0 516 7 157 1856 93.53 76.67 27.70 98.7
234* 2237 50 0 0 0 0 13 0 2274 99.43 NaN NaN NaN
Average 96.7 71.8 12.5 64.0
Table 4.9 SVEB and VEB comparison result are based on 14 and 11 common testing records respectively
Methods
Supraventricular ectopic
beat (S)
ventricular ectopic beat (V)
Acc
(%) Se
(%) Spe
(%) Ppr
(%) Acc
(%) Se
(%) Spe
(%) Ppr
(%)
Hu et
al.[5] N/A N/A N/A N/A 94.8 78.9 96.8 75.8
Chazal
et al. [4] 92.4 76.4 93.2 38.7 96.4 77.5 98.9 90.6
Jiang
and
Kong
[2]
97.5 74.9 98.8 78.8 98.8 94.3 99.4 95.8
Ince etal. [1] 96.1 81.8 98.5 63.4 97.9 90.3 98.8 92.2
MLP
BP NN
method 98.2 32.7 98.8 36.4 98.4 82.2 99.2 82.1
RBF
detected
method 82.5 73.5 30.7 24.3 96.7 71.8 12.5 64.0

5/11/2018 Analysis of ECG Signal for Detection of Cardiac Arrhythmias - slidepdf.com
http://slidepdf.com/reader/full/analysis-of-ecg-signal-for-detection-of-cardiac-arrhythmia
51
N/A: Not AnalyzedTable 4.10 VEB and SVEB comparison result are based on 24 common testing records
Methods
Supraventricular ectopic beat (S) ventricular ectopic beat (V)
Acc
(%)Se(%) Spe(%) Ppr(%) Acc (%) Se(%) Spe(%) Ppr(%)
Jiang and
Kong [2]96.6 50.6 98.8 67.9 98.1 86.6 99.3 93.3
Ince et al.
[1]96.1 62.2 98.5 56.7 97.6 83.4 98.1 87.4
ANN
detected
method
96.7 49.4 97.9 42 96.9 67.6 98.6 70.6
Table 4.2 summarizes beat-by-beat classification results of ECG heartbeat patterns for 24
test records. Classification performance is measured using the four standard metrics:
classification accuracy ( Acc), sensitivity (Sen), specificity (Spe), and positive predictivity (Ppr ).
The MLP neural network and RBF neural network are compared with three existing algorithms,
[1], [2], [3] and [5], which comply with the AAMI standards and use all records from the
MIT/BIH arrhythmia database. For comparing the performance results, the problem of VEB andSVEB detection is considered individually. The performance results for VEB detection in the
first four rows of Table 4.9 are based on 11 test recordings (200, 202, 210, 213, 214, 219, 221,
228, 231, 233, and 234) that are common to all four methods. For SVEB detection, comparison
results are based on 14 common recordings (with the addition of records 212, 222, and 232). It
is observed that the MLP neural network classifier achieves comparable performance over the
training and testing set of patient records as companied to existing method [1] and [2]. It is worth
noting that the number of training beats used for each patient’s classifier was less than 2% of all
beats in the training dataset. Experimental result shows that the MLP –BP neural network
achieves better result as compared to RBF network.
4.6 Conclusion
The ECG signal can be used as a reliable indicator of heart diseases. The MLP neural
network and RBF neural network classifiers are presented as the diagnostic tool to aid the
5/11/2018 Analysis of ECG Signal for Detection of Cardiac Arrhythmias - slidepdf.com
http://slidepdf.com/reader/full/analysis-of-ecg-signal-for-detection-of-cardiac-arrhythmia
52
physician in the analysis of cardiac abnormalities. The most important factor in determining
whether an automatic ECG diagnosis system is successful or not is the accuracy of event
detection. The accuracy of the tools depends on several factors, such as the size and quality of
the training set, the efficient extracted feature set and also the parameters chosen to represent the
input. The experimental result shows that the MLP BP NN achieves sensitivity of 98.2% and
98.4% for SVEBs and VEBs respectively. For the same number of test set the RBF NN shows
sensitivity 82.5% and 96.7% for SVEBs and VEBs respectively. Hence the MLP neural network
shows better result as compared to RBF neural network.
References
[1] T.Ince, S. Kiranyaz, and M. Gabbouj, “A generaric and robust system for automated patient-specific
classification of ECG signals,” IEEE Trans. Biomed. Eng. vol. 56, pp. 1415-1426, 2009.
[2] W. Jiang and S. G. Kong, “Block-based neural networks for personalized ECG signal classification,” IEEE
Trans. Neural Netw., vol. 18, no. 6, pp. 1750–1761, Nov. 2007.
[3] S. Osowski, T. H. Linh, and T. Markiewicz, “Support vector machinebased expert system for reliable heart
beat recognition,” IEEE Trans. Biomed. Eng., vol. 51, no. 4, pp. 582–589, Apr. 2004.
[4]
P.de Chazal, M.O. Duyer, and R.B. Reilly, “Automatic classification of heartbeat using ECG morphologyand heart beat interval features,” IEEE Trans. Biomed. Eng. vol. 51, pp. 1196-1206, 2004.
[5] Y. Hu, S. Palreddy, and W. J. Tompkins, “A patient-adaptable ECG beat classifier using a mixture of
experts approach,” IEEE Trans. Biomed. Eng., vol. 44, no. 9, pp. 891–900, Sep. 1997.
[6] P. de Chazal, R.B. Reilly, “A patient-adapting heartbeat classifier using ECG morphology and heartbeat
interval feature,” IEEE Trans. Biomed. Eng. vol. 53, pp. 2535-2543, 2006.
[7] Simon Haykin, Neural networks a comprehensive foundation, Pearson Prentice Hall, pp.178-330.
[8] MIT-BIH Database distribution, Massachusetts Institute of Technology, 77 Massachusetts Avenue,
Cambridge, MA 02139,1998.http://www.physionet.org/physiobank/database/mitdb/
[9] American National Standard for Ambulatory Electrocardiographs, publication ANSI/AAMI EC38-1994,
Association for the Advancement of Medical Instrumentation, 1994.
[10] D. A. Coast, R. M. Stern, G. G. Vano and S. A. Biller, "An approach to cardiac arrhythmia analysis using
Hidden Markov Model, " IEEE Trans. Biomed. Eng. ,vol. 37, no. 9,Sep. 1990.

5/11/2018 Analysis of ECG Signal for Detection of Cardiac Arrhythmias - slidepdf.com
http://slidepdf.com/reader/full/analysis-of-ecg-signal-for-detection-of-cardiac-arrhythmia
53
[11] R. J. Schalkoff, "Pattern Recognition: Statistical, Structural, and Neural Approaches", JOHN WILEY &
SONS, INC., 1992.
[12] T. H. Yeap, F. Johnson, and M. Rachniowski, “ECG beat classification by a neural network,” in Proc.
Annu. Int. Conf. IEEE Engineering Medicine and Biology Society, 1990, pp. 1457–1458.
[13] Y. H. Hu, W. J. Tompkins, J. L. Urrusti, and V. X. Afonso, “Applications of artificial neural networks for
ECG signal detection and classification,” J. Electrocardiol., vol. 26, pp. 66–73, 1993.
[14] S. Osowski and T. L. Linh, “ECG beat recognition using fuzzy hybrid neural network,” IEEE Trans.
Biomed. Eng., vol. 48, no. 11, pp.1265–1271, Nov. 2001.
[15] I. Christov, I. Jekova, and G. Bortolan, “Premature ventricular contraction classification by the kth
nearest-neighbours rule,” Physiol. Meas., vol. 26, pp. 123–130, 2005.
[16] S. Evans, H. Hastings, and M. Bodenheimer, “Differentiation of beats of ventricular and sinus origin using
a self-training neural network,” PACE , vol. 17, pp. 611–626, 1994.
[17] Recommended Practice for Testing and Reporting Performance Results of Ventricular Arrhythmia
Detection Algorithms, 1987. Association for the Advancement of Medical lnstrumentation.
[18] B. D. Ripley, Pattern Recognition and Neural Networks, Cambridge, U.K.: Cambridge Univ. Press, 1996.
[19] P. de Chazal and R. B. Reilly, “A comparison of the ECG classification performance of different feature
sets,” Proc. Comput. Cardiology, vol. 27, pp. 327–330, 2000.
[20] T. H. Linh, S. Osowski, and M. Stodolski, “On-line heart beat recognition using Hermite polynomials and
neuro-fuzzy network,” IEEE Trans. Instrum. Meas., vol. 52, no. 4, pp. 1224–1231, Aug. 2003.
[21] X. Yao, “Evolving artificial neural networks,” Proc. IEEE , vol. 87, no. 9, pp. 1423–1447, Sep. 1999.
[22] A. E. Zadeh, A. Khazaee, and V. Ranaee, “classification of electrocardiogram signal using supervisedclassifier and efficient features,” Computer methods and Programs in Biomedicine, vol. 99, pp. 179-194,
2010.
[23] M.Korurek and B.Dogan. “ECG beat classification using particle swarm optimization and radial basis
function neural network,” Expert System with Application, vol. 33, pp. 7563-7569, 2010.
[24] R. O. Duda, P. E. Hart, and D. G. Stork , Pattern Recognition, 2nd ed. New York: Wiley, 2000.

5/11/2018 Analysis of ECG Signal for Detection of Cardiac Arrhythmias - slidepdf.com
http://slidepdf.com/reader/full/analysis-of-ecg-signal-for-detection-of-cardiac-arrhythmia
54
CHAPTER 5
Conclusion and Future work

5/11/2018 Analysis of ECG Signal for Detection of Cardiac Arrhythmias - slidepdf.com
http://slidepdf.com/reader/full/analysis-of-ecg-signal-for-detection-of-cardiac-arrhythmia
55
5.1 Conclusion
This thesis provides an algorithm for accurate detection of QRS complex and automatic
classification of cardiac arrhythmias recommended by Association for the Advancement of
Medical Instrumentation (AAMI). Feature extraction methodology proves an essential process
for reducing the inputs to the classifier drastically. The automatic classification of arrhythmias
helps in recognizing the diseases more accurately with less time.
Chapter 2 of this thesis represents a novel algorithm for detection of QRS complex
in ECG signal. Accurate detection of QRS complex is the first and most important
part of ECG signal analysis. A novel approach using the properties of Hilbert
transform and autocorrelation function is developed. The autocorrelation based
method is used to find out the period of one cardiac cycle. The high slope point that
means R-peak in ECG signal is identified from the envelope of Hilbert transform
output. The adaptive threshold technique is used which helps in distinguish the R-
peaks from P-wave and T-wave. The beat detection algorithm is compared with the
two existing techniques like Pan-Tompkins [1], difference operation method
(DOM) [2]. The experimental result shows that the proposed method performs
better result as compared to PT- method and DOM- method.
Chapter 3 of this thesis represents the feature extraction methodology for each
heartbeat of one cardiac cycle. The morphological features combined with temporal
features of each heartbeat are extracted to provide better classification accuracy.
The feature extraction methodology extracts the features of each heartbeat after
automatic detection of R-peak. This method does not follow the beat annotation file
provided by the exports as references of finding R-peaks. Hence it can also beapplicable in real time application. Thus the feature extraction techniques play a
vital role in the performance of classifying beta arrhythmias using the classifiers.
Chapter 4 of this thesis represents the automatic classification of cardiac
arrhythmias heartbeats into five classes: normal beats, VEBs, SVEBs, fusion beats
and unclassified beats. The combination of local classifier of each patient with the
5/11/2018 Analysis of ECG Signal for Detection of Cardiac Arrhythmias - slidepdf.com
http://slidepdf.com/reader/full/analysis-of-ecg-signal-for-detection-of-cardiac-arrhythmia
56
global classifier performs better classification result than individual. The
classification performance of 11 #tapes contain VEBs and 14 #tapes hold SVEBs
are compared with the earlier existing methods [3]-[6]. The performance also
analyzed using 24 #tapes of MIT-BIH arrhythmias database and compared with
methods [4], [5]. The comparative study of ECG beat classifier using multilayer
perceptron neural network and radial basis function neural network has done and
the result shows MLP neural network achieve higher classification accuracy than
RBF neural network.
5.2 Future scope
Automatic cardiac abnormality classification is necessary for real time application. The
classification accuracy can improve by extracting the better features of ECG signal. Future
developments can be made as follows
• To design better feature extraction methodology which can improve the classification
result of cardiac arrhythmias in ECG signal.
• To analyze the classification accuracy using different classifier such that it can classify
the beat arrhythmias in the approved manner.
• To modify the network structure according to cost function of multilayer neural network
so that it can achieve better classification accuracy as compared to existing ECG beat
classifier.
• Real time operation for recognizing the cardiac arrhythmias can also be done since the
methodology uses the automatic detection of R-peaks and feature extraction techniques.
5.3 References
[1] J. Pan, W. J. Tompkins, “A real time QRS detection algorithm,” IEEE Trans. Biomed. Eng., vol. 32, pp. 230–236, 1985.
[2] Y.C. Yeha, and W. J. Wang, “QRS complexes detection for ECG signal The Difference Operation Method
(DOM),” Computer methods and programs in biomedicine, vol. 9, pp. 245–254, 2008.
[3] P.de Chazal, M.O. Duyer, and R.B. Reilly, “Automatic classification of heartbeat using ECG morphology and
heart beat interval features,” IEEE Trans. Biomed. Eng. vol. 51, pp. 1196-1206, 2004.

5/11/2018 Analysis of ECG Signal for Detection of Cardiac Arrhythmias - slidepdf.com
http://slidepdf.com/reader/full/analysis-of-ecg-signal-for-detection-of-cardiac-arrhythmia
57
[4] T.Ince, S. Kiranyaz, and M. Gabbouj, “A generaric and robust system for automated patient-specific
classification of ECG signals,” IEEE Trans. Biomed. Eng. vol. 56, pp. 1415-1426, 2009.
[5] W. Jiang and S. G. Kong, “Block-based neural networks for personalized ECG signal classification,” IEEE
Trans. Neural Netw., vol. 18, no. 6, pp. 1750–1761, Nov. 2007.
[6] Y. Hu, S. Palreddy, and W. J. Tompkins, “A patient-adaptable ECG beat classifier using a mixture of experts
approach,” IEEE Trans. Biomed. Eng., vol. 44, no. 9, pp. 891–900, Sep. 1997.

5/11/2018 Analysis of ECG Signal for Detection of Cardiac Arrhythmias - slidepdf.com
http://slidepdf.com/reader/full/analysis-of-ecg-signal-for-detection-of-cardiac-arrhythmia
58
List of Publications
1. J.P. Sahoo, M.K. Das, S. Ari and S. Behera, “Autocorrelation and Hilbert transform
based QRS Complex detection in ECG Signal,” International Journal of Signal and
Imaging Systems Engineering, (In Press).
2. J.P. Sahoo, S. Behera, and S. Ari, “A novel technique for QRS complex detection in
ECG signal based on Hilbert transform and autocorrelation,” International Conference on
Electronic Systems, NIT, Rourkela, Jan 7-9, 2011.
3. M.K. Das, S. Ari and J.P. Sahoo, “Enhancement of Electrocardiogram Signal using S-
Transform,” IEEE TENCON , Bali, Indonesia, November 21-24, 2011(Communicated).