analysis of alternative manufacturing processes for
TRANSCRIPT

Clemson UniversityTigerPrints
All Theses Theses
12-2010
ANALYSIS OF ALTERNATIVEMANUFACTURING PROCESSES FORLIGHTWEIGHT BIW DESIGNS, USINGANALYTICAL HIERARCHY PROCESSSrinath VijayakumarClemson University, [email protected]
Follow this and additional works at: https://tigerprints.clemson.edu/all_theses
Part of the Mechanical Engineering Commons
This Thesis is brought to you for free and open access by the Theses at TigerPrints. It has been accepted for inclusion in All Theses by an authorizedadministrator of TigerPrints. For more information, please contact [email protected].
Recommended CitationVijayakumar, Srinath, "ANALYSIS OF ALTERNATIVE MANUFACTURING PROCESSES FOR LIGHTWEIGHT BIWDESIGNS, USING ANALYTICAL HIERARCHY PROCESS" (2010). All Theses. 1037.https://tigerprints.clemson.edu/all_theses/1037

i
ANALYSIS OF ALTERNATIVE MANUFACTURING PROCESSES FOR
LIGHTWEIGHT BIW DESIGNS, USING ANALYTICAL HIERARCHY PROCESS
A Thesis
Presented to
The Graduate School of
Clemson University
In Partial Fulfillment
Of the Requirements for the Degree
Master of Science
Mechanical Engineering
by
Srinath Vijayakumar
December 2010
Accepted by:
Dr Mohammed Atif Omar, Committee Chair
Dr Imtiaz Haque
Dr Mohammed Daqaq

ii
ABSTRACT
The main objective of the analysis was to investigate the forming of Body in White
(BIW) panels using alternative processes most suitable for replacing the conventional
press working process in order to achieve a reduction in the total mass of the vehicle
body structure. The selection of the alternatives was guided by multi criteria decision
making tool, the Analytic Hierarchy Process (AHP). Here the alternatives were selected
based on their relative importance to the different manufacturing attributes considered.
The selected processes were applied to the manufacturing of different parts of BIW
indicated in the BOM along with suggestion of the appropriate material to be used.

iii
DEDICATION
I dedicate this work to my parents and grandparents who have been a perennial source of
motivation and inspiration throughout my life. For all the sacrifices they have made and
continue to make, I wish I will live up to their expectations.

iv
ACKNOWLEDGMENTS
I would like to express my immense gratitude to my advisor Dr M.A Omar for his
continuous support, guidance and encouragement without which this work would not
have been possible. I am thankful to my committee members Dr Imtiaz Haque and Dr
Mohammad Daqaq for their valuable inputs.
I would like to take this opportunity to thank my close friends and research group
colleagues Arun and Harish for their solidarity and constructive criticism which has gone
a long way in helping me refines my work. Also I would like to take this opportunity to
thank my research mates who have been with me through the time of work for their moral
support and friendship.

v
TABLE OF CONTENTS
Page
TITLE PAGE ....................................................................................................................... i
ABSTRACT ........................................................................................................................ ii
DEDICATION ............................................................................................................................. iii
ACKNOWLEDGMENTS .......................................................................................................... iv
LIST OF TABLES ........................................................................................................... viii
LIST OF FIGURES ........................................................................................................... xi

vi
CHAPTER PAGE
I. Need For Light Weighting Of Vehicle.................................................................. 1
Introduction ..................................................................................................1
CAFE Standards...........................................................................................2
Weight and Cost Reduction .........................................................................9
II. Selection of Alternative Manufacturing Process Using
Analytic Hierarchy Process ...................................................................................25
Introduction ................................................................................................25
Working of AHP ........................................................................................29
AHP in Process selection ...........................................................................38
III. Review of Superplastic Forming And Hydroforming Process ..............................62
Introduction ................................................................................................62
Superplastic Forming .................................................................................62
Hydroforming Process Description ............................................................75

vii
IV Application of Alternative Manufacturing Process In
Fabrication of Body in White ................................................................................88
Introduction ................................................................................................88
Underbody..................................................................................................89
Roof............................................................................................................91
Front Module .............................................................................................93
Body Side Panel .........................................................................................98
Body Rear ................................................................................................101
V Contribution and Future Work............................................................................105
REFERENCES ................................................................................................................107
viii
LIST OF TABLES
Table Page
1. Estimated fuel economy standard .................................................................................4
2. Comparative description of mechanical
properties of magnesium, aluminum and steel ...........................................................22
3. AHP literature review .................................................................................................28
4. Fundamental scale of measurement for
pair wise comparison ..................................................................................................35
5. Random index tables ..................................................................................................37
6. Attributes comparison ................................................................................................49
7. Normalization and prioritization of attributes
along with consistency check .....................................................................................50
8. Comparison of alternatives with respect to
reduction in number of components ...........................................................................51
9. Normalization, prioritization and
consistency check .......................................................................................................51
10. Pairwise comparison with respect to modularization .................................................52
11. Prioritization of the values depicted in table 10 .........................................................52
12. Pairwise comparison with respect to part consolidation ............................................52
13. Prioritization of the values depicted in table 12 .........................................................52
14. Pairwise comparison with respect to changeover time ..............................................53

ix
15. Prioritization of the values depicted in table 14 .........................................................53
16. Pairwise comparison with respect to common ...........................................................53
17. Prioritization of the values depicted in table 16 .........................................................54
18. Pairwise comparison with respect to uniformity in
material selection ........................................................................................................54
19. Prioritization of the values depicted in table 18 .........................................................54
20. Pairwise comparison wrt reducing variability in dimension ......................................55
21. Prioritization of the values depicted in table 20 .........................................................55
22. Pairwise comparison wrt reducing variability in dimension ......................................55
23. Prioritization of the values depicted in table 22 .........................................................56
24. Pairwise comparison wrt reduction in number of
process parameters .....................................................................................................56
25. Prioritization of the values depicted in table 24 .........................................................56
26. Pairwise comparison with respect to concurrent operations ......................................57
27. Prioritization of the values depicted in table 26 .........................................................57
28. Pairwise comparison with respect to intercell and intracell distance .........................57
29. Prioritization of the values depicted in table 28 .........................................................58
30. Pairwise comparison with respect to open architectural control ................................58
31. Prioritization of the values depicted in table 29 .........................................................58
32. Pairwise comparison with respect to product volume ................................................59
33. Prioritization of the values depicted in table 32 .........................................................59
34. Pairwise comparison with respect to surface finish ...................................................59
35. Prioritization of the values depicted in table 34 .........................................................60

x
36. Pairwise comparison with respect to optimal alignment of
raw material ................................................................................................................60
37. Prioritization of the values depicted in table 36 .........................................................60
38. Final Evaluation .........................................................................................................61
39. Alternative manufacturing process for vehicle underbody ........................................90
40. Alternatives for vehicle roof .......................................................................................92
41. Front side panel ..........................................................................................................96
42. Wheel house engine support .......................................................................................96
43. Splash wall parts .........................................................................................................97
44. Front body bracket left ...............................................................................................97
45. Body side frame ........................................................................................................100
46. Body side frame single components .........................................................................100
47. Trunk Floor ...............................................................................................................103
48. Floor parts rear .........................................................................................................104
49. Tail trim ..................................................................................................................104

xi
LIST OF FIGURES
Figure Page
1. Comparison of different standards ...............................................................................5
2. Graphical representation of the fuel economy vs. mass ...............................................6
3. Net total saving by the customer from increase in MPG .............................................8
4. A) NSX Monocoque Structure B) Audi A2 Space
Frame Structure C) Honda INSIGHT Hybrid Structure ...........................................10
5. Strain hardening behavior of BH steel .......................................................................15
6. Comparison of the relative formability of AHSS .......................................................18
7. Comparison of the FLD of aluminum and steel .........................................................20
8. Steps in AHP application ...........................................................................................30
9. Hierarchy level to decide water level in Dam ............................................................33
10. Hierarchy structure used for the purpose of process selection ...................................39
11. Stamped assembly vs. Hydroformed assembly .........................................................40
12. Superplastic forming a) before gas blowing b) after
gas blowing .................................................................................................................64
13. Strain rate and flow stress relationship for a typical fine
grained superplastic material ......................................................................................68
14. Relationship between strain rate and inverse size of grain ........................................69
15. Relationship of flow stress & elongation to failure with
strain rate for different grain sizes of a superplastic material ....................................70

xii
16. Effect of strain rate sensitivity „m‟ on the formability of
superplastic material ...................................................................................................72
17. QPF system design .....................................................................................................74
18. Sheet hydro-forming ...................................................................................................76
19. Punch and die specification of a) conventional deep
drawing process b) hydrodynamic deep drawing process .........................................79
20. Relationships between punch roughness and counter
pressure for a sheet thickness of 1.2 mm & LDR of 2.5 ............................................80
21. Tube hydro forming.1 tube, 2 lower die, 3 upper die, 4
axial punch .................................................................................................................82
22. Underbody ..................................................................................................................90
23. Roof panel ..................................................................................................................92
24. a) Wheel housing/ engine support b) Splash wall parts
c) Front body bracket left/ right d) Front side panel ..................................................95
25. Body side frame ..........................................................................................................98
26. Single components of body side frame ......................................................................99
27. Body rear a) Trunk Floor b) Floor parts rear c) Tail trim ........................................102

1
CHAPTER ONE
Need For Light Weighting Of Vehicle
Introduction
The automobile industry forms the backbone of the economy of USA. The
automobile industry as described in CRS report for congress titled “US Automotive
Industry: Policy Overview and History” [1] is dynamic industry marked by frequent
changes in both technological and management fields. The current trend in the field of
automotive relates to an increasing need to conserve fuel and establish a green
environment. This can be achieved through various means such as better transmission
design, increase in the engine efficiency, better logistics and weight reduction. The
objective of the chapter is to highlight the importance and need of weight reduction of a
vehicle. It describes the need for the integration of new technologies in a conventional
system and the factors, regulatory standards governing the technological changes, driving
these needs. It gives an overview of the factors and their effect on the manufacturing
decision taken by the Original Equipment manufacturers (OEM).
The first part of the chapter deals with the introduction of regulatory standards,
their objectives, efficiency and effectiveness and their achievements and shortcomings.
The second section deals with the impact of such regulatory standards on the
manufacturing decisions taken. In particular it addresses the different ways in which the
OEM can achieve these standards through manufacturing changes. These include both
changes in manufacturing and material used in the production of BIW. The later part of

2
the chapter gives a lead on the flow and methodology of the work to be described
in the succeeding chapters.
1 CAFE Standards
The CAFE ( Corporate Average Fuel Economy) standards were established in the
year 1975 by the Energy Policy and Conservation Act (EPCA) in response to the oil
embargo established by the Arab nations from 1973 – 1974. Though this was not the first
regulatory standard to be introduced by the government, the first automotive emission
control technology was established in the state of California in 1961, this was the only
standard that with a view of economic control rather than to address the issues related
with the environmental pollution. Since the transportation sector was the biggest
consumer of fossil fuel an act was passed to control this sector. This was introduced with
an objective of reducing the dependency on oil imports and thereby reduces economic
dependency on external factors. These standards were to be applied for all cars from the
model year 1977 (MY 1977). The CAFÉ standards prescribe a minimum average fleet
economy which must be met by all OEM else face fines or negative credits. The current
penalty for not meeting the standards set for the model year is $5.50 per 0.1 Mpg less
than the set standard multiplied by the total fleet production volume. The base value to be
targeted is decided by the EPA (Environmental Protection Agency) and NHTSA
(National Highway Traffic Safety Administration). [2]
As explained in the work titled “Theoretical and Practical Possibilities of a
Market Mechanism Approach to Air Pollutant Control” [3] though oil consumption could
be checked by imposing taxes on the externalities produced by the transportation industry

3
this was rendered impossible due to the complex nature of the relationship between
various factors affecting the externalities. For example a tax on the pollutants emitted by
a vehicle is not effective as the amount of pollutants emitted depends on various
uncontrollable factors such as weather, road condition, operating condition etc. These
factors cannot be accurately accounted hence making the act of levying taxes absurd.
Also levying of taxes without a regulating standard would not have led to an
advancement in technologies.
The establishment of CAFÉ standard resulted in introduction of various
technologies leading to an increase in fuel efficiency of the vehicles. Some of the
technologies introduced as a result of introduction of these standards were 3 way catalytic
converter, multi point fuel injection system (MPFI), electronically controlled combustion,
etc. 70% of the increase in fuel economy was due weight reduction, improved
transmission, better aerodynamics, and use of front wheel drive and use of fuel injection
technologies. [4]
The effectiveness of CAFÉ standards is visible in from the fact that it along with
price rise in gasoline lead to doubling of the fuel economy from the period between 1974
to 1984. One of the main tools used by the OEMs to achieve this was to reduce the
weight of the vehicle. The work carried out by Nivola and Crandall proves through
regression analysis that CAFÉ has been responsible for most of the reduction in vehicle
weight. The average weight of a domestic vehicle in 1974 was 4380 lbs which was 1676
lb more than the average weight of Euro cars and 1805 lbs more than that of the Asian
cars. By 2000 the average weight of the domestic cars was 756 lbs lesser than that of the
4
Euro cars and just 245 lbs more than the Asian cars. The use of this standard also
resulted in reduction of pollutants released, the pollutants emitted in 1994 where just 25%
of what was emitted in 1975 [5].
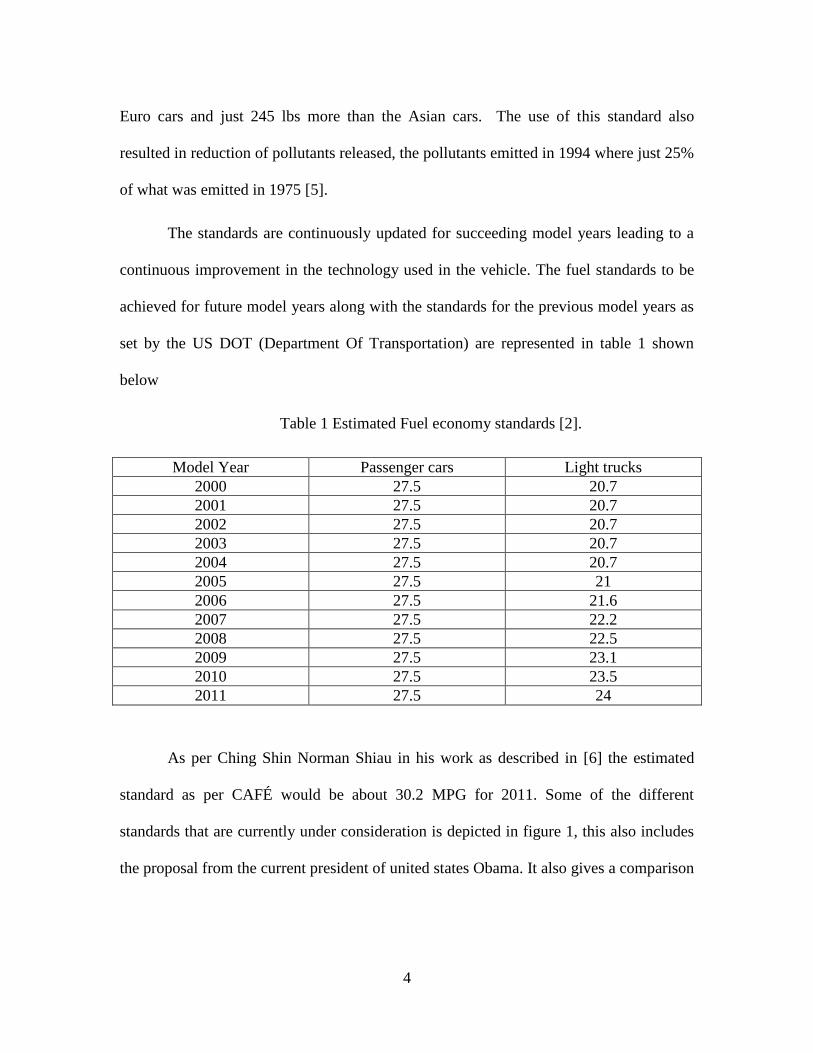
The standards are continuously updated for succeeding model years leading to a
continuous improvement in the technology used in the vehicle. The fuel standards to be
achieved for future model years along with the standards for the previous model years as
set by the US DOT (Department Of Transportation) are represented in table 1 shown
below
Table 1 Estimated Fuel economy standards [2].
Model Year Passenger cars Light trucks
2000 27.5 20.7
2001 27.5 20.7
2002 27.5 20.7
2003 27.5 20.7
2004 27.5 20.7
2005 27.5 21
2006 27.5 21.6
2007 27.5 22.2
2008 27.5 22.5
2009 27.5 23.1
2010 27.5 23.5
2011 27.5 24
As per Ching Shin Norman Shiau in his work as described in [6] the estimated
standard as per CAFÉ would be about 30.2 MPG for 2011. Some of the different
standards that are currently under consideration is depicted in figure 1, this also includes
the proposal from the current president of united states Obama. It also gives a comparison

5
between the Co2 emission and MPG to be achieved. Control of Co2 emission is given
high priority as per the Kyoto protocol due to the green house effect caused by it.
Figure 1 Comparison of different standards [6].
Weight reduction is one of the most effective ways of controlling the fuel
consumption as a 10 % reduction I weight brings about a 5% reduction in the fuel
consumption [7]. The relationship between vehicle weight and the fuel consumed as
depicted in equation (1.1) is obtained by conducting a regression analysis of the current
North American production midsize vehicle as shown in [8].
Where
Constant = 1019.892
Wgt = -0.42357
( ) ( ) ( ) ( ) (1.1)wgt aero disp hp
dMPG const Kg width height c liters horsepower

6
Aero= -0.111
Disp = -0.13856
HP = -0.09086
Also different studies suggest different correlation between vehicle weight and fuel
consumption. From [9] we have the relationship described by equation (1.2) .
-(1.2)
Figure 2 Graphical representation of fuel economy vs mass equation
The main opposition in implementing the CAFÉ standards in spite of all these
benefits is based on the fact that weight reduction which plays an important role in
increasing the fuel economy is achieved at the expense of vehicle safety. Some of the
work in relation to this was carried out by Dr Charles Kahane described in [10] & [11].
These works are argued to be void by the American chemistry council as the combined
effect of both size and weight were not considered in both the works. Also work carried
0
5
10
15
20
25
30
35
40
10
00
11
00
12
00
13
00
14
00
15
00
16
00
17
00
18
00
19
00
20
00
21
00
22
00
23
00
24
00
25
00
26
00
27
00
28
00
29
00
30
00
MP
G
Mass in lbs
MPG
MPG
( 0.463)895.74MPG mass

7
out by the National Academy of Sciences (NAS) classified Dr Kahane‟s work as being
overly simplistic and suggested the NHTSA to carry on further intensive research to
establish a relationship between size weight and safety of a vehicle. Experimental work
carried out by the Dynamic Research Inc in the field of crash testing resulted in the
observation that extension of crush zones without increase in weight resulted in a 26%
increase in the Expected Life Units (ELU). A practical example of this case can be seen
in the Jaguar XJ8 2004 model as compared with that of its 2003 model [12].
Another major constraint leading to a state of indecision on the part of the
manufacturer in improving the fuel economy of their fleet is the increase in vehicle cost.
This results in a situation where the customer has to pay more for gaining a minimal
return through increased MPG. Hence the manufacturer has to decide on the process
selection in a way that the net total cost saving in the view of customer which is the
difference between the increase in vehicle cost and savings due to increased MPG is on
the positive side. This can happen only with a reduction in production cost without
compensating on the issue of quality as that will eventually affect customer retention. The
effect of this is shown in figure 3.
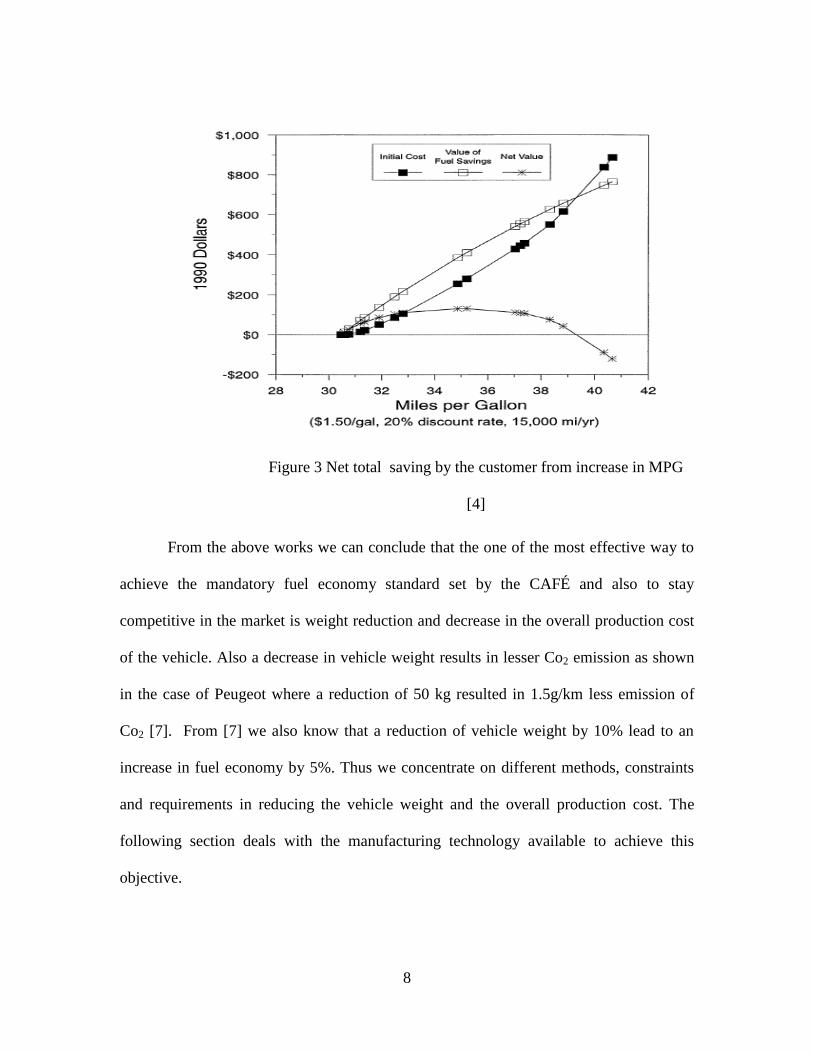
8
Figure 3 Net total saving by the customer from increase in MPG
[4]
From the above works we can conclude that the one of the most effective way to
achieve the mandatory fuel economy standard set by the CAFÉ and also to stay
competitive in the market is weight reduction and decrease in the overall production cost
of the vehicle. Also a decrease in vehicle weight results in lesser Co2 emission as shown
in the case of Peugeot where a reduction of 50 kg resulted in 1.5g/km less emission of
Co2 [7]. From [7] we also know that a reduction of vehicle weight by 10% lead to an
increase in fuel economy by 5%. Thus we concentrate on different methods, constraints
and requirements in reducing the vehicle weight and the overall production cost. The
following section deals with the manufacturing technology available to achieve this
objective.

9
2 Weight and Cost Reduction through Manufacturing Decisions
This section describes the various ways through which an OEM can bring about a
reduction in the total vehicle weight and overall production cost. These objectives again
depend on various other attributes of a manufacturing system like reduction in number of
components, modularization of parts etc which are discussed in detail in chapter 2. From
the perspective of an OEM manufacturer the main factors affecting the weight of the
vehicle are
1) Vehicle Design
2) Material Used
These factors again depend on various other factors which will be discussed in brief now
and will be discussed in detail in the later chapters.
2.1 Vehicle Design
With regard to weight reduction the most critical area is that of the body in white
design of a vehicle. The BIW accounts for up to 25 % of the total curb weight of the
vehicle. The three main types of vehicle body structure are Monocoque, space frame and
hybrid structure. Figure 4 shows the three different structures. Here the different
structures are described with their advantages and limitation followed by the potential for
the application of alternative manufacturing technologies. The alternative technologies
will be described in chapter 3.
Monocoque Structure – The monocoque structure consists of predominantly stamped
parts and posses excellent rigidity. It is still one of the most suited designs for a high

10
A) B)
C)
Figure 4 A) NSX Monocoque Structure B) Audi A2 Space Frame Structure C) Honda
INSIGHT Hybrid Structure [13]
volume of production. The parts are predominantly joined using simple welding
techniques such as spot welds or seam welds. It is also easier to use adhesives for joining

11
of parts in such a structure. On substituting the primary material with aluminum instead
of steel as in Honda NSX a weight reduction of up to 140 kg was achieved [7].
Some of the disadvantages of this type of structure are that it has higher number
of components as compared to a space frame or hybrid structure. Such a structure is not
suitable for a low volume of production. Since the parts used in this structure are
predominantly stamped it becomes necessary that the material used should have good
formability characteristics. This proves to be highly disadvantageous as it increases the
cost of vehicle due to repeated operations when light weight materials like aluminum are
used. Like explained in [7] substitution of steel with Al resulted in up to 50K amps of
welding current and 800 kgf of weld force as compared against the 120K amps and
300kgf of weld force required for steel. This has largely negated the advantages that
could have been gained by the weight reduction of 40%. Due to the springback effect
resulting from a low „r‟ value there was an increase in the number of operations also.
These problems can be addressed by substituting sheet hydroforming and/
superplastic forming as the major forming process instead of press stamping as they are
more suited for aluminum and medium volume production vehicle. The use of
hydroforming can also further reduce vehicle weight as it can bring about a reduction in
the number of components. The same can be achieved by superplastic forming as will be
explained in the succeeding chapters. Also since Honda NSX falls under the category of
medium volume production the sheet hydroforming can be a good substitute along with
superplastic forming.
12
Space frame structure – From the works of Geoff Davies and Masaaki Saito
described in [7] & [13] a typical space frame structure consists of predominantly
extruded parts. This type of structure was specifically designed for building of vehicle
body using aluminum as the primary material. It possesses better energy absorbing
abilities during crash scenarios. It is relatively easy to build as majority of sections are
tubular structure that are readily extruded or cast depending on the complexity and role in
load bearing property. Also since the outer panels do not take any load they can be
thinned considerably leading to weight reduction. Also as the numbers of components are
less compared to that in monocoque structure for the same vehicle size, this further
reduces the total curb weight along with the use of lightweight materials. Another great
advantage of using space frame structure is it is highly modular nature and thus is highly
suitable for the concept of mass customization.
Some of the disadvantages in manufacturing of a space frame structure using
conventional technologies are in the area of joining of components, production volume,
and production rate. The use of adhesives for the process of joining is inhibited due the
complexities in application and also for the same reason the use of spot weld is also
limited. This calls for the extensive use of laser weld and mechanical fasteners which
increase the production cost. The ASF (Aluminum Super Frame) model used in A8
consists of 2400 rivets, 64 meters of MIG weld and 20 meters of laser weld. Also the use
of casting process induces a high machining cost and increases the production rate [7].
Alternative manufacturing technologies like tubular hydroforming process has
great potential in the fabrication of space frame structure as the main structures are

13
mostly tubular in nature. Also the process of die less hydroforming can be used for the
joining the space frame components as described in [14]. The hydrojoining techniques
like hydro self pierce riveting and hydro clinching as described in [15] can also be used
for joining of tubular components thereby reducing the need for laser weld and hence
decreasing the production cost. These techniques will be discussed in detail in chapter 3
of this document.
Hybrid Structure – It consists of a mixture of monocoque structure and space
frame structure. It combines the desired qualities of both monocoque and space frame
structure and has excellent rigidness as well as good crash absorption characteristics. The
use of such a structure in Honda INSIGHT bought about a reduction in number of
components by as much as 15% and reduction in weight by 24% [13]. For the same
reasons as described for the other two body structures hydroforming and superplastic
forming can be used instead of conventional processes like extrusion and press stamping.
2.2 Material Used
The material used in an automobile plays an important role in the determining
total weight of the vehicle, as it is directly affected by the density of the material used.
The material used also affects the manufacturing process which in turn affects the part
count. The major materials that are consistently used in the construction of Body in
White are steel, aluminum and off late magnesium.
Some of the properties which affect the selection of material are its formability,
drawablity, yield strength and tensile strength. These characteristics are described in brief
as derived from [8]

14
Yield Strength – It represents the stress at which the plastic deformation of the material
starts. It is generally measured at a strain offset of 0.2% on a stress strain curve.
Tensile Strength – It represents the maximum stress bearable by the material, after which
the material will fail.
Formability – It is defined by the strain hardening exponent „n‟ value of the material. It is
usually measured as the slope of stress strain curve at 10- 20% of strain and indicates the
relative stretch formability of the sheet metals and increase in strength due to plastic
deformation. It gives a measure of how evenly strain is distributed in the section. An
increase in „n‟ value indicates an increase in the formability of the material.
Drawablity – It is indicated by the plastic strain ratio „r‟ value of the material. It describes
the materials ability to resists thickening or thinning of material on application of force.
A high value of „r‟ indicates a high drawablity of the material which is usually the desired
case.
Steel – Steel is the most used material in automobiles due to its excellent formability,
availability, ease of recyclability, excellent paintability, and good work hardening rates.
There are different types of steel that are used in automobile based on function required.
As described in [16] the steels used in automobile industry are available in the following
types possess specific characteristics based on their composition.
Commercial Quality (CQ)
Low carbon – Drawing Quality (DQ)
Interstitial Free (IF) stabilized – Drawing Quality

15
Dent resistant
Bake Hardenable (BH)
Non Bake Hardenable
High Strength Low Alloy (HSLA)
Ultra High Strength Steel/ Advanced High Strength Steel (AHSS) – DP, TRIP
Laminated Steel
Stainless Steel
Initially the steels used were classified as either hot rolled steel or cold rolled steel. In
this case importance was attached to the drawablity of the steel. The main classifications
of the steel available were; Commercial qualities (CQ), Draw quality (DQ), Deep draw
quality (DDQ) and Extra deep draw quality (EDDQ). The steels have been listed in
increasing order of formability. The surface finish of the steels rolls were decided based
on the type of surface they were to be used on. Typically a Class A surface or exposed
surface had a better surface finish compared to Class B (semi exposed) or Class C
(unexposed) surface. The drawbacks with these types of steels were that they had poor
yield strength and dent resistance. To compensate for this thickness of the material had to
be increased resulting in an increased weight of the vehicle.
This led to production of dent resistant, high speed steel (HSS), bake hardenable (BH)
steel and high strength low alloy (HSLA) steel. These had higher yield strengths and
thereby playing an important role in the weight reduction of the vehicle. Dent resistant
steel is usually classified as bake hardenable or non bake hardenable steel. Non bake
hardenable steel derives its final strength as a combination of initial strength and work

16
hardening of the material during the forming process. Bake hardenable steel have high
formability in the initial stages and posses good strength in final stages due to work
hardening from both forming and painting baking cycle. This unique property of BH steel
enables it to be substituted for DQ steel without making any major changes to the die.
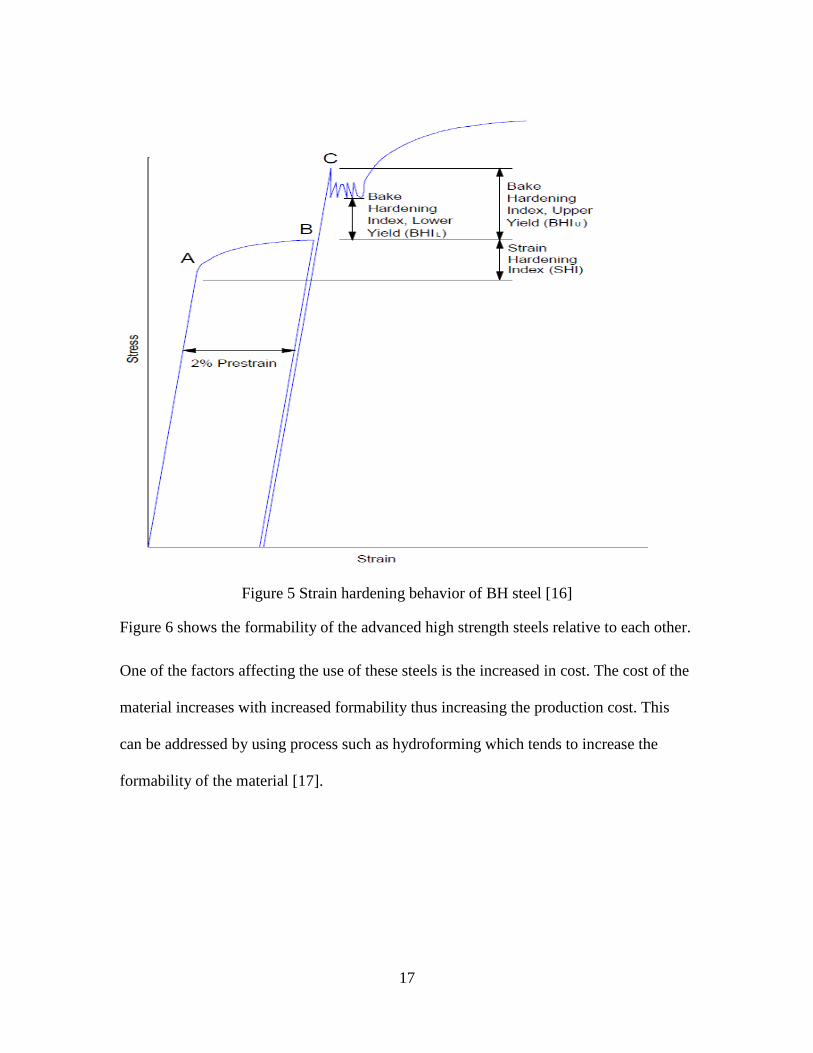
Figure 5 depicts the BH steel behavior through a stress strain diagram.
These improved properties were often at the cost of slight decrease in the „n‟
value thus affecting the formability and calls for die re-design. Advanced high strength
steels such as DP (Dual Phase), TRIP (Transformation Induced Plasticity) steel,
Martensitic steel were introduced to compete with other light weight metals and further
light weighting requirements. These types of steels have higher strength along with
improved formability. The DP steel relies on it microstructure consisting of a
combination of both ferrite and martensite to provide a high tensile strength and low yield
strength thus improving the value of „n‟. Due to it high work hardening rate these have
high formability at initial forming stages and posses high strength in final stages. TRIP
steels shows the same work hardening behavior when measure at 0-7% of strain. But a
study of their work hardening behavior at 7- 20% of their strain rate shows that there is a
delay in the onset of localized thinning and necking due to its unique microstructure
which helps in stabilizing the plastic deformation and increases strength.
17
Figure 5 Strain hardening behavior of BH steel [16]
Figure 6 shows the formability of the advanced high strength steels relative to each other.
One of the factors affecting the use of these steels is the increased in cost. The cost of the
material increases with increased formability thus increasing the production cost. This
can be addressed by using process such as hydroforming which tends to increase the
formability of the material [17].

18
Figure 6 Comparison of the relative formability of AHSS [18].
The feasibility study on the potential of hydroforming process in weight reduction
in automobile using HSS, TRIP and BH steel in majority was carried out by as described
in [19] which resulted in weight reduction of up to 36% and the cost of the body structure
was on level with that of the bench marked structure. Also the BIW structure possessed
excellent crashworthiness characteristics. Tubular hydroforming was utilized for the
creation of side roof rail member using HSS. This resulted in reduction of both mass and
cost due to decrease in number of parts and weight. Sheet hydroforming was utilized for
the manufacturing of roof panel which enabled the use of sheets of thinner gauge
resulting in reduction of both weight and cost.
Aluminum – Aluminum has been used in cars right from 1909 for different
components. The advent of CAFÉ standards and an increasing pressure on the OEMs to
reduce the emissions from vehicle led to an increasing interest in aluminum as a
substitute for steel as the primary material for BIW. This was due to the low density of
aluminum which was 2.69g/cc. though the substitution of aluminum instead of steel

19
would have resulted in a weight reduction of about 40% the complexities regarding its
formability and availability caused the OEMs to continue with steel. The main
advantages of aluminum have been its resistance to corrosion, low density, ease of
recyclability and the presence of a strong supply base. Studies show that aluminum has a
very high recyclability rate, as high as 83% for beverage cans with the can to can ratio
being 68% [7] [19].
The main limitation of aluminum is its relative complexity in forming process
which arises due to its poor modulus of rigidity which is 69 Gpa as compared against that
of steel which is 210 Gpa. These calls for a complete redesign of all dies and other
process such as joining painting etc. since the „r‟ value of aluminum is on the lower side
the maximum depth up to which a part might be drawn in a single shot is also limited.
This leads to need for repetitive drawing operation and thus increasing the cost. Also due
to this thicker gauge of sheet have to be used which tough decreases the weight it results
an increased cost. Thus the high and often fluctuating cost of aluminum also affects the
continuous production of vehicle in JIT system. The high cost in spite of high
recyclability ratio is due to the fact that extraction of pure aluminum from aluminum
alloys that are often used in vehicle is a complex and expensive process. Also welding of
aluminum has proven to be expensive as described in the above section [7] [20].
The comparison of the FLD curves of steel and aluminum is shown in figure 7.

20
Figure 7 Comparison of the FLD of aluminum and steel [7].
The two main aluminum alloys developed for automotive application were the
Al5xxx series and Al6xxx series. The 5xxx series alloys are predominantly used for
manufacturing of inner panels while the 6xxx series alloys are used for class A surface.
The 5xxx series alloys possess excellent formability characteristics which suits the deep
drawing operations. Also it has better welding characteristics when compared with the
6xxx alloys. The application of 5xxx series alloy for class A surface are limited as they
have a tendency to soften when they undergo the paint curing process which greatly
affects their dent resistance. The 6xxx series alloys have excellent work hardening
characteristics and undergo bake hardening during the paint curing process. Due to this
their final strength is high and they possess excellent dent resistant characteristics. Also
they possess much better hemming characteristics compared to 5xxx series alloys. The
main reason for their application to class A surface as against the 5xxx series alloys it that

21
they have better surface finish as they are devoid of any stretch strain markings and have
anti orange peel effect [7] [20].
Despite the improvements in the alloys design changes were required for the use
of aluminum as the primary material. The aluminum material is better suited for space
frame structure and hybrid structure instead of a monocoque structure. Also the
applications of different manufacturing technologies are aimed at bringing about a further
reduction in cost and weight through the use of aluminum. The OEMs have developed
their own customized superplastic forming to achieve the objectives, for example ford
has developed a customized superplastic forming process named the ford advanced
superplastic forming technique (FAST) and the GM uses a quick plastic forming
technology. A study on the technological and economical feasibility of superplastic
forming of door of a car instead of conventional process was carried out by applying the
FAST process which is described in [21]. The results obtained from the study show that
the weight of the door structure when manufactured by applying FAST bought about the
total weight of the structure by 11.4%. Also when the inner assembly was manufactured
by FAST as a single piece it bought about a weight reduction of 26%. Also the
economical analysis done showed that the piece per cost of the door was $297 as
compared against the benchmark value of $315. Also the tooling cost estimated for FAST
was $85817 as against $4, 49,000 required for the conventional process. Also Opel GT
uses the process of hydroforming for manufacturing chassis part [22].

22
Magnesium- Magnesium with a density of 1.74g/m3 is 35% lighter than aluminum
and posses much better damping characteristic of noise and vibration. The main
advantage of magnesium has been its low density coupled with high strength to weight
ratio. This has made it to be considered as the material for future. Also it allows for
casting of much thinner gauge and hence indirectly helps in the process of part
consolidation. Also raw magnesium is available in abundance as it is the 8th
most
available material on the planet. The life cycle cost analysis of materials places it at a
much more advantageous position than that of steel and aluminum [23].
Table 2 Comparative description of mechanical properties of Magnesium, Aluminum and
Steel [23].
Property Magnesium Aluminum Iron
Crystal Structure Hcp Fcc Bcc
Density(g/cm3) 1.74 2.70 7.86
Coefficient of thermal
expansion(106)
25.2 23.6 11.7
Elastic Modulus(106 Mpa) 44.126 68.974 206.842
Tensile Strength (Mpa) 240 (AZ91) 320(A380) 350
Melting point(oc) 650 660 1536
The main reason why magnesium is not used as the primary material in the
construction of BIW is its poor formability. The poor formability of magnesium at room
temperature arises due it hexagonally closed pack structure as shown in table 2. Also due
to its closed pack hexagonal structure the amount of energy consumed for forming of
magnesium product is much higher than that of aluminum and steel ultimately leading to

23
an increase in the production cost. These rules out the possibility of press working to be
used for the production of manufacturing parts as in the case of steel and aluminum. Thus
all the magnesium parts used in today‟s automobile are produced only by casting. The
disadvantage with casting process is that it has lower elongation than other materials such
as steel and also increases the machining cost. Also the machining cost of magnesium
remains on the higher side due to the complexities posed by it due to its low melting
point. The melting point of aluminum is around 650oc due to which there is always a risk
of fire hazard. Also the cost of production is increased due to the need of coating, e.g.
Teflon resin, in case of magnesium in order to prevent the galvanic corrosion of
magnesium. The use of magnesium also rules out any use of water based coolants as its
reaction with water produces oxides which will reduce the salvage value [23].
Studies are being carried out for determining the feasibility of employing
superplastic forming of magnesium alloys, [24], [25] and [26], as an substitute for die
casting process. The advantages of superplastic forming of magnesium remains the same
as that of aluminum described in the above section. Also if magnesium is to replace
aluminum in the construction of BIW the superplastic forming process will not undergo
any major change as both magnesium and aluminum have same behavior at elevated
temperature [27]. These leads to minimum changes in the die and process of the
manufacturing system. The greatest limitation in the application of superplastic forming
to magnesium forming is the high cost of superplastic magnesium alloys which will
increase the cost of production.

24
The above mentioned factors lead to a need for alternative manufacturing
technology to meet the future regulations and at the same time to address the issue of
mass reduction. Thus this chapter elucidates the need for alternative manufacturing
process and their potential in achieving our objective. To determine the most suitable
process for achieving our objectives of weight and cost reduction we make use of
decision making tool as described in the next chapter. The technical details of the various
forming process described will be explained in detail in chapter 3.

25
CHAPTER TWO
SELECTION OF ALTERNATIVE MANUFACTURING PROCESS USING
ANALYTIC HIERARCHY PROCESS
Introduction
The aim of this chapter is to describe the use of Analytic Hierarchy Process (AHP) in
multi criteria decision making process. As process selection is one of the most important
steps in conceptual stage of system design it necessitates the use of evaluative decision
making tool such as that of AHP to avoid any inappropriate decision. The process is
selected based on the pairwise comparison and prioritizing of alternatives and attributes
at each level. A brief overview of the applications of the tool followed by description of
the science behind the working of this tool is described in section one of the document.
The algorithm for the application of the tool is also described in this section. The second
section describes the application of AHP for the deciding the most suitable alternative
manufacturing process. The consequence and inferences of the result obtained will be
discussed in chapter 4 along with its area of application.
The main objective of any decision making process is to decide on the alternative that
best suits our requirements and criterions. It is obvious that the best alternative can be
chosen only after comparison with reference to all the attributes (requirement and
criterion). Here again while a particular alternative may be able to fulfill a particular
attribute this may not be the case when it is compared with respect to another attribute,
this necessitates the need for a tool which enables an overall prioritizing. This is one of

26
the main reasons why AHP was preferred over other decision making tools for the
purpose of selecting the appropriate alternative processes.
An AHP is a multi objective decision methodology that provides a logical
formulation of the selection of problems and reduces ambiguity. As in any problem
solving methodology AHP also consists of three main principles that are – decomposition
of the problem, comparison of the difference elements involved and synthesizing of
priorities. These will be discussed in detailed in the later sections. The main advantage of
AHP is that here the weights are calculated and from pair wise comparison and not just
assigned. The other advantages of using AHP are shorter product development time,
checking for consistency of the ratings and better quality of the product. From the work
of Saaty [28] we know that it can be used for both relative and absolute evaluation.
AHP has been used as a decision making tool over a wide range. The
manufacturing industry is the major user of AHP as indicated in [29]. [30] Describes the
use of AHP in selection of layered manufacturing techniques. A final selection was made
considering the four levels namely – application, prototype categories, attributes and
alternatives. The work proves the adaptive nature of an AHP model where in with change
in certain need or constraint evokes a different result. Prioritization is done by ranking the
alternatives with respect to attributes and then ranking attributes with respect to prototype
categories. Results of the test confirmed the validity of the selection procedure based on
the adaptive AHP model.
The application of AHP for the purpose of material selection of polymeric
composites for automotive bumper is described in [31]. Here again a four level hierarchy

27
is used consisting of the objective, main criteria consisting of the factors affecting the
material selection, sub criteria forms level 3 and the level four consists of different
alternatives to choose from. A sensitivity analysis is provided for checking the
consistency of rankings.
The work done by Che Wei Chang in the work titled “ An Application Of AHP
And Sensitivity Analysis For Selecting The Best Slicing Machine “ [32] describes the use
of AHP tool in the selection of silicon wafer slicing machine quality systems consisting
of a four level hierarchy system. The results obtained are then cross checked and held in
confirmation after using Exponentially Weighted Moving Average Charts (EWMA) and
sensitivity analysis. While the EWMA control chart was used to verify the feasibility and
effectiveness of the AHP based algorithm the sensitivity analysis was used for testing the
stability of the priorities obtained through the application of the AHP. [33] Describes an
AHP based decision support system with a three level hierarchy system for selecting the
most suitable casting process for a given product. Factors such as dimensional tolerance,
surface finish, material suitability and flexibility are considered. Here the effectiveness of
the AHP is illustrated by a numerical example.

28
Table 3 AHP literature review [29]
AHP 2005 2006 2007 2008 2009
Ayag
(2005)
Abildtrup et
al. (2006)
Arshinder
and Deshmukh
(2007)
Ahn and Choi
(2008)
Aguilar-
Lasserre et al.
(2009)
Carnero
(2005)
Alkahtani et
al. (2006)
Carlucci and
Schiuma
(2007)
Angelou
and Economides
(2008)
Bahinipati et
al. (2009)
Chan et al.
(2005)
Caliskan
(2006)
Pilavachi (2007) Dey and
Ramcharan
(2008)
Erol et al.
(2009)
Chougule
and Ravi
(2005)
Ertay et al.
(2006)
Chen and Liu
(2007)
Khorramshahgol
and
Djavanshir
(2008)
Ho and
Emrouznejad
(2009)
Wei et al.
(2005)
Nagesha and
Balachandra
(2006)
Zeng et al.
(2007)
Ahn and Choi
(2008)
Li and Li
(2009)
Yurdakul
and Ic
(2005)
Teo and Ling
(2006)
Liou and Tzeng
(2007)
Yu J (2008) Sharma and
Agrawal
(2009)
Tsai (2005) Masozera et
al.
(2006)
Kahraman et al.
(2007)
Su and
Chou (2008)
Wan et al.
(2009)
Scholl et al.
(2005)
Strager and
Rosenberger
(2006)
Diamantopoulos
(2007)
Wong and Li
(2008)
Park et al.
(2009)
Richman
et al.
(2005)
Kuo and
Chen (2006)
Chang et al.
(2007a)
Martinez-Olvera
(2008)
Shin et al.
(2009)
The above table gives further examples of the various work carried out which has
used AHP as the tool for multi criteria decision making. The list of work suggested in this
section depicts the popularity of the AHP tool for multi criteria decision making.
29
Similar example of an application is described [34] where AHP is used for the
evaluation of FMS (Flexible Manufacturing System) in a tractor manufacturing plant.
Here the company had to choose between the alternatives of whether or not to implement
FMS through ought the organization. Here again sensitivity analysis was used to evaluate
the stability of priorities.
A more complete study of the applications of AHP is described in [29]. Table 3
shows some of them as illustrated in [29]. This clearly illustrates the popularity of AHP
as a decision making tool under multi criteria condition.
1 Working of Analytic Hierarchy Process
AHP is a decision making tool that provides a framework for considering
intuitive, rational and irrational decision in an environment of multi criteria, multi
objective and multi actor scenario with or without the certainty of the number of
alternative. It breaks down the problem into constituting elements and using a system of
pair wise comparison leading to the prioritization of the alternatives available [35].
The main steps involved in the AHP are objective, decomposition, comparison and
synthesis of priorities [31]. The steps followed in applying the AHP model is depicted in
figure 8.

30
Figure 8 Steps in AHP application
1.1 Decomposition
The decomposition of a problem refers to the setting up of hierarchy of the
problem. The hierarchy of the process is basically one way of structuring the problem.
Structuring of a problem helps us visualize the different factors and elements involved in
the problem in a logical way and draw our conclusions based on it. The hierarchy
represents all the elements/factors that are involved in the decision making process.
Usually the process of structuring involves the identification of problem, the elements
involved in the problem, requirement and criteria, actions, actors and alternatives
available and then this is followed by clustering to bring homogeneity by level [36].
The science behind the creation of hierarchy in AHP is explained by T.L Saaty in
his book fundamentals of decision making [37] through several axioms concerning the
Objective
Decomposition
Comparative
Evaluation
Prioritization

31
hierarchy formation. Two most important axioms considered during the formation of
hierarchy are described in brief below.
Axiom 1- Let H be a partially ordered set with largest element „b‟, now H is
considered to be an hierarchy if and only if it satisfies the following mathematical
conditions
There is a partition of H into sets Lk ; where k = 1,2 … ,h and L1= „b‟
If x Lk it implies that x- Lk+1 ; where k = 1,..,h-1
If x Lk it implies that x+ Lk-1 ; where k = 2,..,h
The interpretation of these axioms is mentioned in [35] and conveys the
following, from the first condition we have that objective or goal must be placed at the
first level of a hierarchy. The second condition can be explained in technical terms as, if x
(which may be criteria, sub criteria or alternative) belongs to particular level then the all
the subsets of x must belong to level k+1 i.e. the next level. By this axiom if we place
criteria at level to of a hierarchy then the sub criteria‟s must be place at level 3 of the
hierarchy. The third condition is similar to that of second condition; according to it if x
refers to sub criteria and is placed at level three then criteria must be placed at level two.
Axiom 2 - Given an hierarchy H, x H and x Lk H then x- Lk+1 is ρ
homogenous for all k = 1,.., h-1 [39].
This axiom states that an element must be placed in a particular hierarchy in such
a way that it is comparable with the other elements present at that level. Hence the

32
criteria, sub criteria and alternatives all should be placed in different levels and should
never be mixed [35].
Though hierarchy structure can be formed in different ways the basic steps involved as
described by T.L Saaty in [36] are
Definition of goal – This forms the focal point of our structure, this is analogous to the
mission or vision statement in an organization.
Breaking down of the problem – the problem is decomposed in the same way a system is
decomposed into sub systems components etc. The problem can be decomposed based on
their function, time horizon, etc.
Establishment of end points or bottom levels – The bottom level usually consists of
alternatives to choose from which when implemented should solve the problem
considered.
Check for completeness and consistency of architecture – This can be done by making
sure that the established structure fulfills the hierarchy axioms stated above. A
hierarchical structure is usually checked by making sure the flow of logic remains the
same from top to bottom.
An example of a typical hierarchical structure used in an AHP is shown in figure
9. It illustrates a hierarchy for deciding whether the water in the dam must be kept at half
its level or should the dam must be full. Here the hierarchy consist of seven levels i.e. k
=7 as per the axiom. The problem has been decomposed based on the cause and effect
situation. Also all the criteria at each level are comparable with one another hence

33
ensuring a logical flow of information. Since the hierarchy illustrated satisfies both the
axioms it could be considered as a complete hierarchy and we can proceed to the next
step that is pair wise comparison.
1.2 Comparative Evaluation
In mathematics two kinds of measurement topologies exist, metric topology and
order topology. While the metric topology is concerned with measuring how much of an
attribute an element has. Order topology is more concerned with the measurement of
dominance of one element over another with respect to a particular attribute. The
outcomes are in form of priorities instead of absolute values. [40]
Figure 9 Hierarchy level to decide the water level in the Dam [36].
In AHP we make use of order topology for the purpose of decision making. This
is achieved by using pair wise comparison, where in each attribute relative importance
with another is determined with respect to a higher goal. Here the number derived from

34
comparison of one element with another is specific to the particular attribute/situation and
cannot be generalized. This is preferred because the importance of an element changes
with respect to the environment and is not stable in a dynamic environment. Also this
enables us to capture the influence of one element over the other and offers greater
flexibility; in the sense both tangibles and non tangibles can be measured and expressed
in this way [40].
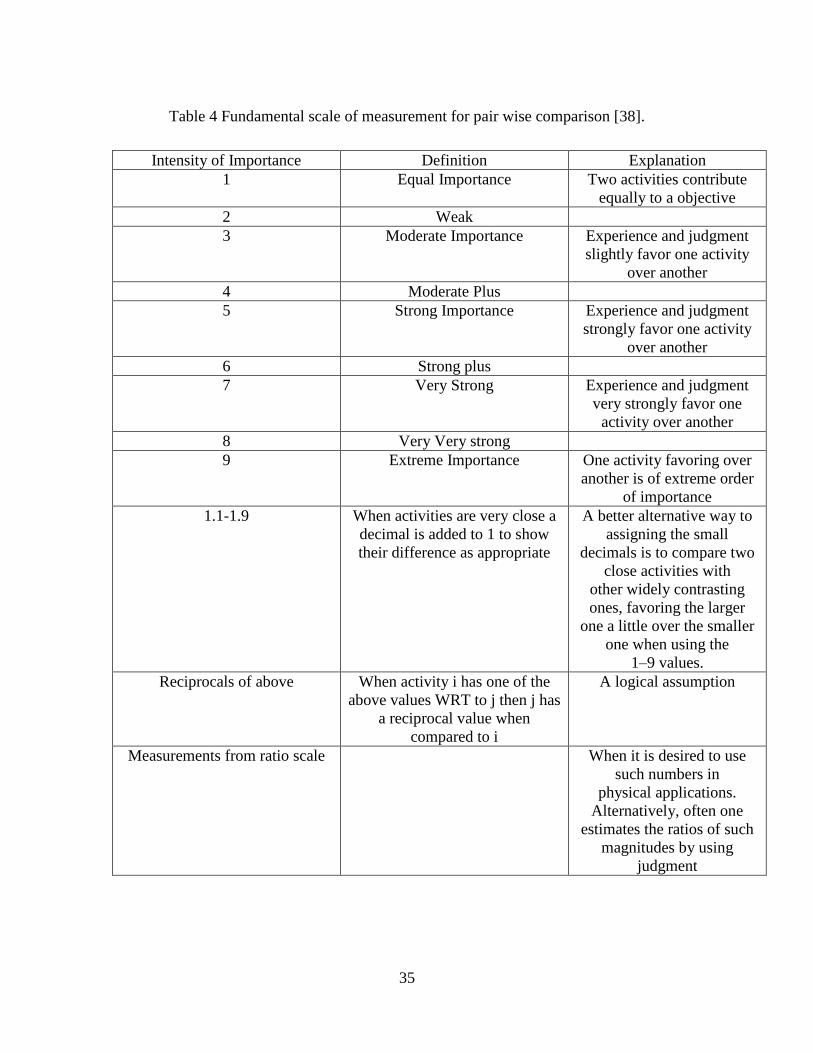
Usually we use a fundamental scale as depicted in table 4 for the purpose of
relative measurement. This scales indicate the ratio of weight of one element over
another, ie if wi and wj are the weights of two elements, the pair wise comparison gives
their dominance in terms of ratio of (wi / wj) [35].
The ratio scales are then represented in the form of relationship matrix which is
essentially a reciprocal matrix. This matrix is then synthesized to obtain a list of priorities
which will be explained in the following section. The matrixes are formed in accordance
with certain axioms explained by T.L Saaty in his book fundamentals of decision making
[37].
Axiom 3 – for all Ai , Aj A and c C
Pc(Ai , Aj) = 1/ Pc(Aj , Ai)
Pc represents the intensity or strength of preference of one alternative over another.
\
35
Table 4 Fundamental scale of measurement for pair wise comparison [38].
Intensity of Importance Definition Explanation
1 Equal Importance Two activities contribute
equally to a objective
2 Weak
3 Moderate Importance Experience and judgment
slightly favor one activity
over another
4 Moderate Plus
5 Strong Importance Experience and judgment
strongly favor one activity
over another
6 Strong plus
7 Very Strong Experience and judgment
very strongly favor one
activity over another
8 Very Very strong
9 Extreme Importance One activity favoring over
another is of extreme order
of importance
1.1-1.9 When activities are very close a
decimal is added to 1 to show
their difference as appropriate
A better alternative way to
assigning the small
decimals is to compare two
close activities with
other widely contrasting
ones, favoring the larger
one a little over the smaller
one when using the
1–9 values.
Reciprocals of above When activity i has one of the
above values WRT to j then j has
a reciprocal value when
compared to i
A logical assumption
Measurements from ratio scale When it is desired to use
such numbers in
physical applications.
Alternatively, often one
estimates the ratios of such
magnitudes by using
judgment

36
This axiom states that a relationship matrix derived through pair wise comparison
of one element over another must essentially form a reciprocal matrix. This is simply
another way of stating if A is 5 times more dominant than B then B is 1/5 times dominant
than B [28].
1.3 Synthesization of Priorities
Priorities refer to the order of preference of the alternatives or attributes obtained
after pair wise comparison of the elements. Though there are many ways of prioritization
the Eigen value method is the most efficient of all as it can deal with both consistent and
inconsistent matrix obtained from the pair wise comparison. The inconsistency may occur
due to the loss in one or more of the properties of reflexivity, transitivity and asymmetric
nature. The use of Eigen value method enables the AHP to accommodate inconsistency
in judgment.
To elucidate the use eigen vector consider a situation where in we compare n
different alternatives of different weight w1, w2, ….,wn. If A denotes the consistent
reciprocal matrix and W represent the weight, the corresponding weight matrix can be
recovered from equation as represented below [28].
A W = n W - (2.1)
This is clearly the case of eigen value problem where in n represents the eigen
value leading to the conclusion that W is the eigen vector. Also since A is a constant
multiple matrix and also the fact that its trace equals the order n, we have n as the
principle Eigen vector of A. Now the values of n are normalized to convert the values

37
obtained in the ratio scale into absolute scale. This however describes an ideal case,
whereas in real life situations the pair wise matrix are usually inconsistent.
Also from Saaty‟s axioms described in [38] we know that when considering an
inconsistent matrix say A‟ the above equation becomes
A‟W‟ = ‟max W‟. – (2.2)
Here A‟ is consistent if and only if ‟max = n and it is proved that we always have ‟max
n. Here the weight W‟ obtained contains positive elements and it is unique with
multiplicative components. To check whether the judgment is consistent or not we
calculate the consistency index and consistency ratio as shown below. If the values
obtained fall below the prescribed threshold value the judgment is accepted.
CI (consistency index) = (‟max – n)/ (n-1) - (2.3)
CR (consistency ratio) = CI/ RI - (2.4)
RI – random index
Table 5 Random index tables [39]
The weights obtained after establishment of relative matrix are normalized for the
purpose of translating the ratio scales into absolute scales. Normalization also helps us to
capture the fleeting transitivity in the judgments made [40].

38
The alternative which has the highest priority number is chosen as the solution for
the problem concerned. Here again the stability of ranking depends on the kind of
measurement used in comparison of alternatives. If we use relative measurement the rank
changes with change in the quantity and quality of the attributes and alternatives. If we
want an idealistic measure where there are no rank reversals than an absolute mode of
measurement must be utilized.
2 AHP in Process Selection
This section describes the application of AHP tool in selection of the most
appropriate alternative manufacturing process from among the alternatives considered.
The hierarchical structure of AHP in this case consists of three levels as shown below in
figure 10 where in the attributes were obtained from the QFD analysis performed and
described in [41].

39
Figure 10 Hierarchy structure used for the purpose of process selection
2.1 Objective
The objective here is to determine the alternative best suited to replace the
stamping process in order to reduce the production cost and weight of the body structure.
This leads us into identifying the different attributes that a manufacturing process must
possess to achieve the objective.
2.2 Attributes
The selection of the most suitable manufacturing process depends on some of this
attributes. Of all the considered attributes only some are related with the process
selection. The others were considered and prioritized as they were needed for designing a

40
systems manufacturing unit on the whole. The attributes affecting the manufacturing
process selection are described below.
2.2.1. Reduction in number of components
One of the main requirements for the reduction in cost as well as lead time is
reduction in the total number of components forming the part. An example of how a
process could affect the total number of components is shown in the figure 11.
a) Stamped radiator assembly b) Hydroformed radiator assembly
Figure 11 Stamped assembly vs. Hydroformed assembly [42]
Figure 11 shows the comparison between a stamped radiator assemblies of Dodge
Dakota. As can be seen the number of components required in the case of hydroforming
is just 10 compared against that of stamped assembly where 14 parts were required. This
consequentially leads to a reduction in both cost and mass of the assembly.
2.2.2 Use of Modular structure
Modularization refers to the use of modules for the creation of part. Modules are
functional blocks that can be described functionally and physically and are essentially

41
independent [43]. It is a very efficient tool for the purpose of mass customization. While
comparing this attribute with the alternatives we check for the ease of creating modular
structures. The increase in modularity usually increases the complexity and the number of
parts to be produced. Hence the process selected must be able to achieve complex shape
and at the same time try to minimize the number of components in the module.
2.2.3 Reduction in Changeover / Setup time
In an environment of mass customization a decrease in changeover and setup time
plays a crucial role in the reduction of production lead time. With increase in the number
of dies required the changeover time and the setup time increases. This also depends on
the number of process required for the creation of the same object. This can again be
illustrated by taking the example of radiator assembly depicted in figure 11 wherein only
10 parts have to be joined as against 14 thus bringing about a reduction in lead time.
Process such as hydroforming and superplastic forming make use of single dies thus
reducing the complexity in die changing process.
2.2.4 Common Platform
The concept of common platform refers to the idea of having a common base on
which the entire model could be built up on. Instead of assembling all the parts together
one by one having it done on a common base aids in mass customization as well as in
reduction of time. In case of our system manufacturing concept we use the chassis as a
common platform for building of BIW. Here the role of the alternatives in manufacturing
of this common platform and their ability to be reconfigured to incorporate small changes
42
are evaluated. The work done by the auto steel partnership described in their work [44] is
highly relevant and has been used as an guide way.
2.2.5 Uniformity in Material Selection
This was introduced after considering the case study of manufacturing of Honda
NSX as described in [7] where in tough the expected weight reduction and other
performance objectives were achieved, lot of modifications had to be made to the process
variables to make a full aluminum BIW. For example the twice the over crowning
allowance was needed compared to that of steel. Again considering the welding process
for this BIW welding current of up to 50k amps was used against that of steel BIW which
used only 12k amps. Also adjustments had to be made for greater springback which
necessitated a system re design.
Again while using a mixture of material changeover and reconfiguration becomes
necessary hence, to reduce design complication and reduce lead time it is better to use a
uniform material. The greatest disadvantage with this is that while some regions may
require more thickness while others don‟t need that much of material. Hence we look for
process which has the capability of producing a part with varying dimensions and
complexities. For example the relatively new viscous pressure forming technique is
intended to form sheets of various thicknesses and other difficult to form materials [17].
2.2.6 Reducing Variability in Dimension
Variability in dimension increases the number of components thereby increasing
the lead time and cost. Variation in dimension arises as different parts in a body structure
require different stress bearing capacities. For example in a door panel the hinges require
43
more load bearing capacity than the other parts. Some process like hydroforming induces
work hardening properties into the sheet metal parts thus increasing the yield strength of
the sheet metal. In such case low grade material (also cheaper) could be used for load
bearing purposes thus bringing about a reduction in part number.
2.2.7 Reduction in Number of Process Parameters
An increase in number of process parameters increases the complexity of the
operation. For example consider the casting process, here the process control variables
involves composition, temperature of melt and mould, speed of filling, quality of
mould/die , shrinkage and thermal patterns etc [20]. Such a high number of process
variables reduce the ease and reliability of a process. Also reconfiguration of such a
process becomes difficult as all the parameters need to be addressed.
2.2.8 Concurrent Operations
Concurrent engineering is a tool in itself for the reduction of lead time and cost. It
is a methodology in systems engineering wherein process such as product design, process
planning, manufacturing decisions are carried out simultaneously. This has been
described in [45] with an example of mold manufacturing. In our AHP we check for the
possibility of simultaneous operation in a process and the positive effect and potential of
concurrent systems design. For example in case of superplastic forming as described in
[46] one of the ways to reduce the production lead time is by controlling the upstream
and downstream activities, which again depends on the production volume. Also in
hybrid superplastic forming process both stamping and superplastic forming can be
carried out simultaneously.

44
2.2.9 Reduction in Intercell and Intracell Distance
Intercell and Intracell distance depend on the process layout and type of grouping
technology preferred. Here attributes and alternatives were compared under the
assumption that grouping has been done per process. In such a case the Intracell distance
in a cell depends on the number of process before the final product is formed. The
numbers of process for SPF, hydroforming and origami have been determined from the
works [46], [42] and [47] respectively.
2.2.10 Production Volume
Production volume plays the most important role in selection of alternatives as
this cannot be compromised with and all other attributes and alternatives are adjusted to
suit this. For the purpose of our research a total annual production of 100,000 BIW is
considered. This falls under the category of medium volume production. Factors affecting
the process capabilities for high volume production were frequency of tool change
required, investment in tooling, cycle time, changes required for increasing cycle time.
2.2.11 Surface Finish
Surface finish becomes a highly essential requirement for class A surfaces. In
such cases only those process capable of producing such a high quality parts in the least
number of operation, lead time and cost is preferred. For example machining becomes
essential for casting process if a cast part falls under class A surface. Because of the
presence of smiles on parts produced through the process of industrial origami it cannot
be used as a class A surface.
45
2.2.12 Optimized Alignment of Raw Material
This essentially refers to the nesting of blanks of sheet metal going into the
process in such a way as to reduce scrap and also to increase the opportunity for
simultaneous forming process.
2.2.13 Open architecture control
Open architecture control enables better automation of the process while
possessing the potential to be reconfigured when required depending on the situation. For
example in the present day factories applying flexible manufacturing principles the
automation and control process is done through software that is fixed or static in nature
as here only part programs can be changed while the software architecture cannot be
changed [47]. This greatly reduces the capability of the system to be reconfigured to suit
the market demands. Here we try to assess the ability of the process to be automated and
the associated effects. For example automation of superforming plastic would be a
complex process due to the need for handling pre heated sheets there by increasing the
cost. The process of automation of hydroforming is relatively simpler when compared to
that of superforming and casting.
2.2.14 Avoiding intricate shapes
As described in [46] when an aluminum door is formed using superplastic
forming enables the production of door as a single part there by reducing the number of
parts to be assembled together and at the same time doing away with complex parts. This
cannot be achieved with the use of industrial origami where in the radius of bend cannot

46
be too small. Hence we try to assess the ability of the process to remove unneeded
complexities but at the same time be able to achieve those complexities when required.
2.3 Alternatives
The alternatives here describe the processes that have the potential to replace
stamping as the major forming process. This section gives a brief description about such
process.
2.3.1 Industrial Origami
“The patented Industrial Origami Precision Fold Technology is based on the
creation of fold defining geometries which, when put into sheet metal, enable structure
and innovative shapes never before possible with traditional technologies. These features
called "smiles", control the folding and are responsible for the accurate folding properties
embedded in the sheet metal”[47]. Some of the advantages are that it posses great
accuracy, and can be used on steel, aluminum, plastic and composites. It can also be used
for a wide range of thickness. It makes use of existing tooling to stamp or cut features on
to the blanks.
The main disadvantage of this process is that it has poor load bearing capability.
This was further investigated and ascertained by running analysis of origami samples for
various thicknesses. Also it does not have the potential of completely replacing the
stamping process.

47
2.3.2 Hydroforming
Hydro-forming has gained acceptance as a forming technology in many
automotive and non automotive components. It makes use of the forces of fluids to shape
parts. The main advantages of hydro-forming over that of conventional stampings are that
1) higher quality 2) lower cost 3) ease of forming complex shape 4) reduction in number
of parts and better tolerance control. The main disadvantage of the hydroforming process
is its high cycle time. At times the cycle time of a hydroforming process tends to be twice
that of a stamping process [17].
2.3.3 Superplastic Forming
Superplastic forming is a metal forming process which is used to shape metals
using the theory of super plasticity. Certain aluminum and magnesium alloys exhibit
superplastic behavior by virtue of which they can be stretched to nearly 300-500% of
their original length. This stretching is a slow and gradual process due to which the cycle
times involved in superplastic forming is high. This has limited super plastic forming to
low volume applications like that of aerospace industry and specific light weight
automotive applications. Moreover we would require specialized processed raw materials
(aluminum alloys) which have been processed to obtain a very fine grain size. This
specialized raw material requirement adds an additional cost to the product compared to
regular aluminum or steel. On the flip side superplastic forming boasts of superior surface
finish and gives the designer considerable design freedom in the case of consolidation of
parts. For example an aluminum door panel which previously consisted of 4 stamped

48
panels is now made using a single super plastic forming operation. Issues like springback
are also eliminated by the usage of superplastic forming [46].
2.3.4 Casting
In a casting process the molten material is poured into a die cavity possessing the
negative shape of a required component and allowed to solidify. The solidified part
represents the needed component.
The main advantages of using castings are: design flexibility, part number
reduction by consolidation of fabricated parts into single components, near net shape
production process. The main disadvantage of casting is the huge volume of scrap
produced. Also there are too many variables to be controlled for achieving a high level of
reliability [20].
2.4 Comparative Evaluation
In this section the steps followed in the pair wise comparison of the attributes, and
the comparison involving alternatives and attributes are described.
2.4.1 Attributes Comparison
The attributes identified from the QFD process are compared with each other and
assigned relative weights with respect to each other as shown in table 6.

49
Table 6 Attributes Comparison.
The attributes are prioritized in the next step after normalization of the values, as this
would ensure the consistency of the weights assigned. A consistency check is also carried
out to determine whether the judgments made are consistent. This process is shown in
table 7.
2.4.2 Alternatives Comparison
The alternatives are compared with each other in a pair wise form with respect to
each and every attribute prioritized in the preceding step. Here again the weights are
given in the first step and then normalized for the purpose of consistency. An example of
such a comparison is shown in the table 8 and table 9.
R eduction
in NO of
compone
nts
R eduction
in
changeover
time
uniformity
in material
s election
R educ ing
variablity in
dimens ions
Avoiding
intricate
s hapes
R eduction in
number of
proces s
parameters
C ommon
platform
O pen
architecture
control
O ptimiz ed
alignment
of raw
material
us e of
modular
s tructures
C ons olida
tion of
parts
C oncurre
nt
operation
s
R educ ing
the
intercell
and
intracell
dis tance
production
Volume
S urface
F inis h
R eduction in NO of components 1.00 5.00 5.00 5.00 3.00 3.00 3.00 7.00 7.00 3.00 3.00 5.00 5.00 0.20 3.00
R eduction in changeover time 0.20 1.00 3.00 3.00 3.00 3.00 5.00 5.00 5.00 0.33 0.33 3.00 5.00 0.33 0.33
uniformity in material s election 0.20 0.33 1.00 3.00 3.00 5.00 3.00 5.00 5.00 0.20 0.33 0.33 3.00 0.33 0.33
R educ ing variablity in dimens ions 0.20 0.33 0.33 1.00 3.00 3.00 0.20 3.00 3.00 0.20 0.33 3.00 3.00 0.33 0.33
Avoiding intricate s hapes 0.33 0.33 0.33 0.33 1.00 3.00 0.20 3.00 3.00 0.14 0.20 3.00 3.00 0.20 0.33
R eduction in number of proces s parameters 0.33 0.33 0.20 0.33 0.33 1.00 0.33 3.00 3.00 0.20 0.20 3.00 3.00 0.33 0.33
C ommon platform 0.33 0.20 0.33 5.00 5.00 3.00 1.00 5.00 5.00 0.20 0.33 3.00 5.00 0.33 0.33
O pen architecture control 0.14 0.20 0.20 0.33 0.33 0.33 0.20 1.00 3.00 0.14 0.20 3.00 0.33 0.20 0.20
O ptimiz ed alignment of raw material 0.14 0.20 0.20 0.33 0.33 0.33 0.20 0.33 1.00 0.14 0.20 0.33 0.33 0.20 0.20
Us e of modular s tructure 0.33 3.00 5.00 5.00 7.00 5.00 5.00 5.00 7.00 1.00 3.00 7.00 5.00 0.33 3.00
C ons olidation of parts 0.33 3.00 3.00 3.00 5.00 5.00 3.00 5.00 5.00 0.33 1.00 5.00 5.00 0.33 3.00
C oncurrent operations 0.20 0.33 3.00 0.33 0.33 0.33 0.33 0.33 3.00 0.14 0.20 1.00 0.33 0.20 0.20
R eduction in the intra cell and intercell dis tance 0.20 0.20 0.33 0.33 0.33 0.33 0.20 3.00 3.00 0.20 0.20 3.00 1.00 0.20 0.20
P roduction Volume 5.00 3.00 3.00 3.00 5.00 3.00 3.00 5.00 5.00 3.00 3.00 5.00 5.00 1.00 3.00
S urface F inis h 0.33 3.00 3.00 3.00 3.00 3.00 3.00 5.00 5.00 0.33 0.33 5.00 5.00 0.33 1.00

50
Table 7 Normalizing and Prioritizing of Alternatives along with the consistency check.

51
Table 8 Comparison of Alternatives With Respect To Reduction in Number of
Components
Table 9 Normalization, Prioritization and consistency check
The tables 10 – 37 depict the pairwise evaluation of alternatives with respect to the
corresponding attributes described in section 2.2.
R eduction in No of c omponents
O rigami HydroformingC as ting
S uperplas ti
c forming
O rigami 1.00 0.50 0.25 0.33
Hydroforming 2.00 1.00 0.50 0.50
C as ting 4.00 2.00 1.00 2.00
S uper plas tic forming 3.00 2.00 0.50 1.00
Origami HydroformingCasting
Superplastic
forming Average x
Origami 0.11 0.12 0.21 0.07 0.13 0.52 4.05
Hydroforming 0.54 0.60 0.50 0.64 0.57 2.38 4.19
Casting 0.04 0.09 0.07 0.07 0.07 0.27 4.08
super plastic forming 0.32 0.20 0.21 0.21 0.24 1.01 4.25
n 4.14
CI 0.05
RI 0.90
CR 0.05

52
Table 10 Pairwise comparison with respect to modularization
Table 11 Prioritization of the values depicted in table 10
Table 12 Pairwise comparison with respect to part consolidation
Table 13 prioritization of values depicted in table 12
F abric ation/Manufac turing of modular s truc tures
O rigami HydroformingC as ting
s uperplas ti
c forming
O rigami 1.00 0.25 3.00 0.33
Hydroforming 4.00 1.00 3.00 2.00
C as ting 0.33 0.33 1.00 0.50
S uperforming plas tics 3.00 0.50 2.00 1.00
O rigami HydroformingC as ting
s uperplas ti
c forming Average x
O rigami 0.12 0.12 0.33 0.09 0.1651 0.70 4.24
Hydroforming 0.48 0.48 0.33 0.52 0.4538 1.99 4.38
C as ting 0.04 0.16 0.11 0.13 0.1104 0.45 4.10
S uperforming plas tics 0.36 0.24 0.22 0.26 0.2708 1.21 4.48
n 4.30
C I 0.10
R I 0.90
C R 0.11
C ons olidation of parts
O rigami HydroformingC as ting
s uperplas ti
c forming
O rigami 1.00 0.33 0.25 0.50
Hydroforming 3.00 1.00 0.50 2.00
C as ting 4.00 2.00 1.00 0.33
S uperforming plas tics 2.00 0.50 3.00 1.00
O rigami HydroformingC as ting
s uperplas ti
c forming Average x
O rigami 0.10 0.09 0.05 0.13 0.0925 0.42 4.55
Hydroforming 0.30 0.26 0.11 0.52 0.2970 1.34 4.51
C as ting 0.40 0.52 0.21 0.09 0.3048 1.37 4.50
S uperforming plas tics 0.20 0.13 0.63 0.26 0.3057 1.55 5.08
n 4.66
C I 0.22
R I 0.90
C R 0.24

53
Table 14 Pairwise comparison with respect to reduction in changeover time
Table 15 Prioritization of the values depicted in table 14
Table 16 Pairwise comparison of the alternatives with respect to common platform
R educ tion in c hangeover time/s etup time
O rigami HydroformingC as ting
s uperplas ti
c forming
O rigami 1.00 3.00 5.00 3.00
Hydroforming 0.33 1.00 3.00 0.50
C as ting 0.20 0.33 1.00 0.25
S uperforming plas tics 0.33 2.00 4.00 1.00
O rigami HydroformingC as ting
s uperplas ti
c forming Average x
O rigami 0.54 0.47 0.38 0.63 0.5064 2.13 4.21
Hydroforming 0.18 0.16 0.23 0.11 0.1681 0.68 4.05
C as ting 0.11 0.05 0.08 0.05 0.0723 0.29 4.05
S uperforming plas tics 0.18 0.32 0.31 0.21 0.2531 1.05 4.14
n 4.11
C I 0.04
R I 0.90
C R 0.04
C ommon P latform
O rigami HydroformingC as ting
s uperplas ti
c forming
O rigami 1.00 0.20 0.50 0.33
Hydroforming 5.00 1.00 3.00 4.00
C as ting 2.00 0.33 1.00 2.00
S uperforming plas tics 3.03 0.25 0.50 1.00

54
Table 17 Prioritization of values depicted in table 16
Table 18 Pairwise comparison of the alternatives with respect to Uniformity in material
selection
Table 19 Prioritization of the values depicted in table 18
O rigami HydroformingC as ting
s uperplas ti
c forming Average x
O rigami 0.09 0.11 0.10 0.05 0.0870 0.35 4.07
Hydroforming 0.45 0.56 0.60 0.55 0.5399 2.26 4.18
C as ting 0.18 0.19 0.20 0.27 0.2103 0.89 4.23
S uperforming plas tics 0.27 0.14 0.10 0.14 0.1628 0.67 4.09
n 4.14
C I 0.05
R I 0.90
C R 0.05
Uniformity in material s elec tion
O rigami HydroformingC as ting
s uperplas ti
c forming
O rigami 1.00 0.33 2.00 0.50
Hydroforming 3.00 1.00 5.00 2.00
C as ting 0.50 0.20 1.00 0.50
S uperforming plas tics 2.00 0.50 2.00 1.00
O rigami HydroformingC as ting
s uperplas ti
c forming Average x
O rigami 0.15 0.16 0.20 0.13 0.1607 0.65 4.04
Hydroforming 0.46 0.49 0.50 0.50 0.4883 1.97 4.04
C as ting 0.08 0.10 0.10 0.13 0.1001 0.40 4.03
S uperforming plas tics 0.31 0.25 0.20 0.25 0.2509 1.02 4.05
n 4.04
C I 0.01
R I 0.90
C R 0.02

55
Table 20 Pairwise comparison of the alternatives with respect to reduction in variability
in dimension
Table 21 Prioritization of values depicted in table 20
Table 22 Pairwise comparison of the alternatives with respect to avoiding intricate shapes
R educ ing Variablity in D imens ion
O rigami HydroformingC as ting
s uperplas ti
c forming
O rigami 1.00 0.20 3.00 0.33
Hydroforming 5.00 1.00 3.00 3.00
C as ting 0.33 0.33 1.00 0.33
S uperforming plas tics 3.00 0.33 3.00 1.00
O rigami HydroformingC as ting
s uperplas ti
c forming Average x
O rigami 0.11 0.11 0.30 0.07 0.1464 0.62 4.24
Hydroforming 0.54 0.54 0.30 0.64 0.5036 2.29 4.54
C as ting 0.04 0.18 0.10 0.07 0.0964 0.40 4.12
S uperforming plas tics 0.32 0.18 0.30 0.21 0.2536 1.15 4.54
n 4.36
C I 0.12
R I 0.90
C R 0.13
Avoiding intric ate s hapes
O rigami HydroformingC as ting
S uperformi
ng plas tics
O rigami 1.00 0.33 0.50 0.25
Hydroforming 3.00 1.00 3.00 0.33
C as ting 3.00 0.33 1.00 0.20
S uperforming plas tics 4.00 3.00 5.00 1.00

56
Table 23 Prioritization of values depicted in table 22
Table 24 Pairwise comparison of the alternatives with respect to reduction in number of
process parameters
Table 25 Prioritization of values depicted in table 24
O rigami HydroformingC as ting
S uperformi
ng plas tics Average x
O rigami 0.09 0.07 0.05 0.14 0.0888 0.37 4.19
Hydroforming 0.27 0.21 0.32 0.19 0.2474 1.11 4.48
C as ting 0.27 0.07 0.11 0.11 0.1404 0.59 4.23
S uperforming plas tics 0.36 0.64 0.53 0.56 0.5234 2.32 4.44
n 4.34
C I 0.11
R I 0.90
C R 0.12
R educ tion in number of proc es s parameters
O rigami HydroformingC as ting
s uperplas ti
c forming
O rigami 1.00 3.00 5.00 3.00
Hydroforming 0.33 1.00 5.00 3.00
C as ting 0.20 0.20 1.00 0.33
S uperforming plas tics 0.33 0.33 3.00 1.00
O rigami HydroformingC as ting
s uperplas ti
c forming Average x
O rigami 0.54 0.66 0.36 0.41 0.4909 2.15 4.38
Hydroforming 0.18 0.22 0.36 0.41 0.2913 1.24 4.26
C as ting 0.11 0.04 0.07 0.05 0.0670 0.27 4.08
S uperforming plas tics 0.18 0.07 0.21 0.14 0.1507 0.61 4.07
n 4.20
C I 0.07
R I 0.90
C R 0.07

57
Table 26 Pairwise comparison of the alternatives with respect to concurrent operations
Table 27 Prioritization of values depicted in table 26
Table 28 Pairwise comparison of the alternatives with respect to reduction in intercell and
Intracell distance
C onc urrent O perations
O rigami HydroformingC as ting
s uperplas ti
c forming
O rigami 1.00 0.33 2.00 0.33
Hydroforming 3.00 1.00 5.00 3.00
C as ting 0.50 0.20 1.00 0.33
S uperforming plas tics 3.00 0.33 3.00 1.00
O rigami HydroformingC as ting
s uperplas ti
c forming Average x
O rigami 0.13 0.18 0.18 0.07 0.1413 0.57 4.02
Hydroforming 0.40 0.54 0.45 0.64 0.5083 2.15 4.23
C as ting 0.07 0.11 0.09 0.07 0.0840 0.35 4.11
S uperforming plas tics 0.40 0.18 0.27 0.21 0.2664 1.11 4.17
n 4.13
C I 0.04
R I 0.90
C R 0.05
R educ tion in interc ell and intrac ell dis tanc e
O rigami HydroformingC as ting
s uperplas ti
c forming
O rigami 1.00 0.50 0.20 0.33
Hydroforming 2.00 1.00 0.33 0.33
C as ting 5.00 5.00 1.00 3.00
S uperforming plas tics 3.00 3.00 0.33 1.00

58
Table 29 Prioritization of values depicted in table 28
Table 30 Pairwise comparison of the alternatives with respect to open architecture control
Table 31 Prioritization of values depicted in table 30
O rigami HydroformingC as ting
s uperplas ti
c forming Average x
O rigami 0.09 0.05 0.11 0.07 0.0805 0.34 4.19
Hydroforming 0.18 0.11 0.18 0.07 0.1343 0.56 4.15
C as ting 0.45 0.53 0.54 0.64 0.5399 2.35 4.35
S uperforming plas tics 0.27 0.32 0.18 0.21 0.2453 1.07 4.36
n 4.26
C I 0.09
R I 0.90
C R 0.10
O pen Arc hitec ture c ontrol
O rigami HydroformingC as ting
S uperformi
ng plas tics
O rigami 1.00 0.33 3.00 0.33
Hydroforming 3.00 1.00 5.00 0.33
C as ting 0.33 0.20 1.00 0.33
S uperforming plas tics 3.00 3.00 3.00 1.00
O rigami HydroformingC as ting
S uperformi
ng plas tics Average x
O rigami 0.14 0.07 0.25 0.17 0.1566 0.66 4.24
Hydroforming 0.41 0.22 0.42 0.17 0.3033 1.35 4.45
C as ting 0.05 0.04 0.08 0.17 0.0849 0.35 4.12
S uperforming plas tics 0.41 0.66 0.25 0.50 0.4552 2.09 4.59
n 4.35
C I 0.12
R I 0.90
C R 0.13

59
Table 32 Pairwise comparison of the alternatives with respect to production volume
Table 33 Prioritization of values depicted in table 32
Table 34 Pairwise comparison of the alternatives wrt surface finish
P roduc tion Volume
O rigami HydroformingC as ting
s uperplas ti
c forming
O rigami 1.00 3.00 0.33 0.33
Hydroforming 0.33 1.00 0.33 0.33
C as ting 3.00 3.00 1.00 3.00
S uperforming plas tics 3.00 3.00 0.33 1.00
O rigami HydroformingC as ting
s uperplas ti
c forming Average x
O rigami 0.14 0.30 0.17 0.07 0.1686 0.70 4.16
Hydroforming 0.05 0.10 0.17 0.07 0.0959 0.40 4.14
C as ting 0.41 0.30 0.50 0.64 0.4630 2.07 4.48
S uperforming plas tics 0.41 0.30 0.17 0.21 0.2725 1.22 4.48
n 4.32
C I 0.11
R I 0.90
C R 0.12
S urfac e F inis h
O rigami HydroformingC as ting
s uperplas ti
c forming
O rigami 1.00 0.33 0.50 0.20
Hydroforming 3.00 1.00 2.00 0.50
C as ting 2.00 0.50 1.00 0.25
S uperforming plas tics 5.00 2.00 4.00 1.00
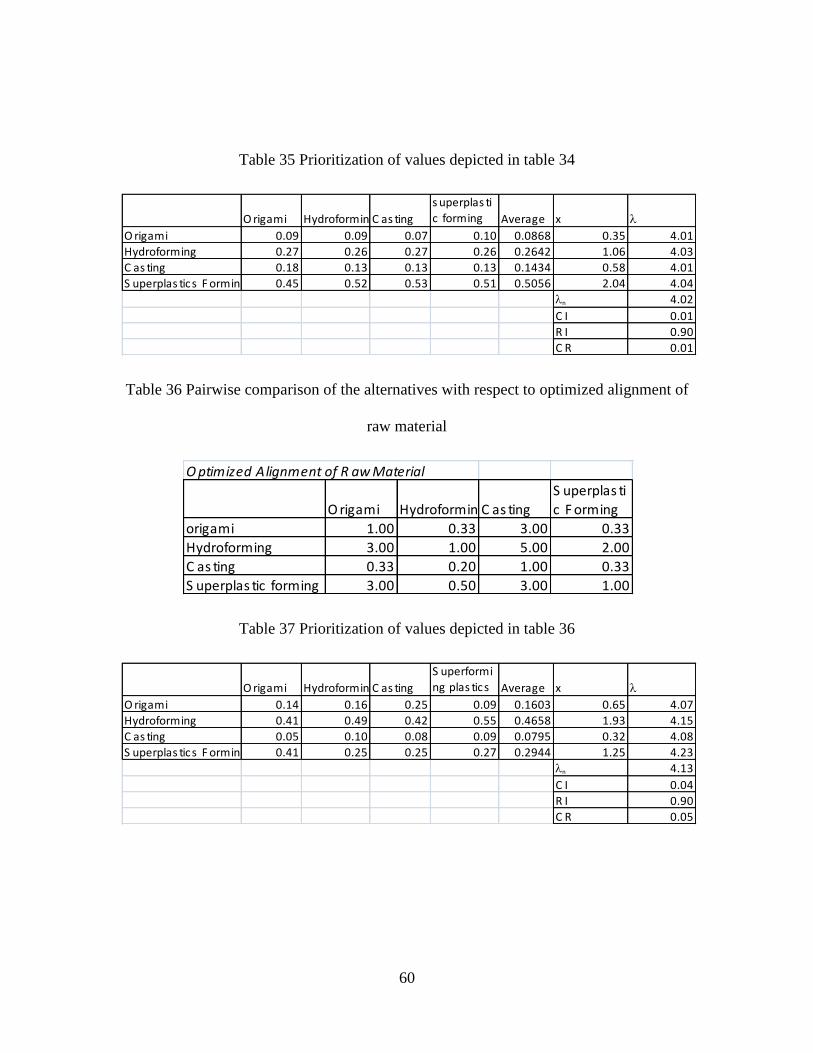
60
Table 35 Prioritization of values depicted in table 34
Table 36 Pairwise comparison of the alternatives with respect to optimized alignment of
raw material
Table 37 Prioritization of values depicted in table 36
O rigami HydroformingC as ting
s uperplas ti
c forming Average x
O rigami 0.09 0.09 0.07 0.10 0.0868 0.35 4.01
Hydroforming 0.27 0.26 0.27 0.26 0.2642 1.06 4.03
C as ting 0.18 0.13 0.13 0.13 0.1434 0.58 4.01
S uperplas tics F orming 0.45 0.52 0.53 0.51 0.5056 2.04 4.04
n 4.02
C I 0.01
R I 0.90
C R 0.01
O ptimized Alignment of R aw Material
O rigami HydroformingC as ting
S uperplas ti
c F orming
origami 1.00 0.33 3.00 0.33
Hydroforming 3.00 1.00 5.00 2.00
C as ting 0.33 0.20 1.00 0.33
S uperplas tic forming 3.00 0.50 3.00 1.00
O rigami HydroformingC as ting
S uperformi
ng plas tics Average x
O rigami 0.14 0.16 0.25 0.09 0.1603 0.65 4.07
Hydroforming 0.41 0.49 0.42 0.55 0.4658 1.93 4.15
C as ting 0.05 0.10 0.08 0.09 0.0795 0.32 4.08
S uperplas tics F orming 0.41 0.25 0.25 0.27 0.2944 1.25 4.23
n 4.13
C I 0.04
R I 0.90
C R 0.05

61
2.4.3 Final Evaluation
In the final step of ranking or prioritization the overall comparison of the
alternatives with the attributes listed is carried out and the alternative with the highest
priority/ranking was selected. In our case hydroforming and SPF process were the best
suited to our requirements. Table 38 depicts the results of the final comparison carried
out for choosing the best alternative.
Table 38 Final Evaluation
Tough superplastic forming results as the most viable alternative source on the
overall evaluation for the purpose of effective mass customization it is better that we use
the process based on the results of comparison between alternatives and attributes. The
application of this process in the construction of BIW will be discussed in chapter 4.

62
CHAPTER 3
REVIEW OF SUPERPLASTIC FORMING AND HYDROFORMING PROCESS
Introduction
From the previous chapter we selected two processes as potential alternatives for
the stamping process in order to achieve the objective of reduction in mass of the vehicle.
Again the need for reduction in mass and a brief overview of how this could be achieved
through alternative process was explained in the first chapter. In this chapter the overview
of the two alternative processes is described in detail.
The first section deals with the overview of superplastic forming process. Though
this process has been in use for more than a decade its application in automotive industry
has been very limited until recently. The subsections describe the conventional
superplastic forming process, the requirements and need of a superplastic forming
process and the various industrial modifications made to this process along with their
applications.
The second section of this chapter deals with hydroforming process which has
been used in industry predominantly for manufacturing of different tubular parts in a
vehicle. Here the advantages, disadvantages, various types of hydroforming are described
along with their application in current situation.
1 Superplastic Forming
Superplastic forming is predominantly used in aerospace, architectural and sports
industry as it is the most suitable forming process for forming of aluminum and

63
magnesium alloys. The conventional stamping of these alloys is expensive and requires
major design changes due to their low formability. The advantages of superplastic
forming are that it can form complex shape, negligible springback as the material formed
is in superplastic state at the time of being formed, part consolidation as it can be used to
form near net shapes, reduction in tooling cost. Also as the force exerted on the die is
relatively less than stamping process the dies can be made of cast iron dies instead of
hard to work tool steels [46].
Superplastic forming is a manufacturing process that depends on the tendency of
the superplastic material to elongate by as high as 5000% under the application of high
temperature. Usually the temperature to which the material is heated is 0.5 times that of
its melting temperature. In a conventional superplastic forming process the required
complex shape is formed through blow forming process where in a sheet of superplastic
material is blown into the die cavity by applying pressure through gas blowing
mechanism as shown in figure 12. As can be seen from the figure superplastic forming
material requires just one die as against two required in a conventional press working
process thereby reducing the overall tooling cost. A major requirement of this process is
the procurement of superplastic alloys with very specific properties [48].

64
a)
b)
Figure 12 Superplastic Forming a) before gas blowing b) after gas blowing
The superplastic alloys used for this purpose possess the ability to undergo very
large elongation before complete failure which is often referred by the term elongation to
failure. These alloys must have a very fine grain structure and must possess high strain
rate sensitivity. Due to this the alloys cannot be formed in the normal way and require

65
various grain refinement technique. Some of the grain refinement techniques generally
used for the formation of superplastic alloys is described below as derived from [49]. A
brief description of some of these processes is given below.
Dynamic recrystallization
Thermo mechanical treatment
Consolidation of amorphous or nano crystalline powder
Mechanical alloying
Physical vapor deposition
Intense plastic straining
Dynamic recrystallization – Here a fine grained structure is obtained due to
misorientation that takes place between the neighboring grain boundaries as a result of
continuous recrystallization induced due to straining. This is usually carried out for alloys
with sub grained structure. The resulting micro structural changes increase the strain rate
sensitivity of the alloy. An example of an alloy refined through this process Al – Li alloy.
Thermo mechanical treatment – this type of grain refinement technique is mainly
used for composites such as Al-Mg-Si matrix composites. Here grain refinement is
achieved through hot extrusion process wherein the refinement takes place due to both
recrystallization and precipitation.
Mechanical alloying – In this process the materials to be mixed are grounded and
then fused together by sintering process and application of high iso static pressure. Such
superplastic alloys are used for high strain rate super plasticity. Alloys such as IN 9052
are refined through this process.
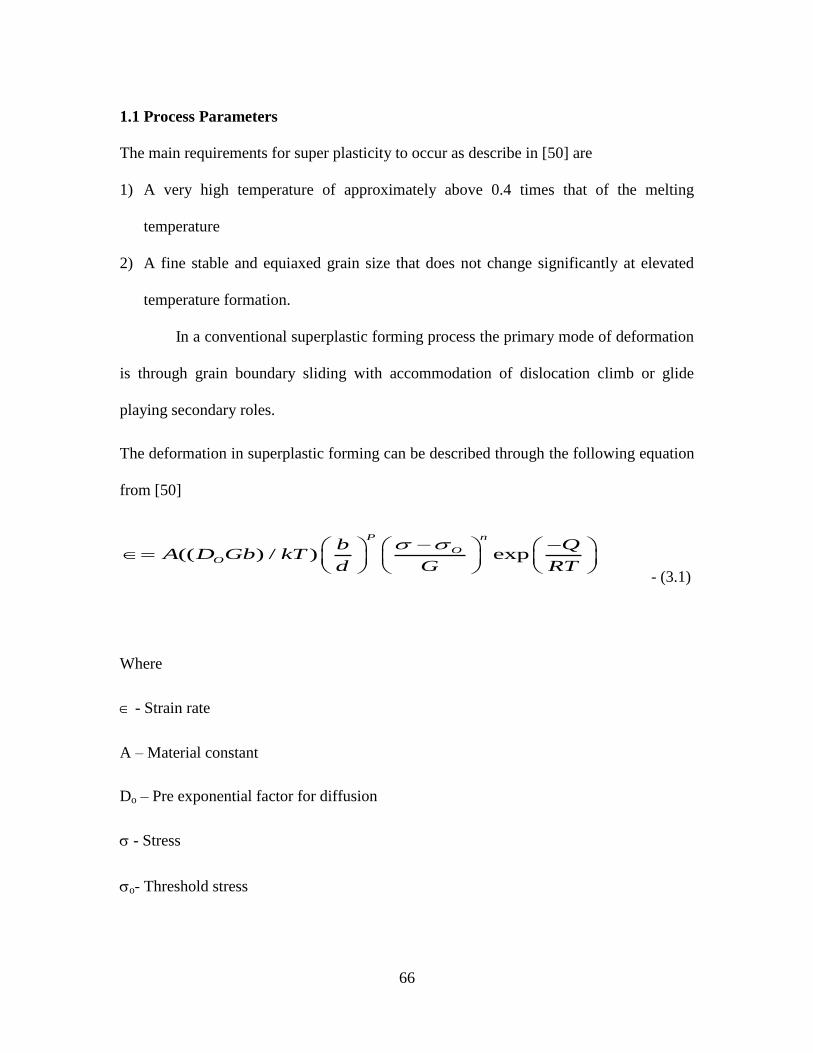
66
1.1 Process Parameters
The main requirements for super plasticity to occur as describe in [50] are
1) A very high temperature of approximately above 0.4 times that of the melting
temperature
2) A fine stable and equiaxed grain size that does not change significantly at elevated
temperature formation.
In a conventional superplastic forming process the primary mode of deformation
is through grain boundary sliding with accommodation of dislocation climb or glide
playing secondary roles.
The deformation in superplastic forming can be described through the following equation
from [50]
- (3.1)
Where
- Strain rate
A – Material constant
Do – Pre exponential factor for diffusion
- Stress
o- Threshold stress
(( ) / ) exp
nP
OO
b QA D Gb kT
d G RT

67
G – Shear modulus
k - Boltzmann‟s Constant
d – Grain size
p – Grain size exponent
R – Gas constant
b – Burger vector
Q – Activation energy depending on the rate controlling the process
T – Absolute temperature
n – Stress exponent; inverse of strain rate sensitivity „m‟
The variables n, p & Q are used for identifying the deformation mechanism. The
activation energy for grain boundary sliding of AA5083 alloy is 110 KJ/mole while the
activation energy for SD creep in the same alloy is 136KJ/mole [51]. Deformation
through grain boundary sliding mechanism takes place at low strain rate and requires a
very fine grain structure. In grain boundary sliding the grains move past each other or
along their adjacent common boundaries. This sliding motion can occur in three ways 1)
strain jump 2) rotational jump 3) translation jump [52]. Also this form of deformation
takes place at high strain rate of sensitivity. The typical values for strain rate and strain
rate sensitivity for deformation through grain boundary sliding is 10-3
to 10-5
s-1
and
0.3<m<0.5. With increase in strain rate other accommodating mechanism like dislocation
climb or diffusion becomes the predominant deformation mechanism. Figure 14 depicts a
flow stress and strain rate relationship and identifies the various deformation zones.

68
Figure 13 Strain rate and flow stress relationship for a typical fine grained superplastic
material [48]
In figure 13 regions marked II and III deform via grain boundary sliding and dislocation
slip (or any other accommodating mechanism).
One of the most important control factors in a superplastic forming process is the
grain size. A typical grain size of a superplastic material ranges from 5 to 10 m [49].
The effect of grain size on the formability of a superplastic material is shown in figure
14.

69
Figure 14 Relationship between strain rate and inverse size of grain [50].
From the above figure it can be seen that with the increase in optimal strain rate
the grain size decreases indicating that for a high strain rate process to be possible a very
fine grain size is required.
The slope of the line in the above figure represents the grain size exponent „p‟.
The relationship between flow stress and elongation to failure with respect to the strain
rate for different grain sizes of a superplastic material is depicted below in figure 15.

70
Figure 15 Relationship of flow stress and elongation to failure with strain rate for
different grain sizes of a superplastic material [53].
From figure 16 we see that the flow stress of a given material decreases with
decrease in grain size for a given strain rate. Also the slope of the curve depicting the
strain rate sensitivity increases with decrease in grain size. Hence for a more uniform
thinning of material a finer grain size becomes necessary. Also for a given strain rate the
elongation to failure for a superplastic material increases with decreasing grain size.

71
While the flow stress of the material increases with increase in strain rate this leads to
decrease in elongation to failure of the superplastic material. The initial flow stress of the
material can be calculated from equation (3.2) as described in [51].
.n mk - (3.2)
Where refers to the flow stress of the material, k is is the strength of coefficient,
n refers to the strain hardening exponent, m is the strain rate sensitivity, .
and
represent the strain rate and strain of the superplastic material.
From Mukherjee‟s work described in [51] we know that the strain rate sensitivity
„m‟ is another important control parameter in the superplastic forming process. The strain
rate sensitivity of the material gives an indication of the capacity of the material to resist
necking. Thus higher the m value of a process the greater is the probability of achieving
uniform thickness distribution across the component. A high value of m helps in better
elongation as it helps in reducing the tendency of localized necking. Figure 16 illustrates
the effect of m value on the formability of superplastic materials.
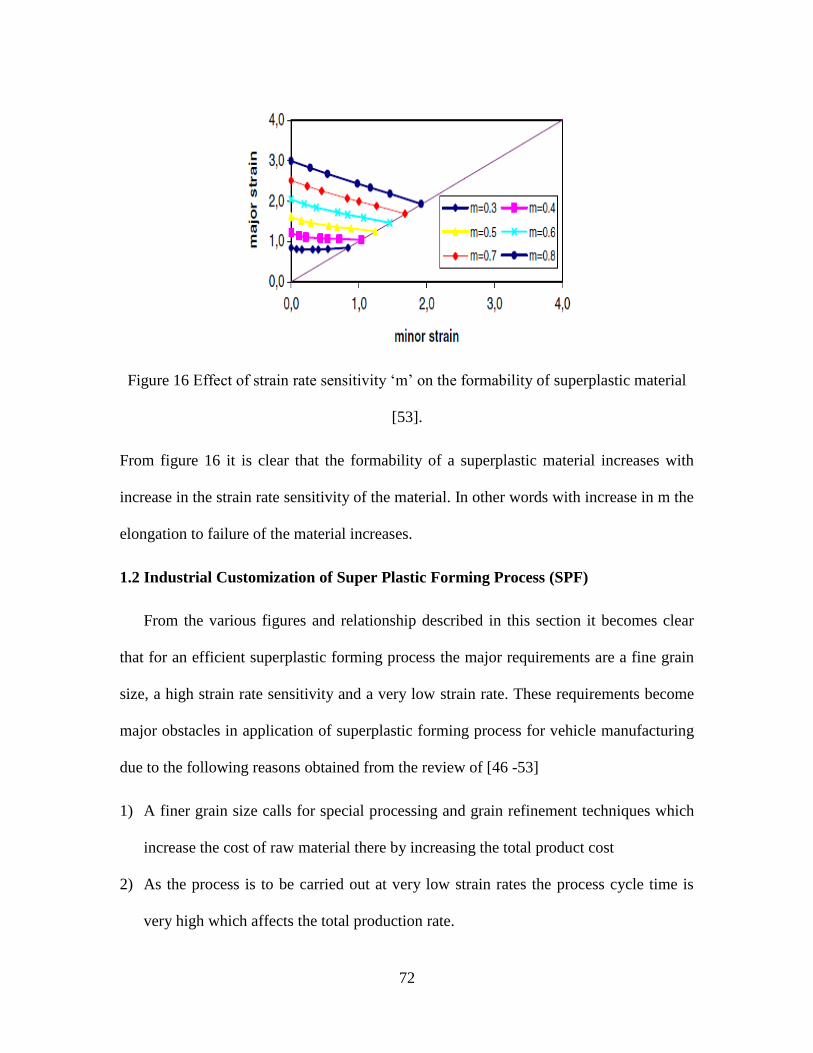
72
Figure 16 Effect of strain rate sensitivity „m‟ on the formability of superplastic material
[53].
From figure 16 it is clear that the formability of a superplastic material increases with
increase in the strain rate sensitivity of the material. In other words with increase in m the
elongation to failure of the material increases.
1.2 Industrial Customization of Super Plastic Forming Process (SPF)
From the various figures and relationship described in this section it becomes clear
that for an efficient superplastic forming process the major requirements are a fine grain
size, a high strain rate sensitivity and a very low strain rate. These requirements become
major obstacles in application of superplastic forming process for vehicle manufacturing
due to the following reasons obtained from the review of [46 -53]
1) A finer grain size calls for special processing and grain refinement techniques which
increase the cost of raw material there by increasing the total product cost
2) As the process is to be carried out at very low strain rates the process cycle time is
very high which affects the total production rate.

73
3) The superplastic forming process is suited for low to medium volume production only
as at higher volume of production the advantages of conventional press working
overdo the advantages of superplastic forming as the high tooling cost incurred in
stamping process is spread over the high volume of products.
To overcome these disadvantages the OEMs started modifying the superplastic
forming process to suit their production system. The General Motors (GM) developed
The Quick Plastic Forming Process (QPF) to overcome the disadvantages. A systems
approach was taken by GM to increase the production rate and suit high volume
production. A typical QPF process is shown in figure 17. Some of the differences
between the QPF and SPF as described in the work [54] are quick plastic forming process
can be carried out at relatively higher strain rates than superplastic forming process as the
primary mode of deformation is through dislocation creep and not grain boundary sliding.
While grain boundary sliding deformation mechanism is dependent on the grain size
solute dislocation creep mechanism is not dependent on the grain size. Thus need for
specialized treatments of raw materials for the purpose of grain refinement are not
required. The solute dislocation creep mechanism has a viscous glide mechanism where
in the strain rate sensitivity is approximately 0.3.
The quick plastic forming process was used in the forming of Al doors which resulted
in the mass saving of about 5.1 kg in the front door and 4.7 kg for the rear door when
compared to a door made of steel through the stamping process. Also the entire inner
panel was cast as one part which would never have been possible by using a conventional
stamping process [59].

74
In line with this ford developed the Ford Advanced Superplastic Forming Technology
(FAST) which makes use of a hybrid superplastic forming technology. Here the cycle
time of the process is improved by changing the die design and automating process such
as blank pre heating, part loading and extraction. A cost analysis for the production of
door through intensive application of FAST process resulted in a weight saving of about
11.4% and a reduction in cost from $315 to $297. In this case the bench marking was
done with a door made of aluminum where in the use of stamping process had ruled out
the option of producing the door inner model as a single piece. With the application of
FAST the number of part count was also reduced from eight to seven. [61]
Figure 17 QPF system design [60]
75
2 HYDROFORMING PROCESS DESCRIPTIONS
Hydroforming refers to a fluid tool soft forming process like gas blow forming
process where the blank is formed by the force exerted by fluid such as oil, water etc.
here the fluid acts as the punch or the die [17]. Hydroforming is gaining importance in
the automobile industry due to various advantages over stamping. One of the main areas
of application of hydroforming has been in the forming of tubular components. In this
section we discuss about the various classification of hydroforming along with their
control parameters and requirements. Hydro-forming is mainly classified as sheet hydro-
forming and tube hydro-forming.
2.1 Sheet Hydro-forming
Figure 19 describes a sheet hydro forming or hydro forming deep drawing
process. It is a soft die forming technology and is extensively used in the automobile
industry for deep drawing of blanks for formation of cups etc. one main advantage of this
process is that it increases the Limit Drawing Ratio (LDR) of the blanks due to the
continuous forces exerted by the fluid. From the works described in [58] and [59] a
typical sheet hydroforming process is described as below.

76
Figure 18 Sheet hydro-forming. [62]
As can be seen in the above figure the blank and the fluid are separated by a
rubber diaphragm. Here the shape of the drawn blank is determined by the punch. The
fluid substitutes for the female die thus bringing about a considerable reduction in the
tooling cost. When the punch moves down in the chamber the blank assumes the shape of
the punch under the action of forces exerted by the punch and the fluid. Also as the punch
moves down against the pressure exerted by the fluid it can be seen that some of the fluid
flows out and forms a layer between the blank and top surface of the die, this leads to a
decrease in the friction co efficient between the blank and the die and hence improving
the LDR of the blank. Also the fluid injected into the die under a pre calculated pressure
causes pre bulging of the blank held before the action of punch. This pre bulging action
causes uniform elongation of the blank under the action of punch. Also due to the
continuous action of fluid acting against the punch there is reduction in localized thinning
of the blank and this improves the formability as well as reduces the springback effect.

77
Cups and flat sheet metal products are formed using this technology. This is also known
as flex forming or flexible forming mostly used in the production of prototypes and small
scale production. It is also known hydrodynamic deep drawing process. The major
advantages of this process are that it is highly flexible as in most cases only the punch
contour needs to be changed.
2.1.1 Control Parameters
The important process control parameters for sheet metal hydroforming are the
counter pressure applied, the punch surface roughness, blank thickness, blank material
properties.
2.1.1.1 Counter Pressure –
The counter pressure applied relates to the pressure applied that acts against the
punch force. The counter pressure is responsible for the pre bulging operation in a
hydrodynamic deep drawing operation. Also it is seen from experimental results
described in [60] that for the same punch roughness to achieve a maximum draw ratio
counter punch have to be increased. Also for the same draw ratio the counter pressure
increases with increase in thickness of the blank.
From [59] & [61] we have the calculation of pressure based on the available
hydroforming press tonnage and component surface area. This is described in equation
(3.3) and (3.4).
p s fF A P - (3.3)

78
2 2
0 000 0 0
0 0 0
2 tan2 tan 1.1ln (3.4)
2 2
b k fbp b k f g st
d h t qd cF d h t q p p
t t
Where
Fp – Press force
As- Component surface area
Pf – Forming pressure
o – Drawing ratio
db – Punch base diameter
- Coefficient of friction
qf – Strain hardening factor
pg – Counter pressure
o – Flow stress
pst – Support pressure
to – Initial thickness of blank
dBhi – Inner blank diameter
c – Geometry constant
- Instantaneous drawing ratio
- Semi cone angle of punch
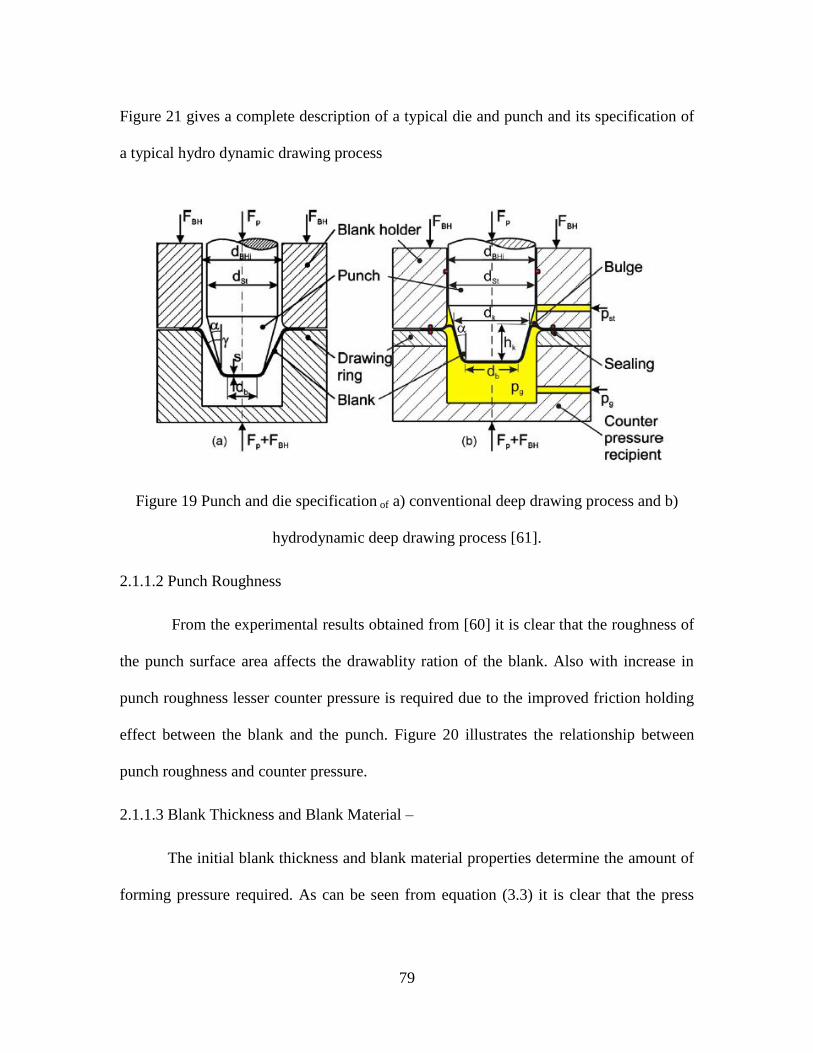
79
Figure 21 gives a complete description of a typical die and punch and its specification of
a typical hydro dynamic drawing process
Figure 19 Punch and die specification of a) conventional deep drawing process and b)
hydrodynamic deep drawing process [61].
2.1.1.2 Punch Roughness
From the experimental results obtained from [60] it is clear that the roughness of
the punch surface area affects the drawablity ration of the blank. Also with increase in
punch roughness lesser counter pressure is required due to the improved friction holding
effect between the blank and the punch. Figure 20 illustrates the relationship between
punch roughness and counter pressure.
2.1.1.3 Blank Thickness and Blank Material –
The initial blank thickness and blank material properties determine the amount of
forming pressure required. As can be seen from equation (3.3) it is clear that the press
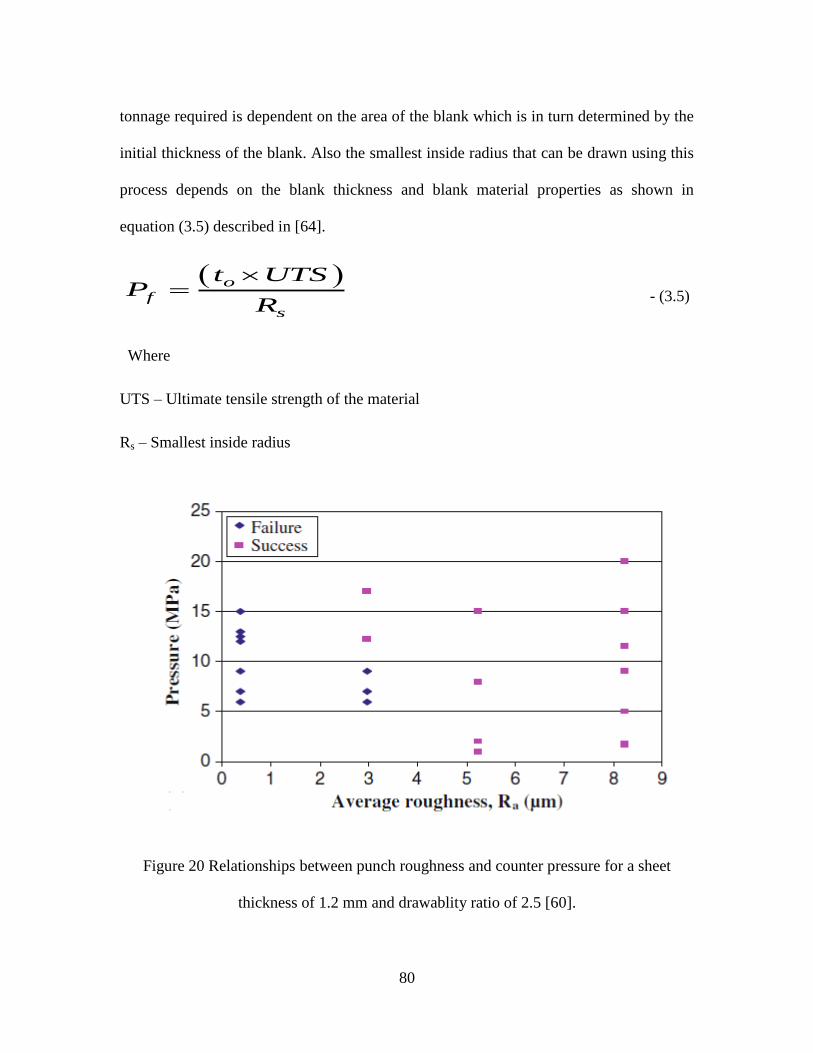
80
tonnage required is dependent on the area of the blank which is in turn determined by the
initial thickness of the blank. Also the smallest inside radius that can be drawn using this
process depends on the blank thickness and blank material properties as shown in
equation (3.5) described in [64].
of
s
t UTSP
R
- (3.5)
Where
UTS – Ultimate tensile strength of the material
Rs – Smallest inside radius
Figure 20 Relationships between punch roughness and counter pressure for a sheet
thickness of 1.2 mm and drawablity ratio of 2.5 [60].
81
2.2 Tube Hydro Forming
This type of hydro forming is used for the production of tubular structures. Figure
21 represents a typical tube hydro forming process. Here the tube is inserted into the die
and a compressive axial and internal pressure is generated. While the axial pressure is
generated through use of axial punch, the internal pressure is generated through the fluid.
The main difference between the sheet hydro forming and tube hydro forming is that
while the fluid replaces the female die in sheet hydro forming it replaces the punch in
tube hydro forming process. On application of internal pressure the tube expands/bulges
to occupy the negative cavity formed after joining the two set of dies. It is further
classified as low pressure forming, where the internal pressure ranges from 80 to 100
Mpa and the wall thinning is less than 5 % of its thickness, and high pressure forming
wherein the pressure ranges up to 600 Mpa and the wall thinning is more than 5% of its
initial thickness. [17]
Other variations of tube hydroforming process as described in [59] are multi
pressure hydroforming, hydrobulge forming and bellow forming process. The major
difference between a multi pressure forming process and low pressure forming process is
that in multi pressure forming process the fluid pressure exists before the die is closed,
die closing pressure, due to which the fluid acts as mandrel during the time of die closing
hence preventing any excessive surface deformation. This process is most suitable for
forming of body structures, frame members for vehicle. In the hydro bulging process is
characterized by high end feeding activity of a relatively larger length of tube. This
process is mainly used for the production of t joints or sections with end bulging .

82
Figure 21 Tube hydro forming.1 tube, 2 lower die, 3 upper die, 4 axial punch.[58]
2.2.1 Control Parameters
The important parameters in the tube hydroforming process are classified as
geometrical parameters, material parameters and process parameters. The geometrical
parameters refers to the initial geometry of the tube like tube length, initial thickness
required final thickness etc. The material parameters are required for determining the
failure mode and region in the tube. The typical material parameters considered here are
the ultimate tensile strength of material required, material anisotropy and strain hardening
exponent.
2.2.1.1 Geometrical Parameters
Length of tube – The length of the tube being used is used to determine the
maximum load that can be applied to the tube after which the various failure modes such
as wrinkling, buckling or bursting of the tube takes place. The critical load at which

83
failure due to buckling and wrinkling can take place is calculated as shown in the
equations (3.6) and (3.7) described in [62].
3 3
2cr
C Er tF
L
- (3.6)
24
3
t
WR
E tF
- (3.7) Where
Fcr – Critical load at which buckling of tube takes place
Fwr – Critical load at which wrinkling of tube takes place
E – Elastic modulus of material
t – Initial thickness of the material
L – Length of the tube
C – End conditions of the tube
Thickness of the tube – The thickness of the tube to be used is determined by the
final required thickness of the formed part. The relationship between the final thickness
and the initial thickness is defined by the relationship shown in equation (3.8) as
described in [63]. In a hydroforming process neither the stress ratio nor the inner radius
remains constant or uniform over the period of operation. Hence in the following
equation t1 refers to the instantaneous thickness of the part being formed.
0.5 0.5
1
1 1
1o or rt t
r r
- (3.8)
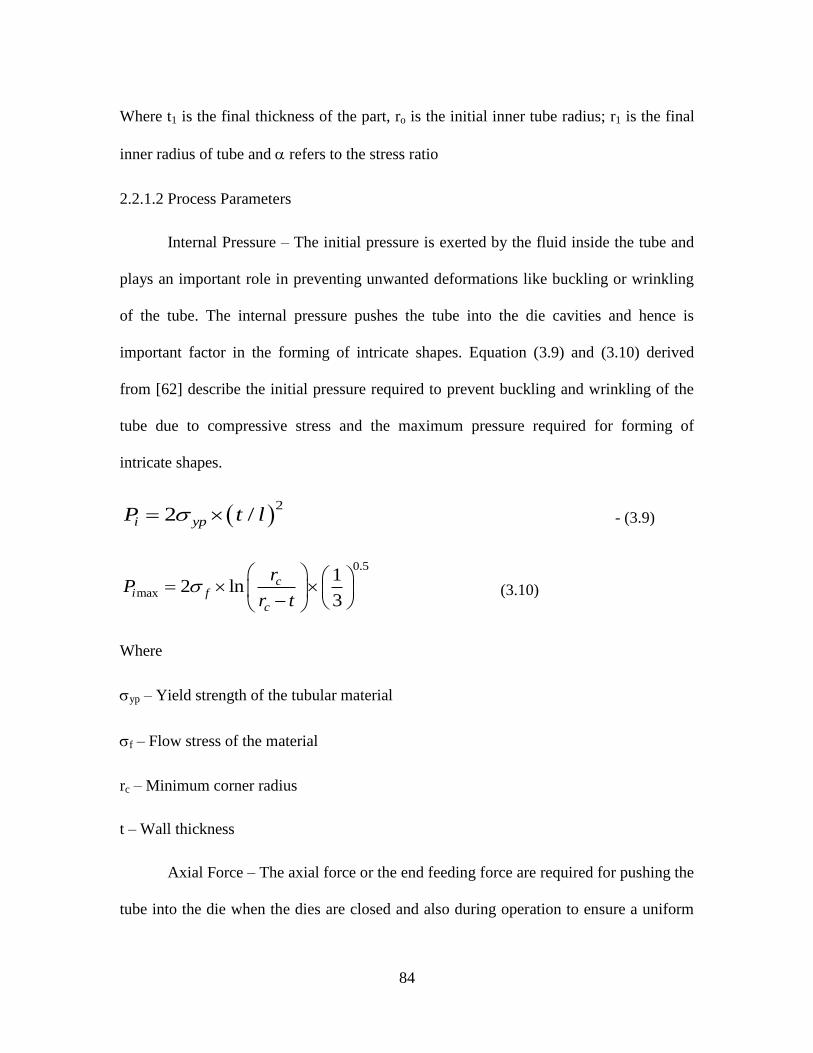
84
Where t1 is the final thickness of the part, ro is the initial inner tube radius; r1 is the final
inner radius of tube and refers to the stress ratio
2.2.1.2 Process Parameters
Internal Pressure – The initial pressure is exerted by the fluid inside the tube and
plays an important role in preventing unwanted deformations like buckling or wrinkling
of the tube. The internal pressure pushes the tube into the die cavities and hence is
important factor in the forming of intricate shapes. Equation (3.9) and (3.10) derived
from [62] describe the initial pressure required to prevent buckling and wrinkling of the
tube due to compressive stress and the maximum pressure required for forming of
intricate shapes.
2
2 /i ypP t l - (3.9)
0.5
max
12 ln
3
ci f
c
rP
r t
(3.10)
Where
yp – Yield strength of the tubular material
f – Flow stress of the material
rc – Minimum corner radius
t – Wall thickness
Axial Force – The axial force or the end feeding force are required for pushing the
tube into the die when the dies are closed and also during operation to ensure a uniform

85
elongation of the material under the action of internal pressure exerted by the action of
fluids inside the tube [59]. It also seals the tube and hence acting as a constraint on the
degree of freedom of the tube inside the tube. Equation (3.11) derived from [62] gives the
relationship between the axial force and internal pressure and final thickness of the part.
21 1 1 1 1 1( ) 2 2 ( 0.5 )a o o yp i a i zF R t R t P R d P R t t
- (3.11)
Where
Fa – Axial force
Ro – Initial outer median radius
R1 – Final outer median radius
- Coefficient of friction
4 Advantages and Disadvantages of Hydro Forming Process
Some of the main advantages of the hydro forming process are
1) Consolidation of parts - Many of the pieces that have to be stamped and then welded
together can be formed in a single step through hydro forming process. As can be
seen from figure 11 the number of components in a radiator assembly decreases on
using of hydro forming technology. It is because hydro forming allows the forming of
parts with varying cross section.
2) Weight reduction – Considering the same example as depicted in figure 11 the total
weight of hydro formed assembly was 10 kg while that of the stamped assembly was

86
14 kg. This is due to the less use of material due to better design enabled by having
closed sections of various profile and by removing flanges [42].
3) Lower tooling cost – As the number of tools used in the process is less the tooling
cost is also very low. For example there is no need for blank holder or female die in
sheet hydro forming. Also parts made from different materials can be made using the
same tool [17].
4) Improved structural strength and stiffness – Due to the effect of work hardening that
the materials undergo during tube preparation, pre bending and pre forming operation
the yield strength of the material changes [22].
5) Fewer secondary operations – As some of the operations can be simultaneously
performed, foe e.g punching of holes, hydro joining etc it reduces the number of
process required to produce a part [15].
6) Tight dimensional tolerance and lower springback - High pressure, low corner radius
and high friction allowed in obtaining high levels of plastic strain on top region of the
samples with subsequent reduction in springback levels [58].
Some of the disadvantages or shortcomings of the hydro forming process are
1) Slow cycle time – A typical hydro forming operation consists of preparing tubes, pre
bending and pre forming operations. The cycle time for a hydro forming process if
twice that of stamping process due to pre forming and calibration time. Displacing
large fluid volumes to open/close dies, moving the part in/out of tooling, filling and

87
pressurizing the tube are several factors that could bring about a reduction in cycle
time [17].
2) Suitable for small lot production – Since the tool life of pre bending tool is short
(approximately 40000 parts) it has to be replaced quite often for high volume of
production. As the bending tool is highly dedicated and has a high changeover time
this may cause problem in the throughput. Also increase in number of bend increases
the tooling cost [42].
3) Often additional attachments like stamped brackets to form an interface between the
hydro formed part and the rest of vehicle. Also there is an extra cost of welding this
attachment. One way of overcoming this is by designing integrated joining technique
in hydro forming process [15].
4) Stamping is often cost effective where a closed system can be manufactured from a
single pair of stamped parts. This often due to the fact that hydro forming is more
labor intensive due to process such as lubrication, bending and annealing [42].
Based on the study of the capabilities of these processes their application in the
manufacturing of a vehicle body structure will be discussed in the following chapter.

88
CHAPTER 4
APPLICATION OF ALTERNATIVE MANUFACTURING PROCESS IN
FORMIG OF VEHCLE BODY IN WHITE
Introduction
In this chapter the application of the alternative forming process of hydroforming
and superplastic forming in construction of some of the parts of vehicle body structure is
discussed. The vehicle considered here is has a Unibody structure with. The Bill of
Materials (BOM) was generated for the vehicle under consideration for identification of
the possible areas for the application of these forming processes. The main objective was
limited to the area of application of the forming process and did not include the cost
saving as the process are relatively new and the data required for the purpose of cost
modeling was scarce.
The BOM generated suggests the alternative manufacturing process, loading
characteristics and the material to be used. The alternative manufacturing process and the
appropriate material for the considered part was determined based on the part function,
loading characteristics and part complexity.
The entire body structure of the vehicle was classified into five major components as
1) Underbody
2) Roof
3) Front module
4) Body side frame

89
5) Body rear
1 Underbody
The underbody of the car is often used as the platform on which the entire Body In
White (BIW) is assembled on. The underbody of the car can also be used a common
platform while constructing different vehicles in case of a globalised platform. The main
requirements of an underbody as described in [64] are
1) Provide a dimensionally stable base on which the entire body can be built upon
2) Provides support for the occupants and the mounting of interior components
3) Provides a base for the mounting of suspension and other components
4) It must therefore possess a good body stiffness
An underbody is typically a class C surface with requirement of good stiffness and
excellent crash characteristic with no crumple zones. A typical underbody is shown in
figure 22.

90
Figure 22 Underbody [65]
The construction of underbody consists of 14 hydroforming process and SPF
process and predominantly makes use of aluminum as the primary material. Some of the
parts considered along with their original and suggested manufacturing process are
shown in table 39. The table also suggests the appropriate material that could be used
along with the mentioned process.
Table 39 Alternative manufacturing process for vehicle underbody

91
Here a conscious effort was made to reduce the number of SPF operations as it is
relatively time consuming and since the underbody of the vehicle doesn‟t need any class
A surface. Also the use of hydroforming process would impart better strain hardening
characteristic to the parts being formed and hence providing the required stiffness. The
using of hydroforming process helps in the use of aluminum as the primary material and
also possibly reduces the gauge thickness required as compared to a conventional
stamping process where in the use of aluminum as primary material would have been
hindered due to the complexity of operation and an increase in gauge thickness of the
material being used.
2 Roof
The roof of a vehicle is one of the primary factors adding to the aesthetic value of the
vehicle. Some of the functions of the roof in a vehicle structure include from [64] are
1) Protect the occupants of the car from natural elements
2) Maintain dimensional accuracy of the vehicle structure
3) Contribute to the vehicle performance
As can be seen from figure 23 the roof of the vehicle under consideration seven major
components with component 1 being a class A surface. Also the roof tops are not
subjected to relatively heavy loading as compared with that of other parts of the body
structure which enables the use of lighter materials such as magnesium. Here the roof
panel is formed through superplastic forming as it is class A surface which requires a
superior surface finish and this also enables the use of lightweight material magnesium.
The other components that provide reinforcements to the roof panel are formed through

92
hydroforming process as these materials need to possess sufficient strength and stiffness
to support the roof panel. Some of the major components considered and their suggested
alternatives are shown in table 40.
Figure 23 Roof panel [65]
Table 40 Alternatives for vehicle roof

93
Aluminum has been suggested for some of the parts described in the table like
upper apron, roof bow and rear window frame upper part due to the process constraints in
spite of the potential for the use of magnesium. This is because hydroforming of
magnesium is still at theoretical level. Here the required stiffness is provided by the left
and right apron reinforcement which is formed using hydroforming process.
3 Front Module
The main functions of the front module of the vehicle as described in [64] are
1) To provide a suitable base for the mounting of parts like engine, radiator and
other systems
2) To act as absorption zones in the event of frontal collision and make sure that the
crash energy is not transferred to the body side frames and floor.
3) To act as a barrier for the transfer of noise, vibration and other outputs of
combustion process from reaching the body interior.
4) To absorb load from the frontal suspension.
5) To support the dash panel and other interior elements housed by the dash panel
a)

94
b)
c)

95
d)
Figure 24 a) Wheel housing/ engine support b) Splash wall parts c) Front body bracket
left/ right d) Front side panel [65]
The front module construction consists of predominantly hydroforming process as
most of the part are subjected to continuous loading and also as the parts form a class C
or class B surface. The SPF process is used for the forming of splash wall, lower apron
and front wall as these parts are not subjected to continuous heavy loading and present a
feasible opportunity for weight reduction. Hence to use magnesium as the primary
material for the purpose of weight reduction SPF was used. SPF was also used for the
forming of front side panel shown by component 1 in figure 25d. Here SPF was used as
this was a class A surface which required a very good surface finish and also as it was not
subjugated to continuous heavy loads magnesium was used as primary material here.

96
The front body bracket as shown in the figure 24c formed purely by hydroforming
process as it provides the mount for engine, radiator and other systems. The tables 41, 42,
43 &44 gives details of the parts considered and suggested alternatives.
Table 41 Front side panel
Table 42 Wheel house engine support

97
Table 43 Splash wall parts
Table 44 Front body bracket left

98
4 Body Side Panel
The main functions of the body side panel as described in [64] are to
1) To provide required stiffness
2) To possess the required collision characteristics for both side and frontal collision
3) To provide a rigid base for the mounting of roof module.
4) To provide the aperture for mounting of doors and other needed closures.
The body side panel is essentially a class A surface and subjected to load bearing
through the roof module. The body side panel considered is shown in figure 25. The body
side panel acts as an intermediate connection between the front module and the body rear
of a vehicle body structure. It also acts as the intermediate between the underbody and the
roof module.
Figure 25 Body side frame [65]
The roof module is supported by the body side pillar which consist of the
reinforcement structures of pillar A,B &C. these pillars add strength to the body structure
and play an important role in the design and assembly of door closures.

99
The construction of body side frame consists predominantly of superplastic
forming process using aluminum as the primary material. Magnesium is not used as the
body side frame is subjected to continuous load as it supports the roof module.
The use of SPF enables the consolidation of many parts in the body side frame.
Figure 26 Single components of body side frame [65]
From figure 26 depicted above we can see that the component 1 representing the
interior side frame consists of two parts 2 and 3 which are c pillar reinforcement and
cover panel for wheel house. With the creation of the complex die there is a possibility
for the manufacturing of this part in a single SPF operation producing a near net shape.
The drawback in this type of part consolidation is that as the size of apertures are too
large this may lead to a huge scrap generation thereby increasing the cost of the
production process. Hence it is much more feasible to produce part 1 as a single part

100
instead of producing the entire side frame as one part. The parts considered and their
suggested method of manufacturing are depicted in table 45 &46
Table 45 Body side frame
Table 46 Body side frame single components

101
5 Body Rear
The body rear consists of trunk floor, floor parts rear and tail trim. This also includes
the closures like deck lid. These are represented in figure 27.
a)
b)

102
c)
Figure 27 Body rear a) Trunk Floor b) Floor parts rear c) Tail trim [65]
The main functions of the body rear as described in [64] are
1) To possess the required stiffness for maintaining the stability of the structure on
the whole
2) To absorb energy in case of rear collision and prevent the transfer of collision
energy to the body interior
3) To provide for the mounting of rear axle and other systems
4) To provide mounting for exterior and interior trim
5) To provide for mounting of fuel tank
The construction of body rear consists predominantly hydroforming operation as most
of the parts are subjected to loads and they also fall under the category of class B or class
C surface. SPF is used for the construction of class A surface such as the rear side panels
and closures like deck lid. From the figure 27 c SPF is used for the forming of component
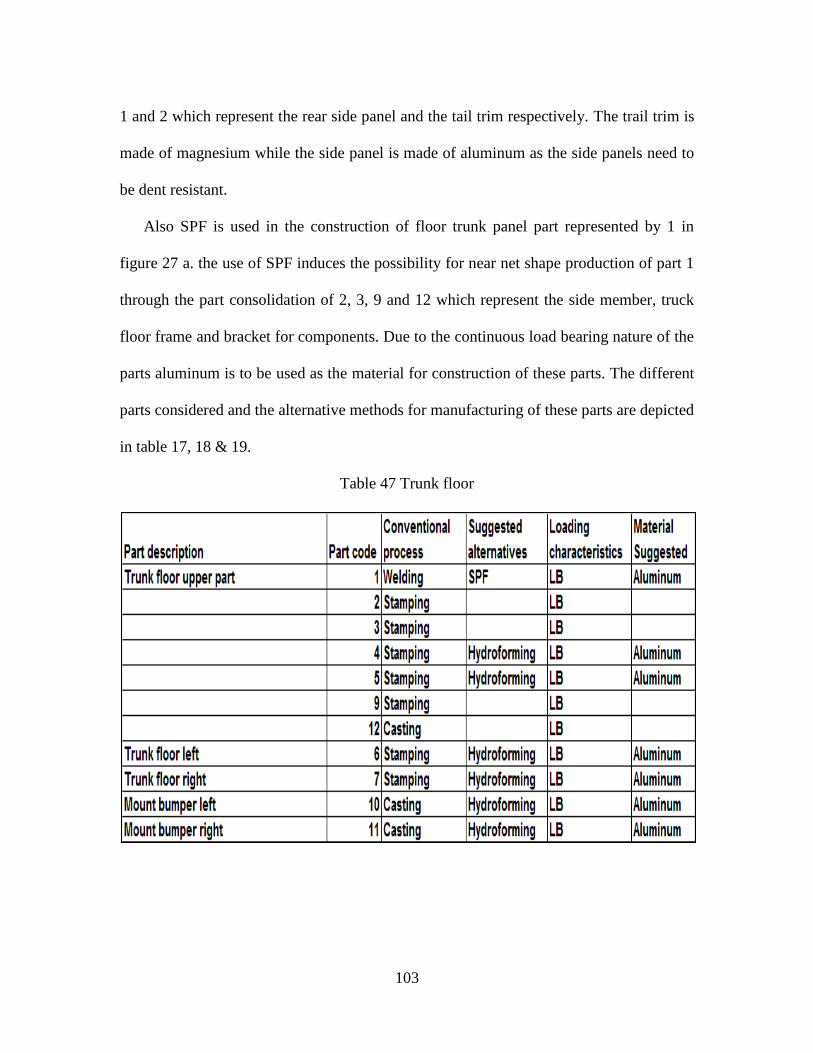
103
1 and 2 which represent the rear side panel and the tail trim respectively. The trail trim is
made of magnesium while the side panel is made of aluminum as the side panels need to
be dent resistant.
Also SPF is used in the construction of floor trunk panel part represented by 1 in
figure 27 a. the use of SPF induces the possibility for near net shape production of part 1
through the part consolidation of 2, 3, 9 and 12 which represent the side member, truck
floor frame and bracket for components. Due to the continuous load bearing nature of the
parts aluminum is to be used as the material for construction of these parts. The different
parts considered and the alternative methods for manufacturing of these parts are depicted
in table 17, 18 & 19.
Table 47 Trunk floor

104
Table 48 Floor parts rear
Table 49 Tail trim

105
CHAPTER 5
CONTRIBUTION AND FUTURE WORK
Contribution
The main objective of the work carried out was to study and suggest ways for
reducing the mass of total vehicle body through alternative forming process that had the
potential to replace the conventional press working process used in manufacturing of
vehicle body structure. The most appropriate alternative manufacturing processes were
determined through the use of AHP tool as described in chapter 2. The AHP was used for
the pairwise comparison and judgment of the different attributes and alternatives
considered. From the result obtained from the use of AHP tool literature review
regarding the capabilities of the processes was done as documented in chapter 3. Here the
relationships between the various process parameters were studied and their importance
with respect to the manufacturing parameters such as cycle time, material selection and
system engineering were valued. A bill of material was created depicting the important
components of a body in white along with the conventional manufacturing process and
loading characteristics. The alternative to the conventional manufacturing process were
then suggested along with the appropriate material that could be used with respect to the
corresponding process to achieve the objective of light weighting.
Future Work
The current BOM suggests the alternative forming process with the suitable
material to be used for achieving a relatively lighter BIW. The BOM could be expanded
to incorporate the different joining techniques to follow the forming process which would

106
then be followed by an appropriate painting sequence. The inclusion of these processes
would enable the use of cost modeling tools to determine a near net cost of production of
the BIW. Due to the process limitation other suitable materials like composite matrix
were not considered which would have required out of line production process.
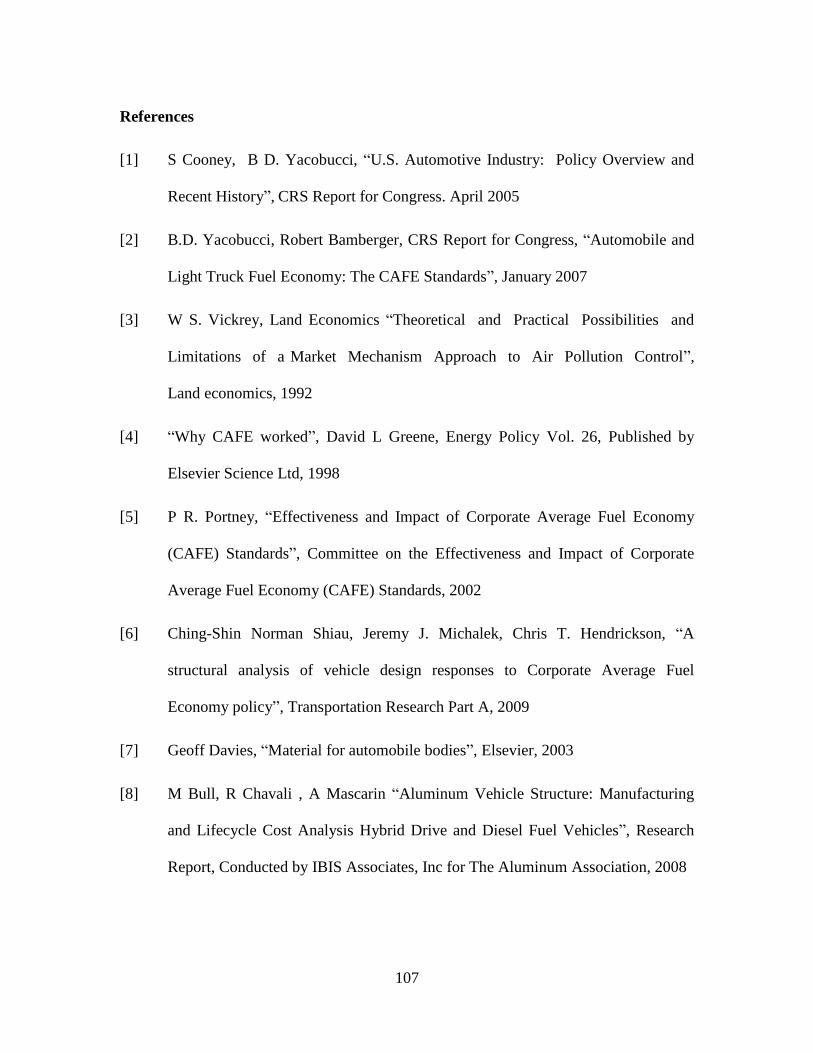
107
References
[1] S Cooney, B D. Yacobucci, “U.S. Automotive Industry: Policy Overview and
Recent History”, CRS Report for Congress. April 2005
[2] B.D. Yacobucci, Robert Bamberger, CRS Report for Congress, “Automobile and
Light Truck Fuel Economy: The CAFE Standards”, January 2007
[3] W S. Vickrey, Land Economics “Theoretical and Practical Possibilities and
Limitations of a Market Mechanism Approach to Air Pollution Control”,
Land economics, 1992
[4] “Why CAFE worked”, David L Greene, Energy Policy Vol. 26, Published by
Elsevier Science Ltd, 1998
[5] P R. Portney, “Effectiveness and Impact of Corporate Average Fuel Economy
(CAFE) Standards”, Committee on the Effectiveness and Impact of Corporate
Average Fuel Economy (CAFE) Standards, 2002
[6] Ching-Shin Norman Shiau, Jeremy J. Michalek, Chris T. Hendrickson, “A
structural analysis of vehicle design responses to Corporate Average Fuel
Economy policy”, Transportation Research Part A, 2009
[7] Geoff Davies, “Material for automobile bodies”, Elsevier, 2003
[8] M Bull, R Chavali , A Mascarin “Aluminum Vehicle Structure: Manufacturing
and Lifecycle Cost Analysis Hybrid Drive and Diesel Fuel Vehicles”, Research
Report, Conducted by IBIS Associates, Inc for The Aluminum Association, 2008

108
[9] Dr M.A Omar, “Anatomy of an Automobile, Material”, Advanced materials for
automotive application, CU-ICAR, 2009
[10] C J. Kahane, “Effect of car size on the frequency and severity of rollover
crashes”, In: 13th E.S.V. Conference, NHTSA, 1991
[11] C. J Kahane, “Vehicle Weight, Fatality Risk and Crash Compatibility of
Model Year 1985-93 Passenger Cars and Light Trucks”, U.S. Department of
Transportation, NHTSA Technical Report, 1997
[12] American Chemistry Council “New auto safety research evaluates impact of size
and weight on accidents. Lighter/large vehicles can decrease fatalities, contrary to
common belief”,
[13] M Saito, S Iwatsuki, K Yasunaga, K Andoh, “Development of aluminum body
for the most fuel efficient vehicle” ,JSAE Review 21 (2000) 511 516, 2000
[14] M. Marré, M. Ruhstorfer, A.E. Tekkaya, M.F. Zaeh, “Manufacturing Of
Lightweight Frame Structures By Innovative Joining By Forming Processes”, Int
J Mater Form (2009) Vol. 2, Springer/ESAFORM, 2009
[15] R. Neugebauer, R. Mauermann, R. Grützner, “Hydrojoining”, Int J Mater Form,
Springer/ESAFORM, 2008
[16] “Automotive Steel Design Manual”, American Iron and Steel Institute &
Auto/Steel Partnership, 2002
[17] S.H. Zhang, “Developments In Hydroforming”, Journal Of Materials Processing
Technology 91, Elsevier, 1999

109
[18] Brandon M. Hance, “Work Hardening Behavior of Advanced High Strength
Steels”, Guest Lecturer for AuE 868 CU-ICAR, 2008
[19] “Ultra Light Steel Auto Body Stretches the Limits of Hydroformed Tube
Technology”, American Iron and Steel Institute
[20] Brian Cantor, Patrick Grant, Colin Johnston,“Automotive Engineering,
lightweight functional and novel materials”, Published By Taylor And Francis
Group, 2007
[21] S.G. Luckey, S. Subramanian, C. Young, and P.A. Friedman ,“Technical and Cost
Study of Superplastic Forming of a Lightweight Aluminum Door Structure”,
JMEPEG 16, ASM International, 2007
[22] M. Tolazzi, “Hydroforming Applications In Automotive: A Review”, Int J Mater
Form Vol. 3, Springer-Verlag France, 2010
[23] M K Kulekci, “Magnesium and its alloys applications in automotive industry”, Int
Journal Advanced Manufacturing Technology 39, Springer-Verlag London
Limited, 2007
[24] M.K. Khraisheh, F.K. Abu-Farha, K.J. Weinmann, “Investigation of Post-
Superplastic Forming Properties of AZ31 Magnesium Alloy”, Annals of the CIRP
Vol. 56, Elsevier, 2007
[25] W.J. Kima, J.D. Park, U.S. Yoon, “Superplasticity and Superplastic Forming Of
Mg–Al–Zn Alloy Sheets Fabricated By Strip Casting Method”, Journal of Alloys
and Compounds 464, Elsevier, 2007

110
[26] “The Development Of A New Manufacturing Route For Superplastic Magnesium
Alloy Sheet Exploiting Twin Roll Casting”, R Dashwood, M Jackson, D
Klaumünzer, Z Fan, R Grimes, 6th
EUROSPF Conference, 2008
[27] http://www.magnesium-technologies.com
[28] T. Saaty, “How to make a decision: The Analytic Hierarchy Process”,
European Journal of Operational Research 48, Elsevier Science Publishers,
1990
[29] S Sipahi And M Timor, “The Analytic Hierarchy Process And Analytic Network
Process: An Overview Of Applications”, Emeraldinsight, 2009
[30] A Armillotta, “Selection of layered manufacturing techniques by an adaptive
AHP decision model”, Robotics and Computer-Integrated Manufacturing 24,
Elsevier, 2008
[31] A. Hambali, S. M. Sapuan, N. Ismail, Y.Nukman, “Material Selection Of
Polymeric Composite Automotive Bumper Beam Using Analytical Hierarchy
Process”, J. Cent. South Univ. Technology 17, Springer, 2010
[32] C.W Chang, C.R Wu, C.T Lin, H.C Chen, “An Application Of AHP And
Sensitivity Analysis For Selecting The Best Slicing Machine”, Computers &
Industrial Engineering 52, Elsevier, 2007
[33] M.K Tiwari, and R.Banerjee “A Decision Support System for the Selection of a
Casting Process Using Analytic Hierarchy Process”, Production Planning &
Control 12, 2001

111
[34] O. Bayazit, “Use Of AHP In Decision-Making for Flexible Manufacturing
Systems”, JMTM 16, Emeraldinsight, 2004
[35] Patrick T. Harker and L G. Vargas, “The Theory Of Ratio Scale Estimation:
Saaty‟s Analytic Hierarchy Process”, Management Science Vol. 33, Informs,
1987
[36] T L. Saaty, H.S Shih, “Structures in decision making: On the subjective geometry
of hierarchies and networks”, European Journal of Operational Research 199,
Elsevier, 2009
[37] T L. Saaty, “The Fundamentals of Decision Making and Priority Theory with the
Analytic Hierarchy Process”, Vol. VI, AHP Series, RWS Publ., 2000 (revised).
[38] T L. Saaty, “Relative Measurement And Its Generalization In Decision Making
Why Pairwise Comparisons Are Central In Mathematics For The Measurement
Of Intangible Factors The Analytic Hierarchy/Network Process”, Estadística E
Investigación Operativa / Statistics And Operations Research VOL. 102 (2),
RACSAM, 2008
[39] G Coyle: “The Analytic Hierarchy Process (AHP)”, Open Access Material. AHP,
Pearson Education Limited 2004
[40] T L. Saaty, “Rank from Comparisons and From Ratings In The Analytic
Hierarchy/Network Processes”, European Journal Of Operational Research 168,
Elsevier, 2006

112
[41] H Thiruvengadam, “Analysis of Part Consolidation Techniques for Automotive
BIW Panels Based On Advanced Sheet Metal Forming Technologies”, Clemson
University, SC, 2010
[42] B Constantine, R Roth, and J P. Clark, “Substituting Tube-Hydroformed Parts for
Automotive Stampings: An Economic Model”, Automotive Material Economics,
2001
[43] G. Pahl And W. Beitz, J. Feldhusen And K.-H. Grote, “Engineering Design A
Systematic Approach”, 3rd
Edition, Springer, 2007
[44] „Light Weight SUV Frame Design Development”, Altair Engineering Report,
2003
[45] R.S Lee, Y.M Chen, H Y Cheng and M.D Kuo, “A Framework Of
A Concurrent Process Planning System For Mold Manufacturing” Computer
Integrated Manufacturing Systems Volume 11, 1998
[46] P.A. Friedman, S.G. Luckey, W.B. Copple, R. Allor, C.E. Miller, and C. Young,
“Overview of Superplastic Forming Research at Ford Motor Company”,
JMEPEG 13, ASM Int, 2004
[47] Y Koren, U Heisel, F Jovane, T Moriwaki, G Pritschow, G Ulsoy, H. V Brussel,
“Reconfigurable Manufacturing System”, Annals Of CIRP Vol 48, 1999
[48] M. F. Thompson, “Effects Of Laboratory Rolling Conditions On Continuously
Cast AA5083”, Naval Post Graduate School, Monterey, California, 2007

113
[49] M Mabuchi and K Higashi, “The Processing, Properties, and Applications of
High-Strain-Rate Superplastic Materials”, JOM, 1998
[50] “Application of Superplasticity in Commercial Magnesium Alloy For Fabrication
Of Structural Components”, T Mukai, H Watanabe And K Higashi, Material
Science And Technology Vol 16, 2000
[51] “Deformation Mechanisms In Superplastic AA5083 Materials”, M.A Kulas, W. P
Green, E.M. Taleff, P.E. Krajewski, And T.R. Mcnelley, Metallurgical And
Materials Transactions A Vol 36A, 2005
[52] K. Seigert, T Werle, “Physical Mechanism Of Superplasticity”,TALAT Lecture
3802, Stuttgart University
[53] G Giuliano, “Analysis Of Forming Limit Diagram For Superplastic Materials”,
Int Journal Adv Manufacturing Technology 31, 2006
[54] R. Boissiere, S. Terzi, J.J. Blandin, L. Salvo, “Quick-Plastic forming: similarities
and differences with Super-Plastic forming”, 6th
EUROSPF Conference, 2008
[55] J. G. Schroth, H.M. Brueggeman, and N. P. Grewal, “Quick Plastically Formed
Aluminum Doors: Design and Performance”, JMEPEG 16, ASM Intl, 2007
[56] S.S. Woo, Y.R. Kim, D.H. Shin And W.J. Kim, “Efflects Of Mg Concentration
On The Quasi- Superplasticity Of Coarse-Grained Al-Mg Alloys”, Scripta
Materialia Vol. 37, Elsevier, 1997
[57] P.E Krajewsik, J.G Schroth, “Overview of Quick Plastic Forming Process
Technology”, Material Science Forum Vol 552, Trans Tech Publication, 2007

114
[59] H Singh, “Fundamentals of Hydroforming”, Society of Manufacturing Engineers,
2003
[60] A. A Kumar, S Satapathy, and D.Kumar, “Effect of Sheet Thickness and Punch
Roughness on Formability of Sheets in Hydromechanical Deep Drawing”,
JMEPEG, ASM Int, 2010
[61] T. Khandeparkar, M. Liewald, “Hydromechanical deep drawing of cups with
stepped geometries” Journal of materials processing technology 202, Elsevier,
2008
[62] M Koc, T Altan, “Prediction of forming limits and parameters in the tube
hydroforming process”,International Journal of Machine Tools & Manufacture
42, Elsevier, 2002
[63] B Li, D.R Metzger, T.J Nye, “Reliability Analysis Of The Tube Hydroforming
Process Based On Forming Limit Diagram”, Journal Of Pressure Vessel
Technology Vol 128, ASME, 2006
[64] “An Assessment of Mass Reduction Opportunities for a 2017 – 2020 Model Year
Vehicle Program”, Lotus Engineering Inc., 2010
[65] www.RealOEM.com