analysis and interpretation of data -...
TRANSCRIPT

Chapter 5
ANALYSIS AND INTERPRETATION OF DATA
5.1 Summary of Different Analysis Carried Out
5.2 Achievement in Biology of Secondary School Students in Experimental
and Control Groups
5.3 Comparison of Achievement in Biology of Secondary School Students
in Experimental and Control Groups
5.4 Genuineness of the Difference in Achievement
5.5 Comparison of the Effectiveness of MIA and CMDI on the Total
Achievement in Biology of Experimental and Control Groups
5.6 Comparison of the Effectiveness of MIA and CMDI on the
Achievement in Biology of Different Objectives of Cognitive Domain
in Experimental and Control Groups
5.7 Comparison of the Effectiveness of MIA and CMDI on the
Achievement in Biology of Students in Experimental and Control
Groups having different Learning Styles
5.8 Comparison of the Effectiveness of MIA on the Achievement in Biology
of Students in Experimental Group having different Learning Styles
5.9 Comparison of the Effectiveness of MIA on the Achievement in Biology
of Students in Experimental Group having different Levels of MI

Analysis and Interpretation of Data 169
ANALYSIS AND INTERPRETATION OF DATA
The analysis and interpretation of data represent the application of
deductive and inductive logic to the research process. Analysis of data involves a
number of closely related operations that are performed with the purpose of
summarizing the collected data and organizing these in such a manner that they
will yield answers to the research questions.
The purpose of analysis is to build up an intellectual model that explains
the relationship between different variables. The analyzed data is then synthesized
in such a way that hypotheses may be accepted or rejected.
The major objective of this investigation was to ascertain the relative
effectiveness of MIA and CMDI on the achievement in biology of secondary school
students. Hence the investigator adopted experimental method with the Pre-test Post-test
- Non-Equivalent groups Design where there was one experimental group and one control
group. The experimental group was taught through MIA and the control group was taught
through CMDI.
Six divisions of standard X students of three schools from three districts of
Kerala were selected for the study. De Paul Higher Secondary School,
Thodupuzha, Idukki, Kuriakose Elias Higehr Secondary School, Mannanam,
Kottayam and Mother Theresa H.S.S. Muhamma, Alappuzha were the selected
schools. Thus the sample consisted of 188 students from all the above three
schools in which 94 students were in each experimental and control groups.

Analysis and Interpretation of Data 170
The investigator prepared and standardized an achievement test in biology
and the same was used as both pre-test and post-test to measure the achievement
of students before and after the experiment. The experimental group was taught
through MIA on the basis of lesson transcripts prepared by the investigator and the
control group was taught through CMDI. During the time of experiment the
investigator administered all the other tools such as Multiple Intelligence Inventory
which is prepared and standardized by the investigator and Kolb’s Learning Style
Inventory in both the experimental and control groups. Then the post-test was
given to two groups. The difference between the pre and post-test scores of
experimental and control groups were compared with the help of appropriate
statistical techniques to ascertain the relative effectiveness of MIA and CMDI on
the achievement in biology of secondary school students.
The data pertaining to the experimental and control groups were subjected
to the following statistical analysis:
1) Classification and tabulation of scores
2) Calculation of Measures of Central tendency, Dispersion, Skewness and
Kurtosis
3) Test of significance of the difference between the means
4) Analysis of variance
5) Analysis of Co variance and
6) Bonferroni test
5.1 Summary of Different Analysis Carried Out
Different analysis carried out for the present study were

Analysis and Interpretation of Data 171
1. Total achievement in biology of secondary school students
a) Before Experiment
b) After Experiment
c) Gain in Achievement
2. Comparison of the total achievement in biology of secondary school
students in experimental and control groups
a) Before Experiment
b) After Experiment
c) Gain in Achievement
3. Comparison of the effectiveness of MIA and CMDI on the total
achievement in biology of secondary school students.
Experimental group versus Control group
4. Comparison of the effectiveness of MIA and CMDI on the achievement in
biology of secondary school students in different objectives of Cognitive
domain such as
a) Remembering,
b) Understanding,
c) Applying,
d) Analyzing,
e) Evaluating and
f) Creating.

Analysis and Interpretation of Data 172
5. Comparison of the effectiveness of MIA and CMDI on the achievement in
biology of secondary school students having different Learning styles such
as
a) Diverging style,
b) Assimilating style,
c) Accommodating style and
d) Converging style.
6. Comparison of the effectiveness of MIA on the achievement in biology of
experimental group students having different learning styles such as
a) Diverging style,
b) Assimilating style,
c) Accommodating style and
d) Converging style.
7. Comparison of the effectiveness of MIA on the achievement in biology of
experimental group students having different levels of MI such as
a) Verbal /linguistic,
b) Logical /Mathematical,
c) Visual / Spatial,
d) Bodily/Kinaesthetic,
e) Musical/ Rhythmical

Analysis and Interpretation of Data 173
f) Interpersonal,
g) Intrapersonal and
h) Naturalistic.
5.2. Achievement in Biology of Secondary School Students in Experimental and
Control Groups
5.2.1. Before Experiment
The pre-test scores obtained by secondary school students in the
experimental and control groups were condensed into frequency tables and then
calculated the Arithmetic Mean, Median, Mode, Standard Deviation, Skewness and
Kurtosis in order to get a general picture. The values of various statistics calculated
are given in Table 5.1.
TABLE 5.1
Measures of Central Tendency and Dispersion of Pre-test Scores of
Experimental and Control Groups
Values Obtained Statistics Calculated Experimental Group Control Group
Mean 2.85
2.82
Median 3.00
3.00
Mode 3.00
3.00
Standard Deviation 1.00
1.06
Skewness 0.696
0.539
Kurtosis 0.429
0.174

Analysis and Interpretation of Data 174
The test carried a maximum weightage of 40 marks. The calculated values
of the three most commonly used measures of central tendency mean, median and
mode are below four. This indicates that students in experimental and control
groups had only limited knowledge on the topic to be taught.
The arithmetic mean scores obtained for the experimental and control
groups are 2.85, and 2.82 respectively. The absolute difference in arithmetic mean
scores of experimental and control groups is 0.03. This value shows that the two
groups had almost same previous knowledge on the topic.
The median value of both experimental and the control groups is three.
From this value it is inferred that only 50% of the students in these groups have
scored above this value. This also shows that the two groups did not differ very
much in their scores in pre-test.
The mode value obtained for the experimental and control group is three.
This value too shows that the typical scores are below four. The details are shown
in Figure 5.1.

Analysis and Interpretation of Data 175
2.852.82
3 3 3 3
2.7
2.75
2.8
2.85
2.9
2.95
3
Mean Median Mode
ExperimentalgroupControl Group
Figure 5.1 Measures of Central Tendency of Pre-Test Scores of
Experimental and Control Groups
The values of standard deviation of experimental group (Ex. gr.) and control
group (Con. gr.) (S.D. for Ex. gr. = 1.00 and Con. gr. = 1.06) too show that there is
only very small variations in the pre-test scores of students in both groups from
the average.
The values of skewness obtained for experimental and control groups are
0.696 and 0.539 respectively. These values show that the scores were positively
skewed in experimental and control groups and more individuals scored less than
the average score of their group.

Analysis and Interpretation of Data 176
The value of kurtosis for the experimental and control groups are 0.429,
and 0.174 respectively. Since the value of kurtosis is greater than 0.263 in the
experimental group, it can be inferred that the distribution is platykurtic and the
value is lesser than 0.263 in the control group, it can be inferred that the
distribution is leptokurtic i.e., the frequency distributions are more peaked than the
normal.
5.2.2. After Experiment
The post-test scores obtained by students in the experimental and control
groups were condensed into frequency tables and then calculated the various
measures of central tendency and dispersion. The values of statistics calculated are
given in Table 5.2.
TABLE 5.2
Measures of Central Tendency and Dispersion of Post-test Scores of
Experimental and Control Groups
Values Obtained Statistics Calculated Experimental Group Control Group
Mean 29.96
17.91
Median 28.50
17.00
Mode 26.00
17.00
Standard Deviation 5.48
4.17
Skewness 0.170
0.508
Kurtosis -1.308
-0.694

Analysis and Interpretation of Data 177
The mean, median and mode values of experimental group are 29.96, 28.50 and
26.00 and that of control group are 17.91, 17.00, and 17.00. These values clearly show
that MIA had significant impact on the achievement in the post-test. The details are
shown in Figure 5.2.
29.96
28.5
26
17.91
17 17
0
5
10
15
20
25
30
35
experimental group control group
Mean
Median
Mode
FIGURE 5.2 Measures of Central Tendency of Post-Test Scores of
Experimental and Control Groups
The values of standard deviation 5.48 and 4.17 respectively of experimental
and control groups show that the scores do not vary much from the average.
The values of skewness obtained for experimental and control groups are
0.170, and 0.508 respectively. These values showed that the scores were positively

Analysis and Interpretation of Data 178
skewed in experimental and control groups and more individuals scored less than
the average score of their group.
The values of kurtosis -1.308, and -0.694 respectively of the experimental
and control groups show that the distributions are leptokurtic i.e., the frequency
distributions are more peaked than normal.
5.2.3 Gain in Achievement
The difference between the pre-test and post-test scores of students in
experimental and control groups were condensed into frequency tables. The
measures of central tendency and dispersion of the scores were computed in order
to get a general picture of the gain in achievement of the two groups. The results
are given in Table 5.3.
TABLE 5.3
Measures of Central Tendency and Dispersion of Gain Scores of
Experimental and Control Groups
Values Obtained Statistics Calculated
Experimental Group Control Group
Mean 27.14
15.10
Median 26.00
14.00
Mode 23
13
Standard Deviation 5.54
4.23
Skewness 0.166
0.442
Kurtosis -1.246
- 0.652

Analysis and Interpretation of Data 179
A careful observation of the table makes it clear that the values of measures
of central tendency decreases as one moves from experimental group to control
group. This regular gradation in value indicates the superiority of experimental
group over control group. The details are shown in Figure 5.3.
27.14 26
23
15.1
14
13
0
5
10
15
20
25
30
experimental group control group
Mean
Median
Mode
FIGURE 5.3 Measures of Central Tendency of Gain Scores of Experimental
and Control Groups

Analysis and Interpretation of Data 180
The moderate values of standard deviation (S.D. for Ex.gr. = 5.54, and Con.gr.
= 4.23) showed that there were only small variations in the achievement of students
from the mean value.
The values of skewness of the experimental and control groups were 0.166
and 0.442 respectively. These values showed that the scores were positively
skewed in experimental and control groups and more individuals scored less than
the average score for their group. The values of kurtosis for the experimental and
control groups are -1.246 and - 0.652 respectively which are less than 0.263.
Therefore it can be inferred that the distribution of scores in both the groups is
leptokurtic, i.e., the frequency distribution is peaked than the normal.
5.3. Comparison of Achievement in Biology of Secondary School Students in
Experimental and Control Groups
To ascertain the relative effectiveness of MIA and CMDI on the
achievement in biology of secondary school students, the investigator compared
the total achievement of the experimental and control groups. For this the mean
pre-test scores, mean post-test scores and mean gain scores were computed before
and after the experiment and subjected to analysis of Critical ratio.
5.3.1 Before experiment.
Before starting the experiment, the achievement of students in experimental
group was compared with achievement of students in the control group. This was
done by testing the significance of difference between means of pre-test scores of
experimental and control groups. Data and result of test of significance are given in
Table 5.4.

Analysis and Interpretation of Data 181
TABLE 5.4
Data and Result of Test of Significance of the Difference between the Mean
Pre-test Scores of Experimental and Control Groups
Group No. of Students Mean Standard
Deviation Critical Ratio
Level of Significance
Experimental Group 94 2.85 1.00
Control Group 94 2.82 1.06
0.212 P>0.05
The Critical ratio obtained (CR = 0.212 P> 0.05) is not significant even at
0.05 level. This showed that there is no significant difference between the means of
the pre-test scores of students in experimental and control groups. The above
observation made clear that the two groups did not differ significantly in their
academic achievement before the experiment. Thus it can be interpreted that before
subjecting to the instructional strategies, the two groups were more or less
equivalent with reference to the previous knowledge.
5.3.2 After experiment.
After the experiment, the achievement of the students in the experimental
and control groups were compared by testing the significance of difference
between the means of the post-test scores of the two groups. The data and result of
significance are given in Table 5.5.

Analysis and Interpretation of Data 182
TABLE 5.5
Data and Result of Test of Significance of the Difference between the Mean
Post-test Scores of Experimental and Control Groups
Group No. of Students Mean Standard
Deviation Critical Ratio
Level of Significance
Experimental Group 94 29.96 5.48
Control Group 94 17.91 4.17
16.972 P<0.01
The obtained value of Critical ratio is highly significant (CR =16.972; P<
0.01). This means that there is significant difference between the means of the
post-test scores of the students in experimental and control groups. Since the mean
of the post-test scores of the experimental group is greater than that of the control
group, the students in the experimental group is superior to the students in the
control group in their academic achievement. So then, it is tentatively interpreted
that the MIA is much superior to CMDI with respect to pupil’s academic
achievement.
5.3.3 Gain in achievement.
The gain in achievement of students in both groups was compared by
testing the significance of the difference between means of the gain scores of the
two groups. For this critical ratio was found out and tested for significance. The
data and results of the test of significance are given in Table 5.6.

Analysis and Interpretation of Data 183
TABLE 5.6
Data and Result of Test of Significance of the Difference between the Mean
Gain Scores of Experimental and Control Groups
Group No. of Students Mean Standard
Deviation Critical Ratio
Level of Significance
Experimental Group 94 27.14 5.54
Control Group 94 15.10 4.23
16.764 P<0.01
The obtained value of Critical ratio (CR =16.764; P <0.01) is significant
even at 0.01 level. This significant difference between the means of gain scores of
students in experimental and control groups shows that the two groups differ
significantly in their academic achievement. The higher gain scores of the
experimental group when compared to control group indicate that the experimental
group is superior to the control group on the achievement in biology.
Since experimental and control groups selected for the present study were intact
class room groups which were not equated for intelligence, socio-economic status etc. of
the students, it is only tentatively interpreted that MIA is more effective than CMDI.
The details of comparison of pre-test, post-test and gain scores of students
in experimental and control groups are shown in Figure 5.4.

Analysis and Interpretation of Data 184
2.82 2.85
29.96
17.91
27.14
15.1
0
5
10
15
20
25
30
35
Pre-test scores Post-test scores Gain scores
experimental group
control group
FIGURE 5.4 The Comparison of Pre-Test, Post-Test and Gain Scores
of Students in Experimental and Control Groups
5.4. Genuineness of the Difference in Achievement
The analysis of the post-test scores and the gain scores of the students in
the two groups (experimental and control groups) showed that there is significant
difference on the achievement in biology of students in these groups. But the two
groups selected for the study were non-equivalent intact classroom groups, and
differed slightly in the means of their pre-test scores. Hence it can not be
concluded that the students of the two groups are differed significantly on their
achievement in the post-test by simply comparing the post-test scores or the gain
scores.

Analysis and Interpretation of Data 185
More than that, the higher post-test scores of the students in the
experimental group than that of the students in the control group cannot be
attributed to the application of the experimental variables to the experimental
group. In this context, it became necessary to analyze the data using the statistical
technique called Analysis of covariance (ANCOVA), by which the difference in
the initial status of the two groups can be removed statistically, that they can be
compared as though their initial status had been equated.
In the present study ANCOVA was used in two major ways; as a technique
for controlling extraneous variables and as a means of increasing power. Use of
covariance is essentially equivalent to matching groups on the variable or the
variables to be controlled. ANCOVA adjusts post-test scores for initial differences
on some variable and compares adjusted scores. In other words, the groups were
equalized with respect to the control variable and then compared. By using
covariance the investigator has attempted to reduce variation in post-test scores,
which has been attributable to another variable.
The second function of ANCOVA is that it increases the power of a
statistical test by reducing within group (error) variance. By using covariance the
investigator has attempted to reduce within group (error) variance, which is due to
limited sample size in the present study.
5.5. Comparison of the Effectiveness of MIA and CMDI on the Total
Achievement in Biology of Experimental and Control Groups
To compare the effectiveness of MIA and CMDI on the achievement in
biology of secondary school students the pre-test and post-test scores of the
experimental and control groups were subjected to the statistical analysis of
Analysis and Interpretation of Data 186
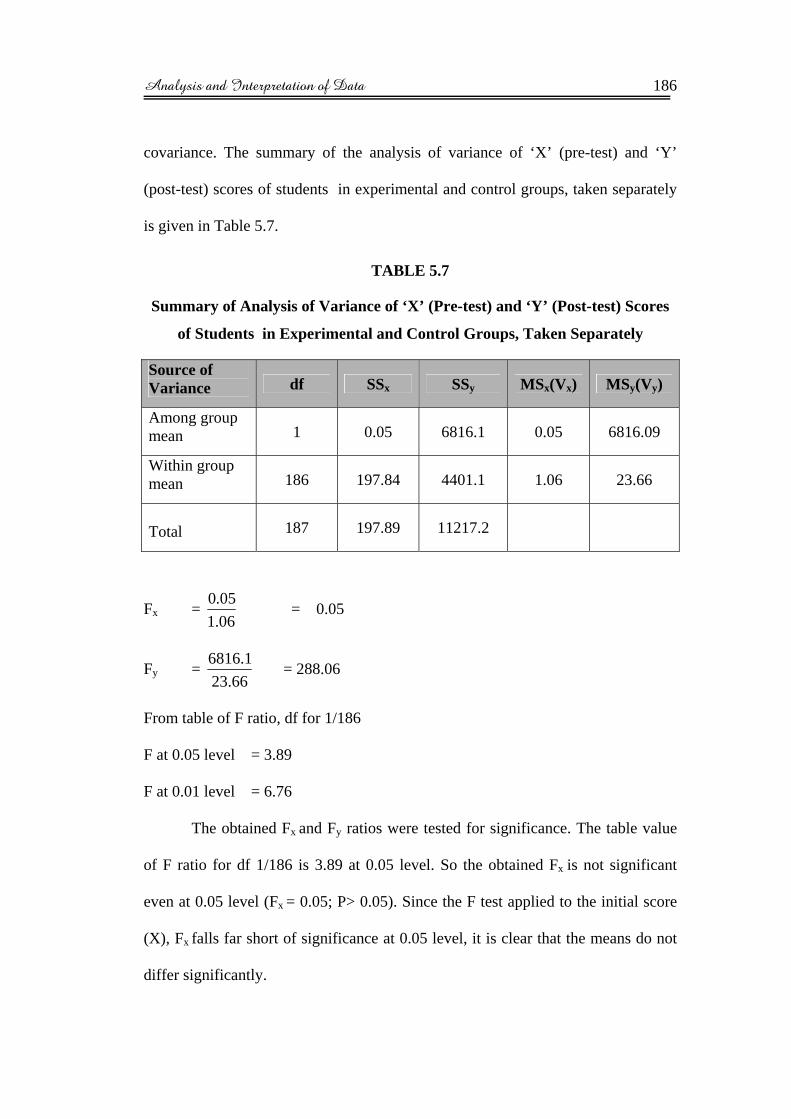
covariance. The summary of the analysis of variance of ‘X’ (pre-test) and ‘Y’
(post-test) scores of students in experimental and control groups, taken separately
is given in Table 5.7.
TABLE 5.7
Summary of Analysis of Variance of ‘X’ (Pre-test) and ‘Y’ (Post-test) Scores
of Students in Experimental and Control Groups, Taken Separately
Source of Variance df SSx SSy MSx(Vx) MSy(Vy)
Among group mean 1 0.05 6816.1 0.05 6816.09
Within group mean 186 197.84 4401.1 1.06 23.66
Total 187 197.89 11217.2
Fx = 06.105.0 = 0.05
Fy = 66.23
1.6816 = 288.06
From table of F ratio, df for 1/186
F at 0.05 level = 3.89
F at 0.01 level = 6.76
The obtained Fx and Fy ratios were tested for significance. The table value
of F ratio for df 1/186 is 3.89 at 0.05 level. So the obtained Fx is not significant
even at 0.05 level (Fx = 0.05; P> 0.05). Since the F test applied to the initial score
(X), Fx falls far short of significance at 0.05 level, it is clear that the means do not
differ significantly.

Analysis and Interpretation of Data 187
The table value of F ratio for df 1/186 is 6.76 at 0.01 level. So the obtained
Fy is highly significant (Fy = 288.06; P<0.01). Since the F test applied to the final
scores (Y) Fy falls far beyond the 0.01 level of significance, it can be tentatively
interpreted that there is significant difference between the ‘Y’ means of the two
groups.
Analysis of Covariance
The final (Y) scores were corrected for difference in initial (X) scores. For
that the SSy have been adjusted for any variability in ‘Y’ contributed by ‘X’. The
adjusted sum of squares for ‘Y’, that is SSyx were computed and the F ratio (Fyx)
was calculated. The summary of analysis of covariance of pre-test and post-test
scores of students in experimental and control groups taken separately is given in
Table 5.8.
TABLE 5.8
Summary of Analysis of Co-variance of ‘X’ (Pre-test) and ‘Y’ (Post-test)
Scores of Students in Experimental and Control Groups, Taken Separately
Source of Variance df SSx SSy SSxy SSyx MSy(Vy) SDyx
Among group mean 1.00 0.05 6816.1 18.06 6812.80 6812.80
Within group mean 185 197.84 4401.1 8.96 4400.74 23.79
Total 186 197.89 11217.2 27.02 11213.54
4.88
Fyx = 79.2380.6812 = 286.40
From table of F ratio = df 1/185 for
F at 0.05 level = 3.89
F at 0.01 level = 6.76

Analysis and Interpretation of Data 188
Since the table value of F ratio for 1/185 is 6.76 at 0.01 level of
significance, the obtained Fyx ratio is highly significant (Fyx= 286.40; P<0.01). The
significant Fyx ratio shows that the means of the post-test scores of students in the
experimental and control groups have significant difference. The significant Fyx
ratio also shows that the means of the post-test scores of students in the
experimental and control groups differ significantly even after they have been
adjusted for difference in the pre-test scores. So it can be tentatively interpreted
that MIA has greater effect on the achievement in biology than CMDI.
Comparison of Adjusted ‘Y’ Means
The adjusted means of post-test scores (Y means) of students in the
experimental and control groups were computed and the difference between the
adjusted ‘Y’ means was tested for significance. The data for adjusted means of
post-test scores of students in experimental and control groups taken separately is
given in Table 5.9.
TABLE 5.9
Data for Adjusted ‘Y’ means of Post-test Scores of Students in Experimental
and Control Groups, Taken Separately
Group N Mx My Adjusted Y Mean (Myx)
Experimental Group 94 2.85 30.0 29.96
Control Group 94 2.82 17.9 17.92
General Means 94 2.84 23.94 23.94
S Em =0.71
‘t’ = 16.93

Analysis and Interpretation of Data 189
Table value of ‘t’
‘t’ at 0.05 level = 1.97
‘t’ at 0.01 level = 2.60
The table value of ‘t’ is 1.97 at 0.05 level and 2.60 at 0.01 level. The
calculated ‘t’ value (16.93) is significant at 0.01 level. The significantly greater
adjusted ‘Y’ mean of the experimental group than the control group indicates that
experimental group is superior to control group, on the achievement in biology. It
may therefore be interpreted that the students taught through MIA has better
achievement in biology than those taught through CMDI.
From the analysis of total achievement scores of students in experimental
and control groups, by using the statistical technique of analysis of covariance it
becomes apparent that the MIA is more effective than the CMDI on the
achievement in biology of secondary school students.
5.6. Comparison of the Effectiveness of MIA and CMDI on the
Achievement in Biology of Different Objectives of Cognitive Domain in
Experimental and Control Groups
An objective is the intended behaviour of students, the ways in which
individuals are to act, think or feel as a result of participating in some unit of
instruction. An objective is a level of mental growth which the teacher expects the
child to reach through learning experiences. The child who has achieved the
objectives will be different from the child who hasn’t achieved the objectives. This
means, as a result of educational process the teacher brings about desirable changes
in the pupil. These behavioural changes indicate the attainment of an objective.

Analysis and Interpretation of Data 190
To compare the effectiveness of MIA and CMDI on the achievement of
different objectives of Cognitive domain in biology at the secondary level, the pre-
test and post-test scores at different objective levels of the cognitive domain of the
two groups (experimental and control groups) were subjected to the statistical
technique of analysis of covariance.
Levels of objectives of Cognitive domain selected for the analysis of covariance
were
a) Remembering, b) Understanding, c) Applying ,
d) Analyzing, e) Evaluating and f) Creating.
The post-test scores of the different objectives of Cognitive domain obtained
by the students in the experimental and control groups were condensed into
frequency tables and then calculated the mean and standard deviation. The
consolidated results of the post-test scores of different objectives of cognitive
domain in the experimental and control groups are given in Table 5.10.
TABLE 5.10
Mean and Standard Deviation of Post-test Scores of Different Objectives of Cognitive Domain in Experimental and Control Groups
Experimental Group Control Group No
Objectives Mean SD Mean SD
1 Remembering 3.74 0.44 3.2 0.7
2 Understanding 4.55 0.63 3.59 0.91
3 Applying 9.24 1.33 6.06 1.41
4 Analyzing 9.3 2.04 4.61 1.91
5 Evaluating 1.87 0.94 0.38 0.57
6 Creating 1.24 1.09 0.15 0.36

Analysis and Interpretation of Data 191
10 Experimental Group
Control Group9
8
7
6Post-test Scores 5
4
3
2
1
0RE AP AN CR UN EV
Objectives
FIGURE 5.5 The Comparison of Mean Post-Test Scores of Different
Objectives of Cognitive Domain in Experimental and
Control Groups
5.6.1. Comparison of the effectiveness of MIA and CMDI on the
achievement in biology of secondary school students with respect to the
REMEMBERING level.
To compare the effectiveness of MIA and CMDI on the achievement in biology
of secondary school students with respect to Remembering level, the pre-test and post-
test scores of the experimental and control groups at the Remembering level were

Analysis and Interpretation of Data 192
subjected to the statistical analysis of covariance. The summary of analysis of
variance of ‘X’ (pre-test) and ‘Y’ (post-test) scores of students in experimental
and control groups at the Remembering level, taken separately is given in Table
5.11.
TABLE 5.11
Summary of Analysis of Variance of ‘X’ (Pre-test) and ‘Y’ (Post-test) Scores
of Students in Experimental and Control Groups with Respect to the
REMEMBERING Level, Taken Separately
Source of Variance df SSx SSy MSx(Vx) MSy(Vy)
Among group mean 1 0.05 13.8 0.05 13.84
Within group mean 186 197.84 63.0 1.06 0.34
Total 187 197.89 76.8
Fx = 06.105.0 = 0.05
Fy = 34.084.13 = 40.83
From table of F ratio, df for 1/186
F at 0.05 level = 3.89
F at 0.01 level = 6.76
The obtained Fx and Fy ratios were tested for significance. The table value
of F ratio for 1/186 is 3.89 at 0.05 level. So the obtained Fx is not significant even
at 0.05 level (Fx =0.05; P> 0.05). Since the F test applied to the initial scores (X),

Analysis and Interpretation of Data 193
Fx falls far short of significance at 0.05 level, it is clear that the means do not differ
significantly.
The table value of F ratio for df 1/186 is 6.76 at 0.01 level. So the obtained
Fy is highly significant (Fy = 40.83; P<0.01). Since the F test applied to the final
(Y) scores (Fy) falls far beyond the 0.01 level of significance, it can be tentatively
interpreted that there is significant difference between the ‘Y’ means of two
groups.
Analysis of Covariance
The final (Y) scores were corrected for difference in initial (X) scores. For
that the SSy have been adjusted for any variability in ‘Y’ contributes by ‘X’. The
adjusted sum of squares for ‘Y’, that is SSyx were computed and the F ratio (Fyx)
was calculated. The summary of analysis of covariance of pre-test and post-test
scores of students in experimental and control groups with respect to
Remembering level taken separately, is given in Table 5.12.
TABLE 5.12
Summary of Analysis of Covariance of ‘X’ (Pre-test) and ‘Y’ (Post-test)
Scores of Students in Experimental and Control Groups, with Respect to the
REMEMBERING Level, Taken Separately
Source of Variance df SSx SSy SSxy SSyx
MSy (Vyx)
SDyx
Among group mean 1 0.05 13.8 0.81 13.79 13.79
Within group mean 185 197.84 63.0 4.86 62.91 0.34
Total 186 197.89 76.8 5.67 76.70
0.58

Analysis and Interpretation of Data 194
Fyx = 34.079.13 = 40.56
From table of F ratio, df 1/185 for
F at 0.05 level = 3.89
F at 0.01 level = 6.76
Since the table value of F ratio for df 1/185 is 6.76 at 0.01 level of
significance, the obtained Fyx ratio is highly significant (Fyx =40.56; P<0.01). The
significant Fyx ratio shows that the means of the post-test scores of students at the
Remembering level in the experimental and control groups have significant
difference. The significant Fyx ratio also shows that the means of the post-test
scores at the Remembering level of students in the experimental and control groups
differ significantly even after they have been adjusted for difference in the pre-test
scores. So it can tentatively interpreted that MIA has greater effect than CMDI on
the achievement in biology of secondary school students at the Remembering
level.
Comparison of Adjusted ‘Y’ Means
The adjusted means of post-test scores (Y means) of students in the
experimental and control groups were computed and the difference between the
adjusted ‘Y’ means was tested for significance. The data for adjusted means of
post-test scores of students in experimental and control groups at the Remembering
level, taken separately is given in Table 5.13.

Analysis and Interpretation of Data 195
TABLE 5.13
Data for Adjusted ‘Y’ Means of Post-test Scores of Students in
Experimental and Control Groups, with Respect to the
REMEMBERING Level, Taken Separately
Group N Mx My Adjusted Y Mean (Myx)
Experimental Group 94 2.85 3.7 3.74
Control Group 94 2.82 3.2 3.20
General Means 94 2.84 3.47 3.47
S Em =0.09
“t” =6.39
Table value of ‘t’
‘t’ at 0.05 level = 1.97
‘t’ at 0.01 level = 2.60
The table value of ‘t’ is 1.97 at 0.05 level and 2.60 at 0.01 level. The
calculated ‘t’ value (6.37) is significant at 0.01 level. The significantly greater
adjusted ‘Y’ mean of the experimental group than the control group indicates that
experimental group is superior to control group on the achievement in biology at
the Remembering level. It may therefore be inferred that the secondary school
students taught through MIA has better achievement in biology at the
Remembering level than those taught through CMDI.

Analysis and Interpretation of Data 196
5.6.2. Comparison of the effectiveness of MIA and CMDI on the
achievement in biology of secondary school students with respect to the
UNDERSTANDING level.
To compare the effectiveness of MIA and CMDI on the achievement in
biology of secondary school students with respect to the Understanding level, the pre-
test and post-test scores of the experimental and control groups at the
Understanding level were subjected to the statistical analysis of covariance. The
summary of analysis of variance of ‘X’ (pre-test) and ‘Y’ (post-test) scores of
students in experimental and control groups at the Understanding level, taken
separately is given in Table 5.14.
TABLE 5.14
Summary of Analysis of Variance of ‘X’ (Pre-test) and ‘Y’ (Post-test) Scores
of Students in Experimental and Control Groups with Respect to the
UNDERSTANDING Level, Taken Separately
Source of Variance df SSx SSy MSx(Vx) MSy(Vy)
Among group mean 1 0.05 44.0 0.05 44.05
Within group mean 186 197.84 114.1 1.06 0.61
Total 187 197.89 158.1
Fx = 06.105.0 = 0.05
Fy = 61.005.44 = 72.213
From table of F ratio, df for 1/186
F at 0.05 level = 3.89
F at 0.01 level = 6.76

Analysis and Interpretation of Data 197
The obtained Fx and Fy ratios were tested for significance. The table value
of F ratio for 1/186 is 3.89 at 0.05 level. So the obtained Fx is not significant even
at 0.05 level (Fx =0.05; P> 0.05). Since the F test applied to the initial scores (X),
Fx falls far short of significance at 0.05 level, it is clear that the means do not differ
significantly.
The table value of F ratio for df 1/186 is 6.76 at 0.01 level. So the obtained
Fy is highly significant (Fy = 72.213; P<0.01). Since the F test applied to the final
(Y) scores (Fy) falls far beyond the 0.01 level of significance, it can be tentatively
interpreted that there is significant difference between the ‘Y’ means of two
groups.
Analysis of Covariance
The final (Y) scores were corrected for difference in initial (X). For that the
SSy have been adjusted for any variability in ‘Y’ contributes by ‘X’. The adjusted
sum of squares for ‘Y’, that is, SSyx were computed and the F ratio (Fyx) was
calculated. The summary of analysis of covariance of pre-test and post-test scores
of students in experimental and control groups with respect to the Understanding
level taken separately , is given in Table 5.15.
TABLE 5.15
Summary of Analysis of Covariance of ‘X’ (Pre-test) and ‘Y’ (Post-test) Scores of Students in Experimental and Control Groups with Respect to the
UNDERSTANDING Level, Taken Separately Source of Variance df SSx SSy SSxy SSyx
MSy (Vyx)
SDyx
Among group mean 1 0.05 44.0 1.45 44.00 44.00
Within group mean 185 197.84 114.1 2.69 114.02 0.62
Total 186 197.89 158.1 4.14 158.02
0.79

Analysis and Interpretation of Data 198
Fyx = 62.000.44 = 70.96
From table of F ratio, df 1/185 for
F at 0.05 level = 3.89
F at 0.01 level = 6.76
Since the table value of F ratio for df 1/185 is 6.76 at 0.01 level of significance,
the obtained Fyx ratio is highly significant (Fyx =70.96; P<0.01). The significant Fyx
ratio shows that the means of the post-test scores of students at the Understanding
level in the experimental and control groups have significant difference. The
significant Fyx ratio also shows that the means of the post-test scores at the
Understanding Level of students in the experimental and control groups differ
significantly even after they have been adjusted for difference in the pre-test
scores. So it can be tentatively interpreted that MIA has greater effect on the
achievement in biology of secondary school students at the Understanding level
than CMDI.
Comparison of Adjusted ‘Y’ Means
The adjusted means of post-test scores (Y means) of students in the
experimental and control groups were computed and the difference between the
adjusted ‘Y’ means was tested for significance. The data for adjusted means of
post-test scores of students in experimental and control groups at the
Understanding level taken separately is given in Table 5.16.

Analysis and Interpretation of Data 199
TABLE 5.16
Data for Adjusted ‘Y’ Means of Post-test Scores of Students in
Experimental and Control Groups, with Respect to the
UNDERSTANDING Level, Taken Separately
Group N Mx My Adjusted Y Mean (Myx)
Experimental Group 94 2.85 4.6 4.55
Control Group 94 2.82 3.6 3.59
General Means 94 2.84 4.07 4.07
S Em =0.11
‘t’ =8.45
Table value of ‘t’
‘t’ at 0.05 level = 1.97
‘t’ at 0.01 level = 2.60
The table value of ‘t’ is 1.97 at 0.05 level and 2.60 at 0.01 level. The
calculated ‘t’ value (8.45) is significant at 0.01 level. The significantly greater
adjusted ‘Y’ mean of the experimental group than the control group indicates that
experimental group is superior to control group on the achievement in biology at
the Understanding level. It may therefore be inferred that the secondary school
students taught through MIA has better achievement in biology at the
Understanding level than those taught through CMDI.

Analysis and Interpretation of Data 200
5.6.3. Comparison of the effectiveness of MIA and CMDI on the
achievement in biology of secondary school students with respect to the
APPLYING level.
To compare the effectiveness of MIA and CMDI on the achievement in
biology of secondary school students with respect to the Applying level, the pre-
test and post-test scores of the experimental and control groups at the Applying
level were subjected to the statistical analysis of covariance. The summary of
analysis of variance of ‘X’ (pre-test) and ‘Y’ (post-test) scores of students in
experimental and control groups at the Applying level, taken separately is given in
Table 5.17.
TABLE 5.17
Summary of Analysis of Variance of ‘X’ (Pre-test) and ‘Y’ (Post-test) Scores
of Students in Experimental and Control Groups with Respect to the
APPLYING Level, Taken Separately
Source of Variance df SSx SSy MSx(Vx) MSy(Vy)
Among group mean 1 0.05 475.5 0.05 475.54
Within group mean 186 197.84 347.0 1.06 1.87
Total 187 197.89 822.5
Fx = 06.105.0 = 0.05
Fy = 87.1
54.475 = 254.28

Analysis and Interpretation of Data 201
From table of F ratio, df for 1/186
F at 0.05 level = 3.89
F at 0.01 level = 6.76
The obtained Fx and Fy ratios were tested for significance. The table value
of F ratio for 1/186 is 3.89 at 0.05 level. So the obtained Fx is not significant even
at 0.05 level (Fx =0.05; P> 0.05). Since the F test applied to the initial scores (X),
Fx falls far short of significance at 0.05 level, it is clear that the means do not differ
significantly.
The table value of F ratio for df 1/186 is 6.76 of 0.01 level. So the obtained
Fy is highly significant (Fy =254.28; P<0.01). Since the F test applied to the final
(Y) scores (Fy) falls far beyond the 0.01 level of significance, it can be tentatively
interpreted that there is significant difference between the ‘Y’ means of two
groups.
Analysis of Covariance
The final (Y) scores were corrected for difference in initial (X) scores. For
that the SSy have been adjusted for any variability in ‘Y’ contributes by ‘X’. The
adjusted sum of squares for ‘Y’, that is., SSyx was computed and the F ratio (Fyx)
was calculated. The summary of analysis of covariance of pre-test and post-test
scores of students at the Applying level in experimental and control groups taken
separately is given in Table 5.18.

Analysis and Interpretation of Data 202
TABLE 5.18
Summary of Analysis of Covariance of ‘X’ (Pre-test) and ‘Y’ (Post-test)
Scores of Students in Experimental and Control Groups with Respect to the
APPLYING Level, Taken Separately
Source of Variance df SSx SSy SSxy SSyx
MSy (Vyx)
SDyx
Among group mean 1 0.05 475.5 4.77 475.64 475.64
Within group mean 185 197.84 347.0 -4.49 346.89 1.88
Total 186 197.89 822.5 0.28 822.53
1.37
Fyx = 88.1
64.475 = 253
From table of F ratio, df 1/185 for
F at 0.05 level = 3.89
F at 0.01 level = 6.76
Since the table value of F ratio for df 1/185 is 6.76 at 0.01 level of significance,
the obtained Fyx ratio is highly significant (Fyx = 253; P<0.01). The significant Fyx
ratio shows that the means of the post-test scores of students at the Applying level
in the experimental and control groups have significant difference. The significant
Fyx ratio also shows that the means of the post-test scores at the Applying level of
students in the experimental and control groups differ significantly even after they
have been adjusted for difference in the pre-test scores. So it can be tentatively
interpreted that MIA has greater effect on the achievement in biology of secondary
school students at the Applying level than the CMDI.

Analysis and Interpretation of Data 203
Comparison of Adjusted ‘Y’ Means
The adjusted means of post-test scores (Y means) of students in the
experimental and control groups were computed and the difference between the
adjusted ‘Y’ means was tested for significance. The data for adjusted means of
post-test scores of students in experimental and control groups at the Applying
level, taken separately is given in Table 5.19.
TABLE 5.19
Data for Adjusted ‘Y’ Means of Post-test Scores of Students in
Experimental and Control Groups with Respect to the
APPLYING Level, Taken Separately
Group N Mx My Adjusted Y Mean (Myx)
Experimental Group 94 2.85 9.2 9.25
Control Group 94 2.82 6.1 6.06
General Means 94 2.84 7.65 7.65
S Em =0.20
‘t’ = 15.93
Table value of ‘t’
‘t’ at 0.05 level = 1.97
‘t’ at 0.01 level = 2.60
The table value of ‘t’ is 1.97 at 0.05 level and 2.60 at 0.01 level. The
calculated ‘t’ value (15.93) is significant at 0.01 level. The significantly greater
adjusted ‘Y’ mean of the experimental group than the control group indicates that
experimental group is superior to control group on the achievement in biology at
the Applying level. It may therefore be inferred that the students taught through

Analysis and Interpretation of Data 204
MIA has better achievement in biology at the Applying level than those taught
through CMDI.
5.6.4. Comparison of the effectiveness of MIA and CMDI on the
achievement in biology of secondary school students with Respect to
the ANALYSING level.
To compare the effectiveness of MIA and CMDI on the achievement in
biology of secondary school students with respect to the Analysing level, the pre-
test and post-test scores of the experimental and control groups at the Analysing
level were subjected to the statistical analysis of covariance. The summary of
analysis of variance of ‘X’ (pre-test) and ‘Y’ (post-test) scores of students in
experimental and control groups at the Analysing level, taken separately is given in
Table 5.20.
TABLE 5.20
Summary of Analysis of Variance of ‘X’ (Pre-test) and ‘Y’ (Post-test) Scores
of Students in Experimental and Control Groups with Respect to the
ANALYSING Level, Taken Separately
Source of Variance df SSx SSy MSx(Vx) MSy(Vy)
Among group mean 1 0.05 1034.5 0.05 1034.47
Within group mean 186 197.84 726.1 1.06 3.90
Total 187 197.89 1760.6
Fx = 06.105.0 = 0.05

Analysis and Interpretation of Data 205
Fy = 90.3
47.1034 = 265.248
From table of F ratio, df for 1/186
F at 0.05 level = 3.89
F at 0.01 level = 6.76
The obtained Fx and Fy ratios were tested for significance. The table value
of F ratio for 1/186 is 3.89 at 0.05 level. So the obtained Fx is not significant even
at 0.05 level ( Fx =0.05; P> 0.05). Since the F test applied to the initial scores (X),
Fx falls far short of significance at 0.05 level, it is clear that the means do not differ
significantly.
The table value of F ratio for df 1/186 is 6.76 of 0.01 level. So the obtained
Fy is highly significant (Fy =265.248; P<0.01). Since the F test applied to the final
(Y) scores (Fy) falls far beyond the 0.01 level of significance, it can be tentatively
interpreted that there is significant difference between the ‘Y’ means of two
groups.
Analysis of Covariance
The final (Y) scores were corrected for difference in initial (X) scores. For
that the SSy have been adjusted for any variability in ‘Y’ contributes by ‘X’. The
adjusted sum of squares for ‘Y’, that is SSyx were computed and the F ratio (Fyx)
was calculated. The summary of analysis of covariance of pre-test and post-test
scores of students in the experimental and control groups with respect to the
Analysing level, taken separately is given in Table 5.21.

Analysis and Interpretation of Data 206
TABLE 5.21
Summary of Analysis of Covariance of ‘X’ (Pre-test) and ‘Y’ (Post-test)
Scores of Students in Experimental and Control Groups, with Respect to the
ANALYSING Level, Taken Separately
Source of Variance df SSx SSy SSxy SSyx MSy (Vyx) SDyx
Among group mean 1 0.05 1034.5 7.04 1034.33 1034.33
Within group mean 185 197.84 726.1 -1.52 726.08 3.92
Total 186 197.89 1760.6 5.52 1760.41
1.98
Fyx = 92.3
33.1034 = 263.85
From table of F ratio, df 1/185 for
F at 0.05 level = 3.89
F at 0.01 level = 6.76
Since the table value of F ratio for df 1/185 is 6.76 at 0.01 level of significance,
the obtained Fyx ratio is highly significant (Fyx = 263.85; P<0.01). The significant Fyx
ratio shows that the means of the post-test scores of students at the Analysing level
in the experimental and control groups have significant difference. The significant
Fyx ratio also shows that the means of the post-test scores at the Analysing level of
students in the experimental and control groups differ significantly even after they
have been adjusted for difference in the pre-test scores. So it can be tentatively
interpreted that MIA has greater effect on the achievement in biology at the
Analysing level than CMDI.

Analysis and Interpretation of Data 207
Comparison of Adjusted ‘Y’ Means
The adjusted means of post-test scores (Y means) of students in the
experimental and control groups were computed and the difference between the
adjusted ‘Y’ means was tested for significance. The data for adjusted means of
post-test scores of students in experimental and control groups at the Analysing
level, taken separately is given in Table 5.22.
TABLE 5.22
Data for Adjusted ‘Y’ Means of Post-test Scores of Students in
Experimental and Control Groups with Respect to the
ANALYSING Level, Taken Separately
Group N Mx My Adjusted Y Mean (Myx)
Experimental Group 94 2.85 9.3 9.30
Control Group 94 2.82 4.6 4.61
General Means 94 2.84 6.95 6.95
S Em =0.29
‘t’ = 16.24
Table value of ‘t’
‘t’ at 0.05 level = 1.97
‘t’ at 0.01 level = 2.60
The table value of ‘t’ is 1.97 at 0.05 level and 2.60 at 0.01 level. The
calculated ‘t’ value (16.24) is significant at 0.01 level. The significantly greater
adjusted ‘Y’ mean of the experimental group than the control group indicates that

Analysis and Interpretation of Data 208
experimental group is superior to the control group on the achievement in biology
at the Analysing level. It may therefore be inferred that the students taught through
MIA have better achievement in biology at the Analysing level than those taught
through CMDI.
5.6.5. Comparison of the effectiveness of MIA and CMDI on the
achievement in biology of secondary school students with respect to the
EVALUATING level.
To compare the effectiveness of MIA and CMDI on the achievement in
biology of secondary school students with respect to the Evaluating level, the pre-test
and post-test scores at the Evaluating level of the experimental and control groups
were subjected to the statistical analysis of covariance. The summary of analysis of
variance of ‘X’ (pre-test) and ‘Y’ (post-test) scores of students in experimental
and control groups at the Evaluating level, taken separately is given in Table 5.23 .
TABLE 5.23
Summary of Analysis of Variance of ‘X’ (Pre-test) and ‘Y’ (Post-test) Scores
of Students in Experimental and Control Groups with Respect to the
EVALUATING Level, Taken Separately
Source of Variance df SSx SSy MSx(Vx) MSy(Vy)
Among group mean 1 0.05 104.3 0.05 104.26
Within group mean 186 197.84 112.7 1.06 0.61
Total 187 197.89 217
Fx =06.105.0 = 0.05

Analysis and Interpretation of Data 209
Fy = 61.026.104 = 170.918
From table of F ratio, df for 1/186
F at 0.05 level = 3.89
F at 0.01 level = 6.76
The obtained Fx and Fy ratios were tested for significance. The table value
of F ratio for 1/186 is 3.89 at 0.05 level. So the obtained Fx is not significant even
at 0.05 level (Fx =0.05; P> 0.05). Since the F test applied to the initial scores (X),
Fx falls far short of significance at 0.05 level, it is clear that the means do not differ
significantly.
The table value of F ratio for df 1/186 is 6.76 of 0.01 level. So the obtained
Fy is highly significant (Fy =170.918; P<0.01). Since the F test applied to the final
(Y) scores (Fy) falls far beyond the 0.01 level of significance, it can be tentatively
interpreted that there is significant difference between the ‘Y’ means of two
groups.
Analysis of Covariance
The final (Y) scores were corrected for difference in initial (X) scores. For
that the SSy have been adjusted for any variability in Y contributes by ‘X’. The
adjusted sum of squares for ‘Y’, that is SSyx were computed and the F ratio (Fyx)
was calculated. The summary of analysis of covariance of pre-test and post-test
scores of students at the Evaluating level in experimental and control groups,
taken separately is given in Table 5.24.

Analysis and Interpretation of Data 210
TABLE 5.24
Summary of Analysis of Covariance of ‘X’ (Pre-test) and ‘Y’ (Post-test)
Scores of Students in Experimental and Control Groups with Respect to the
EVALUATING Level, Taken Separately
Source of Variance df SSx SSy SSxy SSyx
MSy (Vyx)
SDyx
Among group mean 1 0.05 104.3 2.23 104.24 104.24
Within group mean 185 197.84 112.7 -0.28 112.68 0.61
Total 186 197.89 217 1.95 216.92
0.78
Fyx =61.024.104 = 170.885
From table of F ratio, df 1/185 for
F at 0.05 level = 3.89
F at 0.01 level = 6.76
Since the table value of F ratio for df 1/185 is 6.76 at 0.01 level of significance,
the obtained Fyx ratio is highly significant (Fyx = 170.885; P<0.01). The significant
Fyx ratio shows that the means of the post-test scores of students at the Evaluating
level in the experimental and control groups have significant difference. The
significant Fyx ratio also shows that the means of the post-test scores at the
Evaluating level of students in the experimental and control groups differ
significantly even after they have been adjusted for difference in the pre-test
scores. So it can be tentatively interpreted that MIA has greater effect on the
achievement in biology of secondary school students at the Evaluating level than
CMDI.

Analysis and Interpretation of Data 211
Comparison of Adjusted ‘Y’ Means
The adjusted means of post-test scores (Y means) of students in the
experimental and control groups were computed and the difference between the
adjusted ‘Y’ means was tested for significance. The data for adjusted means of
post-test scores of students in experimental and control groups at the Evaluating
level, taken separately is given in Table 5.25.
TABLE 5.25
Data for Adjusted ‘Y’ Means of Post-test Scores of Students in
Experimental and Control Groups with Respect to the
EVALUATING Level, Taken Separately
Group N Mx My Adjusted Y Mean (Myx)
Experimental Group 94 2.85 1.9 1.87
Control Group 94 2.82 0.4 0.38
General Means 94 2.84 1.13 1.13
S Em =0.11
‘t’ = 13.08
Table value of ‘t’
‘t’ at 0.05 level = 1.97
‘t’ at 0.01 level = 2.60
The table value of ‘t’ is 1.97 at 0.05 level and 2.60 at 0.01 level. The
calculated ‘t’ value (13.08) is significant at 0.01 level. The significantly greater
adjusted ‘Y’ mean of the experimental group than the control group indicates that
experimental group is superior to control group on achievement in biology at the
Evaluating level. It may therefore be inferred that the students taught through MIA

Analysis and Interpretation of Data 212
have better achievement in biology at the Evaluating level than those taught
through CMDI.
5.6.6. Comparison of the effectiveness of MIA and CMDI on the
achievement in biology of secondary school students with respect to the
CREATING level.
To compare the effectiveness of MIA and CMDI on the achievement in
biology of secondary school students with respect to Creating level, the pre-test and
post-test scores at the Creating level of the experimental and control groups were
subjected to the statistical analysis of covariance. The summary of analysis of
variance of ‘X’ (pre-test) and ‘Y’ (post-test) scores of students in experimental
and control groups at the Creating level, taken separately is given in Table 5.26.
TABLE 5.26
Summary of Analysis of Variance of ‘X’ (Pre-test) and ‘Y’ (Post-test) Scores
of Students in Experimental and Control Groups with Respect to the
CREATING Level, Taken Separately
Source of Variance df SSx SSy MSx(Vx) MSy(Vy)
Among group mean 1 0.05 56.4 0.05 56.43
Within group mean 186 197.84 123.3 1.06 0.66
Total 187 197.89 179.7
Fx = 06.105.0 = 0.05
Fy =66.043.56 = 85 .5
From table of F ratio, df for 1/186

Analysis and Interpretation of Data 213
F at 0.05 level = 3.89
F at 0.01 level = 6.76
The obtained Fx and Fy ratios were tested for significance. The table value of
F ratio for 1/186 is 3.89 at 0.05 level. So the obtained Fx is not significant even at
0.05 level (Fx =0.05; P> 0.05). Since the F test applied to the initial scores (X), Fx
falls far short of significance at 0.05 level, it is clear that the means do not differ
significantly.
The table value of F ratio for df 1/186 is 6.76 of 0.01 level. So the obtained
Fy is highly significant (Fy =85.5; P<0.01). Since the F test applied to the final (Y)
scores (Fy) falls far beyond the 0.01 level of significance, it can be tentatively
interpreted that there is significant difference between the ‘Y’ means of two
groups.
Analysis of Covariance
The final (Y) scores were corrected for difference in initial (X) scores. For
that the SSy have been adjusted for any variability in ‘Y’ contributes by ‘X’. The
adjusted sum of squares for Y, that is SSyx were computed and the F ratio (Fyx) was
calculated. The summary of analysis of covariance of pre-test and post-test scores
of students at the Creating level in experimental and control groups taken
separately is given in Table 5.27.

Analysis and Interpretation of Data 214
TABLE 5.27
Summary of Analysis of Covariance of ‘X’ (Pre-test) and ‘Y’ (Post-test)
Scores of Students in Experimental and Control Groups with Respect to the
CREATING Level, Taken Separately
Source of Variance df SSx SSy SSxy SSyx
MSy (Vyx)
SDyx
Among group mean 1 0.05 56.4 1.64 56.33 56.33
Within group mean 185 197.84 123.3 4.96 123.16 0.67
Total 186 197.89 179.7 6.60 179.49
0.82
Fyx = 67.033.56 = 84.074
From table of F ratio, df 1/185 for
F at 0.05 level = 3.89
F at 0.01 level = 6.76
Since the table value of F ratio for df 1/185 is 6.76 at 0.01 level of significance,
the obtained Fyx ratio is highly significant (Fyx = 84.074; P<0.01). The significant Fyx
ratio shows that the means of the post-test scores of students at the Creating level
in the experimental and control groups have significant difference. The significant
Fyx ratio also shows that the means of the post-test scores at the Creating level of
students in the experimental and control groups differ significantly even after they
have been adjusted for difference in the pre-test scores. So it can be tentatively
interpreted that MIA has greater effect on the achievement in biology at the
Creating level than CMDI.

Analysis and Interpretation of Data 215
Comparison of Adjusted ‘Y’ Means
The adjusted means of post-test scores (Y means) of students in the
experimental and control groups were computed at the Creating level and the
difference between the adjusted ‘Y’ means was tested for significance. The data for
adjusted means of post-test scores of students in experimental and control groups
at the Creating level, taken separately is given in Table 5.28.
TABLE 5.28
Data for Adjusted ‘Y’ Means of Post-test Scores of Students in
Experimental and Control Groups with Respect to the
CREATING Level, Taken Separately
Group N Mx My Adjusted Y Mean (Myx)
Experimental Group 94 2.85 1.2 1.24
Control Group 94 2.82 0.1 0.15
General Means 94 2.84 0.70 0.70
S Em =0.12
‘t’ = 9.20
Table value of ‘t’
‘t’ at 0.05 level = 1.97
‘t’ at 0.01 level = 2.60

Analysis and Interpretation of Data 216
The table value of ‘t’ is 1.97 at 0.05 level and 2.60 at 0.01 level. The
calculated ‘t’ value (9.20) is significant at 0.01 level. The significantly greater
adjusted ‘Y’ means of the experimental group than the control group indicates that
experimental group is superior to control group on the achievement in biology at
the Creating level. It may therefore be inferred that the students taught through
MIA have better achievement in biology at the Creating level than those taught
through CMDI.
The summary of analysis of covariance of pre-test and post-test scores of
students in experimental and control groups with respect to different objectives of
Cognitive domain is given in Table 5.29.

TABLE 5.29
Summary of Analysis of Covariance of ‘X’ (Pre-test) and ‘Y’ (Post-test) Scores of Experimental and Control Group Students with respect to Different Objectives of Cognitive Domain, Taken Separately
Objectives Groups Source of Variation df SSx SSy SSxy SSyx MSyx SDyx Fyx
Level of Significan
ce Among group mean 1 0.05 13.8 0.81 13.79 13.79
Remembering
Experimental group and Control group
Within group mean 185 197.84 63.0 4.86 62.91 0.34
0.58 40.56 P<0.01
Among group mean 1 0.05 44.0 1.45 44.00 44.00
Understanding
Experimental group and Control group
Within group mean 185 197.84 114.1 2.69 114.02 0.62
0.79 70.96 P<0.01
Among group mean 1 0.05 475.5 4.77 475.64 475.64
Applying
Experimental group and Control group
Within group mean 185 197.84 347.0 -4.49 346.89 1.88
1.37 253 P<0.01
Among group mean 1 0.05 1034.5 7.04 1034.33 1034.33
Analysing
Experimental group and Control group
Within group mean 185 197.84 726.1 -1.52 726.08 3.92
1.98 263.85 P<0.01
Among group mean 1 0.05 104.3 2.23 104.24 104.24
Evaluating
Experimental group and Control group
Within group mean 185 197.84 112.7 -0.28 112.68 0.61
0.78 170.885 P<0.01
Among group mean 1 0.05 56.4 1.64 56.33 56.33
Creating
Experimental group and Control group
Within group mean 185 197.84 123.3 4.96 123.16 0.67
0.82 84.074 P<0.01

Analysis and Interpretation of Data 218
The summary of adjusted means of pre test and post-test scores of students
in experimental and control groups with respect to different objectives of Cognitive
domain is given in Table 5.30.
TABLE 5.30
Summary of the Adjusted ‘Y’ Means of Post-test Scores of Students in
Experimental and Control Groups with respect to Different Objectives of
Cognitive Domain, Taken Separately
Objectives Group N Mx My Myx t
value
Level of Significa
nce Experimental
94 2.85 3.7 3.74
Remembering Control
94 2.82 3.2 3.20
6.37 P<0.01
Experimental
94 2.85 4.6 4.55
Understanding Control
94 2.82 3.6 3.59
8.45 P<0.01
Experimental
94 2.85 9.2 9.25
Applying Control
94 2.82 6.1 6.06
15.93 P<0.01
Experimental
94 2.85 9.3 9.3
Analysing Control
94 2.82 4.6 4.61
16.24 P<0.01
Experimental
94 2.85 1.9 1.87
Evaluating Control
94 2.82 0.4 0.38
13.08 P<0.01
Experimental
94 2.85 1.2 1.24
Creating Control
94 2.82 0.1 0.15
9.2 P<0.01
From the analysis of total and objective wise achievement scores of
students in the experimental and control groups, by using the statistical technique

Analysis and Interpretation of Data 219
of analysis of covariance it becomes apparent that MIA is more effective than the
CMDI on the achievement in biology of secondary school students.
5.7. Comparison of the Effectiveness of MIA and CMDI on the Achievement in
Biology of Students in Experimental and Control Groups having different
Learning Styles
Individual differences have been seen to play an important role in students'
successes and failures. Learning styles are used to characterize how one prefers to
learn about something. It is the way a person processes, internalizes, and studies
new and challenging material. The cornerstone of Learning style theory is that
most people can learn and each individual has his own unique ways of mastering
new and difficult subject matter (Dunn, 2000).
Kolb’s model of learning suggests a learning process with four stages in a
continuous cycle: Concrete experience, Reflective observations on those
experiences, Abstract conceptualizations developed from those reflections, Active
experimentation on those conceptualizations. Depending on the relative emphasis
or preference along these coordinates four learning style types were identified by
Kolb (1984): Converging, Assimilating, Diverging, and Accommodating.
To compare the effectiveness of MIA and CMDI on the achievement in
biology of secondary school students having different Learning styles, the
investigator administered the Kolb’s learning style inventory on both the
experimental and control groups. On the basis of the scores obtained from the
inventory, the students were categorized into four groups of learning styles, viz.
Converging, Assimilating, Diverging, and Accommodating in both experimental

Analysis and Interpretation of Data 220
and control group. In order to compare the effectiveness of MIA and CMDI on the
achievement in biology of students having different learning styles, it was essential
that the achievement scores of various learning style groups of both experimental
and control groups be compared and analyzed. Thus the pre-test, post-test and gain
scores of students have the different Learning styles of both experimental and
control groups were subjected to the statistical analysis.
The pre-test, post-test and gain scores obtained by students in the
experimental and control groups having different learning styles were condensed
into frequency tables and then calculated the mean and standard deviation. The
values of statistics calculated are given in Table 5.31.
TABLE 5.31
Mean and Standard Deviation of Pre-test, Post-test and Gain Scores of
Different Learning style Groups in Experimental and Control Groups
Experimental Group Control Group Learning
Styles PRE
TEST POST TEST
GAIN PRE TEST POST TEST
GAIN
Mean 2.87 33.75 30.94 2.81 17.34 14.53
Diverging
SD 1.04 5.06 5.03 1.1 3.84 3.88
Mean 2.74 28.11 25 2.85 16.38 13.54
Accommo-
dating SD 0.81 4.51 4.64 1.34 3.31 3.55
Mean 2.5 28.23 25.5 2.74 18.84 16.11
Assimi-lating
SD 0.86 4.98 4.9 0.93 4.19 4.42
Mean 3.29 27.67 25 2.93 19.87 16.93
Conver-ging
SD 1.15 4.51 4.85 0.88 5.13 5.01

Analysis and Interpretation of Data 221
Ex Gr Post- test Co Gr Post- test
35
30
25
20Marks
15
10
5
0D As Ac Co
Learning Styles
FIGURE 5.6 The Comparison of Mean Post-Test Scores of Students Having
Different Learning Styles in the Experimental and Control
Groups
5.7.1. Comparison of the effectiveness of MIA and CMDI on the
achievement in biology of experimental and control group students
having DIVERGING learning Style
To compare the effectiveness of MIA and CMDI on the achievement in
biology of secondary school students having Diverging learning style, the pre-test
and post-test scores of experimental and control group students having Diverging
learning style were subjected to analysis of covariance. The summary of analysis
of variance of ‘X’ (pre-test) and ‘Y’ (post-test) scores of students in experimental

Analysis and Interpretation of Data 222
and control groups having Diverging learning style, taken separately is given in
Table 5.32.
TABLE 5.32
Summary of Analysis of Variance of ‘X’ (Pre-test) and ‘Y’ (Post-test) Scores
of Experimental and Control Group Students Having DIVERGING
Learning Style, Taken Separately
Source of Variance df SSx SSy MSx(Vx) MSy(Vy)
Among group mean 1 0.118
4245.052
0.118
4245.052
Within group mean 74 71.920
1744.106
0.971
23.569
Total 75
72.039
5989.158
Fx = 9718994.011844.0 = 0.123
Fy = 569.23052.4245 = 180.112
From table of F ratio, df for 1/74
F at 0.05 level = 3.98
F at 0.01 level = 7.01
The obtained Fx and Fy ratios were tested for significance. The table value
of F ratio for 1/74 is 3.98 at 0.05 level. So the obtained Fx is not significant even at
0.05 level (Fx =0.123; P> 0.05). Since the F test applied to the initial scores (X),
Fx falls far short of significance at 0.05 level, it is clear that the means do not differ
significantly.
The table value of F ratio for df 1/74 is 7.01 of 0.01 level. So the obtained
Fy is highly significant (Fy =180.112; P<0.01). Since the F test applied to the final
(Y) scores (Fy) falls far beyond the 0.01 level of significance, it can be tentatively

Analysis and Interpretation of Data 223
interpreted that there is significant difference between the ‘Y’ means of two
groups.
Analysis of Covariance
The final (Y) scores were corrected for difference in initial (X). For that the
SSy have been adjusted for any variability in ‘Y’ contributes by ‘X’. The adjusted
sum of squares for Y, that is, SSyx were computed and the F ratio (Fyx) was
calculated. The summary of analysis of covariance of pre-test and post-test scores
of experimental and control group students having Diverging learning style, taken
separately is given in Table 5.33.
TABLE 5.33
Summary of Analysis of Covariance of ‘X’ (Pre-test) and ‘Y’ (Post-test)
Scores of Experimental and Control Group Students Having DIVERGING
Learning Style, Taken Separately
Source of Variance df SSx SSy SSxy SSyx MSy (Vyx) SDyx
Among group mean
1 0.118 4245.052 22.421 4184.710 4184.71
Within group mean
73 71.920 1744.106 86 1641.270 22.483
Total 74 72.039 5989.158 108.421 5825.981
4.741
Fyx = 483.22
71.4184 =186.126
From table of F ratio, df 1/73 for
F at 0.05 level = 3.98
F at 0.01 level = 7.01

Analysis and Interpretation of Data 224
Since the table value of F ratio for df 1/73 is 7.01 at 0.01 level of
significance, the obtained Fyx ratio is highly significant (Fyx =186.126; P<0.01).
The significant Fyx ratio shows that the means of the post-test scores of students
having Diverging learning style in the experimental and control groups have
significant difference. The significant Fyx ratio also shows that the means of the
post-test scores of students having Diverging learning style in the experimental
and control groups differ significantly even after they have been adjusted for
difference in the pre-test scores. So it can be tentatively interpreted that MIA has
greater effect than the CMDI on the achievement in biology of students having
Diverging learning style.
Comparison of Adjusted ‘Y’ Means
The adjusted means of post-test scores (Y means) of students in the
experimental and control groups having Diverging learning style were computed
and the difference between the adjusted ‘Y’ means was tested for significance. The
data for adjusted means of post-test scores of students having Diverging learning
style in experimental and control groups, taken separately is given in Table 5.34.
TABLE 5.34
Data for Adjusted ‘Y’ Means of Post-test Scores of Experimental and Control
Group Students Having DIVERGING Learning Style, Taken Separately
Group N Mx My Adjusted Y Mean (Myx)
Experimental Group 38 2.842 32.4 32.323
Control Group 38 2.7632 17.42 17.467
General Means 38 2.803 24.91 24.895

Analysis and Interpretation of Data 225
SED between adjusted mean = SDyx 2N
11N
1+
= 4.7416381
381+ = 1.087
Obtained difference between means =32.4 – 17.42 =14.98
Calculated ‘t’ value = DSE
means Ybetween Difference
= 087.1
98.14 = 13.781
Table value of ‘t’
‘t’ at 0.05 level = 1.99
‘t’ at 0.01 level = 2.64
The table value of ‘t’ is 1.99 at 0.05 level and 2.64 at 0.01 level. The
calculated ‘t’ value (13.781) is significant at 0.01 level. The significantly greater
adjusted ‘Y’ mean of the experimental group than the control group indicates that
experimental group is superior to control group on the achievement in biology. It
may therefore be inferred that MIA is more effective than CMDI on the
achievement in biology of secondary school students having diverging learning
style.
5.7.2. Comparison of the effectiveness of MIA and CMDI on the
achievement in biology of experimental and control group students
having ACCOMODATING learning style.
To compare the effectiveness of MIA and CMDI on the achievement in
biology of secondary school students having Accommodating learning style, the

Analysis and Interpretation of Data 226
pre-test and post-test scores of students having Accommodating learning style in
the experimental and control groups were subjected to the statistical analysis of
covariance. The summary of analysis of variance of ‘X’ (pre-test) and ‘Y’ (post-
test) scores of experimental and control group students having Accommodating
learning style, taken separately is given in Table 5.35.
TABLE 5.35
Summary of Analysis of Variance of ‘X’ (Pre-test) and ‘Y’ (Post-test) Scores
of Experimental and Control Group Students having ACCOMODATING
Learning Style, Taken Separately
Source of Variance df SSx SSy MSx(Vx) MSy(Vy)
Among group mean 1 0.039 1047.116 0.039 1047.116
Within group mean 24 30 418 1.25 17.4166
Total 25 30.039 1465.116
Fx = 25.1039.0 = 0.0312
Fy 4166.17
116.1047 = 60.122
From table of F ratio, df for 1/24
F at 0.05 level = 4.26
F at 0.01 level = 7.82
The obtained Fx and Fy ratios were tested for significance. The table value of F
ratio for 1/24 is 4.26 at 0.05 level. So the obtained Fx is not significant even at 0.05
level (Fx =0.0312; P> 0.05). Since the F test applied to the initial scores (X), Fx

Analysis and Interpretation of Data 227
falls far short of significance at 0.05 level, it is clear that the means do not differ
significantly.
The table value of F ratio for df 1/24 is 7.82 of 0.01 level. So the obtained
Fy is highly significant (Fy =60.122; P<0.01). Since the F test applied to the final
(Y) scores (Fy) falls far beyond the 0.01 level of significance, it can be tentatively
interpreted that there is significant difference between the ‘Y’ means of two
groups.
Analysis of Covariance
The final (Y) scores were corrected for difference in initial (X) scores. For
that the SSy have been adjusted for any variability in ‘Y’ contributes by ‘X’. The
adjusted sum of squares for ‘Y’, that is, SSyx were computed and the F ratio (Fyx)
was calculated. The summary of analysis of covariance of pre-test and post-test
scores of experimental and control group students having Accommodating learning
style, taken separately is given in Table 5.36.
TABLE 5.36
Summary of Analysis of Covariance of ‘X’ (Pre-test) and ‘Y’ (Post-test)
Scores of Experimental and Control Group Students Having
ACCOMODATING Learning Style, Taken Separately
Source of Variance df SSx SSy SSxy SSyx MSy (Vyx) SDyx
Among group mean
1 0.039 1047.116 -6.364 1038.575 1038.575
Within group mean
23 30 418 -17 408.367 17.755
Total 24 30.039 1465.116 -23.364 1446.942
4.2136

Analysis and Interpretation of Data 228
Fyx = 755.17575.1038 = 58.49
From table of F ratio, df 1/23 for
F at 0.05 level = 4.28
F at 0.01 level = 7.88
Since the table value of F ratio for df 1/23 is 7.88 at 0.01 level of
significance, the obtained Fyx ratio is highly significant (Fyx =58.49; P<0.01). The
significant Fyx ratio shows that the means of the post-test scores of students having
Accommodating learning style in the experimental and control groups have
significant difference. The significant Fyx ratio also shows that the means of the
post-test scores of students having Accommodating learning style in the
experimental and control groups differ significantly even after they have been
adjusted for difference in the pre-test scores. So it can be tentatively interpreted
that MIA has greater effect than the CMDI on the achievement in biology of
secondary school students having Accommodating learning style.
Comparison of Adjusted ‘Y’ Means
The adjusted means of post-test scores (Y means) of students having
Accommodating learning style in the experimental and control groups were
computed and the difference between the adjusted ‘Y’ means was tested for
significance. The data for adjusted means of post-test scores of students having
Accommodating learning style in experimental and control Groups taken
separately is given in Table 5.37.

Analysis and Interpretation of Data 229
TABLE 5.37
Data for Adjusted ‘Y’ Means of Post-test Scores of Experimental and
Control Group Students having ACCOMODATING Learning Style,
Taken Separately
Group N Mx My Adjusted Y Mean (Myx)
Experimental Group 13 2.769 29.08 29.0579
Control Group 13 2.846 16.385 16.4065
General Means 13 2.808 22.7325 22.7322
SED between adjusted mean = SDyx 2N
11N
1+
= 4.2137131
131+ = 1.6527
Obtained difference between means =29.08 – 16.385 =12.695
Calculated ‘t’ value = DSE
means Ybetween Difference
= 6527.1
695.12 = 7.6814
Table value of ‘t’
‘t’ at 0.05 level = 2.06
‘t’ at 0.01 level = 2.78
The table value of ‘t’ is 2.06 at 0.05 level and 2.78 at 0.01 level. The
calculated ‘t’ value (7.6814) is significant at 0.01 level. The significantly greater
adjusted ‘Y’ mean of the experimental group than the control group indicates that

Analysis and Interpretation of Data 230
experimental group is superior to control group on the achievement in biology. It
may therefore be inferred that MIA is more effective than CMDI on the
achievement in biology of secondary school students having Accommodating
learning style.
5.7.3. Comparison of effectiveness of MIA and CMDI on the
Achievement in biology of secondary school students having
ASSIMILATING learning style.
To compare the effectiveness of MIA and CMDI on the achievement in
biology of secondary school students having Assimilating learning style, the pre-
test and post-test scores of experimental and control group students having
Assimilating learning style were subjected to the statistical analysis of covariance.
The summary of analysis of variance of ‘X’ (pre-test) and ‘Y’ (post-test) scores of
students having Assimilating learning style in experimental and control groups,
taken separately is given in Table 5.38.
TABLE 5.38
Summary of Analysis of Variance of ‘X’ (Pre-test) and ‘Y’ (Post-test) Scores
of Experimental and Control Group Students having ASSIMILATING
Learning Style, Taken Separately
Source of Variance df SSx SSy MSx(Vx) MSy(Vy)
Among group mean 1 1.29 900.658 1.29 900.658
Within group mean 36 28.11 813.158 0.7808 22.5877
Total 37 29.40 1713.816

Analysis and Interpretation of Data 231
Fx = 7808.029.1 = 1.652
Fy = 5877.22658.900 = 39.874
From table of F ratio, df for 1/36
F at 0.05 level = 4.12
F at 0.01 level = 7.42
The obtained Fx and Fy ratios were tested for significance. The table value of
F ratio for 1/36 is 4.12 at 0.05 level. So the obtained Fx is not significant even at
0.05 level (Fx = 1.652; P> 0.05). Since the F test applied to the initial scores (X),
Fx falls far short of significance at 0.05 level, it is clear that the means do not differ
significantly.
The table value of F ratio for df 1/36 is 7.42 of 0.01 level. So the obtained
Fy is highly significant (Fy =39.874; P<0.01). Since the F test applied to the final
(Y) scores (Fy) falls far beyond the 0.01 level of significance, it can be tentatively
interpreted that there is significant difference between the ‘Y’ means of two
groups.
Analysis of Covariance
The final (Y) scores were corrected for difference in initial (X) scores. For
that the SSy have been adjusted for any variability in ‘Y’ contributes by ‘X’. The
adjusted sum of squares for ‘Y’, that is, SSyx were computed and the F ratio (Fyx)
was calculated. The summary of analysis of covariance of pre-test and post-test
scores of experimental and control group students having Assimilating learning
style, taken separately is given in Table 5.39.

Analysis and Interpretation of Data 232
TABLE 5.39
Summary of Analysis of Covariance of ‘X’ (Pre-test) and ‘Y’ (Post-test)
Scores of Experimental and Control Group Students having
ASSIMILATING Learning Style, Taken Separately
Source of Variance df SSx SSy SSxy SSyx
MSy (Vyx)
SDyx
Among group mean 1 1.29 900.658 -34.0789 804.527 804.527
Within group mean 35 28.11 813.158 -24.8421 791.204 22.6
Total 36 29.40 1713.816 -58.921 1595.731
4.753
Fyx = 6.22
5276.804 = 35.598
From table of F ratio, df 1/35 for
F at 0.05 level = 4.12
F at 0.01 level = 7.42
Since the table value of F ratio for df 1/35 is 7.42 at 0.01 level of
significance, the obtained Fyx ratio is highly significant (Fyx =35.598; P<0.01). The
significant Fyx ratio shows that the means of the post-test scores of students having
Assimilating learning style in the experimental and control groups have significant
difference. The significant Fyx ratio also shows that the means of the post-test
scores of students having Assimilating learning style in the experimental and
control groups differ significantly even after they have been adjusted for difference
in the pre-test scores. So it can be tentatively interpreted that MIA has greater
effect than the CMDI on the achievement in biology of students having
Assimilating learning style.

Analysis and Interpretation of Data 233
Comparison of Adjusted ‘Y’ Means
The adjusted means of post-test scores (Y means) of experimental and
control group students having Assimilating learning style were computed and the
difference between the adjusted ‘Y’ means was tested for significance. The data for
adjusted means of post-test scores of students having Assimilating learning style in
experimental and control groups are given in Table 5.40.
TABLE 5.40
Data for Adjusted ‘Y’ Means of Post-test Scores of Experimental And
Control Group Students having ASSIMILATING
Learning Style, Taken Separately
Group N Mx My Adjusted Y Mean (Myx)
Experimental Group 19 2.368 28.58 28.743
Control Group 19 2.737 18.8 18.637
General Means 19 2.553 23.69 23.69
SED between adjusted mean = SDyx 2
11
1NN
+
= 4.753191
191+ = 1.542
Obtained difference between means =28.58– 18.8 =9.78
Calculated ‘t’ value = DSE
means Ybetween Difference
= 542.178.9 = 6.342
Table value of ‘t’
‘t’ at 0.05 level = 2.02
‘t’ at 0.01 level = 2.71

Analysis and Interpretation of Data 234
The table value of ‘t’ is 2.02 at 0.05 level and 2.71 at 0.01 level. The
calculated ‘t’ value (6.363) is significant at 0.01 level. The significantly greater
adjusted ‘Y’ mean of the experimental group than the control group indicates that
experimental group is superior to control group on the achievement in biology. It
may therefore be inferred that MIA is more effective than CMDI on the
achievement in biology of secondary school students having Assimilating learning
style.
5.7.4. Comparison of effectiveness of MIA and CMDI on the
achievement in biology of experimental and control group students
having CONVERGING learning style.
To compare the effectiveness of MIA and CMDI on the achievement in
biology of secondary school students having Converging learning style, the pre-test
and post-test scores of experimental and control group students having Converging
learning style were subjected to the statistical analysis of covariance. The summary
of analysis of variance of ‘X’ (pre-test) and ‘Y’ (post-test) scores of students
having Converging learning style in experimental and control groups, taken
separately is given in Table 5.41.
TABLE 5.41
Summary of Analysis of Variance of ‘X’ (Pre-test) and ‘Y’ (Post-test) Scores of Experimental and Control Group Students having CONVERGING
Learning Style, Taken Separately Source of Variance df SSx SSy MSx(Vx) MSy(Vy)
Among group mean 1 1.2003
512.533 1.2003 512.533
Within group mean 28 30.2667 737.467 1.08095 26.338
Total 29 31.4670 1250

Analysis and Interpretation of Data 235
Fx = 08095.12003.1 = 1.1104
Fy = 338.026533.512 = 19.359
From table of F ratio, df for 1/28
F at 0.05 level = 4.20
F at 0.01 level = 7.64
The obtained Fx and Fy ratios were tested for significance. The table value
of F ratio for 1/28 is 4.20 at 0.05 level. So the obtained Fx is not significant even at
0.05 level (Fx =1.1104; P> 0.05). Since the F test applied to the initial scores (X),
Fx falls far short of significance at 0.05 level, it is clear that the means do not differ
significantly.
The table value of F ratio for df 1/28 is 7.64 of 0.01 level. So the obtained
Fy is highly significant (Fy =19.359; P<0.01). Since the F test applied to the final
(Y) scores (Fy) falls far beyond the 0.01 level of significance, it can be tentatively
interpreted that there is significant difference between the ‘Y’ means of two
groups.
Analysis of Covariance
The final (Y) scores were corrected for difference in initial (X) scores. For
that the SSy have been adjusted for any variability in ‘Y’ contributes by ‘X’. The
adjusted sum of squares for ‘Y’, that is, SSyx were computed and the F ratio (Fyx)
was calculated. The summary of analysis of covariance of pre-test and post-test
scores of students having Converging learning style in the experimental and
control groups, taken separately is given in Table 5.42.

Analysis and Interpretation of Data 236
TABLE 5.42
Summary of Analysis of Covariance of ‘X’ (Pre-test) and ‘Y’ (Post-test)
Scores of Experimental and Control Group Students having CONVERGING
Learning Style, Taken Separately
Source of Variance df SSx SSy SSxy SSyx
MSy (Vyx)
SDyx
Among group mean 1 1.2003
512.533 24.8 519.8243 519.824
Within group mean 27 30.2667 737.467 -16.8 728.1419 26.9682
Total 28 31.4670 1250 8 1247.966
5.1930
Fyx = 9682.268243.519 = 19.2754
From table of F ratio, df 1/27 for
F at 0.05 level = 4.21
F at 0.01 level = 7.68
Since the table value of F ratio for df 1/27 is 7.68 at 0.01 level of
significance, the obtained Fyx ratio is highly significant (Fyx =19.2754; P<0.01).
The significant Fyx ratio shows that the means of the post-test scores of students
having Converging learning style in the experimental and control groups have
significant difference. The significant Fyx ratio also shows that the means of the
post-test scores of students having Converging learning style in the experimental
and control groups differ significantly even after they have been adjusted for
difference in the pre-test scores. So it can be tentatively interpreted that MIA has
greater effect than CMDI on the achievement in biology of students having
Converging learning style.

Analysis and Interpretation of Data 237
Comparison of Adjusted ‘Y’ Means
The adjusted means of post-test scores (Y means) of students having
Converging learning style in the experimental and control groups were computed
and the difference between the adjusted ‘Y’ means was tested for significance. The
data for adjusted means of post-test scores of students having Converging learning
style in the experimental and control groups, taken separately is given in Table
5.43.
TABLE 5.43
Data for Adjusted ‘Y’ Means of Post-test Scores of Experimental and
Control Group Students having CONVERGING Learning Style, Taken
Separately
Group N Mx My Adjusted Y Mean (Myx)
Experimental Group 15 3.333 28.133 28.254
Control Group 15 2.933 19.867 19. 745
General Means 15 3.133 24.00 24.00
SED between adjusted mean = SDyx 2
11
1NN
+
= 5.1930151
151+ = 1.895
Obtained difference between means =28.133 – 19.867 =8.266

Analysis and Interpretation of Data 238
Calculated ‘t’ value = DSE
means Ybetween Difference
= 895.1266.8 = 4.362
Table value of ‘t’
‘t’ at 0.05 level = 2.13
‘t’ at 0.01 level = 2.95
The table value of ‘t’ is 2.13 at 0.05 level and 2.95 at 0.01 level. The
calculated ‘t’ value (4.362) is significant at 0.01 level. The significantly greater
adjusted ‘Y’ mean of the experimental group than the control group indicates that
experimental group is superior to control group in academic achievement. It may
therefore be inferred that the MIA is more effective than CMDI on the
achievement in biology of secondary school students having Converging learning
style.
The summary of analysis of covariance of pre-test and post-test scores of
students having different Learning styles in experimental and control groups,
taken separately is given in Table 5.44.

TABLE 5.44
Summary of Analysis of Covariance of X (Pre-test) and Y (Post-test) Scores of Experimental and Control Group students having different Learning Styles, Taken Separately
Learning Styles Groups Source
of Variation
df SSx SSy SSxy SSyx MSyx SDyx Fyx Level of
Significance
Among group mean
1 0.118 4245.052 22.421 4184.711 4184.711 Diverging
Experimental group and Control group
Within group mean
73 71.921 1744.106 86 1641.270 22.483
4.742 186.126 P<0.01
Among group mean
1 0.039 1047.116 -6.364 1038.575 1038.575
Accommodating
Experimental group and Control group
Within group mean
23 30 418 -17 408.367 17.755
4.214 58.49 P<0.01
Among group mean
1 1.29 900.658 -34.079 804.528 804.528
Assimilating
Experimental group and Control group
Within group mean
35 28.11 813.158 -24.842 791.204 22.6
4.753 35.598 P<0.01
Among group mean
1 1.200 512.533 24.8 519.824 519.824
Converging
Experimental group and Control group
Within group mean
27 30.267 737.467 -16..8 728.142 26.968
5.1898 19.333 P<0.01

Analysis and Interpretation of Data 240
The summary of adjusted means of pre-test and post-test scores of
students in experimental and control groups having different Learning styles,
taken separately is given in Table 5.45.
TABLE 5.45
Consolidated Result of the Adjusted Means of Post-test Scores of
Experimental and Control Group Students having Different
Learning Styles, Taken Separately
Learning Styles Group N Mx My Myx t value
Level of Signifi cance
Experi-mental 38 2.842 32.4 32.323 Diverging
Control 38 2.763 17.42 17.467 13.775 P<0.01 Experi-mental 13 2.769 29.08 29.058 Accomm-
odating Control 13 2.846 16.385 16.407 7.681 P<0.01 Experi-mental 19 2.368 28.58 28.743 Assimi-
lating Control 19 2.737 18.8 18.637 6.342 P<0.01 Experi-mental 15 3.333 28.133 28.255 Converging
Control 15 2.933 19.867 19.745 4.362 P<0.01
From the analysis of pre-test and post-test scores of students in
experimental and control groups, having different learning styles, by using the
statistical technique of analysis of covariance it becomes apparent that MIA is
more effective than CMDI on the achievement in biology of secondary school
students having different learning styles.

Analysis and Interpretation of Data 241
0
5
10
15
20
25
30
35
Marks
Post- test Post- test
Experimental Group Control Group
Learning Styles
D
As
Ac
Co
FIGURE 5.7 The Comparison of Mean Post-Test Scores of Students
Having Different Learning Styles in Experimental and
Control Groups
5.8 Comparison of the Effectiveness of MIA on the Achievement in Biology of
Students in Experimental Group having Different Learning Styles
To compare the effectiveness of MIA on the achievement in biology of
secondary school students having different Learning styles in the experimental

Analysis and Interpretation of Data 242
group, the pre-test, post-test and gain scores of students having different Learning
styles of the experimental group were subjected to the statistical analysis.
TABLE 5.46
Mean and Standard Deviation of Pre-test, Post-test and Gain Scores of
Experimental Group Students Having Different Learning Styles
Experimental Group
Learning Style
PRETEST POSTTEST GAIN
Mean
2.87
33.75
30.94
Diverging
Std. Deviation
1.04
5.06
5.03
Mean
2.74
28.11
25 Accommodating Std. Deviation
0.81
4.51
4.64
Mean
2.5
28.23
25.5 Assimilating Std. Deviation
0.86
4.98
4.9
Mean
3.29
27.67
25 Converging Std. Deviation
1.15
4.51
4.85

Analysis and Interpretation of Data 243
0
5
10
15
20
25
30
35
Marks
D As Ac Co
Learning Styles
PRETESTPOSTESTGAIN
FIGURE 5.8 The Comparison of Mean Pre-Test, Post-Test and Gain
Scores of Experimental Group Students Having
Different Learning Styles
Analysis of Variance
To compare the effectiveness of MIA on the achievement in biology of
secondary school students having different learning styles in the experimental group,
the pre-test and post-test scores of students having different learning styles in the
experimental group were subjected to the statistical analysis of variance. The
summary of analysis of variance of ‘X’ (pre-test) and ‘Y’ (post-test) scores of

Analysis and Interpretation of Data 244
experimental group students having different learning styles, taken separately is
given in Table 5.47.
TABLE 5.47
Summary of Analysis of Variance of ‘X’ (Pre-test) and ‘Y’ (Post-test) Scores of Students Having Different Learning Styles in the Experimental Group,
Taken Separately
Source of Variance
df SSx SSy MSx(Vx) MSy(Vy)
Among group mean 3 6.945 701.51 2.315 233.837
Within group mean
90 86.970 2086.32 0.966 23.181
Total 93 93.915 2787.83
Fx = 966.0315.2 = 2.396
Fy = 181.23837.233 = 10.087
From table of F ratio, df for 3/90
F at 0.05 level = 2.71
F at 0.01 level = 4.01
The obtained Fx and Fy ratios were tested for significance. The table value of
F ratio for 3/90 is 2.71 at 0.05 level. So the obtained Fx is not significant even at
0.05 level (Fx =2.396; P> 0.05). Since the F test applied to the initial scores (X), Fx
falls far short of significance at 0.05 level, it is clear that the means do not differ
significantly.

Analysis and Interpretation of Data 245
The table value of F ratio for df 3/90 is 4.01 at 0.01 level. So the obtained
Fy is highly significant (Fy =10.087; P<0.01). Since the F test applied to the final
(Y) scores (Fy) falls far beyond the 0.01 level of significance, it can be tentatively
interpreted that there is significant difference among the ‘Y’ means of the four
different Learning style groups in the experimental group.
This indicates that there is significant difference in the means of post- test
scores among the four different Learning style groups. However it does not
necessarily imply that all the means are significantly different from each other.
Here visual inspection of the Figure 5.9 may suggest that they are all significantly
different. Since visual inspection is not scientific, the Post hoc test (Bonferroni
Test) was applied.
Experimental Group -Post- test
D, 33.75
As, 28.23
Ac, 28.11
Co, 27.67
DAsAcCo
FIGURE 5.9 The Comparison of Mean Post-Test of Students Having
Different Learning Styles in the Experimental Group

Analysis and Interpretation of Data 246
5.8.1 The Bonferroni Test
Post hoc tests are used to determine where the significant differences lie after
the null hypothesis has been rejected in ANOVA. Since the F test applied to the
final (Y) scores (Fy) falls far beyond the 0.01 level of significance (Fy =10.087;
P<0.01), it can be tentatively interpreted that there is significant difference among
the means of post-test scores of the four different Learning style groups. But it is
not clear where do the differences lie.
The Bonferroni test used an F ratio to test for a significant difference between
any two different Learning style groups. It used the value of ‘k’ from the original
experiment to compute ‘df’ between treatments. Thus, ‘df’ for the numerator of
the F ratio is ‘k – 1’; where ‘k’ is the number of groups and the critical value of the
Bonferroni test (F ratio) is the same as was used to evaluate the F ratio from the
overall ANOVA.
Thus the Bonferroni test requires that every post-test satisfies the criteria
used for the overall ANOVA. The procedure is to start testing using the biggest
mean difference and continue testing until a non-significant difference is produced.
The summary of the Bonferroni test analysis of the means of post-test scores of
students having different Learning styles in the experimental group, taken
separately is given in Table 5.48.

Analysis and Interpretation of Data 247
TABLE 5.48
Summary of the Bonferroni Test Analysis of the means of Post-test Scores of
Students Having Different Learning Styles in the Experimental group,
Taken Separately
LS (I) LS (J) Mean Difference (I-J)
F ratio
Significance level
D As 5.52* .000
Acc 5.64* .001
Co 6.08* .000
As D -5.52* .000
Acc .12 1.000
Co .56 1.000
Acc D -5.64* .001
As -.12 1.000
Co .44 1.000
Co D -6.08* .000
As -.56 1.000
Acc -.44 1.000
* The mean difference is significant at the .01 level.
5.8.2 Comparison of the effectiveness of MIA on the achievement in
biology of experimental group students having different learning styles.
A. Comparison between diverging and assimilating learning style groups.
The table value of F ratio for df 3/90 is 2.71 at 0.05 level and 4.01 at 0.01
level. The obtained Fy is highly significant (Fy =5.52; P<0.01). Since the F test
applied to the final (Y) scores (Fy) falls far beyond the 0.01 level of significance, it

Analysis and Interpretation of Data 248
became apparent that there is significant difference between the ‘Y’ means of the
Diverging and Assimilating learning style groups.
B. Comparison between diverging and accommodating learning style
groups.
The table value of F ratio for df 3/90 is 2.71 at 0.05 level and 4.01 at 0.01 level.
The obtained Fy is highly significant (Fy =5.64; P<0.01). Since the F test applied to
the final (Y) scores (Fy) falls far beyond the 0.01 level of significance, it became
apparent that there is significant difference between the ‘Y’ means of the
Diverging and Accommodating learning style groups.
C. Comparison between diverging and converging learning style groups.
The table value of F ratio for df 3/90 is 2.71 at 0.05 level and 4.01 at 0.01
level. The obtained Fy is highly significant (Fy =6.08; P<0.01). Since the F test
applied to the final (Y) scores (Fy) falls far beyond the 0.01 level of significance, it
became apparent that there is significant difference between the ‘Y’ means of the
Diverging and Converging learning style groups.
The obtained values of Fy of all other group comparisons are not significant
even at 0.05 level (P > 0.05). This indicates that the other groups are more or less
equivalent on their achievement in biology.
The table value of F ratio for df 3/90 is 4.01 at 0.01 level. The calculated F
values of Diverging learning style group in comparison with Assimilating,
Accommodating and Converging learning style groups are 5.52, 5.64, 6.08
respectively and are significant at 0.01 level. The significantly greater adjusted
‘Y’ means of the Diverging learning style group than other learning style groups in
the experimental group indicates that Diverging learning style group is superior to

Analysis and Interpretation of Data 249
other learning style groups on the achievement in biology. It may therefore be
inferred that the students having Diverging learning style taught through MIA
have better achievement in biology than other three learning style groups such as
accommodating, assimilating and converging groups who were also taught
through MIA.
5.9. Comparison of the Effectiveness of MIA on the Achievement in Biology of
Students in the Experimental Group having Different levels of MI
To compare the effectiveness of MIA on the achievement in biology of
secondary school students having different levels of MI, the investigator
administered the Multiple Intelligence inventory (prepared and standardized by the
investigator) on the experimental and control group students. On the basis of the
scores obtained from the inventory, the students were categorized into eight
groups, viz. Verbal/Linguistic, Logical/ Mathematical, Visual/ Spatial, Bodily/
Kinaesthetic, Musical/ Rhythmical , Interpersonal, Intrapersonal and Naturalistic.
In order to find out the effect of MIA on the achievement in biology of
secondary school students having different levels of MI, it was essential that the
achievement scores of the above eight intelligence groups of experimental group
be compared and analyzed. Thus the pre-test, post-test and gain scores of eight MI
groups of experimental group were subjected to the statistical analysis.
The pre-test, post-test and gain scores of experimental group students having
different levels of MI were condensed into frequency tables and then calculated the
mean and standard deviation. The values of statistics calculated are given in Table
5.49.

Analysis and Interpretation of Data 250
TABLE 5.49
Mean and Standard Deviation of the Pre test, Post-test and Gain Scores of
Students Having Different Levels of MI
in the Experimental Group
Multiple Intelligence
POST TEST
PRETEST
GAIN
Mean 31.10 2.90 27.60 Bodily/ Kinaesthetic
SD 6.28 0.99 5.66
Mean 35.40 2.87 32.87 Interpersonal
SD 3.18 1.06 3.00
Mean 28.08 2.58 25.50 Intrapersonal
SD 4.36 1.08 4.36
Mean 26.23 2.85 23.00 Logical/ Mathematical
SD 3.35 .69 3.44
Mean 27.91 3.00 25.36 Visual/Spatial
SD 5.61 1.55 5.41
Mean 27.91 2.73 25.09 Verbal/ Linguistic
SD 5.79 0.79 5.96
Mean 31.17 2.75 28.33 Musical/ Rhythmical SD 5.13 0.97 5.57
Mean 30.80 3.20 28.20 Naturalistic
SD 4.85 0.92 5.14

Analysis and Interpretation of Data 251
POSTEST
PRETEST
Nat MusIntra Log Spat LingType of Intelligence
Inter Bk
40
35
30
25
20Scores
15
10
5
0
FIGURE 5.10 The Comparison of Mean Pre- Test and Post-Test Scores of
Experimental Group Students Having Different Levels of
MI

Analysis and Interpretation of Data 252
To compare the effectiveness of MIA on the achievement in biology of secondary
school students having different levels of MI in the experimental group, the pre-test
and post-test scores of students having different levels of MI of the experimental
group were subjected to the statistical analysis of variance. The summary of
analysis of variance of ‘X’ (pre-test) and ‘Y’ (post-test) scores of students having
different levels of MI in the experimental group, taken separately is given in Table
5.50.
TABLE 5.50
Summary of Analysis of Variance of ‘X’ (Pre-test) and ‘Y’ (Post-test) Scores
of Students Having Different Levels of MI in the
Experimental Group, Taken Separately
Source of Variance df SSx SSy MSx(Vx) MSy(Vy)
Among group mean
7
2.641
797.021
0.377
113.860
Within group mean
86
91.274
1990.809
1.061
23.149
Total
93
93.915
2787.830
Fx = 061.1377.0 = 0.355
Fy =149.23860.113 = 4.919
From table of F ratio, df for 7/86
F at 0.05 level = 2.06
F at 0.01 level = 2.74

Analysis and Interpretation of Data 253
The obtained Fx and Fy ratios were tested for significance. The table value
of F ratio for 7/86 is2.06 at 0.05 level. So the obtained Fx is not significant even at
0.05 level (Fx =0.355; P> 0.05). Since the F test applied to the initial scores (X), Fx
falls far short of significance at 0.05 level, it is clear that the means do not differ
significantly.
The table value of F ratio for df 7/86 is 2.74 at 0.01 level. So the obtained
Fy is highly significant (Fy =4.919; P<0.01). Since the F test applied to the final
(Y) scores (Fy) falls far beyond the 0.01 level of significance, it can be tentatively
interpreted that there is significant difference among the ‘Y’ means of eight MI
groups.
This indicates that there is a significant difference in the mean post- test
scores among the eight different of MI groups. However it does not necessarily
imply that all the means are significantly different from each other. Here visual
inspection of the Figure 5.11 may suggest that they are all significantly different.
Since visual inspection is not scientific, the Post hoc test (Bonferroni Test) was
applied.

Analysis and Interpretation of Data 254
Post- test Mean
Bk
Inter
Intra
LogicalSpatial
Lingul
Musical
Natural
BkInterIntraLogicalSpatialLingulMusicalNatural
FIGURE 5.11 The Comparison of Mean Post-Test Scores of the
Experimental Group Students Having Different Levels of
MI
5.9.1. The Bonferroni test.
Post hoc tests are used to determine where the significant differences lie after
the null hypothesis has been rejected in ANOVA. Since the F test applied to the
final (Y) scores (Fy) falls far beyond the 0.01 level of significance (Fy =4.919;
P<0.01), it can be tentatively interpreted that there is significant difference among
the means of post-test scores of the eight Different MI groups. But it is not clear
where do the differences lie.

Analysis and Interpretation of Data 255
The Bonferroni test used an F ratio to test for a significant difference
between any two MI groups. It used the value of ‘k’ from the original experiment
to compute ‘df’ between treatments. Thus, ‘df’ for the numerator of the F ratio is
‘k – 1’; where ‘k’ is the number of groups and the critical value of the Bonferroni
test (F ratio) is the same as was used to evaluate the F ratio from the overall
ANOVA.
Thus the Bonferroni test requires that every post-test satisfies the criteria
used for the overall ANOVA. The procedure is to start testing using the biggest
mean difference and continue testing until a non-significant difference is produced.
The summary of the Bonferroni test analysis of the means of post-test scores
of students having different levels of MI in the experimental group, taken
separately is given in Table 5.51.
TABLE 5.51
Summary of the Bonferroni Test Analysis of the means of Post-test Scores of
Experimental Group Students having Different levels of MI, Taken
Separately
(I) MI
(J) MI
Mean Difference
(I-J)
Std.
Error
Sig.
Inter-personal Intrapersonal 7.32 1.86 0.01
Logical/Mathematical 9.17 1.82 0.01
Visual/Spatial 7.49 1.91 0.01
Verbal/Linguistic 7.49 1.91 0.01

Analysis and Interpretation of Data 256
5.9.2. Comparison of the effectiveness of MIA on the achievement in
biology of experimental group students having different levels of MI.
A. Comparison between Interpersonal and Intrapersonal Intelligences
groups.
The table value of F ratio for df 7/86 is 2.06 at 0.05 level and 2.74 at 0.01
level. The obtained Fy is highly significant (Fy =7.32; P<0.01). Since the F test
applied to the final (Y) scores (Fy) falls far beyond the 0.01 level of significance, it
becomes apparent that there is significant difference between the ‘Y’ means of the
Interpersonal and Intrapersonal intelligences groups.
B. Comparison between Interpersonal and logical/ Mathematical
Intelligences groups.
The table value of F ratio for df 7/86 is 2.06 at 0.05 level and 2.74 at 0.01
level. The obtained Fy is highly significant (Fy =9.17; P<0.01). Since the F test
applied to the final (Y) scores (Fy) falls far beyond the 0.01 level of significance, it
becomes apparent that there is significant difference between the ‘Y’ means of the
Interpersonal and Logical/Mathematical intelligences groups.
C. Comparison between Interpersonal and Visual/Spatial Intelligences
groups.
The table value of F ratio for df 7/86 is 2.06 at 0.05 level and 2.74 at 0.01
level. The obtained Fy is highly significant (Fy =7.49; P<0.01). Since the F test
applied to the final (Y) scores (Fy) falls far beyond the 0.01 level of significance, it
becomes apparent that there is significant difference between the ‘Y’ means of the
Interpersonal and Visual/Spatial Intelligences groups.

Analysis and Interpretation of Data 257
D. Comparison between Interpersonal and Verbal/ Linguistic
Intelligences groups.
The table value of F ratio for df 7/86 is 2.06 at 0.05 level and 2.74 at 0.01
level. The obtained Fy is highly significant (Fy =7.49; P<0.01). Since the F test
applied to the final (Y) scores (Fy) falls far beyond the 0.01 level of significance, it
becomes apparent that there is significant difference between the ‘Y’ means of the
Interpersonal and Verbal/Linguistic Intelligences groups.
The obtained values of Fy of all other group comparisons are not significant
even at 0.05 level (P > 0.05). This indicated that the other groups are more or less
equivalent on their achievement in biology.
The table value of F ratio for df 7/86 is 2.06 at 0.05 level and 2.74 at 0.01
level. The calculated F values of Interpersonal Intelligence group in comparison
with Intrapersonal, Logical/Mathematical, Visual/Spatial and Verbal/Linguistic
Intelligences groups are 7.32, 9.17, 7.49 and 7.49 respectively and are significant
at 0.01 level. The significantly greater ‘Y’ mean of the Interpersonal intelligence
group than other MI groups in the experimental group indicates that Interpersonal
Intelligence group is superior to other Intelligences groups on the achievement in
biology. It may therefore be inferred that the students having Interpersonal
Intelligence group taught through MIA have better achievement in biology than
other MI groups such as Intrapersonal, Logical/ Mathematical Visual/ Spatial,
Verbal/ Linguistic Intelligences who were also taught through Multiple Intelligence
Approach.