analysing ways to achieve a new urban agenda-based
TRANSCRIPT

sustainability
Article
Analysing Ways to Achieve a New UrbanAgenda-Based Sustainable Metropolitan Transport
Romanika Okraszewska 1,* , Kazimierz Jamroz 1, Lech Michalski 1, Joanna Zukowska 1 ,Krzysztof Grzelec 2 and Krystian Birr 1
1 Department of Highway and Transportation Engineering, Faculty of Civil and Environmental Engineering,Gdansk University of Technology, Gdansk 80-233, Poland; [email protected] (K.J.);[email protected] (L.M.); [email protected] (J.Z.); [email protected] (K.B.)
2 Department of Transportation Market, Faculty of Economics, University of Gdansk, Sopot 81-824, Poland;[email protected]
* Correspondence: [email protected]; Tel.: +48-58-347-27-31
Received: 31 October 2018; Accepted: 29 January 2019; Published: 4 February 2019�����������������
Abstract: The New Urban Agenda (NUA) sets a new vision of sustainable urban development to helpcities deal with the challenges of changing demography. While numerous articles have addressedhow the NUA can be implemented at different levels and in different areas, this article points out thepotential limitations in incorporating the NUA into metropolitan transport policies. The relevance ofthe limitations can be seen in three main fields: incompatibility between legal and financial frameworksand the functional and spatial structures of metropolitan areas, the characteristics of how transportsystems are developed as part of metropolitan functional and spatial structures and the inconsistencyand inadequacy between political declarations (NUA) which are based on ideas and programmes andthe objectives of strategy papers which are based on diagnoses, data analyses and predictive models.The authors put forward the thesis that by concentrating on cities, the NUA leaves out some of thecharacteristics of metropolitan areas. As a consequence, although the NUA can work successfully formetropolitan cores, outer areas are not covered directly. In order to verify the thesis, a comparisonwas made between the NUA’s transport system approach with experience from running and planningmetropolitan transport systems described in the literature. The results of the comparative analysis,confirmed the thesis of the authors and made it possible to formulate general conclusions regarding thespecific conditions of metropolitan areas for the running and developing of the transport system. By usingexplanatory case study of Tri-City Metropolitan Area (TMA) and the Strategy for Transport and Mobilityfor TMA 2030 general assumptions were confirmed and explain in more details. The NUA and STMwere compared for how they address the main areas of intervention related to transport. Differences wereidentified and recommendations were formulated, should the documents be updated. The STM must beupdated in areas such as equity and climate change mitigations while the NUA should be expanded tocover the specific conditions that prevail in functional and metropolitan areas.
Keywords: new urban agenda; metropolitan transport system; civil engineering and transport
1. Introduction
More than 50% of the world’s population lives in urban areas, a large part of it in metropolitanareas. It is predicted that by 2050 70% of the population will live in urban areas [1]. In this situation,it is questionable if the cities are sufficiently equipped to keep pace with this demographic pressure.To give an answer to the massive global trend in urbanization in October 2016 the III United NationsHabitat Conference was held where the New Urban Agenda (NUA) was approved [2].
Sustainability 2019, 11, 813; doi:10.3390/su11030813 www.mdpi.com/journal/sustainability
Sustainability 2019, 11, 813 2 of 21
The NUA is serving as a new vision for the cities and municipalities for the next 20 years.This document sets a new global standard for sustainable urban development and helps to rethinkhow life in the cities can be planned and managed. The NUA aligns with the 17 key SustainableDevelopment Goals (SDG) related to urban development, quality of life and social equity. The mainareas of NUA refer to specific targets of the SDG’s goal No. 11 which is: “to make cities and humansettlements inclusive, safe, resilient and sustainable” [3]. Transport and mobility are key issues forachieving the goal. Reflecting the complexity of urban structures, the new agenda covers a broad set oftopics, where transport and mobility find their place or interact with: other technical infrastructure,urban planning, public space, housing, land use, real estate, energy efficiency, cultural heritage, goodgovernance, regional cooperation, inclusion, equality, gender issue, anti-discrimination, participation,education, health, economy, industry, resilience, disaster risk reduction and financing.
The language used in the document is flexible and supports the delivery of the vision in manyareas and contexts [4]. With no legal force, the NUA is merely a declaration designed to express a jointposition of the stakeholders. Despite that, it does create a language in which urban issues and theurban developments over the coming decades will be discussed. The implementation of the NUAhelps facilitate the achievement of other development agendas, policies, plans, approaches and actionsin the urban context in general [4] or sectoral terms [5] on regional [6,7], national [8] or local level [9]both in developed and developing countries [10].
The NUA’s European delivery instrument is the Urban Agenda for the EU, approved in 2016 underthe Pact of Amsterdam [7]. Partnerships have been launched under the Urban Agenda for the EUinvolving city authorities, member states, EU institutions and other stakeholders. Their goal is toprovide citizens with new opportunities, improve their quality of life and deal with the key challengesthat cities must face, including transport and mobility issues.
On the national level the NUA proposes National Urban Policies (NUPs) within local-nationalpartnerships as one of the fundamental drivers of change, including transport and mobility. The NUPis a key instrument for governments to support the implementation of the NUA, city related SDGsand other global agreements such as the climate change agreements. A report of the OECD [10] showsthat European countries still have a lot to do to develop NUPs. Only eight countries have an explicitnational urban policy and the next eight have partial elements of national urban policies in theirurban policy landscape, offering some foundations on which to build on. Poland adopted its NUPin 2015 elevating it to the level of national strategy papers. With the NUP part of the hierarchy ofdocuments, more consistency is expected in linking thematic development goals with lower levels ofadministration (region, municipality, city).
At the lowest level of administration, urban areas have been given a tool to achieve sustainable urbanmobility. This comes in the form of the European Commission’s proposed Sustainable Urban MobilityPlans (SUMP), a strategic document designed to meet the demand for mobility whilst ensuring adequatequality of life for the residents [11]. The concept of SUMP, as the document to implement SDG No. 11,has been widely adopted in Europe over the last years. Today, two of the cities that form the TMA, that is,Gdansk [12] and Gdynia [13] have already adopted their SUMPs with Sopot still working on the process.
A system of strategic documents with known formal and legal ramifications corresponds to thecountry’s fundamental territorial division. In many countries administrative divisions do not reflectsettlement processes as they happen. Recent decades have seen the rise of polycentric metropolitan regionsconsisting of a number of connected large urban areas, which presents a new set of challenges for transportplanning [14]. New functional and spatial trends call for a metropolitan approach to governance andnew legal and financial frameworks. This is reflected in the NUA [2, article 90] and emphasised in IRU’spublication [14]. Many countries, however, do not have metropolitan governance frameworks in place.The result is a variety of informal structures of cooperation between the relevant bodies [15–20].
Metropolises come in different sizes, spatial forms and degrees of advanced metropolitanprocesses. In Poland, Warsaw is the only city which may qualify as an established metropolis, althoughat a low level when compared to international standards. Apart from Warsaw, other cities with
Sustainability 2019, 11, 813 3 of 21
populations of more than half a million have fairly well developed metropolitan functions. They arePoznan, Wrocław, Kraków, the Tri-City and Silesia Conurbation and Łódz. [21]. The functionaland spatial development of Polish metropolises follows the world’s trends. There are monocentricmetropolises with a single city and polycentric metropolises such as the Silesia Conurbation andthe Tri-City. The morphological differences carry functional consequences due to different types oftransport links (Figure 4). The common feature is a growing demand for longer and more complicatedtechnical infrastructure networks including the transport network.
Dedicated metropolitan governance is common in Poland. Four of the eight metropolitan areas inPoland (Lódz, Wrocław, Poznan and the Tri-City) have metropolitan governance bodies. In Krakow andWrocław the voivodeship, the first level of sub-national government, provides some of the functions ofa typical governance body [15].
Regardless of what type of metropolitan governance has been adopted, strategic papers aredeveloped to support the delivery of metropolitan functions. The new classification of metropolitanfunctions proposed in “Metropolitan areas in Europe” [22], puts transport next to politics, economy,science and culture. Transport is indicated as a key challenge for metropolitan governance by BarcelonaCentre for International Affairs [23] too.
While EU countries commonly plan their strategy papers around the paradigm of sustainabledevelopment, “planning lacks unifying themes or directives for achieving sustainability in cities ( . . . )The existing rating systems can be context-specific by country and may at best target weak sustainability astheir intended outcome” [4]. Therefore, it seems reasonable to seek answers to how the New Urban Agendaaligns with strategic planning of infrastructure and cities but also at particular levels of territorial division.
Because they are designed to promote new ideas, political declarations such as the NUA,set the main goals and directions for sustainable development and non-discrimination policies.They also relate to the relevant science and research. The literature presents debates on sustainabledevelopment which can be divided into a few themes: a) conceptual; b) contextual; c) academic;and d) geopolitical [24]. A review of the literature shows that research and development interestsconcentrate on sustainable development goals, the results of decisions taken, proposed sequences ofactions, the tools used and ways to measure results [4,24–28]. The objective of this article is to enrichthe knowledge on how to plan and implement sustainable development effectively by identifyingpotential inconsistencies and inadequacies of the political declarations (NUA) which are based onideas and programmes and the goals contained in strategy papers which are formulated on the basisof diagnoses, data analyses and predictive modelling. If formalised and dedicated to a strict deliveryof political declarations, the inconsistency may hamper the delivery of strategic targets or even causeorganisations to abandon the goals altogether. This constitutes a methodological error and one thatstems from failure to acknowledge specific aspects of sustainable development policy which maybe a consequence of a country’s social, economic and political ramifications [10]. As suggested bythe author [10] Poland’s fundamental administrative division at city level may find it difficult toimplement the New Urban Agenda successfully “in the conditions of constantly changing law, lack ofproper financing and organizational problems that Polish cities have to face” [10].
2. Method
2.1. Study Method
Having developed the Strategy for Transport and Mobility for the Tri-City Metropolitan Areaour team realised that metropolitan areas are not addressed directly by the NUA and that the specificneeds of metropolitan areas and their transport systems are not accounted for. The overall objective ofthe work was to establish whether:
• the NUA’s proposed approach to urban visions, principles, implementation and follow-up andreview can be successfully used in metropolitan areas?
• the NUA’s proposed principles can be used for planning metropolitan transport systems?

Sustainability 2019, 11, 813 4 of 21
To achieve the main goal two groups of specific research objectives were adopted: scientific andpractical. The scientific objective was to analyse how well the NUA corresponds to previous experienceand principles of transport planning in metropolitan areas. The practical objective was to formulaterecommendations to both documents in the main areas of intervention covering the operation anddevelopment of the urban (NUA) and metropolitan transport system (STM). The objectives wereachieved by using a set of methods as schematically presented in Figure 1.
Sustainability 2019, 11, 813 4 of 23
To achieve the main goal two groups of specific research objectives were adopted: scientific and practical. The scientific objective was to analyse how well the NUA corresponds to previous experience and principles of transport planning in metropolitan areas. The practical objective was to formulate recommendations to both documents in the main areas of intervention covering the operation and development of the urban (NUA) and metropolitan transport system (STM). The objectives were achieved by using a set of methods as schematically presented in figure 1.
Figure 1. Diagram of the method for achieving scientific and practical objectives.
2.2. Achieving the Scientific Objectives
To achieve the scientific objectives the authors of this article used three study methods: literature review, case study and comparative analysis.
Literature review was designed to identify and analyse transport problems in metropolitan areas to use as the basis for answering the following questions:
• RQ1. How are transport and population mobility problems represented in the NUA? • RQ2. What is the transport management experience in metropolitan areas? • RQ3. What transport problems are found in metropolitan areas?
Literature studies looked at NUA implementation experience [6,29,30], the research methods applied [24,27,28] and the identification of metropolitan transport problems [31]. A few dozen scientific publications were studied such as [16,25,32], reports from NUA implementation, for example [5,8] and case studies, for example [4]. The answers to scientific questions one (RQ1), two (RQ2) and three (RQ3) are presented in Section 3.
Case study included identifying and analysing transport problems using the example of the Tri-City Metropolitan Area (TMA). The authors first characterised the TMA and its transport system and presented its strategic document titled Strategy for Transport and Mobility in the TMA until 2030. Next, studies and analyses were conducted to help answer more research questions:
• RQ4. What are the differences in delivering transport services in the TMA’s core and outer parts? • RQ5. What are the problems in delivering transport services in the TMA’s outer part?
The answers to the question four (RQ4) and five (RQ5) are provided synthetically in Section 4. A number of analyses and studies were conducted. Results of TMA’s diagnostic studies were used such as: analysis of planning documents [13,33], transport system stocktaking, road traffic studies (in the field), transport behaviour of the population (surveys) [34,35] and transport services by different
Commented [M4]: Please check if there is Figure 1 citation in this manuscript
Figure 1. Diagram of the method for achieving scientific and practical objectives.
2.2. Achieving the Scientific Objectives
To achieve the scientific objectives the authors of this article used three study methods: literaturereview, case study and comparative analysis.
Literature review was designed to identify and analyse transport problems in metropolitan areasto use as the basis for answering the following questions:
• RQ1. How are transport and population mobility problems represented in the NUA?• RQ2. What is the transport management experience in metropolitan areas?• RQ3. What transport problems are found in metropolitan areas?
Literature studies looked at NUA implementation experience [6,29,30], the research methodsapplied [24,27,28] and the identification of metropolitan transport problems [31]. A few dozen scientificpublications were studied such as [16,25,32], reports from NUA implementation, for example [5,8] andcase studies, for example [4]. The answers to scientific questions one (RQ1), two (RQ2) and three (RQ3)are presented in Section 3.
Case study included identifying and analysing transport problems using the example of theTri-City Metropolitan Area (TMA). The authors first characterised the TMA and its transport systemand presented its strategic document titled Strategy for Transport and Mobility in the TMA until 2030.Next, studies and analyses were conducted to help answer more research questions:
• RQ4. What are the differences in delivering transport services in the TMA’s core and outer parts?• RQ5. What are the problems in delivering transport services in the TMA’s outer part?
The answers to the question four (RQ4) and five (RQ5) are provided synthetically in Section 4.A number of analyses and studies were conducted. Results of TMA’s diagnostic studies were usedsuch as: analysis of planning documents [13,33], transport system stocktaking, road traffic studies (inthe field), transport behaviour of the population (surveys) [34,35] and transport services by differenttransport modes (database exploration) [33,34,36]. Simulation studies were also conducted for variousoptions and scenarios [11,24] of TMA’s transport system operation. The simulation studies covered
Sustainability 2019, 11, 813 5 of 21
the core and outer sections and a combined area of the entire TMA. The simulation was aided by atransport model which was developed using the VISUM software [37]. Calibrated to in-the-field andsurvey data, the programme was applied to cars and public transport [34,38].
Comparative analysis involved a comparison between how the NUA solves transport problemsand how this is addressed in the STM in the area of the TMA. The results were intended to help theauthors to answer the following questions:
• RQ6. Is there consistency between the NUA’s principles of shaping metropolitan transportsystems and the TM’s goals and programmes of action?
• RQ7. Do the NUA and STM cover the same areas of intervention used for managing anddeveloping transport systems in metropolitan areas?
The comparative analysis used the results of analyses from Sections 3–5. Section 5 gives the resultsof the analyses and the answer to the question six (RQ6) and seven (RQ7).
2.3. Achieving the Practical Objectives
The authors delivered the practical objectives of this article by analysing and synthetizing studiesand analyses presented in Sections 3–5. The results of the analyses are intended to help with thesepractical questions:
• PQ1. Which of the areas of metropolitan transport intervention identified through literaturestudies and case studies should be included in the NUA?
• PQ2. Which of the areas of intervention proposed in the NUA and identified in the studies shouldbe included in the TMA’s development efforts (e.g. the STM)?
The recommendations which answer the above questions are given in Section 6.
3. Identification and Analysis of Transport Problems in Metropolitan Areas—Literature Review
3.1. Transport and Mobility According to the NUA
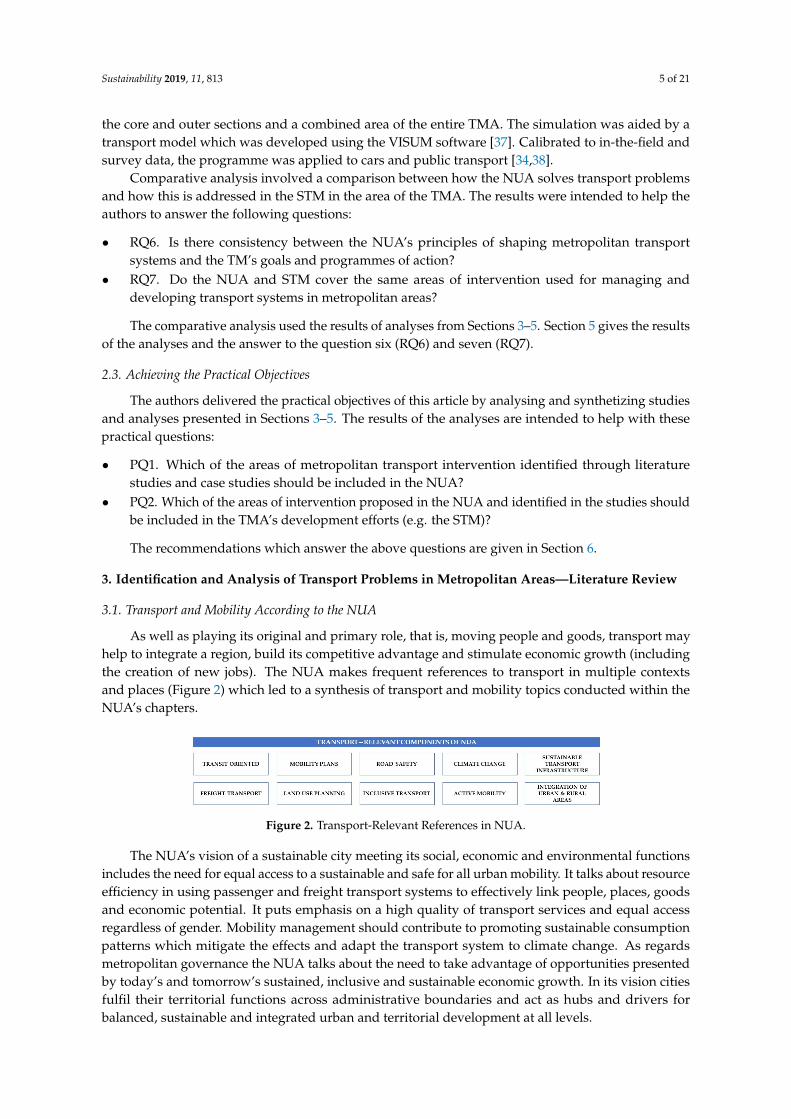
As well as playing its original and primary role, that is, moving people and goods, transport mayhelp to integrate a region, build its competitive advantage and stimulate economic growth (includingthe creation of new jobs). The NUA makes frequent references to transport in multiple contextsand places (Figure 2) which led to a synthesis of transport and mobility topics conducted within theNUA’s chapters.
Sustainability 2019, 11, 813 5 of 23
transport modes (database exploration) [33,34,36]. Simulation studies were also conducted for various options and scenarios [11,24] of TMA’s transport system operation. The simulation studies covered the core and outer sections and a combined area of the entire TMA. The simulation was aided by a transport model which was developed using the VISUM software [37]. Calibrated to in-the-field and survey data, the programme was applied to cars and public transport [34,38].
Comparative analysis involved a comparison between how the NUA solves transport problems and how this is addressed in the STM in the area of the TMA. The results were intended to help the authors to answer the following questions:
• RQ6. Is there consistency between the NUA’s principles of shaping metropolitan transport systems and the TM’s goals and programmes of action?
• RQ7. Do the NUA and STM cover the same areas of intervention used for managing and developing transport systems in metropolitan areas?
The comparative analysis used the results of analyses from Sections 3, 4 and 5. Section 5 gives the results of the analyses and the answer to the question six (RQ6) and seven (RQ7).
2.3. Achieving the Practical Objectives
The authors delivered the practical objectives of this article by analysing and synthetizing studies and analyses presented in Sections 3-5. The results of the analyses are intended to help with these practical questions:
• PQ1. Which of the areas of metropolitan transport intervention identified through literature studies and case studies should be included in the NUA?
• PQ2. Which of the areas of intervention proposed in the NUA and identified in the studies should be included in the TMA’s development efforts (e.g. the STM)?
The recommendations which answer the above questions are given in Section 6.
3. Identification and analysis of transport problems in metropolitan areas—literature review
3.1. Transport and Mobility According to the NUA
As well as playing its original and primary role, that is, moving people and goods, transport may help to integrate a region, build its competitive advantage and stimulate economic growth (including the creation of new jobs). The NUA makes frequent references to transport in multiple contexts and places (Figure 2) which led to a synthesis of transport and mobility topics conducted within the NUA’s chapters.
Figure 2. Transport-Relevant References in NUA.
The NUA’s vision of a sustainable city meeting its social, economic and environmental functions includes the need for equal access to a sustainable and safe for all urban mobility. It talks about resource efficiency in using passenger and freight transport systems to effectively link people, places, goods and economic potential. It puts emphasis on a high quality of transport services and equal access regardless of gender. Mobility management should contribute to promoting sustainable consumption patterns which mitigate the effects and adapt the transport system to climate change. As regards metropolitan governance the NUA talks about the need to take advantage of opportunities presented by today’s and tomorrow’s sustained, inclusive and sustainable economic
Figure 2. Transport-Relevant References in NUA.
The NUA’s vision of a sustainable city meeting its social, economic and environmental functionsincludes the need for equal access to a sustainable and safe for all urban mobility. It talks about resourceefficiency in using passenger and freight transport systems to effectively link people, places, goodsand economic potential. It puts emphasis on a high quality of transport services and equal accessregardless of gender. Mobility management should contribute to promoting sustainable consumptionpatterns which mitigate the effects and adapt the transport system to climate change. As regardsmetropolitan governance the NUA talks about the need to take advantage of opportunities presentedby today’s and tomorrow’s sustained, inclusive and sustainable economic growth. In its vision citiesfulfil their territorial functions across administrative boundaries and act as hubs and drivers forbalanced, sustainable and integrated urban and territorial development at all levels.
Sustainability 2019, 11, 813 6 of 21
The “Principles and commitments” chapter defines how the vision should be delivered throughshared approaches. Key to this is sustainability and a people-focused, integrated approach tourban and territorial development by implementing policies, strategies and actions at all levels.By promoting cooperation across all levels of administration, urban areas will grow in a sustainableand integrated manner.
“Call for action” is the biggest chapter identifying how cities should work to be sustainable. So forthe purposes of this analysis the NUA’s approaches to actions have been grouped into three main pillars ofsustainable development. As described in the paradigm of sustainable development transport should besocially acceptable, economically justified and environmentally safe. A closer look at the "Call for actions"chapter shows that sustainable urban transport should meet the following requirements:
• social—exercising the right to an adequate standard of living, without discrimination, a commonand equal access to high quality mobility and transport infrastructure and services. Urban mobilitywhich is safe and accessible for all and efficient. Efficiency is to be achieved through integrationof subsystems and shaping transport behaviour, developing a well-organised, safe and functionalsystem of public transport and by promoting active forms of mobility such as walking and cycling.If transport safety is to improve, legal changes will be required as well as new planning andtechnology approaches to focus on road safety and vulnerable road users.
• economic—the ability to move people and goods using a fast, efficient and cheap transport is themost important element of meeting the EU’s goals which is to combine a dynamic economy withsocial cohesion. According to NUA guidelines urban mobility and transport should contribute toan effective use of an area’s economic capacity going beyond the city’s administrative boundariesand stimulate interaction and connectivity between urban and rural areas. The NUA includes anumber of political declarations designed to support the application of international and nationalpublic finances to advance urban and territorial sustainable development.
• environment—the NUA puts emphasis on the need to minimise the human impact on theenvironment through transport. To that end it encourages a change in transport behaviour,new low-carbon and energy efficient technologies and optimisation of transport choices.The document reflects the growing understanding of global threats, a result of climate change.The NUA points out that more needs to be done to prevent further climate change.
Signatories to the NUA use the “Effective implementation” chapter to commit themselves to actionsfor creating legal and financial frameworks at all levels of governance and working towards cooperationand participation. The document promotes a clear division of competences of territorial units andencourages cooperation between them while leaving cooperation principles to be defined and regulated bynational laws. Given the functional and spatial differences of metropolitan areas, the NUA encouragesthe development of sustainable regional infrastructure to stimulate sustainable economic production,promoting equitable growth of regions across the urban-rural continuum. The declarations refer to supportfor integrated territorial planning to prevent unfavourable and uncontrolled urban development trends.Spatial planning should follow the principles of compactness, polycentrism and multiple use of spacewhich will help to reduce the challenges, needs and costs of service delivery per capita and harness densityand economies of scale and agglomeration. There is a declaration for transport safety.
“Follow-up and review” includes incentives and declarations for a timely and activeimplementation of the NUA and monitoring progress, evaluating the impacts and reporting regularly.
Described in the document, the urban vision talks about cities which fulfil their territorialfunctions across administrative boundaries and act as hubs and drivers for balanced, sustainableand integrated urban and territorial development at all levels. But the vision, commitments andprinciples of implementing a sustainable transport system are primarily related to areas within citiesand concentrate on urban trips with a marginal interest in external trips, the basis for economic growthand prosperity of metropolitan areas. These conclusions are a positive answer to the research questionone (RQ1).
Sustainability 2019, 11, 813 7 of 21
3.2. Experience of Transport Operation and Management on Metropolitan Areas
Metropolisation is one of the key features of today’s development model. In the contemporaryworld developed countries maintain contacts between regions through their metropolitan areas withlinks that include transport and institutions. There are several cities in Poland that have established apresence on the European map of metropolitan cooperation such as the Tri-City’s seaport cities.
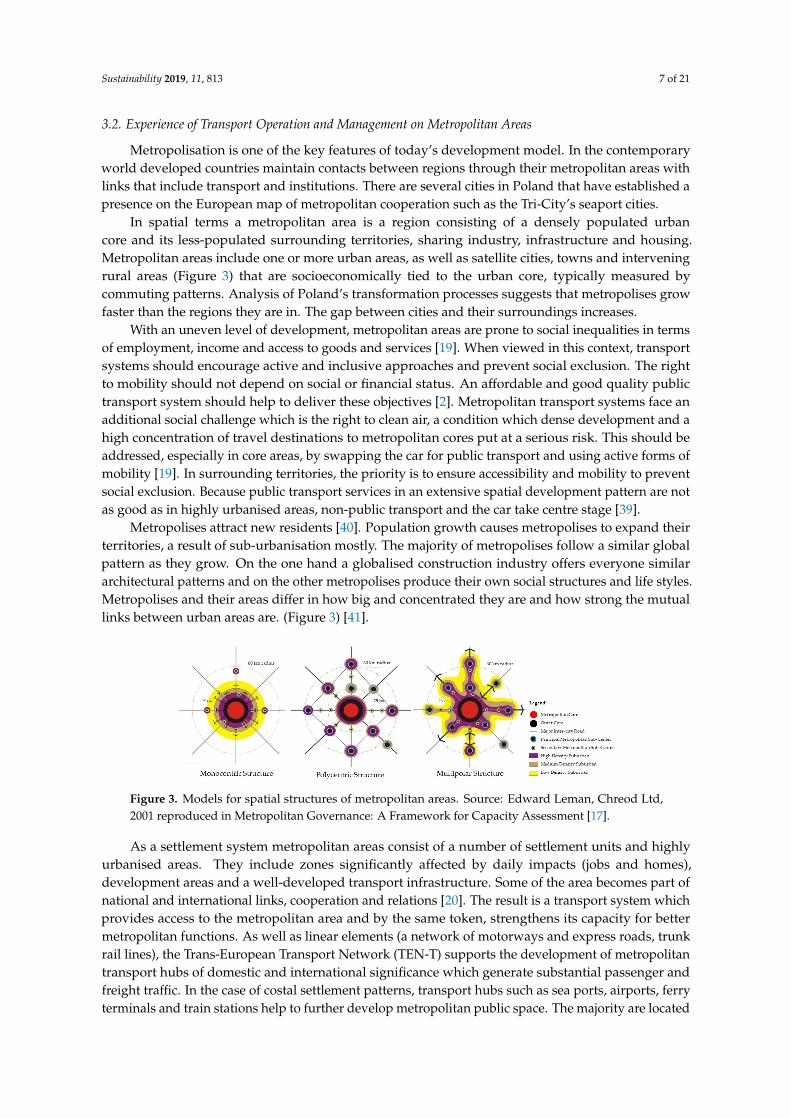
In spatial terms a metropolitan area is a region consisting of a densely populated urbancore and its less-populated surrounding territories, sharing industry, infrastructure and housing.Metropolitan areas include one or more urban areas, as well as satellite cities, towns and interveningrural areas (Figure 3) that are socioeconomically tied to the urban core, typically measured bycommuting patterns. Analysis of Poland’s transformation processes suggests that metropolises growfaster than the regions they are in. The gap between cities and their surroundings increases.
With an uneven level of development, metropolitan areas are prone to social inequalities in termsof employment, income and access to goods and services [19]. When viewed in this context, transportsystems should encourage active and inclusive approaches and prevent social exclusion. The rightto mobility should not depend on social or financial status. An affordable and good quality publictransport system should help to deliver these objectives [2]. Metropolitan transport systems face anadditional social challenge which is the right to clean air, a condition which dense development and ahigh concentration of travel destinations to metropolitan cores put at a serious risk. This should beaddressed, especially in core areas, by swapping the car for public transport and using active forms ofmobility [19]. In surrounding territories, the priority is to ensure accessibility and mobility to preventsocial exclusion. Because public transport services in an extensive spatial development pattern are notas good as in highly urbanised areas, non-public transport and the car take centre stage [39].
Metropolises attract new residents [40]. Population growth causes metropolises to expand theirterritories, a result of sub-urbanisation mostly. The majority of metropolises follow a similar globalpattern as they grow. On the one hand a globalised construction industry offers everyone similararchitectural patterns and on the other metropolises produce their own social structures and life styles.Metropolises and their areas differ in how big and concentrated they are and how strong the mutuallinks between urban areas are. (Figure 3) [41].
Sustainability 2019, 11, 813 7 of 23
of implementing a sustainable transport system are primarily related to areas within cities and concentrate on urban trips with a marginal interest in external trips, the basis for economic growth and prosperity of metropolitan areas. These conclusions are a positive answer to the research question one (RQ1).
3.2. Experience of Transport Operation and Management on Metropolitan Areas
Metropolisation is one of the key features of today’s development model. In the contemporary world developed countries maintain contacts between regions through their metropolitan areas with links that include transport and institutions. There are several cities in Poland that have established a presence on the European map of metropolitan cooperation such as the Tri-City’s seaport cities.
In spatial terms a metropolitan area is a region consisting of a densely populated urban core and its less-populated surrounding territories, sharing industry, infrastructure and housing. Metropolitan areas include one or more urban areas, as well as satellite cities, towns and intervening rural areas (Figure 3) that are socioeconomically tied to the urban core, typically measured by commuting patterns. Analysis of Poland’s transformation processes suggests that metropolises grow faster than the regions they are in. The gap between cities and their surroundings increases.
With an uneven level of development, metropolitan areas are prone to social inequalities in terms of employment, income and access to goods and services [19]. When viewed in this context, transport systems should encourage active and inclusive approaches and prevent social exclusion. The right to mobility should not depend on social or financial status. An affordable and good quality public transport system should help to deliver these objectives [2]. Metropolitan transport systems face an additional social challenge which is the right to clean air, a condition which dense development and a high concentration of travel destinations to metropolitan cores put at a serious risk. This should be addressed, especially in core areas, by swapping the car for public transport and using active forms of mobility [19]. In surrounding territories, the priority is to ensure accessibility and mobility to prevent social exclusion. Because public transport services in an extensive spatial development pattern are not as good as in highly urbanised areas, non-public transport and the car take centre stage [39].
Metropolises attract new residents [40]. Population growth causes metropolises to expand their territories, a result of sub-urbanisation mostly. The majority of metropolises follow a similar global pattern as they grow. On the one hand a globalised construction industry offers everyone similar architectural patterns and on the other metropolises produce their own social structures and life styles. Metropolises and their areas differ in how big and concentrated they are and how strong the mutual links between urban areas are. (Figure 3) [41].
Figure 3. Models for spatial structures of metropolitan areas. Source: Edward Leman, Chreod Ltd, 2001 reproduced in Metropolitan Governance: A Framework for Capacity Assessment [17].
As a settlement system metropolitan areas consist of a number of settlement units and highly urbanised areas. They include zones significantly affected by daily impacts (jobs and homes), development areas and a well-developed transport infrastructure. Some of the area becomes part of
Figure 3. Models for spatial structures of metropolitan areas. Source: Edward Leman, Chreod Ltd,2001 reproduced in Metropolitan Governance: A Framework for Capacity Assessment [17].
As a settlement system metropolitan areas consist of a number of settlement units and highlyurbanised areas. They include zones significantly affected by daily impacts (jobs and homes),development areas and a well-developed transport infrastructure. Some of the area becomes part ofnational and international links, cooperation and relations [20]. The result is a transport system whichprovides access to the metropolitan area and by the same token, strengthens its capacity for bettermetropolitan functions. As well as linear elements (a network of motorways and express roads, trunkrail lines), the Trans-European Transport Network (TEN-T) supports the development of metropolitantransport hubs of domestic and international significance which generate substantial passenger andfreight traffic. In the case of costal settlement patterns, transport hubs such as sea ports, airports, ferryterminals and train stations help to further develop metropolitan public space. The majority are located
Sustainability 2019, 11, 813 8 of 21
within the metropolitan core generating strong influences on its spatial structure and environment andcontributing to intense transit traffic [42].
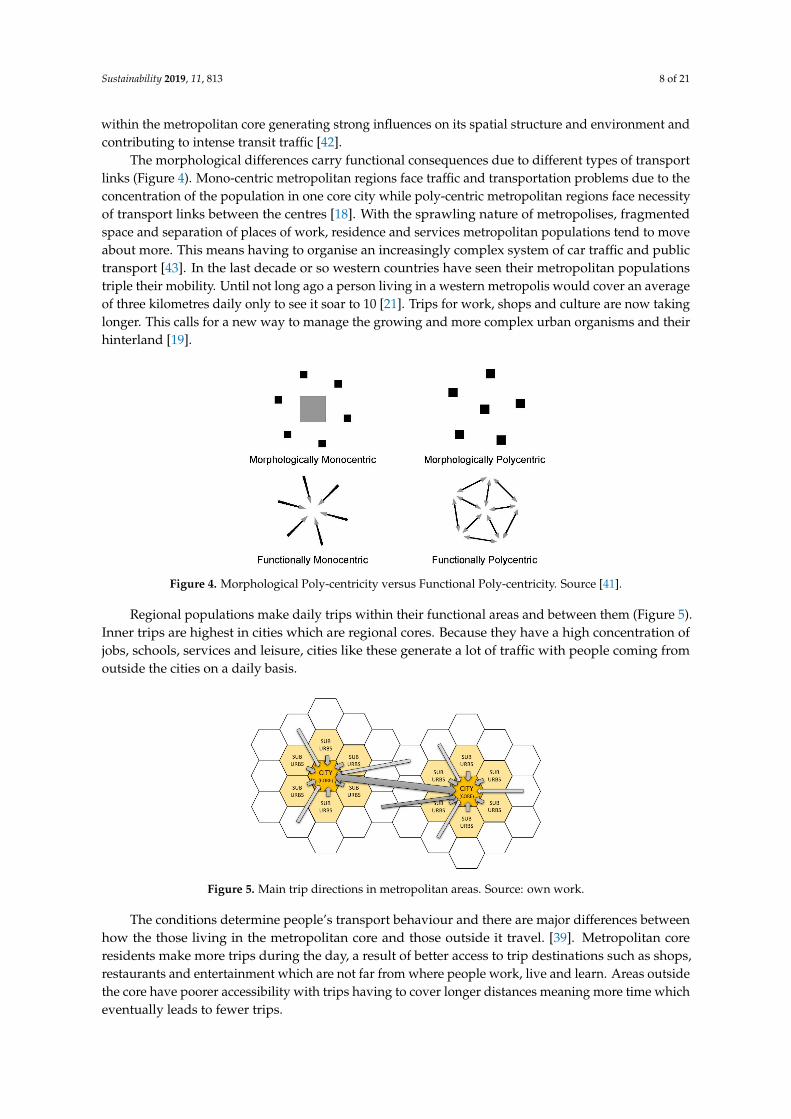
The morphological differences carry functional consequences due to different types of transportlinks (Figure 4). Mono-centric metropolitan regions face traffic and transportation problems due to theconcentration of the population in one core city while poly-centric metropolitan regions face necessityof transport links between the centres [18]. With the sprawling nature of metropolises, fragmentedspace and separation of places of work, residence and services metropolitan populations tend to moveabout more. This means having to organise an increasingly complex system of car traffic and publictransport [43]. In the last decade or so western countries have seen their metropolitan populationstriple their mobility. Until not long ago a person living in a western metropolis would cover an averageof three kilometres daily only to see it soar to 10 [21]. Trips for work, shops and culture are now takinglonger. This calls for a new way to manage the growing and more complex urban organisms and theirhinterland [19].
Sustainability 2019, 11, 813 8 of 23
national and international links, cooperation and relations [20]. The result is a transport system which provides access to the metropolitan area and by the same token, strengthens its capacity for better metropolitan functions. As well as linear elements (a network of motorways and express roads, trunk rail lines), the Trans-European Transport Network (TEN-T) supports the development of metropolitan transport hubs of domestic and international significance which generate substantial passenger and freight traffic. In the case of costal settlement patterns, transport hubs such as sea ports, airports, ferry terminals and train stations help to further develop metropolitan public space. The majority are located within the metropolitan core generating strong influences on its spatial structure and environment and contributing to intense transit traffic [42].
The morphological differences carry functional consequences due to different types of transport links (Figure 4). Mono-centric metropolitan regions face traffic and transportation problems due to the concentration of the population in one core city while poly-centric metropolitan regions face necessity of transport links between the centres [18]. With the sprawling nature of metropolises, fragmented space and separation of places of work, residence and services metropolitan populations tend to move about more. This means having to organise an increasingly complex system of car traffic and public transport [43]. In the last decade or so western countries have seen their metropolitan populations triple their mobility. Until not long ago a person living in a western metropolis would cover an average of three kilometres daily only to see it soar to 10 [21]. Trips for work, shops and culture are now taking longer. This calls for a new way to manage the growing and more complex urban organisms and their hinterland [19].
Figure 4. Morphological Poly-centricity versus Functional Poly-centricity. Source [41].
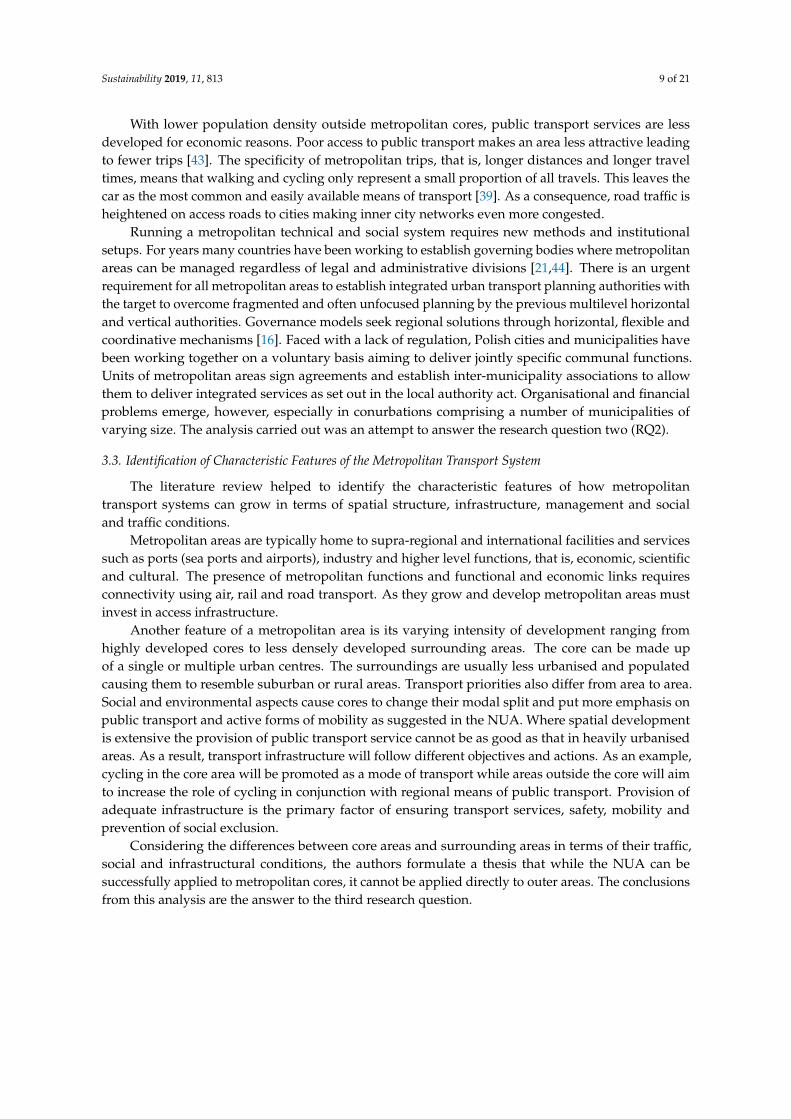
Regional populations make daily trips within their functional areas and between them (Figure 5). Inner trips are highest in cities which are regional cores. Because they have a high concentration of jobs, schools, services and leisure, cities like these generate a lot of traffic with people coming from outside the cities on a daily basis.
Figure 4. Morphological Poly-centricity versus Functional Poly-centricity. Source [41].
Regional populations make daily trips within their functional areas and between them (Figure 5).Inner trips are highest in cities which are regional cores. Because they have a high concentration ofjobs, schools, services and leisure, cities like these generate a lot of traffic with people coming fromoutside the cities on a daily basis.
Sustainability 2019, 11, 813 9 of 23
Figure 5. Main trip directions in metropolitan areas. Source: own work.
The conditions determine people’s transport behaviour and there are major differences between how the those living in the metropolitan core and those outside it travel. [39]. Metropolitan core residents make more trips during the day, a result of better access to trip destinations such as shops, restaurants and entertainment which are not far from where people work, live and learn. Areas outside the core have poorer accessibility with trips having to cover longer distances meaning more time which eventually leads to fewer trips.
With lower population density outside metropolitan cores, public transport services are less developed for economic reasons. Poor access to public transport makes an area less attractive leading to fewer trips [43]. The specificity of metropolitan trips, that is, longer distances and longer travel times, means that walking and cycling only represent a small proportion of all travels. This leaves the car as the most common and easily available means of transport [39]. As a consequence, road traffic is heightened on access roads to cities making inner city networks even more congested.
Running a metropolitan technical and social system requires new methods and institutional setups. For years many countries have been working to establish governing bodies where metropolitan areas can be managed regardless of legal and administrative divisions [21,44]. There is an urgent requirement for all metropolitan areas to establish integrated urban transport planning authorities with the target to overcome fragmented and often unfocused planning by the previous multilevel horizontal and vertical authorities. Governance models seek regional solutions through horizontal, flexible and coordinative mechanisms [16]. Faced with a lack of regulation, Polish cities and municipalities have been working together on a voluntary basis aiming to deliver jointly specific communal functions. Units of metropolitan areas sign agreements and establish inter-municipality associations to allow them to deliver integrated services as set out in the local authority act. Organisational and financial problems emerge, however, especially in conurbations comprising a number of municipalities of varying size. The analysis carried out was an attempt to answer the research question two (RQ2).
3.3. Identification of Characteristic Features of the Metropolitan Transport System
The literature review helped to identify the characteristic features of how metropolitan transport systems can grow in terms of spatial structure, infrastructure, management and social and traffic conditions.
Metropolitan areas are typically home to supra-regional and international facilities and services such as ports (sea ports and airports), industry and higher level functions, that is, economic, scientific and cultural. The presence of metropolitan functions and functional and economic links requires connectivity using air, rail and road transport. As they grow and develop metropolitan areas must invest in access infrastructure.
Another feature of a metropolitan area is its varying intensity of development ranging from highly developed cores to less densely developed surrounding areas. The core can be made up of a
Figure 5. Main trip directions in metropolitan areas. Source: own work.
The conditions determine people’s transport behaviour and there are major differences betweenhow the those living in the metropolitan core and those outside it travel. [39]. Metropolitan coreresidents make more trips during the day, a result of better access to trip destinations such as shops,restaurants and entertainment which are not far from where people work, live and learn. Areas outsidethe core have poorer accessibility with trips having to cover longer distances meaning more time whicheventually leads to fewer trips.
Sustainability 2019, 11, 813 9 of 21
With lower population density outside metropolitan cores, public transport services are lessdeveloped for economic reasons. Poor access to public transport makes an area less attractive leadingto fewer trips [43]. The specificity of metropolitan trips, that is, longer distances and longer traveltimes, means that walking and cycling only represent a small proportion of all travels. This leaves thecar as the most common and easily available means of transport [39]. As a consequence, road traffic isheightened on access roads to cities making inner city networks even more congested.
Running a metropolitan technical and social system requires new methods and institutionalsetups. For years many countries have been working to establish governing bodies where metropolitanareas can be managed regardless of legal and administrative divisions [21,44]. There is an urgentrequirement for all metropolitan areas to establish integrated urban transport planning authorities withthe target to overcome fragmented and often unfocused planning by the previous multilevel horizontaland vertical authorities. Governance models seek regional solutions through horizontal, flexible andcoordinative mechanisms [16]. Faced with a lack of regulation, Polish cities and municipalities havebeen working together on a voluntary basis aiming to deliver jointly specific communal functions.Units of metropolitan areas sign agreements and establish inter-municipality associations to allowthem to deliver integrated services as set out in the local authority act. Organisational and financialproblems emerge, however, especially in conurbations comprising a number of municipalities ofvarying size. The analysis carried out was an attempt to answer the research question two (RQ2).
3.3. Identification of Characteristic Features of the Metropolitan Transport System
The literature review helped to identify the characteristic features of how metropolitantransport systems can grow in terms of spatial structure, infrastructure, management and socialand traffic conditions.
Metropolitan areas are typically home to supra-regional and international facilities and servicessuch as ports (sea ports and airports), industry and higher level functions, that is, economic, scientificand cultural. The presence of metropolitan functions and functional and economic links requiresconnectivity using air, rail and road transport. As they grow and develop metropolitan areas mustinvest in access infrastructure.
Another feature of a metropolitan area is its varying intensity of development ranging fromhighly developed cores to less densely developed surrounding areas. The core can be made upof a single or multiple urban centres. The surroundings are usually less urbanised and populatedcausing them to resemble suburban or rural areas. Transport priorities also differ from area to area.Social and environmental aspects cause cores to change their modal split and put more emphasis onpublic transport and active forms of mobility as suggested in the NUA. Where spatial developmentis extensive the provision of public transport service cannot be as good as that in heavily urbanisedareas. As a result, transport infrastructure will follow different objectives and actions. As an example,cycling in the core area will be promoted as a mode of transport while areas outside the core will aimto increase the role of cycling in conjunction with regional means of public transport. Provision ofadequate infrastructure is the primary factor of ensuring transport services, safety, mobility andprevention of social exclusion.
Considering the differences between core areas and surrounding areas in terms of their traffic,social and infrastructural conditions, the authors formulate a thesis that while the NUA can besuccessfully applied to metropolitan cores, it cannot be applied directly to outer areas. The conclusionsfrom this analysis are the answer to the third research question.

Sustainability 2019, 11, 813 10 of 21
4. Identification and Analysis of Transport Problems in the Tri-City Metropolitan Area—Case Study
4.1. Tri-City Metropolitan Area (TMA)
With a mismatch between the territorial and administrative divisions and the actual spatial andfunctional characteristics, conurbations and metropolitan areas have to come together to jointly resolvetheir functional and development problems. Having that shared goal which is to ensure a harmoniousgrowth of the entire Tri-City metropolitan area, was the driving force behind the establishment ofan association of counties and municipalities. Set up in 2011, the organisation brings together theauthorities of some fifty local authority units, all part of the Tri-City Metropolitan Area. Under Poland’slegislation such associations are voluntary because the law does not regulate metropolitan areas, theirformal and legal establishment, operation or funding.
Located in the north of Poland, the Tri-City Metropolitan Area (TMA) with the Tri-City (the citiesof Gdansk, Gdynia and Sopot) (Figure 6) at its core is made up of eight counties and three countycapitals. The area has a population of 1.5 million. Its metropolitan transport functions are deliveredprimarily by the TEN-T’s trans-European network infrastructure (sea ports, airport, rail, express roadsand motorway), national and regional roads and rail lines. The TMA’s internal transport servicesbetween counties and municipalities are delivered by the remaining transport infrastructure.
Key to assessing the TMA’s spatial structure from the perspective of transport is the area’slong-lasting process of sub-urbanisation, urban location of sea ports, their hinterland industriesand services and a strong presence within the TMA’s core of places of higher education and jobs.According to the models for metropolitan area spatial structures proposed in Reference [17] the TMAcorresponds to the asymmetrically developing Multipolar structure (compare Figure 3).
As sub-urbanisation progresses, average trips take longer. The share of cars in TMA trips increasesas a result of infrastructure shortages, poor connectivity between transport modes, slow pace of addingnew transport hubs, insufficiently integrated ticketing systems, bicycles not sufficiently recognised as ameans for commuting to transport hubs, poor access to public transport in areas outside the core TMAand poor quality of transport services operating between the Tri-City and the other TMA municipalities.
Sustainability 2019, 11, 813 11 of 23
Figure 6. Tri-City Metropolitan Area. Source: [34].
4.2. Strategy for Transport and Mobility for the TMA
The framework of cooperation for the area’s transport mobility issues is the TMA’s Strategy for Transport and Mobility (STM TMA). Adopted in 2016, from the methodological standpoint the STM TMA includes: a diagnosis of the existing transport system, a vision, development scenarios, strategic goals and programmes for delivering those goals. With references to standards of strategy development, the methodology can serve as good practice. The transport system’s diagnosis addresses the following problem areas: determinants of trips and transport behaviour, identification and assessment of transport infrastructure for its condition, cohesion and accessibility, a transport safety assessment, especially that of road transport and the impact of transport on the environment and the quality life of the people. A Complex Traffic Survey (CTS) was conducted designed to study traffic volume and vehicle speeds, modal split of vehicles and freight, directions of passenger transport and means of transport, destinations, reasons why specific modes are used and others. The CTS’ main goal was to build a traffic model for further use in planning to forecast changes in traffic for the different transport policy scenarios [45].
Key to the methodology was to define strategy scenarios to reflect the STM’s different internal and external factors (Table 1). Its sustainable transport and mobility option relies on a good socio-economic situation as measured with GDP and promises prosperity for all and a highly effective transport policy. As much as they are unfavourable, the other strategy scenarios sadly turned out to be realistic.
Table 1. Potential transport scenarios in the STM. Source [34].
Factors impacting on scenarios
Social and economic situation measured with GDP bad good
Effectiveness of transport
policy
low Stagnation scenario Pro-motorization scenario
high Restrictive scenario Sustainable scenario
Figure 6. Tri-City Metropolitan Area. Source: [34].
Sustainability 2019, 11, 813 11 of 21
4.2. Strategy for Transport and Mobility for the TMA
The framework of cooperation for the area’s transport mobility issues is the TMA’s Strategyfor Transport and Mobility (STM TMA). Adopted in 2016, from the methodological standpoint theSTM TMA includes: a diagnosis of the existing transport system, a vision, development scenarios,strategic goals and programmes for delivering those goals. With references to standards of strategydevelopment, the methodology can serve as good practice. The transport system’s diagnosis addressesthe following problem areas: determinants of trips and transport behaviour, identification andassessment of transport infrastructure for its condition, cohesion and accessibility, a transport safetyassessment, especially that of road transport and the impact of transport on the environment and thequality life of the people. A Complex Traffic Survey (CTS) was conducted designed to study trafficvolume and vehicle speeds, modal split of vehicles and freight, directions of passenger transport andmeans of transport, destinations, reasons why specific modes are used and others. The CTS’ main goalwas to build a traffic model for further use in planning to forecast changes in traffic for the differenttransport policy scenarios [45].
Key to the methodology was to define strategy scenarios to reflect the STM’s different internal andexternal factors (Table 1). Its sustainable transport and mobility option relies on a good socio-economicsituation as measured with GDP and promises prosperity for all and a highly effective transport policy.As much as they are unfavourable, the other strategy scenarios sadly turned out to be realistic.
Table 1. Potential transport scenarios in the STM. Source [34].
Factors Impacting on ScenariosSocial and Economic Situation Measured with GDP
bad good
Effectiveness of transport policy low Stagnation scenario Pro-motorization scenariohigh Restrictive scenario Sustainable scenario
The TMA’s basic goal to be met through its transport system is to support the delivery of thearea’s social, economic and environmental objectives defined in the relevant regional and municipalstrategies. High quality standards are required if the transport system is to be competitive, supportsocial engagement and economic innovation, promote spatial order and sustainable urban mobility.
The STM’s actions and interventions are related to areas: external/surrounding area (A)and internal/core area (B). External interventions (A) are designed to ensure the TMA’s externalconnectivity to support its position as an international hub. There are two strategic objectives withinthis area:
• A.1. Improve the TMA’s transport accessibility,• A.2. Improve the quality of transport infrastructure to ensure access to the TEN-T’s sea ports
and airports.
Internal interventions (B) are designed to ensure the TMA’s internal (between municipalities)connectivity to support its development as a functional area. There are three strategic objectives withinthis area:
• B.1. Improve efficiency of TMA’s transport networks,• B.2. Improve public transport and non-motorised services,• B.3. Reduce adverse impacts of transport.
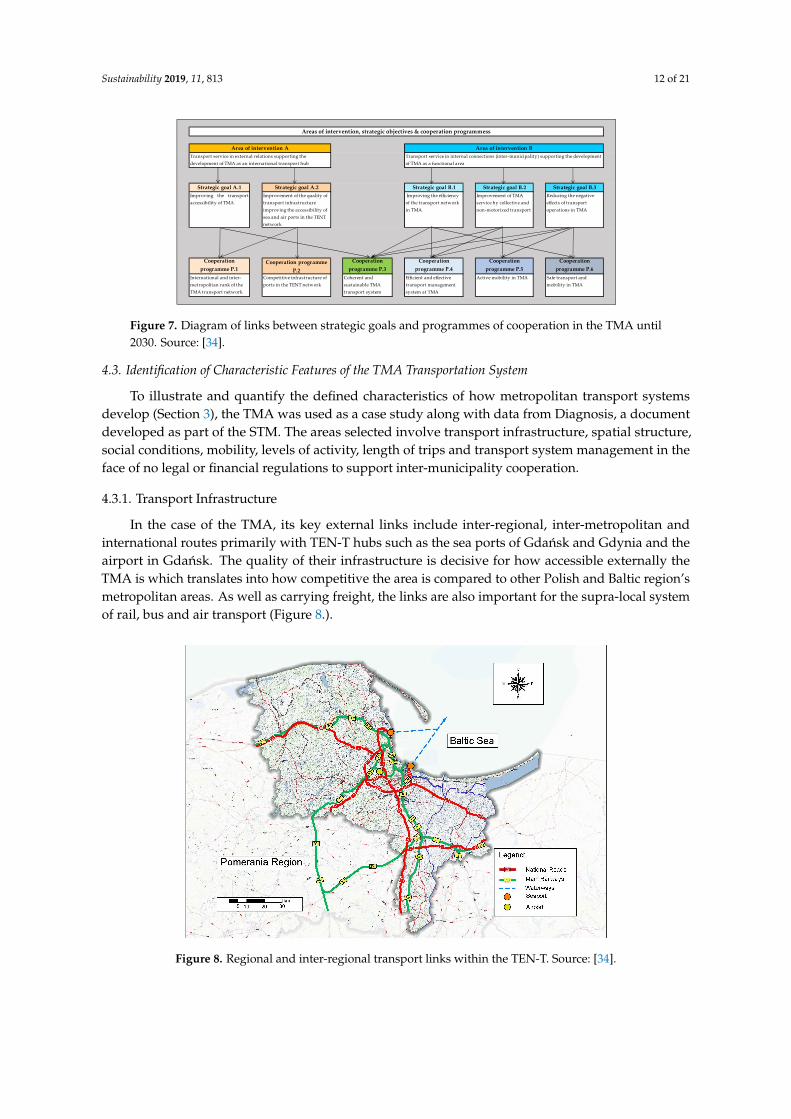
To ensure that the strategic objectives are delivered successfully, strategic interventions will bepart of programmes of joint and coordinated actions. Defined as joint, these actions will be taken by atleast two municipalities and involve organisations from outside the local authorities. There are six keyprogrammes of cooperation in the STM with each delivering their specific strategic goals (Figure 7)through specific objectives.
Sustainability 2019, 11, 813 12 of 21
Sustainability 2019, 11, 813 12 of 23
The TMA’s basic goal to be met through its transport system is to support the delivery of the area’s social, economic and environmental objectives defined in the relevant regional and municipal strategies. High quality standards are required if the transport system is to be competitive, support social engagement and economic innovation, promote spatial order and sustainable urban mobility.
The STM’s actions and interventions are related to areas: external/ surrounding area (A) and internal/ core area (B). External interventions (A) are designed to ensure the TMA’s external connectivity to support its position as an international hub. There are two strategic objectives within this area:
• A.1. Improve the TMA’s transport accessibility, • A.2. Improve the quality of transport infrastructure to ensure access to the TEN-T’s sea ports
and airports.
Internal interventions (B) are designed to ensure the TMA’s internal (between municipalities) connectivity to support its development as a functional area. There are three strategic objectives within this area:
• B.1. Improve efficiency of TMA’s transport networks, • B.2. Improve public transport and non-motorised services, • B.3. Reduce adverse impacts of transport.
To ensure that the strategic objectives are delivered successfully, strategic interventions will be part of programmes of joint and coordinated actions. Defined as joint, these actions will be taken by at least two municipalities and involve organisations from outside the local authorities. There are six key programmes of cooperation in the STM with each delivering their specific strategic goals (Figure 7) through specific objectives.
Figure 7. Diagram of links between strategic goals and programmes of cooperation in the TMA until 2030. Source: [34].
4.3. Identification of Characteristic Features of the TMA Transportation System
To illustrate and quantify the defined characteristics of how metropolitan transport systems develop (section 3), the TMA was used as a case study along with data from Diagnosis, a document developed as part of the STM. The areas selected involve transport infrastructure, spatial structure, social conditions, mobility, levels of activity, length of trips and transport system management in the face of no legal or financial regulations to support inter-municipality cooperation.
4.3.1. Transport Infrastructure
In the case of the TMA, its key external links include inter-regional, inter-metropolitan and international routes primarily with TEN-T hubs such as the sea ports of Gdańsk and Gdynia and the
Strategic goal A.1 Strategic goal A.2 Strategic goal B.1 Strategic goal B.2 Strategic goal B.3Improving the transportaccessibility of TMA
Improvement of the quality of transport infrastructure improving the accessibility of sea and air ports in the TENT network
Improving the efficiency of the transport network in TMA
Improvement of TMA service by collective and non-motorized transport
Reducing the negative effects of transport operations in TMA
Cooperation programme P.1
Cooperation programme P.2
Cooperation programme P.3
Cooperation programme P.4
Cooperation programme P.5
Cooperation programme P.6
International and inter-metropolitan rank of the TMA transport network
Competitive infrastructure of ports in the TENT network
Coherent and sustainable TMA transport system
Efficient and effective transport management system at TMA
Active mobility in TMA Safe transport and mobility in TMA
Areas of intervention, strategic objectives & cooperation programmess
Area of intervention A Area of intervention BTransport service in external relations supporting the development of TMA as an international transport hub
Transport service in internal connections (inter-municipality) supporting the development of TMA as a functional area
Commented [M5]: Please check if this is a section citation, if so, please check if there is section 3 in this manuscript.
Figure 7. Diagram of links between strategic goals and programmes of cooperation in the TMA until2030. Source: [34].
4.3. Identification of Characteristic Features of the TMA Transportation System
To illustrate and quantify the defined characteristics of how metropolitan transport systemsdevelop (Section 3), the TMA was used as a case study along with data from Diagnosis, a documentdeveloped as part of the STM. The areas selected involve transport infrastructure, spatial structure,social conditions, mobility, levels of activity, length of trips and transport system management in theface of no legal or financial regulations to support inter-municipality cooperation.
4.3.1. Transport Infrastructure
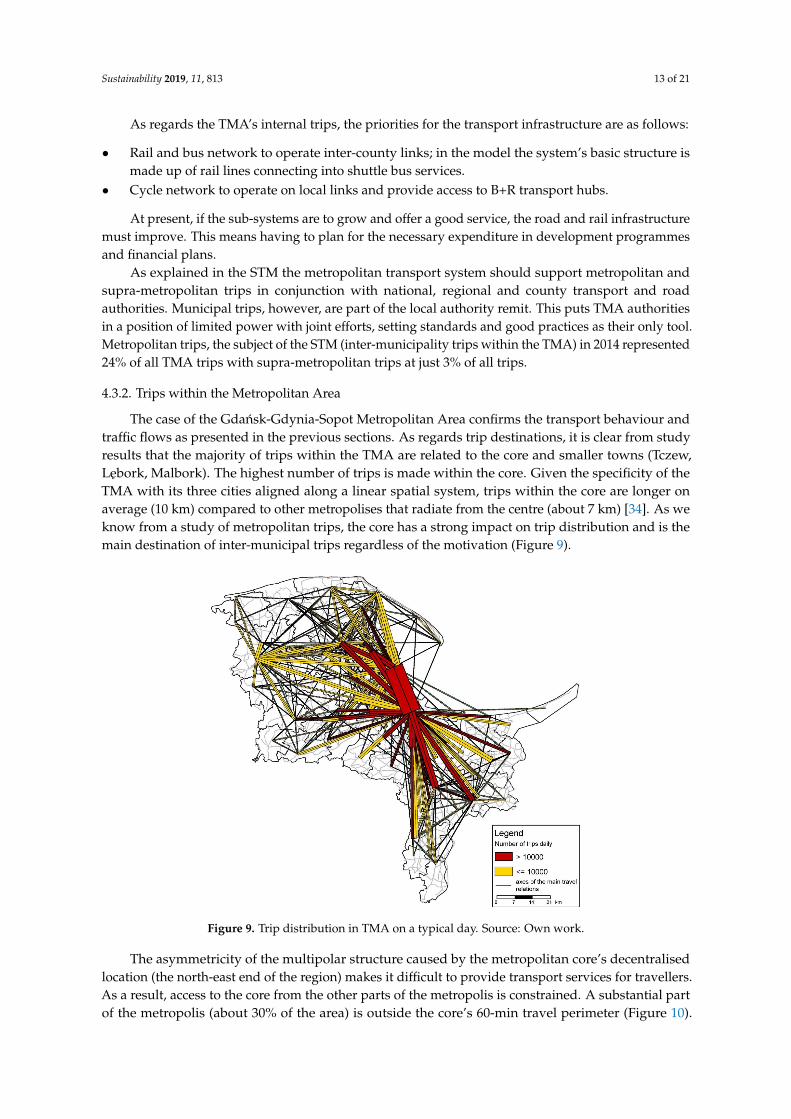
In the case of the TMA, its key external links include inter-regional, inter-metropolitan andinternational routes primarily with TEN-T hubs such as the sea ports of Gdansk and Gdynia and theairport in Gdansk. The quality of their infrastructure is decisive for how accessible externally theTMA is which translates into how competitive the area is compared to other Polish and Baltic region’smetropolitan areas. As well as carrying freight, the links are also important for the supra-local systemof rail, bus and air transport (Figure 8.).
Sustainability 2019, 11, 813 13 of 23
airport in Gdańsk. The quality of their infrastructure is decisive for how accessible externally the TMA is which translates into how competitive the area is compared to other Polish and Baltic region’s metropolitan areas. As well as carrying freight, the links are also important for the supra-local system of rail, bus and air transport (Figure 8.).
Figure 8. Regional and inter-regional transport links within the TEN-T. Source: [34].
As regards the TMA’s internal trips, the priorities for the transport infrastructure are as follows:
• Rail and bus network to operate inter-county links; in the model the system’s basic structure is made up of rail lines connecting into shuttle bus services.
• Cycle network to operate on local links and provide access to B+R transport hubs.
At present, if the sub-systems are to grow and offer a good service, the road and rail infrastructure must improve. This means having to plan for the necessary expenditure in development programmes and financial plans.
As explained in the STM the metropolitan transport system should support metropolitan and supra-metropolitan trips in conjunction with national, regional and county transport and road authorities. Municipal trips, however, are part of the local authority remit. This puts TMA authorities in a position of limited power with joint efforts, setting standards and good practices as their only tool. Metropolitan trips, the subject of the STM (inter-municipality trips within the TMA) in 2014 represented 24% of all TMA trips with supra-metropolitan trips at just 3% of all trips.
4.3.2. Trips within the Metropolitan Area
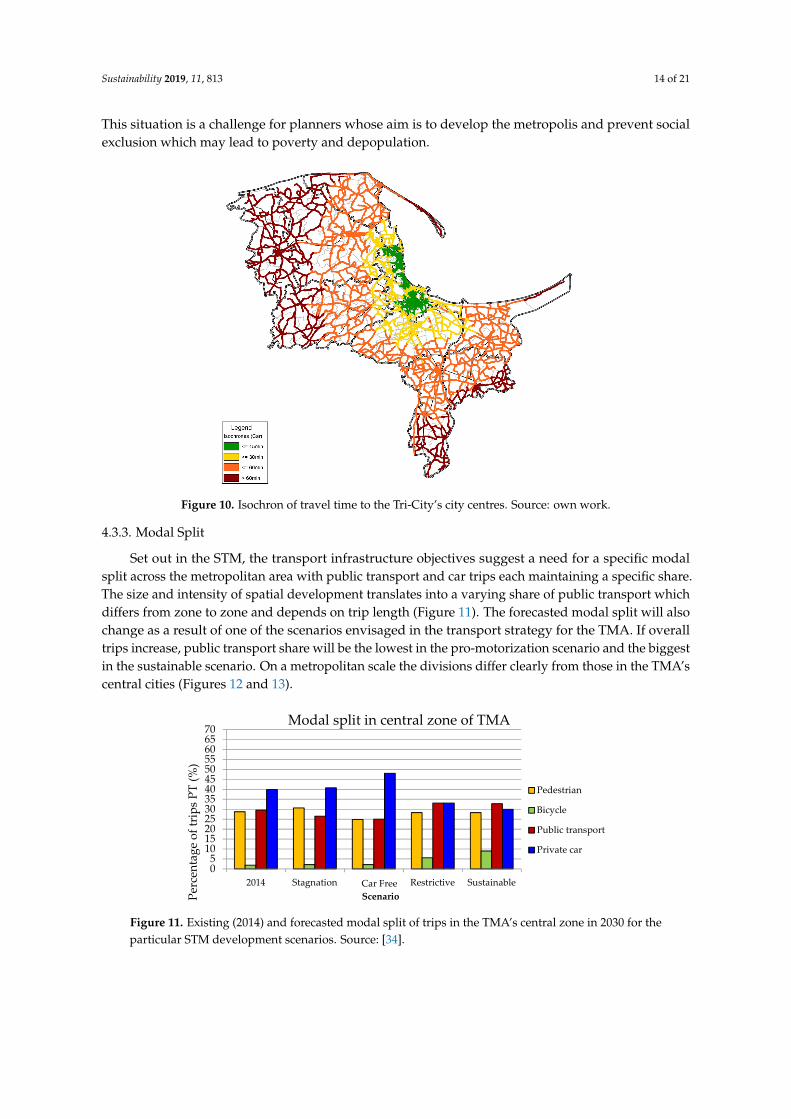
The case of the Gdańsk-Gdynia-Sopot Metropolitan Area confirms the transport behaviour and traffic flows as presented in the previous sections. As regards trip destinations, it is clear from study results that the majority of trips within the TMA are related to the core and smaller towns (Tczew, Lębork, Malbork). The highest number of trips is made within the core. Given the specificity of the TMA with its three cities aligned along a linear spatial system, trips within the core are longer on average (10 km) compared to other metropolises that radiate from the centre (about 7 km) [34]. As
Figure 8. Regional and inter-regional transport links within the TEN-T. Source: [34].
Sustainability 2019, 11, 813 13 of 21
As regards the TMA’s internal trips, the priorities for the transport infrastructure are as follows:
• Rail and bus network to operate inter-county links; in the model the system’s basic structure ismade up of rail lines connecting into shuttle bus services.
• Cycle network to operate on local links and provide access to B+R transport hubs.
At present, if the sub-systems are to grow and offer a good service, the road and rail infrastructuremust improve. This means having to plan for the necessary expenditure in development programmesand financial plans.
As explained in the STM the metropolitan transport system should support metropolitan andsupra-metropolitan trips in conjunction with national, regional and county transport and roadauthorities. Municipal trips, however, are part of the local authority remit. This puts TMA authoritiesin a position of limited power with joint efforts, setting standards and good practices as their only tool.Metropolitan trips, the subject of the STM (inter-municipality trips within the TMA) in 2014 represented24% of all TMA trips with supra-metropolitan trips at just 3% of all trips.
4.3.2. Trips within the Metropolitan Area
The case of the Gdansk-Gdynia-Sopot Metropolitan Area confirms the transport behaviour andtraffic flows as presented in the previous sections. As regards trip destinations, it is clear from studyresults that the majority of trips within the TMA are related to the core and smaller towns (Tczew,Lebork, Malbork). The highest number of trips is made within the core. Given the specificity of theTMA with its three cities aligned along a linear spatial system, trips within the core are longer onaverage (10 km) compared to other metropolises that radiate from the centre (about 7 km) [34]. As weknow from a study of metropolitan trips, the core has a strong impact on trip distribution and is themain destination of inter-municipal trips regardless of the motivation (Figure 9).
Sustainability 2019, 11, 813 14 of 23
we know from a study of metropolitan trips, the core has a strong impact on trip distribution and is the main destination of inter-municipal trips regardless of the motivation (Figure 9).
Figure 9. Trip distribution in TMA on a typical day. Source: Own work.
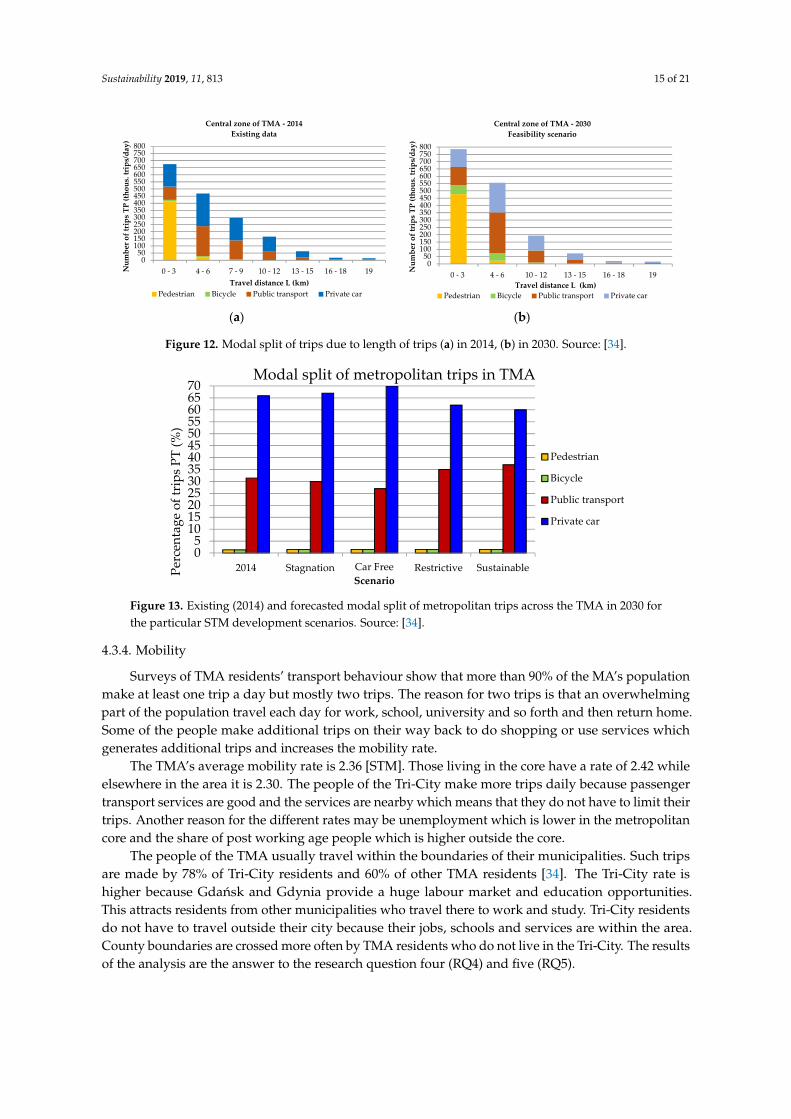
The asymmetricity of the multipolar structure caused by the metropolitan core’s decentralised location (the north-east end of the region) makes it difficult to provide transport services for travellers. As a result, access to the core from the other parts of the metropolis is constrained. A substantial part of the metropolis (about 30% of the area) is outside the core’s 60-minute travel perimeter (Figure 10). This situation is a challenge for planners whose aim is to develop the metropolis and prevent social exclusion which may lead to poverty and depopulation.
Commented [M6]: Please check if there is Figure 9 citation in this manuscript
Figure 9. Trip distribution in TMA on a typical day. Source: Own work.
The asymmetricity of the multipolar structure caused by the metropolitan core’s decentralisedlocation (the north-east end of the region) makes it difficult to provide transport services for travellers.As a result, access to the core from the other parts of the metropolis is constrained. A substantial partof the metropolis (about 30% of the area) is outside the core’s 60-min travel perimeter (Figure 10).
Sustainability 2019, 11, 813 14 of 21
This situation is a challenge for planners whose aim is to develop the metropolis and prevent socialexclusion which may lead to poverty and depopulation.
Sustainability 2019, 11, 813 15 of 23
Figure 10. Isochron of travel time to the Tri-City’s city centres. Source: own work.
4.3.3. Modal Split
Set out in the STM, the transport infrastructure objectives suggest a need for a specific modal split across the metropolitan area with public transport and car trips each maintaining a specific share. The size and intensity of spatial development translates into a varying share of public transport which differs from zone to zone and depends on trip length (Figure 13). The forecasted modal split will also change as a result of one of the scenarios envisaged in the transport strategy for the TMA. If overall trips increase, public transport share will be the lowest in the pro-motorization scenario and the biggest in the sustainable scenario. On a metropolitan scale the divisions differ clearly from those in the TMA’s central cities (Figures 11 and 12).
(a) (b)
Figure 11. Modal split of trips due to length of trips (a) in 2014, (b) in 2030. Source: [34].
050
100150200250300350400450500550600650700750800
0 - 3 4 - 6 7 - 9 10 - 12 13 - 15 16 - 18 19Num
ber o
f tri
ps T
P (th
ous.
trip
s/da
y)
Travel distance L (km)
Central zone of TMA - 2014Existing data
Pedestrian Bicycle Public transport Private car
050
100150200250300350400450500550600650700750800
0 - 3 4 - 6 10 - 12 13 - 15 16 - 18 19Num
ber o
f tri
ps T
P (th
ous.
trip
s/da
y)
Travel distance L (km)
Central zone of TMA - 2030Feasibility scenario
Pedestrian Bicycle Public transport Private car
Commented [M7]: Please check if there is Figure 11 citation in this manuscript
Figure 10. Isochron of travel time to the Tri-City’s city centres. Source: own work.
4.3.3. Modal Split
Set out in the STM, the transport infrastructure objectives suggest a need for a specific modalsplit across the metropolitan area with public transport and car trips each maintaining a specific share.The size and intensity of spatial development translates into a varying share of public transport whichdiffers from zone to zone and depends on trip length (Figure 11). The forecasted modal split will alsochange as a result of one of the scenarios envisaged in the transport strategy for the TMA. If overalltrips increase, public transport share will be the lowest in the pro-motorization scenario and the biggestin the sustainable scenario. On a metropolitan scale the divisions differ clearly from those in the TMA’scentral cities (Figures 12 and 13).
Sustainability 2019, 11, 813 16 of 23
Figure 12. Existing (2014) and forecasted modal split of metropolitan trips across the TMA in 2030 for the particular STM development scenarios. Source: [34].
Figure 13. Existing (2014) and forecasted modal split of trips in the TMA’s central zone in 2030 for the particular STM development scenarios. Source: [34].
4.3.4. Mobility
Surveys of TMA residents’ transport behaviour show that more than 90% of the MA’s population make at least one trip a day but mostly two trips. The reason for two trips is that an overwhelming part of the population travel each day for work, school, university and so forth and then return home. Some of the people make additional trips on their way back to do shopping or use services which generates additional trips and increases the mobility rate.
The TMA’s average mobility rate is 2.36 [STM]. Those living in the core have a rate of 2.42 while elsewhere in the area it is 2.30. The people of the Tri-City make more trips daily because passenger transport services are good and the services are nearby which means that they do not have to limit their trips. Another reason for the different rates may be unemployment which is lower in the metropolitan core and the share of post working age people which is higher outside the core.
The people of the TMA usually travel within the boundaries of their municipalities. Such trips are made by 78% of Tri-City residents and 60% of other TMA residents [34]. The Tri-City rate is higher because Gdańsk and Gdynia provide a huge labour market and education opportunities. This attracts residents from other municipalities who travel there to work and study. Tri-City residents do not have to travel outside their city because their jobs, schools and services are within the area. County boundaries are crossed more often by TMA residents who do not live in the Tri-City. The results of the analysis are the answer to the research question four (RQ4) and five (RQ5).
5. Comparative Analysis of NUA and STM
05
10152025303540455055606570
2014 Stagnation Free car Restrictive SustainablePerc
enta
ge o
f tri
ps P
T (%
)
Car FreeScenario
Modal split of metropolitan trips in TMA
Pedestrian
Bicycle
Public transport
Private car
05
10152025303540455055606570
2014 Stagnation Free car Restrictive Sustainable
Perc
enta
ge o
f tri
ps P
T (%
)
Car FreeScenario
Modal split in central zone of TMA
Pedestrian
Bicycle
Public transport
Private car
Figure 11. Existing (2014) and forecasted modal split of trips in the TMA’s central zone in 2030 for theparticular STM development scenarios. Source: [34].
Sustainability 2019, 11, 813 15 of 21
Sustainability 2019, 11, 813 15 of 23
Figure 10. Isochron of travel time to the Tri-City’s city centres. Source: own work.
4.3.3. Modal Split
Set out in the STM, the transport infrastructure objectives suggest a need for a specific modal split across the metropolitan area with public transport and car trips each maintaining a specific share. The size and intensity of spatial development translates into a varying share of public transport which differs from zone to zone and depends on trip length (Figure 13). The forecasted modal split will also change as a result of one of the scenarios envisaged in the transport strategy for the TMA. If overall trips increase, public transport share will be the lowest in the pro-motorization scenario and the biggest in the sustainable scenario. On a metropolitan scale the divisions differ clearly from those in the TMA’s central cities (Figures 11 and 12).
(a) (b)
Figure 11. Modal split of trips due to length of trips (a) in 2014, (b) in 2030. Source: [34].
050
100150200250300350400450500550600650700750800
0 - 3 4 - 6 7 - 9 10 - 12 13 - 15 16 - 18 19Num
ber o
f tri
ps T
P (th
ous.
trip
s/da
y)
Travel distance L (km)
Central zone of TMA - 2014Existing data
Pedestrian Bicycle Public transport Private car
050
100150200250300350400450500550600650700750800
0 - 3 4 - 6 10 - 12 13 - 15 16 - 18 19Num
ber o
f tri
ps T
P (th
ous.
trip
s/da
y)
Travel distance L (km)
Central zone of TMA - 2030Feasibility scenario
Pedestrian Bicycle Public transport Private car
Commented [M7]: Please check if there is Figure 11 citation in this manuscript
Figure 12. Modal split of trips due to length of trips (a) in 2014, (b) in 2030. Source: [34].Sustainability 2019, 11, 813 16 of 23
Figure 12. Existing (2014) and forecasted modal split of metropolitan trips across the TMA in 2030 for the particular STM development scenarios. Source: [34].
Figure 13. Existing (2014) and forecasted modal split of trips in the TMA’s central zone in 2030 for the particular STM development scenarios. Source: [34].
4.3.4. Mobility
Surveys of TMA residents’ transport behaviour show that more than 90% of the MA’s population make at least one trip a day but mostly two trips. The reason for two trips is that an overwhelming part of the population travel each day for work, school, university and so forth and then return home. Some of the people make additional trips on their way back to do shopping or use services which generates additional trips and increases the mobility rate.
The TMA’s average mobility rate is 2.36 [STM]. Those living in the core have a rate of 2.42 while elsewhere in the area it is 2.30. The people of the Tri-City make more trips daily because passenger transport services are good and the services are nearby which means that they do not have to limit their trips. Another reason for the different rates may be unemployment which is lower in the metropolitan core and the share of post working age people which is higher outside the core.
The people of the TMA usually travel within the boundaries of their municipalities. Such trips are made by 78% of Tri-City residents and 60% of other TMA residents [34]. The Tri-City rate is higher because Gdańsk and Gdynia provide a huge labour market and education opportunities. This attracts residents from other municipalities who travel there to work and study. Tri-City residents do not have to travel outside their city because their jobs, schools and services are within the area. County boundaries are crossed more often by TMA residents who do not live in the Tri-City. The results of the analysis are the answer to the research question four (RQ4) and five (RQ5).
5. Comparative Analysis of NUA and STM
05
10152025303540455055606570
2014 Stagnation Free car Restrictive SustainablePerc
enta
ge o
f tri
ps P
T (%
)
Car FreeScenario
Modal split of metropolitan trips in TMA
Pedestrian
Bicycle
Public transport
Private car
05
10152025303540455055606570
2014 Stagnation Free car Restrictive Sustainable
Perc
enta
ge o
f tri
ps P
T (%
)
Car FreeScenario
Modal split in central zone of TMA
Pedestrian
Bicycle
Public transport
Private car
Figure 13. Existing (2014) and forecasted modal split of metropolitan trips across the TMA in 2030 forthe particular STM development scenarios. Source: [34].
4.3.4. Mobility
Surveys of TMA residents’ transport behaviour show that more than 90% of the MA’s populationmake at least one trip a day but mostly two trips. The reason for two trips is that an overwhelmingpart of the population travel each day for work, school, university and so forth and then return home.Some of the people make additional trips on their way back to do shopping or use services whichgenerates additional trips and increases the mobility rate.
The TMA’s average mobility rate is 2.36 [STM]. Those living in the core have a rate of 2.42 whileelsewhere in the area it is 2.30. The people of the Tri-City make more trips daily because passengertransport services are good and the services are nearby which means that they do not have to limit theirtrips. Another reason for the different rates may be unemployment which is lower in the metropolitancore and the share of post working age people which is higher outside the core.
The people of the TMA usually travel within the boundaries of their municipalities. Such tripsare made by 78% of Tri-City residents and 60% of other TMA residents [34]. The Tri-City rate ishigher because Gdansk and Gdynia provide a huge labour market and education opportunities.This attracts residents from other municipalities who travel there to work and study. Tri-City residentsdo not have to travel outside their city because their jobs, schools and services are within the area.County boundaries are crossed more often by TMA residents who do not live in the Tri-City. The resultsof the analysis are the answer to the research question four (RQ4) and five (RQ5).
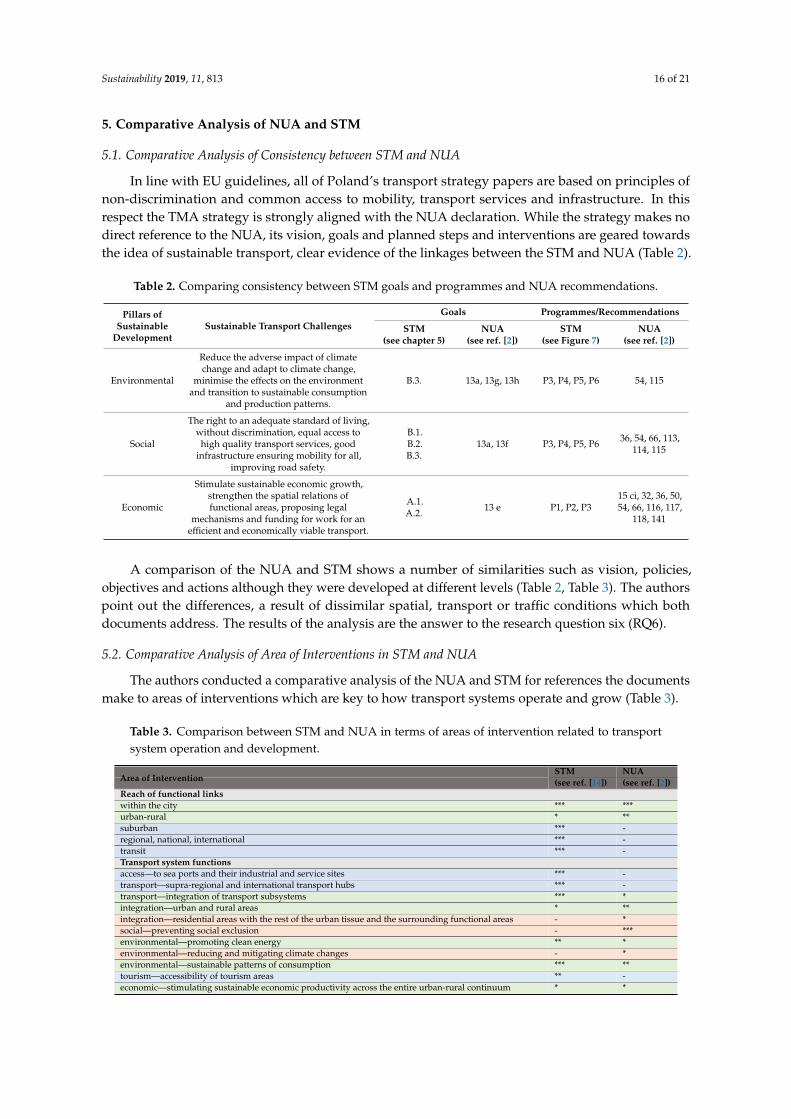
Sustainability 2019, 11, 813 16 of 21
5. Comparative Analysis of NUA and STM
5.1. Comparative Analysis of Consistency between STM and NUA
In line with EU guidelines, all of Poland’s transport strategy papers are based on principles ofnon-discrimination and common access to mobility, transport services and infrastructure. In thisrespect the TMA strategy is strongly aligned with the NUA declaration. While the strategy makes nodirect reference to the NUA, its vision, goals and planned steps and interventions are geared towardsthe idea of sustainable transport, clear evidence of the linkages between the STM and NUA (Table 2).
Table 2. Comparing consistency between STM goals and programmes and NUA recommendations.
Pillars ofSustainable
DevelopmentSustainable Transport Challenges
Goals Programmes/Recommendations
STM(see chapter 5)
NUA(see ref. [2])
STM(see Figure 7)
NUA(see ref. [2])
Environmental
Reduce the adverse impact of climatechange and adapt to climate change,
minimise the effects on the environmentand transition to sustainable consumption
and production patterns.
B.3. 13a, 13g, 13h P3, P4, P5, P6 54, 115
Social
The right to an adequate standard of living,without discrimination, equal access to
high quality transport services, goodinfrastructure ensuring mobility for all,
improving road safety.
B.1.B.2.B.3.
13a, 13f P3, P4, P5, P6 36, 54, 66, 113,114, 115
Economic
Stimulate sustainable economic growth,strengthen the spatial relations offunctional areas, proposing legal
mechanisms and funding for work for anefficient and economically viable transport.
A.1.A.2. 13 e P1, P2, P3
15 ci, 32, 36, 50,54, 66, 116, 117,
118, 141
A comparison of the NUA and STM shows a number of similarities such as vision, policies,objectives and actions although they were developed at different levels (Table 2, Table 3). The authorspoint out the differences, a result of dissimilar spatial, transport or traffic conditions which bothdocuments address. The results of the analysis are the answer to the research question six (RQ6).
5.2. Comparative Analysis of Area of Interventions in STM and NUA
The authors conducted a comparative analysis of the NUA and STM for references the documentsmake to areas of interventions which are key to how transport systems operate and grow (Table 3).
Table 3. Comparison between STM and NUA in terms of areas of intervention related to transportsystem operation and development.
STM NUAArea of Intervention (see ref. [14]) (see ref. [2])Reach of functional linkswithin the city *** ***urban-rural * **suburban *** -regional, national, international *** -transit *** -Transport system functionsaccess—to sea ports and their industrial and service sites *** -transport—supra-regional and international transport hubs *** -transport—integration of transport subsystems *** *integration—urban and rural areas * **integration—residential areas with the rest of the urban tissue and the surrounding functional areas - *social—preventing social exclusion - ***environmental—promoting clean energy ** *environmental—reducing and mitigating climate changes - *environmental—sustainable patterns of consumption *** **tourism—accessibility of tourism areas ** -economic—stimulating sustainable economic productivity across the entire urban-rural continuum * *

Sustainability 2019, 11, 813 17 of 21
Table 3. Cont.
STM NUAArea of Intervention (see ref. [14]) (see ref. [2])Transport infrastructuregreen - *open, efficient, innovative, safe (road traffic) ** **accessible (sea and land ports) *** *adjusted to age and gender - **walking and cycling *** *rail, air, road *** -integration transport hubs *** -Mobility managementmonitoring people’s transport behaviour and preferences *** -education, promotion of active forms of mobility *** -shaping transport behaviour *** *organisational, spatial and investment efforts to enable optimal transport choices *** *Transport offercommon (for all) * *no constraints for people with disabilities ** *affordable - *optional for those non-motorised *** *using the most recent technologies to deliver joint mobility services *** *Conditions of growthspatial, social, legal, planning ** ***traffic, demographics, organisational *** -Urban logisticssupport for economic growth * *not affecting negatively living conditions in the city * *logistics centres ** -Managing growthtransparent, hierarchical management structures * ***public participation * **implementation of policies and strategies * **implementation of programmes *** *cooperation between all levels of administration * **consistency of sectoral policy goals across levels *** **sectoral policy taking account of functional areas according to national law *** *strengthens the capacity of regional and local authorities to implement metropolitan multi-level governancegoing beyond the administrative boundaries and based on functional criteria, *** *
mechanisms of metropolitan funding, - **strengthening the role of small and medium-sized cities and towns - **mechanisms of inter-municipality cooperation to deliver metropolitan public services, ** **Spatial planningurban planning: moving functions, preventing sub-urbanisation, denser development, compact structures ** ***regional planning: polycentricism, concentration, multiple functions ** **mitigate mobility challenges and needs *** **reducing costs of service delivery per capita, - *integration of spatial planning with transport planning * ***
The results of the analysis are the answer to the research question seven (RQ7). –: no reference; *: incidentalreference in the text; **: several references in the text; ***: several references in the text with a description. Legend:
Sustainability 2019, 11, 813 18 of 23
integration—residential areas with the rest of the urban tissue and the surrounding functional areas
- *
social—preventing social exclusion - *** environmental—promoting clean energy ** * environmental—reducing and mitigating climate changes - * environmental—sustainable patterns of consumption *** ** tourism—accessibility of tourism areas ** - economic—stimulating sustainable economic productivity across the entire urban-rural continuum
* *
Transport infrastructure green - * open, efficient, innovative, safe (road traffic) ** ** accessible (sea and land ports) *** * adjusted to age and gender - ** walking and cycling *** * rail, air, road *** - integration transport hubs *** - Mobility management monitoring people’s transport behaviour and preferences *** - education, promotion of active forms of mobility *** - shaping transport behaviour *** * organisational, spatial and investment efforts to enable optimal transport choices *** * Transport offer common (for all) * * no constraints for people with disabilities ** * affordable - * optional for those non-motorised *** * using the most recent technologies to deliver joint mobility services *** * Conditions of growth spatial, social, legal, planning ** *** traffic, demographics, organisational *** - Urban logistics support for economic growth * * not affecting negatively living conditions in the city * * logistics centres ** - Managing growth transparent, hierarchical management structures * *** public participation * ** implementation of policies and strategies * ** implementation of programmes *** * cooperation between all levels of administration * ** consistency of sectoral policy goals across levels *** ** sectoral policy taking account of functional areas according to national law *** * strengthens the capacity of regional and local authorities to implement metropolitan multi-level governance going beyond the administrative boundaries and based on functional criteria,
*** *
mechanisms of metropolitan funding, - ** strengthening the role of small and medium-sized cities and towns - ** mechanisms of inter-municipality cooperation to deliver metropolitan public services, ** ** Spatial planning urban planning: moving functions, preventing sub-urbanisation, denser development, compact structures
** ***
regional planning: polycentricism, concentration, multiple functions ** ** mitigate mobility challenges and needs *** ** reducing costs of service delivery per capita, - * integration of spatial planning with transport planning * ***
The results of the analysis are the answer to the research question seven (RQ7). –: no reference; *: incidental reference in the text; **: several references in the text; ***: several references in the text with
a description. Legend: Areas of intervention with document consistency; NUA areas of intervention requiring recommendations; STM areas of intervention requiring recommendations.
Areas of intervention with document consistency;
Sustainability 2019, 11, 813 18 of 23
integration—residential areas with the rest of the urban tissue and the surrounding functional areas
- *
social—preventing social exclusion - *** environmental—promoting clean energy ** * environmental—reducing and mitigating climate changes - * environmental—sustainable patterns of consumption *** ** tourism—accessibility of tourism areas ** - economic—stimulating sustainable economic productivity across the entire urban-rural continuum
* *
Transport infrastructure green - * open, efficient, innovative, safe (road traffic) ** ** accessible (sea and land ports) *** * adjusted to age and gender - ** walking and cycling *** * rail, air, road *** - integration transport hubs *** - Mobility management monitoring people’s transport behaviour and preferences *** - education, promotion of active forms of mobility *** - shaping transport behaviour *** * organisational, spatial and investment efforts to enable optimal transport choices *** * Transport offer common (for all) * * no constraints for people with disabilities ** * affordable - * optional for those non-motorised *** * using the most recent technologies to deliver joint mobility services *** * Conditions of growth spatial, social, legal, planning ** *** traffic, demographics, organisational *** - Urban logistics support for economic growth * * not affecting negatively living conditions in the city * * logistics centres ** - Managing growth transparent, hierarchical management structures * *** public participation * ** implementation of policies and strategies * ** implementation of programmes *** * cooperation between all levels of administration * ** consistency of sectoral policy goals across levels *** ** sectoral policy taking account of functional areas according to national law *** * strengthens the capacity of regional and local authorities to implement metropolitan multi-level governance going beyond the administrative boundaries and based on functional criteria,
*** *
mechanisms of metropolitan funding, - ** strengthening the role of small and medium-sized cities and towns - ** mechanisms of inter-municipality cooperation to deliver metropolitan public services, ** ** Spatial planning urban planning: moving functions, preventing sub-urbanisation, denser development, compact structures
** ***
regional planning: polycentricism, concentration, multiple functions ** ** mitigate mobility challenges and needs *** ** reducing costs of service delivery per capita, - * integration of spatial planning with transport planning * ***
The results of the analysis are the answer to the research question seven (RQ7). –: no reference; *: incidental reference in the text; **: several references in the text; ***: several references in the text with
a description. Legend: Areas of intervention with document consistency; NUA areas of intervention requiring recommendations; STM areas of intervention requiring recommendations.
NUA areas of intervention requiring recommendations;
Sustainability 2019, 11, 813 18 of 23
integration—residential areas with the rest of the urban tissue and the surrounding functional areas
- *
social—preventing social exclusion - *** environmental—promoting clean energy ** * environmental—reducing and mitigating climate changes - * environmental—sustainable patterns of consumption *** ** tourism—accessibility of tourism areas ** - economic—stimulating sustainable economic productivity across the entire urban-rural continuum
* *
Transport infrastructure green - * open, efficient, innovative, safe (road traffic) ** ** accessible (sea and land ports) *** * adjusted to age and gender - ** walking and cycling *** * rail, air, road *** - integration transport hubs *** - Mobility management monitoring people’s transport behaviour and preferences *** - education, promotion of active forms of mobility *** - shaping transport behaviour *** * organisational, spatial and investment efforts to enable optimal transport choices *** * Transport offer common (for all) * * no constraints for people with disabilities ** * affordable - * optional for those non-motorised *** * using the most recent technologies to deliver joint mobility services *** * Conditions of growth spatial, social, legal, planning ** *** traffic, demographics, organisational *** - Urban logistics support for economic growth * * not affecting negatively living conditions in the city * * logistics centres ** - Managing growth transparent, hierarchical management structures * *** public participation * ** implementation of policies and strategies * ** implementation of programmes *** * cooperation between all levels of administration * ** consistency of sectoral policy goals across levels *** ** sectoral policy taking account of functional areas according to national law *** * strengthens the capacity of regional and local authorities to implement metropolitan multi-level governance going beyond the administrative boundaries and based on functional criteria,
*** *
mechanisms of metropolitan funding, - ** strengthening the role of small and medium-sized cities and towns - ** mechanisms of inter-municipality cooperation to deliver metropolitan public services, ** ** Spatial planning urban planning: moving functions, preventing sub-urbanisation, denser development, compact structures
** ***
regional planning: polycentricism, concentration, multiple functions ** ** mitigate mobility challenges and needs *** ** reducing costs of service delivery per capita, - * integration of spatial planning with transport planning * ***
The results of the analysis are the answer to the research question seven (RQ7). –: no reference; *: incidental reference in the text; **: several references in the text; ***: several references in the text with
a description. Legend: Areas of intervention with document consistency; NUA areas of intervention requiring recommendations; STM areas of intervention requiring recommendations.
STM areas of intervention requiring recommendations.
5.3. Discussion of the Results of Analysis
The chronology of the documents explains why the strategy makes no direct reference to theNUA. But because its vision, goals and planned steps and interventions are geared towards the ideaof sustainable transport there is clear evidence of the linkages between the STM and NUA. The documentsalso differ substantially on the subject and object. While the NUA refers to cities in general and urbandevelopment in all spheres, the STM refers to a specific metropolis and the development of its transportsystem. As a consequence, the NUA addresses primarily links within urban areas and urban-rural links.The STM, however, looks at the reach of functional links up to the international level, a result of themetropolitan functions.
When analysed in the context of the NUA, the TMA’s transport system displays some featureswhich are not sufficiently covered in the NUA. Because it is an extensive area it will typically havesome characteristics that are strategic and critical for ensuring a balanced development across themetropolitan area. These include: the role of external and internal transport links in shaping themetropolis’ transport system, modal split and trip length, transport safety, local authority cooperationand transport preferences of the metropolis population.
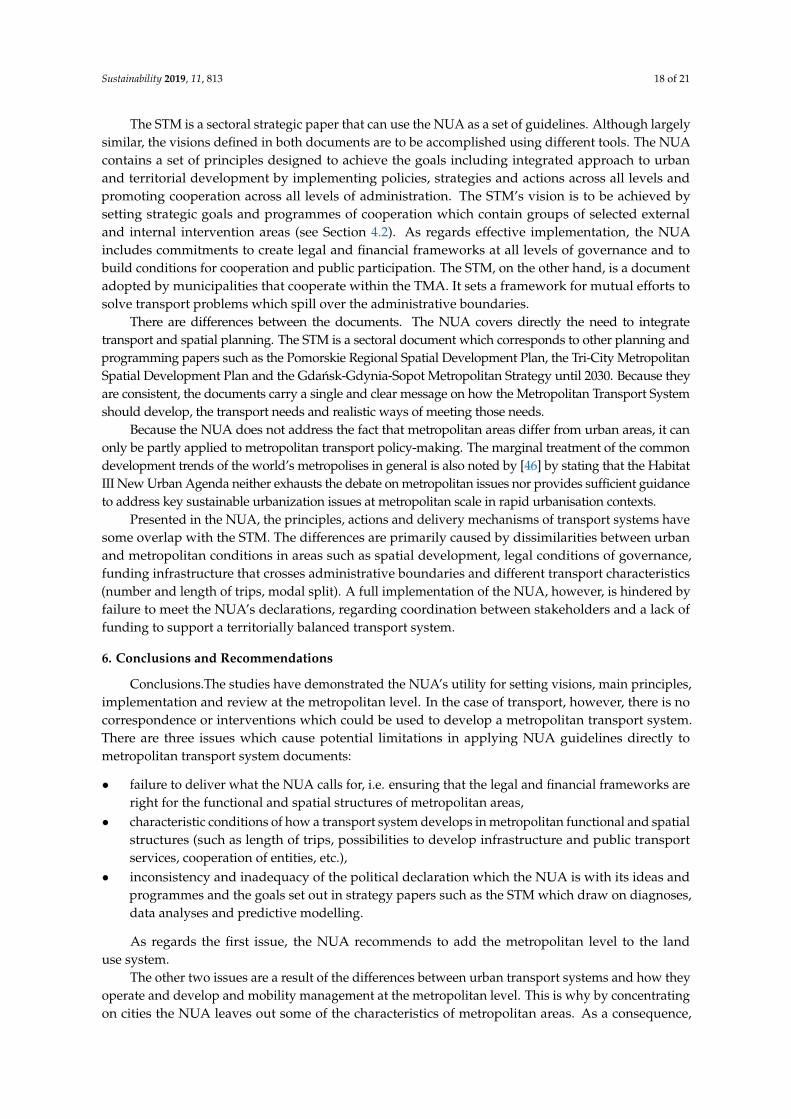
Sustainability 2019, 11, 813 18 of 21
The STM is a sectoral strategic paper that can use the NUA as a set of guidelines. Although largelysimilar, the visions defined in both documents are to be accomplished using different tools. The NUAcontains a set of principles designed to achieve the goals including integrated approach to urbanand territorial development by implementing policies, strategies and actions across all levels andpromoting cooperation across all levels of administration. The STM’s vision is to be achieved bysetting strategic goals and programmes of cooperation which contain groups of selected externaland internal intervention areas (see Section 4.2). As regards effective implementation, the NUAincludes commitments to create legal and financial frameworks at all levels of governance and tobuild conditions for cooperation and public participation. The STM, on the other hand, is a documentadopted by municipalities that cooperate within the TMA. It sets a framework for mutual efforts tosolve transport problems which spill over the administrative boundaries.
There are differences between the documents. The NUA covers directly the need to integratetransport and spatial planning. The STM is a sectoral document which corresponds to other planning andprogramming papers such as the Pomorskie Regional Spatial Development Plan, the Tri-City MetropolitanSpatial Development Plan and the Gdansk-Gdynia-Sopot Metropolitan Strategy until 2030. Because theyare consistent, the documents carry a single and clear message on how the Metropolitan Transport Systemshould develop, the transport needs and realistic ways of meeting those needs.
Because the NUA does not address the fact that metropolitan areas differ from urban areas, it canonly be partly applied to metropolitan transport policy-making. The marginal treatment of the commondevelopment trends of the world’s metropolises in general is also noted by [46] by stating that the HabitatIII New Urban Agenda neither exhausts the debate on metropolitan issues nor provides sufficient guidanceto address key sustainable urbanization issues at metropolitan scale in rapid urbanisation contexts.
Presented in the NUA, the principles, actions and delivery mechanisms of transport systems havesome overlap with the STM. The differences are primarily caused by dissimilarities between urbanand metropolitan conditions in areas such as spatial development, legal conditions of governance,funding infrastructure that crosses administrative boundaries and different transport characteristics(number and length of trips, modal split). A full implementation of the NUA, however, is hindered byfailure to meet the NUA’s declarations, regarding coordination between stakeholders and a lack offunding to support a territorially balanced transport system.
6. Conclusions and Recommendations
Conclusions.The studies have demonstrated the NUA’s utility for setting visions, main principles,implementation and review at the metropolitan level. In the case of transport, however, there is nocorrespondence or interventions which could be used to develop a metropolitan transport system.There are three issues which cause potential limitations in applying NUA guidelines directly tometropolitan transport system documents:
• failure to deliver what the NUA calls for, i.e. ensuring that the legal and financial frameworks areright for the functional and spatial structures of metropolitan areas,
• characteristic conditions of how a transport system develops in metropolitan functional and spatialstructures (such as length of trips, possibilities to develop infrastructure and public transportservices, cooperation of entities, etc.),
• inconsistency and inadequacy of the political declaration which the NUA is with its ideas andprogrammes and the goals set out in strategy papers such as the STM which draw on diagnoses,data analyses and predictive modelling.
As regards the first issue, the NUA recommends to add the metropolitan level to the landuse system.
The other two issues are a result of the differences between urban transport systems and how theyoperate and develop and mobility management at the metropolitan level. This is why by concentratingon cities the NUA leaves out some of the characteristics of metropolitan areas. As a consequence,
Sustainability 2019, 11, 813 19 of 21
although the NUA can work successfully for metropolitan cores, outer areas are not covered directly.The article demonstrated that by comparing the NUA with the STM.
The differences between the STM and NUA in how they tackle selected areas of interventioninvolving the operation and development of transport systems suggest that when these documentsare updated or delivered it would be worthwhile to complement the principles and actions withnew ones that reflect modern day development problems of urban and metropolitan areas. Based onthe research and analysis carried out, recommendations for NUA and STM were developed, whichprovide answers to the practical question one (PQ1) and two (PQ2).
Recommendations for NUA. When implementing the NUA in developing metropolitan areas,it is recommended to adapt the NUA principles to the specific conditions that prevail in the functionalareas. The spatial structure and the distribution of destinations and sources of traffic means that:
• trips are relatively long, sometimes impossible to be made walking or cycling,• means of transport must be integrated to reflect different distances and a rail and bus passenger
system must be built (a shuttle service),• the quality of rail and road infrastructure to be used by buses and transit traffic to TENT hubs
must be improved (sea ports, airports); this problem applies not only to emerging metropoliseswhich still carry a legacy of poor quality transport infrastructure.
In the context of the above problems and phenomena it is noted and recommended that successiveurban agendas should address problems specific to metropolitan areas such as:
• presence of transport hubs and logistic centres,• presence of infrastructure to access transport hubs and logistics centres used by motor, rail and
inland water transport,• tourist traffic services,• a strong need to integrate transport sub-systems,• institutionally and legally complex mobility management.
Recommendation for STM. It is recommended that the STM should in particular consider thefollowing areas of intervention proposed in NUA, that are part of transport management:
• prevent social exclusion,• prevent and adapt to climate change,• adapt the infrastructure to the age and gender of transport users,• shape affordable transport tariffs,• identify funding priorities for transport sub-systems,• reduce transport costs per capita.
The above groups of intervention should complement the objectives of the STM and form part ofthe efforts carried out by metropolitan entities.
Author Contributions: R.O.—wrote and edited the article, contributed to Chapters 1, 3.1, 3.2, 3.3,4.3, 5.1, 5.2,5.3, 6;K.J.—conceptualization, supervision and contribution to Chapter 2.1,2.1,2.3,4.2,4.3, 6; L.M.—contributed to Chapter 4,6; J.Z.—contributed to Chapter 3.3,4.2; K.G.—contributed to Chapter 1, 6; K.B.—data visualisation and contributed toChapter 3.2,4.1,4.2; Some authors were directly involved in the development of the Strategy for Transport and Mobilityfor the TMA until 2030. K.J.—team leader, L.M.—main author, R.O., K.G. and K.B.—co-authors.
Funding: This research received no external funding.
Acknowledgments: The STM TMA was developed for Partner in Business Strategies (PBS) commissioned by theGdansk-Gdynia-Sopot Metropolitan Area association. No funding was obtained in the project to cover the costsof publication in Open Access.
Conflicts of Interest: The authors declare no conflict of interest. The funding sponsors had no role in the design ofthe study; in the collection, analyses or interpretation of data; in the writing of the manuscript and in the decisionto publish the results.

Sustainability 2019, 11, 813 20 of 21
References
1. Lerner, W. The Future of Urban Mobility. Towards Networked, Multimodal Cities of 2050; Arthur D Little FutureLab: Brussels, Belgium, 2011.
2. United Nations. New Urban Agenda; United Nations: New York, NY, USA, 2017.3. United Nations. Sustainable Development Goals | UNDP; United Nations: New York, NY, USA, 2015.4. Cohen, M.; Habron, G. How Does the New Urban Agenda Align with Comprehensive Planning in U.S.
Cities? A Case Study of Asheville, North Carolina. Sustainability 2018, 10, 4590. [CrossRef]5. Müller, B.; Shimizu, H.; Otto, A. The Transition towards Sustainable and Resilient Cities—Urban Challenges
and Solutions in Germany and Japan. In Towards the Implementation of the New Urban Agenda; SpringerInternational Publishing: Cham, Switzerland, 2018; pp. 1–20.
6. Jordán, R.; Indvik, K.; Winchester, L.; Devin, S. Subregional Action Plan for the implementation of the New UrbanAgenda in the Caribbean; United Nations publication: Santiago, Chile, 2017; pp. 1–36.
7. EU Ministers Responsible for Urban Matters. Urban Agenda for the EU: Pact of Amsterdam; European Union(EU): Brussels, Belgium, 2016.
8. OECD. The State of National Urban Policy in OECD Countries; A Special Report Prepared for the United NationsConference on Housing and Sustainable Urban Development (Habitat III); OECD: Paris, France, 2016.
9. Wefering, F.; Rupprecht, S.; Bührmann, S.; Böhler-Baedeker, S. Developing and Implementing a SustainableUrban Mobility Plan Guidelines; European Commission: Brussels, Belgium, 2014.
10. Bernciak, A. The New Urban Agenda—A Challenge or an Opportunity for Polish Cities? Econ. Environ. Stud.2017, 17, 879–892. [CrossRef]
11. Okraszewska, R.; Romanowska, A.; Wołek, M.; Oskarbski, J.; Birr, K.; Jamroz, K. Integration of a MultilevelTransport System Model into Sustainable Urban Mobility Planning. Sustainability 2018, 10, 479. [CrossRef]
12. Orcholska, K. Sustainable Urban Mobility Plan for Gdansk; Grafpol: Wrocław, Poland, 2018.13. Wołek, M.; Czapnik, M.; Czermanski, E.; Franek, Ł.; Furkal, J.; Hebel, K.; Jagiełło, A.; Kaszubowski, D.;
Kuropatwinski, P.; Lewandowski, K.; Majewski, P.; et al. Gdynia’s Sustainable Urban Mobility Plan(SUMP) and Its Development. Gdynia, Poland, 2016. Available online: https://drive.google.com/file/d/0B5EayIa4PrsqV0lEU2pWMWtnM3M/view (accessed on 30 November 2016).
14. Kulwant, S. Contribution on Smart Urban Mobility for Safe, Inclusive, Resilient and Sustainable Cities—EcoMobility;IRU: Geneve, Switzerland, 2016.
15. Ahrend, R.; Schumann, A. Approaches to Metropolitan Area Governance: A Country Overview. OECD Reg.Dev. Work. Pap. 2014, 3, 0_1.
16. Nelles, J. Comparative Metropolitan Policy: Governing beyond Local Boundaries in the Imagined Metropolis;Routledge: Abingdon, UK, 2012.
17. Pearson, J. Metropolitan Governance: A Framework for Capacity Assessment; Deutsche Gesellschaft fürInternationale Zusammenarbeit, GmbH: Bonn, Germany, 2016.
18. Knieling, J. Metropolitan Regions. Definitions, Typologies and Recommendations for Development Cooperation.Metropolitan Regions as Governance Systems; Deutsche Gesellschaft für Internationale Zusammenarbeit, GmbH:Bonn, Germany, 2014.
19. Danielewicz, J. Management of Metropolitan Areas in the Presence of Global Urbanization Processes; WydawnictwoUniwersytetu Łódzkiego: Łódz, Poland, 2013. (In Polish)
20. Markowski, T.; Marszał, T. Metropolises, Metropolitan Areas, Metropolization: Problems and Basic Concepts; PolskaAkademia Nauk, Komitet Przestrzennego Zagospodarowania Kraju: Warszawa, Poland, 2006. (In Polish)
21. Smetkowski, M.; Jałowiecki, B.; Gorzelak, G. Metropolitan areas in Poland: development and delimitation problems;Centrum Europejskich Studiów Regionalnych i Lokalnych EUROREG: Warszawa, Poland, 2009. (In Polish)
22. Göddecke-Stellmann, J. Metropolitan areas in Europe, Federal Institute for Research on Building; Urban Affairsand Spatial Development (BBSR): Bonn, Germany, 2011.
23. Barcelona Centre for International Affairs. The Role of Metropolitan Areas in the Governance of Development Challenges:Towards the European Urban Agenda; Barcelona Centre for International Affairs: Barcelona, Spain, 2016.
24. Ciegis, R.; Ramanauskiene, J.; Martinkus, B. The Concept of Sustainable Development and its Use forSustainability Scenarios. Eng. Econ. 2015, 62. [CrossRef]
25. Banister, D. The sustainable mobility paradigm. Transp. Policy 2008, 15, 73–80. [CrossRef]
Sustainability 2019, 11, 813 21 of 21
26. UITP. Public Transport for Sustainable Mobility. UITP, 2002. Available online: https://www.uitp.org/sites/default/files/cck-focus-papers-files/PUBLIC%20TRANSPORT%20FOR%20SUSTAINABLE%20MOBILITY.pdf (accessed on 23 January 2019).
27. Gillis, D.; Semanjski, I.; Lauwers, D. How to Monitor Sustainable Mobility in Cities? Literature Review inthe Frame of Creating a Set of Sustainable Mobility Indicators. Sustainability 2015, 8, 29. [CrossRef]
28. WBCSD. Methodology and Indicator Calculation Method for Sustainable Urban Mobility; WBCSD: Geneva,Switzerland, 2015.
29. Andersdotter Fabre, E. Local implementation of the SDGs and the New Urban Agenda. Towards a Swedish NationalUrban Policy, Global Utmaning; Global Utmaning: Stockholm, Sweden, 2017.
30. Mobilise Your City, 100 Cities and 20 National Governments Engaged in Sustainable Urban Mobility, Brussels.2017. Available online: http://mobiliseyourcity.net/resources/mobiliseyourcity-publications/ (accessed on23 January 2019).
31. Habitat III. The Montréal Declaration on Metropolitan Areas. Fostering metropolitan cooperationfor sustainable urban development. Thematic Meeting, Montreal, 6–7 October 2015. 2015.Available online: http://www.urbangateway.org/system/files/documents/urbangateway/habitat_declarationmontreal-en.pdf (accessed on 23 January 2019).
32. Worth, L. Urbanism as a way of life (Wirth; 1938).pdf. Am. J. Sociol. 1938, 44, 97–104. [CrossRef]33. Pietruszewski, J. Spatial Development Plan for Tricity Metropolitan Area 2030; Pomorskie Biuro Planowania
Regionalnego: Gdansk, Poland, 2015; p. 194. (In Polish)34. Michalski, L.; Jamroz, K.; Grzelec, K.; Grulkowski, S.; Kaszubowski, D.; Okraszewska, R.; Birr, K.; Kustra, W.
Strategy for Transport and Mobility for Tricity Metropolitan Area 2030; Partner in Business Strategies: Gdansk,Poland, 2015; p. 104. (In Polish)
35. Rojas, M.B.; Sadeghvaziri, E.; Jin, X. Comprehensive Review of Travel Behavior and Mobility Pattern StudiesThat Used Mobile Phone Data. Transp. Res. Rec. J. Transp. Res. Board. 2016, 2563, 71–79. [CrossRef]
36. Bozek, M.; Chastek, K.; Krzynowek_Franek, A.; Sapon, P.; Szpórnóg, M.; Wiertel, B. Gdansk travel studies,VIA VISTULA. Available online: https://www.brg.gda.pl/attachments/article/243/wyniki-gdanskich-badan-ruchu-2016-broszura.pdf (accessed on 3 February 2019).
37. P.A. Group. PTV Visum17 Manual; P.A. Group: Karlsruhe, Germany, 2017.38. Domencich, T.A.; McFadden, D. Urban Travel Demand: A Behavioral Analysis: A Charles River Associates
Research Study; Charles River Associates, North-Holland Pub. Co.: Amsterdam, Holland, 1975.39. Cebollada, A.; Riera, P. Daily mobility in the Comarques Centrals. 2008. Available online:
http://www.academia.edu/716883/La_mobilitat_quotidiana_a_les_Comarques_Centrals_Daily_mobility_in_the_Comarques_Centrals (accessed on 3 February 2019).
40. Castells, M. The Rise of the Network Society; Blackwell Publishers: Cambridge, CA, USA, 2000.41. Burger, M.; Meijers, E. Form Follows Function? Linking Morphological and Functional Polycentricity.
Urban Stud. 2012, 49, 1127–1149. [CrossRef]42. Merk, O. The Competitiveness of Global Port-Cities: Synthesis Report. 2013. [CrossRef]43. Pucher, J.; Renne, J.L. Rural mobility and mode choice: Evidence from the 2001 National Household Travel
Survey. Transportation (Amst) 2005, 32, 165–186. [CrossRef]44. Hulst, R.; van Montfort, A. Inter-Municipal Cooperation: A Widespread Phenomenon. In Inter-Municipal
Coop. Eur.; Springer: Dordrecht, The Netherlands, 2007; pp. 1–21. [CrossRef]45. Oskarbski, J.; Kaszubowski, D.; Oskarbski, J.; Kaszubowski, D. Applying a Mesoscopic Transport Model
to Analyse the Effects of Urban Freight Regulatory Measures on Transport Emissions—An Assessment.Sustainability 2018, 10, 2515. [CrossRef]
46. The International Policy Centre for Inclusive Growth, A New Urban Paradigm: Pathways to SustainableDevelopment, (2013) 83278. Available online: https://www.ipc-undp.org/pub/eng/PIF37_A_new_urban_paradigm_pathways_to_sustainable_development.pdf (accessed on 22 October 2018).
© 2019 by the authors. Licensee MDPI, Basel, Switzerland. This article is an open accessarticle distributed under the terms and conditions of the Creative Commons Attribution(CC BY) license (http://creativecommons.org/licenses/by/4.0/).