analysing the effect of company characteristics on working
TRANSCRIPT

INTERNATIONAL JOURNAL OF ACADEMIC RESEARCH IN ACCOUNTING, FINANCE AND
MANAGEMENT SCIENCES
Vol. 1 1 , No. 3, 2021, E-ISSN: 2225-8329 © 2021 HRMARS
554
Full Terms & Conditions of access and use can be found at
http://hrmars.com/index.php/pages/detail/publication-ethics
Analysing the Effect of Company Characteristics on Working Capital Management: Evidence from an Emerging Economy
Charles Ekornunye Ansah
To Link this Article: http://dx.doi.org/10.6007/IJARAFMS/v11-i3/11239 DOI:10.6007/IJARAFMS /v11-i3/11239
Received: 10 July 2021, Revised: 14 August 2021, Accepted: 29 August 2021
Published Online: 18 September 2021
In-Text Citation: (Ansah, 2021) To Cite this Article: Ansah, C. E. (2021). Analysing the Effect of Company Characteristics on Working Capital
Management: Evidence from an Emerging Economy. International Journal of Academic Research in Accounting Finance and Management Sciences, 11(3), 554–585.
Copyright: © 2021 The Author(s)
Published by Human Resource Management Academic Research Society (www.hrmars.com) This article is published under the Creative Commons Attribution (CC BY 4.0) license. Anyone may reproduce, distribute, translate and create derivative works of this article (for both commercial and non-commercial purposes), subject to full attribution to the original publication and authors. The full terms of this license may be seen at: http://creativecommons.org/licences/by/4.0/legalcode
Vol. 11, No. 3, 2021, Pg. 554 - 585
http://hrmars.com/index.php/pages/detail/IJARAFMS JOURNAL HOMEPAGE

INTERNATIONAL JOURNAL OF ACADEMIC RESEARCH IN ACCOUNTING, FINANCE AND
MANAGEMENT SCIENCES
Vol. 1 1 , No. 3, 2021, E-ISSN: 2225-8329 © 2021 HRMARS
555
Analysing the Effect of Company Characteristics on Working Capital Management: Evidence from an
Emerging Economy
Charles Ekornunye Ansah National Youth Authority P. O. Box AB 29, Abor. Volta Region Ghana. West Africa
Email: [email protected] Abstract This study analyses effects of company characteristics (company size (SIZE), profitability, operating cash flow, sales growth, current ratio (CR), quick ratio (QR) and debt ratio (DR)) on Working Capital Management (WCM), measured as cash conversion cycle (CCC). Unlike profitability, these characteristics have received less attention in the extant literature especially in emerging economies and this is where the study makes its contribution. Data retrieved were gathered from annual financial reports of 13 sampled non-financial firms, over the period 2005 – 2013, listed on Ghana Stock Exchange. Panel data methodology was used, and descriptive statistics, regression and correlation analyses were employed in testing the seven hypotheses. Results indicate that, SIZE has a negative and significant impact on CCC whereas CR and DR positively and significantly relate to CCC. The findings imply that: CCC is greatly enhanced if managers improve upon their firms’ sizes; further, firms can enhance their CCC by maintaining CR and DR at optimal levels so that more profits could be accumulated, resulting from the efficiency, to support positive NPV projects. The study however finds no relationship between CCC and the other variables. Further researches could consider measuring WCM using cash conversion efficiency, net working capital level and operating cycle. Keywords: Working Capital Management, Cash Conversion Cycle, Company characteristics, Ghana Stock Exchange. Introduction
Day in day out, many business leaders and managers are becoming increasingly aware of the accruing benefits and relevance of managing their working capital well. It is evidently clear that, irrespective of the quantum of fixed assets possessed by any firm, no business would be able to undertake daily business activities in the absence of satisfactory capital because capital serves as the blood that runs through the veins of the business without which the business cannot survive. In that wise, Deloof opines that firms try to keep a level of working capital that sustains their operations thereby increasing the value of the firm (Deloof, 2003). Working capital management (WCM) has to do with how current assets and current liabilities are controlled and coordinated in daily business activities.
The patronisation of short-term credit market than long-term market by fund providers in Ghana and other emerging economies has made WCM very relevant in these economies. The patronage might have come as a result of the high rate of interest in some emerging markets, compared with

INTERNATIONAL JOURNAL OF ACADEMIC RESEARCH IN ACCOUNTING, FINANCE AND
MANAGEMENT SCIENCES
Vol. 1 1 , No. 3, 2021, E-ISSN: 2225-8329 © 2021 HRMARS
556
developed economies, which has the tendency of reducing the purchasing power of future cash flows. With limited availability of financing sources in Ghana and other emerging markets, companies must ensure they manage their working capital efficiently in order to remain profitable and grow. This will help the country in stabilising its economy and to help address unemployment (Akoto et al., 2013). Managing working capital is a difficult task and often left not well handled by most players in the financial sector, though it is a known term (Afrifa, 2013). This often results to the failure of some companies. Adverse consequences that a firm could face when working capital is either inadequate or not managed properly include retardation of growth arising from not being able to take up positive Net Present Value projects as a result of lack of funds, missing profit targets of the firm arising from not being able to implement plans, facing inefficiencies in operations, loss of attractive credit chances due to paucity of working capital, and inability of the firm to settle its maturing debts.
Most researchers have used cash conversion cycle (CCC) as a proxy measure of working capital management. It is the difference in time from the purchase of raw materials to the collection of moneys from customers who have purchased the finished goods (Atseye et al., 2015; Naser et al., 2013). The quantum of investment in working capital, whether large or small, is determined by the length of this time interval. A well-managed CCC leads to increased sales which eventually increases profitability. Thus, working capital provides an assessment of how liquid a firm is. It ensures that adequate capital is maintained to settle current liabilities and future operating expenditures to ensure uninterrupted business operations (Naser et al., 2013). Insolvency and bankruptcy issues are the resultant effects of failure on the part of managers to fully regulate working capital (Okreglicka, 2014). The decision of a firm’s management regarding working capital usually should center on the financing and investment decisions (McInnes, 2000; Jen – Ren et al., 2006; Sharma and Kumar, 2011). Only the financing decision has been given attention by firms, with the investment decision being relegated to the background (McInnes 2000).
When managing working capital, one major area where attention should be more focused on is managing cash. This enables the availability of cash at all times for the firm’s operational needs whilst at the same time ensuring reduction in the cost of holding cash (Naser et al., 2013). When there is supply of products, cash must be received unless the supply is on credit. The management of cash impacts WCM as it affects settlement of debts and claims collection accompanied by discounts, depending on the situation (Zohrabi et al., 2013).
As a result of the key role working capital plays, a host of researches have been conducted over the years to explore factors impacting working capital. A host of researchers have identified correlations among WCM and business performance (Raheman and Nasr, 2007; Karaduman et al., 2010; Bratland and Hornbrinck, 2013; Mengesha, 2014; Awan et al., 2014; Banos-Caballero et al., 2014; Aktas et al., 2015; Raza et al., 2015; Afrifa, and Padachi, 2016). There are several other factors, aside from profitability, that impact WCM for which no much studies have been conducted into and that is what this study seeks to examine and analyse. Only a handful of studies (Sabri, 2012; Valipour et al., 2012a; Naser et al., 2013) have been conducted on the impact firm attributes have on WCM. Their results demonstrate that debt, size and the liquidity ratios have significantly varied influences on WCM. Recent studies relating to WCM in Ghana (Prempeh, 2016; Mawutor, 2014; Akoto et al., 2013; Agyeman and Asiedu, 2013) have not been based on the effect of a number of company characteristics on WCM. Some prior studies indicate that characteristics that impact WCM are return on assets, leverage, size, growth and cash flow from operations (Rimo and Panbunyuen, 2010; Valipour et al. 2012a; Naser et al. 2013). To the knowledge of the author, no study has examined the effect of a number of company characteristics on WCM of firms listed on Ghana Stock Exchange (GSE) and many other emerging economies. This study therefore is undertaken to fill in the gap of non-existent
INTERNATIONAL JOURNAL OF ACADEMIC RESEARCH IN ACCOUNTING, FINANCE AND
MANAGEMENT SCIENCES
Vol. 1 1 , No. 3, 2021, E-ISSN: 2225-8329 © 2021 HRMARS
557
empirical studies in relation to the efficient and effective ways of managing WC in order to boost firm and shareholder values. Empirical Review Working Capital Management
Working capital (short–term capital) is capital used by firms in their day to day activities with relevant elements being inventory, receivables, cash in hand and at bank, payables and bank overdrafts (Marfo-Yiadom and Agyei, 2011; Jen-Ren et al., 2006). A firm’s liquidity is often measured by working capital, and for a firm to be able to settle its current obligations when their time is due, its liquidity position has to be adequate (Khanqah et al., 2012). WCM has to do with the issues that emanate from the management of, and interrelationship between, current assets and liabilities as mismanaging these could retard growth and impede profitability even if there are growth prospects. Adequate working capital would enable the firm produce enough goods to meet customers’ orders (Gachira et al., 2014). Management of Inventory
Managing a firm’s inventory entails controlling, utilizing and purchasing materials. The purpose is to getting the required inventories promptly. All these affect production (Prempeh, 2016). In his study on the role of material management in production operations of manufacturing firms in Nigeria, Akindipe recommends several ways to manage materials / inventory which include the following: determination of minimum stock levels by manufacturing firms to ensure that stock-out, loss of production time, low capacity utilization and inability to meet production targets are avoided; proper programming of timely arrival of raw materials and other inventories in order that no delays of the time lag between requisition and supply would be recorded as this will ensure uninterrupted production operations; and using inventory models among others. These recommendations, it is believed, when implemented will result to efficient management of inventory which will eventually lower the CCC and thus, enhance profit and firm value (Akindipe, 2014). To add to the above, Nkwakaego is of the view that holding substantial inventories in relation to the amount required to service sales will result to a low inventory turnover ratio which is a plus for the firm as more than needed inventory means tying up of most needed funds unnecessarily. On the other hand, the firm could lose customers if it holds on to little inventory resulting to very low inventory turnover ratio (Nwakaego, 2014). Therefore, a reasonable amount of inventory has to be maintained to ensure that customers’ demands are met whilst avoiding excess stocks. Management of Receivables
Nowadays, many businesses resort to selling on credit basis in order to gain a larger customer base. If such firms have the chance, they would tend to sell their goods on cash basis but because of circumstances prevailing such as market conditions, stiff competition and trade policies among others, firms are forced to sell on credit to the extent that some even give extended credit in order to boost sales. As a result, current asset is created in the form of Accounts Receivable. That means some locking up of capital is occurring in those accounts receivables and this form of investment has to be effectively and efficiently managed because it brings about some costs. Effective management of accounts receivable would ensure that the benefits outweigh costs arising from maintaining receivables. According to Ezejiofor et al. (2015), the main aim of receivables management is the minimisation of bad and doubtful debts resulting from customers’ inability to pay for what they owe the firm. They find a positive connection between credit granting and operating profit of the firms affirming that credit could be granted to creditworthy customers in order to boost profitability as they find that

INTERNATIONAL JOURNAL OF ACADEMIC RESEARCH IN ACCOUNTING, FINANCE AND
MANAGEMENT SCIENCES
Vol. 1 1 , No. 3, 2021, E-ISSN: 2225-8329 © 2021 HRMARS
558
turnover and profitability increases as a result of credit sales. However, the study by Makori and Jagongo (2013) suggest the existence of a negative connection between average receivable period and profitability, thus, as receivables increase, profit declines. To them, it enables management of the firms to set credit policies for those sectors. Management of Cash
Ensuring that the daily operations of the firm are run successfully depends on the availability of cash. Therefore, managing cash is geared towards making cash available to meet the daily operational needs and also to cut down on cash holding costs (Naser, et al., 2013). The study by Ogundipe et al. (2012) suggests the existence of a positive correlation between cash and cash flow implying that, firms having large cash flows would often retain higher levels of cash. The researchers further find a negative connection between profitability and cash holdings which supports the trade-off theory. Naser, et al. (2013) find a negative correlation between operating cash flows and CCC indicating that the more the operating cash flow increases, the shorter is the CCC. This calls for prudence in managing the CCC for optimal profitability. Management of Payables
Accounts Payables are the reverse of accounts receivables in that a firm obtains credit from its suppliers as opposed to the firm giving credit to its customers. Payables constitute goods and, or services supplied to the firm for which payment is yet to be made. Deloof (2003) opines that instead of finding funding sources to finance business activities, assessing trade credits is very useful for enhancing sales because customers could assess product quality and pay at a later date. However, McInness study reveals that firms do not pay much attention to accounts payable compared to other working capital components. Trade credit has been treated as unimportant as portrayed by the ranking of trade payable, being between third and fourth. This lapse could be placed at the door steps of senior management of the firms in the study as their focus is more on inventory, cash and receivables management (McInnes, 2000).
In order to have a shorter CC, it is advisable that a firm delays a little in paying its suppliers while ensuring early collection of its debts. This creates the synergy for a shorter working capital cycle indicating an efficiently managed working capital. Makori and Jagongo (2013), after their research shows a positive correlation between accounts payable period and profitability, recommend that firms delay reasonably in paying suppliers as this helps them obtain better profitability. This could be achieved if suppliers do not interrupt supplies to the firm so that the firms would have smooth uninterrupted operations. Hypotheses Formulation Measuring Working Capital Management (WCM) using Cash Conversion Cycle
While there are numerous proxy measures of WCM such as Net Working Capital Ratio, Operating Cycle, Current Ratio, Cash Conversion Cycle (CCC), Inventory Turnover Ratio and Average Payment Period, Kusuma and Bachtiar (2018) find that Inventory Turnover is the best measure of WCM which better explains profitability. Kusuma and Bachtiar suggest that net working capital ratio, current ratio, CCC, inventory turnover and average payment period could be used. Karaduman et al. (2010) also suggest the use of CCC, operating cycle, net-trade cycle or weighted CCC.
In this study, CCC is used as the dependent variable to measure working capital. The CCC gives more explanation to WCM because it encompasses all the components and concepts, starting with purchase of raw material to the finished goods and outputs which represent inventory levels, to accounts receivable and the payment serving the cash aspect (Aminu and Zainudin, 2015). As
INTERNATIONAL JOURNAL OF ACADEMIC RESEARCH IN ACCOUNTING, FINANCE AND
MANAGEMENT SCIENCES
Vol. 1 1 , No. 3, 2021, E-ISSN: 2225-8329 © 2021 HRMARS
559
mentioned, the components of CCC are averages of inventory days, accounts receivable days and accounts payable days.
Several of the studies cited above have established a correlation between WCM and company characteristics such as company size, profitability, operating cash flow, sales growth, current ratio, quick ratio and debt ratio. Prior studies that assess any of the characteristics will be reviewed. Company Characteristics Company Size (SIZE)
Some studies have been conducted to investigate the relationship between size of company and WCM. Some find that SIZE has a negative effect on WCM (Naser, et al. (2013); Attari and Zara (2012); Rimo and Panbunyuen, (2010)). They elaborate that large-sized firms have more bargaining influence over their customers (receivables) and suppliers (payables) to negotiate for early settlement by customers, and huge discounts and longer terms of payment than their smaller sized counterparts. They are also able to reduce their prices more than smaller companies thereby increasing their sales to attain sales growth and higher profits. All these shorten the CCC indicating efficiency and effectiveness in managing working capital. Zalaghi et al. (2019) also examine the moderating role of firm’s characteristics on the relationship between WCM and financial performance and find that SIZE has significant negative connection with CCC of firms listed on Tehran Stock Exchange.
Other studies however report a positive effect of SIZE on CCC, and profitability implying higher profits recorded by larger firms as compared to smaller firms. They attribute this to the ability of larger firms to take advantage of economies of scale which eventually shortens the CCC (Akomeah and Frimpong, 2019; Tahir and Anuar, 2015; Makori and Jagongo, 2013). The study by Tahir and Anuar (2015) examines the relationship between WCM and company profitability by the use of 127 quoted Pakistani textile companies on Karachi Stock Exchange between 2001 and 2012. Their results suggest a positive effect of SIZE on CCC as well as PROF and growth in sales. The authors advise firms to design and implement effective working capital policies to enhance their profitability. These effects have been summed up thusly: large firms have the ability to manage their working capital efficiently than smaller firms as they are able to shorten their CCC better.
The advantage the large firms have over their smaller counterparts is being supported by the working capital performance report by Ernst and Young. It states that, large companies have managed to drive improvement in the performance of their payables, as they take action to leverage and consolidate spend, change their terms of payment, standardize their processes and work closely with their suppliers. Meanwhile, SMEs’ payables result have exhibited a much weaker trend and this may have come up due to changes in tactics and strategies with most companies opting to respond to more challenging market conditions by settling their payables more quickly in order to enjoy enhanced cash discounts (Ernst and Young, 2014).
Company size counts in bargaining for better trading conditions. This power to bargain is a characteristic of large firms which translates into better management of working capital resulting from shorter CCC. Hypothesis 1 is therefore formulated as:
H1: Company Size is negatively related to cash conversion cycle. Profitability (PROF)
A number of researches have been undertaken to establish the relationship between WCM and PROF as PROF seemed to have been prioritised over the other company characteristics based on those numerous studies. CCC has to be shortened in order for PROF to be increased, and PROF increases when sales rises. It is expedient to ensure proper pricing of products in order to attract customers so as to boost sales. Deloof (2003) investigates the relation between WCM measured by CCC and PROF

INTERNATIONAL JOURNAL OF ACADEMIC RESEARCH IN ACCOUNTING, FINANCE AND
MANAGEMENT SCIENCES
Vol. 1 1 , No. 3, 2021, E-ISSN: 2225-8329 © 2021 HRMARS
560
measured by gross operating income in a sample of 1,009 large Belgian non-financial firms. His study suggests that managers can increase corporate profitability by reducing receivable days and inventory days. The study further reveals a negative relation between accounts payable and profitability which is consistent with the view that less profitable firms wait longer to pay their bills. Awan and Ahmad (2013) study whether working capital could make a difference in a sample of 358 firms from Kenya Stock Exchange by examining the contact of working capital variables with profitability. Their results reveal that PROF negatively affects long average collection period, inventories accumulation and financial leverage but increases with growth opportunities. They contend that when collection period is long, bad debts may increase and this ends up decreasing profitability as a result of a rise in CCC. Other studies (Awan et al., 2014); Ukaegbu (2014); Napompech (2013); Valipour et al (2012a); Bellouma (2011); Dãnuletui (2010); Raheman and Nasr (2007)) also report a negative relation between PROF and CCC.
Anton and Anca (2021) investigate the effect of WCM on PROF in 719 Polish listed firms. They find that PROF has a positive effect on working capital when its optimal level is low. The authors attribute this to discounts earned for making payments in advance and a rise in sales. They also find that, when working capital is above optimal level, PROF is adversely affected and they attribute this to the presence of financing cost, refinancing uncertainties and opportunity cost. Akomeah and Frimpong (2019); Akoto et al (2013) report a positive relation between CCC and PROF when they examine the impact of working capital on profitability of manufacturing firms listed on Ghana Stock Exchange. Akoto et al. further establish significantly positive relations between PROF and current ratio, size and current assets turnover whilst indicating significant negative correlation between PROF and receivable days. Other findings showing positive relationship between working capital and operating profit include (Valipour et al., 2012b; Rimo and Panbunyuen, 2010).
It is envisaged, considering prior empirical studies, and theory, that a profitable company would have an effective WCM plan which is expected to result in shorter CCC. The hypothesis is therefore formulated as:
H2. Profitability is negatively related to cash conversion cycle. Operating Cash Flow (CF)
Cash flows from operation exhibits a company’s capability to generate cash, and also its policies on management of cash, inventories, accounts receivable and accounts payable. Managing these enable the firm to have enough available cash for its transactional, speculative and operational purposes. Few studies have been carried out to examine the relationship between WCM and CF. Valipour et al. (2012a) assess the relationship between company characteristics and CCC for which the outcome shows that CF affects the company’s WCM. Also, regression results from the study by Naser et al. (2013) indicate that the operating cash flow to total assets is negatively connected with the dependent variable. The findings of Mun and Jang (2015) report cash level as an important element of a firm’s efficiency in managing its working capital. Their study finds an existence of interactive effects among working capital, cash levels and profitability, advising managers of firms to look attentively at the above roles when developing strategies for efficient WCM.
A research which examines capital and liquidity ratios and financial distress across European banking industry report that, though quite a number of the banks have been able to meet the capital required to carry out banking operations, yet they have encountered challenges as a result of their inability to handle and control the availability of high quality liquid assets well enough (Chiaramonte and Casu, 2017). It is evidently clear that the cash generation capacity of a firm usually would stem from well managed working capital. Excess cash flow from operating activities will eventually result to shorter CCC which is healthy for the company. Therefore, hypothesis 3 is formulated as:

INTERNATIONAL JOURNAL OF ACADEMIC RESEARCH IN ACCOUNTING, FINANCE AND
MANAGEMENT SCIENCES
Vol. 1 1 , No. 3, 2021, E-ISSN: 2225-8329 © 2021 HRMARS
561
H3. Operating cash flow is negatively related to cash conversion cycle Sales Growth (GROWTH)
Growth in sales is the percentage change in sales of the current year and the previous year. Deloof (2003) gives the computation as this year’s sales (current) minus previous year’s sales of which the outcome is divided by previous year’s sales. For CCC to decrease, growth in sales has to be achieved. Some studies find a negative relationship between GROWTH and CCC concluding that GROWTH is achieved when the CCC is reduced (Naser et al., 2013; Valipour et al., 2012a; Rimo and Panbunyuen, 2010). Valipour et al (2012a) find that companies with a higher percentage of sales tend to pay more attention to WCM as these companies would extend the payment period to attract customers in order that sales could be increased, thus, increasing profitability. Jang and Park (2011) examine inter-relationship between firm growth and PROF and they conclude that previous year’s profitability impacts positively on the growth rate of the current year’s. But, the researchers find the current and previous years’ growth rates to have negative effect on current year’s profitability with explanation that, the sampled industry’s profit creates growth. However, growth delays profitability. Niklas and Viktor (2014) examine the connection between WCM and growth of revenue in 36 Swedish firms within the IT and telecom, wholesale, and manufacturing industries and find that an increase in revenue generation is not a guarantee for an increase in net working capital. Regasa (2015)’s study then concludes that infrastructural development, getting access to market, and competition all determine business growth positively whereas interest rate level negatively affects the growth of business
Lee (2014) however finds a positive significant relationship between sales and CCC. The author further finds that the relationship between firm growth and profit is greatly affected by institutional environment, and that there exist a positive impact of growth on profit in old firms but not in young firms.
With a high sales growth, a firm’s working capital is expected to go high. A reflection of effective and efficient WCM is an increased sales growth eventually leading to reduction in CCC. Therefore, hypothesis 4 is formulated as:
H4. Sales growth is negatively related to cash conversion cycle. Current Ratio (CR)
A handful of studies have been conducted to assess the impact of current ratio, as a firm attribute, on WCM. Current ratio is calculated as Current Assets divided by Current Liabilities. The ratio measures a company’s ability to meet its financial obligations as they fall due. It is good to maintain the ratio above 1 to ensure that current assets are always available to meet obligations whenever they fall due but ensuring the ratio does not go too high. Results from phase 1 of the study by Valipour et al. (2012a) show there is no significant correlation between CCC and current ratio. Nonetheless, regression results from the study by Rimo and Panbunyuen (2010) show a positive but insignificant relationship between current ratio and CCC just as Zalaghi et al. (2019) report a positive significant relation between current ratio and CCC.
The expectation is that, when current ratio is high, it signifies better liquidity for the firm and thus, the CCC is shortened indicating a better managed working capital. Hypothesis 5 is therefore formulated as:
H5. Current ratio is negatively related to cash conversion cycle.

INTERNATIONAL JOURNAL OF ACADEMIC RESEARCH IN ACCOUNTING, FINANCE AND
MANAGEMENT SCIENCES
Vol. 1 1 , No. 3, 2021, E-ISSN: 2225-8329 © 2021 HRMARS
562
Quick Ratio (QR) Quick ratio is the same as current ratio, except that inventory is not part of the total current asset
value. Rimo and Panbunyuen (2010) also share the same view on this. Though the general rule is to get the ratio close to 1, the average value of the sector to which the firm belongs is more acceptable in practice. Results of Rimo and Panbunyuen (2010) show no significant relationship between QR and CCC. The study by Valipour et al. (2012a) suggests there is no significant connection between CCC and QR. Nevertheless, their results from the second phase show a significant negative correlation between QR and CCC. Hypothesis 6 is formulated as:
H6. Quick ratio is negatively related to cash conversion cycle. Debt Ratio (DR)
The definition or meaning of debt ratio on which this study is based, is the definition used by Rimo and Panbunyuen (2010) and Alipour (2011). They define DR to mean Total Debts or Total Liabilities divided by Total Assets. A higher ratio simply means the firm is financing its business operations by the use of external sources because its own internal sources are either unavailable or very limited. Investigating the correlation between WCM components and performance of firms using dynamic panel data analysis from a sample of 75 manufacturing firms listed on Istanbul Stock Exchange, Vural et al. (2012) find a significant negative connection between leverage as a control variable, and firm value as well as profitability of the sampled firms, meaning any increase in the level of debt or leverage will cause a decline in both profitability and value of the firm. Other studies record a positive relationship between DR and CCC Naser et al (2013); Valipour et al (2012a; Rimo and Panbunyuen, 2010). Their results mean that firms that have low DR would often have shorter CCC. On the other hand, high leverage firms are not able to generate adequate funds internally and therefore they resort to funding their activities through external sources thereby leading to a rise in the CCC. Hypothesis 7 is formulated as:
Hypothesis 7. Debt ratio is positively related to cash conversion cycle. Methodology Research Approach and Data Collection
This study used quantitative research approach, and data retrieved for the research were gathered from the annual financial reports of the selected companies for the period of 2005 to 2013 downloaded from the Ghana Stock Exchange (GSE) and Annual Reports Ghana websites. Sample Selection
The target population for the research comprised listed companies on the GSE. The size of the sample was determined based on the extent to which the companies’ financial information were available. At the time this study was conducted, 35 companies were listed and they were grouped by the Stock Exchange on sectorial bases as follows: Financials (insurance, banking, investment, etc.) –12, Oil and Gas–3, Consumer Goods and Services –12, Healthcare–2, Basic Materials–3, Industrials –2, and Technology–1. Out of these, 13 companies satisfied the selection criteria on the basis that, only those companies’ financial statements (non-financial companies) have been published and publicly available on the GSE and Annual Reports Ghana websites for the period under investigation. For the fact that some of the companies’ financial statements of 2013 and 2014 have not been published as of the start of this research in 2016, only the 13 non-financial companies whose financial statements have been published from 2005 to 2013 were selected. Companies in the financial sector were not included in the study due to the fact that they have differing financial characteristics and differing WCM strategies. This is in line with previous studies including Rimo and Panbunyuen (2010),

INTERNATIONAL JOURNAL OF ACADEMIC RESEARCH IN ACCOUNTING, FINANCE AND
MANAGEMENT SCIENCES
Vol. 1 1 , No. 3, 2021, E-ISSN: 2225-8329 © 2021 HRMARS
563
Karaduman et al. (2010), Akoto et al. (2013), Agyeman and Asiedu (2013), Naser et al. (2013), and Anton and Anca (2021). Processing and Analysis of Data
A pooled panel data analysis of cross-sectional company and time series data were combined into one column to enable the analysis of how CCC relate to each of the seven (7) company characteristics, and also the interrelationship amongst the company characteristics in the sampled firms. SPSS version 22 was used in getting the needed results. The statistical tools employed in testing the hypothesis included descriptive statistics, correlation and regression and this is consistent with Akoto et al. 2013; Naser et al. 2013; Valipour et al. 2012a; Baveld, 2012 and Rimo and Panbunyuen, 2010 among others. Research Variables and Model Specification
This study’s model has CCC as the dependent variable, whilst Company Size, Operating Profit, Operating Cash Flow, Sales Growth, Current Ratio, Quick Ratio and Debt Ratio are the independent variables. Consequently, the relation between company characteristics and WCM, represented by CCC, is formulated and estimated by the adoption and use of linear regression model below which is consistent with Rimo and Panbunyuen (2010), Sharma and Kumar (2011), Baveld, (2012), Agyeman and Asiedu (2013), Akoto et al. (2013), Naser et al. (2013), Nwagaeko (2014) and Kale and Chobe (2016) that also adopted it. CCC= a0 + a1SIZE + a2PROFIT + a3CF + a4GROWTH + a5CR + a6QR + a7DR + e Whereas: CCC = Cash Conversion Cycle = Average number of days Inventory + Average number of
days Accounts Receivable – Average number of days Accounts Payable SIZE = Size measured by Total Assets =Natural Logarithm of Total Assets PROFIT = Operating Profit measured by Return on Asset =Earnings before Interest and Tax /
Total Assets CF = Operating Cash Flows = Cash Flow from Operating Activities / Total Assets GROWTH = Sales Growth = (Current year’s sales – Previous year’s sales) x Previous year’s sales CR = Current Ratio = Current Assets / Current Liabilities QR = Quick Ratio = (Current Assets – Inventories) / Current Liabilities DR = Debt Ratio = Total Liabilities / Total Assets a0 = the interception of the regression line e = Error term / Disturbance a1 - a7 = Parameters of the model. Results Descriptive Statistics
Table 1 presents the descriptive statistics of the dependent and independent variables used in the study. The table gives the mean value for the CCC as 16.921 days with the minimum (min.) and maximum (max.) values of -351.184 days and 464.395 days respectively. This implies that firms averagely take 16.921 days to turn their locked up capital into cash, with -351.184 days and 464.395 days as minimum and maximum respectively for the same purpose. A minimum value of -351.184 days means that averagely, customers pay for products 351.184 days in advance. This may seem absurd but is not different from previous studies on firms listed on GSE (Addae and Nyarko-Baasi, 2013: Min. -51.883 days and Max. 493.335 days; Mawutor, 2014: Min. -8 days and Max. 115 days ) as well as other researches (Deloof, 2003: Min. -155.74 days and Max. 515.25 days; Alipour, 2011: Min. -720.49 days and Max. 1005.05 days; Bratland and Hornbrinck, 2013: Min. -367.454 days and Max. 403.361 days;

INTERNATIONAL JOURNAL OF ACADEMIC RESEARCH IN ACCOUNTING, FINANCE AND
MANAGEMENT SCIENCES
Vol. 1 1 , No. 3, 2021, E-ISSN: 2225-8329 © 2021 HRMARS
564
Naser et al., 2013: Min. -326 days and Max. 301 days). This study’s negative value is mostly influenced by the oil and gas sector which recorded -102.23 days. This sector pays its customers 169.9575 days on average, (the longest period), (see Appendix B), thereby shortening the CCC into a negative value.
The averages of numbers of days inventory (INV), accounts receivable (AR) and accounts payable (AP) that constitute the CCC have average (mean) values of 82.519 days, 42.438 days and 108.035 days respectively. Each of the three components have 0.000 days as minimum values while having 320.047 days, 464.395 days and 485.902 days as maximum values in that order. Thus, firms take 82.519 days to sell their inventories. Also, companies receive payments from customers in 42.438 days, being influenced largely by the health care sector (72.1337 days) (see Appendix A), whilst averagely settling creditors in 108.035 days. The payable days is largely influenced by the oil and gas sector (169.9575 days) and consumer goods and services sector (108.6898 days) (see Appendices B and C).
It could be deduced from the table (1) that average PROF of firms, measured by ROA, is 9.34% with -95.4% and 39.9% as minimum and maximum values respectively. A 9.34% is quite on a low side, however, it is almost the same as in Bratland and Hornbrinck (2013) of 9.33% in Swedish firms. However, Kusuma and Bachtiar (2018) report 15.30% in Indonesian firms, nearly doubling this study’s.
An average of 0.090 is recorded of operating cash flow, with -2.107 as minimum value and 0.919 as maximum and a standard deviation of 0.252.
Regarding SIZE, the table (1) shows an average of 18.057 with standard deviation of 3.286 whilst having a minimum and maximum values of 0.000 and 23.955 respectively.
Averagely, the firms have seen their sales grow by 19.5% per annum with a minimum of -24.20% and a maximum of 111.40%.
Both the CR and QR have their mean values quite close to each other with 1.604 and 1.006 respectively. The difference between the two values is inventory, suggesting that there is no such negative effect of inventory on CR. The two ratios have minimum values of 0.000 each with 9.015 and 7.254 as their maximum values respectively.
The debt ratio averaged 0.5241 implying that the companies have more assets than liabilities. It records 0.000 as minimum value and 4.044 as maximum. It is laudable as the firms are maintaining the ratio below 1 meaning that the assets always exceed liabilities in order that obligations could be met with those assets when they are due for settlement.
Table 1: Descriptive Statistics of the Variables
Variable
Minimum
Maximum Sum Mean
Std. Deviation
Variation Skewness Kurtosis
Statistic Statistic Statistic Statisti
c Statistic Statistic Statistic Std.
Error Statisti
c Std.
Error
C -351.184 464.394
1979.784
16.921 116.111 13481.7
56 .231 .224 3.275 .444
INV. .000 320.047
9654.698
82.519 71.939 5175.27
0 1.468 .224 2.004 .444
AP .000 464.395
4965.217
42.438 52.282 2733.43
0 5.013 .224 36.621 .444
AP .000 485.902
12640.131
108.035
101.141 10229.4
06 1.610 .224 2.875 .444
PROF. -.954 .399 10.924 .0934 .155 .024 -2.651 .224 17.327 .444
CF -2.107 .919 10.537 .0901 .252 .063 -5.469 .224 50.858 .444
SIZE .000 23.955
2112.664
18.057 3.286 10.798 -1.405 .224 7.497 .444

INTERNATIONAL JOURNAL OF ACADEMIC RESEARCH IN ACCOUNTING, FINANCE AND
MANAGEMENT SCIENCES
Vol. 1 1 , No. 3, 2021, E-ISSN: 2225-8329 © 2021 HRMARS
565
GROWTH
-.242 1.114 22.827 .195 .248 .062 1.154 .224 2.489 .444
CR .000 9.015 187.669 1.604 1.512 2.287 2.942 .224 9.522 .444
QR .000 7.254 117.716 1.006 1.126 1.269 3.328 .224 12.932 .444
DR .000 4.044 61.320 .5241 .394 .155 6.140 .224 54.986 .444
Valid N (Listwis
e) 117
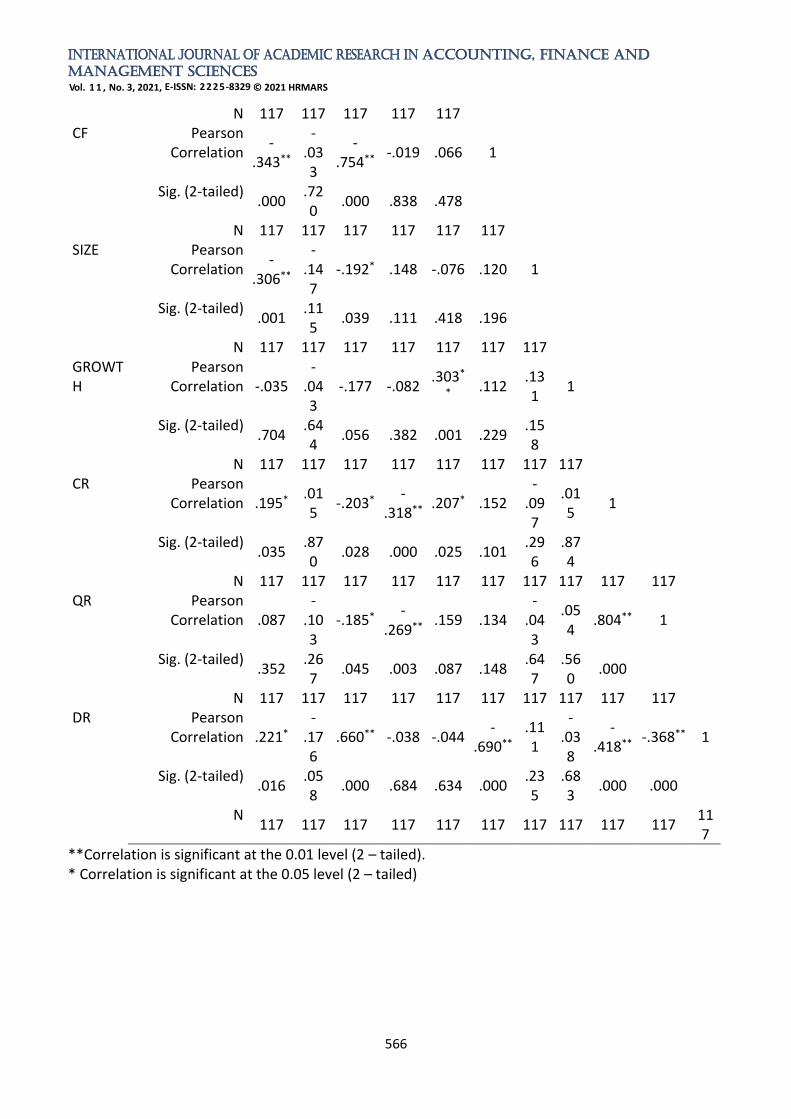
Correlation Analysis Table 2 shows correlation analysis for all the variables by the help of Pearson’s Correlation Matrix.
Correlation at a high level may allude to a collinearity problem. Multicollinearity occurs when there is high level of relation among some or all the independent variables and it is not clear the one that is impacting the dependent variable. Correlation matrix therefore shows any presence of multicollinearity in the data. Relationship between CCC and the Independent Variables
Results of the correlation analysis show that CCC has strong negative relation with operating cash flow (CF) (-0.343) and SIZE (-0.306) at 0.01 significant level, whilst correlating positively with current ratio (CR) (0.195) and debt ratio (DR) (0.221) at 0.05 significant level. This result is similar to that of Zalaghi et al. (2019) who find SIZE correlating negatively with CCC whilst having positive correlation between CR and CCC at 0.01 significant level.
Table 2: Pearson’s Correlation Matrix for all the Variables
Variables CCC INV. AR AP PRO
F CF SIZE GROWTH CR QR DR
CCC Pearson Correlation
1
Sig. (2-tailed) N 117
INV. Pearson Correlation
.527** 1
Sig. (2-tailed) .000 N 117 117
AR Pearson Correlation
.308** .183*
1
Sig. (2-tailed) .001
.048
N 117 117 117 AP Pearson
Correlation -
.614** .201*
.294** 1
Sig. (2-tailed) .000
.030
.001
N 117 117 117 117 PROF. Pearson
Correlation .150
.045
-.052 -.167 1
Sig. (2-tailed) .107
.628
.577 .072
INTERNATIONAL JOURNAL OF ACADEMIC RESEARCH IN ACCOUNTING, FINANCE AND
MANAGEMENT SCIENCES
Vol. 1 1 , No. 3, 2021, E-ISSN: 2225-8329 © 2021 HRMARS
566
N 117 117 117 117 117 CF Pearson
Correlation -
.343**
-.033
-.754**
-.019 .066 1
Sig. (2-tailed) .000
.720
.000 .838 .478
N 117 117 117 117 117 117 SIZE Pearson
Correlation -
.306**
-.147
-.192* .148 -.076 .120 1
Sig. (2-tailed) .001
.115
.039 .111 .418 .196
N 117 117 117 117 117 117 117 GROWTH
Pearson Correlation -.035
-.043
-.177 -.082 .303*
* .112
.131
1
Sig. (2-tailed) .704
.644
.056 .382 .001 .229 .158
N 117 117 117 117 117 117 117 117 CR Pearson
Correlation .195* .015
-.203* -
.318** .207* .152
-.097
.015
1
Sig. (2-tailed) .035
.870
.028 .000 .025 .101 .296
.874
N 117 117 117 117 117 117 117 117 117 117 QR Pearson
Correlation .087 -
.103
-.185* -
.269** .159 .134
-.043
.054
.804** 1
Sig. (2-tailed) .352
.267
.045 .003 .087 .148 .647
.560
.000
N 117 117 117 117 117 117 117 117 117 117 DR Pearson
Correlation .221* -
.176
.660** -.038 -.044 -
.690** .111
-.038
-.418**
-.368** 1
Sig. (2-tailed) .016
.058
.000 .684 .634 .000 .235
.683
.000 .000
N 117 117 117 117 117 117 117 117 117 117
117
**Correlation is significant at the 0.01 level (2 – tailed). * Correlation is significant at the 0.05 level (2 – tailed)

INTERNATIONAL JOURNAL OF ACADEMIC RESEARCH IN ACCOUNTING, FINANCE AND
MANAGEMENT SCIENCES
Vol. 1 1 , No. 3, 2021, E-ISSN: 2225-8329 © 2021 HRMARS
567
Relationship between Components of CCC and the Independent Variables AR has a strong negative relation with cash flow (r = -0.754), but has a strong positive relation
with debt ratio (r = 0.660) at 0.01 significant level. Results further show that AR has weak relationships with size (r = -0.192), current ratio (r = -0.203) and quick ratio (r = -0.185) at 0.05 significant level. AP has a negative and significant relationships with CR (r = -0.318) and QR (r = -0.269). The inventory days (INV) nonetheless has no relation with any factor. Interrelationships amongst the Independent Variables
It could be observed from Table 2 that there exists multi correlation among the variables which is a necessary condition for performing principal component analysis. The highest correlation obtained is a strong positive relation (r = 0.804, p<0.01) between Quick Ratio (QR) and Current Ratio (CR) indicating high ability of an increase or decrease in one to influence a corresponding increase or decrease in the other, thus, suggesting a multicollinearity problem. Some strong negative relationship has also been observed between Cash Flow and DR (-0.690, p<0.01) indicating an upward movement in the value of one that results in downward movement of the other. Profitability (ROA) has positive and significant correlation with Sales Growth (r =0.303, p<0.01) and CR (r =0.207, p<0.05). CR is observed to have established a negative and significant relationship with DR (r= -0.418, p<0.01) whilst QR records a significant negative relation with DR (-0.368, p<0.01).
3.1.1. Principal Components Analysis The principal components analysis regroups variables into a more useful form. This is normally
done when almost all the variables have not met the normality rule. Principal components analysis therefore helps to identify variables that are more significant in the analysis. Table 3: KMO and Bartlett’s Test
From table 3 above, it could be seen that the KMO value is 0.534 which indicates that the test is meritoriously adequate for factoring. This suggests appropriateness of factor analysis and the correlation matrix is appropriate for factoring. KMO varies between 0 and 1 and a value close to 1 means small partial correlation coefficients whereas a value close to 0 portrays the presence of weak correlation between variables and therefore factor analysis could not be possible. Regrouping of Variables using Eigen-Value-Greater-Than-One Rule
The correlation matrix also seeks to suggest some form of grouping of the variables in turn leading to a possible prediction of the number of factors that can be expected. The criterion for determining the number of components adequate for explaining the variations in the data is the eigen-value-greater-than-one rule. Values greater than one are considered, whilst values less than one are ignored as such values mean the score on the component would have negative reliability.
Table 4: Total Variance Explained
Measure Value
Kaiser-Meyer-Olkin Measure of Sampling Adequacy. .534 Bartlett's Test of Sphericity Approx. Chi-Square 251.099
df 21 Sig. .000
Components Total % of Variance Cumulative %
1 10.836 73.924 73.924 2 3.239 22.095 96.019
INTERNATIONAL JOURNAL OF ACADEMIC RESEARCH IN ACCOUNTING, FINANCE AND
MANAGEMENT SCIENCES
Vol. 1 1 , No. 3, 2021, E-ISSN: 2225-8329 © 2021 HRMARS
568
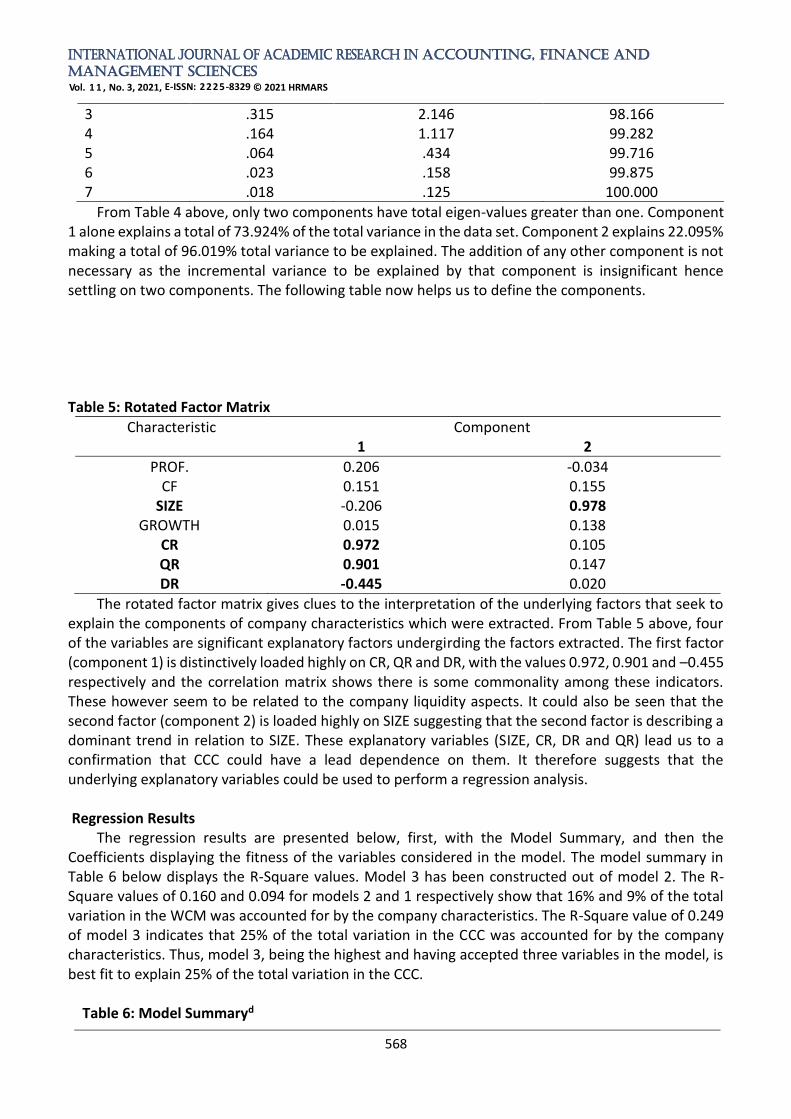
From Table 4 above, only two components have total eigen-values greater than one. Component 1 alone explains a total of 73.924% of the total variance in the data set. Component 2 explains 22.095% making a total of 96.019% total variance to be explained. The addition of any other component is not necessary as the incremental variance to be explained by that component is insignificant hence settling on two components. The following table now helps us to define the components. Table 5: Rotated Factor Matrix
Characteristic Component 1 2
PROF. 0.206 -0.034 CF 0.151 0.155
SIZE -0.206 0.978 GROWTH 0.015 0.138
CR 0.972 0.105 QR 0.901 0.147 DR -0.445 0.020
The rotated factor matrix gives clues to the interpretation of the underlying factors that seek to explain the components of company characteristics which were extracted. From Table 5 above, four of the variables are significant explanatory factors undergirding the factors extracted. The first factor (component 1) is distinctively loaded highly on CR, QR and DR, with the values 0.972, 0.901 and –0.455 respectively and the correlation matrix shows there is some commonality among these indicators. These however seem to be related to the company liquidity aspects. It could also be seen that the second factor (component 2) is loaded highly on SIZE suggesting that the second factor is describing a dominant trend in relation to SIZE. These explanatory variables (SIZE, CR, DR and QR) lead us to a confirmation that CCC could have a lead dependence on them. It therefore suggests that the underlying explanatory variables could be used to perform a regression analysis. Regression Results
The regression results are presented below, first, with the Model Summary, and then the Coefficients displaying the fitness of the variables considered in the model. The model summary in Table 6 below displays the R-Square values. Model 3 has been constructed out of model 2. The R-Square values of 0.160 and 0.094 for models 2 and 1 respectively show that 16% and 9% of the total variation in the WCM was accounted for by the company characteristics. The R-Square value of 0.249 of model 3 indicates that 25% of the total variation in the CCC was accounted for by the company characteristics. Thus, model 3, being the highest and having accepted three variables in the model, is best fit to explain 25% of the total variation in the CCC.
Table 6: Model Summaryd
3 .315 2.146 98.166 4 .164 1.117 99.282 5 .064 .434 99.716 6 .023 .158 99.875 7 .018 .125 100.000

INTERNATIONAL JOURNAL OF ACADEMIC RESEARCH IN ACCOUNTING, FINANCE AND
MANAGEMENT SCIENCES
Vol. 1 1 , No. 3, 2021, E-ISSN: 2225-8329 © 2021 HRMARS
569
Model R R Square
Adjusted R Square
Std. Error of the Estimate
Durbin-Watson
1 .306a .094 .086 111.0214669 2 .400b .160 .145 107.3718492 3 .499c .249 .229 101.9804402 .616
a. Predictors: (Constant), SIZE : b. Predictors: (Constant), SIZE, DR : c. Predictors: (Constant), SIZE, DR, CR: d. Dependent Variable: CCC
Table 7 displays the coefficients of the variables considered fit into the models. In model 1, SIZE was the only variable accepted as good to fit into the model whilst SIZE and DR were accepted in model 2. In model 3, out of the four variables (QR, CR, DR and SIZE) that factor analysis (Table 5) pointed up as adequate to be used in explaining Cash Conversion Cycle, SIZE, DR and CR were accepted as good enough to fit into the model.
Table 7: Coefficientsa
Model Unstandardized Coefficients
Standardized Coefficients
t Sig.
B Std. Error Beta
1 (Constant)
212.150 57.566 3.685 .000
SIZE -10.812 3.137 -.306 -3.447 .001 2
(Constant) 190.494 56.142 3.393 .001
SIZE -11.823 3.053 -.335 -3.873 .000 DR 76.161 25.457 .258 2.992 .003
3 (Constant)
118.202 56.870 2.078 .040
SIZE -11.223 2.904 -.318 -3.865 .000 DR 116.152 26.537 .394 4.377 .000 CR 25.247 6.904 .329 3.657 .000
a. Dependent Variable: CCC
SIZE could be seen to have displayed significantly negative correlation with CCC in all the three models. The implication is that, as SIZE increases, there is a corresponding decrease in the CCC and vice versa thereby demonstrating efficiency in WCM. Therefore, Hypothesis 1 which states that Company Size is negatively related to CCC is confirmed and accepted.
In model 2, Debt Ratio has a positive relationship with CCC with 0.003 significant value. The positive DR implies that, as DR decreases, CCC also decreases and vice versa. In model 3, both DR and CR register positive and significant relationships with CCC. Hypothesis 5 suggests a negative relationship between CR and CCC. The regression result however finds the presence of a positive and significant relation between the two variables. Consequently, hypothesis 5 is rejected and the null hypothesis accepted.
Hypothesis 7 suggests the Debt Ratio to have positive relationship with CCC. The regression result indicates a significant positive connection between Debt Ratio and CCC and as such, the hypothesis is confirmed and thus accepted.
INTERNATIONAL JOURNAL OF ACADEMIC RESEARCH IN ACCOUNTING, FINANCE AND
MANAGEMENT SCIENCES
Vol. 1 1 , No. 3, 2021, E-ISSN: 2225-8329 © 2021 HRMARS
570
The constant figure of 118.202 in model 3 reveals the minimum of CCC when other variables are absent. In the model, all the variables have 0.000 significant values thus, indicating that the model has gotten to a statistically significant level hence the inclusion of the three variables in the model.
For purposes of analysing the impact the independent variables have on the CCC, the Standardized Beta Coefficients have been used since the B Coefficients have varying scales. This agrees with Rimo and Panbunyuen (2010) amongst others. It could be studied from model 3 (Table 7) that, SIZE, DR and CR are all significant statistically at 0.000 significant level in predicting the CCC, with the highest contributor being Debt Ratio (R= 0.394), thus, providing the most salient information. Regression results therefore suggest the three independent variables are the most significant contributors in the prediction of the CCC.
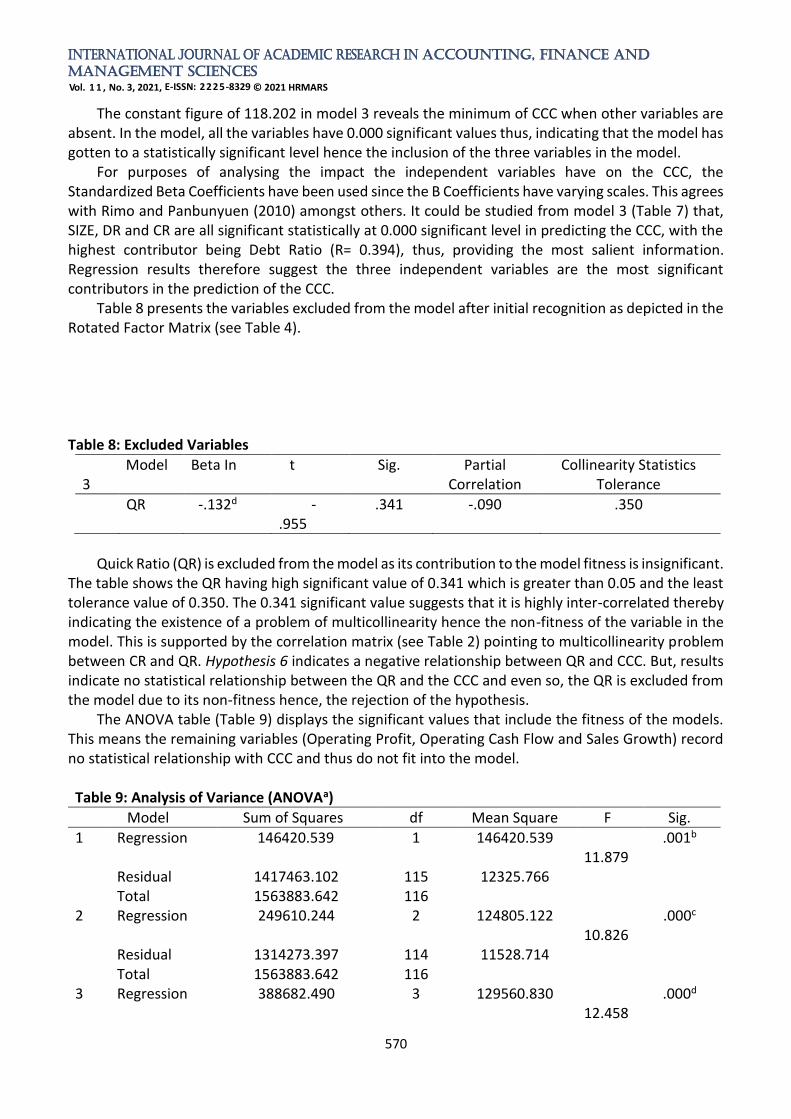
Table 8 presents the variables excluded from the model after initial recognition as depicted in the Rotated Factor Matrix (see Table 4).
Table 8: Excluded Variables
Model 3
Beta In t Sig. Partial Correlation
Collinearity Statistics Tolerance
QR -.132d -.955
.341 -.090 .350
Quick Ratio (QR) is excluded from the model as its contribution to the model fitness is insignificant.
The table shows the QR having high significant value of 0.341 which is greater than 0.05 and the least tolerance value of 0.350. The 0.341 significant value suggests that it is highly inter-correlated thereby indicating the existence of a problem of multicollinearity hence the non-fitness of the variable in the model. This is supported by the correlation matrix (see Table 2) pointing to multicollinearity problem between CR and QR. Hypothesis 6 indicates a negative relationship between QR and CCC. But, results indicate no statistical relationship between the QR and the CCC and even so, the QR is excluded from the model due to its non-fitness hence, the rejection of the hypothesis.
The ANOVA table (Table 9) displays the significant values that include the fitness of the models. This means the remaining variables (Operating Profit, Operating Cash Flow and Sales Growth) record no statistical relationship with CCC and thus do not fit into the model.
Table 9: Analysis of Variance (ANOVAa)
Model Sum of Squares df Mean Square F Sig.
1 Regression 146420.539 1 146420.539 11.879
.001b
Residual 1417463.102 115 12325.766 Total 1563883.642 116
2 Regression 249610.244 2 124805.122 10.826
.000c
Residual 1314273.397 114 11528.714 Total 1563883.642 116
3 Regression 388682.490 3 129560.830 12.458
.000d

INTERNATIONAL JOURNAL OF ACADEMIC RESEARCH IN ACCOUNTING, FINANCE AND
MANAGEMENT SCIENCES
Vol. 1 1 , No. 3, 2021, E-ISSN: 2225-8329 © 2021 HRMARS
571
Residual 1175201.152 113 10400.010 Total 1563883.642 116
a. Dependent Variable: CCC; b. Predictors: (Constant), SIZE; c. Predictors: (Constant), SIZE, DR; d. Predictors: (Constant), SIZE, DR, CR
Therefore, Hypotheses 2, 3 and 4 that suggest the existence of negative relationship between CCC and Operating Profit, Operating Cash Flow and Sales Growth respectively are rejected.
To sum up, the entire hypotheses (H1, H5, H7) have 0.000 significant values. These outcomes from the regression analysis confirm the existence of relation between Company Size, Current Ratio, Debt Ratio and Working Capital Management, measured by Cash Conversion Cycle. Thus, these variables best predict the Working Capital Management in this study.
Discussion of Results Cash Conversion Cycle (CCC)
Results from the study show average CCC of firms as 16.921 days. The average number of days inventory (INV), from the time inventories are purchased to the time they are sold, is 82.519 days. The average period the companies take to collect cash from their customers (AR) is 42.438 days and average time taken to settle suppliers (AP) is 108.035 days.
Short periods of -276.99 days, 1.52 days, 2.194 days and 19.79 days reported in previous studies are found by Mengesha (2014), Addae and Nyarko-Baasi (2013), Al-Shubiri and Aburumman (2013) and Kusuma and Bachtiar (2018) in Ethiopian, Ghanaian, Jordanian and Indonesian companies respectively, while Belgian, United Arab Emirates (UAE), Pakistani, Swedish, Italian and Iranian firms record longer periods of 44.48 days, 55.27 days, 65.53 days, 75.38 days, 79.35 days, and 189.77 days respectively (Deloof, 2003; Naser et al., 2013; Bhutto, Abbas, ur Rehman, & Shah, 2011; Rimo and Panbunyuen, 2010; Muscettola, 2014; Valipour et al., 2012a). Indian firms record the longest period of 450 days on average (Sharma and Kumar, 2011). Akomea and Frimpong (2019), Mawutor (2014) and Akoto et al., 2013 report higher results (48.186 days, 24.96 days and 112 days respectively) relating to listed firms on GSE than this study’s. It could be concluded that the outcome of this study falls in line with what the study and theory expect, thus, having a short cycle which is healthy for the firms.
A negative CCC implies that firms generally receive payment in advance from their customers for products and services before production takes place as in the study of Mengasha (2014) where -276.99 days was recorded in Ethiopian companies. In that regard, firms do not need to fund inventories and payables with their own capital but would use the moneys received from their customers. Panigrahi and Chaudhury (2015), and Soyemi and Olawale (2014) laud a situation like this and they advise firms to strive to achieve a negative cycle. This is however not the case with regards to this study as it finds a positive short cycle.
With regards to the CCC components, 82.519 days of inventory period is recorded. Usually, when the inventory storage time is long it depicts there is greater investment in inventories but the shorter the period, the lower will be the firm’s inventory holding cost. This is best for the firm as it shortens the CCC and in the end increases profitability. Though better than in the study by Akoto et al., 2013 [123.68 days], 82.52 days inventory period in the current study is quite on the high side compared to previous studies (Mawutor, 2014: 79.33 days; Addae and Nyarko-Baasi, 2013: 34.359 days; Rimo and Panbunyuen 2010: 79.33 days; Deloof, 2003: 46.62 days). The period is largely influenced by that of the healthcare sector (233.95 days) as in Appendix A. Therefore, it could be concluded that quite a long inventory period of 82.52 days was recorded due to the varying nature of the business operations of the companies involved in this study stemming from the nature of their inventories. Though longer than in the studies by Addae and Nyarko-Baasi (2013) of non-listed firms (12.182 days), and Akoto et

INTERNATIONAL JOURNAL OF ACADEMIC RESEARCH IN ACCOUNTING, FINANCE AND
MANAGEMENT SCIENCES
Vol. 1 1 , No. 3, 2021, E-ISSN: 2225-8329 © 2021 HRMARS
572
al. (2013) of listed firms (30 days), the 42.438 days receivable period (AR) in this study would have been quite shorter than 30 days had it not been the 72.134 days period from the healthcare sector, the longest among the sectors (see Appendix A). The result is however within acceptable limits. After all, it is shorter than in other researches (Mawutor, 2014: 45.25 days; Rimo and Panbunyuen, 2010: 53.85 days Deloof, 2003: 54.64 days). The accounts payable days (AP) of 108.035 days is quite a lengthy period compared to previous studies (Deloof, 2003: 56.77 days; Rimo and Panbunyuen, 2010: 57.90 days; Akoto et al., 2013: 41.68 days; Mawutor, 2014: 68.32 days and Kusuma and Bachtiar, 2018: 96.56 days). That comes about as a result of the longer periods recorded in the oil and gas sector (169.9575 days) and consumer goods and services sector (108.6898 day).
The difference between receivable days (42.438 days) and payable days (108.035 days) is 65.597 days, meaning after collecting moneys from customers, it takes firms additional 65.597 days on average to pay their creditors, almost the same as in Kusuma and Bachtiar (2018) which records 64.43 days difference. This is higher than the 27 days difference in Akomea and Frimpong, (2019)’s study. Paying quite late is a source of free and cheap capital whereby those moneys are injected back into the business operations for 65. 597 more days, which generates more profit, and the result of this study is quite acceptable in that regard. Nonetheless, delayed payments are associated with costs and the company has to weigh the costs and benefits in delaying these payments.
The study of the relation between WCM and profitability of Banks in Ghana by Agyei and Yeboah (2011) presents an empirical backing for excluding financial firms from this current study. Their study finds an average CCC of -6524.6 days on a 365-day cycle, equivalent to about eighteen (18) years as average total debts accounted for about 88% of total assets. Similar study by Yeboah and Yeboah (2014) records an average CCC of -4914.02 days with standard deviation of 18231.46 days. These results buttress the point that most financial sector firms are highly levered. And since the CCC would have represented the average of financial and non-financial firms [in the case where the financial sector forms part of the study], including the financial sector in the study would distort the outcome of the study and render it biased. Company Characteristics Company Size (SIZE)
Both the regression and correlation results from the study indicate a negative and statistically significant correlation between SIZE and CCC signifying that firms of large sizes have shorter CCC. The outcome means that, an increase or a decrease in SIZE would have a decreasing or an increasing effect on CCC in that order. In this wise, the larger the Size the shorter the CCC becomes as large firms can negotiate for better trading conditions with their suppliers such as to bargain for discounts and longer payment terms. The result agrees with Rimo and Panbunyuen, 2010; Valipour et al., 2012; Manoori and Muhammad, 2012; Attari and Zara, 2012; Naser et al., 2013; Azeem and Marsap, 2015). A positive relationship between CCC and SIZE has been reported in some studies as they opine that large firms rake in huge returns and this increases the CCC (Lotfinia et al., 2012; Addae and Nyarko-Baasi, 2013; Akoto et al., 2013; Anton and Anca., 2021). The result of the current study meets the theoretical expectation and agrees with many prior studies.
A further explanation to the outcome of this study as regards Size is that when a firm is large, the prices of its products are low due to economies of scale from large productions, and economies of scope (as it is capable of offering more than one product most often). Its customer base is also large and as a result could dictate how quick customers pay for products given them (Receivables). Also, due to low prices of its products, the company does not keep inventories for long as their products are patronised more often thereby cutting down on storage costs and tied up capital in inventories (Inventories). More importantly, Size could enable the firm buy raw materials from its suppliers in very

INTERNATIONAL JOURNAL OF ACADEMIC RESEARCH IN ACCOUNTING, FINANCE AND
MANAGEMENT SCIENCES
Vol. 1 1 , No. 3, 2021, E-ISSN: 2225-8329 © 2021 HRMARS
573
large quantities at lower prices and since the company becomes a large and key customer to the supplier, the company could negotiate for flexible payment terms. This makes the firm delay in paying for supplies made to it (Payables). All these shorten the CCC indicating efficient and effective management of working capital.
With regards to components of CCC, results show a positive and significant correlation between inventory days and SIZE. This shows that large companies keep high levels of inventory so that at any point in time there would be materials for production to meet customers’ demands. By meeting production deadlines, finished products are always available to meet the orders of their customers without stock outs thereby avoiding stock out related costs. The study’s result further indicates a positive and significant relation between SIZE and Receivable Days (AR). This means that as SIZE increases, AR also increases. Thus, large firms are able to produce large volumes of products at lower prices due to economies of scale as stated earlier. This enables them to sell their products to customers at reduced prices compared to smaller firms. Coupled with reliability from their customers, they are able to increase their customer base (receivables) since customers rely on the firm at all times. Ultimately, the firm’s profitability is increased resulting from shortened CCC.
Results further show strong positive and significant correlation between Payable Days (AP) and SIZE and this agrees with Rimo and Panbunyuen, (2010). It signifies that large-size firms have the ability to negotiate for better payment terms than small firms leading to the granting of lengthened payment terms by their suppliers. The longer payment period for large firms could also mean that the firms derive good profits from longer payment terms as they see this as an opportunity of having access to interest-free capital. They see the cash discount as not too profitable enough compared to the longer payment terms contrary to smaller firms that prefer cash discounts to payment terms thus, having shorter payable periods. The reverse regarding results of the three components of CCC in relation to smaller firms is true. Profitability (PROF)
Regression results from the study reveal that PROF has no relationship with CCC. This contrasts what theory and this study envisage but agrees with Al-Shubiri and Aburumman (2013) who find PROF not statistically connected to CCC. Conversely, the outcome is inconsistent with studies by Deloof, (2003); Danuletui (2010); Alipour (2011); Bellouma (2011); Sarbapriya (2012); Addae and Nyarko-Baasi (2013); Mawutor (2014); Mengesha (2014); Azeem and Marsap (2015) that find PROF relating negatively with CCC. Ukaegbu (2014) too finds strongly negative interconnection between PROF and CCC across different industrialisation typologies in manufacturing companies in Egypt, Kenya, Nigeria and South Africa. Some studies nonetheless find a positive interconnectivity (Rimo and Panbunyuen, 2010; Sharma and Kumar, 2011; Valipour et al., 2012b; Akoto et al., 2013; Gachira et al., 2014; Tahir and Anuar, 2015). The outcome of this study confirms why it is imprudent to over concentrate on assessing profitability and its impact on WCM as done by several researches, but instead assesses to what extent the other firm attributes affect working capital as well. Regression results point up SIZE, CR and DR as most significant contributors in predicting working capital other than profitability and this assertion is supported by the correlation matrix.
Regression results find PROF to have no relationship with any of the components of CCC, and the correlation matrix asseverates this outcome. This is opposed to prior studies that find: inventory days (INV) interconnecting positively with PROF Rimo and Panbunyuen (2010); Makori and Jagongo (2013); Lwiki et al (2013); Mawutor (2014); Gachira et al (2014); Prempeh (2016); and a significantly positive interconnection between AR and PROF (Muscettola, 2014); Gachira et al (2014); Sharma and Kumar (2011)). Some also find a negative relation between inventory days and PROF (Addae and Nyarko – Baasi (2013); Mengesha (2014); Alipour (2011); Sharma and Kumar (2011); Raheman and Nasr (2007);

INTERNATIONAL JOURNAL OF ACADEMIC RESEARCH IN ACCOUNTING, FINANCE AND
MANAGEMENT SCIENCES
Vol. 1 1 , No. 3, 2021, E-ISSN: 2225-8329 © 2021 HRMARS
574
a significantly negative connection between AR and PROF signifying a rise in accounts receivable period that results in reduction in profitability and vice versa (Mawutor (2014); Mengesha (2014); Addae and Nyarko – Baasi (2013); Akoto et al (2013); Sarbapriya (2012); Alipour (2011); Mathuva (2009); and a negative relationship between AP and PROF where this relationship is best explained by early settlement discount gains (Mengesha, 2014; Gachira et al., 2014; Nwakaego, 2014; Addae and Nyarko–Baasi, 2013; Sharma and Kumar, 2011; Deloof, 2003). A positive relation may mean increased funds that are available as a result of not settling Accounts Payable early which is then put into productive use and which eventually increase profitability. Operating Cash Flow (CF)
Regression result suggests nonexistence of any significant connection among CCC and CF contrary to theoretical and this study’s expectations where a negative relationship is envisaged. This may have come about due to the usage of total assets in the computation. Perhaps, the outcome could have been different if, say, net sales were used as in Manoori and Muhammad (2012). Even though the results of Rimo and Panbunyuen (2010), Manoori and Muhammad (2012), Valipour et al. (2012b) and Naser et al. (2013) show CF relating negatively and significantly with CCC as averred by this study’s correlation analysis, and the study by Azeem and Marsap (2015) shows a positive relationship, this study’s regression result does not support any of these relationships from those empirical results.
Regarding CCC components, regression results show that AR has positive significant relation with CF, disagreeing with Rimo and Panbunyuen (2010) who find negative significant relation between CF and INV as well as AR. Correlation result also supports the study by Rimo and Panbunyuen (2010) of significantly strong negative relation between CF and AR. Sales Growth (GROWTH)
Regression analysis indicates that GROWTH has no association with CCC, and the correlation matrix lends support to this assertion. But this contradicts the study’s expectation of a negative relationship. The finding is inconsistent with prior studies (Naser et al. (2013); Rimo and Panbunyuen (2010)) that find a negative influence of CCC by GROWTH. A negative relation stipulates that anytime growth in sales increases, CCC will decrease and this is healthy. When the rate of GROWTH goes up firms will seek for additional funding to support the growth. This will result in the firms trying to efficiently manage their inventories, receivables and payables so as to generate internal funds to aid operations. Increased GROWTH Rate may mean more expansion needed to be carried out to augment the growth. Valipour et al. (2012a), Addae and Nyarko-Baasi (2013), Azeem and Marsap (2015), and Anton and Anca (2021) however find a significantly positive connection between CCC and GROWTH. Also, the results do not find any relation between the components of CCC and GROWTH as the correlation matrix result gives credence to this outcome. Current Ratio (CR)
Regression result shows a statistically significant and positive correlation between CCC and CR contrary to a negative relationship that the study and theory envisaged. This result is affirmed by the correlation matrix, and Zalaghi et al. (2019) also support the outcome of this study. The result indicates that when CR is high CCC also increases implying strong liquidity position in that, the firm has more current assets than current liabilities to support operations and that more current assets are available to settle liabilities as and when they are due for settlement. Thus, the high current value supports the high CCC. Likewise, it also shows that when CR decreases, CCC also decreases. This means that no much capital is tied up in current assets. Hence, there is efficiency in managing working capital. The result lends support to prior studies by Rimo and Panbunyuen (2010) and Al-Shubiri and Aburumman

INTERNATIONAL JOURNAL OF ACADEMIC RESEARCH IN ACCOUNTING, FINANCE AND
MANAGEMENT SCIENCES
Vol. 1 1 , No. 3, 2021, E-ISSN: 2225-8329 © 2021 HRMARS
575
(2013) though Rimo and Panbunyuen reports a positive but statistically insignificant correlation between CR and CCC. The result of this study is inconsistent with the study by Valipour et al. (2012a) which finds no statistically significant relation. Both regression and correlation matrix results find AR and AP to have a negative and significant relation with CR. Quick Ratio
Regression and correlation matrix results indicate no statistical relationship between CCC and Quick Ratio. This result does not support the negative relation the study expected. However, the outcome agrees with Rimo and Panbunyuen (2010), but contrasts that of Valipour et al. (2012a) which finds a significant negative relationship. The regression results also find that inventory days has relationship with QR and is significantly negative. Debt Ratio (DR)
The regression result reports significantly positive relation between DR and CCC, agreeing with Rimo and Panbunyuen (2010), Valipour et al. (2012a), Al-Shubiri and Aburumman (2013), and Naser et al. (2013). It means that as DR decreases, CCC also decreases signifying that, the less debt that firms obtain, the less finance cost they incur and this shortens the CCC, and the reverse is true. The result meets the expectation of the study and on theoretical grounds. It is however inconsistent with the studies by Lotfinia et al. (2012), Azeem and Marsap (2015) and Anton and Anca (2021) that identify an inverse relationship between WCM and DR. Further to the contrary results, Manoori and Muhammad (2012) find no significant connection between CCC and DR.
The result of this study gives credence to the Perking Order Theory. Perking Order Theory stipulates that the company’s capital structure decision is largely influenced by the amount of funding required to undertake all profitable/positive NPV projects identified by the company coupled with the amount of earnings set aside by the company over a period, and the firm’s capacity to obtain debt finance. Therefore, the implication, which the study supports, is that more profitable firms are expected to use less debt because of the availability of the huge retained earnings they accumulate even though they might have better chances to obtain debt finance. The retained earnings are then used to finance positive NPV projects in lieu of debt. As a result, the CCC gets shortened due to effective and efficient WCM practice emanating from lower costs in servicing debts. Thus, the lesser the debt is the shorter the CCC. This agrees with the studies by Degryse et al. (2012) and Sabri (2012). Sabri further finds that companies with low debt have higher current assets on average whilst those with high debts have lower current assets on average. This current study finds inventory days and payable days relating negatively and significantly with DR as opposed to Rimo and Panbunyuen (2010) who find a significant positive relation between inventory days and Debt Ratio. Summary of Findings and Conclusion
This study seeks to assess the impact of a number of corporate attributes on WCM, measured by CCC, of publicly traded non-financial companies analysing data over the period of 2005–2013. Results from regression analysis show that, out of the seven independent variables used in the study to explain the variation in WCM, three are found to be significant in predicting the CCC and they are Company Size, Current Ratio and Debt Ratio. Whereas SIZE exhibits a negative and significant relation with CCC, CR and DR display significantly positive connections, with DR being the highest contributor. Also, inventory days, receivable days and payable days have been assessed in order to establish their relation with the variables in the study.
Companies whose sizes are large have upper hand in better trade negotiations: they could influence customers to pay early (receivables); have influence on suppliers in order to pay late

INTERNATIONAL JOURNAL OF ACADEMIC RESEARCH IN ACCOUNTING, FINANCE AND
MANAGEMENT SCIENCES
Vol. 1 1 , No. 3, 2021, E-ISSN: 2225-8329 © 2021 HRMARS
576
(payables); and are able to buy raw materials in large quantities at reduced prices and store enough finished goods to meet customers’ demands (inventories). Their size also helps them have large customer bases enabling them to achieve high sales growth compared to their small-sized counterparts. All these shorten their CCC thus, increasing the value of the firm and shareholders value eventually. Regression results add that all the three CCC components are all significantly and positively related to SIZE implying that as SIZE goes up, AR, INV and AP also increase. Firms are thusly advised to improve upon their sizes as well as manage the components of CCC for increased firm value.
The result further suggests Current Ratio as having positive correlation with CCC. This way, as CR increases the liquidity of the firm becomes strong in that, the firm’s operations are being supported by the high current assets, and those liabilities that are due could easily be paid off. Consequently, the high current assets could support the high CCC for efficient operations. The positive relation also means that as CR decreases CCC decreases as there is no much capital locked up in current assets that will result to exposing the firm to excessive costs arising from unnecessary tied up funds. Thus, firms are encouraged to keep their current ratio at optimum level in order for their values to shore up and for shareholders’ value to also increase in turn.
Also, the value of debts used by highly profitable firms is minimal as the results suggest DR to be positively correlated with CCC, implying the usage of less debts by profitable firms to fund operations and positive NPV projects since they are able to pile up huge amounts of profits. Hence, the CCC becomes shortened demonstrating efficiency and effectiveness in managing working capital. The other variables (PROF., GROWTH, QR and CF) have no significant relations with CCC as regards this study even though some prior studies find differing results.
This study shows that, other company traits, for instance SIZE, GROWTH, CF, CR, QR as well as DR affect WCM as evidenced by some previous studies (Degryse et al., 2010; Rimo and Panbunyuen, 2010; Lotfinia et al. 2012; Valipour et al., 2012 and Naser et al., 2013). Unlike profitability, these company characteristics have received less attention in the extant literature, and this is where the study makes its contribution.
The study concludes that, Company Size, Current Ratio and Debt Ratio are the major contributors in predicting Working Capital Management. The results apply to firms in emerging economies and beyond that have similar financial characteristics such as those listed on GSE. In this regard, firms are advised to improve upon their sizes, ensure current ratios are at their optimum, and their debt ratios kept as low as possible. The outcome further proposes the shying away from making too much investment in working capital and instead strive to maintain an optimal level (CCC≤17 days), or work at reducing it further. These would increase the value of the firm and in turn create value for shareholders. In the end, the study serves as a consulting mechanism for firms to enable them become very liquid and, or, solvent in order for them to avoid bankruptcy and its related issues so as to stay in business for an indefinite period of time. Future researches could consider measuring WCM using cash conversion efficiency, net working capital level and operating cycle. Data Availability Statement The data that support the findings of this study are openly available.
INTERNATIONAL JOURNAL OF ACADEMIC RESEARCH IN ACCOUNTING, FINANCE AND
MANAGEMENT SCIENCES
Vol. 1 1 , No. 3, 2021, E-ISSN: 2225-8329 © 2021 HRMARS
577
Acknowledgments I am grateful to Mr Eric Aglozo and Ms Yvonne Delali Tagbor for their roles in finalising the manuscript. More so, I appreciate the helpful comments from Mr Eric Aglozo relating to the introduction, structure of the abstract, and other general comments on the manuscript. Finally, I am grateful to my wife, Mrs Elorm Daniella Ansah and my daughter, Senyuiedzorm for their support in all aspects. References Addae, A. A., & Nyarko–Baasi, M. (2013). Working capital management and profitability: an empirical investigation in an emerging market. Research Journal of Finance and Accounting. 4(15), 143 – 152. Afrifa, G. A. (2013). Working capital management practices of UK SMEs: The role of education and experience. International Journal of Academic Research in Accounting, Finance and Management Sciences. 3(4), 185 –196. http://dx.doi.org/10.6007/IJARAFMS/v3-i4/390. Afrifa, G. A., & Padachi, K. (2016). Working capital level influence on SME profitability. Journal of Small Business and Enterprise Development. 23(1). Agyei, S. K., & Yeboah, B. (2011). Working capital management and profitability of banks in Ghana. Business Journal of Economics, Finance and Management Sciences. 2(2), 112. Agyemang, B. E., & Asiedu, M. K. (2013). The relationship between working capital management and
profitability of listed manufacturing companies in Ghana. International Journal of Business and Social Research (IJBSR). 3(2), 25 – 34.
Akindipe, O. S. (2014). The role of raw material management in production operations.International Journal of Managing Value and Supply Chain. 5(3), 37 – 44.
http://dx.doi.org/10.5121/ijmvsc.2014.5303. Akomeah, J., &Frimpong, S. (2019). Effect of working capital management on profitability of listed manufacturing companies in Ghana. International Journal of Finance and Banking Research. 5(2), 29-35. https://dx.doi.org/10.11648/j.ijfbr.20190502.13. Akoto, R. K., Awunyo–Victor & Angmor, P. L. (2013). Working capital management and profitability:
evidence from Ghanaian listed manufacturing firms. Journal of Economics and International Finance. 5(9), 373 – 379. http://dx.doi.org/10.5897/jeif2013.0539. Aktas, N., Croci, E., & Petmezas, D. (2015). Is working capital management value- enhancing? Evidence from firm performance and investments. Journal of Corporate Finance. 30, 98-113. Alipour, M. (2011). Working capital management and corporate profitability: evidence from Iran. World Applied Science Journal. 12(7), 1093 – 1099. Al – Shubiri, F. N., & Aburumman, N. M. (2013). The relationship between cash conversion cycle and financial characteristics of industrial sectors: an empirical study. Investment Management and Financial Innovations. 10 (4), 95 – 102. Aminu, Y., & Zainudin, N. (2015). A review of anatomy of working capital management theories and the relevant linkages to working capital components: a theoretical building approach. European Journal of Business and Management. 7(2), 10–18. Anton, S. G., & Anca, E. A. N. (2021). The impact of working capital management of firm profitability: empirical evidence from the Polish listed firms. Journal of Risk and Financial Management. 14(9), 1-14. http://dx.doi.org/10.3390/jrfm14010009. Atseye, F. A., Ugwu, J. I., & Takon, S. M. (2015). Determinants of working capital management:
theoretical review. International Journal of Economics, Commerce and

INTERNATIONAL JOURNAL OF ACADEMIC RESEARCH IN ACCOUNTING, FINANCE AND
MANAGEMENT SCIENCES
Vol. 1 1 , No. 3, 2021, E-ISSN: 2225-8329 © 2021 HRMARS
578
Management. 3(2), 1 – 11. Attari, M. A., & Raza, K. (2012). The optimal relationship of cash conversion cycle with firm size and profitability. International Journal of Academic Research in Business and Social Sciences. 2(4), 189 – 203. Awan, A. G., Shahid, P., Hassan, J., & Ahmad, W. (2014). Impact of working capital management on
profitability of cement sector in Pakistan. International Journal of Business and Management Review. 2(4), 1 – 20.
Awan, M. T., & Ahmad, H. (2013). Does working capital management make a difference?. International Journal of Management Sciences and Business Research. 3(1), 64 – 71. Azeem, M. M., & Marsap, A. (2015). Determinant factors and working capital requirement. International Journal of Economics and Finance. 7(2), 280 – 292. http://dx.doi.org/10.5539/ijef.v7n2p280 Ban˜os-Caballero, S., Garcı´a-Teruel, P. J., & Martı´nez-Solano, P. (2010). Working capital management in SMEs. Accounting and Finance. 50, 511–527. http://dx.doi.org/10.1111/j.1467-629X.2009.00331.x Baños-Caballero, S., García-Teruel, P. J., & Martínez-Solano, P. (2014). Working capital management, corporate performance and financial constraints. Journal of Business Research.
67(3), 332 – 338. Baveld, M. B. (2012). Impact of Working capital management on the profitability of public listed firms in the Netherlands during the financial crisis. University of Twente. Bellouma, M. (2011). The impact of working capital management on profitability: The case of small and medium-sized export companies in Tunisia. International Management. 15(3),71–88.http://id.erudit.org/iderudit/1005434ar. http://dx.doi.org/10.7202/1005434ar. Bhutto, N. A., Abbas, G., ur Rehman, M., & Shah, S. M. M. (2011). Relationship of cash conversion cycle with firm size, working capital approaches and firm’s profitability: a case of Pakistani industries‟, Pakistan Journal of Engineering, Technology & Science, 1(2), 45 – 64. Bratland, E., & Hornbrinck, J. (2013). An empirical study of the relationship between working capital policies and stock performance in Sweden. Umeå School of Business and Economics, Umeå University. Chiaramonte, L., & Casu, B. (2017). Capital and liquidity ratios and financial distress. British Accounting Review. 49, 138 – 161. http://dx.doi.org/10.1016/j.bar.2016.04.001 Dănuleţiu, A. E. (2010). Working capital management and profitability: a case of Alba county companies. Annales Universitatis Apulensis Series Oeconomica, 12(1), 364. Degryse, H., Peter de Goeij, & Kappert, P. (2012). The impact of firm and industry characteristics on
small firms’ capital structure. Small Business Economics. 38, 431-447. http://dx.doi.org/10.1007/s11187-010-9281-8. Deloof, M. (2003). Does working capital management affect profitability of Belgian firms? Journal of Business Finance and Accounting. 30 (3 & 4), 573 – 587. http://dx.doi.org/10.1111/1468-5957.00008. Ernst & Young. (2014). All tied up: Working Capital Management Report 2014. [Accessed 26.10.15]. Ezejiofor, R. A., Adigwe, P. K., & John–Akamelu, R. C. (2015). The credit management on liquidity and profitability positions of a manufacturing company in Nigeria. European Journal of Research and Reflection in Management Science. 3(3), 32 – 48. Gachira, W., Chiwanzwa, W., Nkomo, D. J., & Chikore (2014). Working capital management and the profitability of non – financial firms listed on the Zimbabwe Stock Exchange. European Journal of Business and Economics, 9(2), 12–15.
INTERNATIONAL JOURNAL OF ACADEMIC RESEARCH IN ACCOUNTING, FINANCE AND
MANAGEMENT SCIENCES
Vol. 1 1 , No. 3, 2021, E-ISSN: 2225-8329 © 2021 HRMARS
579
Jang, S. C., & Park, K. (2011). Inter – relationship between firm growth and profitability.International Journal of Hospitality Management. 30(4), 1027 – 1035.
Jen – Ren, C., Li, C., & Hang–Wen, W. (2006). The determinants of working capitalmanagement. The Journal of American Academy of Business, Cambridge. 10(1), 149-155.
Kale, B. S., & Chobe, C. N. (2016). Working capital management: a case study of Devgiri Urban Co-operative Bank Ltd. Aurangabad. GE – International Journal of ManagementResearch.
4(1), 60 – 72. Electronic copy available at http://ssrn.com/abstract=2726591. Karaduman, H. A., Akbas, H. E., Ozsozgun, A., & Durer, S. (2010). Effects of working capital management on profitability: the case for selected companies in the Istanbul Stock Exchange (2005–2008). International Journal of Economics and Finance Studies. 2(2), 47–54. Khanqah, V. T., Khosroshahi, M. A., & Ebrati, M. R. (2012). An investigation of the association between working capital management and corporate performance. International Journal of Management and Business Research. 2(3), 203 – 218. Kinuthia, J. N. (2015). The effects of working capital management on the financial performance of retail supermarkets in Nairobi County, Kenya. University of Nairobi. Kusuma, H., & Bachtiar, A. D. (2018). Working capital management and corporate performance: evidence from Indonesia. Journal of Management and Business Administration. Central Europe. 26(2), 76-88. Lee, S. (2014). The relationship between growth and profit: evidence from firm-level panel data. Structural Change and Economic Dynamics. 28, 1-11. Lotfinia, E., Mousavi, Z., & Jari, A. (2012). The relationship between working capital management and
firm characteristics: evidence from Tehran Stock Exchange. International Journal of Business and Social Science. 3(14), 296 – 301.
Lwiki, T., Ojera, P. B., Mugenda, N. G., Wachira, V. K. (2013). The impact of inventory management practices on financial performance of sugar manufacturing firms in Kenya.
International Journal of Business, Humanities and Technology. 3(5), 75 – 85. Mafo Yiadom, E., & Agyei, S. K. (2011). Working capital management practices of Small scale enterprises in the central region of Ghana. Asian Journal of Business and
Management Sciences. 1(4), 29 – 47. Makori, D. M., & Jagongo, A. (2013). Working capital management and firm profitability: empirical evidence from manufacturing and construction firms listed on Nairobi Security Exchange, Kenya. International Journal of Accounting and Taxation. 1(1), 1–14 Manoori, E., & Muhammad, D. J. (2012). Determinants of working capital management: case of singapore firms. Research Journal of Finance and Accounting. 3(11), 15– 23. Mathuva, D. M. (2010). The influence of working capital management components on corporate profitability: a survey on Kenyan listed firms. Research Journal of Business Management. 4(1), 1 –11. http://dx.doi.org/10.3923/rjbm.2010.1.11. Mawutor, J. K. (2014). Working capital management and profitability of firms: a study of listed manufacturing firms in Ghana. Research Journal of Finance and Accounting. 5(22), 122 – 133. Electronic copy available at: http://ssrn.com/abstract=2573319 McInnes, A. N. S. (2000). Working capital management: theory and evidence from New Zealand listed limited liability companies. Lincoln University. Mengesha, W. (2014). Impact of working capital management on firms’ performance: the case of selected metal manufacturing companies in Addis Ababa, Ethiopia. Jimma University. Mun, S. G., & Jang, S. (2015). Working capital, cash holding, and profitability of restaurant firms.

INTERNATIONAL JOURNAL OF ACADEMIC RESEARCH IN ACCOUNTING, FINANCE AND
MANAGEMENT SCIENCES
Vol. 1 1 , No. 3, 2021, E-ISSN: 2225-8329 © 2021 HRMARS
580
International Journal of Hospitality Management. 48, 1–11. Muscettola, M. (2014). Cash conversion cycle and firm’s profitability: an empirical analysis on a sample of 4,226 manufacturing SMEs of Italy. International Journal of Business and Management. 9(5), 25 – 35. http://dx.doi.org/10.5539/ijbm.v9n5p25. Napompech, K. (2013). Effects of working capital management on the profitability of Thai listed firms. International Journal of Trade, Economics and Finance. 3(3), 227. Naser, K., Nuseibeh, R., & Al – Hadeya, A. (2013). Factors influencing corporate working capital management: evidence from an emerging economy. Journal of Contemporary Issues in Business Research. 2(1), 11 – 30. Niklas, H., & Viktor, J. (2014). Working capital management: A study about how Swedish companies manage working capital in relation to revenue growth over time. Uppsala University. Nwakaego, D. A. (2014). Impact of working capital management on corporate profitability of Nigerian manufacturing firms: 2000 to 2011. University of Nigeria, Enugu Campus. Ogundipe, L. O., Ogundipe, S. E., & Ajao, S. K. (2012). Cash holding and firm characteristics: evidence from Nigerian emerging market. Journal of Business, Economics and Finance. 1(2), 45 – 58. Okreglicka, M. B. (2014). The economic recession and working capital management of companies in Poland. Journal of International Scientific Publications. 8, 696 – 706. Panigrahi, A. K., & Chaudhury, K. S. (2015). Negative working capital – a sign of managerial efficiency or possible bankruptcy: a case of Hindustan Unilever Limited. Journal of Management Research and Analysis. 2(1), 35–42. Electronic copy available at: http://ssrn.com/abstract=2594132 Prempeh, K. B. (2016). The impact of efficient inventory management on profitability: evidence from selected manufacturing firms in Ghana. International Journal of Finance and Accounting. 5(1), 22 – 26. http://dx.doi.org/10.5923/j.ijfa.20160501.03 Raheman, A., & Nasr, M. (2007). Working capital management and profitability: case of Pakistani
firms. International Review of Business Research Papers. 3(1), 279 – 300. Raza, M.Y., Bashir, M., Latif, K., Shah, T. S., & Ahmed, M. (2015). Impact of working capital management on profitability: evidence from Pakistan oil sector. International Journal of Accounting and Financial Reporting. 5(1), 286 – 299. Regasa, D. G. (2015). External factors affecting firm growth: evidence from small scale manufacturing
firms in Tigray Regional State of Ethiopia. International Journal of Management and Business Research. 5(4), 279 – 286.
Rimo, A., & Panbunyuen, P. (2010). The effect of company characteristics on working capital management: a quantitative study of Swedish listed companies. Umeå University. http://dx.doi.org:umu-35674. Sabri, T. B. (2012). The effect of working capital on the value of the company in light of differing size, growth, and debt. Business and Economic Horizons. 7(1), 27 – 41. Sarbapriya, R. (2012). Evaluating the impact of working capital management components on corporate profitability: evidence from Indian manufacturing firms. International Journal of Economic Practices and Theories. 2(3), 127 – 136. Sharma, A. K., & Kumar, S. (2011). Effect of working capital management on firm profitability: empirical evidence from India. Global Business Review. 12(1), 159 – 173. http://dx.doi.org/10.1177/097215091001200110. Soyemi, A. A., & Olawale, L. S. (2014). A comparative analysis on working capital managementof
brewery companies in Nigeria. International Journal of Finance and

INTERNATIONAL JOURNAL OF ACADEMIC RESEARCH IN ACCOUNTING, FINANCE AND
MANAGEMENT SCIENCES
Vol. 1 1 , No. 3, 2021, E-ISSN: 2225-8329 © 2021 HRMARS
581
Accounting. 3(6), 356 – 371. http://dx.doi.org/10.5923/j.ijfa.20140306.04 Tahir, M., & Anuar, M. B. A. (2015). The determinants of working capital management and firms’ performance of textile sector in Pakistan. Quality & Quantity. 1 – 14. http://dx.doi.org/10.1007/s11135-015-0166-4. Ukaegbu, B. (2014). The significance of working capital management in determining firm profitability: evidence from developing economies in Africa. Research in International Business and Finance. 31, 1–16. Valipour, H., Moradi, J., & Farsi, F. D. (2012a). The impact of company characteristics on working capital management. Journal of Applied Finance and Banking. 2(1), 105– 125. Valipour, H., Shooshtarian, Z., and Ostovari, E. (2012b). Relationship between working capital, operating cash flows and operating income: empirical evidence from listed firms on Tehran Stock Exchange. Asian Economic and Financial Review. 2(1), 20–29. Vijayakumar, A. (2011). Cash conversion cycle and corporate profitability–an empirical enquiry in Indian automobile firms. International Journal of Research in Commerce, IT & Management. 1(2), 84 – 91. Vural, G., Sökmen, A. G., & Çetenak, E. H. (2012). Effects of working capital management on firm's performance: evidence from Turkey. International Journal of Economics and Financial Issues. 2(4), 488 – 495. Yeboah, B., & Yeboah, M. (2014). The effect of working capital management of Ghana banks on profitability: panel approach. International Journal of Business and Social Science. 5 (10), 294 – 306. Zalaghi, H., Godini, M., & Mansouri, K. (2019). The moderating role of firms’ characteristics on the relationship between working capital management and financial performance. Advances in Mathematical Finance and Applications. 4(1), 71-88. http://dx.doi.org/10.22034/amfa.2019.581878.1158. Zohrabi, M., Abdoli, M. R., and Boujari, M. (2013). The study of working capital strategies in life cycle
of companies. Academic Journal of Accounting and Economic Researches. 2(4), 77-88.

INTERNATIONAL JOURNAL OF ACADEMIC RESEARCH IN ACCOUNTING, FINANCE AND MANAGEMENT SCIENCES
Vol. 1 1 , No. 3, 2021, E-ISSN: 2225-8329 © 2021 HRMARS
582
APPENDIX A
Descriptive
CCC
INV.
AR
AP PROF.
CF
SIZE
GROWTH
CR
QR
DR
Mean
226.321
233.954
72.134
79.767
0.114
0.040
15.093
0.294
1.993
1.006
0.388
Standard Error
34.521
32.759
9.952
14.124
0.027
0.037
0.075
0.135
0.494
0.335
0.038
Median
238.022
238.740
81.190
87.794
0.131
0.018
15.132
0.140
1.535
0.667
0.417
Mode
#N/A
#N/A
#N/A
#N/A
#N/A
#N/A
#N/A
#N/A
#N/A
#N/A
#N/A
Standard Deviation
103.564
98.276
29.856
42.372
0.082
0.110
0.225
0.427
1.483
1.006
0.113
Sample Variance
10725.603
9658.264
891.400
1795.378
0.007
0.012
0.051
0.182
2.200
1.012
0.013
Kurtosis
2.161
4.470
4.890
0.231
-0.914
5.280
1.378
8.379
8.587
8.549
2.718
Skewness
-1.338
-1.866
-2.035
-0.558
0.269
1.835
-0.344
2.822
2.903
2.900
-1.324
Range
328.382
320.047
99.831
138.365
0.248
0.412
0.804
1.472
4.832
3.179
0.387
Minimum
0.000
0.000
0.000
0.000
0.000
-0.107
14.659
0.000
1.084
0.486
0.137
Maximum
328.382
320.047
99.831
138.365
0.248
0.305
15.463
1.472
5.916
3.665
0.524
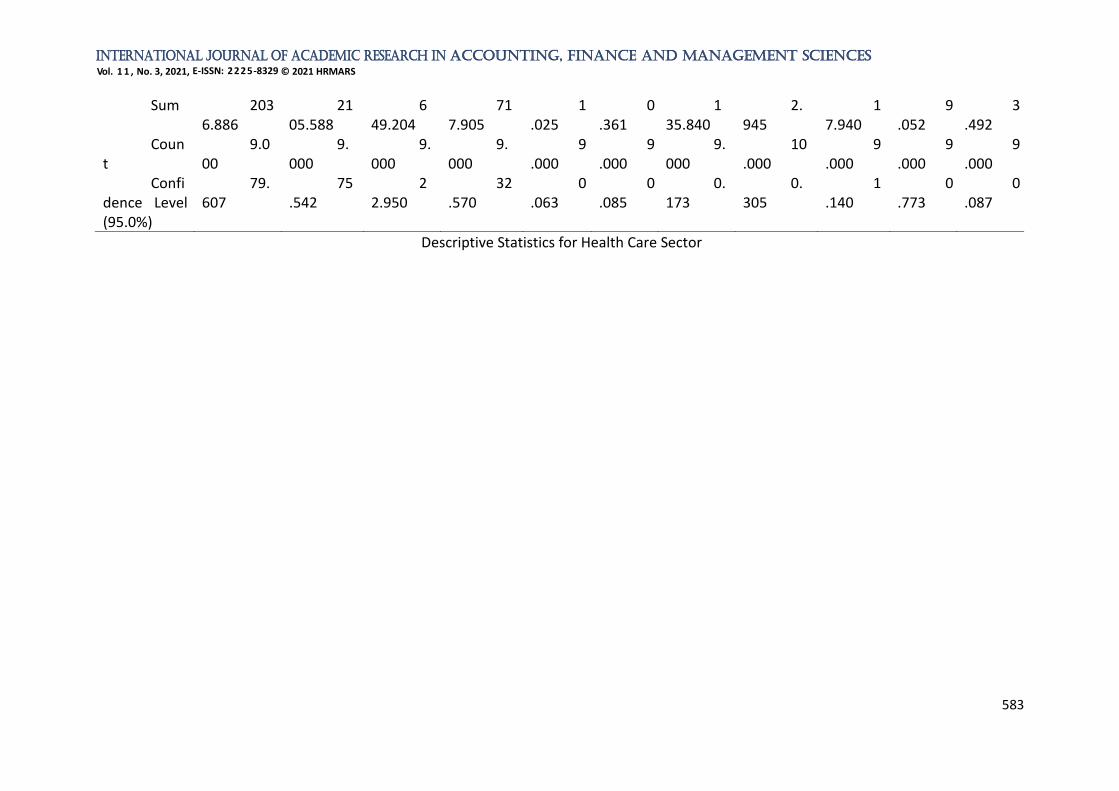
INTERNATIONAL JOURNAL OF ACADEMIC RESEARCH IN ACCOUNTING, FINANCE AND MANAGEMENT SCIENCES
Vol. 1 1 , No. 3, 2021, E-ISSN: 2225-8329 © 2021 HRMARS
583
Descriptive Statistics for Health Care Sector
Sum 2036.886
2105.588
649.204
717.905
1.025
0.361
135.840
2.945
17.940
9.052
3.492
Count
9.000
9.000
9.000
9.000
9.000
9.000
9.000
10.000
9.000
9.000
9.000
Confidence Level (95.0%)
79.607
75.542
22.950
32.570
0.063
0.085
0.173
0.305
1.140
0.773
0.087

INTERNATIONAL JOURNAL OF ACADEMIC RESEARCH IN ACCOUNTING, FINANCE AND MANAGEMENT SCIENCES
Vol. 1 1 , No. 3, 2021, E-ISSN: 2225-8329 © 2021 HRMARS
584
APPENDIX B Descriptive Statistics for Oil and Gas Sector
APPENDIX C Descriptive Statistics for Consumer Goods and
Services Sector
Descriptive Stats
CCC INV. AR AP PROF. CF SIZE GROWTH CR QR DR
Mean -102.232 25.167 42.558 169.958 0.084 0.133 19.581 0.272 0.947 0.847 0.599 Standard Error
29.290 6.475 3.536 34.921 0.011 0.018 1.263 0.075 0.080 0.071 0.042
Median -58.105 8.382 42.254 121.011 0.085 0.150 20.225 0.234 1.045 0.924 0.646 Mode #N/A #N/A #N/A #N/A #N/A #N/A #N/A #N/A #N/A #N/A #N/A Standard Deviation
124.268 27.470 15.002 148.156 0.047 0.075 5.357 0.320 0.338 0.301 0.176
Sample Variance
15442.592 754.578 225.069 21950.259 0.002 0.006 28.699 0.102 0.114 0.091 0.031
Kurtosis -0.965 -0.409 3.898 -0.826 0.524 -0.472 11.477 2.825 2.708 2.806 7.749 Skewness -0.625 1.092 -0.671 0.695 0.237 -0.405 -3.093 1.626 -1.294 -1.254 -2.456 Range 374.006 80.133 74.124 467.235 0.191 0.261 23.955 1.272 1.445 1.309 0.766 Minimum -351.184 0.000 0.000 0.000 0.000 -0.004 0.000 -0.158 0.000 0.000 0.000 Maximum 22.821 80.133 74.124 467.235 0.191 0.257 23.955 1.114 1.445 1.309 0.766 Sum -1840.176 453.013 766.046 3059.235 1.506 2.391 352.455 4.898 17.041 15.240 10.775 Count 18.000 18.000 18.000 18.000 18.000 18.000 18.000 18.000 18.000 18.000 18.000 Confidence Level (95.0%)
61.797 13.660 7.460 73.676 0.023 0.037 2.664 0.159 0.168 0.150 0.088

INTERNATIONAL JOURNAL OF ACADEMIC RESEARCH IN ACCOUNTING, FINANCE AND MANAGEMENT SCIENCES
Vol. 1 1 , No. 3, 2021, E-ISSN: 2225-8329 © 2021 HRMARS
585
Descriptive CCC INV. AR AP PROF. CF SIZE GROWTH CR QR DR
Mean 15.526 79.194 45.021 108.690 0.126 0.093 17.078 0.179 1.744 1.057 0.522
Standard Error
10.300 6.826 7.466 11.413 0.015 0.037 0.229 0.029 0.209 0.159 0.057
Median 12.548 61.675 27.625 107.230 0.122 0.103 17.387 0.177 1.114 0.567 0.468
Mode 0.000 0.000 0.000 0.000 #N/A #N/A #N/A 0.000 #N/A #N/A #N/A
Standard Deviation
87.399 57.917 63.353 96.842 0.130 0.311 1.947 0.249 1.772 1.350 0.482
Sample Variance
7638.629 3354.349 4013.664 9378.351 0.017 0.097 3.792 0.062 3.139 1.821 0.232
Kurtosis 10.064 0.879 27.117 2.895 0.396 35.997 7.872 1.649 6.676 9.220 40.683
Skewness 1.243 1.094 4.521 1.382 -0.303 -4.798 -2.259 0.934 2.588 2.947 5.567
Range 725.358 272.719 464.395 485.902 0.667 3.026 12.054 1.294 8.979 7.254 3.994
Minimum -260.964 0.000 0.000 0.000 -0.268 -2.107 7.551 -0.242 0.036 0.000 0.049
Maximum 464.395 272.719 464.395 485.902 0.399 0.919 19.605 1.052 9.015 7.254 4.044
Sum 1117.864 5702.000 3241.531 7825.667 9.076 6.729 1229.594 12.881 125.565 76.071 37.592
Count 72.000 72.000 72.000 72.000 72.000 72.000 72.000 72.000 72.000 72.000 72.000
Confidence Level (95.0%)
20.538 13.610 14.887 22.757 0.031 0.073 0.458 0.059 0.416 0.317 0.113