anal. chem. 1990, 62, 1906-1913 scanning electrochemical...
TRANSCRIPT
1906 Anal. Chem. 1990, 62, 1906-1913
Scanning Electrochemical Microscopy. Application to Polymer and Thin Metal Oxide Films
Chongmok Lee and Allen J. Bard* Department of Chemistry, The University of Texas, Austin,
Scannlng electrochemical microscopy (SECM) in the feed- back mode, where the steady-state faradaic current at a mlcrodlsk electrode tip Is measured as the tip Is scanned close to a surface, was used to lnvestlgate several dlfferent polymer films on electrode surfaces: poly( vlnylterrocene), N,N’-Ms[3-(t))prop~lE4,4‘-blp~ridkdun e r n e , and Naflon containing Os(bpy);+. The tip response (Le., positive 01 negative feedback) depends upon the nature of the polymer, the substrate electrode potential, the Identity of the solutlon redox specles, and the tip potential. Studles carrled out wlth polymer films on lnterdlgltated array (IDA) electrodes wlth dlfferent redox specles in the cell solution demonstrate that the SECM Images can be used to dlstlngulsh chemically dlfferent sltes on a substrate surface. I t was also posslble wlth similar methods to dlstlnguish Au and oxide-covered Cr electrodes in an IDA.
INTRODUCTION Previous studies from this laboratory have described the
principles of scanning electrochemimcal microscopy (SECM), the theory of the feedback mode, and several applications (1-5). In SECM a microdisk electrode, with a tip radius of the order of a micrometer or less, is moved in close proximity to a substrate of interest that is immersed in a solution con- taining an electroactive species. The electrode reaction at the tip gives rise to a tip current that is affected by the presence of the substrate. In general, the steady-state tip current, iT, is controlled by electrochemical reactions a t the tip electrode and is a function of the tip-substrate distance, d, and the conductivity and the chemical nature of the sample substrate. The measurement of iT can thus provide information about topography of the sample surface, as well as its electrical and chemical properties (3-5). In the feedback mode the mag- nitude of iT increases with respect to its steady-state value a t large distances from the substrate (iTJ (called positive feedback), when the tip electrode is moved close to a con- ductive substrate. iT,- is the steady-state disk ultramicroe- lectrode current given by (6, 7)
iT,m = 4nFDCr (1)
where n is the number of electrons in the electrode reaction, F is the Faraday constant, D is the diffusion coefficient, C is the concentration of electroactive species (0) in the solution, and r is the disk radius. Positive feedback arises because the tip reaction (e.g., 0 + ne- - R) generates a species, R, which is oxidized a t the conductive substrate to produce 0 which then diffuses back to the tip. When the tip is moved close to an insulating substrate, i~ is decreased because the hemispherical diffusion to the tip is partially blocked; this can be termed negative feedback. Note that this feedback mode is different from the SECM generation/collection mode (1, 8, 9).
In this paper we focus on the variation of iT caused by changing the chemical properties of sample substrates, e.g., films of redox polymers, whose redox properties and potentials
0003-2700/90/0382- 1906$02.50/0
Texas 78712
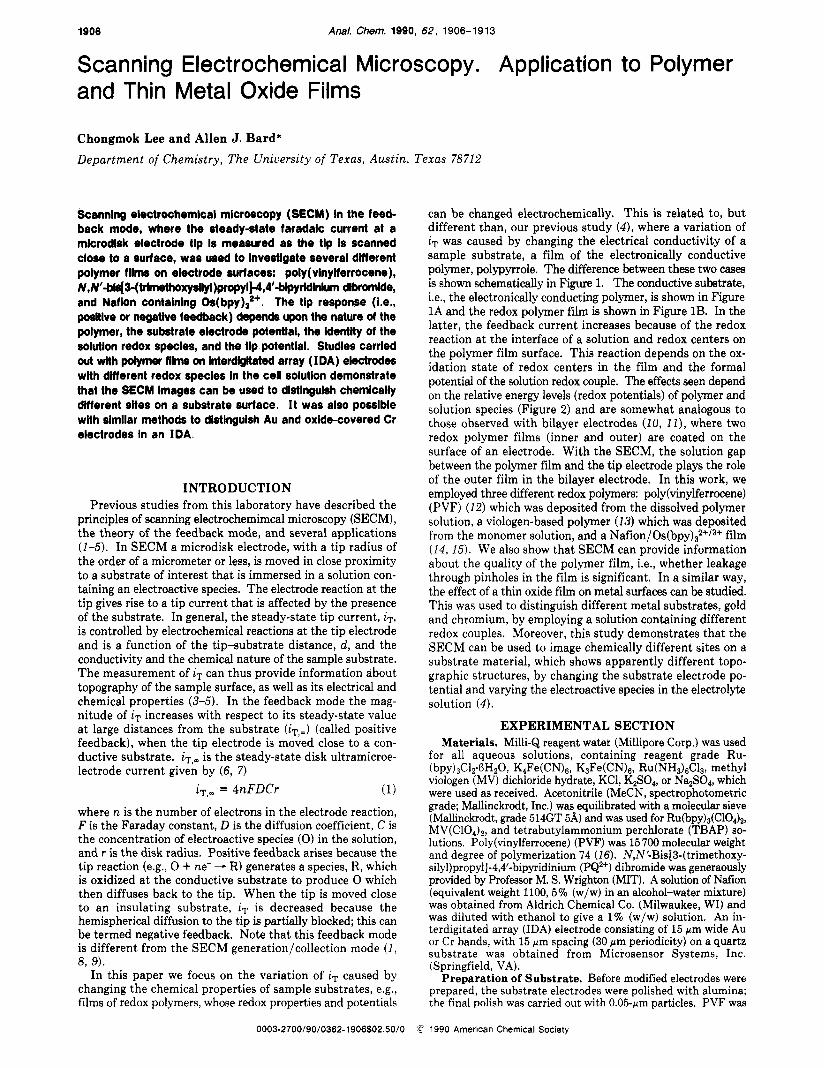
can be changed electrochemically. This is related to, but different than, our previous study (4) , where a variation of iT was caused by changing the electrical conductivity of a sample substrate, a film of the electronically conductive polymer, polypyrrole. The difference between these two cases is shown schematically in Figure 1. The conductive substrate, Le., the electronically conducting polymer, is shown in Figure 1A and the redox polymer film is shown in Figure 1B. In the latter, the feedback current increases because of the redox reaction a t the interface of a solution and redox centers on the polymer film surface. This reaction depends on the ox- idation state of redox centers in the film and the formal potential of the solution redox couple. The effects seen depend on the relative energy levels (redox potentials) of polymer and solution species (Figure 2) and are somewhat analogous to those observed with bilayer electrodes (10, l l ) , where two redox polymer films (inner and outer) are coated on the surface of an electrode. With the SECM, the solution gap between the polymer film and the tip electrode plays the role of the outer film in the bilayer electrode. In this work, we employed three different redox polymers: poly(vinylferrocene) (PVF) (12) which was deposited from the dissolved polymer solution, a viologen-based polymer (13) which was deposited from the monomer solution, and a Nafion/O~(bpy),~+/~+ film (14,15). We also show that SECM can provide information about the quality of the polymer film, Le., whether leakage through pinholes in the film is significant. In a similar way, the effect of a thin oxide film on metal surfaces can be studied. This was used to distinguish different metal substrates, gold and chromium, by employing a solution containing different redox couples. Moreover, this study demonstrates that the SECM can be used to image chemically different sites on a substrate material, which shows apparently different topo- graphic structures, by changing the substrate electrode po- tential and varying the electroactive species in the electrolyte solution ( 4 ) .
EXPERIMENTAL SECTION Materials. Milli-Q reagent water (Millipore Corp.) was used
for all aqueous solutions, containing reagent grade Ru- (bpy),C12-6Hz0, K4Fe(CN)6, K3Fe(CN),, Ru(NH3),C13, methyl viologen (MV) dichloride hydrate, KC1, K2S04, or Na2S04, which were used as received. Acetonitrile (MeCN, spectrophotometric grade; Mallinckrodt, Inc.) was equilibrated with a molecular sieve (Mallinckrodt, grade 514GT 5& and was used for R~(bpy)~(ClO&, MV(C104)z, and tetrabutylammonium perchlorate (TBAP) so- lutions. Poly(viny1ferrocene) (PVF) was 15 700 molecular weight and degree of polymerization 74 (16). N,N’-Bis[3-(trimethoxy- silyl)propyl]-4,4’-bipyridinium (PQ2+) dibromide was generaously provided by Professor M. S. Wrighton (MIT). A solution of Nafion (equivalent weight 1100,5% (w/w) in an alcohol-water mixture) was obtained from Aldrich Chemical Co. (Milwaukee, WI) and was diluted with ethanol to give a 1% (w/w) solution. An in- terdigitated array (IDA) electrode consisting of 15 pm wide Au or Cr bands, with 15 pm spacing (30 pm periodicity) on a quartz substrate was obtained from Microsensor Systems, Inc. (Springfield, VA).
Preparation of Substrate. Before modified electrodes were prepared, the substrate electrodes were polished with alumina; the final polish was carried out with 0.05-pm particles. PVF was
1990 American Chemical Society
ANALYTICAL CHEMISTRY, VOL. 62, NO. 18, SEPTEMBER 15, 1990 1907
R 0
t FEEDBACK 1 t 0 R 0 1
R
SURFACE
)e SUBSTRATE ELECTRODE
( A ) ( B ) Flgure 1. Comparison of positive feedback in SECM: (A) on an electrically conductive substrate, e.g., a conductive polymer (or just an extension of the solM electrode); (e) on a chemically modified substrate, e.g., a redox polymer.
electrodeposited by oxidation to poly(viny1ferrocenium) per- chlorate onto a Pt or Au electrode from a stirred CH2Clz solution containing 5 pM PVF at a potential of 0.7 V vs an oxidized silver wire quasi-reference electrode (AgQRE) (12). Electrolysis time was 1-2 min, yielding about mol of PVF cm-2. A (PQ2+/+), film was grown on a 2 nun diameter Pt disk electrode, half of which was masked by Teflon tape, by applying cyclic potential sweeps (30 cycles, at a scan rate, u, of 100 mV/s) between 0.0 and -0.77 V vs SCE (13) from an aqueous solution containing ca. 3 mM PQz+ monomer, 0.2@ M KC1, and 0.10 M K2HP04 (pH = 8.9) after presaturation with N2. The thickness of this film was measured ellipsometrically and was 100 nm (assuming a refractive index of the oxidized form of 1.50-0.01i). To prepare a Ndion-modified electrode, a Pt disk electrode (5 mm diameter) was spin coated with 10 drops (ca. 10 pL/drop) of a Nafion solution (1% (w/w)) at 2000 rpm and dried in the air for 30 min. Os(bpy)l+ cations were introduced into the Nafion film by immersing the coated electrodes in an aqueous solution containing 1 mM O~(bpy),(ClO~)~ and 0.1 M Na2S04 (15, 17). The measured thickness of a dry Mion/Os(bpy),2+ film was ca. 250 nm, obtained with an Alfa-step 200 profilometer (Tencor Instruments, Mountain View, CA) after partial removal of the film with a sharpened wooden stick. SECM Experiments. Instrumental details and operational
procedures for the SECM were as described previously (3). The bipotentiostat mode was used to apply potentials to the tip (ET) and substrate (E&. Two potential programmers, a PAR 175 universal programmer (Princeton Applied Research, Princeton, NJ) and a home-built bipotentiostat (18), were employed to control ET and Es independently. A microdisk carbon electrode tip (5.5 pm radius) was fabricated and used for SECM experiments (I). The rate of scanning of the tip over the substrate (ST) was 23.7 pm/s for all experiments, except for measurements of A& where ST was 0.66 pm/s. The distance between tip and substrate (d ) was determined from the observed ratio of iT/iT,.. based on the theoretical curves (2), when d was of the order of the tip electrode radius, a. A t larger distances, this was estimated from the cal- ibration curve for the micropositioning device.
RESULTS AND DISCUSSION We first describe SECM experiments on three different
redox polymers where the results are discussed in terms of the SECM feedback principle and the polymer bilayer elec- trode model. We then present SECM experiments on an IDA with interdigitated gold and chromium electrodes with dif- ferent redox couples and explain the results in terms of the properties of a thin passive oxide film on the chromium surface. PVF Film. Several different forms of cyclic voltammetry
(CV) can be carried out with SECM. In tip (T) CV, the tip potential (ET) is scanned and the tip current (iT) measured, with the substrate held a t a potential Es. Substrate (S) CV involves a scan of substrate potential (Es) vs substrate current (is). These two CV modes (T-CV and S-CV) are used to check
POLYMER ELECTRODE
PQ2*'* -0 .5-
POTENTIAL 0 (V vs SCE)
+ I
SOLUTION
NEAR BULK iURFACE SPECIES (FEED- I BACK) I
I
I Fe(CN('14
I
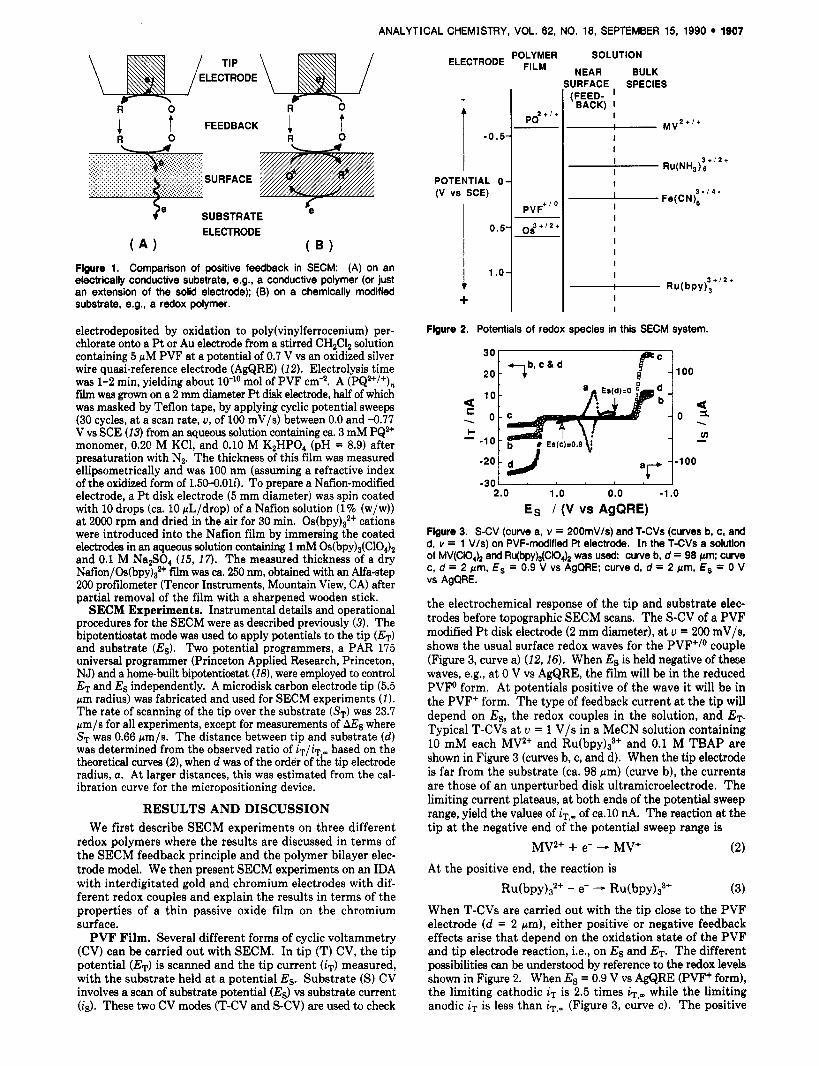
Flgure 2. Potentials of redox species in this SECM system.
1 0 - : 0 : C ' - - 1 0 -
-30 1 I 2.0 1 .o 0.0 -1 .o
Es / (V vs AgQRE)
Figure 3. S-CV (curve a, v = 2OOmV/s) and T-CVs (curves b, c, and d, v = 1 V/s) on PVF-modified Pt electrode. In the T-CVs a solution of MV(C10J2 and Ru(bpyb(CO,), was used: curve b, d = 98 pm; cuve c, d = 2 pm, E, = 0.9 V vs AgQRE; c u ~ e d, d = 2 pm, E, = 0 V vs AgQRE.
the electrochemical response of the tip and substrate elec- trodes before topographic SECM scans. The S-CV of a PVF modified Pt disk electrode (2 mm diameter), at u = 200 mV/s, shows the usual surface redox waves for the PVF+/O couple (Figure 3, curve a) (12,16). When Es is held negative of the* waves, e.g., at 0 V vs AgQRE, the film will be in the reduced PVFO form. At potentials positive of the wave it will be in the PVF+ form. The type of feedback current a t the tip will depend on ES, the redox couples in the solution, and ET. Typical T-CVs a t u = 1 V f s in a MeCN solution containing 10 mM each MV2+ and R ~ ( b p y ) ~ ~ + and 0.1 M TBAP are shown in Figure 3 (curves b, c, and d). When the tip electrode is far from the substrate (ca. 98 pm) (curve b), the currents are those of an unperturbed disk ultramicroelectrode. The limiting current plateaus, at both ends of the potential sweep range, yield the values of iT,= of ca.10 nA. The reaction at the tip a t the negative end of the potential sweep range is
MV2+ + e- - MV+ (2)
Ru(bpy)gP+ - e- - R ~ ( b p y ) ~ ~ + (3)
When T-CVs are carried out with the tip close to the PVF electrode (d = 2 pm), either positive or negative feedback effects arise that depend on the oxidation state of the PVF and tip electrode reaction, i.e., on Es and ET. The different possibilities can be understood by reference to the redox levels shown in Figure 2. When Es = 0.9 V vs AgQRE (PVF' form), the limiting cathodic iT is 2.5 times iT,- while the limiting anodic iT is less than iT,= (Figure 3, curve c). The positive
At the positive end, the reaction is

I908 ANALYTICAL CHEMISTRY, VOL. 82. NO. 18, SEPTEMBER 15, 1990
Figure 4. (A) Sdrematic struchre of IDA (upper) and tha enlargement of the boxed area (lower). (E) Scans of PVF-modified AulCr IDA electrodes (nu. 80 &m periodicity) in 8 mM Ru(bpy),(CIO,),, 0.1 M TBAPlMeCN. E, = 1.5 V vs AgQRE. E, was changed from 0.9 V (front) to 0.0 V (rear) vs AgQRE; liT,ol = ca. 8.6 nA.
feedback current, at the negative potentials, where tip elec- trode reaction (2) occurs, is the result of the reaction
MV+ + PVF+ - M P + PVFO (4)
a t the solution/suhstrate interface, leading to regeneration of M P + in the gap region (see Figure 1B). On the other hand, when ET is a t the positive potential limit, reaction 3 occurs a t the tip. Since R ~ ( h p y ) , ~ + does not react with PVF+, the film behaves as an insulator and iT < iT,-. A similar inter- pretation can he given for the T-CV when Es = 0 V vs AgQRE (PW' form) (Figure 3, curve d). At positive ET values, positive feedback occurs via the reaction
Ru(bpy),,+ + P W - Ru(bpy)z+ + PVF+ (5)
and i~ > i~, . . Although should he less than iT,.. at negative ET values, this was not observed, perhaps because the cell on the SECM mount could not he kept deaerated and some oxygen leaked into the cell and reacted with the tip-generated MV'. The feedback behavior observed with a redox polymer like PVF can be contrasted with that of an electronic con- ductor, such as Pt, where iT would he greater than i,. with ET at both the negative and positive limits, as long as Es was in the zone between the MV*+/+ and Ru(hpy)l+/2+ waves or the Pt was at open circuit. By this selective feedback, which depends on the nature of the redox sites and the probing electroactive species, one can distinguish different sites on a substrate material by varying the electroactive species in the electrolyte solution. The behavior is somewhat analogous to that of polymer bilayer sandwich electrodes, where a redox reaction a t the polymer/polymer interface controls the oh- served voltammetric response ( 1 0 , l l ) . In this case the thin solution layer plays the role of the outer polymer film. However in the SECM case, the potentials of both the polymer fdm and the solution can be controlled independently, so the situation is closer to that of the polymer film open-face sandwich or closely spaced interdigitated electrodes with two different polymers ( l s21 ) .
The topography and redox properties of the substrate can he probed by SECM x-y scans. For this purpose the PVF
Flgure 5. Scans of PVF-modified electmdes in 8 mM Ru(bpy)3(C104h, 0.1 M TBAPlMeCN, E, = 1.5 V vs AgQRE (A) on PI disk electrode after OPD treatment, E, = 0.9 V vs AgQRE (E) same area as in part A except E, was changed from 0.9 (front) to 0.0 V (rear) vs AgQRE, liT,J = ca. 7.4 nA.
was deposited on an Au/Cr IDA with the dimensions and c o n f l a t i o n shown in Figure 4A. As described later, Au was removed from one of the sets of electrodes, leaving an array of interdigitated 15 pm wide Au and Cr hands spaced 15 pm apart. In the experiments described here, the Cr was in the oxidized form and behaved as an insulator (discussed helow), so the m a y can he considered 15 Frn wide Au hands separated by 45 pm spaces. PVF was electrodeposited on the Au hands of the array. For SECM studies, this Au IDA was immersed in a 8 mM RuChpy)?' and 0.1 M TBAP MeCN solution, where iT,- was 8.6 nA, at ET = 1.5 V vs AgQRE. A topographic scan was then obtained by x-y rastering of the tip held close to the array at ET = 1.5 V (Figure 4B). During the course of the scan Es was switched from 0.9 V (PVF' form, which does not react with tip generated Ru(II1)) to 0 V (PVFo form) where positive feedback is possible. Thus, from the T-CVs, one would expect to see a flat plane structure (insulating hehavior) with Es = 0.9 V (iT < iT,..) and the Au hand structure (with a 60 pm periodicity) at Es = 0 V with iT > iT,,. In SECM scans, the expected positive feedback at Es = 0 V occurs, hut negative feedback is not observed a t E, = 0.9 V. Instead iT, when the tip is above the PVF-covered Au, is -iT,-, and is much larger than iT when the tip is over the truly insulating glass or chromium oxide zones. This is consistent with a PVF film that allows some leakage of solution to the underlying Au through pinholes in the film. Pinholes in PVF films have been observed in earlier studies and probed via chronoam- perometry and rotating disk electrode voltammetry of ap- propriate solution species (16, 22). The SECM feedback behavior for a leaky insulating film on a conductive substrate combines the blocking effect of the film (iT < iTJ and the positive feedback effect of the conductive substrate through the pinholes (6 > iT,.). The overall iT observed will he larger than iT over an insulator and will depend upon the relative area of the pinholes and their size and distribution. The quantitative theory for this situation is not yet available and will be the subject of future SECM studies.
Another SECM study was carried out with a PVF film on a Pt electrode substrate. In this case we attempted to seal the pinholes by oxidizing o-phenylenediamine (OPD) in aqueous solution at the film-covered electrode. This treatment has been shown to deposit an insulating film on electrodes (23, 24). The electrode was then transferred to the Ru- (hpy)32+-MeCN solution and SECM scans were carried out (Figure 5). A scan across the substrate at Es = 0.9 V, where insulating behavior is expected, still showed larger iT values than for a true insulator (Figure 5A). An apparently rough film structure is seen under these conditions. Thus the PVF film remains leaky after OPD treatment, perhaps because the film morphology changes upon moving the electrode from the aqueous to the MeCN solution. When Es is switched to 0 V (Figure 5B), positive feedback behavior is observed. Note that under positive feedback conditions the film surface appears
ANALYTICAL CHEMISTRY, VOL. 62, NO. 18, SEPTEMBER 15, 1990 is09
I I 4.0 1 A iZo
. cn
-20 - -8.0
0.2 0.0 -0.2 -0.4 -0.6 -0.8 -1.0
Es / (V vs SCE) Figure 8. S C V (cuve a) and T/S CVs (curves b and c) on PQmOcMied Pt electrode, v = 100 mV/s: T/S CVs in K,Fe(CN),/KCl, ET = 0.6 V vs SCE; curve b, d = 8 pm; curve c, d = 66 pm.
much smoother, suggesting that the variations noticed in the scan with Es = 0.9 V represent variations in film porosity rather than actual film roughness.
(PQ2+/+), Film. Studies were also carried out with a film of (PQ2+), on a Pt substrate, prepared by reduction of the monomer (13). As shown below, this film showed behavior consistent with the absence of pinholes. The S-CV of (PQ2+/+), film on a Pt disk electrode (2 mm diameter), a t u = 100 mV/s in an aqueous solution containing only 0.1 M KC1, shows the usual surface redox waves for the PQ2+/+ couple (Figure 6, curve a) (13). Thus when Es is held negative of these waves, e.g., at -0.75 V vs SCE, the film will be in the reduced PQ+ form. At potentials positive of the wave, it will be in the Paz+ form.
A unique form of CV with the SECM is tip/substrate (T/S) CV (4). T / S CV involves monitoring iT vs Es with ET maintained at a given potential and the tip held near the substrate. The tip monitors electrochemically induced changes in the substrate at locations immediately below the tip, shown by changes in the magnitude of the feedback current. This mode is different than operation in the collection mode (1, 8), where products formed on the substrate are analyzed at the tip. In the T/S CV mode, the type of feedback current at the tip will depend on Es, the redox couples in the solution, and ET. Typical T/S CVs at u = 100 mV/s in an aqueous solution containing 5 mM K4Fe(CN)6 and 0.1 M KC1, a t ET = 0.6 V vs SCE, are shown in Figure 6 (curves b and c). When the tip electrode is far from the substrate (d = 66 pm) (curve c), iT is that of an unperturbed disk ultramicroelectrode, i.e., iT,.. = ca. 4.5 nA. The reaction at the tip is
Fe(CN)64- - e- - Fe(CN)t- (6)
When T/S CV is carried out with the tip close to the (PQ2+/+), electrode (d = 8 pm), either positive or negative feedback effects arise, depending on the oxidation state of the PQ. When Es is moved negative of the surface PQz+/+ redox waves (PQ+ form), iT > iT,.. (Figure 6, curve b). The positive feedback current, where the tip electrode reaction (6) occurs, is the result of the reaction
Fe(CN)t- + PQ+ - Fe(CN),4- + PQz+ (7)
at the solution/substrate interface leading to regeneration of Fe(CN)6C in the solution gap region (Figure 1B). On the other hand, when Es is moved positive of the surface redox waves (PQ2+ form), the film behaves as an insulator and iT < iT,= since Fe(CN):- does not react with Paz+.
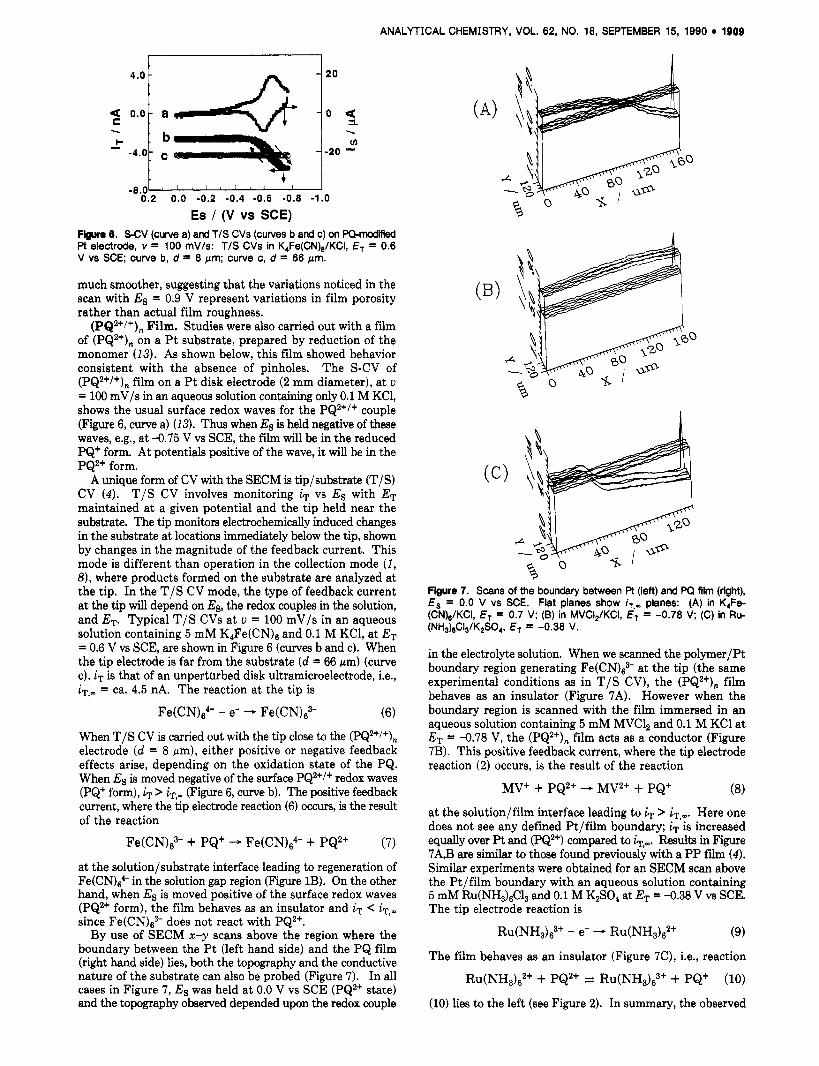
By use of SECM x-y scans above the region where the boundary between the Pt (left hand side) and the PQ film (right hand side) lies, both the topography and the conductive nature of the substrate can also be probed (Figure 7 ) . In all cases in Figure 7, Es was held at 0.0 V vs SCE (PQ2+ state) and the topography observed depended upon the redox couple
-4.0LE!?5d
Figure 7. Scans of the boundary between Pt (left) and W film (rlght), E, = 0.0 V vs SCE. Flat planes show iT,- planes: (A) in K,Fs (CN),/KCI, E, = 0.7 V; (B) in MVCI,/KCI, ET = -0.78 V; (C) in Ru- (NH&CI,/K,SO,, ET = -0.38 V.
in the electrolyte solution. When we scanned the polymer/Pt boundary region generating Fe(CN)63- a t the tip (the same experimental conditions as in T / S CV), the (PQ2+), film behaves as an insulator (Figure 7A). However when the boundary region is scanned with the film immersed in an aqueous solution containing 5 mM MVC12 and 0.1 M KC1 at ET = -0.78 V, the (PQ2+), film acts as a conductor (Figure 7B). This positive feedback current, where the tip electrode reaction (2) occurs, is the result of the reaction
MV+ + PQz+ - MV2+ + PQ+ (8)
at the solution/film interface leading to iT > iT,... Here one does not see any defined Pt/film boundary; iT is increased equally over Pt and (PQ2+) compared to iT, ... Results in Figure 7AJ3 are similar to those found previously with a PP film (4). Similar experiments were obtained for an SECM scan above the Pt/film boundary with an aqueous solution containing 5 mM Ru(NH3)&13 and 0.1 M K2S04 at ET = -0.38 V vs SCE. The tip electrode reaction is
R u ( N H ~ ) ~ ~ + - e- - R u ( N H ~ ) ~ ~ + (9)
The film behaves as an insulator (Figure 7C), i.e., reaction
RU(NH&~+ + PQ2+ s R u ( N H ~ ) ~ ~ + + PQ+ (10)
(10) lies to the left (see Figure 2). In summary, the observed
1910 9 ANALYTICAL CHEMISTRY, VOL. 62, NO. 18, SEPTEMBER 15, 1990
6 ' " ' ' 1 .0 0.8 0.6 0.4 0.2 0.0 -0 .2
Es / (V vs SCE)
40 - 20 -
4 . 0: v) - - -20
-60L " " " " " " v
1.0 0.8 0.6 0.4 0.2 0.0 -0 .2 Es / (V vs SCE)
Flgure 8. T/S CVs (A) curve a, d = 500 pm; curve b, d = 10 pm, and S-CV (B) on Nafion/Os(bpy),3+'2+ electrode in K,Fe(CN)6/Na,S0,, v = 50 mV/s, E, = -0.4 V vs SCE.
feedback response over a PQ film depends on the redox state of the film as well as the redox species in solution. The PQ film (-100 nm) shows much better blocking behavior (i.e., fewer pinholes) than the thicker PVF film.
Nafion/Os(bpy),*+ Film. Films of the perfluorinated ionomer, Nafion, have been examined extensively ( I 1, 14) because of their utility in exchanging electroactive cations
M"+SO1, + n(S03-Na+),leC 2 [(so3-),Mn+1elec + nNa+soh (11)
In this study, O~(bpy) ,~+ cations were introduced into the Nafion films by immersing the Nafion-coated electrodes in an aqueous solution containing 1 mM O~(bpy) , (ClO~)~ and 0.1 M Na2S04. T/S and S-CV modes were used to check the electrochemical response of the tip and substrate electrodes before topographic SECM scans were carried out. T/S and S-CVs of a Nafi~n/Os(bpy) ,~+/~+ substrate in an aqueous solution containing either 10 mM K3Fe(CN), and 0.1 M Na2S04 or 10 mM K,Fe(CN), and 0.1 M Na2S04 are shown in Figures 8 and 9, respectively. The Fe(CN):-I4- couple was chosen because the high negative charge is known to prevent these ions from diffusing into the Nafion coating (17). Thus, reaction between Fe(CN)63-/4- and O ~ ( b p y ) , ~ + / ~ + will be re- stricted to the solution/film interface, as found in a previous study with this couple and Ru(bpy),*+. The S-CV of Na- f ion /O~(bpy) ,~+/~+ film on a Pt disk electrode ( 5 mm diam- eter), a t u = 50 mV/s in the Fe(CN)63- solution, shows the usual redox waves for the O ~ ( b p y ) ~ ~ + / ~ + couple (Figure 8B). When Es is held positive of these waves, the redox sites in the film will be oxidized to the O~(bpy) ,~+ form; for Es held negative of these waves, the redox sites will be in the reduced O ~ ( b p y ) ~ ~ + form. Typical T/S CVs a t u = 50 mV/s a t ET = -0.4 V vs SCE are shown in Figure 8A. When the tip electrode is far from the substrate (d = 500 pm), iT shows iT,.. (9.2 nA) independent of Es (flat CV). The reaction a t the tip is
(12)
When T/S CV is measured with the tip close to the substrate electrode (d = 10 pm), either positive or negative feedback effects arise, depending on the oxidation state of the Os-
Fe(CN)63+ + e- - Fe(CN)64-
-2
-4
-6
-8
2 I- -
. _ 1.0 0.8 0.6 0.4 0.2 0.0 -0.2
Es / (V vs SCE)
-80' " " ' ' " " '
1.0 0.8 0.6 0.4 0.2 0.0 -0.2 Es / (V vs SCE)
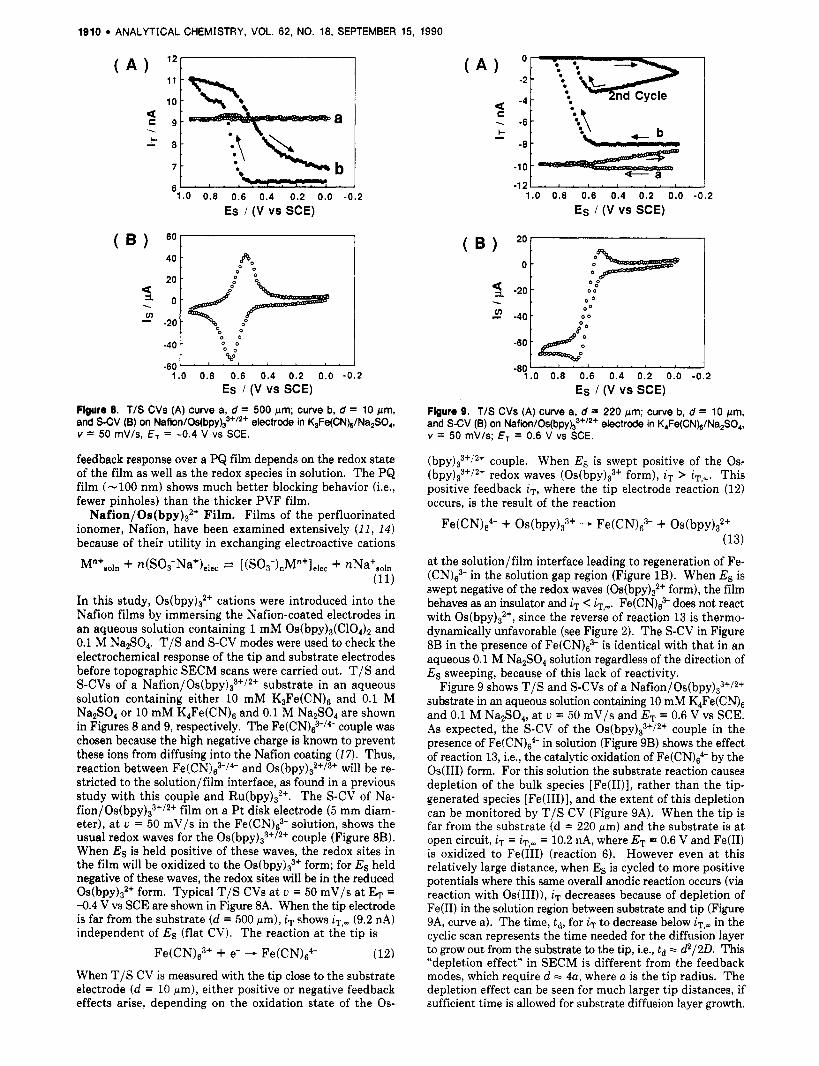
Flgure 9. TIS CVs (A) curve a, d = 220 pm; curve b, d = 10 pm, and SCV (6) on Nafion/Os(bpy),3+'*+ electrode in K4Fe(CN)6/Na,S04, v = 50 mV/s; E, = 0.6 V vs SCE.
( b p ~ ) ~ ~ + / ~ + couple. When Es is swept positive of the Os- ( b ~ y ) 3 ~ + / ~ + redox waves (O~(bpy) ,~+ form), iT > iT,-. This positive feedback iT, where the tip electrode reaction (12) occurs, is the result of the reaction
Fe(CN),4- + O ~ ( b p y ) , ~ + - Fe(CN):- + Os(bpy)32+ (13)
at the solution/film interface leading to regeneration of Fe- (CN)63- in the solution gap region (Figure 1B). When Es is swept negative of the redox waves (O~(bpy),~+ form), the film behaves as an insulator and iT < iT, ... Fe(CN),& does not react with O ~ ( b p y ) ~ ~ + , since the reverse of reaction 13 is thermo- dynamically unfavorable (see Figure 2). The S-CV in Figure 8B in the presence of Fe(CN),,- is identical with that in an aqueous 0.1 M Na2S04 solution regardless of the direction of Es sweeping, because of this lack of reactivity.
Figure 9 shows T/S and S-CVs of a Nafi~n/Os(bpy) ,~+/~+ substrate in an aqueous solution containing 10 mM K,Fe(CN), and 0.1 M Na2S04, at u = 50 mV/s and ET = 0.6 V vs SCE. As expected, the S-CV of the O ~ ( b p y ) , ~ + / ~ + couple in the presence of Fe(CN):- in solution (Figure 9B) shows the effect of reaction 13, Le., the catalytic oxidation of Fe(CN),4- by the Os(II1) form. For this solution the substrate reaction causes depletion of the bulk species [Fe(II)], rather than the tip- generated species [Fe(III)], and the extent of this depletion can be monitored by T/S CV (Figure 9A). When the tip is far from the substrate (d = 220 pm) and the substrate is a t open circuit, iT = iT,= = 10.2 nA, where ET = 0.6 V and Fe(I1) is oxidized to Fe(II1) (reaction 6). However even at this relatively large distance, when Es is cycled to more positive potentials where this same overall anodic reaction occurs (via reaction with Os(III)), iT decreases because of depletion of Fe(I1) in the solution region between substrate and tip (Figure 9A, curve a). The time, t d , for iT to decrease below iT,.. in the cyclic scan represents the time needed for the diffusion layer to grow out from the substrate to the tip, i.e., t d = d2/2D. This "depletion effect" in SECM is different from the feedback modes, which require d = 4a, where a is the tip radius. The depletion effect can be seen for much larger tip distances, if sufficient time is allowed for substrate diffusion layer growth.
ANALYTICAL CHEMISTRY, VOL. 62, NO. 18, SEPTEMBER 15, 1990 1911
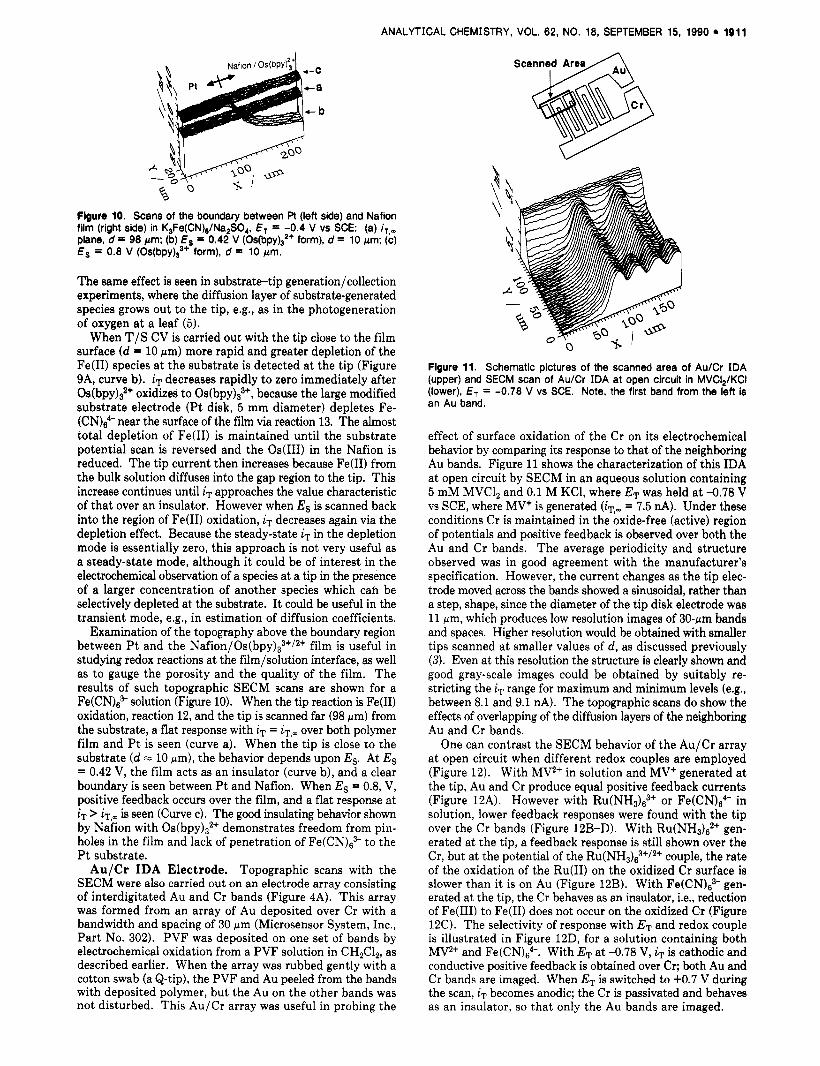
Flgure 10. Scans of the boundary between Pi (left side) and Nafion film (right side) in K,Fe(CN),/Na,SO,, E, = -0.4 V vs SCE: (a) iT,- plane, d = 98 pm; (b) E, = 0.42 V (Os(bpy);+ form), d = 10 pm; (c) E, = 0.8 V (Os(bpy),,+ form), d = 10 pm.
The same effect is seen in substrate-tip generation/collection experiments, where the diffusion layer of substrate-generated species grows out to the tip, e.g., as in the photogeneration of oxygen a t a leaf (5).
When T/S CV is carried out with the tip close to the film surface (d = 10 pm) more rapid and greater depletion of the Fe(I1) species a t the substrate is detected at the tip (Figure 9A, curve b). i~ decreases rapidly to zero immediately after Os(bpy)t+ oxidizes to O ~ ( b p y ) ~ ~ + , because the large modified substrate electrode (Pt disk, 5 mm diameter) depletes Fe- (CN)B- near the surface of the film via reaction 13. The almost total depletion of Fe(I1) is maintained until the substrate potential scan is reversed and the Os(II1) in the Nafion is reduced. The tip current then increases because Fe(I1) from the bulk solution diffuses into the gap region to the tip. This increase continues until iT approaches the value characteristic of that over an insulator. However when Es is scanned back into the region of Fe(I1) oxidation, iT decreases again via the depletion effect. Because the steady-state iT in the depletion mode is essentially zero, this approach is not very useful as a steady-state mode, although it could be of interest in the electrochemical observation of a species at a tip in the presence of a larger concentration of another species which cah be selectively depleted at the substrate. It could be useful in the transient mode, e.g., in estimation of diffusion coefficients.
Examination of the topography above the boundary region between Pt and the Naf i~n/Os(bpy) ,~+/~+ film is useful in studying redox reactions at the film/solution interface, as well as to gauge the porosity and the quality of the film. The results of such topographic SECM scans are shown for a Fe(CN)63' solution (Figure 10). When the tip reaction is Fe(I1) oxidation, reaction 12, and the tip is scanned far (98 pm) from the substrate, a flat response with iT = iT,- over both polymer film and Pt is seen (curve a). When the tip is close to the substrate (d = 10 pm), the behavior depends upon Es. At Es = 0.42 V, the film acts as an insulator (curve b), and a clear boundary is seen between Pt and Nafion. When Es = 0.8, V, positive feedback occurs over the film, and a flat response at iT > i ~ , ~ is seen (Curve c). The good insulating behavior shown by Nafion with Os(bpy)gP+ demonstrates freedom from pin- holes in the film and lack of penetration of Fe(CN)63- to the Pt substrate.
Au/Cr IDA Electrode. Topographic scans with the SECM were also carried out on an electrode array consisting of interdigitated Au and Cr bands (Figure 4A). This array was formed from an array of Au deposited over Cr with a bandwidth and spacing of 30 pm (Microsensor System, Inc., Part No. 302). PVF was deposited on one set of bands by electrochemical oxidation from a PVF solution in CHzClz, as described earlier. When the array was rubbed gently with a cotton swab (a Q-tip), the PVF and Au peeled from the bands with deposited polymer, but the Au on the other bands was not disturbed. This Au/Cr array was useful in probing the
Figure 11. Schematic pictures of the scanned area of Au/Cr IDA (upper) and SECM scan of Au/Cr IDA at open circuit in MVCI,/KCI (lower), ET = -0.78 V vs SCE. Note, the first band from the left is an Au band.
effect of surface oxidation of the Cr on its electrochemical behavior by comparing its response to that of the neighboring Au bands. Figure 11 shows the characterization of this IDA a t open circuit by SECM in an aqueous solution containing 5 mM MVC12 and 0.1 M KC1, where ET was held at -0.78 V vs SCE, where MV+ is generated (iT,.. = 7.5 nA). Under these conditions Cr is maintained in the oxide-free (active) region of potentials and positive feedback is observed over both the Au and Cr bands. The average periodicity and structure observed was in good agreement with the manufacturer's specification. However, the current changes as the tip elec- trode moved across the bands showed a sinusoidal, rather than a step, shape, since the diameter of the tip disk electrode was 11 pm, which produces low resolution images of 30-pm bands and spaces. Higher resolution would be obtained with smaller tips scanned at smaller values of d, as discussed previously (3). Even at this resolution the structure is clearly shown and good gray-scale images could be obtained by suitably re- stricting the iT range for maximum and minimum levels (e.g., between 8.1 and 9.1 nA). The topographic scans do show the effects of overlapping of the diffusion layers of the neighboring Au and Cr bands.
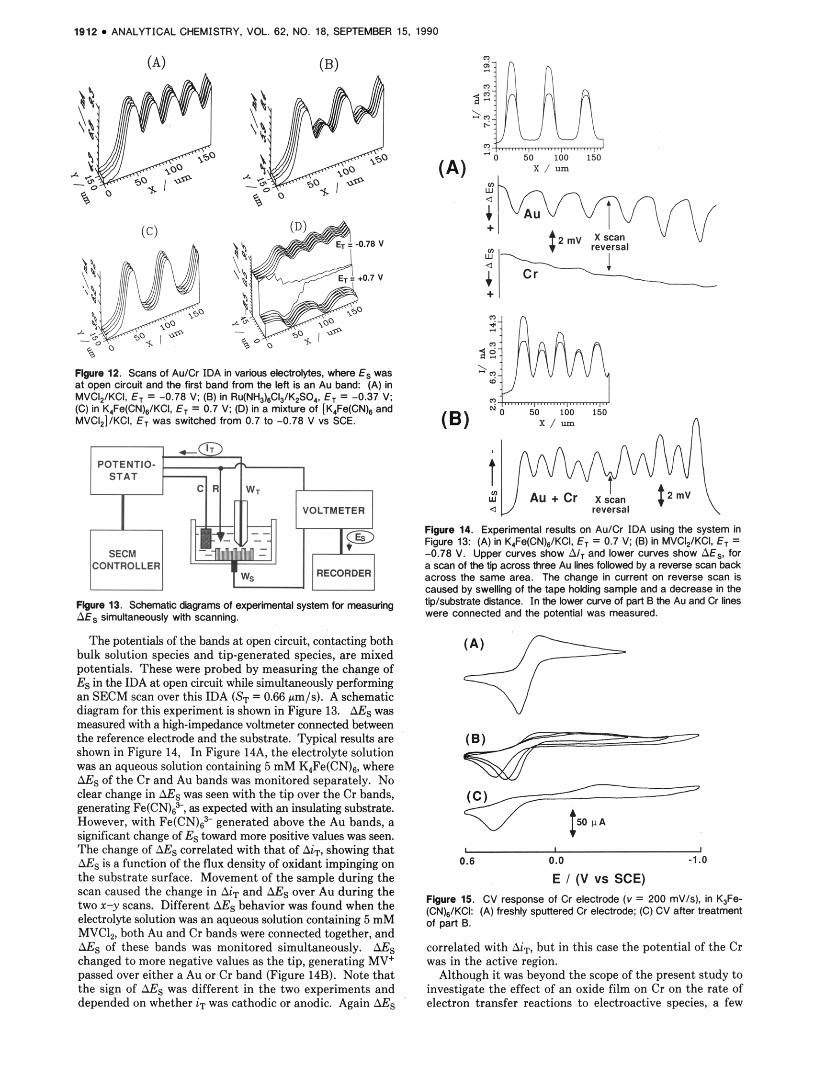
One can contrast the SECM behavior of the Au/Cr array at open circuit when different redox couples are employed (Figure 12). With MV2+ in solution and MV+ generated at the tip, Au and Cr produce equal positive feedback currents (Figure 12A). However with R u ( N H ~ ) ~ ~ + or Fe(CNI6" in solution, lower feedback responses were found with the tip over the Cr bands (Figure 12B-D). With R u ( N H ~ ) ~ ~ + gen- erated at the tip, a feedback response is still shown over the Cr, but at the potential of the RU(NHJ:+/~+ couple, the rate of the oxidation of the Ru(I1) on the oxidized Cr surface is slower than it is on Au (Figure 12B). With Fe(CN)e3- gen- erated at the tip, the Cr behaves as an insulator, i.e., reduction of Fe(II1) to Fe(I1) does not occur on the oxidized Cr (Figure 12C). The selectivity of response with ET and redox couple is illustrated in Figure 12D, for a solution containing both MV2+ and Fe(CN):-. With ET at -0.78 V, iT is cathodic and conductive positive feedback is obtained over Cr; both Au and Cr bands are imaged. When ET is switched to +0.7 V during the scan, iT becomes anodic; the Cr is passivated and behaves as an insulator, so that only the Au bands are imaged.
1912 ANALYTICAL CHEMISTRY. VOL. 62. NO. 18, SEPTEMBER 15, 1990
(A)
Flpun 12. Scans of AuICr IDA in varlous ekctrdyles. where E, was at open circuit and the first band from the lefl is an Au band: (A) in MVCI,IKCi. E, = -0.78 V: (E) in Ru(NH,),CI,IK,SO,. E, = -0.37 V: (C) in K,Fe(CN),IKCI. E, = 0.7 V: (0) in a mixture of [K,Fe(CN), and MVCl,]lKCi, E, was switched from 0.7 to -0.78 V vs SCE.
CONTROLLER
Figure 13. Schematic diaqams of experimental system for measuing AEs simuitaneously with scanning.
The potentials of the hands at open circuit, contacting both hulk solution species and tip-generated species, are mixed potentials. These were probed by measuring the change of Es in the IDA a t open circuit while simultaneously performing an SECM scan over this IDA (S, = 0.66 pm/s). A schematic diagram for this experiment is shown in Figure 13. AEs was measured with a high-impedance voltmeter connected between the reference electrode and the substrate. Typical results are shown in Figure 14, In Figure 14A, the electrolyte solution was an aqueous solution containing 5 mM K,Fe(CN)6, where AEs of the Cr and Au bands was monitored separately. No clear change in AEs was seen with the tip over the Cr hands, generating Fe(CN),*, as expected with an insulating substrate. However, with Fe(CN)63- generated above the Au bands, a significant change of Es toward more Witive values was seen. The change of AEs correlated with that of Ai,, showing that AEs is a function of the flux density of oxidant impinging on the substrate surface. Movement of the sample during the scan caused the change in AiT and AEs over Au during the two x-y scans. Different AEs behavior was found when the electrolyte solution was an aqueous solution containing 5 mM MVC12, both Au and Cr bands were connected together, and AEs of these bands was monitored simultaneously. AEs changed to more negative values as the tip, generating MV+ passed over either a Au or Cr hand (Figure 14B). Note that the sign of AEs was different in the two experiments and depended on whether iT was cathodic or anodic. Again AEs
*! A ?
E
0 - 0 50 100 150
x / -
A
Fbure 14. Experimental resuits on AuICr IDA using the system in Figure 1 3 (A) in K,Fe(CN),/KCI. E, = 0.7 V: (E) in MVCI,/KCI. E, = -0.78 V. Upper curves show Ai, and lower curves show AEs, for a scan of Uw tip a a m three Au lines followed by a revem scan badc across the same area. The change in current on reverse scan is caused by swelling of the tape holding sample and a decrease in the tiplsubsbate distance. In the lower curve of parl B the Au and Cr lines were connected and the potential was measured.
0.6 0.0 -1.0
E / (V vs SCE) Figure 15. CV response of Cr electrode ( v = 200 mVIs). in K d e - (CN)eIKCI: (A) freshly sputtered Cr electrode: (C) CV after treatment of part E.
correlated with AiT, but in this case the potential of the Cr was in the active region.
Although it was beyond the scope of the present study to investigate the effect of an oxide film on Cr on the rate of electron transfer reactions to electroactive species, a few
ANALYTICAL CHEMISTRY, VOL. 62, NO. 18, SEPTEMBER 15, 1990 1913
iments with interdigitated electrode arrays. For a polymer in its insulating state, the observed SECM response could provide information about the presence of pinholes or porosity of the film. Thus PVF films were shown to be rather porous, in agreement with past studies, while (PQ2+), and Nafion formed films that were free of pinholes. SECM can also be
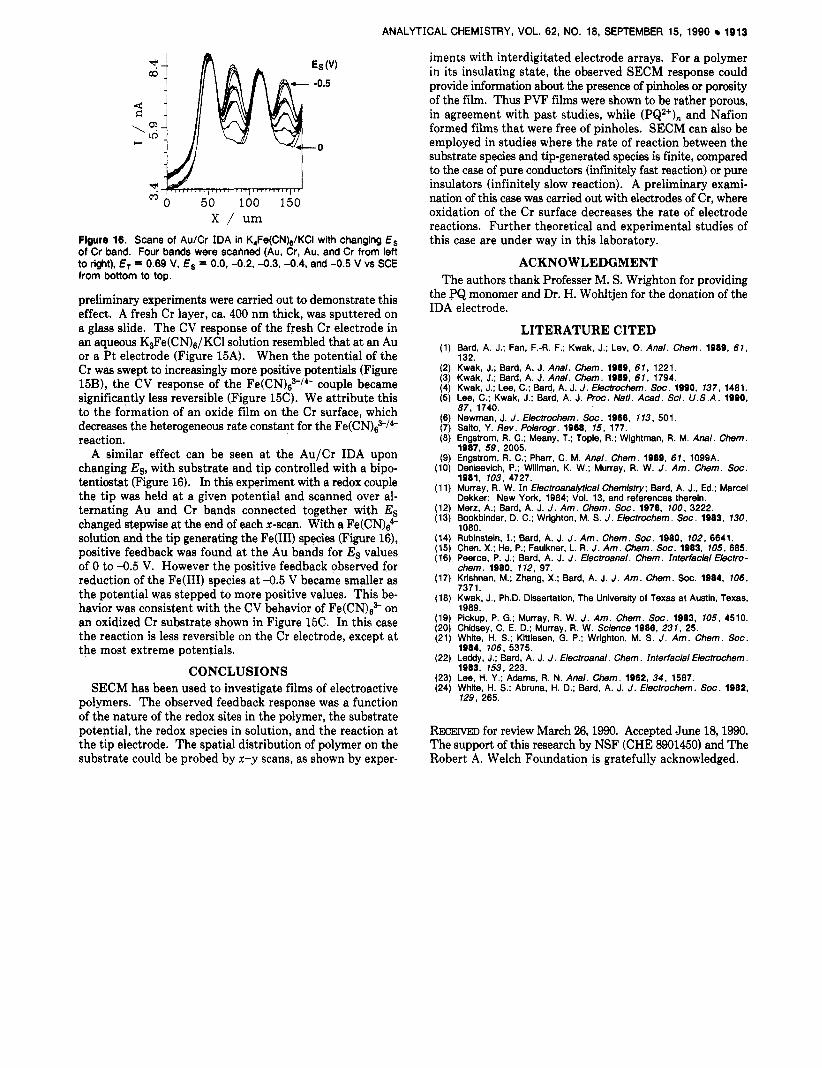
X / urn Figure 16. Scans of Au/Cr IDA in K,Fe(CN),IKCI with changing E, of Cr band. Four bands were scanned (Au, Cr, Au, and Cr from left to right). ET = 0.69 V, E, = 0.0, -0.2, -0.3, -0.4, and -0.5 V vs SCE from bottom to top.
preliminary experiments were carried out to demonstrate this effect. A fresh Cr layer, ca. 400 nm thick, was sputtered on a glass slide. The CV response of the fresh Cr electrode in an aqueous K3Fe(CN)6/KCl solution resembled that a t an Au or a Pt electrode (Figure 15A). When the potential of the Cr was swept to increasingly more positive potentials (Figure 15B), the CV response of the Fe(CN)2-l4- couple became significantly less reversible (Figure 1 5 0 . We attribute this to the formation of an oxide film on the Cr surface, which decreases the heterogeneous rate constant for the Fe(CN)63-/4- reaction.
A similar effect can be seen at the Au/Cr IDA upon changing Es, with substrate and tip controlled with a bipo- tentiostat (Figure 16). In this experiment with a redox couple the tip was held at a given potential and scanned over al- ternating Au and Cr bands connected together with Es changed stepwise at the end of each x-scan. With a Fe(CN)& solution and the tip generating the Fe(II1) species (Figure 16), positive feedback was found at the Au bands for Es values of 0 to -0.5 V. However the positive feedback observed for reduction of the Fe(1II) species a t -0.5 V became smaller as the potential was stepped to more positive values. This be- havior was consistent with the CV behavior of Fe(CN)B3- on an oxidized Cr substrate shown in Figure 15C. In this case the reaction is less reversible on the Cr electrode, except a t the most extreme potentials.
CONCLUSIONS SECM has been used to investigate films of electroactive
polymers. The observed feedback response was a function of the nature of the redox sites in the polymer, the substrate potential, the redox species in solution, and the reaction at the tip electrode. The spatial distribution of polymer on the substrate could be probed by x-y scans, as shown by exper-
employed in studies where the rate of reaction between the substrate species and tip-generated species is finite, compared to the case of pure conductors (infinitely fast reaction) or pure insulators (infinitely slow reaction). A preliminary exami- nation of this case was carried out with electrodes of Cr, where oxidation of the Cr surface decreases the rate of electrode reactions. Further theoretical and experimental studies of this case are under way in this laboratory.
ACKNOWLEDGMENT The authors thank Professer M. S. Wrighton for providing
the PQ monomer and Dr. H. Wohltjen for the donation of the IDA electrode.
LITERATURE CITED (1) Bard, A. J.; Fan, F A . F.; Kwak, J.; Lev, 0. Anal. Chem. 1969, 67,
132. (2) Kwak, J.; Bard, A. J. Anal. Chem. 1969, 67, 1221. (3) Kwak, J.; Bard, A. J. Anal. Chem. 1969, 67, 1794. (4) Kwak, J.; Lee, C.; Bard, A. J. J. Electrochem. Soc. 1990, 737, 1481. (5) Lee, C.; Kwak, J.; Bard, A. J. Proc. Natl. Acad. Sci. U.S.A. 1990,
87, 1740. (6) Newman, J. J. Electrochem. SOC. 1966, 773, 501. (7) Saito, Y. Rev. Polarogr. 1966, 75, 177. (8) Engstrom, R. C.; Meany, T.; Tople, R.; Wightman, R. M. Anal. Chem.
1987, 59, 2005. (9) Engstrom, R. C.; Pharr, C. M. Anal. Chem. 1069, 67, 1099A.
(10) Denisevich, P.; Willman, K. W.; Murray, R. W. J. Am. Chem. SOC. 1981, 703, 4727.
(1 1) Murray, R. W. In Electroanelytlcel Chemistry; Bard, A. J., Ed.; Marcel Dekker: New York. 1984; Vol. 13, and references therein.
(12) Merz, A.; Bard, A. J. J. Am. Chem. SOC. 1976, 100, 3222. (13) Bookbinder, D. C.; Wrighton, M. S. J. Electrochem. SOC. 1963, 730,
1080. (14) Rubinstein. I.; Bard, A. J. J. Am. Chem. Soc. 1960, 702, 6641. (15) Chen, X.; He, P.; Faulkner, L. R. J. Am. Chem. Soc. 1963, 105, 885. (16) Peerce, P. J.; Bard, A. J. J. Electroanal. Chem. Interfacial Elecho-
chem. 1960, 712, 97. (17) Krishnan, M.; Zhang, X.; Bard, A. J. J. Am. Chem. SOC. 1984, 706,
7371. (18) Kwak, J., PhD. Dissertation, The University of Texas at Austin, Texas,
1989. (19) Pickup, P. G.; Murray, R. W. J. Am. Chem. SOC. 1963, 705, 4510. (20) Chidsey, C. E. D.; Murray, R. W. Science 1966. 231, 25. (21) White, H. S.; Kittlesen, G. P.; Wrighton, M. S. J . Am. Chem. SOC.
1984, 706, 5375. (22) Leddy, J.; Bard, A. J. J. Electroanal. Chem. Interfacial Electrochem.
1963, 753, 223. (23) Lee, H. Y.; Adams, R. N. Anal. Chem. 1962, 34 , 1587. (24) White, H. S.; Abruna, H. D.; Bard, A. J. J. Electrochem. SOC. 1962,
729, 265.
RECEIVED for review March 26,1990. Accepted June 18,1990. The support of this research by NSF (CHE 8901450) and The Robert A. Welch Foundation is gratefully acknowledged.