an overview of memscon project: an intelligent wireless sensor
TRANSCRIPT

An overview of MEMSCON project: an intelligent wireless sensor network
for after-earthquake evaluation of concrete buildings
A. Amditis & M. Bimpas ICCS, National Technical University of Athens, Greece
M. Pozzi & D. Zonta DIMS, University of Trento, Italy
Y. Stratakos Advanced Microwave Systems Ltd., Athens, Greece
D. Bairaktaris Bairaktaris and Associates Ltd., Athens, Greece
S. Camarinopolos & S. Frondistou-Yannas RISA Sicherheitsanalysen GmbH, Berlin, Germany
V. Kalidromitis TECNIC S.p.A., Roma, Italy
J. Santana IMEC-NL, Eindhoven, The Netherlands
N. Saillen C2V - Thermo Fisher Scientific, Enschede, The Netherlands
T. Torfs IMEC, Leuven, Belgium
D. Ulieru SITEX 45 SRL, Bucharest, Romania
B. Wenk Memscap SA, Bernin, France
ABSTRACT: Rapid advances in sensing and data transmission techniques, such as Radio Frequency Identification (RFID)
technology, Micro-Electro-Mechanical Systems (MEMS), lower power wireless networking and in computation
give hopes for a new generation of small, inexpensive, networked sensors that can be distributed on civil and
building structures to provide accurate, quantitative information on the physical structure state while in service.
This information can be used to assess the structural condition of the monitored facility and aid decision making
on rehabilitation so that safety can be attained and rehabilitation costs can be reduced. The aim in EU-funded
MEMSCON project is to develop MEMS-based sensors for construction monitoring and to integrate them with a
Decision-Support-System (DSS) that will use the information from the above sensors to aid decisions on both
proactive rehabilitation and on rehabilitation after earthquake damage in reinforced concrete buildings. Although
today the appraisal of seismic damage is almost exclusively based on visual inspection, measuring quantitatively
the response of buildings during and after an earthquake, in terms of acceleration and strain, is an easy task.
However, building owners are somehow reluctant to install permanent sensing systems, both for the high costs of
these devices and for the difficulty of interpreting the data. To overcome these limitations, the MEMCON
project aims to produce small size sensing nodes, integrating MEMS-based sensors and an RFID tag in a single
package that will be attached to reinforced concrete buildings for life-cycle measurements of acceleration and
strain; data that will be transmitted to a remote base station using a wireless interface. These nodes will lead to
an economically sustainable industrial deployment. The DDS, an automatic evaluation software, will process the
measurements and define the condition state, particularly aiming at proactive rehabilitation and rehabilitation
after earthquake damage in buildings. This DSS will accept input from the sensors in order to assess the
structural condition of the monitored building and to select optimal remedial measures.
Keywords: Wireless sensors; After earthquake assessment; Damage detection; Reinforced concrete; Condition
state

1. INTRODUCTION
Structures that are subject to the effects of material aging, design error, overloading, unforeseen
foundation settlement or seismic events can progressively accumulate damage during their operational
life. Periodical assessment is therefore a key step in rationally planning the maintenance needed to
guarantee an adequate level of safety and serviceability.
Nonetheless the economic convenience of installing permanent sensing systems is not easy to
demonstrate (Pozzi et al. 2010): the only way to provide sustainability is to make use of durable and
robust sensors, industrially produced, which can be easily installed during construction and can furnish
information highly relevant to reliability assessment. Modern buildings tend to be overcrowded with
electric wiring for power and signals, and the structural monitoring network must not interfere with
these: nodes should be small and links wireless. Radio Frequency Identification (RFID) and
Micro-Electro-Mechanical-System (MEMS) technologies offer a set of promising tools to develop a
cost-effective system able to fulfil these requirements. The capability of MEMS and wireless
networking for monitoring civil structures is well documented in recent work (Lynch and Loh. 2006,
Zonta et al. 2008, Kruger et al. 2005).
The MEMSCON Project (www.memscon.com) co-funded by the European Community in the 7th
Framework Programme, started in October 2008 and will last three years, involving partners from
seven countries. With this background, the project is devoted to development of a reliable and
cost-efficient monitoring system to be integrated in new Reinforced Concrete (RC) buildings for their
protection against seismic events and settlement. The system includes a wireless network within the
building and a base station linking the building to a remote centre for data interpretation. As outlined
in Figure 1, the network includes sensing nodes measuring strain and acceleration. Strain
measurements are collected at the lowest level of the building, to estimate the vertical column loads
and any variation due to settlement; horizontal acceleration is measured by dedicated nodes at each
level during an earthquake, allowing analysis of the seismic response of the whole structure.
The project has two main tasks: (i) development of the sensing network and (ii) development of
software for remote data processing, structure condition assessment and for maintenance planning.
The products will be validated both in the laboratory and in on-site applications. Task (i) includes
creation of new dedicated instruments for strain and acceleration measurement. Both these devices
will be based on RFID in MEMS (Yusuke et al. 2009), in small-size packages and with ultra-low
power consumption. These nodes have been designed to improve their sensing performance with
respect to that of existing technology (Ferrar et al. 2006).
Production of the definitive nodes is scheduled for end-2010; prototypes have been assembled from
components available on the market, with the necessary design, packaging and programming. These
devices do not now fulfil the target requirements, but they let us investigate the relevant features of the
system. The prototypes were tested in the laboratory and this paper reports on the current stage of the
project.
Figure 1. Scheme of the monitoring system proposed in the MEMSCON project.
2. STRAIN SENSOR WIRELESS NETWORK
2.1. Development of the hardware
The Strain Sensor Wireless Network is devoted to the assessment of settlement and of the activation of
plastic hinges during an earthquake. Sensors will be placed directly on a steel reinforcement bars, at
the corners of each building column.
At this phase of the MEMSCON project, the strain sensors employed are foil gauges available
off-the-shelf, produced by HBM GmbH. Since the gauge is the only component permanently buried in
the concrete, the external electronic interrogation node is connected via a 2-wire cable with an
appropriate connector. This battery-operated device was designed to partially fulfil the basic
MEMSCON specifications: ultra low power consumption (no battery replacement ideally for the
10-year product life), accurate measurement of strain (20 µε resolution), and transmission of
measurements via a wireless network to the base station.
With this target in mind, the hardware developed for the node includes an analog input management
subsystem, with a strain gauge bridge, a programmable amplifier with digital offset and gain
adjustments and a low pass filter: when properly calibrated, this subsystem produces a voltage output
accurately proportional to the strain applied to the sensor. The data transmission makes use of a
Zigbee Wireless Rx/Tx module, and the node also has a microprocessor for global device control,
conversion of analog strain measurements to digital format and a clock that operates continuously for
current date and time with 1 sec resolution (Jiang et al. 2009).
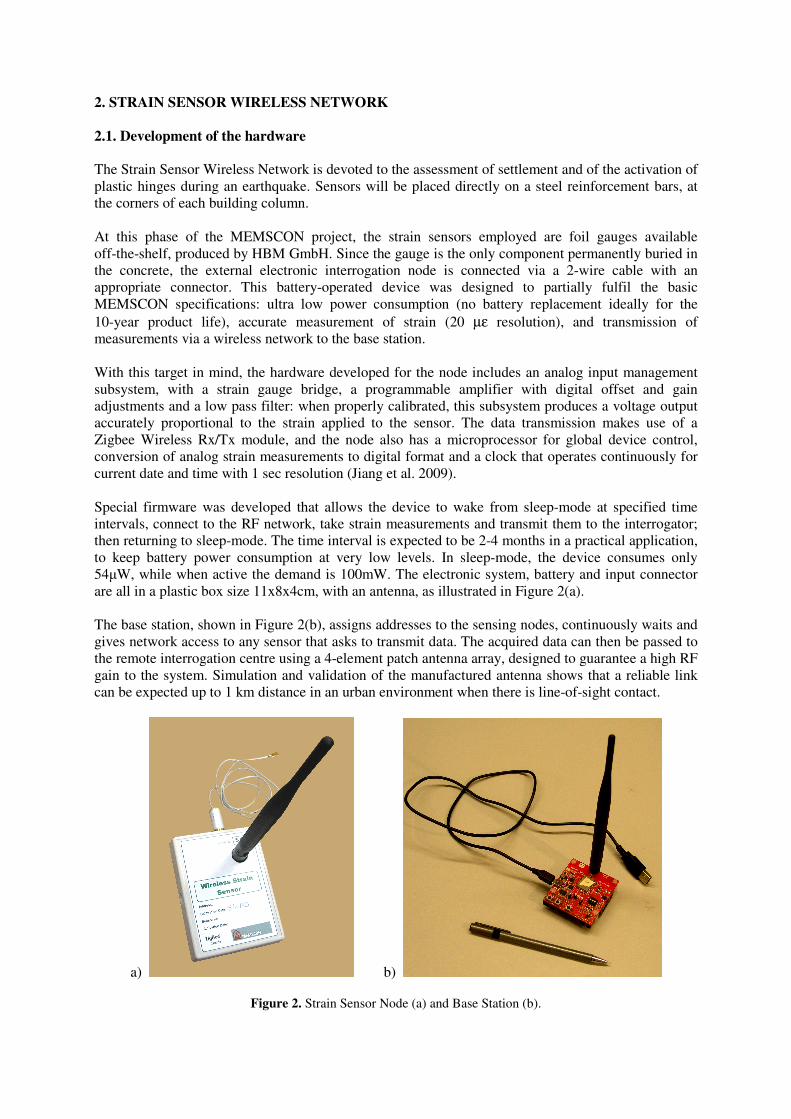
Special firmware was developed that allows the device to wake from sleep-mode at specified time
intervals, connect to the RF network, take strain measurements and transmit them to the interrogator;
then returning to sleep-mode. The time interval is expected to be 2-4 months in a practical application,
to keep battery power consumption at very low levels. In sleep-mode, the device consumes only
54µW, while when active the demand is 100mW. The electronic system, battery and input connector
are all in a plastic box size 11x8x4cm, with an antenna, as illustrated in Figure 2(a).
The base station, shown in Figure 2(b), assigns addresses to the sensing nodes, continuously waits and
gives network access to any sensor that asks to transmit data. The acquired data can then be passed to
the remote interrogation centre using a 4-element patch antenna array, designed to guarantee a high RF
gain to the system. Simulation and validation of the manufactured antenna shows that a reliable link
can be expected up to 1 km distance in an urban environment when there is line-of-sight contact.
a) b)
Figure 2. Strain Sensor Node (a) and Base Station (b).

2.2. Laboratory validation
The validating campaign for the strain-gauge nodes aims at reproducing in the laboratory the
operational conditions of an RC element in a building, up to an extreme scenario. During settlement
and, more often, during an earthquake, the columns can undergo extensive damage including concrete
cracks, cover spalling, crushing and reinforcement yield. As we use the wireless network to estimate
the damage level during or after these events, we must investigate the network performance and
efficiency under the same conditions.
The gauges were attached to ordinary reinforcing bars (steel B450C, 20mm diameter), with a standard
cyanoacrylate adhesive and a silicone protective coating. The installation procedure follows the
instructions by HBM, and so the time required to fasten a gauge is about 30 minutes. In the first
laboratory campaign completed so far, gauge performance was investigated in small specimens, tested
in tensile and compression load cycles. The bars and the complete specimens were also instrumented
with additional strain gauges wired to a high-precision interrogation unit, to compare in real-time the
data flow deriving from the wireless network with reference values. We adopted the same model of
foil gauge, so that the difference between the performance of the wired and wireless systems depends
only on interrogation and data transmission. Before starting the laboratory tests, both the clock and the
voltage sensitivity of the wireless nodes were calibrated, and the sampling frequency set to 3Hz.
The simplest way to check the accuracy of the system is to instrument bare reinforcing bars, not
embedded in concrete; this lets us avoid all the uncertainties related to the random behaviour of
concrete. Therefore two bare bars, 50cm long, were tested in tensile cycles of increasing amplitude, up
to yield and failure. Each bar was instrumented with 1 wired and 2 wireless and gauges, as shown in
Figure 3 (upper graph). The same figure reports the outcome of a full test: the strain recorded by the
wireless (continuous lines) and by the wired system (dashed line) are plotted against time. The
agreement between the two is remarkable, and can be quantified in 20µε, of the same order as the
resolution of the wireless system. Note that, independently of the acquisition mode (wired or wireless),
the gauges become inactive at a strain of about 2300µε, which is a predictable value for the fatigue life
of a glued sensor.
To investigate the performance of the gauges in concrete, three instrumented reinforcing bars were
embedded in a concrete cylinder (length: 50cm, diameter: 13cm). The sensors were placed at the
middle of the bar and protected by a Butyl rubber sealant with aluminium foil. When the concrete was
poured, the mould was weakened, to induce a crack exactly at the instrumented cross section. The
specimens were also instrumented with external sensors to measure the crack opening. Figure 3
(central graph) reports the strain time history, as for the previous test type. Two wireless gauges and
two wired were arranged along the same cross section, where a crack is expected. The test shows that
the sensors keep working up to the same level of strain as that applied to the bare bar, and the
difference between the time histories can be easily attributed to the random behaviour of concrete
under tension. In fact, during the test, asymmetrical cracks appeared along the specimen, which altered
the load eccentricity and, consequently caused variation of the strain along the rebar cross section. The
evolution of the load eccentricity during the test was consistent with the measurements derived by the
external sensors.
The last tests were devoted to analysis of the behaviour of the gauges embedded in concrete under
compression. Three concrete specimens (length: 33cm, diameter: 13cm) were produced, reinforced by
the instrumented bar surrounded by a spiral stirrup to reproduce the effect of confinement. External
long-base strain gauges were also applied to the concrete surface, to record the behaviour of the cover
during the test. The specimens underwent cycles of increasing magnitude, up to spalling of the cover
and crushing of the concrete core. Four gauges were arranged so that 1 wired and 1 wireless sensor
were on both sides of the rebar; Figure 3 (lower graph) shows the measurements obtained against time,
for both systems. The strain, now in compression, again reaches 2000-2500µε, and the agreement is of
the same order as the resolution.

50
0
SG1+
2 WL
rebar
WL10
SG1
10
0
WL12
0 500 1000 1500 2000 25000
500
1000
1500
2000
2500
3000
3500
Time [sec]S
tra
in [ µ
ε]
WL10
WL12
SG1
0 500 1000 1500 2000 25000
500
1000
1500
2000
2500
3000
3500
Time [sec]
Stra
in [ µ
ε]
WL10
WL12
SG1
SG2
concrete
50
0
WLs
wired
86
0
130
rebar
SG1
WL10
SG2
130
33
0
rebar
WL1
SG1
stirrup
0 500 1000 1500 2000-3000
-2500
-2000
-1500
-1000
-500
0
500
Time [sec]
Str
ain
[ µε]
WL1
WL2
SG1
SG2
SG2
WL2
WL12
Figure 3. Outcomes of a test on a bare bar (upper graph), a test on a bar embedded in concrete and tensile test
(central graph) and a test on an embedded bar tested in compression (lower graph).
The network was validated with only two nodes working simultaneously, however additional tests
prove that the network can easily manage many more sensors. The nodes are activated by a switch and
continuously record and send measurements to the base station, which is connected to a PC via USB.
The measurements were acquired using Microsoft Hyperterminal and post-processed via Mathworks
Matlab. The whole system is user-friendly and stores strain data in a database with a timestamp and
sensor identification tag. Over the entire campaign, the network had no problem in data acquisition or
transmission.
To better couple with the needs of in-field applications, the sampling frequency can be also set by the
user, and the strain data can be sent on demand.
3. THE ACCELEROMETER WIRELESS NETWORK
3.1. Development of the hardware
The accelerometers will be placed on each level of the building to be monitored, recording horizontal
vibration in both orthogonal directions as well as torsion components. The network will be
automatically activated during an earthquake, so that it can follow completely the seismic response
and consequently estimate damage.
Each accelerometer node measures, records and transmits over the RF network 3-axis acceleration
data, using a MEMS-based sensor commercially available from Analog Devices Inc. (Selvarajan
2003). This is a completely digital output device that communicates with the system through an SPI
interface having a serial EPROM memory and a micro vibration sensor. The firmware developed
allows device wake-up upon activation of the micro vibration sensor, fast setup of the node
(accelerometer and Zigbee transceiver) from the microprocessor, and data recording in the EPROM.
The power consumption of the unit is similar to the strain sensor unit. The micro sensor acts as
hardware trigger that activates the node only when substantial vibration (above 20mg) occurs. Below
this level, the node remains dormant.
To reduce energy consumption, special algorithms were also developed to minimize unit activation by
false alarms (vibration caused by events other than earthquakes). Once activated by sufficiently strong
vibration, the node acquires acceleration data for a maximum period of 30 seconds, estimating every 5
seconds the amplitude of the vibration along each of the 3 axes. Only if that amplitude is significant
(according to a software threshold defined by the user) does the node consider the signal, transmitting
data to the base station. The combination of these hardware and software thresholds minimizes the
power consumption of the node, avoiding transmission of signals that are irrelevant for seismic
analysis: a battery lifespan of years can be expected.
3.2. Laboratory validation
To test the performance of the network, three wireless nodes were mounted on a shaking table, back to
back with high precision wired piezoelectric seismic accelerometers. The nodes underwent several
vibration tests, with excitation of various shape, frequency and amplitude. The aim of the campaign
was to characterize the dynamic response of the wireless sensing system and to investigate its
accuracy and reliability under conditions similar to those experienced in the field during a seismic
event.
Two types of test were performed: in the “calibration tests”, the nodes were mounted in parallel on the
table, and each axis was tested with harmonic excitation at frequencies in the range 1-20Hz, at
amplitude ranging from +/-1m/s2 to +/-4m/s
2. This sequence allowed calibration of the sensitivity of
each node axis and tuning of the internal clock. The resulting response of the wireless network has a
maximum discrepancy respect to the wired system of the order of 3%.
Then, to better simulate operational conditions, the wireless sensors were mounted on a two-storey
metal frame fixed to the shaking table, again back to back with the wired instruments, as shown in
Figure 3 (lower picture). One sensor was placed on the table, to record the “ground” vibration, and the
other two at the upper floors, to measure the frame response. We excited the frame both with
frequency-sweeps and with seismic-like waves. Figure 4 (upper graph) shows the comparison between
the vibrations recorded by the wired and the wireless systems, at each floor, during a sweep.
Agreement is very good, of the same order as the resolution of the wireless system, which is 18mg
(=0.18m/s2).
This kind of test also allows an estimate of the mechanical properties of the structure employed in the
tests (i.e. the metal frame) that corresponds to the building potentially damaged during an earthquake,

e.g. via classical modal testing (Ewins, 2001). Figure 4 (lower graph) reports the Frequency Response
Functions between the ground excitation and the vibration on each floor, as estimated by the wired and
wireless sensors. This graph allows identification of the resonance and anti-resonance frequencies of
the structure, which remain linear during the tests. The agreement is once again good, especially above
2Hz.
The network easily manages several nodes working simultaneously, because the recorded vibration
only lasts a maximum time of half a minute. As for the strain gauge nodes, the accelerometer node is
activated by a switch, and measurement acquisition is automatically started when the node moves. In
the configuration adopted during the laboratory campaign, the data are stored in a database, with
timestamp, sensor and axis identification tags, using Hyperterminal and Matlab. A limit of the present
configuration of the sensing network is that the activation criterion acts locally on each node, thus in
general the whole network does not wake up simultaneously.
5 10 15 20 25-10
-5
0
5
10
Acc [
m/s
2]
Ground Floor
5 10 15 20 25-10
-50
510
Acc [
m/s
2]
First Floor
5 10 15 20 25-10
-50
510
Time [sec]
Acc [
m/s
2]
Second Floor
WIRELESS accelerometer
WIRED accelerometer
Reference
sensor
WL sensor
1 2 3 4 5 6 710
-2
100
102
FR
F [
-]
First Floor
1 2 3 4 5 6 710
-2
100
102
freq. [Hz]
FR
F [
-]
Second Floor
Figure 4. Example of a frequency-sweep test mounting the sensors on the metal frame: time histories (upper
graph), frequency response functions (lower graph) and appearance of the instrumented metal frame on the
shaking table (lower picture)
4. CONCLUSIONS AND FUTHER STEPS
Both the strain gauge and the accelerometer networks proved to be reliable under the operational
conditions to be expected in a field application. The performance in strain measurement allowed us to
follow the onset of yield in the reinforcing steel, which is usually a limitation for sensors applied to
civil structures. This is suitable for assessment of settlement. In the next few months, additional tests
will be done on full-scale column specimens, to investigate the behaviour of a larger wireless network
in a more complex environment and in a seismic scenario.
The accelerometer network proved to be reliable in the frequency range relevant to seismic analysis,
with sufficient accuracy, and several tri-axial nodes can be employed simultaneously. Data acquisition
is triggered automatically when a vibration threshold is exceeded, and this allows long-term
monitoring, recording all relevant seismic events.
The final products of the MEMSCON project, expected by the end of 2010, will try to improve on this
performance. In particular, the next steps in development of the sensing nodes will reduce the
packaging size, improve the measurement range and reduce power consumption. Further development
of the accelerometer nodes will be related to resolution improvement, to real-time synchronization of
the nodes to allow acquisition of a reliable time-stamp years after installation, and adoption of a more
sophisticated algorithm to reduce the number of false alarms and cause simultaneous wake up of the
whole network.
The measurements provided by the sensing networks are conceived for post-processing by a Decision
Supporting System (DSS) which will automatically assess the condition state and suggest an optimal
maintenance strategy for the building. This DSS and its interface with the measurement flow are now
under development.
AKCNOWLEDGEMENT
The MEMSCON project is funded by the European Community with Grant Agreement n. CP-TP 212004-2. The
authors wish to thank all those involved in the project and particularly Davide Trapani from UniTN, Stavros
Tsakirhs from ICCS and Nicolas Bertsch from MEMSCAP.
REFERENCES
Ewins, D.J. (2001). Modal Testing, Wiley.
Ferrar, C.R., Park, G., Allen, D.W., Todd, M. D.(2006). “Sensor Network Paradigms for Structural Health
Monitoring”, Journal of Structural and Health Monitoring, 13 (1), 210-225, 2006.
Jiang, X.-D. Y.-L. Tang and Y. Lei. (2009). “Wireless sensor networks in Structural Health Monitoring based on
ZigBee technology”, Proc. of ASID Conference 2009. pp 449–452.
Kruger, M., C.U. Grosse and P.J. Marron, (2005). “Wireless Structural Health Monitoring Using MEMS”, Key
Engineering Materials 293-294: 625-634.
Lynch, J.P. and K.J. Loh. (2006). “A summary review of wireless sensors and sensor networks for structural
health monitoring,” The shock and vibration digest, 38(2):91-128.
Pozzi M., D. Zonta, W. Wang and G. Chen. (2010). “A framework for evaluating the impact of structural health
monitoring on bridge management”. Proc. "5th International Conf. on Bridge Maintenance, Safety and
Management (IABMAS2010)", Philadelphia, 11-15 Jul 2010.
Selvarajan, A. (2003). “MEMS and photonics technologies for structural health monitoring.” SPIE: Smart
Materials, Structures, and Systems, 12-14 December, Bangalore, India, Vol.5062, 10-17.
Yusuke, I., S. Suzuki, H. Okamoto, H. Murakami, H. Asama, S. Morishita, T. Mishima, X. Lin and H. Itoh.
(2009). “Force sensor system for structural health monitoring using passive RFID tags”, Sensor Review,
29(2): 127-136.
Zonta, D., M. Pozzi, and P. Zanon. (2008). “Managing the Historical Heritage Using Distributed Technologies,”
International Journal of Architectural Heritage, 2:200-225.