an iterative calculation to derive extinction-to-backscatter ratio based on lidar measurements
TRANSCRIPT

ARTICLE IN PRESS
Journal of Quantitative Spectroscopy &
0022-4073/$ - se
doi:10.1016/j.jq
�CorrespondE-mail addr
Radiative Transfer 109 (2008) 1187–1195
www.elsevier.com/locate/jqsrt
An iterative calculation to derive extinction-to-backscatter ratiobased on lidar measurements
Chih-Wei Chianga,b,�, Subrata Kumar Dasb, Jan-Bai Neeb
aResearch Center for Environmental Changes, Academia Sinica, Nan-Kang, TaiwanbDepartment of Physics, National Central University, Chung-Li, Taiwan
Received 1 May 2007; received in revised form 12 October 2007; accepted 16 October 2007
Abstract
The aerosol optical thickness (AOT) is an important parameter for understanding the radiative impact of aerosols. AOT
based on lidar measurements is often limited by its finite detection range. In this paper, we have reported a method of
fitting and iterative calculation to derive the extinction profile of background aerosols from 0 to 30 km at 532 nm, which is
virtually the AOT of the entire atmosphere. The mean extinction derived from this method at the ground level tallies with
visibility measurement and it is also consistent with the sun-photometer data, within experimental error. These data have
been further treated to study the dust cases. For most of the cases, transmission losses were determined to estimate the
extinction as well as lidar ratio. The result of the analysis shows that for background aerosols, a mean lidar ratio of
47715 sr was found. For dust layers, a mean lidar ratio of 44719 sr and an optical thickness of 0.5370.49 were
determined at 532 nm.
r 2007 Elsevier Ltd. All rights reserved.
Keywords: Lidar ratio; Aerosols; Dust; Depolarization ratio; Optical thickness
1. Introduction
The capability of tracing the vertical profiles of background aerosol/dust makes lidar an important tool foratmospheric research. Lidar measurements consist of deriving the backscattering ratios of molecules, aerosols,and all materials presented in the path that laser travels. To derive the extinction coefficient (ka) ortransmission (T) from the backscattering coefficients (ba) for different aerosols, such as pollutants and dust, anempirical factor known as extinction-to-backscatter or lidar ratio (Sa) is required. Accurate lidar ratio forbackground aerosols/dust is very important for estimating the optical properties of background aerosols/dust.This ratio depends on the shape, size distribution and, the refractive index of the aerosol particles as well as onthe lidar wavelength (l) [1–3]. The lidar ratio is also a useful parameter to understand factors such astransmission and reflection at the interested l. Without accurate estimation of lidar ratio and optical depth ofbackground aerosols/dust, it is difficult to understand their radiative impact on the atmosphere.
e front matter r 2007 Elsevier Ltd. All rights reserved.
srt.2007.10.011
ing author. Research Center for Environmental Changes, Academia Sinica, Nan-Kang, Taiwan.
esses: [email protected] (C.-W. Chiang), [email protected] (S.K. Das),
.edu.tw (J.-B. Nee).

ARTICLE IN PRESSC.-W. Chiang et al. / Journal of Quantitative Spectroscopy & Radiative Transfer 109 (2008) 1187–11951188
There are a few problems related with the derivation of lidar ratio. First, lidar measurement is range limitedbecause of system overlapping problem between the laser beam and the field view of the telescope. Second, thelidar equation is mathematically unsolvable due to its dependence on the two unknown variables k and b forboth molecules and particles. The molecular scattering variables kr and br can be determined either from thestandard atmospheric model or from meteorological data of temperature and pressure. But the aerosolscattering variables ka and ba are still unknown, and to solve lidar equation some kind of relation is requiredbetween these two unknown parameters. This relation is known as extinction-to-backscatter ratio, commonlyknown as lidar ratio. There are some methods to calculate lidar ratio such as the combination of independentbackscattering signals of Raman lidar and elastic-backscatter lidar [4], and also by using high spectralresolution lidar which provides independent measurements of scattering properties for aerosols and molecules[5]. But the former method is limited due to the weakness of Raman backscatter signals and the latter arecomplex to use. To overcome this limitation, we have reported a numerical and fitting method to determinethe lidar ratio from the lidar backscatter at l ¼ 532 nm. The received backscatter is due to Mie scattering.
In the measurement location, background aerosol typically consists of pollutants, sea salts, and otherunidentified aerosol types which are in trace quantities. During the observation made by lidar, the mineraldust is only traced a couple of times during the spring season (March–May). Therefore, we have chosen totreat dust cases separately from the background cases. It is noted, however, that dust co-exists with thebackground aerosol and, thus, in the derivation of dust properties, knowledge about the background aerosolis also needed.
In this paper, we have discussed a method to derive the extinction of background aerosol and later used it forstudying dust. We have also derived lidar ratios and optical thicknesses for both background aerosols and dustevents over Chung-li (24.581N, 121.101E, altitude 167m, MSL) during the period of 2002–2004. This paper isorganized in the following manner: in Section 2, a brief description of the system and methodology arepresented. In Section 3, there will be results and discussion, and finally in Section 4 we will summarize our result.
2. Instrument and methodology
2.1. Lidar system
The lidar measurements were carried out in Chung-li, Taiwan, by using a vertically pointed Nd:YAG lidaroperating at l ¼ 532 nm. The vertical resolution of the measurements is 24m, and each measured verticalprofile was obtained by integrating over 1000 transmitted pulses for a time interval of 33 s. Due to the biaxialconfiguration of the transmitter and receiver system, the lowest part of the atmosphere cannot be monitored.Rather, the field of view of the receiving telescope starts to overlap with the transmitted laser beam at 0.25 kmaltitude (corresponding to 0.417 km from the mean sea level), and the full overlap is obtained at 0.7 km fromthe instrument. The detailed description of our lidar system can be found in Nee et al. [6]. The optical powermeasured by lidar is proportional to the signal backscattered by particles and molecules present in theatmosphere. The lidar equation for the elastic backscattering signals by molecules and aerosols can beexpressed as
PRðzÞ ¼ PLAT
z2ðbrðzÞ þ baðzÞÞT
2, (1)
where PR(z) is the total signal due to molecules and particles scattering received from the height range z, PL isthe laser output energy, AT is a calibration factor that is constant for a given lidar system, T2 is the totalround-trip atmospheric transmittance, and br and ba are volume molecule and particulate backscatteringcoefficient, respectively. The backscattering coefficient of molecules is derived from the molecularconcentration measured by radiosonde multiplied by total Rayleigh scattering cross section. The backscattersolution to the above lidar equation based on Fernald’s method [7] can be written as
brðzÞ þ baðzÞ ¼PRðzÞz
2 exp �2ðSa � SrÞR z
z1brðzÞdz
h i
PRðz1Þz21=ðbrðz1Þ þ baðz1ÞÞ � 2Sa
R z
z1PRðzÞz2 exp �2ðSa � SrÞ
R z
z1brðzÞdz
h idz
, (2)

ARTICLE IN PRESSC.-W. Chiang et al. / Journal of Quantitative Spectroscopy & Radiative Transfer 109 (2008) 1187–1195 1189
where Sr is molecular lidar ratio (8p/3) and Sa is aerosol lidar ratio. Calculation by using Eq. (2) starts fromreference range z1, which is taken at from upper height towards lower height z. For the present studies onlower atmosphere, the initial condition for the upper height z1 is set at 5 km with the reference backscatteringratio (BR) ((br+ba)/br) as 1.05, based on the earlier study [8].
The volume particle extinction coefficient ka can be defined as
ka ¼ Sa ba. (3)
The aerosol optical thickness AOTlidar and transmission Tx of target (where subscript x represents eitherbackground aerosols ‘‘a’’ or dust ‘‘d’’, depending on the case) can be determined by using Eqs. (4) and (5) as
AOTlidar ¼
Z ztop
zbase
kxðzÞdz ¼
Z ztop
zbase
SxðzÞbxðzÞdz, (4)
Tx ¼ expð�AOTlidarÞ, (5)
where the other symbols have their usual meaning. In addition to backscattered power, a so-called lidardepolarization ratio (DR) was measured by recording the lidar returns for perpendicular and parallelpolarizations. Depolarization facilitaties the identification of different particle types and can be defined as
d ¼I?
Ik, (6)
where I? and Ik are the perpendicular and the parallel intensities relative to the outgoing laser beam,respectively. DR is zero for spherical particles and deviates from zero for nonspherical particles such asmineral dust.
2.2. Derivation of lidar ratio
2.2.1. Lidar ratio for background aerosols
In the present study background aerosols are defined by conditions of backscattering and DRs being smallerthan the values of 5 and 0.1, respectively. There are 126 cases of background aerosol reported during theperiod of 2002–2004. Here 126 cases refer to the lidar that has been operated for 126 days during this period.For each case, the data corresponding with conditions of background aerosol mentioned above wereintegrated. Due to lack of accurate lidar measurements below 0.7 km where aerosols loading is high, theAOTlidar derived from lidar extinction data (by using Eq. (4)) is incomplete and thus different from thatmeasured by a sun-photometer [8]. The sun-photometer (Aerosol Robotic Network, ‘‘AERONET’’) used hereprovides spectral distribution of aerosol optical thickness (AOTsun) for several l bands ranging from 0.3 to1.2 mm [9]. In the present study, AOTsun was determined by data at 440 and 670 nm, which have been furtherinterpolated linearly to obtain the equivalent AOTsun at 532 nm.
The lidar ratio critically affects the AOTlidar. Deriving AOTlidar below 0.7 km requires extinction in thisregion, which is calculated from the backscattering coefficient based on Eq. (3). As the lidar ratio is impossibleto derive below 0.7 km due to the poor data because of incomplete signal in this region discussed above, aniterative fitting method has been developed to overcome this problem. This method consists of three steps. Instep 1, we start with a constant lidar ratio as a trial to calculate the complete extinction profile by using Eq. (3).In step 2, a polynomial function is fitted to the extinction profile derived in step 1 and used to extrapolate theaerosol extinction coefficient to the ground level. In step 3, the complete aerosol extinction coefficient thusobtained is integrated from ground to 30 km altitude to obtain the AOTlidar, which is then compared with thecolumn-integrated AOTsun obtained from the AERONET sun-photometer. The difference in the AOT valuesis used to select a new value for the lidar ratio that would lead to a better agreement, and this procedure isrepeated until the difference between AOTlidar and AOTsun is smaller than 0.01. The iteration convergesquickly if we set the initial lidar ratio as 50 sr for analyzing our data. The result of this treatment forbackground aerosols is shown in the extinction profile in Fig. 1. From Fig. 1b we can infer that the polynomialfunction of degree 8 fitted well with the lidar data for the height range of 0.7–30 km. The inserted small box inthe figure shows the detailed function of extinction for the height range of 0–5 km.

ARTICLE IN PRESSC.-W. Chiang et al. / Journal of Quantitative Spectroscopy & Radiative Transfer 109 (2008) 1187–11951190
From the 3 years of observations (2002–2004) of 126 cases, we have estimated the height of mixing layersduring daytime by using the Holzworth method [10]. Statistics shows that the mean height of mixing layer is1.5 km. The standard deviation of the lidar backscatter signals method [11] has been employed to determinethe aerosols turbulence layer during nighttime for all the 126 cases. The beauty of this technique is that here itis not necessary to consider the backscattering signals within the partial overlap region as it is relative ratherthan absolute measurement so that the overlap function can be canceled out. Results of the analysis show thatthe mean aerosols turbulence layer is at 0.57 km. So we can conclude that the aerosols can at least bedistributed above 0.57 km even in the nighttime over our location. Here we have assumed 0.7 km as anaerosols layer, and later this layer will be treated for studying the extinction, by applying the extrapolationmethod which is reasonable. To validate our assumption, the extrapolation result has been compared with thein-situ measurement which shows excellent agreement and this will be discussed later.
These calculations will be useful for deriving the atmospheric extinction produced by background aerosolsunder most conditions. However, under special conditions of a dust storm, the extinction is not valid. We willtherefore need to consider a dust storm as a special case and hence its analysis has been done by a separatemethod discussed below.
2.2.2. Lidar ratio for dust events
Dust often appears as a confined layer. Under such conditions a method has been developed to derive thetransmission of that layer. A similar method has been proposed for cirrus clouds [4,12,13]. In principle,attenuation (scattering and absorption loss) in the aerosols or cloud layers can be determined by comparingthe backscattering signals beneath and above the layer shown in Fig. 2b. The lidar signal will be attenuatedbecause of absorption or scattering loss in the layer. The transmission losses of signal at 532 nm through thatlayer are mainly contributed by molecules, aerosols, and dust within the layer which can be separately
Fig. 1. (a) Extinction coefficient profile of mean background aerosol (solid line). Gray areas represent the standard deviation magnitude.
(b) Fitting of the extinction curve based on the numerical method suggested in the paper. The function (dotted line) that fits the
experimental curve for 0.7–30km is a polynomial function of degree 8. The polynomial function below 5km and linear extrapolation to
the ground level is shown in the small inserted box.
ARTICLE IN PRESSC.-W. Chiang et al. / Journal of Quantitative Spectroscopy & Radiative Transfer 109 (2008) 1187–1195 1191
expressed as transmission factor in lidar Eq. (1): T2r � T2
a � T2d, where r, a, and d are for molecule, aerosol,
and dust, respectively. Comparing the signals between the top and bottom of the dust layer we can retrievetransmission through the dust layer. Out of the three transmission terms, only dust transmission is unknownas Ta can be calculated based on previous derivation and Tr estimation is based on Rayleigh scattering theory.The transmissions through dust layer are given by Eqs. (7) and (8) as
Td ¼Ptop
Pbase
� �1=2
, (7)
td ¼ � lnðTdÞ, (8)
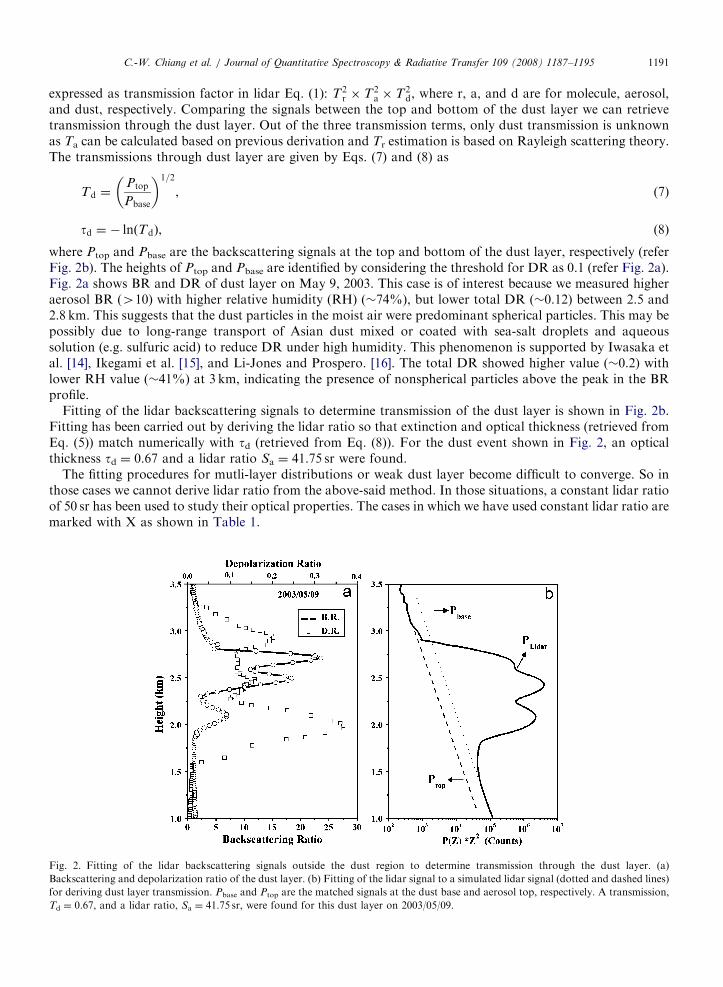
where Ptop and Pbase are the backscattering signals at the top and bottom of the dust layer, respectively (referFig. 2b). The heights of Ptop and Pbase are identified by considering the threshold for DR as 0.1 (refer Fig. 2a).Fig. 2a shows BR and DR of dust layer on May 9, 2003. This case is of interest because we measured higheraerosol BR (410) with higher relative humidity (RH) (�74%), but lower total DR (�0.12) between 2.5 and2.8 km. This suggests that the dust particles in the moist air were predominant spherical particles. This may bepossibly due to long-range transport of Asian dust mixed or coated with sea-salt droplets and aqueoussolution (e.g. sulfuric acid) to reduce DR under high humidity. This phenomenon is supported by Iwasaka etal. [14], Ikegami et al. [15], and Li-Jones and Prospero. [16]. The total DR showed higher value (�0.2) withlower RH value (�41%) at 3 km, indicating the presence of nonspherical particles above the peak in the BRprofile.
Fitting of the lidar backscattering signals to determine transmission of the dust layer is shown in Fig. 2b.Fitting has been carried out by deriving the lidar ratio so that extinction and optical thickness (retrieved fromEq. (5)) match numerically with td (retrieved from Eq. (8)). For the dust event shown in Fig. 2, an opticalthickness td ¼ 0.67 and a lidar ratio Sa ¼ 41.75 sr were found.
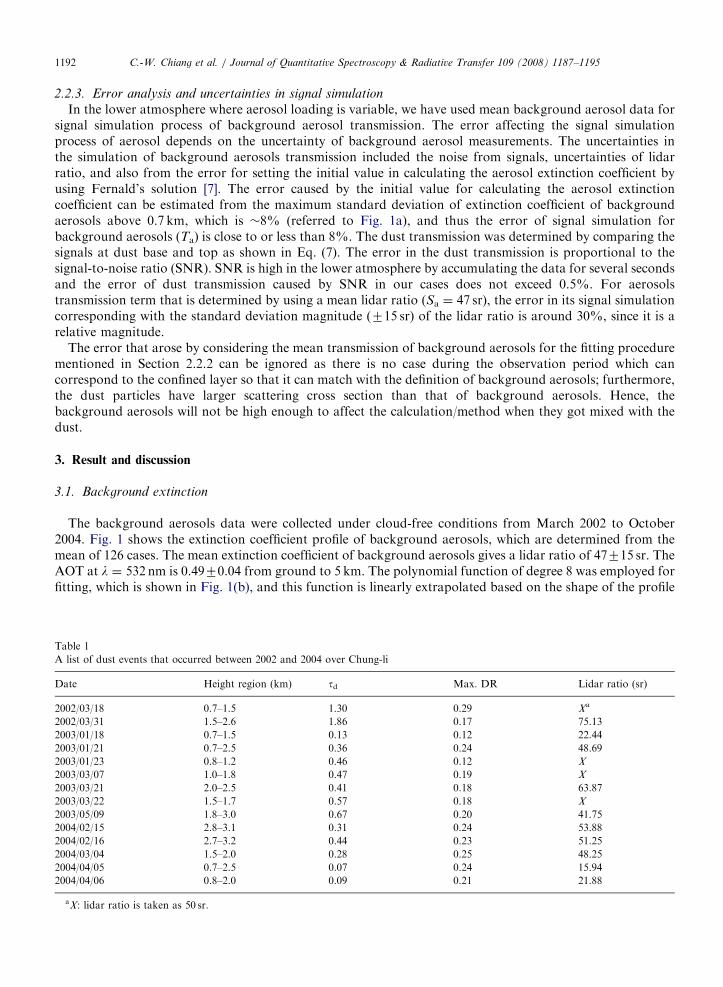
The fitting procedures for mutli-layer distributions or weak dust layer become difficult to converge. So inthose cases we cannot derive lidar ratio from the above-said method. In those situations, a constant lidar ratioof 50 sr has been used to study their optical properties. The cases in which we have used constant lidar ratio aremarked with X as shown in Table 1.
Fig. 2. Fitting of the lidar backscattering signals outside the dust region to determine transmission through the dust layer. (a)
Backscattering and depolarization ratio of the dust layer. (b) Fitting of the lidar signal to a simulated lidar signal (dotted and dashed lines)
for deriving dust layer transmission. Pbase and Ptop are the matched signals at the dust base and aerosol top, respectively. A transmission,
Td ¼ 0.67, and a lidar ratio, Sa ¼ 41.75 sr, were found for this dust layer on 2003/05/09.
ARTICLE IN PRESSC.-W. Chiang et al. / Journal of Quantitative Spectroscopy & Radiative Transfer 109 (2008) 1187–11951192
2.2.3. Error analysis and uncertainties in signal simulation
In the lower atmosphere where aerosol loading is variable, we have used mean background aerosol data forsignal simulation process of background aerosol transmission. The error affecting the signal simulationprocess of aerosol depends on the uncertainty of background aerosol measurements. The uncertainties inthe simulation of background aerosols transmission included the noise from signals, uncertainties of lidarratio, and also from the error for setting the initial value in calculating the aerosol extinction coefficient byusing Fernald’s solution [7]. The error caused by the initial value for calculating the aerosol extinctioncoefficient can be estimated from the maximum standard deviation of extinction coefficient of backgroundaerosols above 0.7 km, which is �8% (referred to Fig. 1a), and thus the error of signal simulation forbackground aerosols (Ta) is close to or less than 8%. The dust transmission was determined by comparing thesignals at dust base and top as shown in Eq. (7). The error in the dust transmission is proportional to thesignal-to-noise ratio (SNR). SNR is high in the lower atmosphere by accumulating the data for several secondsand the error of dust transmission caused by SNR in our cases does not exceed 0.5%. For aerosolstransmission term that is determined by using a mean lidar ratio (Sa ¼ 47 sr), the error in its signal simulationcorresponding with the standard deviation magnitude (715 sr) of the lidar ratio is around 30%, since it is arelative magnitude.
The error that arose by considering the mean transmission of background aerosols for the fitting procedurementioned in Section 2.2.2 can be ignored as there is no case during the observation period which cancorrespond to the confined layer so that it can match with the definition of background aerosols; furthermore,the dust particles have larger scattering cross section than that of background aerosols. Hence, thebackground aerosols will not be high enough to affect the calculation/method when they got mixed with thedust.
3. Result and discussion
3.1. Background extinction
The background aerosols data were collected under cloud-free conditions from March 2002 to October2004. Fig. 1 shows the extinction coefficient profile of background aerosols, which are determined from themean of 126 cases. The mean extinction coefficient of background aerosols gives a lidar ratio of 47715 sr. TheAOT at l ¼ 532 nm is 0.4970.04 from ground to 5 km. The polynomial function of degree 8 was employed forfitting, which is shown in Fig. 1(b), and this function is linearly extrapolated based on the shape of the profile
Table 1
A list of dust events that occurred between 2002 and 2004 over Chung-li
Date Height region (km) td Max. DR Lidar ratio (sr)
2002/03/18 0.7–1.5 1.30 0.29 Xa
2002/03/31 1.5–2.6 1.86 0.17 75.13
2003/01/18 0.7–1.5 0.13 0.12 22.44
2003/01/21 0.7–2.5 0.36 0.24 48.69
2003/01/23 0.8–1.2 0.46 0.12 X
2003/03/07 1.0–1.8 0.47 0.19 X
2003/03/21 2.0–2.5 0.41 0.18 63.87
2003/03/22 1.5–1.7 0.57 0.18 X
2003/05/09 1.8–3.0 0.67 0.20 41.75
2004/02/15 2.8–3.1 0.31 0.24 53.88
2004/02/16 2.7–3.2 0.44 0.23 51.25
2004/03/04 1.5–2.0 0.28 0.25 48.25
2004/04/05 0.7–2.5 0.07 0.24 15.94
2004/04/06 0.8–2.0 0.09 0.21 21.88
aX: lidar ratio is taken as 50 sr.

ARTICLE IN PRESSC.-W. Chiang et al. / Journal of Quantitative Spectroscopy & Radiative Transfer 109 (2008) 1187–1195 1193
above 0.7 km. This extrapolation gives a mean extinction coefficient of 0.40 km�1 at ground level, which is inagreement with the mean extinction coefficient measured by visibility (0.3770.034 km�1) on ground. Thevisibility measurement was at the ground level by assuming horizontal homogeneity. We may reasonablyassume that the visibility extinction can represent the atmospheric extinction near ground level. The extinctioncoefficient can be derived from visibility (V) data through the Koschmeider relationship given as V ¼ 3.91/k (kis the extinction coefficient) [17].
3.2. Dust cases
In the spring season, the dust storms mainly occur over East Asia and these dust events are commonlyknown as Asian dust. The main sources of this storm are from the Taklamakan desert in west China and Gobidesert in Mongolia. These dust events mainly burst when the surface is heated up due to the dry weathercondition and strong winds sweep over the deserts and surrounding areas, which helps their transportation.Many studies have been done in the past by using lidar to measure the dust storm along with their transportpath from the source region to China [18], Japan [19,20], and Korea [21]. During spring time, the dust storm ismainly transported over Chung-li region by a strong continental high-pressure system near Taiwan [22,23].Over this location, the transport of dust from the desert region of Northern China is confirmed by HYSPLITcalculations (Hybrid Single-Particle Lagrangian Integrated Trajectory). The back-trajectory calculations areshown in Fig. 3 by tracing 72 h backward analysis. Lidar measurements at Chung-li indicate that all the dustevents have a DR greater than 0.1.
Fig. 3. Results of 72 h back trajectories displaying the sources and height of a dust storm. The symbols J, n, and & show the events on
2003/01/18, 2004/04/05, and 2004/04/06, respectively.

ARTICLE IN PRESS
Table 2
Lidar ratio (Sa) of dust aerosol for wavelengths between 490 and 550nma
Lidar ratio (sr) Method Source location
4278 Surface measurement New Mexico
3575 Micropulse lidar Africa
3779 Micropulse lidar Africa
4579 Lidar E. Africa; Arabia
4178 Lidar Africa
5375 Raman lidar Sahara Desert
4675 Raman lidar Gobi Desert
5375 In situ measurement Asia
5172 Raman lidar Africa
46710 Raman lidar Asia
4274 Aerosol Robotic Network Bahrain; Nigeria; Spain; Saudi Arabia
aCattrall et al. [24].
C.-W. Chiang et al. / Journal of Quantitative Spectroscopy & Radiative Transfer 109 (2008) 1187–11951194
The lidar ratios retrieved from the method discussed in Section 2.2.2 are listed in Table 1. A mean value of44719 sr was derived, which is consistent with most literature values presented in Table 2. Of all cases, thethree events that occurred on 2003/01/18 and 2004/04/05–06 showed smaller lidar ratios of 16–22 sr (refer toTable 1). These smaller lidar ratios may be related with marine aerosols, in accordance with the backwardtrajectories studies shown in Fig. 3. In these cases the air masses were transported mainly over the oceanregion. Cattrall et al. [24] showed that oceanic aerosols have lidar ratios lying between 24 and 39 sr. Miecalculations [25] for large marine particles indicate that the lidar ratios are in the range of 19–28 sr atl ¼ 532 nm [2]. Our observations also support those results.
4. Concluding remarks
Extinction-to-backscatter ratio (lidar ratio) and optical thickness of aerosols and dust layers have beenderived based on lidar measurements and iterative calculation. This method is suitable for calculatingextinction of aerosol from ground, even though the measurements are not available below the overlap region.The derived method will reduce the uncertainty for analyzing lidar data by assuming the lidar ratio as a fixedvalue, which has been adopted by many researchers for different cases.
For our study, the lidar measurements covered height regions above 0.7 km. Between ground and 0.7 km,extinction has been derived by an iterative calculation. The result is based on the polynomial function fittingthat matches with the optical thickness retrieved from sun-photometer data. The fitting was then linearlyextrapolated to ground level and compared with ground extinction derived from visibility data.
The mean lidar ratio (44 sr) for dust layer is found to be smaller than the background aerosols (47 sr). Someof the events show greater depolarization ratios (40.1) but smaller lidar ratios (o23 sr), which may be due tothe marine aerosols based on HYSPLIT back-trajectory calculations. On the basis of the foresaid methoddiscussed in the paper, lidar ratio can be determined effectively, which can be used to study the aerosol opticalproperties. These studies will help us for better understanding aerosols’ effects on environment and climatechange.
Acknowledgments
This research is supported by the National Science Council of ROC by Contract no. NSC 94-2111-M-008-003. The authors gratefully acknowledge the NOAA Air Resources Laboratory (ARL) for the provision of theHYSPLIT transport and dispersion model and/or READY website (http://www.arl.noaa.gov/ready.html)used in this publication and the Center for Space and Remote Sensing Research (CSRSR) for the provision ofthe sun-photometer data.

ARTICLE IN PRESSC.-W. Chiang et al. / Journal of Quantitative Spectroscopy & Radiative Transfer 109 (2008) 1187–1195 1195
References
[1] Ansmann A, Riebesell M, Wandinger U, Weitkamp C, Voss E, Lahmann W, et al. Combined Raman elastic-backscatter LIDAR for
vertical profiling of moisture, aerosol extinction, backscatter, and LIDAR ratio. Appl Phys 1992;B55:18–28.
[2] Ackermann J. The extinction-to-backscatter ratio of tropospheric aerosol: a numerical study. J Atmos Oceanic Technol
1998;15:1043–50.
[3] Barnaba F, Gobbi GP. Modeling the aerosol extinction versus backscatter relationship for lidar applications: maritime and
continental conditions. J Atmos Oceanic Technol 2004;21:428–42.
[4] Ansmann A, Wandinger U, Riebesell M, Weitkamp C, Michaelis WW. Independent measurement of extinction and backscatter
profiles in cirrus clouds using a combined Raman elastic-backscatter lidar. Appl Opt 1992;31:7113–31.
[5] Shipley ST, Tracy DH, Eloranta EW, Trauger JT, Sroga JT, Roesler FL, et al. High spectral resolution lidar to measure optical
scattering properties of atmospheric aerosols. 1. Theory and instrumentation. Appl Opt 1983;22:3716–24.
[6] Nee JB, Lien CN, Chen WN, Lin CI. Lidar detection of cirrus cloud in Chung-Li (24.961N, 121.191E). J Atmos Sci 1998;55:2249–57.
[7] Fernald FG, Herman BM, Reagan JA. Determination of aerosol height distribution by lidar. J Appl Meteorol 1972;11:482–9.
[8] Chiang CW, Chen WN, Liang WA, Das SK, Nee JB. Optical properties of tropospheric aerosols based on measurements of lidar,
sun-photometer, and visibility at Chung-Li (251N,1211E). Atmos Environ 2007;41:4128–37.
[9] Dubovik O, King MD. A flexible inversion algorithm for retrieval of aerosol optical properties from sun and sky radiance
measurements. J Geophys Res 2000;105:20673–96.
[10] Holzworth GC. Estimates of mean mixing depths in the contiguous United States. Mon Weather Rev 1964;92:235–42.
[11] Menut L, Flamant C, Pelon J, Flamant PH. Urban boundary-layer height determination from lidar measurements over the Paris
area. Appl Opt 1999;38:945–54.
[12] Elouragini S, Flamant PH. Iterative method to determine an averaged backscatter-to-extinction ratio in cirrus clouds. Appl Opt
1996;35:1512–8.
[13] Chen WN, Chiang CW, Nee JB. Lidar ratio and depolarization ratio for cirrus clouds. Appl Opt 2002;41:6470–6.
[14] Iwasaka Y, Yamato M, Imasu R, Ono A. Transport of Asian dust (KOSA) particles; importance of weak KOSA events on the
geochemical cycle of soil particles. Tellus 1988;40B:494–503.
[15] Ikegami M, Okada K, Zaizen Y, Makino Y. Aerosol particles in the middle troposphere over the northern Pacific. J Meteorol Soc Jpn
1993;71:517–28.
[16] Li-Jones X, Prospero JM. Variations in the size distribution of non-sea-salt sulfate aerosol in the marine boundary layer at Barbados:
impact of African dust. J Geophys Res 1998;103:16073–84.
[17] Griffing GW. Relations between the prevailing visibility, nephelometer scattering coefficient and sunphotometer turbidity coefficient.
Atmos Environ 1980;14:577–84.
[18] Zhou J, Yu G, Jin C, Qi F, Liu D, Liu H, et al. Lidar observations of Asian dust over Hefei, China in spring 2000. J Geophys Res
2002;107(D15):4252.
[19] Murayama T, et al. Ground based network observation of Asian dust events of 1998 in East Asia. J Geophys Res
2001;106(D16):18345–59.
[20] Sakai T, et al. Case study of Raman lidar measurements of Asian dust events in 2000 and 2001 at Nagoya and Tsukuba, Japan.
Atmos Environ 2002;36:5479–89.
[21] Park SU, In HJ. Parameterization of dust emission for the simulation of the yellow sand (Asian dust) event observed in March 2002 in
Korea. J Geophys Res 2003;108(D19):4618.
[22] Chiang CW, Chen WN, Liang WA, Nee JB. Lidar measurements of spring dusts in 2002 at Chung-Li (251N, 1211E). Terr Atmos
Oceanic Sci (TAO) 2004;15:813–24.
[23] Lin CY, Wang Z, Chen WN, Chang SY, Chou CCK, Sugimoto N, et al. Long-range transport of Asian dust and air pollutants to
Taiwan: observed evidence and model simulation. Atmos Chem Phys Discuss 2006;6:10183–216.
[24] Cattrall C, Reagan J, Thome K, Dubovik O. Variability of aerosol and spectral lidar and backscatterand extinction ratios of key
aerosol types derived from selected Aerosol Robotic Network locations. J Geophys Res 2005;100:D10S11.
[25] Hulst van de HC. Light scattering by small particles. New York: Wiley; 1957.