an investigation to determine whether the l-score on the a
TRANSCRIPT

University of Montana University of Montana
ScholarWorks at University of Montana ScholarWorks at University of Montana
Graduate Student Theses, Dissertations, & Professional Papers Graduate School
1955
An investigation to determine whether the L-score on the A. C. E. An investigation to determine whether the L-score on the A. C. E.
Psychological examination is more significantly indicative of Psychological examination is more significantly indicative of
academic success in college than is the Q-score academic success in college than is the Q-score
Thelma Lucilla Ware The University of Montana
Follow this and additional works at: https://scholarworks.umt.edu/etd
Let us know how access to this document benefits you.
Recommended Citation Recommended Citation Ware, Thelma Lucilla, "An investigation to determine whether the L-score on the A. C. E. Psychological examination is more significantly indicative of academic success in college than is the Q-score" (1955). Graduate Student Theses, Dissertations, & Professional Papers. 7891. https://scholarworks.umt.edu/etd/7891
This Thesis is brought to you for free and open access by the Graduate School at ScholarWorks at University of Montana. It has been accepted for inclusion in Graduate Student Theses, Dissertations, & Professional Papers by an authorized administrator of ScholarWorks at University of Montana. For more information, please contact [email protected].
AN INVESTIGATION TO DETEFMINS WHETHER THE I/-SCORE ON THE A. 0* E. PSYCHOLOGICAL EXAMINATION IS MORE SIGNIFICANTLY INDICATIVE OF ACADEMIC SUCCESS IN
COLLEGE THilN IS THE Q-SCORE
byThelma L* Ware
B. A# Polytecbnle Institute of Puerto Rico» 1952
Presented In Partial Fulfillment of the Requirements for the Degree of
Master of Arts
Montana State University 1955
Approved tChaj man» Bosyrd of ÆKfarnlnerBkl^©an» Graduate School
( Date
Reproduced with permission of the copyright owner. Further reproduction prohibited without permission.

UMI Number: EP38692
All rights reserved
INFORMATION TO ALL USERS The quality of this reproduction is dependent upon the quality of the copy submitted.
In the unlikely event that the author did not send a complete manuscript and there are missing pages, these will be noted. Also, if material had to be removed,
a note will indicate the deletion.
UMTDwMTtation
UMI EP38692Published by ProQuest LLC (2013). Copyright in the Dissertation held by the Author.
Microform Edition © ProQuest LLC.All rights reserved. This work is protected against
unauthorized copying under Title 17, United States Code
ProQuestProQuest LLC.
789 East Eisenhower Parkway P.O. Box 1346
Ann Arbor, Ml 48106 - 1346
Reproduced with permission of the copyright owner. Further reproduction prohibited without permission.
/ - j ? -'r
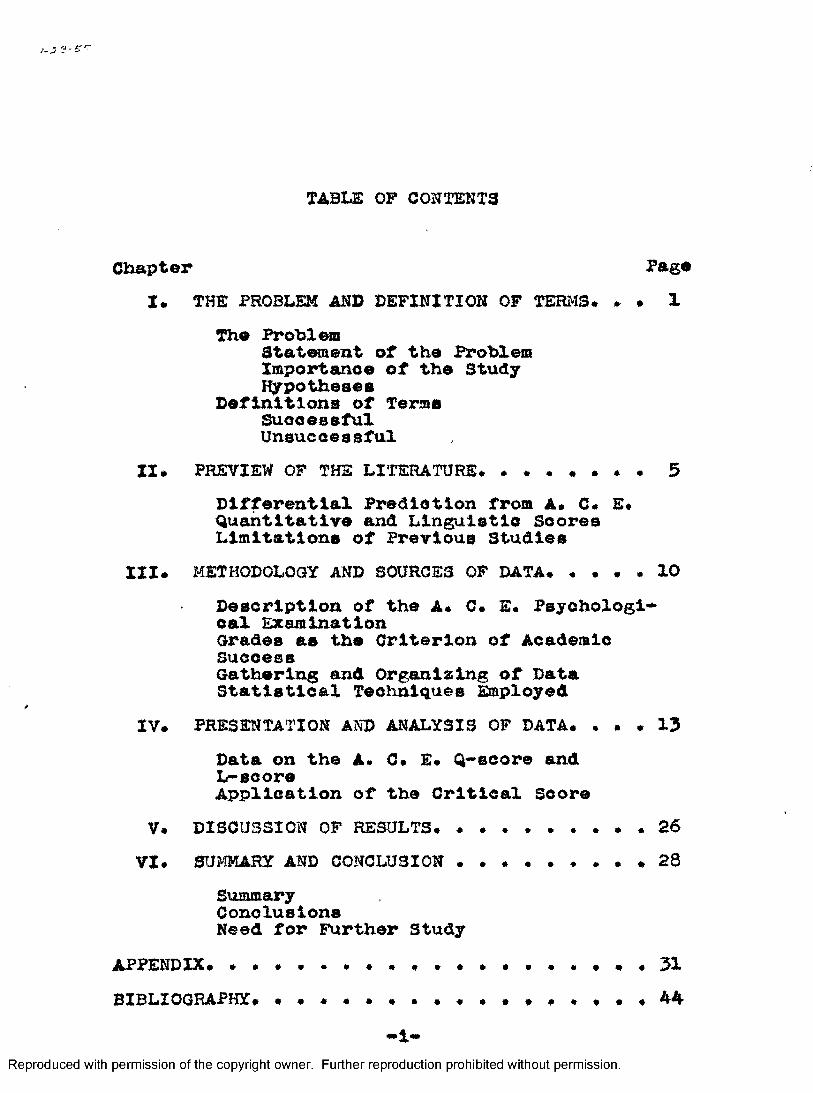
TABLE OF CONTENTS
Chapter Pag#I* THE PROBLEM AND DEFINITION OF TERMS* * • 1
The ProblemStatement of the Problem Importance of the Study Hypotheses Definitions of Terms SuooessfuX UnsuooessfulII. PREVIEW OP THE LITERATURE* . * . * . * . 5
Differential Prediction from A. C* E. Quantitative and Lin^istio Scores Limitations of Previous StudiesIII. METHODOLOGY AND SOURCES OP DATA. . . . . 10
Description of the A. C. E. Psychological ExaminationGrades as the Criterion of Academic SuccessGathering and Organizing of Data Statistical Techniques EmployedIV. PRESENTATION AND ANALYSIS OF DATA. . . . 13
Data on the A. 0. E. Q^ecore and L-sooreApplication of the Critical ScoreV. DISCUSSION OP RESULTS.......... 26
VI. SUMMARY AND CONCLUSION..................28SummaryConclusionsNeed for Further Study
APPENDIX.................................. 31BIBLIOGRAPHY. .............. 44
- 1-Reproduced with permission of the copyright owner. Further reproduction prohibited without permission.

LIST OP TABLES
Table Page1# Basie Lata for the Llscrimlnant* * . 17Analysis • • • » • • • • • • • • « «2. Caleulatlon of the Oorrelatlon * . *Coeffieienta and the Standard. , .Deviations Within Two Groups « • . • 183* Analysis of Varlanoe of ct Between. • and Within the Suooessful and. . . . Unsuccessful Groups. . . . . . . 204, ACE Q and L Scores and Grade Point .Averages for Successful Group. . . . 315. ACE Q and L Scores and Grade Point •Averages for Unsuccessful Group. . • 39
"*11-"
Reproduced with permission of the copyright owner. Further reproduction prohibited without permission.

CHAPTER I THE PROBLEM AND DEFINITION OP TERMS
Reproduced with permission of the copyright owner. Further reproduction prohibited without permission.

CHAPTER I
THE PHOBL.EÎ-Î AND DEFINITION OF TERMS At present the testing senrlcee in many
colleges end iiniversltles use the total score obtained on the American Council on Education Psychological Examination (hereafter referred to as the A, C. E. Psychological Examination) to ap-» praise what is called scholastic aptitude or gener-* ai Intelligonce* The A. C. S, Psychological Examination forms are used also in handling those problems in which it is advisable to distinguish a student *s mental abilities from his high-school prepa-
•Iration and his knowledge gained by work experience,'*’In addition to the use of the total A* C* E,
Psychological Examination score for these purposes,the Quantitative (Q-score) and Linguistic (L-soore)sub-teat scores are frequently utilized in making
2differential predictions of college auccess, Most of the courses in the liborol arts colleges seem
^L, L, Thurstons end T, G, Thurstons,C, E, Psychological Examination for College
Freshmen, ** Manual of Instructions. (194? Edition), 1-23,^ibid. p. 2,
— *1 — >
Reproduced with permission of the copyright owner. Further reproduction prohibited without permission.

to depend more upon llnsulstlo abilities than upon the abilities Involved in quantitative thinking. Thus, the considerably greater importance pls.ced upon verbal ability in most college curricula tends to favor the L-soore as the more significant of the two sub-scores in evaluating scholastic aptitude. This is, however, a priori reasoning from practical experience and the acsumption involved has never been substantiated by experimentation*
THK PROBLEMStatement of the problem.— üie purpose of this study was to determine which of two sub-scale scores of the A. C. E. Psychological Examination was more valid as a predictive Instrument in prognosticating success in college*Importance of the study*— The A. C. E. Psychological Examination, in its various editions. Is widely used among colleges to measure aptitude for college study* In this long-continued use the test has been administered mainly for the purposes of student guidance, but it is used also for purposes of placement, class sectioning, selection of scholarship winners and, less frequently, admission to
Reproduced with permission of the copyright owner. Further reproduction prohibited without permission.

collegeThis particular test Is used more -widely in
testing entering freshmen classes than any other4instrument of Its kind* Its wiae acceptance and
co"itinned use through successive editions suggests that it has been found useful in differentiating potentially weak and strong students. Aside from the use of the total eooro for the purposes mentioned above, the Q-soore and 3>score are frequently utilized in attempts to moke differential predictions of success in college#
Thus, in order to better evaluate the A. C* E* Psychological Examination as a predictive instrument of college success, there is need of a restatement of the assumption Involved In the form of a testable hypothesis.Hypotheses.— 1* It is possible on the basis of the A* C. E, Psychological Examination to predict academic success in college*2* The L-soore on the A. 0, E, Psychological Examination is more significantly indicative of aca-
^“A* C. E. Psychological Examination for College Freshmen,** Norms Bulletin. (1952 Edition), Fo reward*
^Thurston© and Thurstone, on* cit.. p. 1-23,
Reproduced with permission of the copyright owner. Further reproduction prohibited without permission.

deffiio success tn college than Is the Q-score.3^ It is possible to establish cr t-off points on the Q and L score scales such ; o to differentiate between successful end.unsuccessful students#
EKFINITIONS OF TER!TS Successful.-^ Those students were placed in the Successful group who continued at the university to the point of obtaining a degree# or who had a grade point average of 2#0 or hls^or at the tira© of their withdrawal from the university# Onsucceesful.— Those students were placed in the Unsuccessful group who wore officially dropped from the university or who voluntarily discontinued, but who had at the tin© of their withdrawal from the university a grade point deficiency# that is# a gr .de point average of 1.99 or lower.
Reproduced with permission of the copyright owner. Further reproduction prohibited without permission.

CHA.PTEH II REVIEW OF THE LITERATURE
Reproduced with permission of the copyright owner. Further reproduction prohibited without permission.

CKAPTEIR II
REVIEW OF THE LITERATURE The purpôs© of the PGyrhologloal Examina
tion of the American Cotmoll on Education^ accord- Xris to the manualu is to appraise what has bôen called scholastic aptitude or general intelligence, with special reference to the recnir^mente df most ccjllege curricula*
Thur stone and Thurstone, In their manual, stjate that it Is not what is commonly referred to Bd an intelligence test, but rather a teat of ee(rtaln intellectual abilities that have been shown tci be closely related to scholastic success*
This test Is given annually to college fîfeshmen all over the country. It may be administered in an hour’s time and may b© scored conveniently through the use of stencils or by machine* Each test is preceded by a practice exorcise of the same kind* ’Hils ie not only desirable on gen- er- 1 grounds but is definitely reasuring to the giver of the test if he has doubts about tho
^L* L* Thurstons and T, G, Thurstone,’’a* C, s. Psychological Examination for College Freshmen,” Manual of Instructions. (1947 Edition), p* 1-23.
-5-
Reproduced with permission of the copyright owner. Further reproduction prohibited without permission.

homogeneity of hie group.^DIFFERENTIAL PREDICTION FROM A. C. E.QUANTITATIVE AND LINGUISTIC SCORESStudlee made on the A. C« E. Psyohologloal
Examination Q^soore eeem to Indicate that prediction of euecess in college courses is seldom possible from this score. Smlth^ concluded that the level of the linguistic score affects the extent to which students can apply the abilities measured by the Q-score.
Martin's^ research done on the Q-score of the A* C* E. Psychological Examination Indicates that prediction of success In college courses Is difficult to make from this score. He concluded^In agreement with Smith, that the level of the L-score affects the extent to which the student can use the abilities measured by the Q-score and this level varies with types of courses.
It Is the popular belief that superiority
D* Cummins# In The Third Mental Measurements Yearbook. 0. K. Buros# Editor# New Brunswick; Rutgers University Press# 297.^D. D. Smith and T. 0. Trlggs# "Educational Successes and Failures of Students with High Q and .Low L on the A# 0. E. Psychological Examination#"( American Psvcholoisrlst. 5» (1950)# 353-354,^F# M. Martin# "The Prognostic Value of Significantly Different Q and L Scores of the A. G* E. Psychological Examination at the College Level#" American Psycholoptlst. 5# (1950), 471#
Reproduced with permission of the copyright owner. Further reproduction prohibited without permission.

-7-in either the Q or L sections indieatea that the student should pursue the appropriate curriculum, for example# either mathematical sciences or literature» The lack of any marked differences between the predictive values of these two parts in most typical university freshmen courses Indicates that considerable caution should be exercised In the Interpretation of the Q - L-soore differential for purposes of educational guidance
From the results of a study by Bro%m^ It would appear that the L-score predicts grade point averages la linguistic subjects with a degree of , accuracy which compares favorably with other measuring Instruments* The total score on the test was a better predictor of grades In quantitative subjects than was the Q-scor© Itself* For prediction in quantitative subjects there was no significant difference between Q and L-scores*
Various studies have been made In an attempt to predict success In different fields of study*For example, Dorothy M* Barrett? tried to predict
5w* L* Wallace# **Differential Predictive Value of the A% Cm E* Psychological Examination,**School and Society* (1949), 23*
S* Brown, **Differential Prediction by the A* 0* E., ** Journal of Educational Research* 44 (1950), 116*?D. M* Bazvett, **Dlfferentlal Value of Q and
L Scores on the A* C. E* for Predicting Achievement in College Mathematics, **Journal of Peyoholooy* 33 (1952), 205-207*
Reproduced with permission of the copyright owner. Further reproduction prohibited without permission.

-8—achievement In college mathematics by the A* 0# E. Psychological Examination Q and 1> so ores* In agreement with Brown, Barrett concluded that the Q- seore did not predict achievement In general mathematics any better than did the L-soore, the beat predictor being the total score#
CrowleyS attempted to predict academic success In divisions ot the College of Arts and Science from the percentile ranks on the Q-score, L- seore and total score# His study gave indications that counselors and advisers could not with any reasonable degree of confidence attempt such predictions#
Osborne^ reports that when success is measured in terms of average quarter and year marks it is found that the L-score consistently tends to give better predictions than the Q-score, however, none of the correlations were reliable at the#05 level#
LIMITATIONS OF PREVIOUS STUDIES No studies olosely similar to the present
R* Crowley, ^ Evaluation of the jk. £* g. Psychologie al Examination and the Cooperative English Test as Ckiidance Instruments at Montana 3tai^ University# (1951)# 1-64#^R. T# Osborne, et al# “The Differential Prediction of College Marks by A# C* E# Scores,** Journal of Educational Research. 44, (1950), 107-115#
Reproduced with permission of the copyright owner. Further reproduction prohibited without permission.

«9-on® were round In the review of research* Brown’s study dealt with first year students, Crowley’s study ran correlations between the various scores and grade point averages In divisions and departments of the college where the study was conducted, while others ran a correlation between specific courses and the test scores in question*
Reproduced with permission of the copyright owner. Further reproduction prohibited without permission.

CHAPTER III METHODOLOGY AND SOURCES OF DATA
Reproduced with permission of the copyright owner. Further reproduction prohibited without permission.

CHAPTER III METHODOLOGY AND SOURCES OF DATA
Thl# chapter will present an aocount of the materials to be used and the methodology of the study*Description of the A. 0. E* Peycholofflcal Examina*» tion -H» The A» 0* E. Psyohologloal Examination Is used annually In over six hundred colleges and universities* Beginning with the 1938 edition* the one hour examination was oo constructed as to yield* In addition to a total T-seore* two separate sub- scores t the Q-score and the L-score. These subscores do not represent primary mental abilities* They are said to represent two groups of abilities slgnlflccuit for the successful completion of college curricula that are predominately technical and linguistic*Grades as the criterion of academic success*****Grade point averages were the criterion used to determine a student’s success or failure at the University* Because the grading system at Montana State University does not consider a grade of ”F**In calculating the grade point average until the
- 10-
Reproduced with permission of the copyright owner. Further reproduction prohibited without permission.
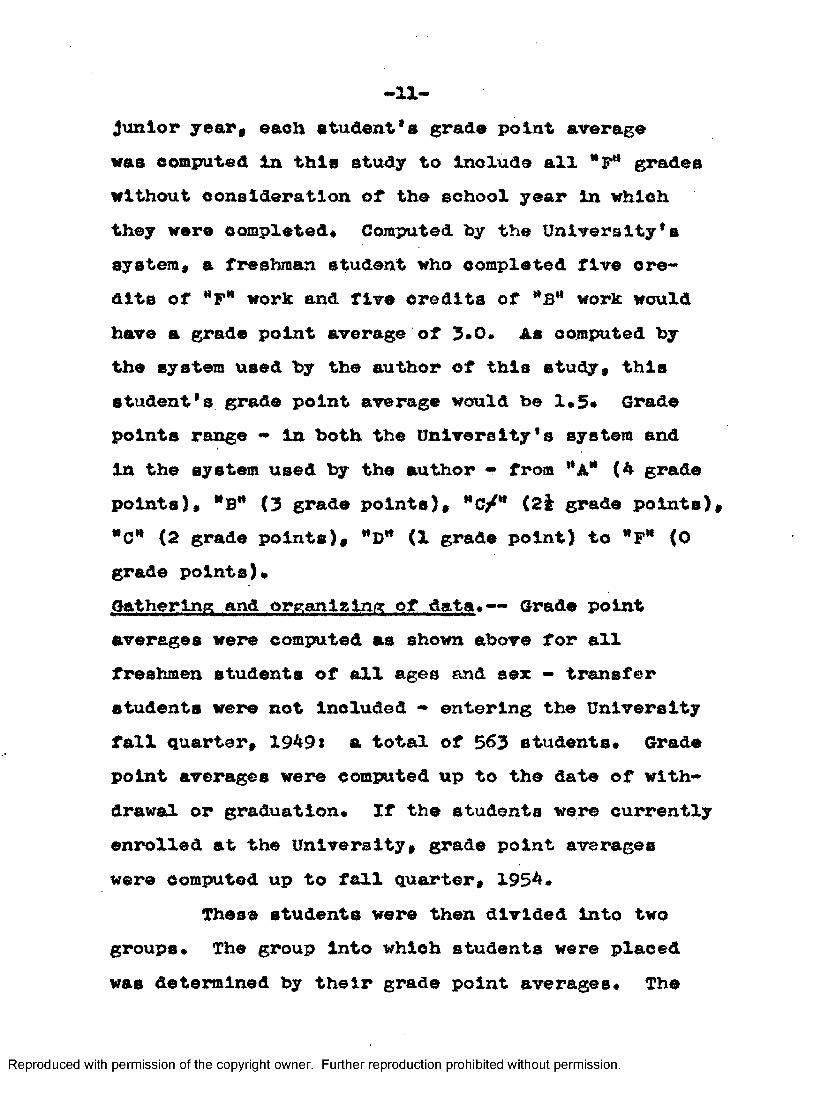
-11-jimlor year, each etudent's grade point average was computed tn this study to Inolude all *P** grades without consideration of the school year in which they were completed# Computed by the University's system, a freshman student who completed five credits of “F** work and five credits of **B** work would have a grade point average of 3*0. As computed by the system used by the author of this study, this student's grade point average would be 1.5* Grade points range - in both the University*s system and in the system used by the author - from **A** (4 grade points), “b** (3 grade points), (2& grade points),**0" (2 grade points), (1 grade point) to "P** (0 grade points)#Gathering and orKanisinA; of data.— Grade point averages were computed as shown above for all freshmen students of all ages and sex - transfer students were not included - entering the University fall quarter, 1949s a total of 563 students# Grade point averages were computed up to the date of withdrawal or graduation* If the students were currently enrolled at the University, grade point averages were computed up to fall quarter, 1954*
These students were then divided Into two groups* The group into which students were placed was determined by their grade point averages* The
Reproduced with permission of the copyright owner. Further reproduction prohibited without permission.

-12-groups were asslgnsted Suocosaful and Unsuooessful.A student with a grade point average of below 2#0 was placed in the Unsuceeosful group. A student with a grade point average of 2.0 or above was placed in the Suooessful group. The Q and L-scores of the A. C* E. Psychological Examination were then obtained for each Individual from records available In the University Counseling Center# Montana State University.Statistical techniques employed.— The particular statistical technique used was Fisher*a Discriminant Function.^ This function deals with the statistical techniques employed in dealing with multiple measurements for differentiating between two or more groups. In this study the two groups to be differentiated were the Successful and the Unsuccessful. For each of these groups there were two sets of measurements - the Q and the L sub-test scores of the A. 0. £. Psychological Examination.
The usual way of treating individuals with several measurements who are to be classified into groups Is to take each measurement separately and compute the significance of the difference between the means of the groups.^
' Ipalmer 0. Johnson# Statistical Methods in Research. New Yorks Prentice-Hall, Inc.# (1949)#"344,2Ibid.. p. 344.
Reproduced with permission of the copyright owner. Further reproduction prohibited without permission.

-13*This method la Inafflolent in that It doea
not combine the Information# taking the Interrela-* tlons between the measurements dealt with intoaccount *3»
The advantage In using Fisher's Dlaorlml*» nant Function Is that It corrects the above discrepancies by showing the relative significance of the sub-scores by inspection of weights in the regression equation* The difference between the weighted Q, and L scores were then tested for significance#
The Discriminant Function uses the F test to determine the significance of the difference between the Q, and L scores*
The essential property of this function, which is a linear function of the observations, is that it will distinguish better than any other linear function between the specified groups on whom common measurements are available# The principle upon which the discriminant function rests is that the linear functions of the measurements will maximise the ratio of the difference between the specific means to the standard deviations within c l a s s e s .4
3ibld# # p. 344. 4Ibid.* p# 344.
Reproduced with permission of the copyright owner. Further reproduction prohibited without permission.

CHAPTER IV PRESENTATION AND ANALYSIS OF DATA
Reproduced with permission of the copyright owner. Further reproduction prohibited without permission.

CHAPTER IV PRESENTATION AlfD ANALYSIS OF DATA In this chapter the results and Interpre
tation of the study Is presented* For purposes of clarity and also In order to render the inherent difficulties of the study Into acceptable hypotheses which could be treated experimentally, It was necessary to consider and treat the study In two distinct parts* As previously stated It was thought to be expedient to first determine which of the two sub-scores of the A* 0. E. Psychological Examination, the Q-score or the L-score, was more indicative of academic success* The second phase of the study was concerned with the establishment of an appropriate cut-off point which would allow test users to make certain predictions within the scope of the Information with which this study deals as to the probability of academic success or academic failure.Data on the A* G* 5» Q-score and L-soore.— In the search for a statistical method for the most adequate treatment of the data the author selected and employed the Discriminant Function* The general and complete mathematical development of the Discrlml-
-14-
Reproduced with permission of the copyright owner. Further reproduction prohibited without permission.

-15-nant Function was œad® by Fisher.1 In Its original fora the development Is rather complex. Because of the need for a simplified version of this function Johnson^ has Introduced a simplified proof and computational example which may be more readily followed and understood than the original and more technical statistical development. The author has used Johnson's simplified form.
The Discriminant Function Is particularly applicable to the operations of predicting membership In a class or group from several variables as was the case In this study. The variables In this study were the Q and L scores of the A. C. E. Psychological Examination.
A regression equation maximizes the ratio of the differences of the means of the variables.Then prediction can be made as to membership into the Successful and Unsuccessful groups.
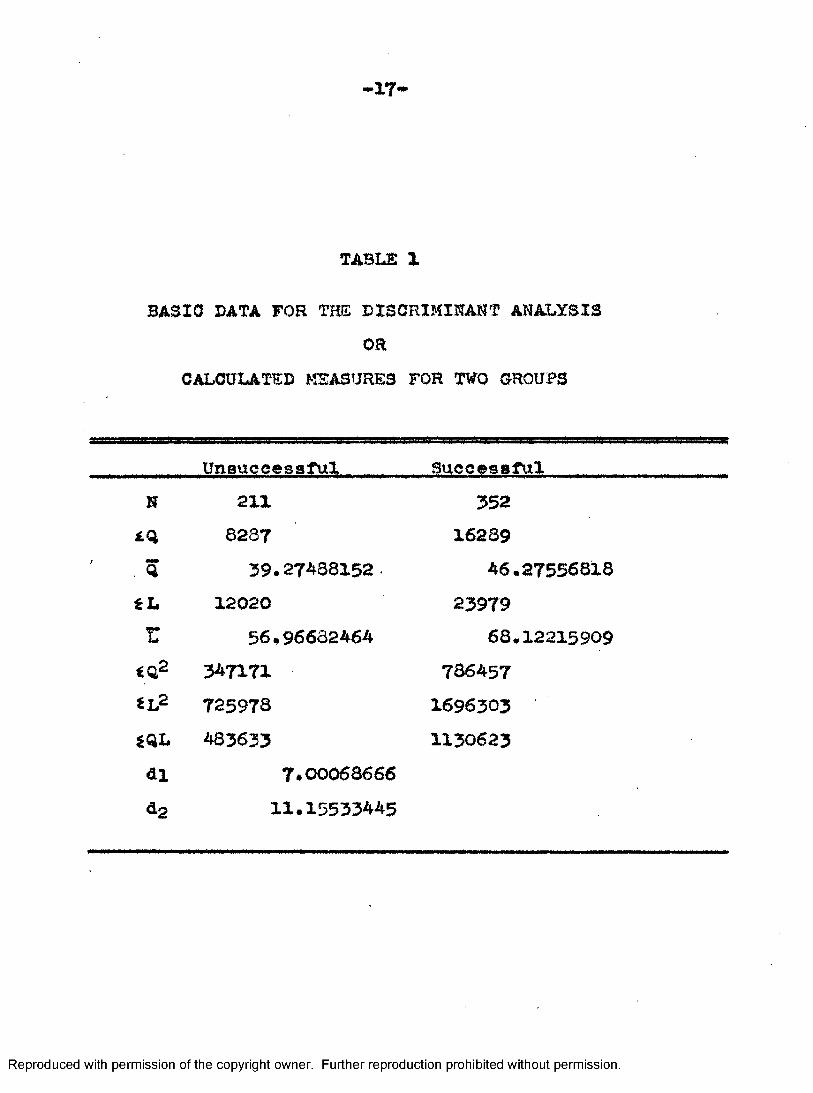
The basic data of the study from which subsequent calculations were made are presented In Table 1. This Table shows the data used In the
^R* A. Fisher, "The use of Multiple Measurements in Taxonomic Problems," i>jfinal8 of Kujrenlea. Vol. VII (1936), pp. 376-386.^Palmer 0. Johnson, Statistical Methods in Research. New York; Prentice-Hall," Inc.",' (1949), p. 34-4. '
Reproduced with permission of the copyright owner. Further reproduction prohibited without permission.

••X6*axiaXyals of the disparity between the Successful and the Unsuccessful groups* Table 2 presents the calculated correlation eoefflclents and the standard deviations within the groups*
The general form of the regression equationis
4, = k, Q, + L (1)Where*
«t =-the linear function of the measurements Q and L which maximizes the ratio of the differences between the means of the Successful and Unsuccessful groups to the standard deviation within classes*
the regression for Q and L scoresrespectively*
Q* L = A* C* E* Psychological Examination sub-scores*
The form of equation (1) for a particular Individual* 1* obtained In this study is
oLj =s -I- L. ' (2)where*
c( =ithe previous definition*Ql# Id. = an individual's raw scores on the
A* C* E* Psychological Examination*In determining whether relation (2) dlffer-
Reproduced with permission of the copyright owner. Further reproduction prohibited without permission.
" 17*
TABLE 1
BASIC DATA FOR THE DISCRIMINANT ANALYSISOR
CALCULATED MEASURES FOR TWO GROUPS
Unsuccessful SuccessfulN 211 352
iQ 8237 16289' . q 39.27438152. 46.27556818
12020 23979r 56 « 96662464 68.12215909
347171 736457él2 725978 1696303SQL 483633 1130623dl 7*00068666d2 11.15533445
Reproduced with permission of the copyright owner. Further reproduction prohibited without permission.

«•18-
TABLE 2
CALOULATIOH OF THE CORRELATION COEFFICIENTS AND THE STANDARD DEVIATIONS WITHIN TWO GROUPS
% %■Total.......... . 1135628 1614256Groups......................324160 1581725.92526120
Q, Within Groups..Sxi = 54574.52675840 S^g =32530.07473880-fïï x = 233.18303274 =^75213.19170372Sx -9.84499537 **12 = •43250491
Total. . . . . .. . . . . .. . . ............... ..... 2422281Groups............. ....................... 2318242.48506840
L, Within Groups.............. 322=104038.51493160=322.55001927
Sg *13.61807249
Reproduced with permission of the copyright owner. Further reproduction prohibited without permission.

-19*entlates the SuooessfuX from the Unsucoeseful group on the variable Pt # the algnlflcanoe between the two groups on the variable < was tested through the analysis of variance in Table 3* The hypothesis tested was
F > 1 (3)where^
F = the F atatlstlo calculated from the dataand
1 = the null F value#Since F < #01 the hypothesis of homogeneous
groups was rejected# Therefore# it was concluded that the relation (2) permits the prediction of future membership in the academically Successful and Unsuccessful groups#
The maximum difference between the two groups was derived by the relation
c = (A)where,
0 — the criterion or cut-off value whichmaximizes the discrimination between the two groups#
^ t4 ^ the calculation arrived at enteringthe mean raw Q and L scores of the UnsucceBsful group in relation (1)#
Reproduced with permission of the copyright owner. Further reproduction prohibited without permission.

-20-
TABLE 3
ANALYSIS OF VARIANCE OF < BETWEEN AND WITHIN THE SUCCESSFUL AND UNSUCCESSFUL GROUPS
Source of Variation D.F* S.S. M.S. F PWithin Groups 559 .00X47523 .00000264 54.47 .01Between Groups 2 .00028759 .00014yT9
Reproduced with permission of the copyright owner. Further reproduction prohibited without permission.

«21«® Blmllar oaloulatlon for the Suoceseful
group,The final hypotheale to be tested was that
the Ii-8Core would prove to be a better instrument of prediction of academic Bucoesa than the Q-soore* The statistical statement of this hypothesis was
A , < (5)where,
^1 ^ *000079 ^2 = .000082
A decision as to whether this hypothesis was right as stated could have been reached by inspecting the difference between the two X coefficients * The difference between them was *000003* Inspection indicated that this difference was so small as to be insignificant. The investigator decided to use another and more meaningful method of arriving at a decision regarding the above hypothesis. The bise- rial correlation coefficients, r^, was selected*
There are two reasons why the biserial correlation coefficient was selected* By calculating
*•» (dc) (LC) (6)Which are the biserial correlations between the Qscores and the criterion and the L scores and thecriterion, respectively*
Reproduced with permission of the copyright owner. Further reproduction prohibited without permission.

-22-The différence
**b <L0) (QC) (7)oould then be tested for significance* Or# In other words# It was hoped to test the null hypothesis
^ (LG) ~ ^b (qo) - O The {decision could then be made regarding the relative merits of L and Q scorea as indicators of academic success* This could be roughly equivalent to testing the slgnlfIcance of the difference between the two regression coefficients* Second# the use of the blserlal coefficient would give moro Information because It would also show the estimated oor- relatlon between each kind of score and the criterion*
For the data**b (LC) - ^b (QC) ^
A test of the null hypothesis regarding these two coefficients was made by
t = (9)-A
where#t = Fisher*8 t statistic#Z^# Zq =• Fisher's Z transformations of the
correlation coefficients In relation (8)*
Reproduced with permission of the copyright owner. Further reproduction prohibited without permission.

= the standard error of the difference between the two Z values#For the data t ~ The P obtained was *29 for adirectional one tailed teat of the null hypothesis# relation (8)# end a *58 for a two tailed test of the same hypothesise Although the Lr*score was found to be a better predictive Instrument in forecasting success In college# the difference In predictive value of the two sub-scores was statistical* ly insignificant# Therefore, the Q and L scores would seem to be equally good predictors of academic success#Aoplicatlon of the critical score#— The equation which permits the prediction of membership In the Successful and Unsuccessful groups was
= #000079 Qi + #000082 (10)where,
^i, * * particular Individual's Q andL scores#
•000079, #000082 =• the empirical X -coefficients#
s an individual's «t-measure#
Reproduced with permission of the copyright owner. Further reproduction prohibited without permission.

Vhea
“‘'o';
<• .008551»which is the criterion» the prediction is made that individual 1 will be unsuccessful in college#
When
or
<*^,•>.008551 the prediction is made that individual 1 will be successful in college*
An illustration of a successful individualfollows Î
= *000079 X64 +#000082 X 70 =.005056 + .005640 -*010696
Since c(g was greater than the criterion, that is, #010696 was greater than #008551, this Individual would be placed in the successful group#
An example of an unsuccessful individual would be as followss
=*000079 X.23 + .000082 48^*001817 + .004136 -.005953
Reproduced with permission of the copyright owner. Further reproduction prohibited without permission.

-25-Slnce indi7ldual b*a eoore was less than
the crlterlcwit that Is, .005953 being less than • 008551# this individual would be plao-sd In the unsucoessful group.
Reproduced with permission of the copyright owner. Further reproduction prohibited without permission.

OHAFTSR V DISOÜSSIOH OF RESULTS
Reproduced with permission of the copyright owner. Further reproduction prohibited without permission.

CHAPTER V
DISCUSSION OP RESULTS Although the L**8eore was found to be higher
etatlatloally than the Q-eoore, It was not eignifl- eaxitly higher*
The fact that the eubjeota conaisted of an aggregation of atudenta Irrespeotlye of their major fielda Hould tend to cancel out the predictive value of the eub-tests* For example* the L-score is primarily indicative of llnguiatlo abilities and the Qrsoore la an indicator of quantitative assets* Two aueceasful studenta$ the one poBsesalng a high L and a low Q-soore; the other having a low L and a high Q-score* would show no differential predictive preference for either the Q or L-acore#
However* if two groups which are clearly dependent upon linguistic and quantitative knowledge* respectlvely* were selected and statistically treated by the Discriminant Function* the tendency of cancellation of the one group by the other would be greatly reduced if not completely suppressed and the probability of finding a greater and
Reproduced with permission of the copyright owner. Further reproduction prohibited without permission.

-27-more représentative dllferenee between the Q and L-Boore would bo Inoreaeed*
An escamplo of this procedure would be the selection of two groups of students composed of physics (Q factor) end English (L factor) majors.The Q and L scores of these groups would then be statistically treated by Fisher*s Function to determine the relative degree to which the A, 0, E, Psychological Examination sub-scores are predictive Instruments of success In college*
Such dichotomized groups would afford a reduction of overlap Insofar as discrete quantitative and linguistic variables are concerned* The absence of qualitative overlap between the major fielda of the subjects would facilitate the desired distinction between the sub-scores and maximize the ratio of the difference between the groups* In this way a more precise indication of the value of each of the sub-scores as predictive Instruments of academic success could be obtained.
This contention Is substantiated by Brown*s^ study* Ho concluded that the L-score was a better predictor In the linguistic field than the Q-score was In the quantitative subjects*
^H* S, Brown, "Differential Prediction by the A* C. E**" Journal of Educational Research* 44 (1950), 116,
Reproduced with permission of the copyright owner. Further reproduction prohibited without permission.

CHâPTER VI SUWÎAHÏ Aim COKOLUSIOH
Reproduced with permission of the copyright owner. Further reproduction prohibited without permission.
OHA.PTEÎÎ VI
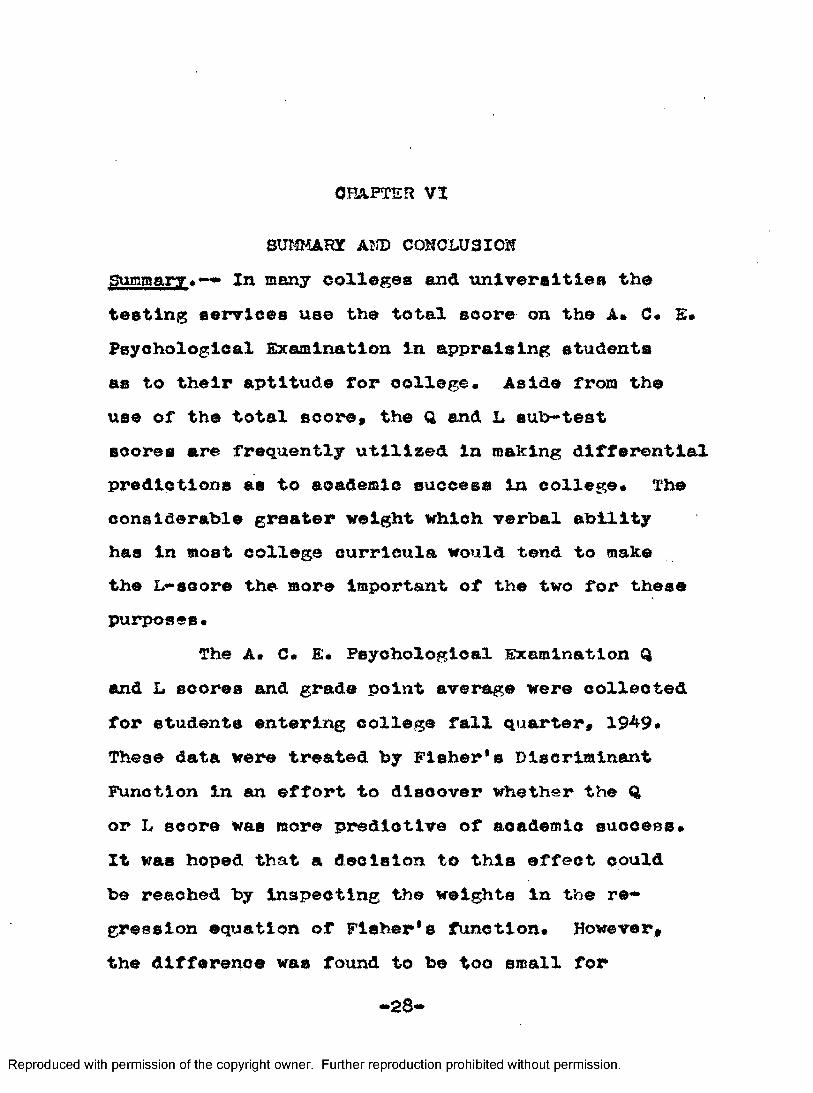
SÜÏÎMAHY AÎÏD CONCLUS ION Smamary***» In many collages and universities th© testing services use the total score on the A. C« S. Psychological Examination in appraising students as to their aptitude for college. Aside from the use of the total score# the Q and L sub*test scores are frequently utilised in making differential predictions as to academic success In college* The considerable greater weight which verbal ability has la most college curricula would tend to make the L-scor© the more important of the two for these purposes*
The A* 0. E* Poyohologlcal Examination Q and L scores and grade point average were collected for students entering college fall quarter# 1949# These data were treated by Fisher’s Discriminant Function in an effort to discover whether the Q or L score was more predictive of academic success*It was hoped that a decision to this effect could be reached by inspecting the weights in the re* gresslon equation of Fisher’s function* However# the difference was found to be too small for
*28*
Reproduced with permission of the copyright owner. Further reproduction prohibited without permission.

—29**differentiation. Therefore# the blserlal correlation coefficient was used In an attempt to arrive at a decision* Before this was done a critical score# 0 =*008551# was obtained* Using the blserlal correlation coefficient the following Information was obtaineds r^ (I.C) = and r^ (qqj = *42.A test of the riull hypothesis regarding these two coefficients gave a P of *29 In a directional one- tailed test and a P of *58 In a two-tailed test* Conclusion,— On the basis of this Information It was concluded that the L-score was a slightly better predictor of academic success than the Q-score* However# the difference between the two sub-scores as predictive Instruments was found not to be significant*
The cut-off point obtained was 0 =» .008551* Any student*a A. C* E* Psychological Examination Q and L scores# when treated In the equation ol • 000078 X Q 4- .000082 X L# which fall below 0 would be designated as a possible unsuccessful student*But if the student's Q and L scores should fall above C the student would be designated as a possible successful student*Heed for further study*— Although the statistical treatment of the basic data maximized the differences between the two groups and thereby made It possible
Reproduced with permission of the copyright owner. Further reproduction prohibited without permission.

- 50-
to assess tim particular value of the Q and L aub— scores in terms of their respective validity as predictive Instruments, It becomes Increasingly apparent when the source of the basic data la considered that need exists for j^irther research before any reliable cut-off point can be established which may be used as a criterion for success in future oases*The investigator would advise against the use of the 0 obtained from the present study aa an absolute criterion of success in connection with future counseling; though some counselors and perhaps some testers may find various uses of the information contained in this study* In the final analysis the Information contained herein pertains only to freshmen who entered Montana State University fall quarter, 1949 and should not be generalised to other classes or individuals without furtlier research on the problem* It is suggested that a number of C points be obtained from further investigations and the mean of the Individual means noted* This Investigator believes such an extended analysis of data would avail a more reliable cut-off point than does a single investigation of a single class*
Reproduced with permission of the copyright owner. Further reproduction prohibited without permission.

APPENDIX
Reproduced with permission of the copyright owner. Further reproduction prohibited without permission.
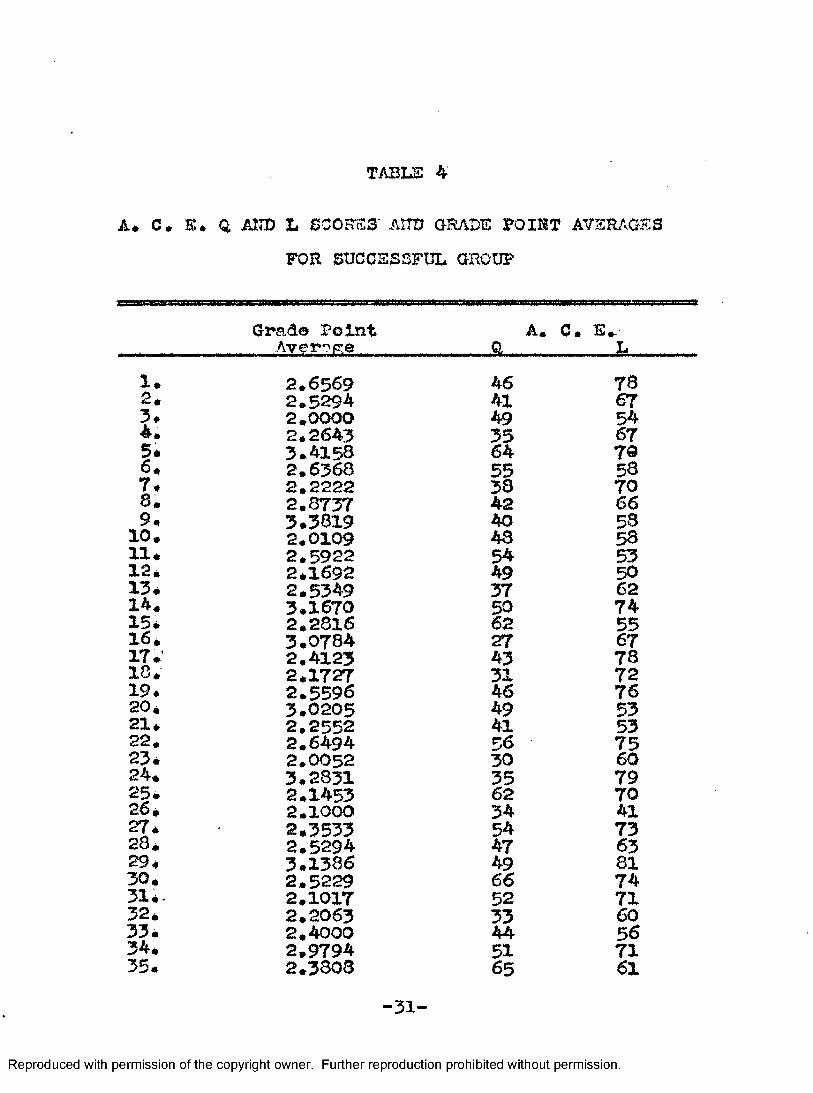
TABLE 4
i.* c # E. Q Aim L SCORES AITD GRADE POINT A7ER/.GESFOE SUCCESSFUL GROUP
Grade Point A. 0. E,.-........ A v e r i R o .......a........ L
1. 2.6569 46 782# 2.5294 41 673. 2,0000 49 544. 2.2643 35 675* 3.4158 64 706# 2,6368 55 587* 2.2222 33 708. 2,8737 42 669# 3.3819 40 5810, 2.0109 48 53lié 2.5922 5 4 5312* 2*1692 49 5013é 2.5349 37 6214* 3,1670 50 7415# 2,2816 62 5516* 3,0784 27 6717. 2,4123 43 7818* 2*1727 3 1 7219* 2,5596 46 7620* 3.0205 49 5321* 2,2552 41 5322. 2.6494 56 7523. 2.0052 30 6 024* 3,2831 35 7925. 2.1453 62 7026* 2.1000 34 4127* 2,3533 54 7328* 2,5294 4 7 6329* 3.1386 49 8130* 2.5229 66 7431. 2.1017 52 7132* 2,2063 33 6033. 2,4000 44 5634* 2,9794 51 7135. 2*3303 65 61”31-
Reproduced with permission of the copyright owner. Further reproduction prohibited without permission.

-32-TABIS 4— Continued
36* 2.5768 48 8837* 2*3012 38 7038. 2*3181 42 5739* 2*0625 55 7040. 2»3980 38 4541* 2*1250 46 7242* 3.1428 43 5743. 2.4523 37 642*1454 57 6145* 2.3283 35 4646. 3.3621 56 6947 * 2.3043 49 6343. 2.9041 43 6749* 2*6666 42 9050* 2*1330 46 6651* 2.4162 45 7352* 2.5T28 53 4453* 2.6931 37 5254* 2.9354 40 7555* 2.6262 43 8358* 2.5645 49 69
i : f l § # g59* 2.2113 48 662.0223 42 652.0000 28 69
7351g * 2.2586 63g * 2,1739 42I li I IS * 2.4130 57 44
64Si* 2.8339 40 ^Î?* 2,7037 49 63
557165 60 6272
71* 2.2201 3672* 3.3725 3773* 2.2883 4674. 2,1713 4475* 2,0000 48I i I I
Reproduced with permission of the copyright owner. Further reproduction prohibited without permission.

•33-TABLE 4*^Cont Inued
83#84*85.86*87.88. 89* 90* 91* 92* 93. 94* 95* 96* 97* 98* 99*100*101*102*
103*1Q4*105*106*107*108*109*110*111*112*113*114*115*116*117*118*119.120*121*122*123*124*125.126*127*128.
Reproduced with permission of the copyright owner. Further reproduction prohibited without permission.
2,6250 41 612,2678 33 552.1229 46 722.1250 41 442,3574 55 762,6736 34 702.4130 32 552,1250 47 723.5323 55 792.1224 45 722,3283 42 032,2176 50 1032.1353 52 732,2513 34 402,5026 46 732.9795 57 622.8954 48 612.2169 41 652.3750 31 683.4051 52 602.1827 45 592,1197 53 422,4079 43 772,2326 53 732*5319 43 732,7050 63 662.5632 22 432.1255 37 582,3450 50 872.3450 61 803.0102 51 762,0665 59 592*0050 53 692,2959 49 823*3974 55 872.0767 51 422*0625 59 1012*8118 70 872*5666 46 612*2010 43 732,7727 41 642*4639 48 802,8205 50 932,0357 51 692.6356 51 802,4232 45 50

-34-table 4— Contlntxed
129* 2,9902 49 86130* 2,0945 46 65131. 2.6010 41 95132. -2,1666 54 77133. 2.2512 56 69134, 2^4593 34 69133. 2^5454 5644 82156, 2,14104 63137. 2.6266 44 55138, 3,1636 65 86139. 2s4401 56 66140, 3.0890 47 57141, 2*5329 40 43142, 2,2962 51 77143, 2.3926 38 84144, 2,75T5 47 60145. 2,3921 49 55146, 2,3398 57 66147. 2.3193 31 69148, 3,4946 54 82149. 2,8468 30 33150, 2.2522 41 56151. 2,8870 54 93152* 2,8750 33 89153. 2.2941 55 77154, 2.2553 35 64155. 2.6037 43 72156* 2.3191 51 64157. 3.1888 56 81158. 2*5679 45 69159. 2.1587 42 71160* 2.3265 33 34161* 2,6336 44 75162* 2,7513 50 66163* 2.5000 45 67164, 2,5967 39 64165. 2,3674 52 68166* 2.4285 36 66167. 2.1478 53 68168* 2,7346 59 62169* 2.0000 55 90170, 2.6136 57 84171* 2,6358 44 55172, 2,9303 40 731731 2.2061 29 76174. 2,4924 42 59175. 2,2127 43 73
Reproduced with permission of the copyright owner. Further reproduction prohibited without permission.

-55-TABLS 4-«-0ontlnued
1T6. 2*4972 47 51177# 3*3877 36 85178# 2*2973 54 80179# 243844 47 70180* 2*1713 42 68181* 3*3703 66 89182* 2*5855 57 67183* 2*7835 46 52184* 2*7079 51 65185* 2*6641 29 54186* 2*9609 55 80187* 2.6391 54 68188* 2*5396 43 63189* 2*1730 42 66190* 2.8131 43 71191* 2.2202 30 50192* 2*8125 52 62193* 2*4526 49 72194* 2*1043 32 52195* 2.7522 62 99196* 243449 63 74ig: S g199* 2*0606 37 60200* 2*7792 50 72201* 2.0487 48 40202 * 2.6283 42 86203* 3*0098 65 80204* 2*4813 41 67205* 2*6182 41 61206* 2.4230 44 8320gt 3:5^ g 86209* 2*0204 46 59210* 2*8144 46 76211* 2.5427 43 72212* 2.3050 63 83213* 3.6802 60 80II IE g iSi: idi i I220. 2.0268 55 §7221* 2.5660 34 83
Reproduced with permission of the copyright owner. Further reproduction prohibited without permission.

—3 ^TABLE 4*»*»Cont Jzitied
222. 2.1770 48 61223* 2.1022 45 58224, 2.7063 46 89225, 2.4596 52 71226, 3.0396 59 66227,228. 2.0769 51 692.1381 48 71229. 3.8510 64 95230. 2.3326 44 ir231, 3.8348 40232.’ 2.1717 52 66233.' 2.8333 42 61234. 2.2727 42 57235. 2.9059 42 60236. 2.0408 56 87237. 2.3225 54 72238. 2.8279 33 57239, 2.3305 43 88240. 2.7234 36 57241. 2.0666 52 72242. 2.5675 45 78243. 2.0236 47 44244, 2.9818 62 77245. 2.2887 55 63246. 2.5555 59 88247, 2.1666 67 70248. 2.2461 33 67249. 3.2167 54 63250. 2.6083 45 73251* 2.6451 57 67252* 2.5681 57 82253, 2.5390 15 26254. 2.1721 46 74255. 3.0482 60 96256. 2.2051 49 8125T* 3.1753 44 64258. 2.3473 35 63259. 2.0833 42 65260* 2.7673 55 76261. 3.0860 57 692621 3.7625 46 67263, 3.2857 40 50264. 2.0623 44 40265. 2.3455 54 51266. 2,0239 4 42267. 2.2010 45 79268. 2.6304 46 73
Reproduced with permission of the copyright owner. Further reproduction prohibited without permission.

TABLE <^^Cont,tnti0d
2C9* 2.5319 46 83270 ♦ 2.2025 64 95271. 2.7828 37 61272. 2.4081 60 92273. 2*2307 31 54274. 2*1094 46 64275. 2.5631 33 592761 2.4590 43 53277. 2.4863 46 98273* 2.1904 45 70279* 3.0815 42 58280* 2.1484 48 79281. 2.3125 50 66282* 3.3094 66 77283* 2.2131 45 74284* 3.1198 41 82285. 2.4633 61 88236. 2.3473 42 74287* 3.2207 63 78238. 2.1800 38 37289. 2.1791 44 67290'* 2,0952 17 56291. 2.0884 41 52292. 2.4892 53 70293. 2,6908 51 80294. 2*1366 53 85295. 2.2000 41296. 2.8200 37 72297. 2.0000 40 72298. 2^4736 38 73299. 2,0252 46 62300. 2.0476 38 39301. 2,0637 47 55302. 2*8840 47 er303* 2.8243 51 82304. 2.2068 37 62305. 2.2307 48 68306. 2.3645 37 54307* 2,2100 56 63303. 2.0538 50 71309. 3.5227 51 91310. 2.4776 44 74311. 2.5769 51 64312. 2,3430 43 72313. 2,4247 48 5881314. 2.4232 45315* 2.4373 52 . 65
Reproduced with permission of the copyright owner. Further reproduction prohibited without permission.

TABLE A C o n tln iie a i
316. 2.1613 45 39317# 2.0000 56 64318# 2*0000 59 91519# 2.0133 23 47320. 2*6361 40 51321. 2*5621 48 63322* 2*0026 31 45323 . 3.5873 50 66324. 3.5555 40 85325. 2.3200 43 53326* 2*1029 11 39327 . 2*6274 65 78323. 2*4782 48 84329. 2*2111 40 47330 , 2*0612 40 63i: i;ii I I334* 2*3541 48 731 fiil I! iI I I 1i 11 I i349. 3*1344 43
3 5 2 * 2*1632 47
26613 5 1 ' 2 * t i l s 47 7 I
60
Reproduced with permission of the copyright owner. Further reproduction prohibited without permission.
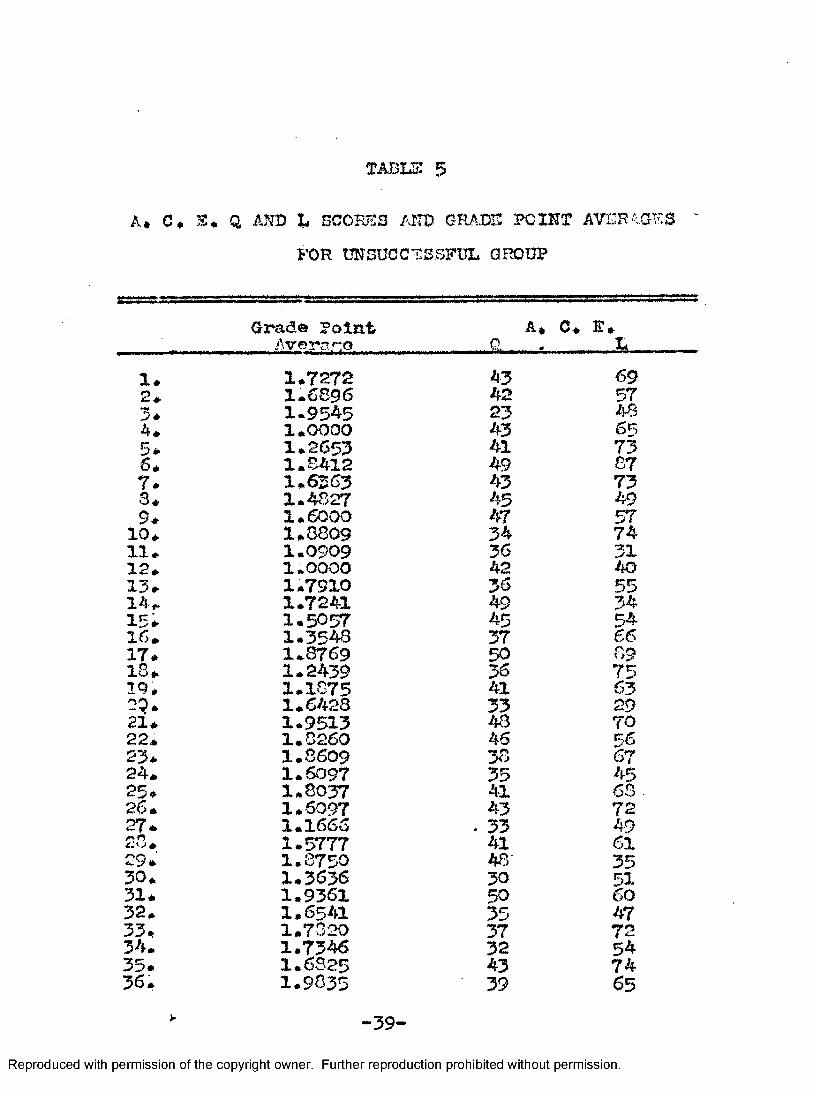
T A B I E 5
A. C* E. Q AND L scorns AND GRADE POINT AVDRAGEgFOR UNSUCCESSFUL GROUP
Grade Point A* C* F*Averaro 0. - . L1* 1*7272 43 692# 1.6896 42 573* 1-9545 23 484* 1.0000 43 655# 1*2653 41 736* 1.8412 49 677# 1*6263 43 733* 1.4827 45 499* 1*6000 47 5710# 1*8809 34 74
11# 1.0909 36 3112* 1.0000 42 4013# 1.7910 36 5514 # 1.7241 49 3415# 1.5057 45 5416# 1.3549 37 6617# 1.8769 50 8918# 1.2439 36 7519# 1.1875 41 631.6428 33 2921# 1.9513 48 7022* 1.8260 46 5623# 1.8609 38 6724# 1.6097 35 4525# 1.8037 41 6326* 1*6097 43 7227# 1.1666 . 33 4928# 1.5777 41 6129* 1.8750 48 3530* 1*3636 30 5131* 1.9361 50 6032* 1.6541 35 4733# 1.7020 37 7234* 1.7346 32 5435. 1*6825 43 7436* 1.9835 39 65
> -39-Reproduced with permission of the copyright owner. Further reproduction prohibited without permission.

TABis
41 56î?7 4344 5446 422S 2642 4711 1650 5048 4150 4825 3750 593750 5023 5531 5121 4832 5838 4343 7829 3327 4747 5545 6156 7754 6543 6528 67P 7345 4728 5829 6041 7064 77JiA rc:
g38 7359 6835 69A| 55S gil g
Reproduced with permission of the copyright owner. Further reproduction prohibited without permission.
37* 1.350438* 1*976739. 1.666640* 1*379341. 1.000042* 1.934743. 1.343744* 1*048445* 1.260846* 1.000047. 1.000048. 1*764749* 1.392150. 1.300051. 1.125052. 1.603953. 1*380054. 1*698255. 1*275856* 1.868457. 1*583358. 1*780959. 1*310360* 1.333361. 1.238062. 1.583363. 1*060164* 1.750065. 1.161266# *952367# 1.697668. *820069. 1,660370. 1.718771. 1.765472. 1.270273. 1.493674. 1,484375* 1*666676* 1,891877. 1.837678. 1*423079. 1.875080* 1*953781. 1*411782. 1*5000

—41^T A B U S ont i m x o d
83; 1.0588 43 6884* i;6060 47 6085* 1*9970 36 5486* 1*7894 49 8087. 1*5111 30 4088. 1*9700 43 4889. 1.9949 14 3390* 46373 38 5191. 1;8750 38 5592. 1*2388 51 7093* 1*7314 48 4894# 1.9787 47 4695. 1.8809 31 4696. 1.3750 17 6897. 1.1851 30 6698. 1.5781 29 6299* 1.8333 36 03100. 1.0333 47 67lOli 1.4666 16 45102* 1.3142 45 78103.'. 1*8043 30 36104. 1.7058 50 69105# 1.5833 32 . 57106* 1.9166 22 55107. 1*2553 56 68103* 1.3600 48 53109. li.5714 24 53110. 1*7944 38 60Ill* 1,5833 34 45112. 1*5555 41 73113. 1*6250 44 68114* 1*2055 46 75115 ♦ 1.8474 31 55116. 1*2325 58 66117. . 1*8061 47 77118. 1*9512 31 53119. 1*7906 36 47120. 1*6491 33 63121. 1.3529 41 53122* 1*7936 65 72123. 1.9027 47 51124* 1,6274 50 69
125. 1*2380 40 57126, 1.5833 29 44127. 1.4000 27 50128* 1.7815 36 66
Reproduced with permission of the copyright owner. Further reproduction prohibited without permission.

-•42**TABLE S—*Contlmied
120* li3Ô8S 42 79130* 1*5208 34 59131* *9523 20132* 1*6039 6$ 56133* 1*7073 40 57134* 1*4444 42 C17135*. 1.6500 35 63136. 1*8000 46 74137* 1*2105 44 47138* 1*6825 43 53139. 1*7857 > 47 98l K). 1*7046 51 85IfH* 1*8315 42 61142* 1^5000 45 85i;;3. 1.8431 39 74144* 1*5000 36 56
i 0 I I149. 1*0909 47 64130. 1.6043 56 en
I 1 I I
I IIm: ï:8 S « g
Reproduced with permission of the copyright owner. Further reproduction prohibited without permission.

—43-»TABLE Continued
175. 1.7777176. 1.6095177. 1.5454178. 1.8043179. 1.3750180. 1.1176181. 1.0909182. 1.7111183. 1.8936134. 1.8853185. 1.6277l86« 1.6981187. 1.4375188. 1.2758189. 1.8936190. 1.4210191. 1.8387192. 1.2083193. 1.9660194. 1.2857195. 1.8333196. 1.9783197. 1.0000198. 1.8058199. 1.9444200. 1.4791201. 1,0000202. 1.7058203. 1.2325204. 1.7297205. 1.7666206. 1.1777207. 1.3589208. 1.7753209. 1.8676210, 1.6904211 * 1.0714
55 7453 709 2541 50
53 5236 6244 4026 3037 68p B49 3739 4624 4138 3748 5537 7034 4052 4320 5430 6847 7450 43^ 6340 55ÎI 2I Bi iB is g
Reproduced with permission of the copyright owner. Further reproduction prohibited without permission.

BÎBLIOGRAPHÏ
Reproduced with permission of the copyright owner. Further reproduction prohibited without permission.

BIBLIOGEAPHÏBOOKS
Campbell* William C« A Form Book for Thesis writ-* Boston! Houghton Mlff 1 In Co. * 1939*Cummins* W« D* in The Third Mental Measurements Yearbook. 0* K* Buros* Editor* New Brunswick! Rutgers tJnlverslty Press* 1949#Edwards * Allen L# Statistical AnnlvslB. New York; Rhlnehart and Co.* 1946#Johnson* Palmer 0* Statistical î^ethods In Research. New York! Prentlco-Hall* Inc** 1949#TUrablan* Kate L# A Manual for Writers of Dissertations# Chicago! The University of Chicago
Press* 1937*
ARTICLES
Barrett* Dorothy M, ’Differential Value of Q snd L Scores on the ACS for Predicting Achievement In College Kathemo-tlcs* ** Journal of Pavcholorrv. Vol. 33, 1952, pp. 205-207*
Broim, Hugh S. ”Dlfferential Prediction by the ACS,” Journal of Sducattonal Research. Vol. 44* 1950,
Fisher* R* A, "The Uso of Multiple Measuremnnts In Taxonomic Problems," Annals of Surenlca.Vol. 7* 1936* pp. 3 7 6 - 5 %
Martin* Frederick M, "The Prognostic Value of Significantly Different Q end L Seores of the AGS Psychological Examinâtion at the College Level,” American Psvcholoa-lst. Vol. 5* 1950* p# 471#Osborne* R. T# et.al. "The Differential Predictlorn of College îferka by the ACE Score," Journal of Sducatlonal Research# Vol. 44* 1950, pp. 107-115.
Reproduced with permission of the copyright owner. Further reproduction prohibited without permission.

•45-Sîülth, D##D. and Trlggs, F» 0* "Educational Successes end Failures of Students with Hi h Q and Low L on the ACE Psychological Examination* "- American Peycholomlst» Vol# 5# 1950, pp, 355-
55^Thuretone* L, L, and Thurstone* T. G. "ace Psychological ExaminâtIon for College Freshmen*^ Manual of Instruction. 1947*The American Council on Education* "ACE Psychological Examination - for College Freshmen," Norme Bulletin. 1952.Wallace, W. L. "Dlfrerentlol Predictive Value of the ACE," School and Society. July 9, 1949.
UTTPUBLX SHICD MATKHIA L
Crowley* Joseph R. "An Evaluation of the American Council on Education Psychological Examination and the Cooperative English Test as Guidcneo Instruments at Monatana SOtat© University. " Unpublished Master's Thesis, Department of E:duca- tion, Montana, State University* 1951,
Reproduced with permission of the copyright owner. Further reproduction prohibited without permission.