an investigation of the transferability of trip generation models dr. jerry everett, university of...
TRANSCRIPT

An Investigation of the Transferability of Trip Generation
Models
Dr. Jerry Everett, University of Tennessee - CTR
Dr. Fred Wegmann, University of Tennessee - CEE

Why try to Model and Forecast Future Travel?
• History tells that urban areas change over time
• The nature, location and magnitude of changes are almost always influenced by transportation
• The grand assumption is that if we can model existing travel then we can use that as a basis for forecasting future travel

“Inside the Black Box”The Role of Models in Transportation Planning
Graphic borrowed from, A Transportation Modeling Primer - By Edward A. Beimborn

Can you Identify this location?
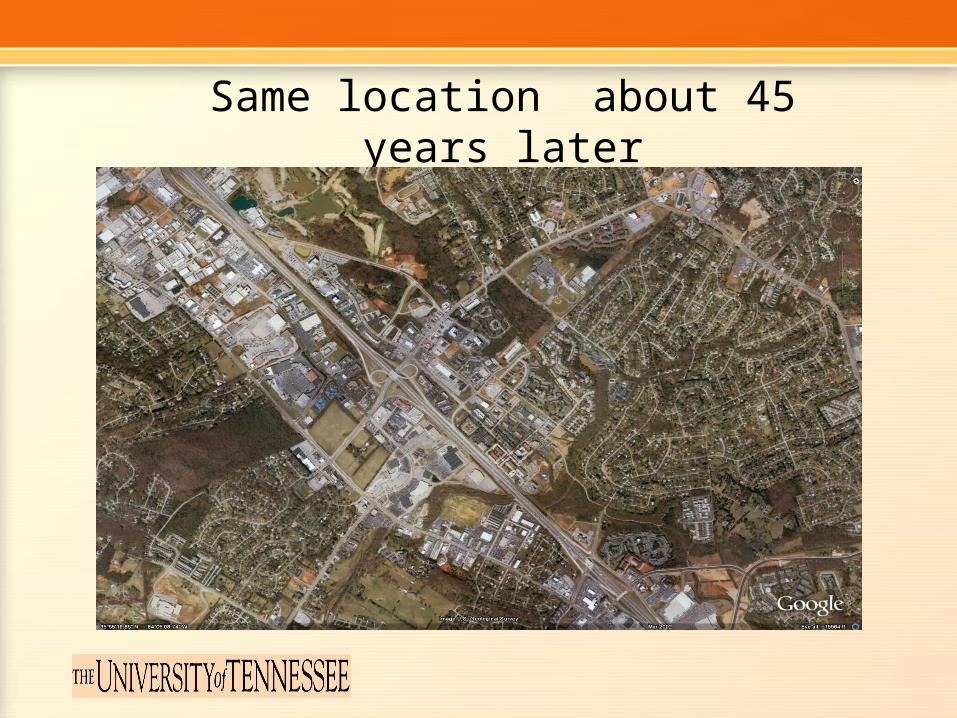
Same location about 45 years later

Motivation for this Research
• Smaller MPOs lack resources to gather local travel data
• Data/models are often borrowed or “transferred” from one area to another
• There is a need for a defensible, repeatable method for making transfer decisions
• Better models may lead to better decisions

History of Transferability of Trip Generation Models
• Validity of transferability has been debated since the infancy of travel demand modeling
• Studied several times using various methods over past 40 years– For example-Nashville and Knoxville were previously
found to have similar trip rates.
• Consensus is maybe - in right circumstances

Phase I: Transferability Research
• Objective: Compare MPO travel rates within Tennessee
• Problem: No travel survey data available for small MPO Areas
• Solution: Conduct surveys for two small MPO areas

Study Areas
Madison County, 560 sq. mi.
Hamblen and Jefferson Counties, 490 sq. mi.

Survey Procedures• RDD sample developed • Advance letter mailed• Recruited via CATI, hh & person data gathered
• Information packet and diaries mailed• Reminder call prior to travel day• Travel activity data retrieved via CATI• Data quality checked then incentives mailed if
applicable

Survey Diary

Survey Scope
Jackson Lakeway
HHs Persons Dates HHs Persons Dates
474 1173 Oct. 2006
June 2007
498 1146 Oct. 2006 May 2007

Distribution of Trips by Purpose
0%
10%
20%
30%
40%
NHB HBO HBW Shop School
Lakeway Jackson
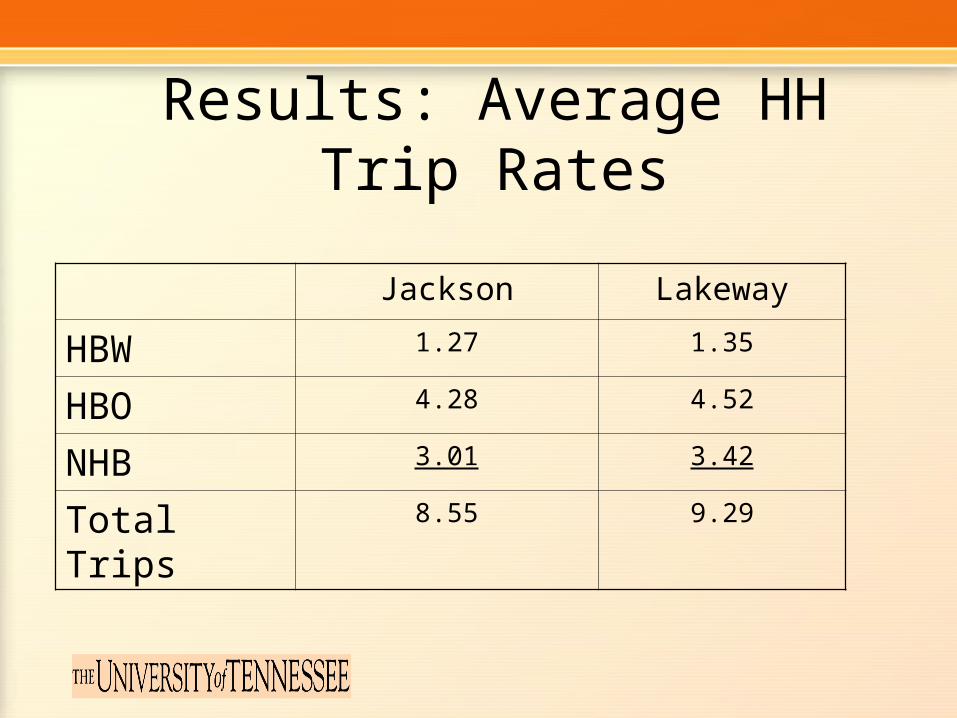
Results: Average HH Trip Rates
Jackson Lakeway
HBW 1.27 1.35
HBO 4.28 4.52
NHB 3.01 3.42
Total Trips 8.55 9.29

Statistical Analysis
where, Xij is the cell mean of the ith row and the jth column of the trip rate matrix for Area 1.Yij is the cell mean of the ith row and the jth column of the trip rate matrix for Area 2.S2xij is the cell variance of the ith row and the jth column for Area 1.S2yij is the cell variance of the ith row and the jth column for Area 2.nij is the number of observations (samples) in the ith row and the jth column for Area 1.mij is the number of observations (samples) in the ith row and the jth column for Area 2.
)///()( 222ijijijijijij
ji
mySnxSYXQ
• The null hypothesis is that the matrices’ cell means are not significantly different • The test statistic will be compared to Chi Sq for i x j degrees of freedom at 0.05 • If Q is larger then the hypothesis can be rejected signifying that the trip rates for the two areas are in fact different

Findings: Phase I• Trip production rates for Jackson and Lakeway
are not statistically different and thus transferable
• Most trip rates for Jackson and Lakeway are statistically different from Knoxville and Nashville
• Streamlined household travel surveys can be conducted for about $75* per complete
• (*Price did not include full geocoding, analysis and project management)
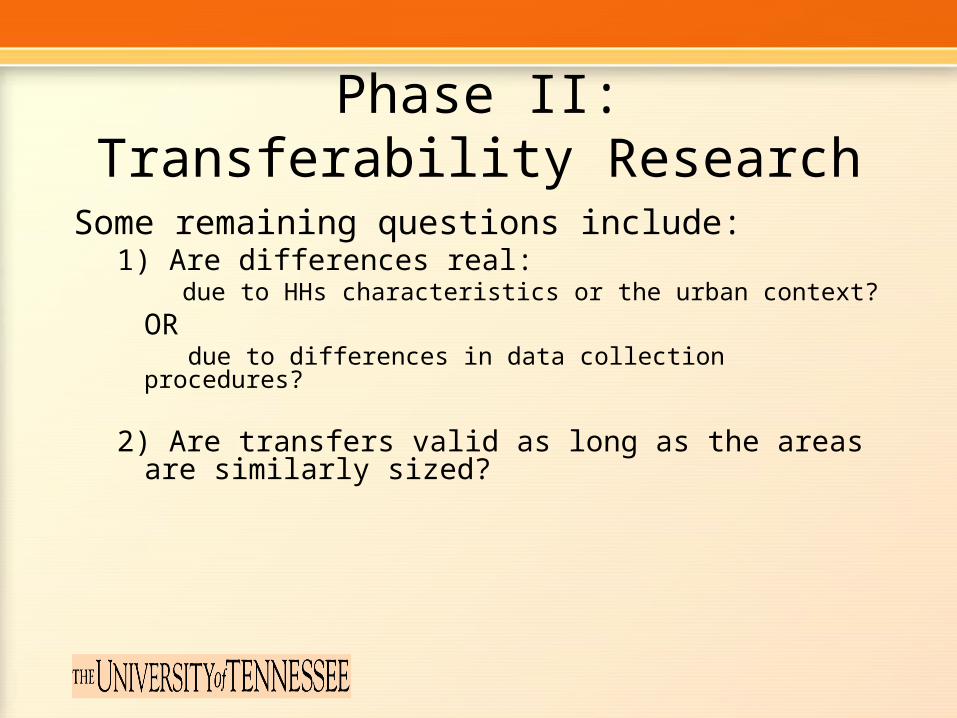
Phase II: Transferability Research
Some remaining questions include:1) Are differences real:
due to HHs characteristics or the urban context?
OR due to differences in data collection procedures?
2) Are transfers valid as long as the areas are similarly sized?

Phase II: Research Objective
Test which is more appropriate:
Transferring from a similarly-sized urban area in a different state/region of the country
or Transferring from an urban area of a different size that is located within the same state?
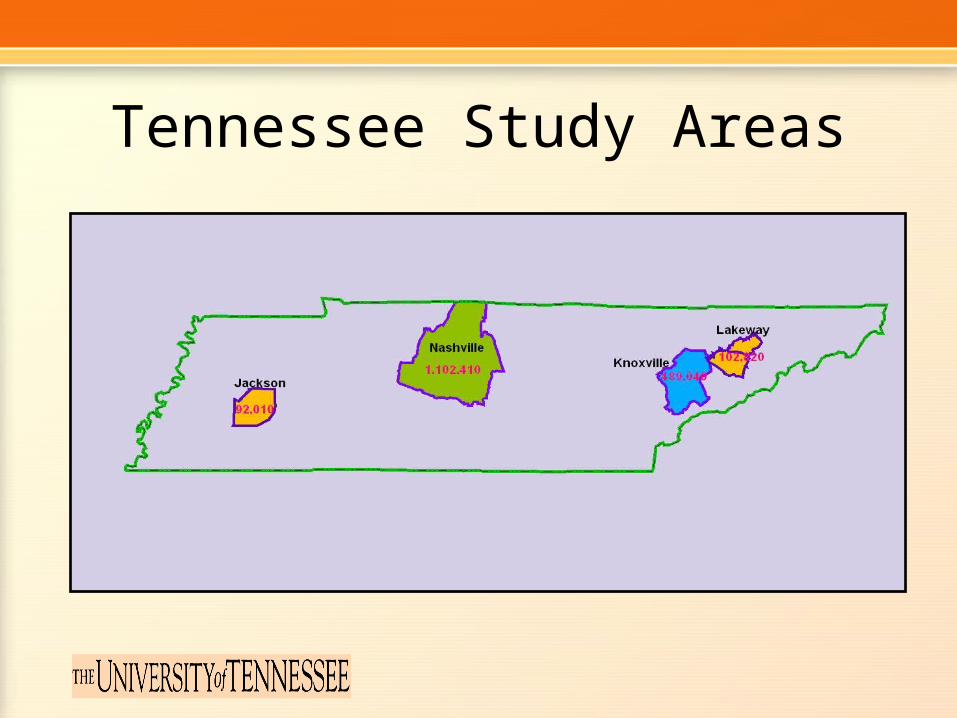
Tennessee Study Areas

Ohio Study Areas

MPO Area Level Results
• 11 comparisons had zero differences• 10 had a difference in one trip category• 15 had differences in two trip categories• 4 had differences in three trip categories 40 = Total area to area comparisons
• All 11 with no differences were within-state comparisons and all 11 pairs had data collected from a common survey
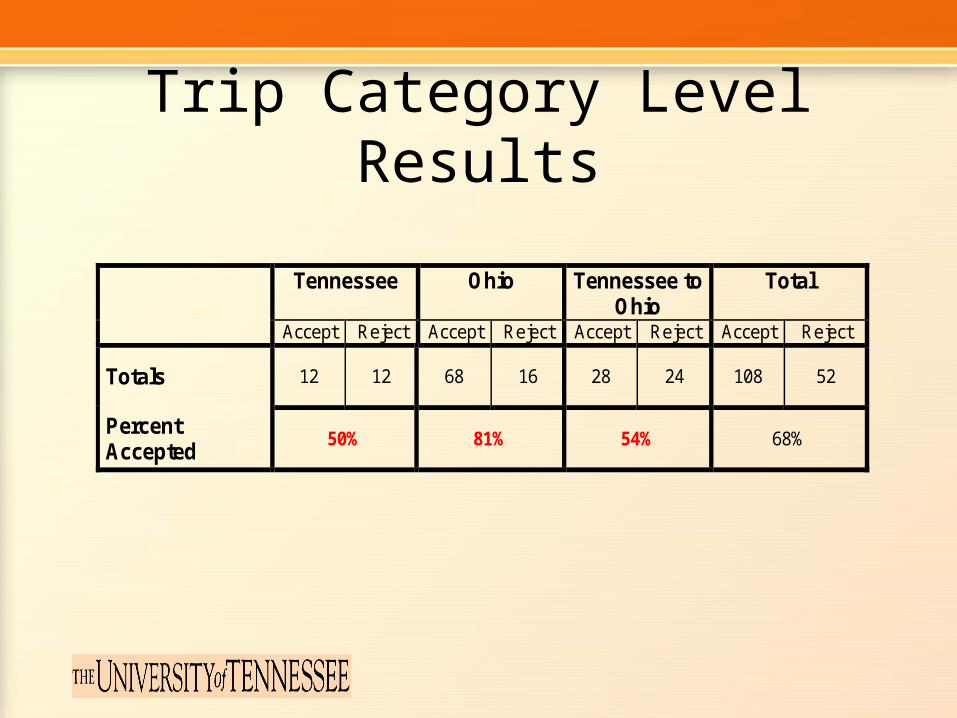
Trip Category Level Results
Tennessee Ohio Tennessee to Ohio
Total
Accept Reject Accept Reject Accept Reject Accept Reject
Totals 12 12 68 16 28 24 108 52
Percent Accepted
50% 81% 54% 68%
Findings: Phase II• Considerable divergence was discovered so transferability
can NOT be advanced as statistically valid on a general basis.
• The results were too mixed to provide clear guidance regarding the selection of an area from which to transfer.
• Though not statistically tested it is very likely that a large portion of differences found were due to survey procedures rather than actual differences in travel.

Issues with Evaluating Transferability of Trip Generation
• Definition of eligible HH survey participants varies• Elements related to when data are collected vary• Survey procedures and quality are often unknown• Unusual circumstances may exist but not be
documented
• Trip/activity: purpose definitions and categories vary

Phase III: Transferability Research
Objective:
Investigate if a meaningful measure of urbanization can be included in trip generation models from different areas to reduce differences between models and thus improve transferability?

Development of Area Types
• Purpose: Add missing dimension to transferability analysis
• Measure: Area Type – “Rural”, “Suburban” and “Urban”
• Approach: Population density based on 1 sq. mi. grids
• Implementation: HHs were attributed with pop density of grid cell in which they are located.
• Categorization Algorithm: TransCAD “Optimal Breaks”

Application of Area Type Measure
Dayton, OH Mansfield, OHRural – 826 HHsSuburban – 366 HHsUrban – 112 HHs
Rural – 688 HHsSuburban – 898 HHsUrban – 364 HHs

Analysis Including Area Type
• A sample of 7 pairs of areas where trips rates were found to be different were re-compared
• These new comparisons were by trip purpose and disaggregated by the area type.
• The same statistical analysis was used as with previous comparisons

Results When Area Type is Included
Ohio to Ohio Tennessee to Ohio
Total
Accept Reject Accept Reject Accept Reject
Percent Accepted
Rural 10 0 3 1 13 1 93%
Suburban 5 5 2 2 7 7 50%
Urban 9 1 9 1 90%
Totals 24 6 5 3 29 9 76%
Percent Accepted 80% 62.5% 76% 76%
Note: Each of these comparison failed the prior test when area type was not included
Findings: Phase III
• A straightforward and meaningful measure of urbanization can be included in trip generation models using area type.
• Including area type significantly improves the results of the transfers.
• The procedures, tools and types of data used in this research are readily available to practitioners and are straightforward enough to be implemented by analysts in many small and medium-sized MPOs.

Summary & Conclusions
• Transferability is not as straightforward as hoped
• Methods are available to improve transferability results
• The standardization of survey practices could save costs and improve transferability analysis
• Additional research is needed on the topic