an investigation of the influence of diaphragm flexibility
TRANSCRIPT

AN INVESTIGATION OF THE INFLUENCE OF DIAPHRAGM FLEXIBILITY ON
BUILDING DESIGN THROUGH A COMPARISON OF FORCED VIBRATION
TESTING AND COMPUTATIONAL ANALYSIS
A Thesis
presented to
the Faculty of California Polytechnic State University,
San Luis Obispo
In Partial Fulfillment
of the Requirements for the Degree
Master of Science in Architecture with a Specialization in Architectural Engineering
by
Blake Alan Roskelley
October 2010

ii
© 2010 Blake Alan Roskelley
ALL RIGHTS RESERVED

iii
COMMITTEE MEMBERSHIP
TITLE: An Investigation of the Influence of Diaphragm
Flexibility on Building Design through a Comparison
of Forced Vibration Testing and Computational
Analysis
AUTHOR: Mr. Blake Alan Roskelley
DATE SUBMITTED: October 2010
COMMITTEE CHAIR: Dr. Cole McDaniel, PE
COMMITTEE MEMBER: Dr. Graham Archer, P.Eng.
COMMITTEE MEMBER: Mr. Kevin Dong, SE
iv
ABSTRACT
An Investigation of the Influence of Diaphragm Flexibility on Building Design through a
Comparison of Forced Vibration Testing and Computational Analysis
Blake Alan Roskelley
An assessment of the validity of idealizing a concrete diaphragm as rigid was performed through the modal analysis of three existing buildings. Modal analysis was performed both by physical experimentation and computational analysis. Experimental determination of the mode shapes shows that two of the three buildings’ diaphragms exhibited flexible behavior. The experimental results were compared to computational analysis results and were shown to be similar, confirming that that the two building diaphragms are not rigid. As a standard, diaphragms with aspect ratios less than three are permitted to be idealized as rigid per ASCE 7-05. To determine the effect of the rigid diaphragm idealization, the design forces and roof deflections for each building were determined from the computational model through a spectral analysis for both a model with rigid diaphragms and a model with semi-rigid diaphragms. It was found that the design seismic demands for the two buildings with flexible diaphragms were higher when modeled with semi-rigid diaphragms than with rigid diaphragms. The conclusion is made that idealizing a concrete diaphragm as rigid solely based on its aspect ratio may result in an unconservative estimate of the seismic demands on a building. Keywords: Modal Analysis, Forced Vibration, Rigid Diaphragm Assumption

v
Contents
List of Figures ....................................................................................................................vi List of Tables ....................................................................................................................vii List of Nomenclature .......................................................................................................viii 1.0 Introduction................................................................................................................... 1
1.1 Background ............................................................................................................... 11.2 Literature Review...................................................................................................... 21.3 Method ...................................................................................................................... 31.4 Structural Basis ......................................................................................................... 41.5 Experimental Basis ................................................................................................... 8
2.0 Experimental Testing .................................................................................................. 112.1 EWB Unit 5 Ambient Vibration Test ..................................................................... 122.2 EWB Unit 5 Forced Vibration Test ........................................................................ 142.3 Mode Shapes........................................................................................................... 172.3.1 EWB Unit 5 Mode Shape .................................................................................... 172.3.2 EWB Unit 3 Mode Shape .................................................................................... 212.3.3 CM Building Mode Shape ................................................................................... 23
3.0 Computational Analysis and Comparison .................................................................. 253.1 EWB Unit 5 Computational Model ........................................................................ 263.2 EWB Unit 3 Computational Model ........................................................................ 323.3 CM Building Computational Model ....................................................................... 34
4.0 Design implications .................................................................................................... 385.0 Structural Considerations............................................................................................ 45
5.1 Relative Stiffness .................................................................................................... 455.2 Additional Sources of Building Stiffness ............................................................... 485.3 Building Isolation and Seismic Joints..................................................................... 505.4 Simplification of Mass Modeling ........................................................................... 52
6.0 Conclusion .................................................................................................................. 537.0 Reference .................................................................................................................... 55

vi
List of Figures
Figure A. EWB Unit 5 a) Plan b) Elevation ....................................................................... 4Figure B. EWB Unit 3 a) Plan b) Elevation........................................................................ 5Figure C. CM Building a) Plan b) elevation ....................................................................... 6Figure D. EWB Unit 5, EWB Unit 3, CM Building Plan View ......................................... 7Figure E. Test Equipment (Shaker, Computer, Accelerometer)......................................... 8 Figure F. Test Setup............................................................................................................ 9Figure G. Ambient vibration FFT response...................................................................... 13Figure H. EWB Unit 5 Floor Forced vibration response .................................................. 14Figure J. EWB Unit 5 Mode Shape at 5.3 Hz................................................................... 18Figure K. EWB Unit 5 Mode Shape at 9.25 Hz................................................................ 19Figure L. EWB Unit 5 Elevation View of Mode Shape at 5.3 and 9.25 Hz..................... 20Figure M. EWB Unit 3 Floor EW Mode Shape at 6.4 Hz ................................................ 22Figure N. CM Building 3rd Floor NS Mode Shape at 3.61 Hz ........................................ 23Figure P. EWB Unit 5 Computer Generated Model ......................................................... 26Figure Q. EWB Unit 5 Computational Floor 1st Mode Shape & Experimental ............... 28Figure R. EWB Unit 5 Computational Floor 2nd Mode Shape & Experimental............... 29Figure S. EWB Unit 5 Computational Vertical Mode Shape 1 and 2 .............................. 31Figure T. EWB Unit 3 Computer Generated Model......................................................... 32Figure U. EWB Unit 3 Floor First EW Mode Shape........................................................ 33Figure V. CM Building Computer Generated Model ....................................................... 35Figure W. CM Building 3rd Floor First NS Mode Shape.................................................. 36Figure X. ASCE 7-05 Design Response Spectrum........................................................... 38Figure Y. SAC Averaged Response Spectra with Trend Line.......................................... 40 Figure Z. Plot of Deformation Ratio to Relative Stiffness Ratio..................................... 47

vii
List of Tables
Table 1. Diaphragm Aspect Ratios ..................................................................................... 7
Table 2. Experimentally Determined Modal Frequencies ................................................ 16
Table 3. EWB Unit 5 Mode 1 Floor Diaphragm Rotations .............................................. 21
Table 4. EWB Unit 3 Floor Diaphragm Rotations ........................................................... 22
Table 5. CM Building Floor Rotations ............................................................................. 24
Table 6. Comparison of Modal Frequencies for EWB Unit 5 [Hz].................................. 27
Table 7. Comparison of MAC Numbers for EWB Unit 5 ................................................ 30
Table 8. Comparison of Modal Frequencies EWB Unit 3 [Hz] ....................................... 32 Table 9. Comparison of MAC Numbers for EWB Unit 3 ................................................ 34 Table 10. Comparison of CM Building Modal Frequencies [Hz] .................................... 35
Table 11. Comparison of MAC Numbers for CM Building............................................. 37
Table 12. ASCE7-05 Comparison of Design Parameters................................................. 41
Table 13. SAC Comparison of Design Parameters........................................................... 43
Table 14. Relative Stiffness .............................................................................................. 46

viii
List of Nomenclature
ASCE – American Society of Civil Engineers
CM – Construction Management
COMP – computer or computational
DBE – Design Basis Earthquake
EW – east-west
EWB – Engineering West Building
EXP – experimental or experiment
FFT – Fast Fourier Transform
g – Units of Gravity
Hz – Hertz
ksi – kips per square inch
LFRS – Lateral Force Resisting System
MAC – Modal Assurance Criterion
MCE – Maximum Considered Earthquake
MEP – Mechanical, Electrical, and Plumbing
NS – north-south
psf – pounds per square foot
rms – Root Mean Square
μg – Units of Gravity Times Ten to the Minus 6
Introduction 1
An Investigation of the Influence of Diaphragm Flexibility on Building Design through a
Comparison of Forced Vibration Testing and Computational Analysis
1.0 INTRODUCTION
Retrofit schemes and new building designs are often based on computer models
created in structural analysis software programs. These programs allow the designer to
approximate the results for a building’s modal periods of vibration and mode shapes.
Computer programs are often used by a designer to determine the forces used in the
design of the lateral force resisting system. A designer makes many assumptions that
affect the results of the computational output. One decision that can have considerable
effect on building analysis and design is the rigidity of the diaphragm. The floor and roof
diaphragms can be defined as rigid or semi-rigid, and it is up to the designer to determine
which designation is more accurate.
ASCE 7-05 allows a building designer to idealize a concrete diaphragm as rigid
solely based on the diaphragm’s aspect ratio. It states
12.3.1.2 Rigid Diaphragm Condition. Diaphragms of concrete slabs or concrete filled metal deck with span to dept ratios of 3 or less in structures that have no horizontal irregularities are permitted to be idealized as rigid.
This thesis investigates the effect that idealizing a diaphragm as rigid has on building
design and addresses the validity of the above statement (ASCE 7-05 2006).
1.1 Background
This thesis will evaluate the rigidity of the concrete floor diaphragms of three
buildings by performing a modal analysis both through physical experimentation and
computational analyses. Modal analysis of structures is concerned with determining the
structure’s modal parameters. The modal parameters of a structure can be determined
both experimentally and by computational analyses. Through experimental testing the

Introduction 2
An Investigation of the Influence of Diaphragm Flexibility on Building Design through a
Comparison of Forced Vibration Testing and Computational Analysis
structure can be analyzed by the means of ambient or forced vibration to determine its
modal parameters. The structure can also be modeled (based on its configuration, taking
into consideration mass, stiffness, and damping properties) and analyzed through the use
of a computation model.
1.2 Literature Review
A method for using ambient vibration measurements to determine natural
frequencies, damping ratios, and mode shapes was presented by Kondo and Hamamoto in
their article “Local damage detection of flexible offshore platforms using ambient
vibration measurement”. The authors compared the change in the curvature of mode
shapes between damaged and undamaged states. They then quantitatively evaluated the
damage in a particular location of the structure by a perturbation method detailed in their
article (Kondo and Hamamoto 1994). This paper’s use of modal analysis by ambient
vibration testing served as a basis for the testing of the structures in the current project.
Others have done research using ambient vibration to perform modal analyses as well
(Trifunac 1972) (Ivanovic and Todorovska 2000) (Feng and Xue 1998).
Forced vibration testing was done on an existing four-story reinforced concrete
building damaged by the 1994 Northridge earthquake to predict the future response of the
structure. In “Forced Vibration Testing of a Four Story Reinforced Concrete Building
Utilizing the NEES@UCLA Mobile Field Laboratory” the authors reported the results
received from a large array of accelerometer sensors throughout the structure. Building
accelerations were excited by ambient vibrations and forced vibrations, using two
eccentric mass shakers with force capability of 100 kips each and a linear shaker with a

Introduction 3
An Investigation of the Influence of Diaphragm Flexibility on Building Design through a
Comparison of Forced Vibration Testing and Computational Analysis
force capability of 15 kips. In their conclusion, the authors suggested further assessment
of their results to determine the degree of damage that resulted from the Northridge
earthquake. They suggested analyzing local site specific ground motions and performing
nonlinear structural analysis (Yu and Wallace 2008). Similar research has been done on a
15 story steel moment-resisting frame building (Skolnik and Wallace 2006). A similar
approach to forced vibration and response data acquisition was used for the testing in this
thesis (Yu 2005).
The experimental results for the modal frequencies from the testing performed by
McDaniel and Archer in their papers “Improving Student Understanding of Structural
Dynamics Using Full-Scale, Real-time Excitation of Buildings” and “Full-Scale Real-
Time Building Dynamics Laboratory” were used in this thesis (McDaniel and Archer
2010b; 2010a). Also, the same method for determining the experimental results for the
modal frequencies and mode shapes detailed in those papers was used in this thesis.
1.3 Method
This thesis documents the procedure, records the data, and compares the results of
the experimental testing of three buildings to computational models. The modal
parameters obtained from both analyses are compared for each building. The modal
parameters include the modal frequencies of vibration, the mode shapes, and the modal
damping. For the purposes of this thesis the modal frequencies and mode shapes are
primarily investigated because they are the parameters that are most affected by the
rigidity of the floor diaphragms. After determining the affect that the diaphragm rigidity
has on the building design, the thesis then investigates what building characteristic has
Introduction 4
An Investigation of the Influence of Diaphragm Flexibility on Building Design through a
Comparison of Forced Vibration Testing and Computational Analysis
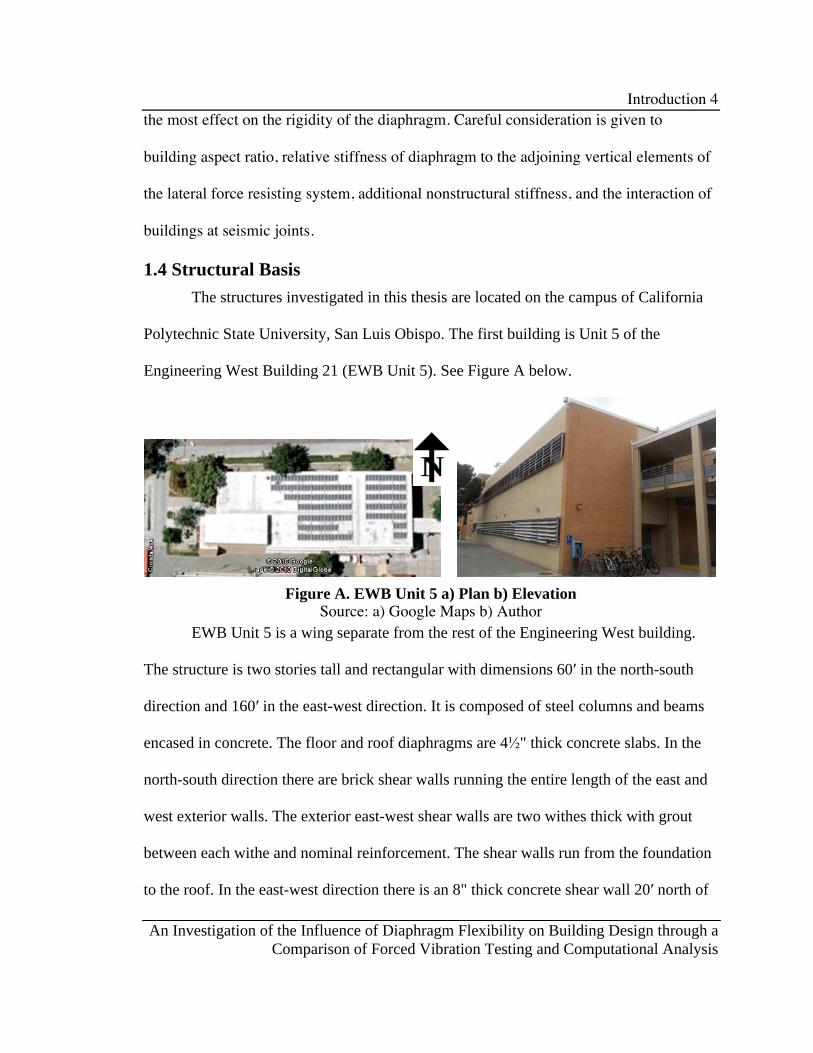
Figure A. EWB Unit 5 a) Plan b) Elevation Source: a) Google Maps b) Author
the most effect on the rigidity of the diaphragm. Careful consideration is given to
building aspect ratio, relative stiffness of diaphragm to the adjoining vertical elements of
the lateral force resisting system, additional nonstructural stiffness, and the interaction of
buildings at seismic joints.
1.4 Structural Basis
The structures investigated in this thesis are located on the campus of California
Polytechnic State University, San Luis Obispo. The first building is Unit 5 of the
Engineering West Building 21 (EWB Unit 5). See Figure A below.
EWB Unit 5 is a wing separate from the rest of the Engineering West building.
The structure is two stories tall and rectangular with dimensions 60 in the north-south
direction and 160 in the east-west direction. It is composed of steel columns and beams
encased in concrete. The floor and roof diaphragms are 4 " thick concrete slabs. In the
north-south direction there are brick shear walls running the entire length of the east and
west exterior walls. The exterior east-west shear walls are two withes thick with grout
between each withe and nominal reinforcement. The shear walls run from the foundation
to the roof. In the east-west direction there is an 8" thick concrete shear wall 20 north of

Introduction 5
An Investigation of the Influence of Diaphragm Flexibility on Building Design through a
Comparison of Forced Vibration Testing and Computational Analysis
the south exterior wall that runs the entire length of the building. It is two stories in height
and perforated at the ground floor and the second floor by four 8 by 3 doors at
approximately 30 on center.
In addition to EWB Unit 5, two other structures also located on the Cal Poly
campus were investigated. The first tested was Unit 3 of Engineering West Building 21
(EWB Unit 3). This building is of similar construction to EWB Unit 5. It is a two story
building with a partial basement on the south end of the building. It is rectangular with
dimensions 138 in the north-south direction and 48 in the east-west direction. Similar to
EWB Unit 5, EWB Unit 3 has steel wide flange beams and columns encased in concrete.
Unlike EWB Unit 5 it does not have masonry shear walls but only smaller 20 long
concrete shear walls in various locations, as seen in Figure D on page 7. Also, it does not
have one large full length concrete shear wall like EWB Unit 5. This building was
chosen in order to compare and verify the results of EWB Unit 5 because of its similarity
in construction type and diaphragm aspect ratio. See Figure B below.
Figure B. EWB Unit 3 a) Plan b) elevation
Source: a) Google Maps b) author

Introduction 6
An Investigation of the Influence of Diaphragm Flexibility on Building Design through a
Comparison of Forced Vibration Testing and Computational Analysis
The third building tested was the Construction Management Building 186 (CM
Building). This building is a steel braced frame structure. The building is three stories
tall. It is ‘L’ shaped and 198 in the east-west direction and 60 in the north-south
direction with a 40 by 30 appendage on the south east end of the building. It has 3"
concrete over 3" metal deck floor diaphragms and there is no concrete fill over the 3"
metal deck roof diaphragm. See Figure C below.
Figure D, on the next page, shows a plan view of each building with the
dimensions of the floor diaphragms and the locations of the lateral force resisting
elements.
Figure C. CM Building a) Plan b) elevation
Source: a) Google Maps b) author

Introduction 7
An Investigation of the Influence of Diaphragm Flexibility on Building Design through a
Comparison of Forced Vibration Testing and Computational Analysis
The aspect ratio of each building is listed in Table 1 below.
Table 1. Diaphragm Aspect Ratios
All the buildings investigated in this thesis have aspect ratios of less than three.
Therefore, according to ASCE 7-05 their diaphragms may be idealized as rigid. The
following testing was done to verify the validity of this idealization. If it is correct to
Figure D: EWB Unit 5, EWB Unit 3, CM Building Plan View
Introduction 8
An Investigation of the Influence of Diaphragm Flexibility on Building Design through a
Comparison of Forced Vibration Testing and Computational Analysis
make this idealization, then the buildings should show rigid diaphragm behavior. And, if
they do not show rigid diaphragm behavior then the design of the buildings should not be
adversly affected by idealizing the diaphragms as rigid in order for the code provision to
be valid.
1.5 Experimental Basis
Testing equipment was set up on all three sites for the purpose of achieving
experimental results for the resonance frequencies and mode shapes. The testing
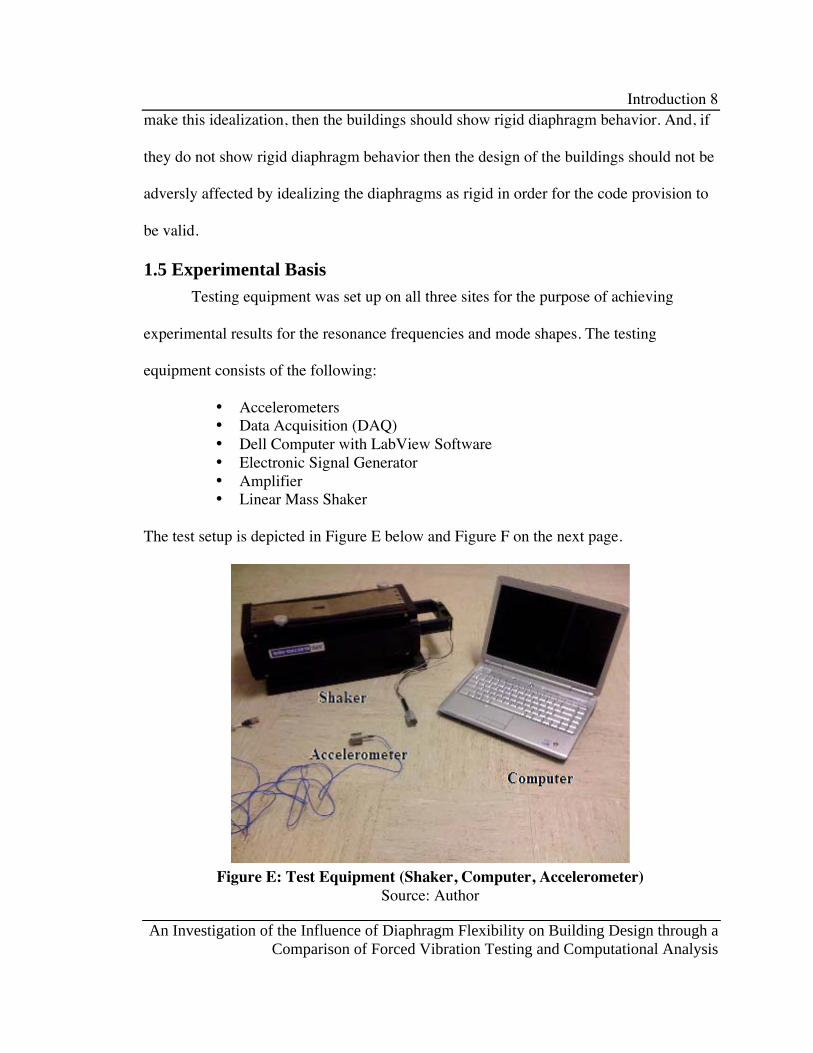
equipment consists of the following:
• Accelerometers • Data Acquisition (DAQ) • Dell Computer with LabView Software • Electronic Signal Generator • Amplifier • Linear Mass Shaker
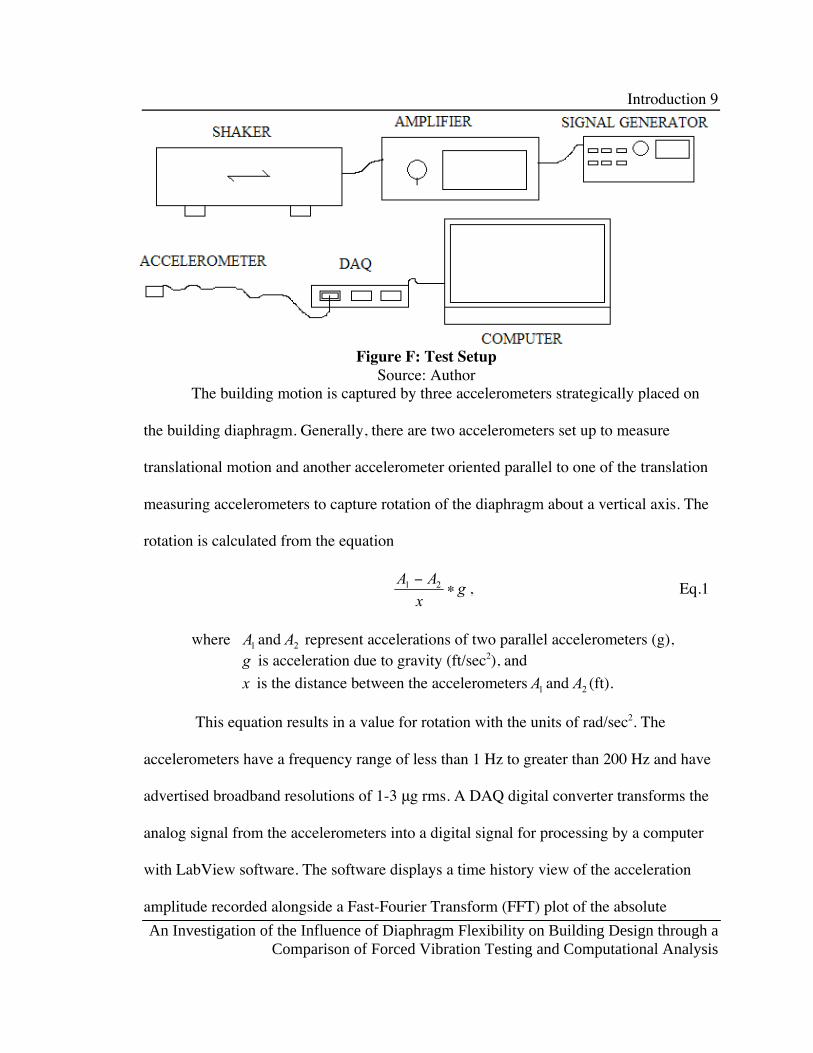
The test setup is depicted in Figure E below and Figure F on the next page.
Figure E: Test Equipment (Shaker, Computer, Accelerometer) Source: Author
Introduction 9
An Investigation of the Influence of Diaphragm Flexibility on Building Design through a
Comparison of Forced Vibration Testing and Computational Analysis
The building motion is captured by three accelerometers strategically placed on
the building diaphragm. Generally, there are two accelerometers set up to measure
translational motion and another accelerometer oriented parallel to one of the translation
measuring accelerometers to capture rotation of the diaphragm about a vertical axis. The
rotation is calculated from the equation
, Eq.1
where and represent accelerations of two parallel accelerometers (g), is acceleration due to gravity (ft/sec2), and
is the distance between the accelerometers and (ft).
This equation results in a value for rotation with the units of rad/sec2. The
accelerometers have a frequency range of less than 1 Hz to greater than 200 Hz and have
advertised broadband resolutions of 1-3 g rms. A DAQ digital converter transforms the
analog signal from the accelerometers into a digital signal for processing by a computer
with LabView software. The software displays a time history view of the acceleration
amplitude recorded alongside a Fast-Fourier Transform (FFT) plot of the absolute
Figure F: Test Setup Source: Author

Introduction 10
An Investigation of the Influence of Diaphragm Flexibility on Building Design through a
Comparison of Forced Vibration Testing and Computational Analysis
response of each frequency obtained. The FFT view is necessary to determine the relative
signs (positive or negative) of the different accelerometer responses.
The forced vibration is produced by a 100 pound portable long-stroke linear mass
shaker with the capability of generating a constant sinusoidal force of 30 pounds. The
shaker’s frequency range is approximately 2-20 Hz. Mechanical attachment of the shaker
to the structural diaphragm is not necessary. Friction at the shaker base is sufficient to
transfer the motion of the shaker into the structure due to the small forces that are
generated (McDaniel and Archer, 2010a).

Experimental Testing 11
An Investigation of the Influence of Diaphragm Flexibility on Building Design through a
Comparison of Forced Vibration Testing and Computational Analysis
2.0 EXPERIMENTAL TESTING
The test equipment, described in Section 1.5 and starting on page 8, was used to
perform a forced vibration test of EWB Unit 5, EWB Unit 3, and the CM Building. The
purpose of forced vibration testing is to obtain the natural frequencies of vibration, the
mode shapes and damping of a building.
To validate and verify the ability of a 30 pound linear mass shaker to produce
measurable accelerations in a nearly 2,000 ton building, a hand calculation was
performed to determine the level of accelerations that 30 pounds of force would produce
on such a building analytically. As a basis for this calculation the EWB Unit 5 was used.
The mass matrix was assembled through an estimation of the building weight. The
damping used was determined to be 1.67% from the experimental results of the forced
vibration test at the first mode. The mode shape for three degrees of freedom (two
translational degrees of freedom and one rotational degree of freedom) at the center of
mass of the floor and roof, and the modal frequencies of vibration were determined
through computational analysis in computer software. The mode shape was mass
orthonormalized. The acceleration, at the first degree of freedom, (at the floor in the
north/south direction) produced when the building is forced at the floor, at the first modal
frequency, by a 30 pound sine wave was then calculated (Chopra 2007). The equations
used are
, Eq. 2
, Eq. 3
, Eq. 4
where represents the modal coordinates, and represent coefficients defined by Chopra on page 480 of his text,

Experimental Testing 12
An Investigation of the Influence of Diaphragm Flexibility on Building Design through a
Comparison of Forced Vibration Testing and Computational Analysis
represents time from 0 to 2 pi, represents the orthonormalized mode shape vector,
represents the nodal displacements vector, represents the modal frequencies vector, and represents the nodal accelerations vector.
The calculation resulted in a value for acceleration at the floor in the north-south
degree of freedom of 0.0842 in/sec2, which is equal to 2.18 10-4 g or 218 g. The average
response measured experimentally by the accelerometers at the first floor, at the center of
mass, at the first mode was 233 g. The percent difference between these two values is
6.4%.
2.1 EWB Unit 5 Ambient Vibration Test
Initially, an ambient vibration test was performed in order to obtain a baseline for
EWB Unit 5. Two accelerometers were placed at the approximate center of mass of EWB
Unit 5. The accelerometers were oriented perpendicular to each other, one in the east-
west direction and one in the north-south direction of the building. An additional
accelerometer was placed 16 away from the accelerometer oriented in the north-south
direction and was oriented in the same direction in order to determine rotational
accelerations. A distance of 16 was determined to produce a rotational magnitude in the
same range as the translational response. The results of the FFT plot of the ambient
vibration test are shown below in Figure G on the following page. The units of the
translation response are in acceleration (g) and the units of the rotational response are in
rad/s2 as described previously.

Experimental Testing 13
An Investigation of the Influence of Diaphragm Flexibility on Building Design through a
Comparison of Forced Vibration Testing and Computational Analysis
Inititially, the plot showed three very large and distinct spikes that dwarfed the
rest of the plot. A modal frequency will appear on the FFT plot as a curved peak. The
sharpness of the peak depends on the amount of damping in that particular mode. A sharp
peak suggests that the structure does not provide a significant amount of damping at that
frequency. Because of the sharpness of several of the peaks in the ambient vibration
response FFT plot, it was determined that they were due to mechanical units or other
oscillating devices on the roof or other parts of the building. Therefore, these extremely
sharp peaks were truncated (thus not visible in the plot in Figure G on the previous page)
and disregarded as potential modal frequencies of vibration.
There appears to be a natural frequency just above 5 Hz and 9 Hz in the north-
south direction. The east-west response is much smaller and less clear than the north-
south. There also appears to be a rotational natural frequency at 11 Hz to 12 Hz.
Figure G: Ambient vibration FFT response

Experimental Testing 14
An Investigation of the Influence of Diaphragm Flexibility on Building Design through a
Comparison of Forced Vibration Testing and Computational Analysis
2.2 EWB Unit 5 Forced Vibration Test
After the ambient test was performed, the linear mass shaker was set up at the
building’s approximate center of mass on the floor diaphragm. The shaker was set to
sweep between frequencies from 4 Hz to 10 Hz on an interval of 120 seconds. In
LabView, the data was recorded ten times (making a total test period of 20 minutes) and
then averaged to create one plot. The same process was repeated for frequencies between
10 Hz and 15 Hz. The shaker was set up to sweep in both translational directions, north-
south and east-west. It was also placed away from the center of mass on a 45 degree
angle in order to excite the building’s rotational modes of vibration. The data was
recorded and plotted on a scale of 4 Hz to 15 Hz as seen in Figure H below.
The forced vibration test showed that there were two (primarily north-south)
modes present. The modes occur at approximately 5.5 Hz and 9.5 Hz. The break in
sweeps is noticeable at just before 10 Hz in the plot as the response decreases
dramatically and then increases again just after 10 Hz. This break is due to the shaker’s
transition from high frequency output to low frequency output. Had the shaker been
Figure H: EWB Unit 5 Floor Forced vibration response

Experimental Testing 15
An Investigation of the Influence of Diaphragm Flexibility on Building Design through a
Comparison of Forced Vibration Testing and Computational Analysis
allowed to sweep continuously through 10 Hz, this break would not be present. The
sweeps were set at small intervals because with shorter frequency intervals the shaker
spent more time at each frequency. The added time at each frequency within the interval
increased the magnitude of the response at the modal frequencies and made them clearer.
Two natural modes of vibration are clearly present from the forced vibration test,
both of which are in the north-south direction (approximately 5.5 Hz and 9.5 Hz).
However, there are no other modes that clearly appear before 15 Hz. The range of the
equipment goes to approximately 25 Hz; therefore, in order to ensure that no other modes
were overlooked, a forced vibration test was also performed at these higher frequencies.
However, no natural frequencies were found.
No modes were found in the east-west direction possibly because of the high
stiffness of the lateral force resisting system in the east-west direction. There is an 8"
thick concrete shear wall that runs the full 160 length and 28 height of the building from
east to west. Performing a rudimentary hand calculation for the in-plane natural mode of
vibration for the shear wall alone produces a natural frequency of approximately 19 Hz.
The stiffness of the brick wall on the south side of the building and any other stiffness
from columns or incidental stiffness was not included in the calculation. Therefore, the
overall building natural frequency is likely even higher. The accuracy of the equipment
comes into question between 20 Hz and 25 Hz because of the shaker’s inability to
provide a pure sinusoidal frequency output. Therefore, it is reasonable to assume that the
translational east-west modal frequency occurs out of the range of the equipment.
Experimental Testing 16
An Investigation of the Influence of Diaphragm Flexibility on Building Design through a
Comparison of Forced Vibration Testing and Computational Analysis
To confirm that the modal frequencies determined in the sweeps were correct, the
shaker was programmed to force at those frequencies, 5.5 Hz and 9.5 Hz. Then, readings
were taken for the frequencies 0.5 Hz below and above 5.5 Hz and 9.5 Hz at intervals of
0.05 Hz. The modal frequencies determined in the sweeps were confirmed to be at 5.3 Hz
and 9.25 Hz as modes in the north-south direction of EWB Unit 5.
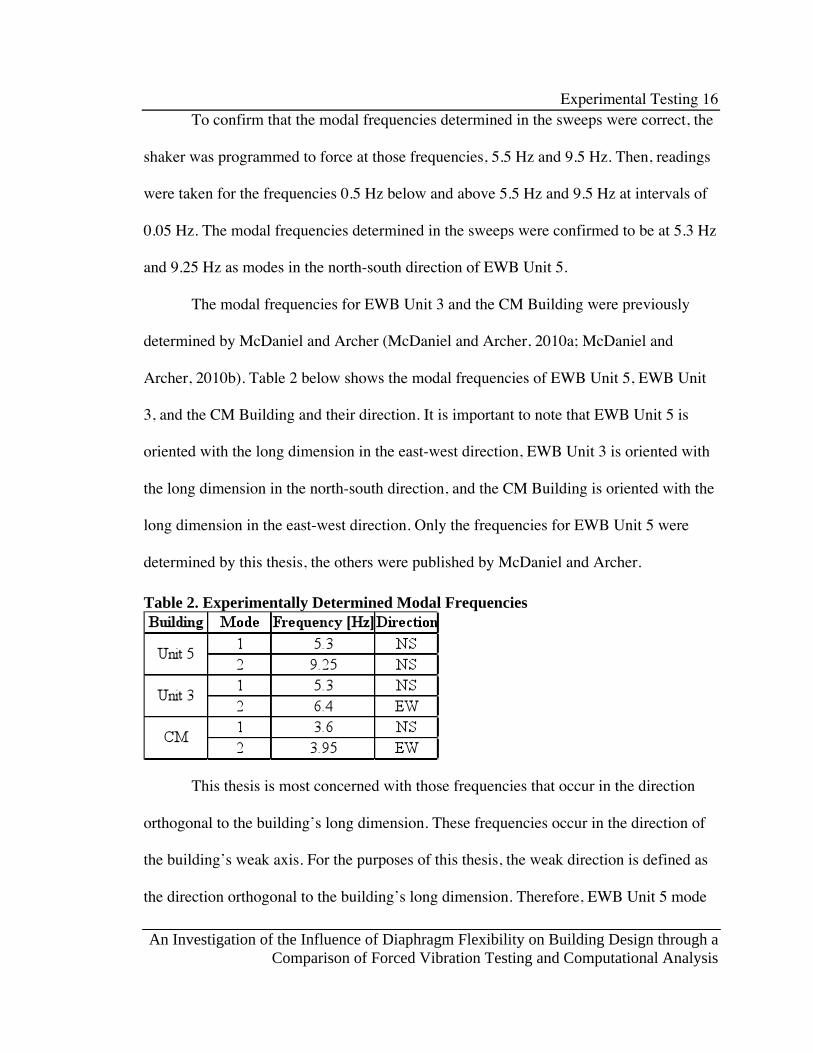
The modal frequencies for EWB Unit 3 and the CM Building were previously
determined by McDaniel and Archer (McDaniel and Archer, 2010a; McDaniel and
Archer, 2010b). Table 2 below shows the modal frequencies of EWB Unit 5, EWB Unit
3, and the CM Building and their direction. It is important to note that EWB Unit 5 is
oriented with the long dimension in the east-west direction, EWB Unit 3 is oriented with
the long dimension in the north-south direction, and the CM Building is oriented with the
long dimension in the east-west direction. Only the frequencies for EWB Unit 5 were
determined by this thesis, the others were published by McDaniel and Archer.
This thesis is most concerned with those frequencies that occur in the direction
orthogonal to the building’s long dimension. These frequencies occur in the direction of
the building’s weak axis. For the purposes of this thesis, the weak direction is defined as
the direction orthogonal to the building’s long dimension. Therefore, EWB Unit 5 mode
Table 2. Experimentally Determined Modal Frequencies

Experimental Testing 17
An Investigation of the Influence of Diaphragm Flexibility on Building Design through a
Comparison of Forced Vibration Testing and Computational Analysis
1 and 2, EWB Unit 3 mode 2, and CM Building Mode 1 are those modes under
investigation.
2.3 Mode Shapes
Having determined the modal frequencies, the mode shapes for each building’s
weak axis frequency were then mapped. Mode shape mapping is the process by which the
physical deformational response of a building’s footprint is determined. The mode shape
shows the direction and relative magnitude of the response at each point of a building’s
diaphragm at a modal frequency.
It was necessary to map the mode shapes for each building, EWB Unit 5, EWB
Unit 3, and the CM Building. The same procedure for obtaining the mode shapes of EWB
Unit 5 was applied to the other two buildings as well.
2.3.1 EWB Unit 5 Mode Shape
The accelerometers were placed at particular locations throughout the floor and
roof diaphragms to obtain readings for the response at each location. The locations at
which the accelerometers were placed initially were chosen in order to obtain a
comprehensive understanding of the motion of the diaphragm. An accelerometer was
placed at the approximate building center of mass and another near the east building edge
to capture the response at the east edge of the diaphragm. Both accelerometers were
oriented in the north-south direction. The accelerometer at the building edge read
approximately 40 percent the response at the center of mass at the first modal frequency,
5.3 Hz. To determine the motion of the diaphragm between these two points, the entire
floor in the north-south direction was mapped by placing an accelerometer approximately
every 15’ across the diaphragm. The roof was excited by placing the shaker at the floor
Experimental Testing 18
An Investigation of the Influence of Diaphragm Flexibility on Building Design through a
Comparison of Forced Vibration Testing and Computational Analysis
diaphragm’s center of mass. Measurements were also taken at various locations along the
length of the roof diaphragm to map the mode shape along the length of the roof
diaphragm. Due to water puddles from rain, the roof diaphragm could not be measured at
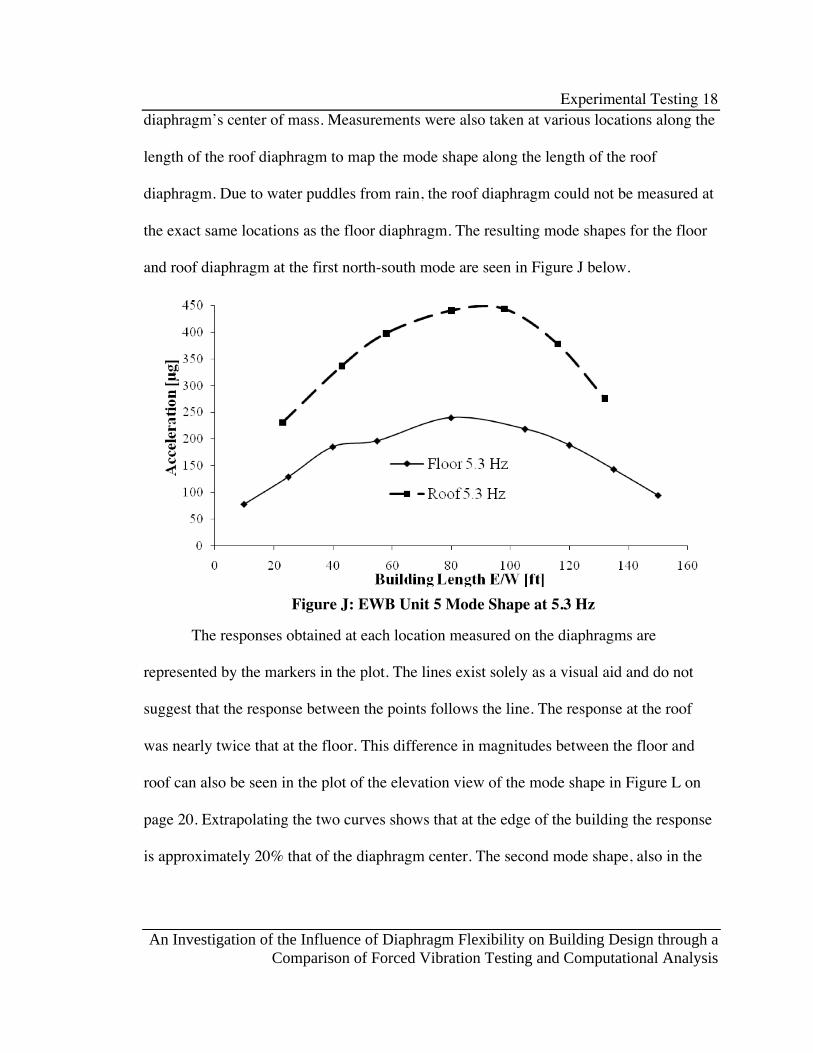
the exact same locations as the floor diaphragm. The resulting mode shapes for the floor
and roof diaphragm at the first north-south mode are seen in Figure J below.
The responses obtained at each location measured on the diaphragms are
represented by the markers in the plot. The lines exist solely as a visual aid and do not
suggest that the response between the points follows the line. The response at the roof
was nearly twice that at the floor. This difference in magnitudes between the floor and
roof can also be seen in the plot of the elevation view of the mode shape in Figure L on
page 20. Extrapolating the two curves shows that at the edge of the building the response
is approximately 20% that of the diaphragm center. The second mode shape, also in the
Figure J: EWB Unit 5 Mode Shape at 5.3 Hz

Experimental Testing 19
An Investigation of the Influence of Diaphragm Flexibility on Building Design through a
Comparison of Forced Vibration Testing and Computational Analysis
Figure K: EWB Unit 5 Mode Shape at 9.25 Hz
north-south direction, was found in the same way as the first and can be seen in Figure K
below.
The second mode occurs as the floor and roof deform out of phase with each
other. Their responses have similar magnitudes but in opposite directions. Extrapolating
the curves for the second mode at the roof and the floor would give a response at the edge
of the building of approximately 10-20% that of the response at the center of mass. All
four plots have a curved response distribution across the east-west length of the building
diaphragm.
It was confirmed that the first mode was in fact the floor and the roof deforming
in phase with each other and the second mode shape was the floor and roof deforming out
of phase with each other in the same direction. Confirmation was made by placing an
accelerometer at the floor and the roof simultaneously to capture the vertical building

Experimental Testing 20
An Investigation of the Influence of Diaphragm Flexibility on Building Design through a
Comparison of Forced Vibration Testing and Computational Analysis
mode shape. Figure L below shows this elevation view of the mode shapes with
measurements at the floor and the roof on the same plot.
The results from Figures J, K, and L suggest that the floor and roof diaphragms of
EWB Unit 5 are not rigid. For a diaphragm to be considered rigid, the response of the
diaphragm must be uniform across its length. Another way to determine if a diaphragm
has rigid deformation is to investigate the rotational response along the length of the
diaphragm. For a diaphragm to be considered rigid, the rotational response should be
uniform throughout. Uniformity in rotational responses shows that the whole diaphragm
is deforming at a similar magnitude and in the same direction. The rotations along the
length of the floor diaphragm are found in Table 3 on the next page.
Figure L: EWB Unit 5 Elevation View of Mode Shape at 5.3 and 9.25 Hz

Experimental Testing 21
An Investigation of the Influence of Diaphragm Flexibility on Building Design through a
Comparison of Forced Vibration Testing and Computational Analysis
It can be seen that the rotational response across the length of the diaphragm is
not uniform. The greatest rotation occurs at the edges of the diaphragm. This progression
makes sense because the slope of the translational response plot is the greatest at the
building edge. Consideration should be given to the fact that the rotations are being
determined by placing two accelerometers in the direction that the building is being
forced. Therefore, the translational deformation of the diaphragm is included in the
determination of the rotations and they cannot be compared directly because they are of
different units. The rotational readings of the second mode and roof are similar, again
suggesting that the floor and roof diaphragms of Engineering West Building Unit 5 are
not rigid.
2.3.2 EWB Unit 3 Mode Shape
The same procedure described in the previous section was performed for EWB
Unit 3. The floor mode shape was mapped to determine if it would exhibit rigid or semi-
rigid deformation. The results are displayed in Figure M on the next page.
Table 3. EWB Unit 5 Mode 1 Floor Diaphragm Rotations

Experimental Testing 22
An Investigation of the Influence of Diaphragm Flexibility on Building Design through a
Comparison of Forced Vibration Testing and Computational Analysis
Table 4. EWB Unit 3 Floor Diaphragm Rotations
Similar to EWB Unit 5, the mode shape appears to suggest that the floor
diaphragm does not have rigid behavior. The north (or in this case, left) edge of the
diaphragm occurs at approximately 20’. At the north edge of the diaphragm the response
is approximately 15% the response at the center of the diaphragm and the response at the
south edge of the diaphragm the response is approximately 50% the response at the center
of the diaphragm. The rotations vary across the length of the diaphragm as well, as seen
in Table 4 below.
The rotational response varies considerably across the length of the diaphragm,
similar to EWB Unit 5. Again, this response suggests that the diaphragm does not have
Figure M: EWB Unit 3 Floor Mode Shape at 6.4 Hz
Experimental Testing 23
An Investigation of the Influence of Diaphragm Flexibility on Building Design through a
Comparison of Forced Vibration Testing and Computational Analysis
Figure N: CM Building 3rd Floor NS Mode Shape at 3.61 Hz
rigid behavior. Unlike EWB Unit 5, however, the rotation recorded at the north edge of
EWB Unit 3 was lower than a response closer to the center of the building, unlike EWB
Unit 5. This behavior and the low translational response at the north edge of the building
can be explained due to the interaction of the building’s edge and the building adjacent to
it. This interaction will be discussed later in the thesis.
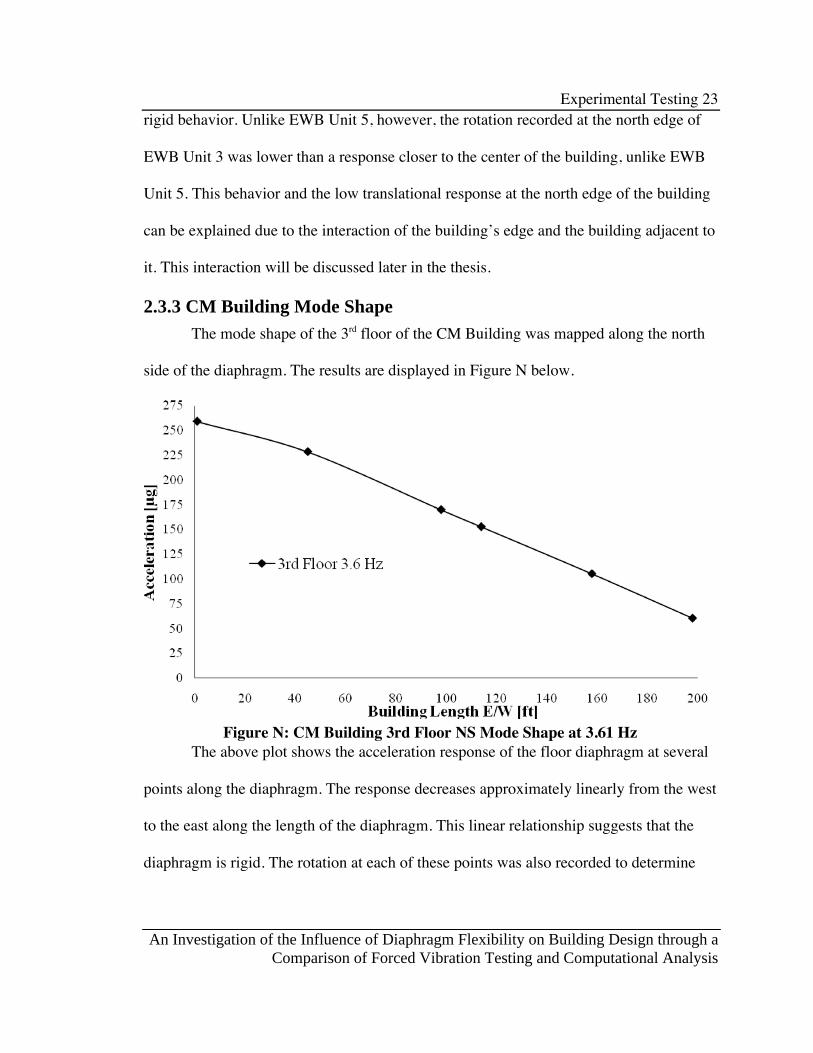
2.3.3 CM Building Mode Shape
The mode shape of the 3rd floor of the CM Building was mapped along the north
side of the diaphragm. The results are displayed in Figure N below.
The above plot shows the acceleration response of the floor diaphragm at several
points along the diaphragm. The response decreases approximately linearly from the west
to the east along the length of the diaphragm. This linear relationship suggests that the
diaphragm is rigid. The rotation at each of these points was also recorded to determine

Experimental Testing 24
An Investigation of the Influence of Diaphragm Flexibility on Building Design through a
Comparison of Forced Vibration Testing and Computational Analysis
how uniform the response of the diaphragm was across its length, as seen in Table 5
below.
The rotational readings along the length of the diaphragm are fairly constant
except for the rotation nearest the west edge of the building. Similar to EWB Unit 3, the
low rotation value at the extreme edge of the building can be explained by the interaction
between the building’s edge and the building adjacent to it. Further investigation of this
response will be conducted later in the thesis in Section 5.3 starting on page 50.
Table 5. CM Building Floor Rotations

Computational Analysis and Comparison 25
An Investigation of the Influence of Diaphragm Flexibility on Building Design through a
Comparison of Forced Vibration Testing and Computational Analysis
3.0 COMPUTATIONAL ANALYSIS AND COMPARISON
The three buildings were all modeled using the commercial computer analysis
software ETABS (CSI 2008). The software was used to determine the modal frequency
and mode shapes of each structure. The results for the modal frequencies are displayed
next to those obtained from the experiment, and the results for the mode shapes are
plotted with a dashed line representing the experimental results for comparison.
A load take off was performed to estimate the mass of each building. The mass
used in the model greatly affected the modal parameter output. Therefore, it was very
important to make as accurate an approximation as possible of the building weight. For
each building, the concrete floor and roof diaphragms, beams, walls, cladding, and an
approximation of 20 psf for MEP and miscellaneous additional weight were included. A
previous student’s senior project with a very detailed dead load take-off was consulted in
determining the mass of the CM Building (Foschaar 2008). The mass was lumped to each
respective floor and roof diaphragm as a uniformly distributed area mass.
The floor and roof diaphragms of each building were modeled based on their
gross section properties. Both the decrease in stiffness associated with cracking of the
concrete was neglected and the increased strength of the concrete due to hardening
overtime were neglected because they are unknowns and affect the concrete stiffness
conversely. It was assumed that the two variables counteract each other and it was
therefore assumed justifiable to use the gross section properties to determine stiffness.
Based on the experimental results obtained for the mode shapes of EWB Unit 5
and EWB Unit 3 their diaphragms were initially modeled as semi-rigid. The semi-rigid
Computational Analysis and Comparison 26
An Investigation of the Influence of Diaphragm Flexibility on Building Design through a
Comparison of Forced Vibration Testing and Computational Analysis
diaphragm designation causes the stiffness of the diaphragm to be determined based on
the properties assigned to the slab. The experimental results for the CM Building’s mode
shape suggested that the diaphragm was rigid; therefore the diaphragm in the
computational model was initially assigned to be rigid. For comparison purposes, each
building was modeled with both rigid and semi-rigid diaphragm assignments.
Only the lateral force resisting elements of each structure were included in the
computational model. Any additional structural and non-structural elements were omitted
because their effect on the dynamic response of the structure was minimal.
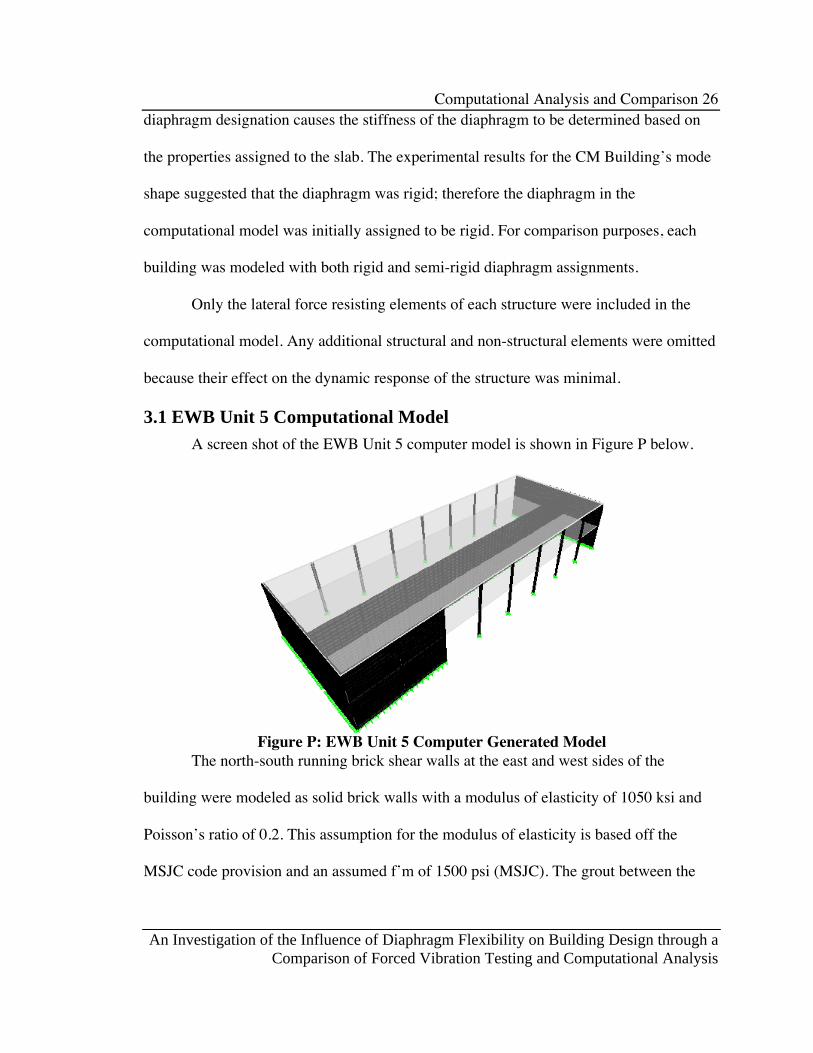
3.1 EWB Unit 5 Computational Model
A screen shot of the EWB Unit 5 computer model is shown in Figure P below.
The north-south running brick shear walls at the east and west sides of the
building were modeled as solid brick walls with a modulus of elasticity of 1050 ksi and
Poisson’s ratio of 0.2. This assumption for the modulus of elasticity is based off the
MSJC code provision and an assumed f’m of 1500 psi (MSJC). The grout between the
Figure P: EWB Unit 5 Computer Generated Model

Computational Analysis and Comparison 27
An Investigation of the Influence of Diaphragm Flexibility on Building Design through a
Comparison of Forced Vibration Testing and Computational Analysis
two withes of brick was assumed to have the same material properties as the brick
surrounding it.
When EWB Unit 5 was modeled with a rigid diaphragm at the floor and roof the
results for the modal periods did not match the experimental results. The first mode was
found to be in the north-south direction and the second mode in the east-west direction.
This evidence, along with the flexible behavior of the diaphragms in the experimental
testing, drove the decision to define the diaphragms as semi-rigid. The semi-rigid
diaphragm designation resulted in the first two building modes occurring in the north-
south direction, matching the experimental results. The results for the first two modal
periods based on the computational model and the experimental results are found in
Table 6 below.
The first modal frequency for the semi-rigid diaphragm designation is very
similar to the experimental result, but the second mode from the semi-rigid results is
much lower. Modifying the out-of-plane thickness of the wall by a factor of 2.6 produced
a second modal frequency value of 9.2 Hz. The first mode remained unchanged with the
modified out-of-plane thickness. This modification points to the discrepancy being an
issue related to the out-of-plane stiffness of the full height shear wall that runs the length
of the building, but a full explanation could not be found. The computational model
produced results for the modal frequencies that are very close to the experimental results
when assigning a semi-rigid diaphragm to the floor and roof of EWB Unit 5. Assigning
Experiment Semi-Rigid Rigid
Mode 1 5.3 5.25 9.33 Mode 2 (4) 9.25 6.9 25.5
Table 6. Comparison of Modal Frequencies for EWB Unit 5 [Hz]

Computational Analysis and Comparison 28
An Investigation of the Influence of Diaphragm Flexibility on Building Design through a
Comparison of Forced Vibration Testing and Computational Analysis
the diaphragms as rigid grossly overestimates the modal frequencies and the second
North-South mode is the fourth mode rather than the second.
The mode shape for the floor and roof were also determined from the
computational model. The units of the mode shapes that were determined by the
experiment and computational model are different. Therefore, in order to compare the
mode shapes determined experimentally with those determined computationally the mode
shapes were mass orthonormalized (Humar 1990). The equation used for mode shape
mass orthonormalization is
, Eq. 5
where represents the mode shape, and represents the mass matrix.
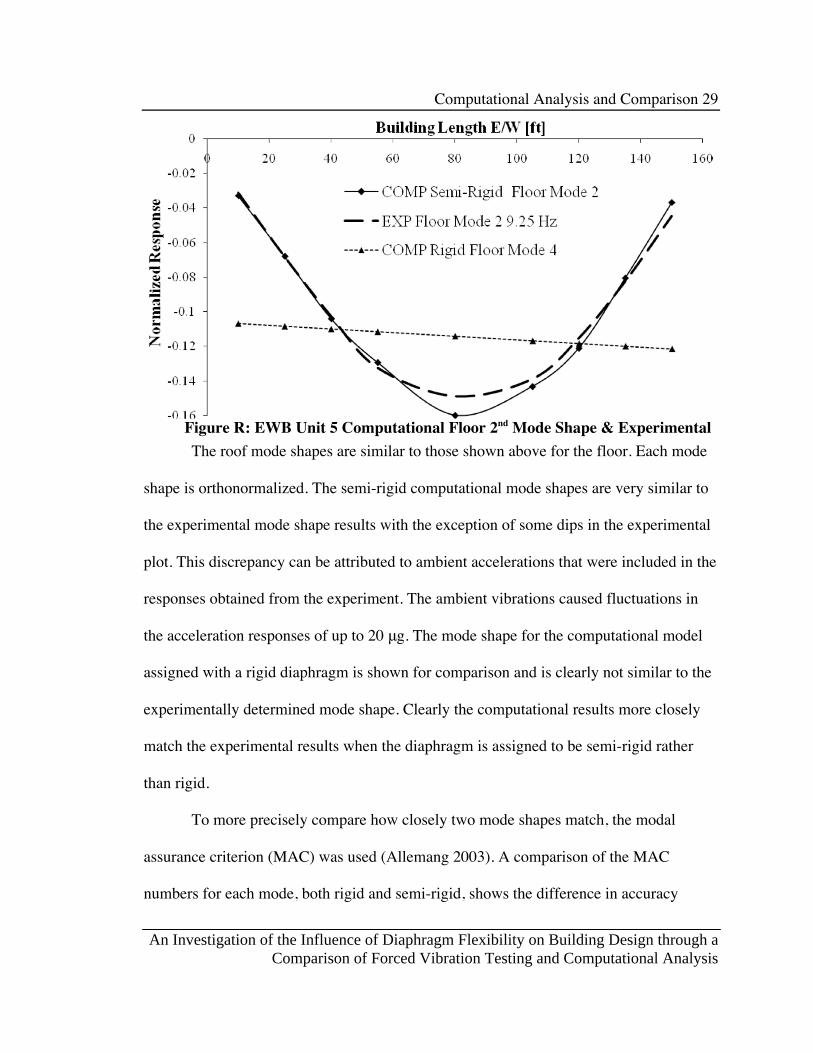
The mode shapes for the floor are found on the plot in Figure Q below and Figure
R on the next page.
Figure Q: EWB Unit 5 Computational Floor 1st Mode Shape & Experimental
Computational Analysis and Comparison 29
An Investigation of the Influence of Diaphragm Flexibility on Building Design through a
Comparison of Forced Vibration Testing and Computational Analysis
The roof mode shapes are similar to those shown above for the floor. Each mode
shape is orthonormalized. The semi-rigid computational mode shapes are very similar to
the experimental mode shape results with the exception of some dips in the experimental
plot. This discrepancy can be attributed to ambient accelerations that were included in the
responses obtained from the experiment. The ambient vibrations caused fluctuations in
the acceleration responses of up to 20 g. The mode shape for the computational model
assigned with a rigid diaphragm is shown for comparison and is clearly not similar to the
experimentally determined mode shape. Clearly the computational results more closely
match the experimental results when the diaphragm is assigned to be semi-rigid rather
than rigid.
To more precisely compare how closely two mode shapes match, the modal
assurance criterion (MAC) was used (Allemang 2003). A comparison of the MAC
numbers for each mode, both rigid and semi-rigid, shows the difference in accuracy
Figure R: EWB Unit 5 Computational Floor 2nd Mode Shape & Experimental

Computational Analysis and Comparison 30
An Investigation of the Influence of Diaphragm Flexibility on Building Design through a
Comparison of Forced Vibration Testing and Computational Analysis
between the two diaphragm designations. The MAC number is a comparison of the
similarity of two mode shapes and is determined by the equation
, Eq. 6
where represents the experimentally determined mode shape,
represents the computationally determined mode shape, and
represents the mass matrix.
A MAC number of 1 indicates perfect correlation between the mode shapes. The
typical MAC number equation, in this case, is modified by adding a weight factor (the
mass matrix). The mode shapes are weighted so that mode shapes that contain both
translational and rotational accelerations with different units can be used in the equation
(McDaniel and Archer 2010). Table 7 below displays the results for the mass weighted
MAC numbers for both modes. The table compares the experimental results to both the
semi-rigid diaphragm computational model and the rigid diaphragm computational
model.
The MAC numbers for the semi-rigid diaphragm computational model are nearly
1 and much more accurate than the rigid diaphragm results. To ensure that the
computational models were performing similarly to the experimental results the vertical
mode shape was also determined from both computational models. Figure S, on the next
page, shows the mode shape’s vertical elevation view for the first and second mode.
Table 7. Comparison of MAC Numbers for EWB Unit 5

Computational Analysis and Comparison 31
An Investigation of the Influence of Diaphragm Flexibility on Building Design through a
Comparison of Forced Vibration Testing and Computational Analysis
The vertical mode shapes of the computational model show that the first two
north-south modes from the semi-rigid and rigid model are both in the north-south
direction, similar to the experimental results. In the first mode the floor and roof deform
in-phase and in the second mode the floor and roof deform out-of-phase.
The plots for the mode shapes show that the computational model results for the
semi-rigid diaphragm closely corresponded to the experimental results. It is concluded
that it is most accurate to assign the diaphragm in the computational model to be semi-
rigid to accurately mimic the physical response of the structure. It is inaccurate to idealize
the diaphragm as rigid, in this case.
Figure S: EWB Unit 5 Computational Vertical Mode Shape 1 and 2

Computational Analysis and Comparison 32
An Investigation of the Influence of Diaphragm Flexibility on Building Design through a
Comparison of Forced Vibration Testing and Computational Analysis
Table 8. Comparison of Modal Frequencies EWB Unit 3 [Hz]
3.2 EWB Unit 3 Computational Model
A screen shot of the EWB Unit 3 computer model is shown in Figure T below.
EWB Unit 3 has a basement that is only under the south half of the building. It
was modeled because the shear walls in the basement affected the stiffness of the super
structure. Therefore, the model has a first floor and roof diaphragm and a rigid diaphragm
at the top of the basement level. Similar to EWB Unit 5, EWB Unit 3 was first modeled
with a rigid diaphragm designation. The modes that resulted from the rigid diaphragm
designation were not as accurate as when the diaphragm was assigned to be semi-rigid.
The results for the first modal frequencies for the computational model compared to the
experiment are found in Table 8 below.
The interaction between EWB Unit 3 and the adjoining buildings may have
caused the computational and experimental frequency results not to match as well as they
could have. The order of the modal frequencies determined from the computational
Figure T: EWB Unit 3 Computer Generated Model
Computational Analysis and Comparison 33
An Investigation of the Influence of Diaphragm Flexibility on Building Design through a
Comparison of Forced Vibration Testing and Computational Analysis
model is opposite to that found from the experiment. One explanation for this swapping
of modes may be the influence of the seismic joint connection at the edges of the building
and the flexibility of the soil at the base of the shear walls. See Section 5.3 starting on
page 49 of this thesis for a discussion on the modeling of the seismic joints and the
interaction of EWB Unit 3’s building edge to the adjacent buildings. Further research
needs to be done to determine the true impact of the soil flexibility on the stiffness of the
building in the north-south direction. The soil was not modeled; however, a more flexible
soil would cause the north-south frequency to decrease. The frequency in the east-west
direction would remain similar to the computationally determined value because of the
restraint and added stiffness caused by the connection to the adjacent buildings that run
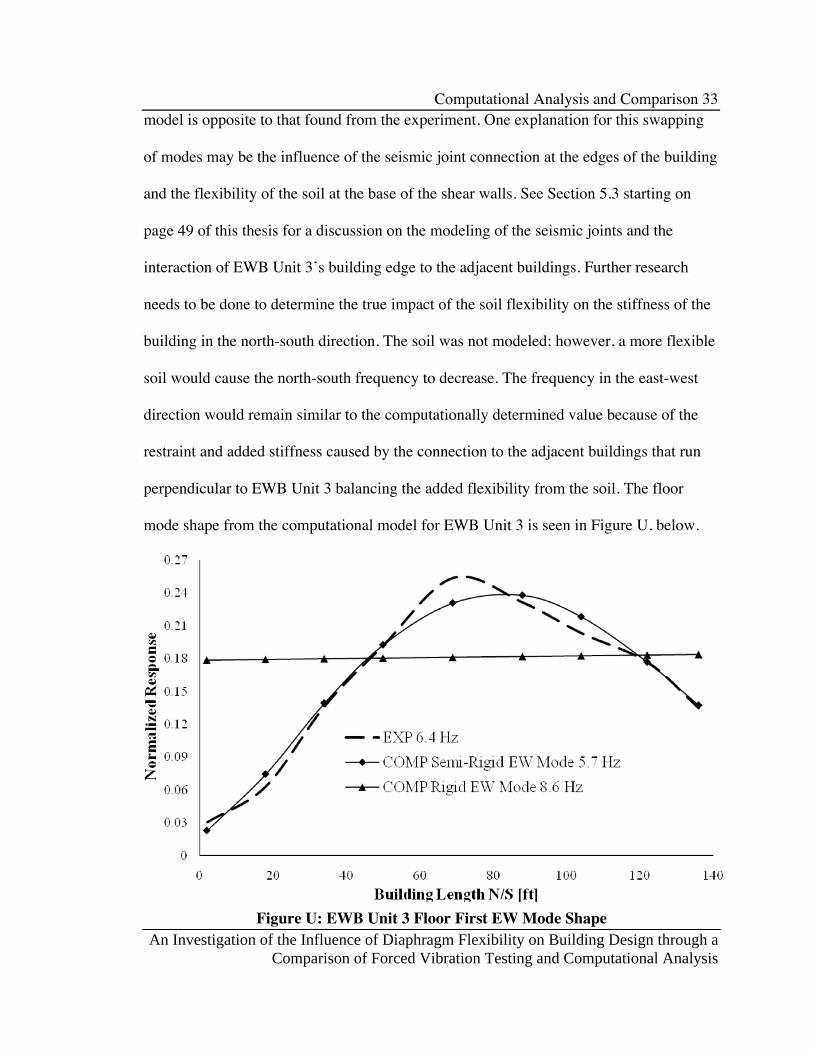
perpendicular to EWB Unit 3 balancing the added flexibility from the soil. The floor
mode shape from the computational model for EWB Unit 3 is seen in Figure U, below.
Figure U: EWB Unit 3 Floor First EW Mode Shape

Computational Analysis and Comparison 34
An Investigation of the Influence of Diaphragm Flexibility on Building Design through a
Comparison of Forced Vibration Testing and Computational Analysis
The maximum deformation of the floor diaphragm occurs at approximately 80
feet. The semi-rigid computational results for the mode shape similarly match the
experimental results from EWB Unit 5. Again, the ambient vibration caused slight
increases and decreases in the experimentally determined mode shape accelerations. The
semi-rigid computational model is clearly more similar to the experimental results than
the rigid computational results. The MAC numbers for EWB Unit 3 are displayed in
Table 9 below.
The MAC numbers show that the semi-rigid computational model produces
results for the mode shape that are more similar to the experimental results than the rigid
computational model. The MAC number for EWB Unit 3 is almost identical to EWB
Unit 5. The semi-rigid computational model is a more accurate representation of the
physical building response than the rigid computational model.
3.3 CM Building Computational Model
A screen shot of the CM Building computer model is shown in Figure V on the next page.
Table 9. Comparison of MAC Numbers for EWB Unit 3

Computational Analysis and Comparison 35
An Investigation of the Influence of Diaphragm Flexibility on Building Design through a
Comparison of Forced Vibration Testing and Computational Analysis
Table 10. Comparison of CM Building Modal Frequencies [Hz]
The experimental results suggested that the CM Building had a rigid diaphragm.
Therefore, the floors and roof were assigned a rigid diaphragm. The results for the modal
periods of vibration were higher than those obtained from experimental testing. The
results for the first two modal frequencies from the computational model for the CM
Building are listed along with the experimental results in Table 10 below.
The disparity in results between computational analysis and experimental testing
exists because of one or both of two issues; the mass is being overestimated or the
stiffness is being underestimated. The problem is probably not the mass estimation
because even when only the weight of the floor and roof decks are considered in the
building weight, the modal frequencies determined by the computational model are still
lower (approximately 2.60 Hz east-west and 2.88 Hz north-south) than those determined
through the experimental testing. This consideration points to a problem with how the
Figure V: CM Building Computer Generated Model

Computational Analysis and Comparison 36
An Investigation of the Influence of Diaphragm Flexibility on Building Design through a
Comparison of Forced Vibration Testing and Computational Analysis
stiffness of the CM Building was modeled. As can be seen in Figure V of the previous
page, only the elements of the lateral force resisting system were modeled in the
structure. On the exterior façade of the CM Building there are large concrete blocks hung
as cladding. This cladding may be adding a considerable amount of stiffness to the
structure when excited at low energy levels. Additionally, when the stiffness attributed to
the concrete cladding is not included, the first two modal frequencies are out of order in
comparison to the experimental results (as seen in Table 10, page 35). The difference
between the modal frequencies for the rigid and semi-rigid diaphragm designations was
less dramatic for the CM Building. Unlike the other two buildings the CM Building
diaphragm designation did not have a significant effect on the modal frequencies.
The mode shape for the 3rd floor of the CM Building was also determined from
the computational model. The mode shape is found in Figure W below.
Figure W: CM Building 3rd Floor First NS Mode Shape

Computational Analysis and Comparison 37
An Investigation of the Influence of Diaphragm Flexibility on Building Design through a
Comparison of Forced Vibration Testing and Computational Analysis
The maximum deformation occurs at the west edge of the building and decreases
approximately linearly to the east edge of the building. The mode shapes from both the
semi-rigid and rigid computational models are very similar to the experimentally
determined mode shape. Further evidence of the similarity between the mode shapes
determined from the computational model and the experimental results is seen by
examining their MAC numbers. The MAC numbers for both the semi-rigid and rigid
computational models are found in Table 11 below.
The similarity in mode shapes and the high value for the MAC numbers in the
semi-rigid and rigid computational models suggest that the CM Building floor
diaphragms are approximately rigid. It can be concluded that idealizing the diaphragm as
rigid in the computational model is a valid assumption when performing a computational
analysis of the CM Building.
Table 11. Comparison of MAC Numbers for CM Building
Design Implications 38
An Investigation of the Influence of Diaphragm Flexibility on Building Design through a
Comparison of Forced Vibration Testing and Computational Analysis
4.0 DESIGN IMPLICATIONS
In section 3.0 it was shown that the floor diaphragms for the three buildings
investigated are not all rigid as the ASCE 7-05 code allows the designer to assume. This
section will investigate the influence that idealizing each building diaphragm as rigid has
on the overall design of each building.
The assignment of the diaphragm as rigid or semi-rigid in the computational
model had an affect on the modal periods, as shown in the previous section. It is
important to make a proper estimate of a building period in order to approximate the
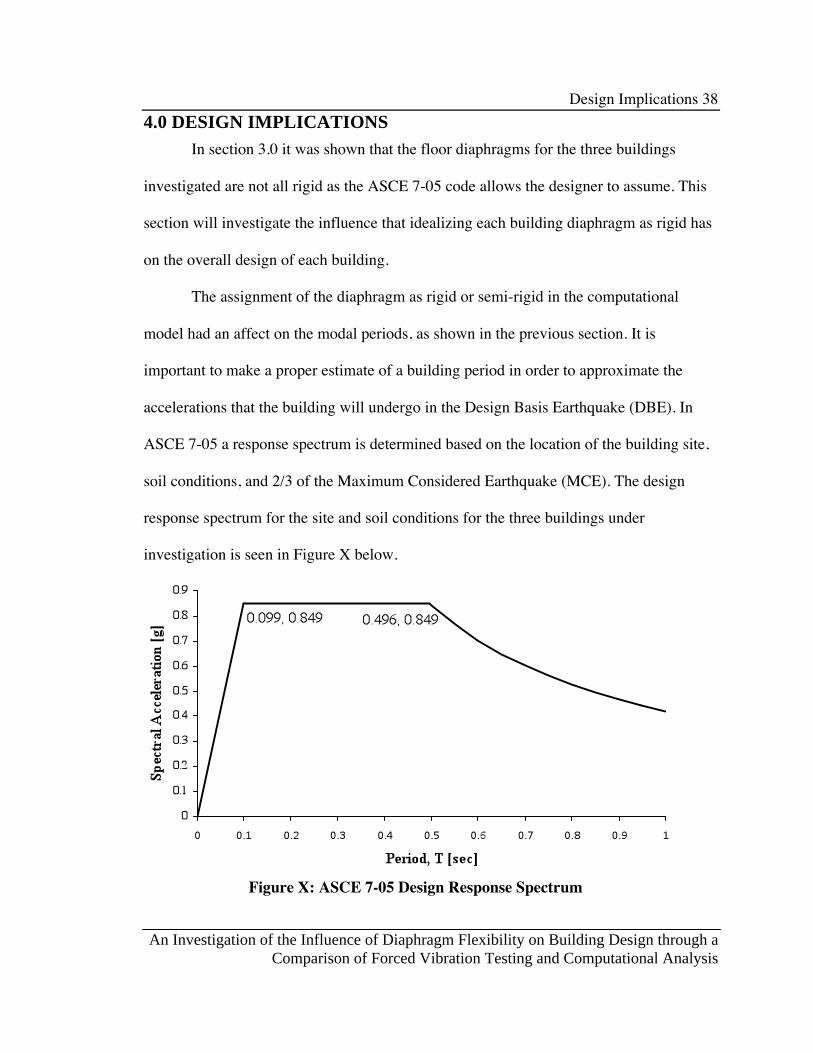
accelerations that the building will undergo in the Design Basis Earthquake (DBE). In
ASCE 7-05 a response spectrum is determined based on the location of the building site,
soil conditions, and 2/3 of the Maximum Considered Earthquake (MCE). The design
response spectrum for the site and soil conditions for the three buildings under
investigation is seen in Figure X below.
Figure X: ASCE 7-05 Design Response Spectrum

Design Implications 39
An Investigation of the Influence of Diaphragm Flexibility on Building Design through a
Comparison of Forced Vibration Testing and Computational Analysis
According to the ASCE 7-05 design response spectrum, the periods for all three
buildings with both semi-rigid and rigid diaphragm designations fall on the response
spectrum plateau and thus have the same spectral response acceleration. For the purposes
of this thesis the forces and displacements were not adjusted by the ‘R’ and Cd’ factors
because only a comparison of the difference between the results obtained from the semi-
rigid and rigid computational models was made.
Another method for determining the design ground acceleration of a building is to
perform a response spectrum analysis with a number of different earthquake records. The
SAC project, a joint venture of the Structural Engineers Association of California
(SEAOC), the Applied Technology Council (ATC), and California Universities for
Research in Earthquake Engineering (CUREe), compiled a list of twenty earthquake
records for the purpose of performing a response spectrum analysis for their project (SAC
1994) (FEMA 355C 2000). An average of the earthquake records’ response spectra was
taken to produce a single curve to determine spectral accelerations for the buildings
examined in this thesis. A trend line was then set to the curve to determine spectral
accelerations at any point on the curve. The equation for the trend line is seen on the plot.
A plot of the average of the SAC earthquake response spectra is seen in Figure Y on the
next page.

Design Implications 40
An Investigation of the Influence of Diaphragm Flexibility on Building Design through a
Comparison of Forced Vibration Testing and Computational Analysis
From the accelerations determined by both ASCE and SAC the base shear and
lateral force resisting element design forces were compared for the semi-rigid and rigid
diaphragm computational models. It is important to note that the accelerations and forces
determined by the ASCE 7-05 design response spectrum cannot be compared directly to
the SAC response spectra. The SAC ground motions were not scaled to the building sites.
The comparisons made are strictly based on the percent change of the accelerations,
forces, and displacements between the semi-rigid and rigid computational models.
The results of the comparisons for the periods, acceleration, base shear, wall shear
forces, roof displacement, and max story drift are summarized in Table 12 on the next
page and Table 13 on page 43.
Figure Y: SAC Averaged Response Spectra with Trend Line

Design Implications 41
An Investigation of the Influence of Diaphragm Flexibility on Building Design through a
Comparison of Forced Vibration Testing and Computational Analysis
The base shear did not change in any of the three buildings because the spectral
acceleration for the rigid and semi-rigid models was the same. The small decrease in
shear wall force in EWB Unit 5 is attributed to the increase in out-of-plane shear that is
Table 12. ASCE7-05 Comparison of Design Parameters

Design Implications 42
An Investigation of the Influence of Diaphragm Flexibility on Building Design through a
Comparison of Forced Vibration Testing and Computational Analysis
resisted by the walls perpendicular to the loading. EWB Unit 3 saw changes in the shear
wall forces because of the force distribution characteristic to rigid and non rigid elements
under lateral loading.
Although the base shear and shear wall forces did not change significantly, the
change in roof displacement and maximum story drift was more apparent. A more than
300% increase in the maximum inter story drift of EWB Unit 5 occurred. However, the
drift is still well within the limit for brick shear wall buildings. According to ASCE 7-05
Table 12.12-1 the allowable maximum drift for masonry cantilever shear wall structures
is 0.010hsx. The drift is approximately 10% of the allowable maximum drift. In a
building design where the drift is close to the allowable maximum drift, assuming the
diaphragm to be rigid would have more of an impact on the design than in these cases.

Design Implications 43
An Investigation of the Influence of Diaphragm Flexibility on Building Design through a
Comparison of Forced Vibration Testing and Computational Analysis
There are large differences in the design forces, roof displacements, and drifts
obtained from the semi-rigid and rigid computational models for the two buildings that
were determined to have semi-rigid diaphragms (EWB Unit 5 and EWB Unit 3). Unlike
Table 13. SAC Comparison of Design Parameters

Design Implications 44
An Investigation of the Influence of Diaphragm Flexibility on Building Design through a
Comparison of Forced Vibration Testing and Computational Analysis
the ASCE 7-05 results, both the forces and displacements increased when the diaphragm
was defined as semi-rigid in the computational model. The reason that the forces
increased with the SAC results and not with the ASCE 7-05 results is that the
accelerations increased when using the SAC response spectrum due to the period shift
caused by the difference in the stiffness between the semi-rigid and rigid diaphragm
designation. As stated earlier, the ASCE 7-05 accelerations did not change between the
two diaphragm designations because the period determined for both semi-rigid and rigid
occurred on the response spectrum plateau.
The CM Building’s parameters are nearly unaffected by the diaphragm
designation. However, the consequences of idealizing a non-rigid diaphragm as rigid, in
the case of EWB Unit 5 and EWB Unit 3, are an underestimation of both the forces
generated in the structure and its roof displacement. The greatest difference in the forces
and displacements is seen in EWB Unit 5, the building that was best modeled with a
semi-rigid diaphragm. An increase of nearly 30% in the base shear would impact the
design of the lateral force resisting elements of the structure, including the shear wall, the
floor and roof diaphragms, the connections, and the foundation. Similar to the results
from ASCE 7-05, the roof displacement and inter story drift increased dramatically in the
semi-rigid diaphragm model, however, the drift is still well within the allowable
maximum drift. The flexibility of the diaphragm and how it is modeled in a
computational analysis affects the design forces and displacements of a building.
Assuming a diaphragm to be rigid when it is not underestimates the design forces and
drifts of a structure.
Structural Considerations 45
An Investigation of the Influence of Diaphragm Flexibility on Building Design through a
Comparison of Forced Vibration Testing and Computational Analysis
5.0 STRUCTURAL CONSIDERATIONS
In this section, structural features of each building that contributed to the results
of the modal parameters and building design are investigated to give an explanation for
the results obtained from both the experimental testing and the computational analysis.
The results of the modal frequencies and the response seen in the mode shapes for both
the experimental and computational analysis can be explained by the geometry, stiffness,
mass and construction of the buildings investigated. The parameters determined by this
thesis to be the most influential are the diaphragm aspect ratio, the relative stiffness of the
diaphragm to the adjoining elements of the lateral force resisting system, added stiffness
from non structural elements of the building, and unintentional restraint at the building
edge interface with other structures.
5.1 Relative Stiffness
The relative stiffness of the horizontal diaphragm to the adjoining elements of the
vertical lateral force resisting system was determined for each building. The combined
bending and shear stiffness of the diaphragm was determined by assuming the diaphragm
was a simply supported deep beam with a point load at mid span. To determine the
moment of inertia of the diaphragm of the CM Building, only the concrete outside of the
flutes of the metal deck profile was considered. The combined flexure and shear stiffness
of the shear wall elements was determined by assuming a cantilevered wall with a point
load at the wall end. The concrete was assumed to be 4 ksi in strength. The concrete was
assumed to have increased in strength over time equally between the diaphragm and
walls. The stiffness of the braced frames was found by modeling the frame in computer

Structural Considerations 46
An Investigation of the Influence of Diaphragm Flexibility on Building Design through a
Comparison of Forced Vibration Testing and Computational Analysis
analysis software. The results for the element stiffness and the ratio between the
diaphragm and vertical elements are found in Table 14 below.
In both EWB Unit 3 and EWB Unit 5 the ratio of the diaphragm stiffness in the
weak direction to the lateral force resisting system is less than 1. The ratio of the
diaphragm stiffness in the weak direction to the lateral force resisting system of the CM
Building is ten to twenty times higher than that of the other two buildings. The ratio in
the strong direction is very large in comparison to the ratio in the weak direction for all
three buildings.
There is a clear correlation between the relative stiffness of the diaphragm to the
vertical elements of the lateral force resisting system and the rigid or flexible behavior of
the diaphragm. As the relative stiffness increases, so does the diaphragm rigidity. In both
the experiment and in the computational model, EWB Unit 5 and EWB Unit 3 exhibited
flexible behavior along the diaphragms, while the CM Building diaphragm was
approximately rigid. In addition to the aspect ratio, relative stiffness has an impact on the
degree of flexibility in a diaphragm and should be considered when modeling the
diaphragm.
A parametric study was performed to determine at what relative stiffness ratio a
diaphragm appears to begin to exhibit flexibility in its response. The parameters of each
Table 14. Relative Stiffness
Structural Considerations 47
An Investigation of the Influence of Diaphragm Flexibility on Building Design through a
Comparison of Forced Vibration Testing and Computational Analysis
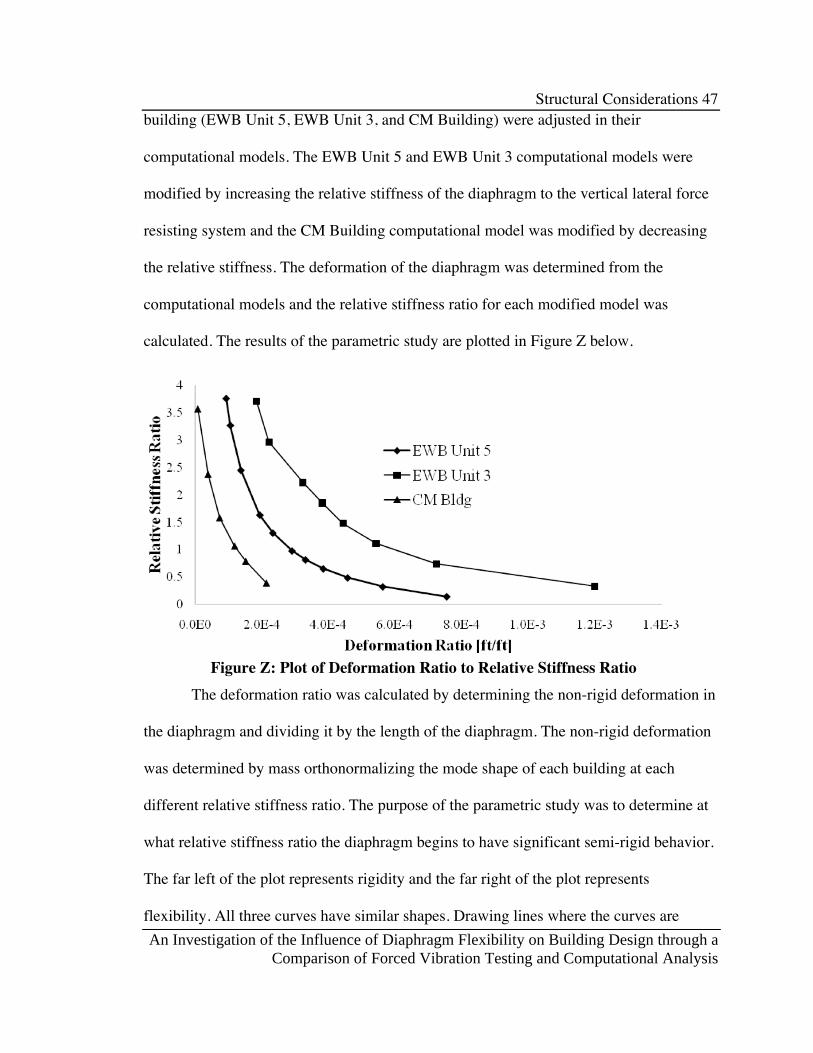
building (EWB Unit 5, EWB Unit 3, and CM Building) were adjusted in their
computational models. The EWB Unit 5 and EWB Unit 3 computational models were
modified by increasing the relative stiffness of the diaphragm to the vertical lateral force
resisting system and the CM Building computational model was modified by decreasing
the relative stiffness. The deformation of the diaphragm was determined from the
computational models and the relative stiffness ratio for each modified model was
calculated. The results of the parametric study are plotted in Figure Z below.
The deformation ratio was calculated by determining the non-rigid deformation in
the diaphragm and dividing it by the length of the diaphragm. The non-rigid deformation
was determined by mass orthonormalizing the mode shape of each building at each
different relative stiffness ratio. The purpose of the parametric study was to determine at
what relative stiffness ratio the diaphragm begins to have significant semi-rigid behavior.
The far left of the plot represents rigidity and the far right of the plot represents
flexibility. All three curves have similar shapes. Drawing lines where the curves are
Figure Z: Plot of Deformation Ratio to Relative Stiffness Ratio

Structural Considerations 48
An Investigation of the Influence of Diaphragm Flexibility on Building Design through a
Comparison of Forced Vibration Testing and Computational Analysis
approximately linear as they approach zero relative stiffness and infinite relative stiffness
results in these lines crossing at a relative stiffness ratio of 1.5. This suggests that
diaphragms of relative stiffness less than 1.5 may be considered semi-rigid and greater
than 1.5 may be considered rigid. Further research must be done to determine the
relationship between relative stiffness and aspect ratio on diaphragm rigidity, because the
buildings investigated in this thesis all have very similar aspect ratios. A larger set of
buildings with a wider range of aspect ratios and relative stiffnesses should be
investigated to determine at what point a diaphragm can and should be idealized as rigid.
5.2 Additional Sources of Building Stiffness
In addition to the lateral stiffness provided by the lateral force resisting system
there also exists other sources of stiffness that are in the physical structure. This
additional stiffness is not accounted for in the computational model and is therefore also a
source of error between the experimental results and computational results. As stated in
section 3.3, the directions of the first two modal periods of the CM Building were
opposite that of the modal periods determined from the physical experiment. One
explanation for this discrepancy could be that the nonstructural cladding on the exterior
façade adds to the building stiffness more in one direction in the other. Additionally, the
added stiffness from the cladding may explain why the frequencies determined
experimentally were so much higher than those determined computationally. The first
two modal frequencies are near each other in value (3.6 Hz NS & 3.9 Hz EW,
experimentally); therefore only a small amount of stiffness added in one direction more
than the other could cause these modes to swap. Steel braces with a small area (4 in2, just
Structural Considerations 49
An Investigation of the Influence of Diaphragm Flexibility on Building Design through a
Comparison of Forced Vibration Testing and Computational Analysis
over two inches in diameter) were added to the model to represent the cladding in the
locations where it was present (approximately 12 braces on the north and south side of
the building and only 6 braces on the west face of the building). This size of the braces
was chosen arbitrarily only as an attempt to point towards an explanation of why the
modes determined in the experiment were swapped from those determined in the
computational model. The braces represent the cladding by providing additional stiffness
only at the locations of the structure where cladding is present; i.e., on the building
exterior, not at windows or doors. Because the building is longer in the east-west
direction, more braces were added in that direction than the north-south, which added
more stiffness in the east-west direction than in the north-south. Adding this stiffness to
the structure effectively swapped the modes and the first mode then occurred in the north-
south direction, matching the experimental results.
Another source of stiffness unaccounted for in the computational model was the
stairs on the west end of EWB Unit 5. It appears from the as-built drawings that the stairs
were built monolithically with the building skeleton. Therefore, the stairs are adding
stiffness to the building along the west line of the lateral force resisting system. The
computational model used in this thesis for EWB Unit 5 did not include the stairs.
However, the brick shear wall that exists along the west line was modeled the entire
length of the building instead of being cut short just before the stairwell. It appears that
the reduction in stiffness associated with the lack of adding the stairs into the model may
have been offset by the added stiffness from the additional length of shear wall in the
model. This simplification may have affected the response of the computational model

Structural Considerations 50
An Investigation of the Influence of Diaphragm Flexibility on Building Design through a
Comparison of Forced Vibration Testing and Computational Analysis
for EWB Unit 5. The connection of the stairs to the building skeleton on the southeast
end of the CM Building appeared to be detailed in such a way that there would be no
interaction between the stairs and the building because of the isolation joint there.
Additionally, the basement of EWB Unit 3 potentially affected the overall
response of the building due to its interaction with the adjacent soil. The model used in
this thesis for EWB Unit 3 simplified this interaction by extending the diaphragm above
the basement throughout the entire footprint of the building. This caused the diaphragm
to then be pinned in space at the location where the columns and walls were pinned at
their base supports. In order to most accurately model this soil interaction, the lateral
stiffness of the soil would need to be determined and then springs added to the basement
walls to represent this interaction. Further research needs to be performed to determine
the full impact of the soil interaction on the building response of EWB Unit 3.
5.3 Building Isolation and Seismic Joints
Both EWB Unit 3 and the CM Building are directly adjacent to other buildings.
The building edges are separated by seismic joints that act as a physical separation
between the building extents. The results from the forced vibration testing suggest that
the seismic joints do not allow the buildings to deflect entirely independently from each
other. Accelerometers were placed on either side of the seismic joints to see how much
energy was transferred from the building being forced to the building on the other side of
the seismic joint. In EWB Unit 3, only on the north side of the building did there appear
to be significant interaction. The responses on either side of the isolation joint, though
low, were very close to each other and read approximately 9 μg on the EWB Unit 3 side

Structural Considerations 51
An Investigation of the Influence of Diaphragm Flexibility on Building Design through a
Comparison of Forced Vibration Testing and Computational Analysis
and 7 μg on the other side. Ambient vibrations were reading in the range of 1 to 2 μg.
This experiment suggested that the interaction between the two buildings at the point of
the isolation joint caused some restraint at the building edge. Similar behavior was
observed at the CM Building, but to a much lesser degree. While the response read at the
west edge of the CM Building was approximately 250 μg the response on the other side
of the seismic joint read only between 15-20 μg at the same frequency. Ambient
vibrations were read at approximately 5 μg.
Because the level of energy applied to the system in the experiment is so low (30
pound harmonic loading transmitted by friction alone), the seismic isolation joints may
still add an amount of stiffness to the system at their locations. This stiffness may be in
part due to the inability of the amount of force exerted on the structure to overcome
friction between touching components. In addition, the plates placed over the gap
between the buildings for safe occupant mobility can cause transfer of vibrations between
the adjacent buildings.
Because the actual stiffness that the interaction between building edges at the
seismic isolation joints causes is not known, it was difficult to mimic this stiffness in the
computational models. Modeling the seismic joint is complex and was not accurately
modeled with a few linear springs defined at the edges of the building. Various attempts
were made to add springs to the computational model for EWB Unit 3. However, the
springs had an undesirable effect on the mode shapes of the building rather than simply
shifting the building period. Further research should be done in the modeling of seismic

Structural Considerations 52
An Investigation of the Influence of Diaphragm Flexibility on Building Design through a
Comparison of Forced Vibration Testing and Computational Analysis
joints between buildings in order to more accurately capture their effect on a building’s
response.
5.4 Simplification of Mass Modeling
The mass assignment was simplified in each of the models. For both EWB Unit 5
and Unit 3 an additional weight of 20 psf was assumed for the combined weight of
mechanical, electrical, plumbing, partitions, and miscellaneous items otherwise
unaccounted for. The building weight of the CM Building was approximated in a similar
manner, however the weights for MEP, partitions, and the ceiling were delineated
separately and were slightly higher than the 20 psf used for the EWB Unit 5 and Unit 3.
Approximating the weight of the mechanical units, the concrete pads on which they sit,
and their ductwork in a simplified manner, as was done for the purposes of this thesis,
may cause the results of the computational model to be less similar to the actual physical
response than if their weights were determined directly.
Several simplifications were made in the modeling of the three buildings
investigated in this thesis and were discussed previously in this chapter. These
simplifications may have had an effect on the response of the computational models that
did not reflect the actual physical response of the building. It is understood that this
discrepancy between actual response and modeled response exists and that further
minimizing the number of simplifications made in the building model may have
improved the correlation between the model and the building response. It may be useful
to perform further research to determine the acceptable level of modeling accuracy
necessary for adequate correlation between computational model and physical response.

Conclusion 53
An Investigation of the Influence of Diaphragm Flexibility on Building Design through a
Comparison of Forced Vibration Testing and Computational Analysis
6.0 CONCLUSION
Modal parameters were determined experimentally and analytically for three
buildings with concrete diaphragms. The forced vibration testing produced accelerations
that were detected in the range that was expected and determined through hand
calculations for the buildings tested. Computational models with a rigid diaphragm
accurately predicted the response of one of the buildings while a semi-rigid diaphragm
was needed to capture the flexural response of the diaphragms of the other two buildings.
It is concluded that the use of forced vibration testing presented in this thesis was able to
identify the flexibility in the diaphragms.
Building design forces and displacements are affected by the way a concrete
diaphragm is modeled, rigid or semi-rigid. All three buildings examined in this thesis had
diaphragm aspect ratios of less than three and per ASCE 7-05 thus may be idealized as
rigid. However, two of the buildings exhibited flexible diaphragm action rather than the
typically assumed and permitted rigid idealization. Idealizing these two buildings’
concrete diaphragms as rigid resulted in an unconservative estimate of the design seismic
demands. It has been shown that assessing the aspect ratio of a diaphragm alone is not
sufficient to determine its rigidity in all cases. The building designer should consider the
relative stiffness between the floor or roof diaphragm and the adjoining vertical lateral
force resisting elements to accurately categorize the rigidity of the diaphragm. Both
buildings that had flexible diaphragms had low relative stiffness ratios (relative stiffness
ratio of horizontal diaphragm to adjoining vertical elements of the lateral force resisting
system), 0.15 and 0.33. The building with a rigid diaphragm had a much higher relative
Conclusion 54
An Investigation of the Influence of Diaphragm Flexibility on Building Design through a
Comparison of Forced Vibration Testing and Computational Analysis
stiffness ratio, greater than three. A relative stiffness of greater than 1.5 was determined
to be the point at which a diaphragm begins to exhibit rigid behavior. Further research
needs to be performed to determine a more accurate ratio for the relative stiffness at
which idealizing a diaphragm as rigid is acceptable for design. From the cases examined
in this thesis, it was determined that a designer should consider the relative stiffness of
the diaphragm to the lateral force resisting system in addition to the diaphragm aspect
ratio when making a decision as to the rigidity of the diaphragm in order to estimate the
building design forces and story drifts.
Reference 55
An Investigation of the Influence of Diaphragm Flexibility on Building Design through a
Comparison of Forced Vibration Testing and Computational Analysis
7.0 REFERENCE
(Allemang 2003) Allemang, R. J. “The Modal Assurance Criterion – Twenty Years of
Use and Abuse.” Sound and Vibration, 2003.
(ASCE 7-05 2006) The Structural Engineer Institute of the American Society of Civil
Engineers. “Minimum Design Loads for Buildings and Other Structures.”
American Society of Civil Engineers, 2006.
(Chopra 2007) Chopra, A. K. “Dynamics of Structures, Theory and Applications to
Earthquake Engineering, Third Edition.” Pearson Prentice-Hall, New Jersey,
2007.
(CSI 2008) CSI. “ETABS 9.5.0 User’s Guide.” Computers & Structures Inc., Berkeley,
CA, 2008.
(FEMA 355C 2000) SAC Joint Venture. “State of the Art Report on Systems
Performance of Steel Moment Frames Subject to Earthquake Ground Shaking.”
Federal Emergency Management Agency, September 2000.
(Feng and Xue 1998) Feng, M. Q, J.-M. Kim, and H. Xue. “Identification of a Dynamic
System Using Ambient Vibration Measurements.” Journal of Applied Mechanics
Volume 65, Issue 4, 1010, 1998.
(Foschaar 2008) Foschaar, Jennifer C. “Ambient Vibrations of an Existing Structure.”
Architectural Engineering Senior Project. California Polytechnic State University,
San Luis Obispo, 2008.
(Humar 1990) Humar, J. L. “Dynamics of Structures.” Prentice-Hall, Inc., New Jersey,
1990.
(Ivanovic and Todorovska 2000) Ivanovic, S. S., M. D. Trifunac, E. I. Novikova, A. A.
Gladkov and M. I. Todorovska. “Ambient Vibration Tests of a Seven-Story
Reinforced Concrete Building in Van Nuys, California, Damaged by the 1994
Northridge Earthquake.” Soil Dynamics and Earthquake Engineering. Volume
19, Issue 6, August 2000. 391-411.
(Ivanovic and Todorovska 2000) Ivanovic, S. S, M. D. Trifunac, M. I. Todorovska.
“Ambient Vibration Tests of Structures – A Review.” ISET Journal of
Earthquake Technology, Paper No. 407, Vol. 37, No. 4, December 2000. 165-
197.

Reference 56
An Investigation of the Influence of Diaphragm Flexibility on Building Design through a
Comparison of Forced Vibration Testing and Computational Analysis
(Kondo and Hamamoto 1994). Kondo, I., and T. Hamamoto. “Local damage detection of flexible offshore platforms using ambient vibration measurement.” The Proceedings of the Fourth International Offshore and Polar Engineering Conference. International Society of Offshore and Polar Engineers (ISOPE), Golden, CO, USA, 1994. 400-407.
(MathWorks 2009) MathWorks Inc. “Matlab 7 Getting Started Guide.” The MathWorks
Inc. Natick, MA, 2009. (McDaniel and Archer 2009) McDaniel, C.C., Archer, G. “Developing a ‘Feel’ for
Structural Behavior.” American Society for Engineering Education (ASEE)
Annual Conference, 2009. (McDaniel and Archer 2010a) McDaniel, C.C., Archer, G. C. “Full-scale, Real-time
Building Dynamics Laboratory.” 9th U.S. National and 10th Canadian Conference on Earthquake Engineering, Earthquake Engineering Research Institute, 2010
(McDaniel and Archer 2010b) McDaniel, C.C., Archer, G. C. “Improving Student
Understanding of Structural Dynamics Using Full-scale, Real-time Excitation of Buildings.” American Society for Engineering Education (ASEE) Annual
Conference, 2010.
(SAC 1994) SAC Steel Project. SEAOC, ATC, CUREe. Web. 19 July 2010. Richmond,
CA, 1994. <http://www.sacsteel.org>.
(Skolnik and Wallace 2006) Skolnik, Derek, Eunjong Yu, Daniel W. Whang, and John
W. Wallace. “Identification, Model Updating, and Response Prediction of an
Instrumented 15-Story Steel-Frame Building.” Eathquake Spectra, Vol. 22, No. 3,
2006. 781-802.
(Trifunac 1972) Trifunac M.D. “Comparisons Between Ambient and Forced Vibration
Experiments.” Earthquake Engineering and Structural Dynamics, Vol. 1, 1972.
133-150.
(Yu 2005) Yu, E. “Forced Vibration Testing and Analytical Modeling of a Four-Story
Reinforced Concrete Frame Building.” PhD Thesis, Department of Civil
Engineering, University of California, Los Angeles. 2005.
(Yu and Wallace 2008) Yu, E., D. Skolnik, D. Whang, J. Wallace. “Forced Vibration
Testing of a Four-Story Reinforced Concrete Building Utilizing the nees@UCLA
Mobile Field Laboratory.” Earthquake Spectra, Vol. 24, No. 4, 2008.