an investigation of structurally diverse carbamates for acetylcholinesterase (ache) inhibition using...
TRANSCRIPT

An investigation of structurally diverse carbamates for acetylcholinesterase(AChE) inhibition using 3D-QSAR analysis
Kuldeep K. Roy, Anshuman Dixit, Anil K. Saxena 1,*
Medicinal and Process Chemistry Division, Central Drug Research Institute, Lucknow 226001, U.P., India
Journal of Molecular Graphics and Modelling 27 (2008) 197–208
A R T I C L E I N F O
Article history:
Received 11 February 2008
Received in revised form 10 April 2008
Accepted 14 April 2008
Available online 24 April 2008
Keywords:
Acetylcholinesterase
Carbamates
QSAR
CoMFA
CoMSIA
Pharmacophore
A B S T R A C T
In order to identify the essential structural features and physicochemical properties for acetylcholi-
nesterase (AChE) inhibitory activity in some carbamate derivatives, the systematic QSAR (Quantitative
Structure Activity Relationship) studies (CoMFA, advance CoMFA and CoMSIA) have been carried out on a
series of (total 78 molecules) taking 52 and 26 molecules in training and test set, respectively.
Statistically significant 3D-QSAR (three-dimensional Quantitative Structure Activity Relationship)
models were developed on training set molecules using CoMFA and CoMSIA and validated against test set
compounds. The highly predictive models (CoMFA q2 = 0.733, r2 = 0.967, predictive r2 = 0.732, CoMSIA
q2 = 0.641, r2 = 0.936, predictive r2 = 0.812) well explained the variance in binding affinities both for the
training and the test set compounds. The generated models suggest that steric, electrostatic and
hydrophobic interactions play an important role in describing the variation in binding affinity. In
particular the carbamoyl nitrogen should be more electropositive; substitutions on this nitrogen should
have high steric bulk and hydrophobicity while the amino nitrogen should be electronegative in order to
have better activity. These studies may provide important insights into structural variations leading to
the development of novel AChE inhibitors which may be useful in the development of novel molecules for
the treatment of Alzheimer’s disease.
� 2008 Elsevier Inc. All rights reserved.
Contents lists available at ScienceDirect
Journal of Molecular Graphics and Modelling
journal homepage: www.elsevier.com/locate/JMGM
1. Introduction
The Alzheimer’s disease (AD) is characterized by a progressiveimpairment in memory and intellectual ability, accompanied bybehavioral disturbances and the person affected may not recognizefamily members or may have trouble speaking, reading or writingand in carrying out daily activities [1]. The enzyme, acetylcholi-nesterase (AChE), is responsible for the termination of impulsesignaling at cholinergic synapses by catalyzing the hydrolysis ofthe neurotransmitter acetylcholine (ACh) and is also a promisingdrug-like target for the treatment of Alzheimer’s disease [2]. In factit is one of the targets viz. AChE and N-methyl-D-aspartate (NMDA)that has provided few palliative drugs presently marketed for thetreatment of Alzheimer’s disease. These drugs include tacrine,galanthamine, donepezil, and rivastigmine as acetylcholinesteraseinhibitors (AChEI) and memantine as a non-competitive NMDAantagonist for moderate improvement in memory and cognitivefunction [3–9]. The active site of AChE consists of an esteraticsubsite containing the catalytic functional unit, and an anionic
* Corresponding author. Tel.: +91 522 2612412x4386; fax: +91 522 26123405.
E-mail address: [email protected] (A.K. Saxena).1 CDRI Communication No. 7499.
1093-3263/$ – see front matter � 2008 Elsevier Inc. All rights reserved.
doi:10.1016/j.jmgm.2008.04.006
subsite responsible for binding the quaternary trimethylammo-nium tail group of ACh. The catalytic functional unit of AChE is thecatalytic triad consisting of Ser200, Glu327, and His440. Thestructure of the gorge also reveals a constricted region formed bythe side chains of Tyr124, Phe297, Tyr337, and Phe338. An allostericsite located at the periphery of the gorge also plays an importantrole in ligand binding. This site called the peripheral anionic site(PAS) is composed of surface residues Tyr70, Asp72, Tyr121, Tyr334
and Trp279 [10,11].A lot of research has been directed towards modulating the
AChE inhibitory activity by using different substitutions incarbamate series and a number of useful leads have beengenerated, e.g. Weinstock et al. have reported a relationshipbetween chemical structure and AChE inhibitory activity in a seriesof mono- and dialkyl 3-(1-dimethylamino ethyl)-phenyl carba-mates [12,13]. The authors showed a close correlation between theamount of energy needed to overcome the restriction of rotationabout the amide bond (Delta Gq) and the affinity of the inhibitor(Ki) for the AChE enzyme. The anomalous ‘‘ethyl’’ effect wasobserved by Lieske et al. [14] who found that the diethyl carbamoylderivative is the least active in a series of 5-(1,3,3-trimethylindo-linyl) carbamates, about 7400 times less potent (Ki) than thedimethylcarbamoyl analogues. Among monosubstituted carba-mates, the compounds substituted by a propyl group were

Table 1AChE inhibitory activities (IC50, mM) of 1-aminoindane, 1- or 2-aminotetraline, and phenethylamine carbamates
Comp. R1 R2 R3 R4 R5 R6 O N IC50 pIC50
1 – – Me Me H – – 0.03 1.52
2a – – Me Et H – – 0.92 0.04
3a H H Me Me H – u 0.76 0.12
4 H H Me Et H – u 19.00 �1.28
5a H H Me n-Pro H – u 7.30 �0.86
6 H H Me n-hexyl H – u 0.53 0.28
7a H H Me cyclohexyl H – u 3.96 �0.60
8 H H Me p-MeOPh H – u 0.30 0.52
9a H H H Et H – u 17.70 �1.25
10 H H H n-Pro H – u 1.48 �1.70
11a H Me Me Me H – u 1.07 �0.03
12 H Me Me Et H – u 38.60 �1.59
13a H Et Me Me H – u 24.50 �1.39
14a H n-Pro Me Et H – u 3.60 �0.56
15 H H Me Me H – v 0.46 0.34
16a H H Me Et H – v 10.50 �1.02
17a H H Me Me H – v 0.51 0.29
18 H H Me Me H – w 0.009 2.05
19a H H Me Et H – w 0.026 1.59
20 H H Me Me H – u s 1.48 �0.17
21a H H Me Et H – u s 6.22 �0.79
22 H H Me Me H – u t 3.24 �0.51
23a H H Me Et H – u t 79.60 �1.90
24 H Pg Me Me H – u 2.90 �0.46
25a H Pg Me Et H – u 47.00 �1.67
26 H Pg Me n-Pro H – u 14.60 �1.16
27 H Pg Me n-hexyl H – u 15.70 �1.20
28 H Pg Me cyclohexyl H – u 41.20 �1.62
29a H Pg Me p-MeOPh H – u 0.86 0.07
30 H Pg H Et H – u 13.70 �1.14
31 H Pg H n-Pro H – u 2.38 �0.38
32 H Pg Me n-Bu H – u 11.30 �1.05
33a H Pg Et n-Bu H – u 72.40 �1.86
34 H Pg Me cyclohexyl H – u 17.90 �1.25
35 H Pg Me Bn H – u 1.78 �0.25
36a H Pg Me Ph H – u 0.55 0.26
37 Me Pg Me Me H – u 12.90 �1.11
38 Et Pg Me Me H – u 17.90 �1.25
39 H Pg Me Me H – v 2.50 �0.40
40 H Pg Me Et H – v 525.00 �2.72
41 H Pg Me n-Pro H – v 45.80 �1.66
42 Me Pg Me Me H – v 7.00 �0.85
43a Me Pg Me Et H – v 439.00 �2.64
44a H Pg Me Me H – w 0.053 1.28
45 H Pg Me Et H – w 2.15 �0.33
46 H Pg Me Et 5-Cl – u 25.50 �1.41
47 H Pg Me n-Pr 5-Cl – u 43.90 �1.64
48 H 1-MePg Me Me H – u 1.80 �0.25
49 H Pg Me Me H – u s 3.94 �0.60
50a H Pg Me Et H – u s 52.40 �1.72
51 H Pg Me Me H – u t 4.10 �0.61
52 H Pg Me Et H – u t 204.00 �2.31
53 Me Pg Me Et H – w 14.90 �1.17
54 Me Me Me Me H – u 2.15 �0.33
55a Me Me Me Me H – w 0.013 1.89
56 H H Me Me H H – 0.23 0.64
57 H H Me Et H H – 35.50 �1.56
58 H H Me n-Pro H H – 7.80 �0.89
59 H Me Me Me H H – 0.28 0.55
60a H Me Me Et H H – 20.70 �1.32
61 Me Me Me Me H H – 0.16 0.76
K.K. Roy et al. / Journal of Molecular Graphics and Modelling 27 (2008) 197–208198

Table 1 (Continued )
Comp. R1 R2 R3 R4 R5 R6 O N IC50 pIC50
62 H Pg Me Me H H – 0.22 0.66
63 H Pg Me Et H H – 30.20 �1.48
64 H Pg Me n-Pro H H – 15.40 �1.19
65a Me Pg Me Me H H – 0.85 0.07
66 Me Pg Me Et H H – 16.60 �1.22
67 H Pg Me Me H Me – 0.54 0.27
68 H Pg Me Et H Me – 33.90 �1.53
69 H Pg Me n-Pro H Me – 19.10 �1.28
70a H Pg Me cyclohexyl H Me – 3.60 0.56
71 H Pg Me n-Bu H Me – 12.20 �1.09
72a Me Pg Me Me H Me – 1.64 �0.22
73 Me Pg Me Et H Me – 234.00 �2.37
74 Me Pg Me n-Pro H Me – 33.10 �1.52
75 Me Pg Me n-hexyl H Me – 3.06 �0.49
76 Me Pg Me cyclohexyl H Me – 8.67 �0.94
77a H 1-MePg Me Me H Me – 0.17 0.77
78 H 1-MePg Me Et H Me – 13.90 �1.14
a The compounds taken in the test set; Pg = propargyl; n-Pro = N-propyl; c-Hexyl = cyclohexyl; 1-MePg = 1-methyl-2-propynyl; Bn = benzyl; Me = methyl; Et = ethyl; n-
Bu = n-butyl; p-MeOPh = p-methoxyphenyl; Ph = phenyl.
K.K. Roy et al. / Journal of Molecular Graphics and Modelling 27 (2008) 197–208 199
suggested to be more active than their corresponding ethyl analogssimilar to the carbamates reported by Weinstock et al. [12,13].
The ligand based approaches like three-dimensional Quantita-tive Structure Activity Relationship (3D-QSAR) studies have beenquite useful in identifying the essential structural requirements forenzyme inhibitory activity. Though some 2D-QSAR studies havebeen reported on Biphenyl-4-acyoxylate-40-N-butylcarbamates[15,16] in order to probe the peripheral anionic site, composedof Trp279, Tyr70, Tyr121, and Asp72, in the AChE and butyrylcho-linesterase (BChE) for pseudo-reversible inhibition but neither 2D-nor 3D-QSAR studies have been carried out to probe the esteraticsubsite containing the catalytic functional unit comprising of Ser
200, Glu 327, and His 440, and an anionic subsite composed ofTrp84, Glu199, and Phe330 responsible for binding the quaternarytrimethylammonium tail group of ACh. Therefore, it appeared ofinterest to carry out Comparative Molecular Field Analysis orCoMFA and Comparative Molecular Similarity Indices Analysis orCoMSIA studies on the carbamates for their AChE inhibitoryactivity. These studies are reported in this paper.
2. Materials and methods
2.1. Biological data
The 3D-QSAR studies were performed on 78 chemically diversemolecules belonging to substituted carbamoyl aminoindanes,tetralenes and phenethyl amines (Table 1) reported by Sterlinget al. [17]. The AChE inhibitory activity of the compounds isexpressed as IC50 value in the micromolar (mM) range. The selectedcompounds cover a wide range of biological activity spanning overfive log units (0.009–525 mM) and diverse structural features. TheIC50 values were converted into log IC50 (pIC50) for use in the QSARstudies.
2.2. Rational division of training and test sets
In view of the recent finding that q2 appears to be the necessarybut not the sufficient condition for the model to have a highpredictive power [18a,b], the emphasis has been given for thevalidation on an external test set. It has been suggested that themodels should be tested on a sufficiently large test set (25–33% oftotal) to establish a reliable QSAR model [18b]. Among severalmethods for the classification of the dataset into training and testsets viz. random sampling (RS), activity ranked clustering (ARC)and descriptor based clustering (DBC); the DBC has been shown to
be the most effective method for selection of representative test set(both in terms of activity and structural diversity). Therefore, thecompounds were rationally divided into training (52 compounds)and test (26 compounds) sets by CoMFA based hierarchicalclustering using molecular steric and electrostatic fields asparameters. The test set compounds were picked up fromgenerated clusters (13) in such a way that they cover almostentire range of biological activity. Thus both the sets (training andtest) span full range of biological activity and structural featuresand the test set can be reasonably used to validate the generatedQSAR models.
2.3. Computational details
The molecular modeling studies CoMFA, advanced CoMFA andCoMSIA were performed on a Silicon Graphics Octane R12000workstation using SYBYL 6.9 molecular modeling software [19].The structures were built from fragments in SYBYL fragmentlibrary. The partial charges were calculated using Gasteiger–Huckel method and their geometry was optimized using Triposforce field with a distance-dependent dielectric function until aroot mean square (rms) deviation of 0.01 kcal/mol A was achieved.The conformational search was performed using multisearchmethod with the following settings: maximum cycles (400),maximum conformers (400), energy cutoff (70 kcal/mol), max-imum rms gradient (3.0) tolerance (0.40), and number of hit (12).The minimum energy conformations thus obtained were used inthe analysis.
2.4. Molecular alignments
Structural alignment is perhaps the most subjective, yet critical,step in CoMFA study. The experience shows that the resulting 3D-QSAR models are often sensitive to a particular alignment scheme.However in contrast to CoMFA, CoMSIA is relatively less sensitiveto changes in orientation of the superimposed molecules in thelattice [20]. Therefore, in the present study we compared threedifferent alignment rules carefully to get the most efficient one forsuch structurally diverse molecules.
1. T
he common substructure fitting method (Alignment 1). In thismethod, molecules are superimposed to a common substructure(Fig. 1A).2. T
he flexible fitting (multi-fit) method (Alignment 2). The align-ment of molecules is performed by a multi-fit option, allowing
Fig. 1. (A) Substructure for common substructure based alignment and (B)
substructure with asterisk marks indicating atoms used for multi-fit alignment.
TaTh
Stu
Par
q2
spr
r2
SEE
F
N
r2bs
SD
r2CV
q2
val
TS
K.K. Roy et al. / Journal of Molecular Graphics and Modelling 27 (2008) 197–208200
flexible fitting of the molecules to the template. The atoms(asterisk marked in Fig. 1B) were considered as fitting point.
Fig. 2. Common substructure based alignment of all 78 molecules.
3. T he rigid body field-fit method (Alignment 3). In this procedure,the root mean square differences (RMSD) between themolecules and the template molecule for steric and electrostaticfields, averaged across all lattice points, is minimized.In ‘Common substructure fitting method’, the 3D structures ofthe molecules to be analyzed are aligned to a suitable conforma-tional template, which is assumed to adopt a ‘‘bioactiveconformation’’. The compounds were fitted to the templatemolecule 18 which is the most active molecule in the dataset.In order to optimize the alignment different substructures wereused and the best alignment was selected from differentalignments thus generated. The most successful alignment wasachieved by using the common aryloxy substructure (Fig. 1A). Thisalignment placed less significance on substituted or unsubstitutedamino groups and correspondingly more significance on thecarbamate groups. Among different alignments this alignmentyielded the best results, though it resulted in flipping of the indanering in 4- and 7-carbamates. It can be seen the position ofcarbamate groups is same while the indane, tetralene andphenethyl groups are taking different orientations (Fig. 2).
The multi-fit based alignment (Alignment 2) where the attemptwas made to place nitrogen (of indane, tetralene and phenethylgroups) together resulted in scattering of carbamate groups andthe field-fit alignment (Alignment 3) in which the molecules weresomewhat scattered due to their rigid nature and relative positionof different groups did not show any significant improvement interms of statistical parameters including leave one out (LOO) cross-validation, q2 over the first common substructure based alignment(Table 2).
ble 2e comparative study of three alignments (all 78 molecules)
dy Alignment 1 Ali
CoMFA CoMSIA CoM
ameters* TS SEH TS
0.730 0.755 0.6
ess 0.544 0.522 0.6
0.931 0.914 0.8
0.275 0.308 0.3
159.555 106.886 88.
6 7 7
0.950 0.929 0.9
bs 0.012 0.016 0.0
ðmeanÞ 0.676 0.642 0.5
= cross-validated correlation coefficient; spress = cross-validated standard error; r2 = d
ue; N = optimal number of components; r2bs ¼ r2 obtained after bootstrapping; SDbs =
= Tripos standard field, S = steric, E = electrostatic, H = hydrophobic field.
2.5. CoMFA [21] studies
2.5.1. CoMFA
The aligned molecules were kept in a 3D cubic lattice with a gridspacing of 2.0 A in x, y and z directions. The steric (6–12 Lennard–Jones potential) and electrostatic (Columbic with 1/r dielectric)fields were calculated at each lattice point using Tripos force fieldand distance-dependent dielectric constant. A sp3-hybridizedcarbon with a +1.0 charge was used as a probe atom. To avoidtoo high and unrealistic energy values inside the molecule, a30 kcal/mol energy cutoff was applied.
2.5.2. Advance CoMFA
H-bonding (HB), indicator (IND) and parabolic (PBL) fields areused in advanced CoMFA routine to extend the scope of CoMFA. H-bond fields are special indicator fields based on the description byBohacek and McMartin [22]. Lattice points with steric energiesbelow the steric cutoff energy are assigned nominal energies equalto the steric cutoff energy if they are close to H-bond accepting ordonating atoms. Indicator fields [23] replace all lattice energieswith magnitudes below a designated threshold with zero values.All energies at or above that threshold are replaced with a nominalenergy value equal in magnitude to the relevant field cutoff value.When both fields are included in a single CoMFA column, thegreater of the steric and electrostatic cutoffs is used. The sign of theoriginal lattice energy is retained. Parabolic fields are those inwhich the magnitude of a standard steric and/or electrostatic field
gnment 2 Alignment 3
FA CoMSIA CoMFA CoMSIA
SEH TS SEH
37 0.476 0.152 0.046
35 0.758 0.985 1.002
99 0.771 0.990 0.636
35 0.501 0.107 0.629
947 39.909 746.88 43.03
6 9 3
37 0.837 0.995 0.743
13 0.038 0.003 0.051
28 0.423 0.106 0.030
etermination coefficient; SEE = noncross-validated standard error; F = Fischer’s F-
bootstrapping standard deviation; r2CVðmeanÞ ¼mean r2 of cross-validation in groups;

Table 3CoMFA and advanced CoMFA models generated using alignment 1
Parameters TS IND PBL
q2 0.733 0.604 0.556
spress 0.532 0.634 0.671
r2 0.967 0.939 0.915
SEE 0.187 0.249 0.293
F 185.412 141.606 99.288
N 7 5 5
Fraction S 0.551 0.568 0.601
E 0.449 0.432 0.399
r2bs 0.969 0.959 0.947
SDbs 0.013 0.015 0.014
r2CVðmeanÞ 0.675 0.545 0.522
q2 = cross-validated correlation coefficient; spress = cross-validated standard error;
r2 = determination coefficient; SEE = noncross-validated standard error;
F = Fischer’s F-value; N = optimal number of components; Fraction = relative
contribution of the fields, r2bs ¼ r2 obtained after bootstrapping; SDbs = bootstrap-
ping standard deviation; r2CVðmeanÞ ¼ mean r2 of cross-validation in groups.
K.K. Roy et al. / Journal of Molecular Graphics and Modelling 27 (2008) 197–208 201
at each lattice point has been squared; the original sign of theenergy is retained.
2.6. CoMSIA [24] studies
CoMSIA is considered superior to CoMFA in certain respectslike it is immune to small shifts in regions, remains unaffectedwhen the orientation of molecules is changed; there is no needof strict cutoffs which can result in exclusion of severalimportant data points and more intuitively interpretablecontour maps. CoMSIA calculates similarity indices at theintersections of a surrounding lattice. Five similarity fieldsnamely steric, electrostatic, hydrophobic, hydrogen bond donorand acceptor were calculated. The lattice dimensions wereselected with a sufficiently large margin extended up to 4 Asurrounding all aligned molecules. In CoMSIA, the steric indicesare related to the third power of the atomic radii, theelectrostatic descriptors are derived from atomic partial charges,the hydrophobic fields are derived from atom-based parameters,and the hydrogen bond donor and acceptor indices are obtainedby a rule-based method derived from experimental values. In thepresent work, similarity indices were computed using a probeatom with radius 1.0 A, charge +1, hydrophobicity +1, hydrogenbond donor and acceptor properties of +1 and attenuation factorof 0.3 for the Gaussian type distance function. A Gaussianfunction is used for the distance dependence between the probeatom and the molecule atoms. Because of the different shape ofthe Gaussian function, the similarity indices can be calculated atall grid points, both inside and outside the molecular surface.
The equation used to calculate the similarity indices is asfollows:
AqF;kð jÞ ¼
XWprobe; kWike�ar2iq
where A is the similarity index at grid point q, summed over allatoms i of the molecule j under investigation. Wprobe, k is the probeatom with radius 1 A, charge +1, hydrophobicity +1, hydrogenbond accepting +1, Wik, is the actual value of the physicochemicalproperty k of atom i, riq is the mutual distance between the probeatom at grid point q and atom i of the test molecule, a is theattenuation factor, with a default value of 0.3, and an optimal valuenormally between 0.2 and 0.4.
Larger values result in a steeper Gaussian function, and astrong attenuation of the distance-dependent effects of mole-cular similarity. Global molecular features become less impor-tant, and there is little averaging of local features. With anattenuation factor (a) of 0.3, each property value of a given atomis felt by 74.1% at 1 A from the atom, by 30.1% at 2 A, and by 6.7%at 3 A.
2.7. Partial least squares (PLS) analysis
PLS was used to correlate the AChE inhibitory activity with theCoMFA and CoMSIA values containing magnitude of steric,electrostatic and other potentials. The generated models wereassessed by using LOO cross-validation procedure by SAMPLSmethod as implied in SYBYL. A strict criterion for selection ofoptimal number of components was applied by selecting lowestspress value and also wherever the last added component increasedq2 less than 5%, the less complex model was chosen. In addition toLOO cross-validation the cross-validation in groups using tengroups, repeating the procedure 10 times was also carried out. Themean of 10 readings is given as ½r2
CVðmeanÞ�. The partial least squaresalgorithm was used to generate the final CoMFA and CoMSIAmodels with optimal number of components obtained using LOOcross-validation. The minimum sigma standard deviation thresh-
old was set at 2.0 kcal/mol to speed up the analysis and to reducethe noise. The r2
CV, spress, r2, and SE values were computed as definedin SYBYL.
2.8. Predictive r2
The predictive r2 was based only on molecules not considered inthe training set. Predictive r2 ðr2
predÞ value is defined as
r2pred ¼
ðSD� PRESSÞSD
where SD is the sum of squared deviation between the biologicalactivities of the test set molecule and the mean activity of thetraining set molecules and PRESS is the sum of squareddeviations between the observed and the predicted activitiesof the test molecules [25]. If Pr2 is zero, then the results are notby chance and are significant. Like r2
cv, the predictive r2 canassume a negative value reflecting a complete lack of predictiveability of the model of the molecules included in the test set[26]. To further assess the robustness and statistical confidenceof the derived models, bootstrapping analysis (100 runs) wasperformed. CoMFA standard scaling was applied to all theCoMFA analysis while autoscaling was applied to all CoMSIAanalysis.
3. Results and discussion
The CoMFA and CoMSIA are highly sensitive to the relativealignment of molecules and since these molecules have widelyvarying structures, it was important to determine the bestalignment rule.
The best alignment was selected on the basis of q2� values bothfor CoMFA and CoMSIA using all 78 compounds. Out of the threealignments, the alignment obtained using the common substruc-ture fitting method (alignment 1) was found to exhibit high q2
values both for CoMFA (q2 = 0.730) as well as CoMSIA (q2 = 0.755).The detailed statistical results obtained for the three alignmentstaking all molecules are shown in Table 2.
Since the Common Substructure Alignment method gave themodel with best statistics and reasonable superimposition ofimportant functional groups (Fig. 2), this alignment was furtherused for systematic CoMFA, advance CoMFA and CoMSIA studiesusing the training set compounds (total 52). The results have beensummarized in Tables 3 and 4.
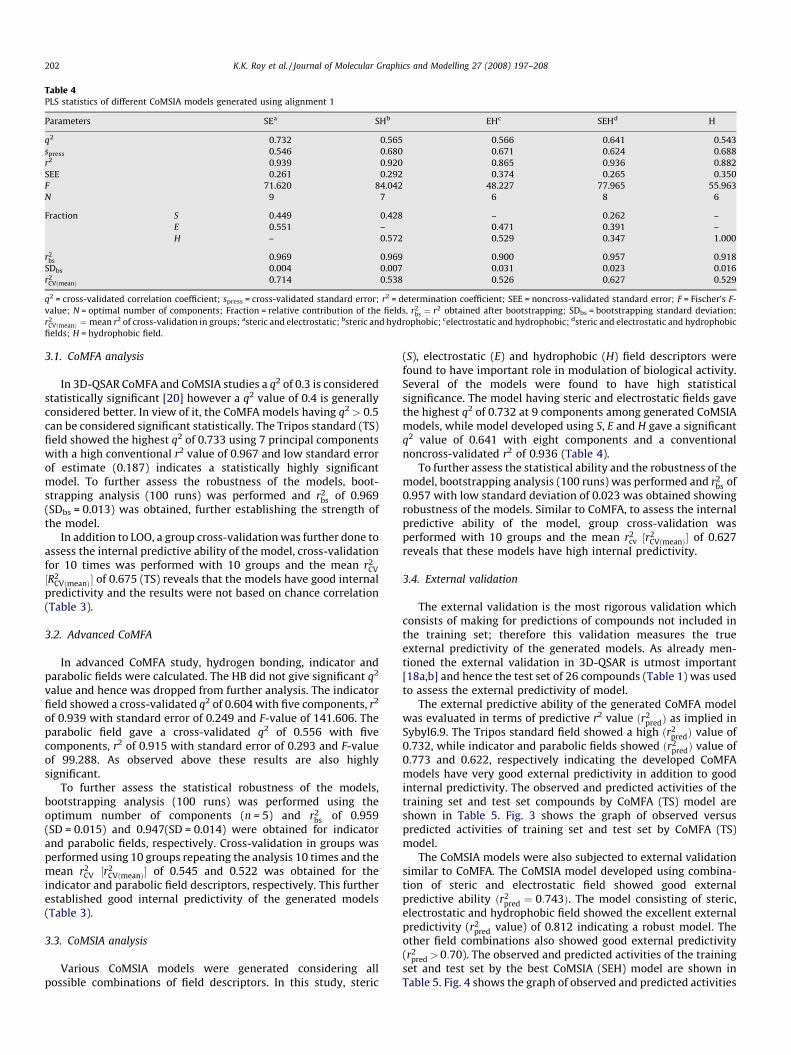
Table 4PLS statistics of different CoMSIA models generated using alignment 1
Parameters SEa SHb EHc SEHd H
q2 0.732 0.565 0.566 0.641 0.543
spress 0.546 0.680 0.671 0.624 0.688
r2 0.939 0.920 0.865 0.936 0.882
SEE 0.261 0.292 0.374 0.265 0.350
F 71.620 84.042 48.227 77.965 55.963
N 9 7 6 8 6
Fraction S 0.449 0.428 – 0.262 –
E 0.551 – 0.471 0.391 –
H – 0.572 0.529 0.347 1.000
r2bs 0.969 0.969 0.900 0.957 0.918
SDbs 0.004 0.007 0.031 0.023 0.016
r2CVðmeanÞ 0.714 0.538 0.526 0.627 0.529
q2 = cross-validated correlation coefficient; spress = cross-validated standard error; r2 = determination coefficient; SEE = noncross-validated standard error; F = Fischer’s F-
value; N = optimal number of components; Fraction = relative contribution of the fields, r2bs ¼ r2 obtained after bootstrapping; SDbs = bootstrapping standard deviation;
r2CVðmeanÞ ¼mean r2 of cross-validation in groups; asteric and electrostatic; bsteric and hydrophobic; celectrostatic and hydrophobic; dsteric and electrostatic and hydrophobic
fields; H = hydrophobic field.
K.K. Roy et al. / Journal of Molecular Graphics and Modelling 27 (2008) 197–208202
3.1. CoMFA analysis
In 3D-QSAR CoMFA and CoMSIA studies a q2 of 0.3 is consideredstatistically significant [20] however a q2 value of 0.4 is generallyconsidered better. In view of it, the CoMFA models having q2 > 0.5can be considered significant statistically. The Tripos standard (TS)field showed the highest q2 of 0.733 using 7 principal componentswith a high conventional r2 value of 0.967 and low standard errorof estimate (0.187) indicates a statistically highly significantmodel. To further assess the robustness of the models, boot-strapping analysis (100 runs) was performed and r2
bs of 0.969(SDbs = 0.013) was obtained, further establishing the strength ofthe model.
In addition to LOO, a group cross-validation was further done toassess the internal predictive ability of the model, cross-validationfor 10 times was performed with 10 groups and the mean r2
CV
½R2CVðmeanÞ� of 0.675 (TS) reveals that the models have good internal
predictivity and the results were not based on chance correlation(Table 3).
3.2. Advanced CoMFA
In advanced CoMFA study, hydrogen bonding, indicator andparabolic fields were calculated. The HB did not give significant q2
value and hence was dropped from further analysis. The indicatorfield showed a cross-validated q2 of 0.604 with five components, r2
of 0.939 with standard error of 0.249 and F-value of 141.606. Theparabolic field gave a cross-validated q2 of 0.556 with fivecomponents, r2 of 0.915 with standard error of 0.293 and F-valueof 99.288. As observed above these results are also highlysignificant.
To further assess the statistical robustness of the models,bootstrapping analysis (100 runs) was performed using theoptimum number of components (n = 5) and r2
bs of 0.959(SD = 0.015) and 0.947(SD = 0.014) were obtained for indicatorand parabolic fields, respectively. Cross-validation in groups wasperformed using 10 groups repeating the analysis 10 times and themean r2
CV ½r2CVðmeanÞ� of 0.545 and 0.522 was obtained for the
indicator and parabolic field descriptors, respectively. This furtherestablished good internal predictivity of the generated models(Table 3).
3.3. CoMSIA analysis
Various CoMSIA models were generated considering allpossible combinations of field descriptors. In this study, steric
(S), electrostatic (E) and hydrophobic (H) field descriptors werefound to have important role in modulation of biological activity.Several of the models were found to have high statisticalsignificance. The model having steric and electrostatic fields gavethe highest q2 of 0.732 at 9 components among generated CoMSIAmodels, while model developed using S, E and H gave a significantq2 value of 0.641 with eight components and a conventionalnoncross-validated r2 of 0.936 (Table 4).
To further assess the statistical ability and the robustness of themodel, bootstrapping analysis (100 runs) was performed and r2
bs of0.957 with low standard deviation of 0.023 was obtained showingrobustness of the models. Similar to CoMFA, to assess the internalpredictive ability of the model, group cross-validation wasperformed with 10 groups and the mean r2
cv ½r2CVðmeanÞ� of 0.627
reveals that these models have high internal predictivity.
3.4. External validation
The external validation is the most rigorous validation whichconsists of making for predictions of compounds not included inthe training set; therefore this validation measures the trueexternal predictivity of the generated models. As already men-tioned the external validation in 3D-QSAR is utmost important[18a,b] and hence the test set of 26 compounds (Table 1) was usedto assess the external predictivity of model.
The external predictive ability of the generated CoMFA modelwas evaluated in terms of predictive r2 value ðr2
predÞ as implied inSybyl6.9. The Tripos standard field showed a high ðr2
predÞ value of0.732, while indicator and parabolic fields showed ðr2
predÞ value of0.773 and 0.622, respectively indicating the developed CoMFAmodels have very good external predictivity in addition to goodinternal predictivity. The observed and predicted activities of thetraining set and test set compounds by CoMFA (TS) model areshown in Table 5. Fig. 3 shows the graph of observed versuspredicted activities of training set and test set by CoMFA (TS)model.
The CoMSIA models were also subjected to external validationsimilar to CoMFA. The CoMSIA model developed using combina-tion of steric and electrostatic field showed good externalpredictive ability ðr2
pred ¼ 0:743Þ. The model consisting of steric,electrostatic and hydrophobic field showed the excellent externalpredictivity (r2
pred value) of 0.812 indicating a robust model. Theother field combinations also showed good external predictivity(r2
pred >0:70). The observed and predicted activities of the trainingset and test set by the best CoMSIA (SEH) model are shown inTable 5. Fig. 4 shows the graph of observed and predicted activities

Table 5Observed (Obs.), predicted AChE inhibitory activities (pIC50) and residuals (d) of the best CoMFA (TS), advanced CoMFA (INN) and CoMSIA (SEH) models
Comp. Obs. TS� d IND 6¼ d SEHy d
1 1.52 1.30 0.22 1.24 0.29 0.86 0.66
2* 0.04 �0.35 0.39 �0.48 0.52 �0.36 0.40
3* 0.12 0.37 �0.25 0.28 �0.16 0.23 �0.11
4 �1.28 �1.15 �0.13 �1.18 �0.10 �1.17 �0.11
5* �0.86 �0.96 0.10 �1.00 0.14 �1.10 0.24
6 0.28 0.25 0.03 0.27 0.01 0.04 0.24
7* �0.60 �0.74 0.14 �0.48 �0.12 �1.45 0.85
8 0.52 0.52 0.01 0.64 �0.12 0.51 0.02
9* �1.25 �0.35 �0.90 �0.66 �0.59 �0.17 �1.08
10 �0.17 �0.09 �0.08 �0.50 0.33 �0.09 �0.08
11* �0.03 �0.23 0.20 �0.10 0.07 �0.02 �0.01
12 �1.59 �1.82 0.23 �1.57 �0.02 �1.44 �0.15
13* �1.39 �0.50 �0.89 �0.71 �0.68 �0.37 �1.02
14* �0.56 �1.71 1.15 �1.36 0.80 �1.40 0.84
15 0.34 0.24 0.10 0.64 �0.30 0.36 �0.02
16* �1.02 �0.94 �0.08 �1.03 0.01 �0.87 �0.16
17* 0.29 0.56 �0.27 0.64 �0.35 0.01 0.28
18 2.05 2.24 �0.19 2.29 �0.24 2.12 �0.07
19* 1.59 0.76 0.83 0.92 0.67 0.72 0.87
20 �0.17 �0.16 �0.01 �0.12 �0.05 �0.12 �0.06
21* �0.79 �1.64 0.85 �1.09 0.30 �0.90 0.11
22 �0.51 �0.53 0.02 �0.41 �0.11 �0.42 �0.09
23* �1.90 �1.77 �0.13 �1.87 �0.03 �1.73 �0.17
24 �0.46 �0.33 �0.13 �0.40 �0.06 �0.54 0.08
25* �1.62 �1.68 0.06 �1.78 0.16 �1.55 �0.07
26 �1.16 �1.40 0.24 �1.60 0.44 �1.43 0.27
27 �1.20 �1.31 0.11 �1.16 �0.05 �1.15 �0.05
28 �1.61 �1.38 �0.23 �1.26 �0.35 �1.43 �0.18
29* 0.07 �0.29 0.36 �0.51 0.58 0.09 �0.02
30 �1.14 �1.20 0.06 �1.46 0.32 �0.96 �0.18
31 �0.38 �0.34 �0.04 �0.63 0.25 �0.43 0.05
32 �1.05 �0.96 �0.10 �1.15 0.10 �1.02 �0.03
33* �1.86 �0.98 �0.88 �0.72 �1.14 �1.89 0.03
34 �1.25 �1.15 �0.11 �1.33 0.08 �1.19 �0.06
35 �0.25 �0.39 0.14 �0.21 �0.04 �0.14 �0.11
36* 0.26 �0.82 1.08 0.04 0.22 �0.06 0.32
37 �1.11 �0.77 �0.34 �0.61 �0.50 �0.48 �0.63
38 �1.25 �1.31 0.06 �1.12 �0.13 �1.37 0.12
39 �0.40 �0.86 0.46 �0.94 0.54 �0.83 0.43
40 �2.72 �2.06 �0.66 �2.33 �0.39 �2.14 �0.58
41 �1.66 �1.64 �0.02 �1.88 0.22 �2.02 0.36
42 �0.85 �0.71 �0.14 �0.86 0.01 �0.72 �0.13
43* �2.64 �1.92 �0.72 �2.20 �0.44 �2.21 �0.43
44* 1.28 1.17 0.11 1.57 �0.29 1.03 0.26
45 �0.33 �0.28 �0.05 �0.10 �0.23 �0.22 �0.12
46 �1.41 �1.60 0.19 �1.36 �0.06 �1.38 �0.03
47 �1.64 �1.60 �0.04 �1.65 0.01 �1.41 �0.23
48 �0.25 �0.31 0.06 �0.62 0.37 �0.54 0.29
49 �0.60 �0.61 0.01 �1.12 0.52 �1.00 0.40
50* �1.72 �1.88 0.16 �1.93 0.21 �2.28 0.56
51 �0.61 �0.60 �0.01 �0.89 0.28 �0.87 0.26
52 �2.31 �2.30 �0.01 �2.18 �0.13 �2.28 �0.03
53 �1.17 �1.26 0.09 �0.95 �0.22 �1.29 0.12
54 �0.33 �0.25 �0.08 �0.47 0.14 0.03 �0.36
55* 1.89 1.55 0.34 0.98 0.91 1.53 0.36
56 0.64 0.62 0.02 0.59 0.05 0.45 0.19
57 �1.55 �1.51 �0.04 �1.13 �0.42 �1.55 0.00
58 �0.89 �0.94 0.05 �0.90 0.01 �1.19 0.30
59 0.55 0.67 �0.12 0.37 0.18 0.79 �0.24
60* �1.32 �1.73 0.41 �0.90 �0.42 �1.62 0.30
61 0.76 0.75 0.02 0.68 0.08 0.60 0.16
62 0.66 0.48 0.18 0.44 0.22 0.78 �0.12
63 �1.48 �1.52 0.04 �1.19 �0.29 �1.12 �0.36
64 �1.19 �0.97 �0.22 �1.00 �0.19 �1.07 �0.12
65* 0.07 0.25 �0.18 0.23 �0.16 0.18 �0.11
66 �1.22 �1.45 0.23 �1.43 0.21 �1.38 0.16
67 0.27 0.02 0.26 �0.08 0.35 0.19 0.09
68 �1.53 �1.46 �0.08 �1.53 0.00 �1.43 �0.10
69 �1.28 �1.44 0.16 �1.63 0.35 �1.50 0.22
70* �0.56 �1.01 0.45 �1.22 0.66 �0.82 0.26
71 �1.09 �0.97 �0.12 �0.95 �0.14 �1.23 0.14
72* �0.22 �0.42 0.20 �0.36 0.14 �0.25 0.03
73 �2.37 �2.53 0.16 �2.12 �0.25 �2.35 �0.03
74 �1.52 �1.40 �0.12 �1.52 0.00 �1.26 �0.26
75 �0.49 �0.56 0.07 �0.26 �0.23 �0.51 0.02
K.K. Roy et al. / Journal of Molecular Graphics and Modelling 27 (2008) 197–208 203

Table 5 (Continued )
Comp. Obs. TS� d IND 6¼ d SEHy d
76 �0.94 �1.05 0.11 �0.89 �0.05 �1.05 0.11
77* 0.77 0.39 0.38 �0.02 0.79 0.52 0.25
78 �1.14 �1.17 0.03 �1.15 0.01 �1.13 �0.01
r2pred 0.73 0.73 0.81
*Compounds of the test set; r2pred ¼ predictive r2; �TS = Tripos standard field; 6¼IND = indicator field; yS = steric, E = electrostatic, H = hydrophobic field.
K.K. Roy et al. / Journal of Molecular Graphics and Modelling 27 (2008) 197–208204
of training set and test set by CoMSIA (SEH) model. The impressiveresults obtained for these test-set compounds provide strongevidence that the CoMFA and CoMSIA models so derived are able topredict well the AChE inhibitory activities of structurally diversecarbamates taken in the study.
3.5. CoMFA and CoMSIA contour maps
The analysis of the CoMFA and CoMSIA contour maps providesgood insight into the SAR by providing a visual display of favouredand disfavoured positions. Therefore, the steric and electrostaticfeatures of the final CoMFA and CoMSIA models are displayed ascontour maps of the PLS regression coefficients at each CoMFA/CoMSIA region grid point. They are generated using the field typeStDev*Coefficient to show the contribution for favourable andunfavourable interactions with the receptor in terms of steric (80%green, 20% yellow), electrostatic (80% blue and 20% red) andhydrophobic (80% yellow, 20% white). These contour maps for the3D models are shown in Figs. 5–10.
The surfaces near the template molecule (18) indicate theregions where the increase (green region) or decrease (yellowregion) in steric bulk as well as increase (blue region) or decrease(red region) in electrostatic field would be important for theimprovement of binding affinity. The yellow polyhydra in thehydrophobic contours shows the region where an increase inhydrophobicity is favourable for AChE inhibitory activity whilewhite polyhydra denotes the region where hydrophobicity is
Fig. 3. The graph of observed versus calculated activities of training
Fig. 4. The graph of observed versus calculated activities of training
unfavourable for activity. The advantage of CoMSIA contour mapsover CoMFA is that they are easier to interpret.
The contours on the molecules are divided into two groups. Thegroup one consists of contours which are enclosing or are near tothe carbamate group (site 1), the second groups consists of thecontours at or near the indane moiety (site 2) (Fig. 5A and B).
3.6. Contour maps on site 1
The blue polyhydra around carbamoyl nitrogen in contours ofboth CoMFA (Fig. 5A) as well as CoMSIA (Fig. 5B) indicate that thisnitrogen should be more electropositive for better binding withAChE enzyme. Therefore, the electron withdrawing groups on thisnitrogen should be more favourable for biological activity. It caneasily be seen among nonpropargyl 6-carbamates, e.g. compound 8(IC50 = 0.30 mM), which has 4-methoxyphenyl (p-MeOPh) as R4
(IC50 = 0.76 mM), is about 2 times more potent than the compound 3substituted with methyl (Me) as R4. This may be due to the fact thatp-MeOPh group pull away electrons from carbamoyl nitrogenthrough resonance and thereby rendering the nitrogen moreelectropositive; Among propargylated 6-carbamates also, thisobservation is consistent, e.g. compound 29 (IC50 = 0.86 mM), whichhas p-MeOPh as R4, is about 45 fold more potent than compound 28(IC50 = 41.2 mM) substituted with cyclohexyl group as R4.
The bigger green polyhydra in both CoMFA as well as CoMSIAcontours suggest that bulkier groups extending to this region (site1) would be more favourable for better AChE inhibitory activity. It
set and test set compounds using the best CoMFA (TS) model.
set and test set compounds using the best CoMSIA (SEH) model.

Fig. 5. (A) Contour map of the best CoMFA model using Tripos standard field and (B) contour map of the best CoMSIA model using steric, electrostatic and hydrophobic fields.
Fig. 6. (A) Electrostatic contour maps of the best CoMFA (TS) model displayed around compound 3 and (B) electrostatic contour maps of the best CoMFA (TS) model displayed
around compound 18.
Fig. 7. (A) Electrostatic contour map of the best CoMSIA model displayed around compound 18 and (B) the common feature pharmacophore model generated using Catalyst
software (blue sphere indicate hydrophobic feature, while green sphere are indicative of hydrogen bond acceptor (HBA) feature with the arrow showing the directionality of
the acceptor feature).
Fig. 8. (A) Hydrophobic contour maps of the best CoMSIA (SEH) model displayed around compound 3 and (B) hydrophobic contour maps of the best CoMSIA (SEH) model
displayed around compound 18.
K.K. Roy et al. / Journal of Molecular Graphics and Modelling 27 (2008) 197–208 205

Fig. 9. Electrostatic contour map of CoMFA displayed around compound 56.
K.K. Roy et al. / Journal of Molecular Graphics and Modelling 27 (2008) 197–208206
is particularly interesting to note that a yellow polyhydra enclosedby a bigger green polyhydra near carbamoyl nitrogen appears bothin CoMFA and CoMSIA contour maps. It explains the anomalouseffect of ethyl group on AChE inhibitory activity i.e. ethyl group isdisfavourable for binding with AChE while methyl or propyl groupsare favourable. This has previously been reported by Weinstocket al. [12,13]. for a series of mono- and dialkyl-3-(1-dimethyla-minoethyl)-phenylcarbamates and by Leiske et al. [14]. for a seriesof 5-(1,3,3-trimethylindolinyl) carbamates. This anomalous ethyleffect is responsible for the observed contours and is prominent inSAR data, e.g. compound 3 (R4 = Me; IC50 = 0.76 mM) compound 5(R4 = Propyl; IC50 = 7.38 mM) and compound 6 (R4 = n-hexyl;IC50 = 0.53 mM) are approx. 25, 3 and 36 times more active thancompound 4 (R4 = Et; IC50 = 19 mM), respectively.
The yellow contour near carbamoyl nitrogen in CoMSIA contourmap indicates that the hydrophobic groups (e.g. aromatic rings likephenyl, p-MeOPh, benzyl, etc.) which can extend to this regionshould be favourable for biological activity, e.g. compound 29
Fig. 10. (A) Steric contour maps of the best CoMSIA (SEH) model displayed around comp
compound 6 and (C) steric contour maps of the best CoMSIA (SEH) model displayed a
(R4 = p-MeOPh; IC50 = 0.86 mM) is about 50 times more potentthan compound 28 (R4 = cyclohexyl; IC50 = 41.2 mM).
Considering all the above observations for site 1 together it canbe inferred that an ideal group here should have good electronwithdrawing power to make the carbamoyl nitrogen moreelectropositive and it should have higher steric bulk andhydrophobicity. The groups like p-MeOPh or other bulky electronwithdrawing groups along with high hydrophobicity may lead toimproved AChE inhibitory activity.
3.7. Contour maps on site 2
The blue and red polyhydra above and below the dashed line(Fig. 6A and B) are arising due to the opposite orientation of theamino nitrogen of 4- and 6-carbamates in 3D space in the chosenalignment scheme where all molecules in the dataset are alignedkeeping the carbamate groups in one place. Thus, due to theopposite orientation of amino nitrogen in the two groups ofmolecules, two blue and two red polyhydra are seen. A closeexamination of these contours reveals that they may be the part ofone blue and one red polyhydra had the C–O bond is rotated insome compounds to bring all nitrogen on one side (Fig. 6A).However in the CoMSIA electrostatic contour (Fig. 7A) only a redpolyhydra is seen near the amino nitrogen. In order to resolve thisambiguity further a pharmacophore model was developed forthese molecules using a representative set consisting of 28molecules (covering different features in the dataset, Table 6) byCatalyst (HipHop) where the blue sphere indicate hydrophobicfeature, while green ones are indicative of hydrogen bond acceptor(HBA) feature with the arrow showing the directionality of theacceptor feature. The observed green sphere around aminonitrogen clearly shows a hydrogen bond acceptor in this region(Fig. 7B) and explains the high activity of the molecules havingdimethyl substitution at this nitrogen. This pharmacophore showsa hydrophobic feature on dimethyl amino group of the carbamatewhich corresponds well with the CoMFA (steric) and CoMSIA
ound 18; (B) steric contour maps of the best CoMSIA (SEH) model displayed around
round compound 24.

Table 6The compounds taken for Catalyst pharmacophore generation
S. No. Comp. IC50 S. No. Comp. IC50
1 1 0.03 15 53 14.90
2 8 0.30 16 55 0.013
3 18 0.009 17 56 0.23
4 19 0.026 18 59 0.28
5 21 6.22 19 61 0.16
6 22 3.24 20 65 0.85
7 24 2.90 21 67 0.54
8 27 15.70 22 69 19.10
9 29 0.86 23 70 3.60
10 34 17.90 24 72 1.64
11 40 525.00 25 73 234.00
12 46 25.50 26 74 33.10
13 49 3.94 27 75 2.00
14 51 4.10 28 77 0.17
K.K. Roy et al. / Journal of Molecular Graphics and Modelling 27 (2008) 197–208 207
(hydrophobic) contours at site 1. However the pharmacophoremodel has another HBA feature on oxygen of carbamate group forwhich no corresponding contour on CoMFA and CoMSIA modelswas seen. The hydrophobic feature which is coming on thearomatic ring of pharmacophore model also does not have anycorresponding CoMFA and CoMSIA contour. Since all the moleculesin the dataset have been aligned over the same core, these featuresare common, therefore no distinguishing CoMFA and CoMSIAcontours can be observed.
It may be inferred from the above observations that the aminonitrogen at site 2 should be more electronegative so that it can actas HB acceptor and the substitutions should be made accordinglyat this position for better AChE inhibitory activity. On the otherhand a red polyhydra is seen around the nitrogen of the moleculeshaving amino group attached to phenethyl moiety (Fig. 9). Thisindicates that negative nitrogen is therefore required for betterinhibitory activity. The amino nitrogen when disubstituted withmethyl group will act as hydrogen bond acceptor rather thandonor. It also suggests that there may be improvement in AChEbinding when the amino nitrogen is disubstituted.
The yellow contour around closed ring of 6-carbamates in site 2(Fig. 8A and B) indicates that hydrophobicity in this region hasfavourable effect on the AChE inhibitory activity. Thus moleculeshaving a hydrophobic group (e.g. indane and tetralene derivatives)here may be more favourable towards AChE inhibition.
The white polyhydra around the amino nitrogen of 4- and 6-carbamates (Fig. 8A and B) gave an insight about the possibility ofenhancement of AChE inhibitory activity by putting morehydrophilic groups. This contour also gave an explanation ofwhy molecules with free amino group i.e. primary amino groupalso led to enhanced activity.
The wide green contour (Fig. 10A–C) below the plane somewhatnear amino nitrogen in site 2 indicates that steric group in this sitemay be favourable among 6-carbamates. In Fig. 10A the mostactive compound is shown. It can be reasonably expected that thederivatives having some steric bulk which can reach to this regionmay show better activity. We are giving more emphasis on the 6-carbamates due to the fact that about 2/3rd of the data set is of 6-carbamates. Also it is evident from contours that a small greenpolyhydra is present near amino nitrogen of 4-carbamates indicatethat steric group may have favourable impact on AChE inhibitoryactivity.
4. Conclusion
The CoMFA, advanced CoMFA and CoMSIA method has beenapplied successfully to rationalize the anti-AChE activity of
structurally diverse carbamate based AChE inhibitors covering awide range of biological activity and structural features in terms oftheir steric, electrostatic, hydrophobic, donor and acceptor proper-ties. To the best of our knowledge no systematic QSAR study usingCoMFA and CoMSIA has been reported on carbamates as AChEinhibitors, therefore this is the first attempt to explore thestructure activity relationship of carbamate based AChE inhibitorsusing these techniques. The developed models showed goodstatistical significance in internal (q2, group cross-validation andbootstrapping) validation and performed very well in predictingthe biological activity (pIC50) of the compounds in the test set. Afterthe detailed study of the CoMFA, advanced CoMFA and CoMSIAcontours, it can be concluded that electron withdrawing groupshaving some steric bulk (phenyl, substituted phenyl, etc.) may leadto compounds with higher activity among 4-carbamates and thiscan be suggested as a novel finding of this study. It is hoped thatthese models can help in future design and optimization of AChEinhibitors for the treatment of the AD.
Acknowledgements
The author (KKR) is thankful to the Indian Council of MedicalResearch (ICMR) Delhi, India for the financial assistance in the formof fellowship to pursue research on the Alzheimer’s disease. Thetechnical assistance of Mr. A.S. Kushwaha is also acknowledged.
Appendix A. Supplementary data
Supplementary data associated with this article can be found, in
the online version, at doi:10.1016/j.jmgm.2008.04.006.
References
[1] J.T. Coyle, D.L. Price, M.R. DeLong, Alzheimer’s disease: a disorder of corticalcholinergic innervation, Science 219 (1983) 1184–1190.
[2] D.M. Quinn, S.R. Feaster, H.K. Nair, N.A. Baker, Z. Radic, P. Taylor, Delineationand decomposition of energies involved in quaternary ammonium binding inthe active site of acetylcholinesterase, J. Am. Chem. Soc. 122 (2000) 2975–2980.
[3] M. Ballmaier, F. Casamenti, C. Scali, R. Mazzoncini, M. Zoli, Rivastigmine antag-onizes deficits in prepulse inhibition induced by selective immunolesioning ofcholinergic neurons in nucleus basalis magnocellularis, Neuroscience 114 (2002)91–98.
[4] C.A. Barnes, J. Meltzer, F. Houston, G. Orr, K. McGann, Chronic Treatment of old ratswith donepezil or galantamine: effects on memory. hippocampal plasticity andnicotinic receptors, Neuroscience 99 (2000) 17–23.
[5] D. Van Dam, D. Abramowski, M. Staufenbiel, P.P. De Deyn, Symptomatic effect ofdonepezil, rivastigmine. Galantamine and memantine on cognitive deficits in theAPP23 Model, Psychopharmacology (Berl.) 180 (2005) 177–190.
[6] A. Clegg, J. Bryant, T. Nicholson, L. McIntyre, S. De Broe, K. Gerard, N. Waugh,Clinical and cost-effectiveness of donepezil. Rivastigmine and Galantamine forAlzheimer’s disease: a rapid and systematic review, Health Technol. Assess. 5(2001) 1–137.
[7] A. Clegg, J. Bryant, T. Nicholson, L. McIntyre, S. De Broe, K. Gerard, N. Waugh,Clinical and cost-effectiveness of donepezil. Rivastigmine and galantamine forAlzheimer’s disease, Int. J. Technol. Assess. Health Care 18 (2002) 497–507.
[8] B. Goldlist, M. Gordon, G. Naglie, Galantamine vs donepezil in the treatment ofAlzheimer’s disease, Drugs Aging 20 (2003) 1139–1140.
[9] V.P. Prasher, Review of donepezil: ageing and health issues in intellectual dis-abilities, Int. J. Geriatr. Psychiatry 19 (2004) 509–515.
[10] J.L. Sussman, M. Harel, F. Frolow, C. Oefner, A. Goldman, L. Toker, I. Silman, Atomicstructure of acetylcholinesterase from torpedo californica: a prototypic acetyl-choline-binding protein, Science 253 (1991) 872–879.
[11] D.M. Quinn, Acetylcholinesterase–enzyme structure, reaction dynamics, andvirtual transition-states, Chem. Rev. 87 (1987) 955–979.
[12] M. Weinstock, M. Razin, I. Ringel, Z. Tashma, M. Chorev, Acetylcholinesteraseinhibition by novel carbamates: a kinetic and nmr study, in: A. Shafferman, B.Velan (Eds.), Multidiscipinary Approaches to Cholinesterase Functions, 36th edn.,Plenum, New York, NY, 1992, pp. 251–259.
[13] M. Weinstock, M. Razin, M. Chorev, Z. Tashma, Pharmacological activity of novelanticholinesterase agents of potential use in treatment of Alzheimer’s disease, J.Neural. Transm. 43 (1994) 219–225.

K.K. Roy et al. / Journal of Molecular Graphics and Modelling 27 (2008) 197–208208
[14] C.N. Lieske, R.T. Gepp, J.H. Clark, H.G. Meyer, P. Blumberg, C.C. Tseng, Antic-holinesterase activity of potential therapeutic 5-(1,3,3-Trimethylindolinyl) car-bamates, J. Enzyme Inhib. 5 (1991) 215–223.
[15] G. Lin, G.H. Chen, S.C. Yeh, C.P. Lu, Probing the peripheral anionic site ofacetylcholinesterase with quantitative structure activity relationships for inhibi-tion by biphenyl-4-acyoxylate-4-N-butylcarbamates, J. Biochem. Mol. Toxicol. 19(2005) 234–243.
[16] G. Lin, G.H. Chen, C.P. Lu, S.C. Yeh, QSARs for Peripheral anionic site of butyr-ylcholinesterase with inhibitions by 4-acyloxy-biphenyl-40-N-butylcarbamates,QSAR Comb. Sci. 24 (2005) 943–952.
[17] J. Sterling, Y. Herzig, T. Goren, N. Finkelstein, D. Lerner, W. Goldenberg, I. Mis-kolczi, S. Molnar, F. Rantal, T. Tamas, G. Toth, A. Zagyva, A. Zekany, G. Lavian, A.Gross, R. Friedman, M. Razin, W. Huang, B. Krais, M. Chorev, M.B. Youdim, M.Weinstock, Novel dual inhibitors of ache and mao derived from hydroxy ami-noindan and phenethylamine as potential treatment for Alzheimer’s disease, J.Med. Chem. 45 (2002) 5260–5279.
[18] (a) A. Golbraikh, A. Tropsha, Beware of q2! J. Mol. Graph. Model. 20 (2002) 269–276;(b) P. Prathipati, K. Saxena Anil, Comparison of MLR. PLS and GA-MLR in QSARanalysis, SAR QSAR Environ. Res. 14 (2003) 433–446.
[19] Tripos Inc., South Hanley Road, St. Louis, MO 63144, 1699.[20] M. Bohm, J. Sturzebecher, G. Klebe, Three-dimensional quantitative structure–
activity relationship analysis using comparative molecular field analysis and
comparative molecular similarity indices analysis to elucidate selectivity differ-ences of inhibitors binding to trypsin, thrombin, and factor Xa, J. Med. Chem. 42(1999) 458–477.
[21] R.D. Crammer, D.E. Patterson, J.D. Bunce, Comparative Molecular Field Analysis(CoMFA). 1. Effect of shape on binding of steroids to carrier proteins, J. Am. Chem.Soc. 110 (1988) 5959–5967.
[22] R.S. Bohacek, C. McMartin, Definition and display of steric, hydrophobic, andhydrogen-bonding properties of ligand binding sites in proteins using lee andrichards accessible surfaces: validation of a high-resolution tool for drug design, J.Med. Chem. 35 (1992) 1671–1684.
[23] R.T. Kroemer, P. Hecht, Replacement of steric potential-derived interaction ener-gies by atom-based indicator variables in CoMFA leads to models of higherconsistency, J. Comput. Aided Mol. Des. 9 (1995) 205–221.
[24] G. Klebe, U. Abraham, T. Mietzner, Molecular similarity indices in a comparativeanalysis (CoMSIA) of drug molecules to correlate and predict their biologicalactivity, J. Med. Chem. 37 (1994) 4130–4146.
[25] C.L. Waller, T.I. Oprea, A. Giolitti, G.R. Marshall, Three-dimensional QSAR ofhuman immunodeficiency virus (I) Protease inhibitors. 1. A CoMFA study employ-ing experimentally determined alignment rules, J. Med. Chem. 36 (1993) 4152–4160.
[26] R.D. Cramer, J.D. Bunce, D.E. Patterson, Cross-validation, bootstrapping, andpartial least squares compared with multiple regression in conventional QSARstudies, Quant. Struct. Act. Relat. 7 (1988) 18–25.