an investigation of skid resistant asphaltic mix designs · an investigation of skid resistant...
TRANSCRIPT

MoDOl
lE 5092 .M8A3
no.74-4 c.2
SOURI COOPERATIVE HIGHWAY RESEARCH PROGRAM
FINAL REPORT
AN INVESTIGATION OF SKID RESISTANT ASPHALTIC MIX DESIGNS
MISSOURI STATE HIGHWAY DEPARTMENT
Property of
MoDOl TRANSPORTATION liBRARY ·

)
1 1 1 }
1 ]
1 J
I J
1
1
1 J
AN INVESTIGATION OF SKID RESIST ANT ASPHALTIC MIX DESIGNS
STUDY NO. 74-4
FINAL REPORT
Prepared by
MISSOURI STATE HIGHWAY DEPARTMENT
DIVISION OF MATERIALS AND RESEARCH
November, 1978
In Cooperation With
U. S. Department of Transportation
Federal Highway Administration
The OpInIOnS, findings, and conclusions expressed in this publication are not necessarily those of the Department of Transportation, Federal Highway Administration. This report does not constitute a standard, specification, or regulation.
48

I 1 1 I 1 1 1 ]
J
1 I 1 j
J
I I 1 I
ABSTRACT
This report discusses the durability of skid resistance of some flexible pavement
surface mixes constructed using special aggregates which have been found to produce
surface with improved skid resistance . . The ability of these mixes to maintain an improved
level of skid resistance is unknown. Evaluation of this ability involved determining the
influence of traffic volumes and accumulated traffic on the improved frictional
characteristics.
Special aggregates utilized were flint chat (Joplin Flint chat), lightweight
aggregate (expanded shale), porphyry (trap rock), blast furnace slag, steel slag, and wet
bottom boiler slag. Also used alone or in combination with special aggregates were crushed
Black River gravel and the following limestones: Bethany Falls, Burlington, Callaway,
Chouteau, Higginsville, Plattin, St. Louis, Ste. Genevieve, Warsaw, and Winterset. Some
limestone mixes were tested which incorporated variations from normal guideline
percentages of material retained on the #10 sieve and/or the 1/211 sieve.
Data on a majority of test sections did not provide reliable wear factors from
which to judge the potential future value of the mixes. As a result, these test sections
were judged on average skid numbers for the sections and variability of skid numbers
over the testing period.
Included in this report is a brief description and discussion of each project,
summaries of the friction data, and graphic representations showing changes in skid numbers
with accumulated traffic.
-i -

I 1
I 1 1 1 ]
]
J
J ]
1 J
j
1 I I 1 J
TABLE OF CONlENTS
I. Introduction .
110 Conclusions ,
III. Implementation
IV. Discussion:
V.
Scope . 0 •
Skid Trailer .
Testing Procedures
Data Analysis .
Project Results
General Summary .
Appendixes - Distinctive Characteristics, Discussion of Results, and Description of Projects . , . . . . . . . . . . , . . .
A
R
C.
D.
E.
F.
G.
H.
Route D, New Madrid County, Project C072-D(4)M, (Wet Bottom Boiler Slag)
Route 41, Saline County, Project C097-41(7)M, (Limestone and Wet Bottom Boiler Slag) .
Route H, Bates County, Project 7-S-H-29, (Limestone and Wet Bottom Boiler Slag) .
Route J, Bates County, Project 7-S-J-30, (Limestone and Wet Bottom Boiler Slag) .
Route 752, Buchanan County, Maintenance Project (Lightweight Aggregate) . . . . ' .
Route 1-70, Jackson County, Maintenance Project (Lightweight Aggregate)
Route 115, St. Louis County, Project frU-lIS-59, (Steel Slag) ... ..... . . .. . . , .... . .
Route 141, St. Louis County, Project frU-141-42, (Steel Slag) ...... . .. .. .... . .. . . . . ..
-i i-
1
3
5
7
7
7
8
8
16
17
19
23
26
32
37
44
48
51

I.
J .
K.
L.
Route 21, St. Louis County, Project 6-U-21-51, (Blast Furnace Slag) ... .
Route 140, St. Louis County, Project C096-M(3), (Two Mixes - Blast Furnace Slag and Porphyry) . . . . . . . . . .
Route 40, St. Louis County, Project C096-40(9)U, (Porphyry) . . .
Route 140, St. Louis County, Project C096-140(2)U, (Porphyry) ..
M. Route 1-435, Clay County, Project
N.
o.
P.
Q,
R
S.
T.
u.
v.
1-435-1(77)12, (Porphyry) . .. . . .
Route FF, Jasper County, Project C049-FFO )M, (Flint Chat) .. . ..
Route 160, Greene County, Project C039-160(6)M, (Three Mixes of Limestone, Flint Chat and Flint Chat Sand) . .... . .
Route 160, Dade County, Project C029-39(5), (Limestone and Flint Chat Sand) . . .. .. . . . . .. .
Route 50, Johnson County, Project 4-P-5Q.19, (Limestone) . . . . .. .
Route 1-70, Lafayette County, Project C054-700), (Two Mixes of Limestone) .
Route 141 , St. Louis County, Project 6-U-141-38, (Limestone) .. , . . . ..
Route 1-44, Newton County, Project I-FI-44-1(36)0, (Limestone with Chert)
Route 291, Jackson County, Project 4-U-29l-55, (Limestone) ... . , ..
Route 1-44, Greene County, Project FI-44-2(67)80, (Limestone) . . ... .
W, Route I-55, Pemiscot County, Project I-IG-55-1(13)11 , (Three Mixes of Limestone and Gravel) . . . .. . .
x. Route IT, Jasper County, Project 7-U-TT-8, (Flint Chat) .. ... . .
-iii-
53
58
63
68
73
76
79
90
92
95
100
103
108
111
114
121
\ 1
I 1
.1
J
-1
)
}

1
I I 1 J
1 I ]
J
I 1
I 1 }
I {
I I I
Y. Route 1-44, SL Louis County, Project 6-1-44-109, 3rd Street Viaduct, (Steel Slag) 0 0 • 0 •••• > •••• 0 •
-iv-
123

AADLT
AC
ASTM
CV
mph, MPH
n
PCC
r2
~.x
SN
SN40
TR
LIST OF ABBREVIA nONS
- Average Annual Daily Lane Traffic
- Asphaltic Concrete
- American Society for Testing and Materials
- Coefficient of Variance
- Miles per Hour
- Number of Entries
- Portland Cement Concrete
- Coefficient of Determination
- Standard Error of Estimate
- Skid Number(s)
- Skid Number(s) Determined at 40 mph
- Estimated Accumulated Traffic
-v-
I ·f
I 1 ]
•
1 I
1 J
J

1
I I 1 1 I 1 I ]
I 1
I I 1
I I
I i
INTRODUCTION
In the past few years, there has been a growing concern about the characteristics
of friction or skid resistance between highway pavements and the tires of vehicles. Much
has been done by various agencies to improve these frictional characteristics, however,
there still remains much to be learned in this area.
The Missouri State Highway Department has been involved in three studies
associated with skid resistance. The report for an earlier investigation of skid resistance
in Missouri was published in August, 1973. The last two studies include" An Investigation
of the Durability of Skid Resistance of Wire Combed PCC Pavement Surfaces" and 11 An
Investigation of Skid Resistant Asphaltic Mix Designs ", which is the subj ect of this report.
Problem
Conventional aggregates normally used in asphaltic mix designs do not necessarily
meet the frictional demands of certain environmental and geometric conditions. As a
response to the problem, several mixes containing special aggregates have been tested. Some
of these special mixes have been shown to provide improved skid resistance. Investigation
of the use of these aggregates has shown that many of the aggregates are available only
in certain locales and often are limited in supply as well as being more expensive.
The ability of these special mixes to maintain an improved level of skid resistance
is unknown. Evaluation of this ability involves determining the influence of traffic volumes
and accumulated traffic on the improved frictional characteristics.
Objective
High initial friction is an important characteristic but the mix should also
maintain reasonable levels of improved friction for a sufficient length of service time.
The objective of this study was to determine friction wear factors for a number of flexible
pavement surface mixes, designed to have improved resistance to skidding as determined
with the Missouri skid traileL
Included in tru.s report is a brief description of each project and summaries of
the friction tests. All of the skid testing has been performed with a skid trailer which
substantially complies with ASTM E 274.
It is realized many factors can influence skid resistance properties of a pavement,
such as temperature, studded tires, precipitation, and vehicle contaminants. The influence
is evident when it is observed how skid numbers vary over a period of time.
-1-

f
r ,. ~ ,
r r [
c L [
[
G [
[
l L t l. I

CONCLUSIONS
Evaluation of the pavement surfaces considered in this investigation and the
following resulting conclusions were primarily based on SN determined at various test
speeds and AADLT (average annual daily lane traffic ) :
10 Data on a majority of test sections did not provide reliable wear factors
from which to judge potential future value of the mixes. As a result, these test sections
were judged on average skid num bers of the sections and variability of skid num bers over
the testing period.
2. On some projects, the magnitude of wear factors could be largely affected
by excluding the first data point, inferring questionable reliability of wear factors in general.
3. Data on several projects indicated sensitivity of SN to AADLT and not
to TR (estimated accumulated traffic)o
4. From four projects which utilized wet bottom boiler slag as either the coarse
or fine portion of the mineral aggregate, it was concluded for AADL T under 1000 there
was no significant difference in the frictional characteristics of a wet bottom boiler slag
mix and a limestone mix. Average SN40 ranged from the upper 30's to the lower 50'so
5. Two lightweight aggregate (expanded shale) sections produced skid
resistance about 20 SN higher than normal AC and pee pavement control sections. Even
in areas with AADLT of 17,000, SN40 was maintained near 40.
60 Steel slag sections with AADLT of about 7000 maintained SN40 in the
40's after nearly four years, however, with an AADLT of around 15,000, SN40 dropped
below 30 in less than two years.
7. Blast furnace slag sections with AADLT of 3500 to 7000 were capable
of maintaining SN40 in the middle 50's.
8. Four projects using porphyry (trap rock) aggregates generally maintained
SN40 of 40 or above even with AADLT of up to 17,000.
9 Flint chat mixes appear to be capable of providing SN40 of 40 or above
for AADLT of up to 4000. There was one mix that did not provide the same results
but it was found to have a high percentage of -#200 material.
10" Five mixes with various limestones were tested in which the percentage
of +# 1 0 material was varied. SN40 averaged in the middle 30's. No significant differences
were noted between sections. AADLT ranged from 1700 to 10,000.
11. A mix utilizing Burlington limestone and Arkansas River sand was capable
of maintaining SN40 generally in the lower 30's with AADLT of over 6000.
12. The section using Plattin limestone reached SN40 in the lower 20's within
two years with an AADLT near 4000.
-3-

130 Mixes incorporating a combination of 50% each by volume of Ste. Genevieve
limestone and crushed Black River gravel (carbonate and non-carbonate aggregates,
respectively) generally provided SN40 of at least 40. AADLT ranged from 4000 to 5000.
140 About five years of data showed a Burlington limestone with 35% chert
capable of generally maintaining SN40 of well above 40 for AADLT of 4000 to 6000.
150 Variations in the percentage of + 1/2" material were used on two limestone
mixes. No significant differences were noted between these two and the other limestone
mixes.
-4-
l
I 1 \ ]
1
J
'f
}
f

1
I I j
I 1
t
I r
[
1M PLEM ENTA nON
Data obtained in this investigation may be used as a guide for the selection
of special mixtures when need for higher skid resistance is demonstrated.
-5-

f
f
t ~
r [
[
[
L
C G [:
L L L L L 1

t
[ DISCUSSION
Scope This study involved 80 test sections and 155.509 miles of tested pavements.
All but one control section were bituminous surfaces. They are located in all parts of
the state except the northeast corner and have AADLT from about 150 to 17,550.
Following are the number of sections and the number of miles for each
Nineteen sections with wet bottom boiler slag .. . . . . . . .
Three sections with lightweight aggregate (expanded shale)
Three control sections adjoining lightweight aggregate . . . .
Five sections with steel slag . . Three sections with blast furnace
slag .. .. .. . ... . . Seven sections with porphyry
(trap rock) .... .. . . Twelve sections with flint chat
(J oplin flint chat) . . . . . Eight sections with Ste. Genevieve
limestone and Black River gravel . Twenty sections with various
limestones . . . . . . . . . . . .
Skid Trailer
mix type:
39.304 miles
0.680 mile
1.100 miles 4.458 miles
2.461 miles
10.110 miles
28.467 miles
10.948 miles
57.981 miles
Frictional properties of pavements on these projects were determined using a
locked wheel skid trailer which substantially complies with ASTM E 274. The skid testing
system was calibrated at the Field Test and Evaluation Center, located at Texas
Transportation Institute, College Station, Texas, in April, 1974, and again in February,
1977. Prior to April, 1974, the trailer was equipped with 7.75 x 14 standard test tires
conforming to the requirements of ASTM E 249. After April, 1974, G78-l5 tires
conforming to the requirements of ASTM E 501 were used.
During the evaluation period in February, 1977, water nozzles were changed
to the Penn State type to obtain a wider water stream.
Testing Procedures
Generally, each test section was tested for skid resistance in five locations per
direction at each test speed. There were cases where the test section was not of sufficient
length to permit five tests. Some projects were tested in more than one lane. In order
to simplify wheelpath indication, a method of numbering was devised. Test positions
(wheelpaths) were numbered consecutively from right to left beginning with the right
wheelpath of the first traffic lane. Most of the testing was performed in "position 2"
(inner wheelpath).
-7-

Data Analysis
For analyzing changes in SN due to traffic, AADLT and age at time of testing
were used to calculate TR.
It has been found, when correlating SN and TR, a log-log relationship is the
most meaningful The slope of the line through two points is defined as the friction
wear factor. It quickly became evident the equation for a line was not adequate for
determining a wear factor if it involved more than two data points.
Generally, the same result can be obtained from a linear regression analysis using
the log-log relationship ..
Also included in the analysis is Syx Values are given in logarithmic form .
~,x is a measure of variability similar to standard deviation. However, in the regression analysis, variability is about a line rather than about a mean.
CV is defined as the ratio of Sy.x to mean SN, expressed as a percentage. The r2 value expresses to what degree SN is affected by TR. An r2 value
of 0668 indicates 66,8% of the influence on SN is caused by TR. The other 33.2% influence
is from factors other than TR. It is possible a trend could be established for some other
variable. However, in this case, TR was the only variable considered.
A 95% level of confidence was used to determine significance of the effect of
TR If significance was established, the regression line was drawn on the graph. It should
be realized that this regression line is valid only within the limits of existing data. If
non-significance was established, it was indicated with the sentence, "A regression analysis
indicates that the skid numbers are not significantly affected by accumulated traffic,
therefore, a dependable wear factor cannot be calculated" .
Project Results
For plant mix bituminous pavements, percentages given for mineral aggregates
are normally calculated on total weight of mineral aggregate instead of total weight of
mix, as is the case for asphaltic concrete pavements.
Wet Bottom Boiler SJag*
The following four projects utilized wet bottom boiler slag in varying amounts
as part of the mjneral aggregate. Each produced very similar results, which tends to point
out the amount of wet bottom boiler slag in pavements with various limestones is not critical in locations with AADLT under 1000,
*Wet bottom boiler slag is a waste product of coal burning, electric utility plants. It
is essentially silicon dioxide and is a black, vitreous, hard, angular material. The slag
is discharged in a molten state at the bottom of the boiler into a water bath which quickly cools the slag into a solid state.
-8-
~
1 I I J
1
1
1
t
J
J
1
1
J

1
I I 1
1
I I I f
[
! l
It appears there are no statistically important relationships between SN and TR
on wet bottom boiler slag mixes, However, analyses of variance were highly suggestive
AADLT does affect SN to some degree. ROUTE D, NEW MADRID COUNTY (Section A of the appendix): The plant
mix bituminous pavement on this project utilized 96.0% wet bottom boiler slag as aggregate.
Two years of testing provided SN40 averaging in the lower 40's for AADLT
ranging from 350 to 500 and SN40 averaging in the higher 30's for an AADLT of about
950. Each test section shows a SN40 range of 5 SN or less,
An analysis of variance indicated SN on the sections with the lowest and highest
AADLT (Sections 2 and 4 respectively) were significantly different from each other at
the 99% level of confidence.
ROUTE 41, SALINE COUNTY (Section B of the appendix): The plant mix
bituminous pavement on this project utilized 20.0% wet bottom boiler slag as fine aggregate
and 39.0% each of Callaway and Chouteau limestones as coarse aggregate.
Five years of data indicated SN40 averaged slightly less than 50 and had a range
of 14 SN, The lowest values were obtained after about two years of testing. AADLT
ranged from 300 to 450.
Regression analyses on the data did not establish significant relationships between
SN and TR In addition, there was no statistical indication SN was significantly affected by AADLT.
ROUTE H, BATES COUNTY (Section C of the appendix): The plant mix
bituminous pavement on this project utilized 20.0% wet bottom boiler slag as fine aggregate
and 80.0% Higginsville limestone as coarse aggregate, After approximately four years of
testing, average SN40 ranged from about 40 to 50. SN40 on most sections ranged over a 7 SN spread. AADLT ranged from 150 to 400.
Section one was not evaluated with the other sections. Besides being tested
at lower speed due to being in a town, the surface was contaminated with flushing asphalt.
An analysis of variance indicated some factor influenced SN but it was apparent
AADL T was not the only influencing factor. According to the regression analyses, the
effect on SN from TR was not significant.
ROUTE J, BATES COUNTY (Section D of the appendix): The plant mix
bituminous pavement on this project also utilized 20,0% wet bottom boiler slag as fine
aggregate and 80,0% Higginsville limestone as coarse aggregate, The mix design was identical
to the above project.
Four years of testing provided SN40 averaging in the 40's for all five sections.
This project has a slightly larger range of SN than the Route H project. AADLT ranged
from 200 to 500.
-9-

Although regression analyses indicated SN was not significantly affected by TR,
an analysis of variance indicated AADLT did significantly affect SN.
Lightweight Aggregate (Expanded Shale)
The asphaltic concrete pavements on the following two projects utilized
lightweight aggregate as coarse aggregate. In each case, the new surface significantly
improved skid resistance about 20 SN,
ROUTE 752, BUCHANAN COUNTY (Section E of the appendix): This asphaltic
concrete pavement utilizing lightweight aggregate was placed on a curve. A control section
of regular asphaltic concrete was also tested.
After four years of testing, SN30 averaged in the lower 60's compared to the
lower 40's in the control section. No 40 mph tests were made.
There were no statistical implications SN was affected by either TR or AADLT.
AADLT ranged from 1300 to 3600.
ROUTE 1-70, JACKSON COUNTY (Section F of the appendix): This asphaltic
concrete pavement utiHzing lightweight aggregate was also placed on a curve. A control
section of PCC pavement was also tested.
After two years of testing, SN40 averaged in the middle 40's for the lightweight
aggregate section compared to the lower 20's in the control section. AADLT ranged
from 12,000 to 17,000.
Statistical analyses did not disclose any significant relationships between SN and
TR or AADLT
Steel Slag*
The following three projects utilized steel slag as part of the mineral aggregate.
Mter examining the data, it appears SN40 above 40 could generally be expected in areas
with AADLT of 7000. However, under the much greater traffic volume of 15,000, SN40
dropped to 30 or below within two years after placement.
ROUTE 115, ST. LOUIS COUNTY (Section G of the appendix): The asphaltic
concrete pavement on this project utilized steel slag as coarse aggregate.
Mter three years of testing, SN40 averaged in the middle 40's. AADLT of
nearly 7000 was recorded on each section.
*Steel slag, consisting principally of a fused mixture of oxides and silicates, is a synthetic
aggregate produced as a by-product of basic oxygen, electric or gas open hearth steel
making furnaces.
-10-
I 1 I
1 "1
1
]
J
J J
f
1 J

I I {
I I 1
I I I l
[
l
The 20 mph and 30 mph test results in Section 1 showed a definite statistical
relationship between SN and TR Wear factors of -0. 132 and -0.082, respectively, were
computed" ROUTE 141, ST. LOUIS COUNTY (Section H of the appendix): The asphaltic
concrete pavement on this project also utilized steel slag as coarse aggregate"
Two years of data on this single test section with an AADL T of about 6000
revealed SN40 maintaining an average of about 46 with a maximum range of 63 SN,
No significant relationships were detected by regression analyses on the data,
ROUTE 1-44, STo LOUIS COUNTY (Section Y of the appendix) : The asphaltic
concrete pavement on this project utilized steel slag as coarse aggregate.
Less than two years of data has been collected on this project. SN40 appears
to be dropping rather sharply from around 40 to about 30 or less, AADLT was in the
neighborhood of 15,000.
Regression analyses did not indicate significant relationships between SN and
TR and an analysis of variance gave no indication of significant influence on SN ..
Blast Furnace Slag*
The asphaltic concrete pavements on the following two projects utilized blast
furnace slag as coarse aggregate. The pavements generally produced SN40 of above SO
for AADLT of less than 7000 and above 60 for AADLT of 3500.
ROUTE 21, ST. LOUIS COUNTY (Section I of the appendix) : The two asphaltic
concrete pavements on this project utilized blast furnace slag as coarse aggregate. The
primary difference between mixes was the asphalt contents of 6.0% and 6.2%
About two years of testing were performed on the project. SN40 was in the
low to middle 50's and AADLT ranged from 5800 to 6600. The maximum range of
SN4Q was 7.5" Sections with 6.0% asphalt had less variability of SN than those with
6.2%" An analysis of variance indicated SN was influenced by some factor but the
influencing factor could not be pinpointed with the available data. Regression analyses
did not disclose any significant relationships between SN and TR
ROUTE 140, ST. LOUIS COUNTY (Section J of the appendix): Two asphaltic
concrete pavements were used on this project which consisted of a porphyry section and
a blast furnace slag section, The porphyry section will be discussed later.
* Air cooled blast furnace slag, consisting primarily of silicates, and alumino-silicates of
lime and other bases, is a synthetic aggregate produced as a by-product of blast furnaces.
-11-

On the other section, 80% of the mix was blast furnace slag aggregate. More
than six years of data provided average SN40 in the lower 60's. Ranges of SN40 were
1304 and 10.8 in positions 3 and 4 with AADLT of nearly 3500. In general, the first
years test data was about 5 to 10 SN higher than the values which were fairly consistently
maintained thereafter,
Regression analyses indicated signi ficant relationships between SN and TR for
the position 3 tests but not for the position 4 tests. No explanation is immediately
obvious.
Porphyry (Trap Rock)
The following four projects utilized porphyry as a portion of the mineral
aggregate in the mixes Asphaltic concrete pavements with porphyry mixes are capable
of producing SN40 in the 40's under nearly any AADLT.
ROUTE 140, ST. LOUIS COUNTY (Section J of the appendix): Two asphaltic
concrete pavements were used on this project which consisted of a porphyry section and
a blast furnace slag section, The blast furnace slag section was discussed earlier.
Over six years of data indicated SN40 averaged close to 50 and ranged from
46.0 to 58.1 under an AADLT of about 3500. After about a year of testing, skid resistance
generally dropped about 5 SN to a level which was maintained rather consistently.
Wear factors were established on the data . For the 40 mph tests, wear factors
were -0.076 and -0 ,043 for positions 3 and 4 respectively.
ROUTE 40, ST. LOUIS COUNTY (Section K of the appendix) : The asphaltic
concrete pavement on this project utilized porphyry as the predominant aggregate.
Roughly five years of testing provided SN40 averaging generally in the upper
4O'&, AADLT ranged from 12,000 to 17,500. Only the regression analyses of position
5 tests provided wear factors. For 40 mph tests, wear factors were -0.071 and -0.068
for Sections 1 and 2 respectively. An analysis of variance gave no indication of SN having
been influenced by AADLT.
ROUTE 140, ST. LOUIS COUNTY (Section L of the appendix) : The asphaltic
concrete pavement on this project utilized porphyry as coarse aggregate.
More than seven years of testing indicated SN30 was generally in the 40's.
Testing was not performed at 40 mph due to traffic conditions and stoplights. AADLT
ranged from 7550 to 8950.
For position 3 tests, regression analyses produced wear factors of -0.178 and
-0.129 for 30 mph tests on Sections 1 and 2 respectively. Upon examination of Figure
XII, it can be seen that presence of the first test results in position 2 kept wear factors
from being significant. This suggests wear factors which were calculated should be regarded
rather cautiously.
-12-
~
1 1
I 1 -1
1
J
J
f r
I I

I I I
[
I
An analysis of variance indicated position 3 tests are significantly higher than
position 2 tests. This situation has no obvious explanation.
ROUTE 1-435, CLAY COUNTY (Section M of the appendix) : The asphaltic
concrete pavement on this project utilized porphyry as coarse aggregate,
Roughly three years of data show SN40 generally above 50 with an AADLT
of nearly 5800.
Regression analyses on the data do not show significant trends between SN and
TR Flint Chat (J oplin Flint Chat)
The following four projects utilized flint chat in some amount, either as coarse
aggregate, fine aggregate or both. Except for the mix used on Sections 4A through 7 A,
Route 160, Greene County, flint chat mixes generally maintained SN40 in the middle
40's or higher for AADLT up to 4000,
ROUTE FF, JASPER COUNTY (Section N of the appendix) : The plant mix
bituminous pavement on this project utilized 75% flint chat and 25% Warsaw limestone
screenings.
About two years of testing produced SN40 averaging around 50 for Sections
1 and 2 and about 55 for Section 3. AADLT was about 500 on each section.
An analysis of variance indicated a significant difference between SN of Section
3 and the other two sections. No significant trends were established between SN and
TR ROUTE 160, GREENE COUNTY (Section 0 of the appendix) : The three plant
mjx bituminous pavements on this project utilized flint chat or flint chat sand in
combination with other mineral aggregates.
Sections 1 through 4 utilized 85% Burlington limestone and 15% flint chat sand.
SN40 averaged from about 48 to S5 with considerable variability. AADLT ranged from
750 to 2000. An analysis of variance did not reveal any significant differences in SN
between sections. RegresslOn analyses indicated reasonable wear factors of -0.073, -0.068,
-0.075 and -0.11 7 for SN40 on Sections 1 and 4 respectively.
Sections 5 and 6 utilized 45% Burlington limestone, 40% flint chat, and 15%
flint chat sand, SN40 averaged about 52 for both sections with AADl T of 2200 and
3800. Variability was much less than on Sections 1 through 4. Wear factors of -0,070
and -0.062 were calculated for 40 mph tests.
Section 7 utilized 72% flint chat and 28% Burlington limestone screenings.
Average SN40 was 5704 with little variability after the first 4 months of testing. A wear
factor of -0.052 was calculated for 40 mph tests. AADLT was about 4000.
-13-
Testing on Sections 1 through 7 was performed over a period of about 4 1/2
years. Section 1 A through 7 A (which overlaid Sections 1 through 7) were tested over
a period of about two years. Sections lA through 7 A utilized 85% Burlington limestone
and 1 5% flint chat sand, the same aggregate combination as originally used on Sections
1 through 4.
SN40 ranged from about 24 to 40. AADLT ranged from 800 to 3650. An
analysis of variance indicated a significant difference exists between SN on Sections 1 A,
2A and 3A and Sections SA and 6A. This implies AADLT has some affect on SN, but
other influencing factors do exist. The percentage of material passing the #200 sieve
was abnormally high on this mix, perhaps accounting for lower SN results.
ROUlE 160, DADE COUNTY (Section P of the appendix) : The plant mix
bituminous pavement on this project utilized 85% Burlington limestone and 15% flint
chat sand. The mix was identical to Sections 1 through 4 and lA through 7 A of Route
160, Greene County.
SN40 averaged about 50 on the single test section. AADLT was nearly 700.
A wear factor of -0.052 was calculated with 40 mph test results.
ROUTE TT, JASPER COUNTY (Section X of the appendix): The asphaltic
concrete pavement on this project utilized flint chat as coarse aggregate.
Mter two years of testing, SN40 averaged around 57 with an AADLT of 700.
Limestones and Gravels
Pavements on the following seven projects utilized limestone as coarse aggregate.
Gravel was used in conjunction with limestone on one of the projects.
One of the design criteria for Type C asphaltic concrete mixes is the amount
of material retained on the #10 sieve (+#10). At the present time, 62.5% +#10 material
is used as a design guideline. Several variations in +#10 material were used in these
mixes. However, no differences in SN could be attributed to these variations.
Another criterion, which is controlled by the standard specifications, is the
amount of +1/2" material. Two of the following projects had +1/2" material. Neither
of these projects showed any difference in SN which were attributable to +1 /2" material.
ROUTE 50, JOHNSON COUNTY (Section Q of the appendix) : The asphaltic
concrete pavement on this project utilized Burlington limestone as coarse aggregate. The
mix had L5% +1/2" and 67.1% +#10 material.
Almost four years of testing indicated average SN40 in the low 40's with AADLT
of about 1700. No significant trends were established with SN.
ROUlE 1-70, LAFAYEfTE COUNTY (Section R of the appendix) : The two
asphaltic concrete pavements on this project utilized different limestone as coarse aggregate.
This project was tested for nearly six years.
-14-

Bethany Falls limestone was used on the westbound section, The mix had 1 7%
+1 /2 II and 66,2% +# 10 material.
Average SN40 was about 36 with AADLT of 5300 to 6100. No significant
trends between SN and TR were established with regression analyses.
Winterset limestone was used on the eastbound section, This mix had 2.0%
+1 /2" and 66.0% +#10 material.
Average SN40 was around 40 with AADLT of 5500 to 6350. Likewise, no
significant trends between SN and TR were established with regression analyses on this
section. The SN on both of these mixes are quite variable.
ROUTE 141 , ST. LOUIS COUNTY (Section S of the appendix) : The asphaltic
concrete pavement on this project utilized Sf. Louis limestone. The mix had 62.9% +# 1 0
materiaL
SN40 averaged about 35 with AADLT of 5650 to 10,050. Regression analyses
did not indicate significant trends between SN and TR. However, SN was quite variable
indicating considerable influence by some other factor.
ROUTE 1-44, NEWTON COUNTY (Section T of the appendix) : The asphaltic
concrete pavement on this project utilized Burlington limestone containing approximately
35% chert and a blended sand containing part flint chat sand. Chert content is normally
less than 10%. The mix had 62.0% +#10 material.
About five years of data showed average SN40 in the upper 40's with AADLT
of 4200 to 6200. Except for the first tests at an age of one month, variability of SN
was reasonably smalL Wear factors for 40 mph tests of -0.081, -0,057 and -0.083 were
calculated on Sections 2, 3 and 4 respectively. A wear factor of -0.052 for the 50 mph
tests was calculated on Section 1. An analysis of variance did not indicate significant
differences in SN between sections.
ROUTE 291, JACKSON COUNTY (Section U of the appendix) : This asphaltic
concrete pavement utilized Bethany Falls limestone with 62,8% +#10 material.
Three years of data indicate SN40 averaging about 38 with AADLT of 6600 .
Variability of SN is rather large. No significant relationships were established between
SN and TR
ROUTE 1-44, GREENE COUNTY (Section V of the appendix): This asphaltic
concrete pavement utilized Burlington limestone with 64.8% +#10 material.
Over four years of testing was performed on this project. AveIage SN40 was
in the upper 30's .. AADLT was about 6350. Wear factors of -0.260 for SN40 on Section
1 and -0.156 for SN50 on Section 2 were calculated.
ROUTE I-55 , PEMISCOT COUNTY (Section W of the appendix) : This project
had one section of asphaltic concrete pavement with Plattin limestone as coarse aggregate
-15-

and eight sections with Ste. Genevieve limestone and crushed Black River gravel as coarse
aggregate (carbonate and non-carbonate aggregates respectively). The Ste. Genevieve
limestone and crushed Black River gravel were mixed half and half by volume.
SN40 on Section 1 averaged about 30 and was highly variable. AADLT was
about 4250. Average SN40 for Sections 2 through 9 were all in the middle 40's and
variability of SN was much lower than on Section 1. AADLT ranged from 4100 to
4500. Wear factors of -0.056 and -0.053 were calculated on Sections 6 and 9 respectively.
No significant trends were established on the other sections. An analysis of variance
indicated no significant difference in SN on Sections 2 through 9.
General Summary
Tables A, B, C and D show section average SN and standard deviation. Sections
are arranged by AADLT groups and test speeds. The tables are self-explanatory, however,
one thing might be pointed out. Certain mixes apparently have very different speed
gradients. For instance, in comparing the steel slag and porphyry mixes, it can be seen
for 20 mph tests, steel slag performs best, however, for 40 mph tests, the order is switched.
Porphyry mixes apparently change very little with test speed.
Figures A and B show examples of mix design forms used by the Department.
Information on mixes shown in this report was taken from forms of this type. Figure
A is for a plant mix bituminous pavement design and Figure B is for Type C asphaltic
concrete pavement design.
-16-
1 1 1 J

APPENDIXES
DISTINCTIVE CHARACTERISTICS
DISCUSSION OF RESULTS
DESCRIPTION OF PROJECTS
TABLES
FIGURES
-17-

r f
L f! r [
L [
L [
E G [
[
L L L 1 L

A-I
ROUTE D
NEW MADRID COUNTY
Distinctive Characteristics
This special plant mix bituminous pavement utilized wet bottom boiler slag as
aggregate.
Discussion of Results
Regression analyses indicated no significant relationships exist between SN and
TR. An analysis of variance indicated a highly significant difference exists between average
SN40 of some sections. Apparently, SN was affected by other factors as well as AADL T
Average SN40 was near 40 or above on all sections.
Description of Project
Project C072-D(4)M involved a plant mix bituminous pavement (Mix
#BP75-26M) completed in August, 1975.
The mix contained 96.0% wet bottom boiler slag (98% -#4),4.0% mineral filler,
and 6.5% asphalt (85-100). Composition of the mix, based on weight of total mix, was
93 ,, 9% mineral aggregate and 6.1% asphalt with 1.8% +#4 and 29.8% +#10 material
Four undivided pavement sections (L084, 1.085, 1.014, and 1.272 miles in
length) were tested., Each section had five tests in position 2 in each direction for each
test speed.
Skid tests and traffic data are shown in Table I and plotted in Figure L
-19-

TABLE I
SKID TESTS AND TRAFFIC DATA
ROUTE D NEW MADRID COUNTY
SN SN SN AADT Age in Date Tested ---1Q --±Q -2Q /Lane Months
Section 1 - Wet Bottom Boiler Slag
9/30/75 46.2 44.1 45.0 346 1 5/11/76 44.0 42.0 40.3 367 8
10/20/76 43.2 40.9 38.4 367 14 3/29/77 46.4 44.2 42.0 367 19 8/12/77 44.8 40.4 37.8 367 23
Section 2 - Wet Bottom Boiler Slag
9/30/75 48.1 45.5 43.6 342 1 5/11/76 46.0 43.5 41.8 362 8
10/20/76 44.9 42.3 39.8 362 14 3/29/77 48.9 47.2 43.0 362 19 8/12/77 47.2 43.2 39.0 362 23
Section 3 - Wet Bottom Boiler Slag
9/30/75 47.0 44.5 42.4 470 1 5/11/76 46.4 43.4 40.9 497 8
10/20/76 44.2 41.7 39.0 497 14 3/29/77 47.1 44.6 41.5 497 19 8/12/77 45.6 41.6 38.6 497 23
Section 4 - Wet Bottom Boiler Slag
9/30/75 38.3 37.6 36.3 893 1 5/11/76 42.8 39.6 38.2 946 8
10/20/76 41.0 38.6 35.2 946 14 3/29/77 44.8 41.2 37.4 946 19 8/12/77 42.0 37.6 34.7 946 23
-20-
A-2
Est. Acc. Traffic,TR
10,000 86,000
152,000 207,000 251,000
10,000 84,000
150,000 204,000 247,000
14,000 116,000 206,000 280,000 340,000
27,000 221,000 391,000 533,000 646,000
l rl
I
1 ]
]
J
f
j
J

Figure
EFFECTS OF TRAFFIC ON SKID NUMBERS ROUTE D
NEW MADRID COUNTY
100~Section 1 - Wet Bottom Boile r Slag 90 80
Z 70 11'1 60
.,; SO
~ 40~ :l 30 Z
C
~ 20 11'1
e @~
A regression analysis indicates that the skid numbers Of. not significantly affected by accumulated traffic, therefore, Q dependable wear factor (onnot b. calculated.
o -SN 30
D-SN 40
\7 - SN 50
10 I I, III! I I II I! I! 1.1 I II I I 1.1, J I II I, I, I. I I II
.01 .1 10
ACCUMULATED TRAFFIC, TR {Millions}
100Esection 2 - Wet Bottom Boile r Slag 90 80
Z 70 11'1 60
11'1 5,
~ 40
~ :l 30 Z C
~ 20 ."
~ ®@§
A regression analysis indicates that the s k id numbers are not significantly affected by accumulated traffic, therefor. , a dependab le we ar foctor cannot b. calculated.
100
o -SN 30
o -SN 40
\7 - SN 50
10 I I! I!', I I II I I 1,1,1 I II I I I, II J J II I I I, I, I III
.01 .1 10
ACCUMULATED TRAFFIC, TR {Millions}
lOOt-Section 3 - Wet Bottom Boiler Slag 90 80
Z 70 11'1 60
ffi- SO~® @ @ ~ III 40
~ :l 30 Z C
~ 20 11'1
A regression analysis indicates tho. the skid numbers or. not significantly aff.cted by accumulat.d traffic , ther.for. , a dependa ble wear 'aclar cannot be calculated .
100
o -SN 30
o -SN 40
\7- SN so
101 Itld"lli """dill 1""""1 I""dlll .01 .1 10 100
ACCUMULATED TRAFFIC, TR {Millions}
-21-
A-3

Figure I (Continued)
EFFECTS OF TRAFFIC ON SKID NUMBERS ROUTE D
NEW MADRID COUNTY
100f-Section 4 - Wet Bottom Boiler Slag 90 80
Z 70 11\ 60
'" SO 111: ' .... IlD 40
~ ;:) 30 Z o :.:: 20 01)
e @ ®®@
A regression analysis indicates that the skid numbers or. not significantly affected by Qccumulated traffic , ther.fore, a dependable wear foctor cannot b. calculated.
o -SN30
D-SN4o
\}-SN so
10 1 1,1,1.1,1111 1,1,1.1.1111 ,I.!.I"III ,I,!,!dlll .01 .1 10 100
ACCUMULATED TRAFFIC, TR (Millions)
-22-
A-4 l 1
I J
J
I j
J
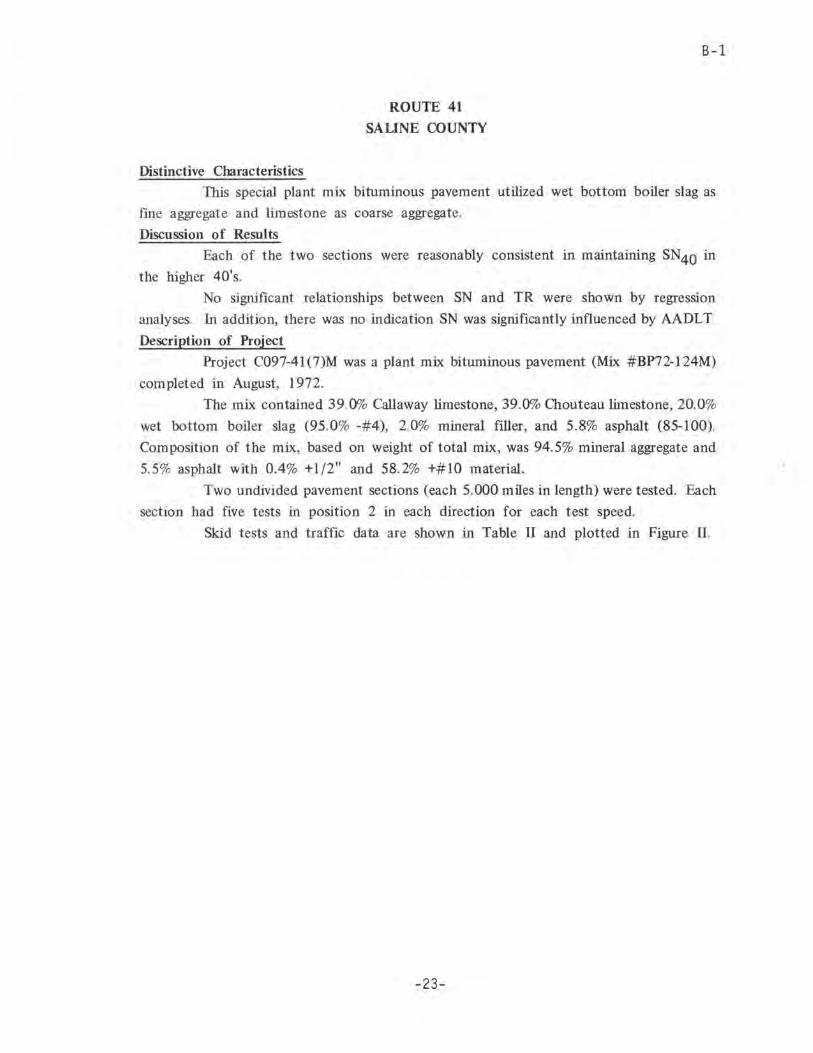
Distinctive Characteristics
ROUTE 41
SAUNE COUNTY
B-1
This special plant mix bituminous pavement utilized wet bottom boiler slag as
fme aggregate and limestone as coarse aggregate.
Discussion of Results
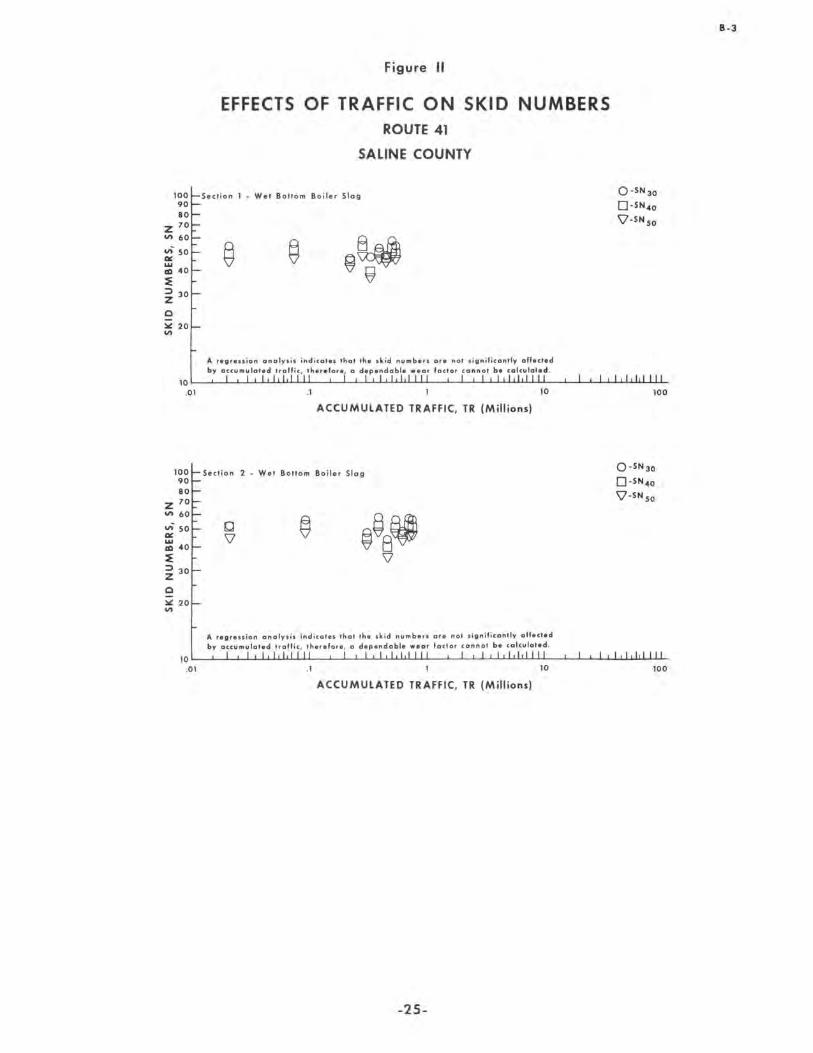
Each of the two sections were reasonably consistent in maintaining SN40 in
the higher 40's.
No significant relationships between SN and TR were shown by regression
analyses. In addition, there was no indication SN was significantly influenced by AADL T.
Description of Project
Project C097-41(7)M was a plant mix bituminous pavement (Mix # BP72-124M)
completed in August, 1972.
The mix contained 39.0% Callaway limestone, 39.0% Chouteau limestone, 20.0%
wet bottom boiler slag (95.0% -#4), 2.0% mineral filler, and 5.8% asphalt (85-100).
Composition of the mix, based on weight of total mix, was 94.5% mineral aggregate and
5.5% asphalt with 0.4% +1/2" and 58.2% +#10 material.
Two undivided pavement sections (each 5.000 miles in length) were tested. Each
section had five tests in position 2 in each direction for each test speed.
Skid tests and traffic data are shown in Table II and plotted in Figure II.
-23-

TABLE II
SKID TESTS AND TRAFFIC DATA
ROUTE 41 SALINE COUNTY
SN SN SN AADT Age in Date Tested -2Q 40 -2Q iLane Months
Section 1 - Wet Bottom Boiler Sla~
10/30/72 54.6 49.3 44.8 235 3 5/16/73 56.0 51.5 46.5 264 10
10/22/74 46.2 44.9 42.2 320 27 4/16/75 58.9 53.8 48.8 333 33
10/ 9/75 47.0 39.5 37.2 333 38 4/12/76 53.0 49.8 46.6 313 44
10/14/76 48.2 46.5 44.8 313 50 3/23/77 58.6 53.2 48.1 313 56 8/ 4/77 54.4 49.4 46.0 313 60
Section 2 - Wet Bottom Boiler Sla~
10/30/72 52.1 51.6 45.6 235 3 5/16/73 55.8 53.3 48.0 376 10
10/22/74 48.2 44.2 42.1 455 27 4/16/75 58.6 52.2 48.8 472 33
10/ 9/75 43.9 39.8 35.6 472 38 4/12/76 55.8 50.5 48.7 445 44
10/14/76 48.8 46.8 44.3 445 50 3/23/77 57.2 52.0 46.2 445 56 8/ 4/77 55.8 50.6 47.0 445 60
-24-
B-2
Est. Acc. Traffic,TR
21,000 75,000
226,000 285,000 335,000 394,000 450,000 506,000 544,000
. 21,000 92,000
307,000 391,000 462,000 544,000 624,000 705,000 758,000
~
"1
1 "1
J ]
]
J
1 I j
I
100 90 80
Z 70 VI 60
.,; 50 DC
~ 40
~ i 30
o ~ 20 VI
Figure II
EFFECTS OF TRAFFIC ON SKID NUMBERS ROUTE 41
SALINE COUNTY
Sect ion 1 - Wet Bottom Boiler Slag
~ @ @~
A regression analysis indicates that the skid numbers or. not significantly affected
by accumulated traffic, ther.fore, a dependable wear factor cannot b. calculated . 10' I, III,! I II . 01 I! I! 1.1 I II '''''"111
.1 10
ACCUMULATED TRAFFIC, TR (Millions)
lOOt-Section 2 - Wet Bottom Boi ler Slag 90 80
Z 70
~ "~ VI SO DC ... ~ 40
~ ::l 30 Z 0 ~ 20 VI
Q ® @@B~ \l
\l
A regression analysis indicates that the skid numbers are not si gnificantly affected by accumulated traffic, ther.for. , a dependable wear factor cannot b. calculated .
O-SN30
O-SN40
\l-SN 50
'''''''"I 100
O-SN30
o - SN 40
\l-SN 50
10 1 100tldili Idtldlll 100d,IIII ,Idtldlll .01 .1 10 100
ACCUMULATED TRAFFIC, TR (Millions)
-25-
B-3

Distinctive Characteristics
ROUTE H
BATES COUNTY
C-1
This special plant mix bituminous pavement utilized wet bottom boiler slag as
fine aggregate and limestone as coarse aggregate.
Discussion of Results
Except for the first section, SN40 generally ranged from about 40 to nearly
50. It was noted the pavement surface on section one was contaminated with flushing
asphalt, which resulted in SN20 averaging around 30.
Regression analyses showed SN was not significantly affected by TR on any
sections. An analysis of variance indicated SN was influenced by some factor. While
it appears AADLT had some affect on SN, it clearly was not the only influencing factor.
Description of Project
Project 7-S-H-29 was a plant mix bituminous pavement (Mix #BP74-16)
completed in May, 1974.
The mix contained 80.0% Higginsville limestone, 20.0% wet bottom boiler slag
(96% -#4) and 6.2% asphalt (85-100). Composition of the mix, based on weight of total
mix, was 94.2% mineral aggregate and 5.8% asphalt with 1.5% +1/2" and 61.2% +#10
material.
Eight undivided pavement sections (1 .376, 2.300, 2.000, 2.000, 2.000, 1.900,
1.300, and 2.295 miles in length) were tested. Each section had five tests in position
2 in each direction for each test speed.
Skid tests and traffic data are shown in Table III and plotted in Figure III.
-26-
l 1 1 ]
J
J
j
J
1
1

TABLE III
SKID TESTS AND TRAFFIC DATA
ROUTE H BATES COUNTY
SN SN SN SN MDT Date Tested ~ -.1Q --1Q. -2Q /Lane
Section 1 - Wet Bottom Boiler Slag
10/10/74 34.4 628 4/ 1/75 39.6 653 9/25/75 27.8 653 4/14/76 28.1 688 8/31/76 29.0 688 4/ 7/77 29.9 688 8/25/77 29.3 688
Section 2 - Wet Bottom Boiler Slag
10/10/74 48.2 40.7 38.3 382 4/ 1/75 45.9 42.7 37.9 398 9/25/75 42.6 36.6 35.2 398 4/14/76 47.1 42.2 39.6 419 8/31/76 43.4 38.0 35.1 419 4/ 7/77 42.0 40.4 33.2 419 8/25/77 43.7 40.0 37.5 419
Section 3 - Wet Bottom Boiler Slag
10/10/74 44.1 340 4/ 1/75 47.0 324 9/25/75 41.2 324 4/14/76 47.2 296 8/31/76 43.4 296 4/ 7/77 45.9 296 8/25/77 47.4 296
Section 4 - Wet Bottom Boiler Slag
10/10/74 42.1 246 4/ 1/75 46.9 255 9/25/75 43.6 255 4/14/76 46.5 233 8/31/76 42.7 233 4/ 7/77 46.2 233 8/25/77 48.1 233
-27-
Age in Months
5 11 17 23 28 35 40
5 11 17 23 28 35 40
5 11 17 23 28 35 40
5 11 17 23 28 35 40
C-2
Est. Acc. Traffic,TR
94,000 209,000 327,000 448,000 551,000 695,000 799,000
57,000 128,000 199,000 273,000 336,000 424,000 486,000
51,000 111,000 169,000 225,000 269,000 331,000 376,000
37,000 82,000
128,000 172,000 207,000 256,000 291,000

TABLE III (Continued)
SKID TESTS AND TRAFFIC DATA
ROUTE H BATES COUNTY
C ... 3
SN SN SN SN AADT Age in Est. Acc. Date Tested --1Q ~ --1Q --2Q /Lane Months Traffic,TR
Section 5 - Wet Bottom Boiler Slag
10/10/74 4/ 1/75 9/25/75 4/14/76 8/31/76 4/ 7/77 8/25/77
48.8 44.8 40.4 51.1 46.0 38.0 51.4 43.0 42.0 52.2 46.8 42.7 51. 1 43. 7 42.3 49.9 46.8 38.6 51. 8 47. 7 44. 6
Section 6 - Wet Bottom Boiler Slag
10/10/74 4/ 1/75 9/25/75 4/14/76 8/31/76 4/ 7/77 8/25/77
42.4 39.7 42.6 39.1 37.6 39.9 39.5
Section 7 - Wet Bottom Boiler Slag
1.0/10/74 4/ 1/75 9/25/75 4/14/76 8/31/76 4/ 7/77 8/25/77
44.8 45.3 41.5 45.0 44.9 45.3 48.3
Section 8 - Wet Bottom Boiler Slag
10/10/74 4/ 1/75 9/25/75 4/14/76 8/31/76 4/ 7/77 8/25/77
50.3 49.6 43.5 53.8 51.0 47.1 54.2 48.0 45.1 54.8 49.9 46.0 53.8 46.3 44.0 51.8 52.0 43.8 55.3 52.5 46.6
-28-
224 233 233 213 213 213 213
224 233 233 213 213 213 213
206 214 214 196 196 196 196
210 163 163 149 149 149 149
5 11 17 23 28 35 40
5 11 17 23 28 35 40
5 11 17 23 28 35 40
5 11 17 23 28 35 40
34,000 75,000
117,000 157,000 189,000 233,000 265,000
34,000 75,000
117,000 157,000 189,000 233,000 265,000
31,000 69,000
107,000 144,000 174,000 215,000 244,000
32,000 65,000 94,000
122,000 145,000 176,000 198,000
1
I 1
I I
J
j
f
J

Figure III
EFFECTS OF TRAFFIC ON SKID NUMBERS ROUTE H
BATES COUNTY
100l-Section I - Wet Bottom Boiler Slag 90 80
Z 70
'" 60 .,; 50 ~
~ .. ~ ::l 30 z 0
~ 20
'"
6-6-
6- 6-6-~
A regression analysis indicates that the skid numbers are not significantly affected by accumulated traffic , therefor., a dependable weor 'actor cannot be calculat.d .
6-SN20
101 1,ltI,Il!! ,1.ltI,j11l 111.111111 ,IIItI,I111
.01 .1 10
ACCUMULATED TRAFFIC, TR (Millions)
100 E Section 2 - Wet Bottom Boiler Slag 90 80
Z 70
'" 60
a- "F IlO 40
~ ::l 30 Z 0 ~ 20
'"
0 6 O@8~ ~ \7 ij \7
A regression analysis indicates that the skid numbers Of. not significantly offected by accumulated traffic , therefor •• a dependable wear factor cannot b. calculated .
100
o -SN 30
O - SN40
\7- SN so
101 ).Itldl!! I.!""'II ''''''''II '''''''III
.01 .1 10 100
ACCUMULATED TRAFFIC, TR (Millions)
100 Section 3 - Wet Bottom Boiler Slag O-SN40
90 80
Z 70
'" 60 .,; 50 ~
~ 40 o o oCb[jJ
~ ::l 30 Z 0 ~ 20
'"
A analysis indicates that the skid numbers or. no. significantly offected a dependable .eor fodor cannot b. calculated.
10' '''''''III '.!"dlll '''''''III ,""""1 .01 .1 10 100
ACCUMULATED TRAFFIC, TR (Millions)
-29-
C-4

Figure III (Continued)
EFFECTS OF TRAFFIC ON SKID NUMBERS ROUTE H
BA TES COUNTY
100 f- Section 4 - Wet Bottom Boiler Slag 90 80
Z 70 VI 60
'" SO 1:11:
~ 40
:IE ;:) 30 Z o ~ 20 CI'l
o o 0 Cb@
A regression analysis indicotes thot the skid numbers are not significantly affected by accumulated traffic , ther.for. , a dependable wear factor cannot b. calculated .
O-SN40
10' I, I! II! I II I! I! 1,1 I II I, I "" I II I!', II' , "
.01 .1 10
ACCUMULATED TRAFFIC, TR (Millions)
lOOf-Section 5 - Wet Bottom Boiler Slag 90 80
Z 70 VI 60
'" SO ~ 1:11: . ... ell 40
:IE ;:) 30 Z 0 ~ 20 CI'l
@ B O~E@ ~ \l \l
A regression analysis indicates that the skid numbers are not significantly affected by occumulated traffic, ther.for. , a dependable wear factor cannot b. colculated .
100
o -SN30
O-SN40
\7 -SN 50
10' 1,1,'"'" ''''''''ll "'"""' ''''''''11 .01 .1 10
ACCUMULATED TRAFFIC, TR (Millions)
100f-Section 6 - Wet Bottom Bo iler Slag 90 80
Z 70 VI 60
'" SO 1:11:
~ 40~ :IE ;:) 30 Z 0 ~ 20 CI'l
0 0 °Q]ctJ
A regression analysis indicate, that the skid numb.,s at. not significantly affected by accumulated traffic, ther.fore, a dependable .ear factor cannot b. calculated.
100
O-SN40
10' ""'''''' 1"11"'" ,,,,11'"' '''''tI'" .01 .1 10 100
ACCUMULATED TRAFFIC, TR (Millions)
-30-
c-s 1
1
1
1
]
I
J
I

1
I
I I I I
100 90 80
Z 70
'" 60
vi" 50 Gt: .
::: 40
~ ::::l 30 z 0 ~ 20
'"
Figure III (Continued)
EFFECTS OF TRAFFIC ON SKID NUMBERS ROUTE H
BATES COUNTY
Section 7 - Wet Bottom Boiler Slag
o 0 ooc:;jJ
A regression analysis ind icate. thot the skid numbers are not significantly affected by accumulat.d traffic , ther.for •• a dependabl. wear 'octor cannot b. calculated.
O-SN40
10' I I 111,1 'I I! I! '1" II I I I, III I I I ,!" II I'"
.01
100 90 80
Z 70
'" 60
vi" 50 Gt: . ... ID 40
~ i 30
o ~ 20
'"
.1 10
ACCUMULATED TRAFFIC, TR (Millions)
Section a · Wet Bo t tom Boiler Slog
@ @@~
A regression analys is ind icate. that the skid numbers or. not significantly affected by accumulated traff ic, ther.for. , a dependable wear 'actor cannot b. calculated.
100
o -SN 30
o -SN 40
\7 -SN 50
10' I! IIII! I II I! I! 'I'I!! I II "I"" I, I ,I" 'I'
.01 .1 10 100
ACCUMULATED TRAFFIC, TR (Millions)
-31-
C-6

Distinctive Characteristics
ROUTE J
BATES COUNTY
0-1
This special plant mix bituminous pavement utilized wet bottom boiler slag as
fihe aggregate and limestone as coarse aggregate .
Discussion of Results
Average SN40 was in the 40's on all sections. Regression analyses indicated
SN was not affected by TR. An analysis of variance disclosed SN40 was at least somewhat
influenced by AADLT.
Description of Project
Project 7-8-J-30 was a plant mix bituminous pavement (Mix #BP74-15)
completed in June, 1974.
The mix contained 80.0% Higginsville limestone, 20.0% wet bottom boiler slag
(96% -#4), and 6.2% asphalt (85-100). Composition of the mix, based on weight of
total mix was 94.2% mineral aggregate and 5.8% asphalt with 1.5% +1/2" and 61.2% +#10
material.
Five undivided pavement sections (1.600, 2.000, 2.000, 2.000, and 2.078 miles
in length) were tested. Each section had five tests in position 2 in each direction for
each test speed.
Skid tests and traffic data are shown in Table IV and plotted in Figure IV.
-32-
~
1
1 1
I
1

TABLE IV
SKID TESTS AND TRAFFIC DATA
ROUTE J BATES COUNTY
SN SN SN AADT Date Tested --1Q --.1Q 50 LLane
Section 1 - Wet Bottom Boiler Slag
10/10/74 44.8 415 4/ 1/75 45.6 432 9/25/75 37.6 432 4/14/76 42.0 505 8/31/76 34.5 505 4/ 7/77 44.6 505 8/24/77 41.8 505
Section 2 - Wet Bottom Boiler Slag
10/10/74 51.0 45.6 42.4 335 4/ 1/75 54.2 48.4 44.4 312 9/25/75 48.6 42.1 39.8 312 4/14/76 52.0 45.6 41.8 366 8/31/76 46.3 39.5 37.6 366 4/ 7/77 50.6 44.8 39.2 366 8/24/77 49.0 44.4 40.5 366
Section 3 - Wet Bottom Boiler Slag
10/10/74 43.6 282 4/ 1/75 46.0 294 9/25/75 40.4 294 4/14/76 43.0 344 8/31/76 40.5 344 4/ 7/77 45.0 344 8/24/77 46.2 344
Section 4 - Wet Bottom Boiler Slag
10/10/74 54.6 52.8 45.6 156 4/ 1/75 56.9 50.0 44.5 180 9/25/75 51.6 45.6 41.0 180 4/14/76 54.0 50.1 44.6 210 8/31/76 50.6 44.0 40.6 210 4/ 7/77 52.6 48.7 43.6 210 8/24/77 54.6 50.5 46.4 210
-33-
Age in Months
4 10 16 22 27 34 39
4 10 16 22 27 34 39
4 10 16 22 27 34 39
4 10 16 22 27 34 39
D-2
Est. Acc. j:'raf_fi.c ,TR
50,000 126,000 204,000 288,000 364,000 470,000 546,000
40,000 98,000
155,000 216,000 270,000 347,000 402,000
34,000 86,000
139,000 196,000 248,000 320,000 371,000
19,000 49,000 81,000
116,000 148,000 192,000 224,000
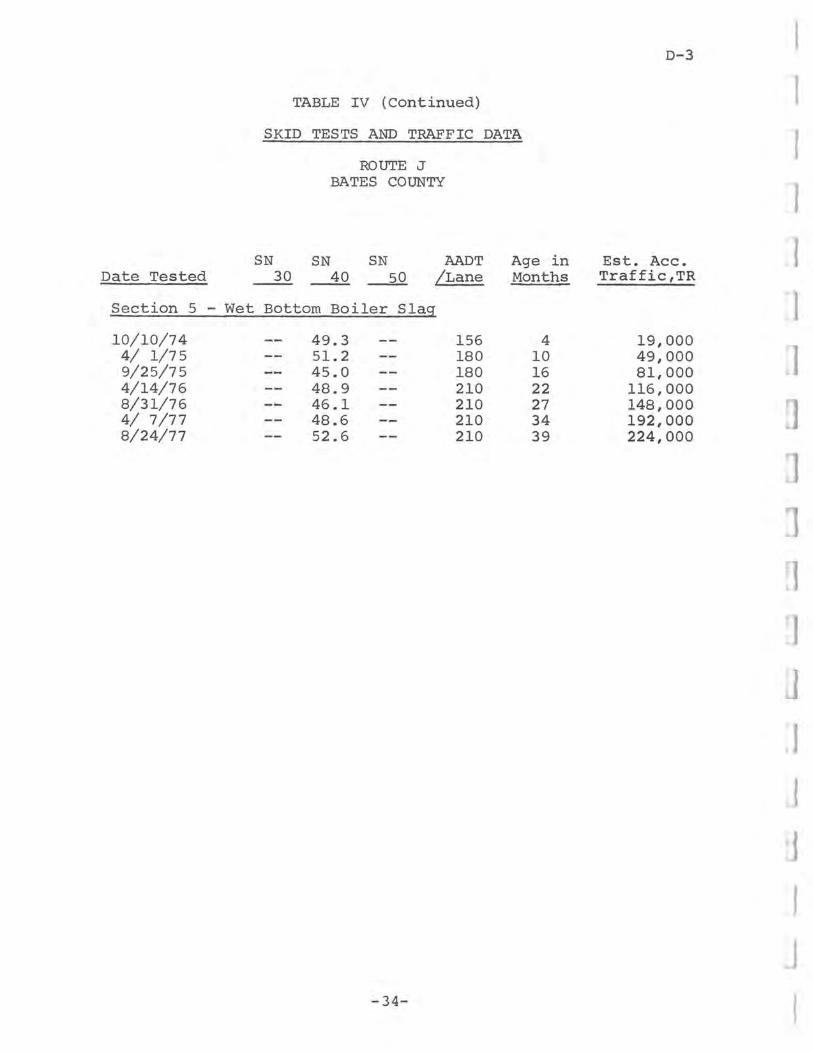
TABLE IV (Continued)
SKID TESTS AND TRAFFIC DATA
ROUTE J BATES COUNTY
SN SN SN AADT Age in Date Tested 30 ~ ~ LLane Months
Section 5 - Wet Bottom Boiler Sla~
10/10/74 49.3 156 4 4/ 1/75 51.2 180 10 9/25/75 45.0 180 16 4/14/76 48.9 210 22 8/31/76 46.1 210 27 4/ 7/77 48.6 210 34 8/24/77 52.6 210 39
-34-
D-3
Est. Acc. Traffic,TR
19,000 49,000 81,000
116,000 148,000 192,000 224,000
1
1
I rJ
J ~l
.J
f
J f

Figure IV
EFFECTS OF TRAFFIC ON SKID NUMBERS ROUTE J
BA TES COUNTY
100 t-Section 1 - Wet Boltom Boil.r Slag 90 80
Z 70
'" 60 ",' 50
~ 40~ ::J 30 Z 0 ~ 20
'"
0 0 00 CO
0
A regression analysis indicates that the skid numbers are not significantly aff.cted by accumulat.d traffic , ther.for., a dependable wear factor cannot b. calculated.
0 - SN40
10' I.',II! " ""11"11 111"11"1 ,"""",
.01 .1 10
ACCUMULATED TRAFFIC, TR (Millions)
lOOt-Section 2 - Wet Boltom Boiler Slag 90 80
Z 70
'" 60
~ 50~ 00: . w ID 40
~ i 30
0 ~ 20
'"
§ § ~99~
A regression analysis indicates thot the skid numbers are not significantly aff.cted by occumulat.d traffic , ther.for. , a dependable wear factor cannot b. calculated.
100
o - SN 30
0-SN40
\7- SN so
10' ,,1""'11 '"""'" "'"11'" 1""11111 .01 .1 10
ACCUMULATED TRAFFIC, TR (Millions)
lOOt-Sect ion 3 - Wet Boltom Boiler Slag 90 80
Z 70
'" 60
~ 50~ 00: . w ID 40
~ ::J 30 Z 0 ~ 20
'"
0 0 o ODeD
A regrellion onolysis indicates thot th. skid numbers ar. not significantly affected by accumulated traff ic. ,her. for., a dependable .ear factor cannot b. colculot.d.
100
D -SN 40
10' ,,'1'1"11 ''''''''II II'tllIl" '''''''III .01 .1 10 100
ACCUMULATED TRAFFIC, TR (Millions)
-35-
0-4

100 90 80
Z 70 VI 60
VI- 50 IX, ... lID 40
~ ::> 30 Z o ~ 20 VI
Figure IV (Continued)
EFFECTS OF TRAFFIC ON SKID NUMBERS ROUTE J
BA TES COUNTY
Section 4 - Wet Bottom Boiler Slog
§ 'V
8 'V §@~~
A reSirenion analysis indicate, that the skid numbers or. not significantly aff.cted by accumulated traffic , ther.for. , a dependable wear 'actor (on not b. colculated.
O -SN 30
O-SN40
~.SN50
10' ,,'11,,'11 ""!!"" 111 1 '"1" 1""1111'
.01 .1 10
ACCUMULATED TRAFFIC, TR (Millions)
lOOt-Sect ion S - Wet Bottom Boiler Slag 90 80
Z 70 VI 60
.,; 50 IX, ... lID 40
~ ::> 30 Z o ~ 20 VI
o o o DDcP
A reor.ssion analysis indicate, thot the skid numbe" are not significantly aff.cted by accumulated traffic , ther.for., a dependable .ear factor cannot b. calculated.
100
O·SN 40
10' I. IIIII I II I! I. II! I II I II" •• I II ",! '" !" .01 .1 10 100
ACCUMULATED TRAFFIC, TR (Millions)
-36-
0-5 1
1
J
J
I 1
J
1
1
1
1
1
1
J
I J
I J
J
I I
Distinctive Characteristics
ROUTE 752
BUCHANAN COUNTY
E-1
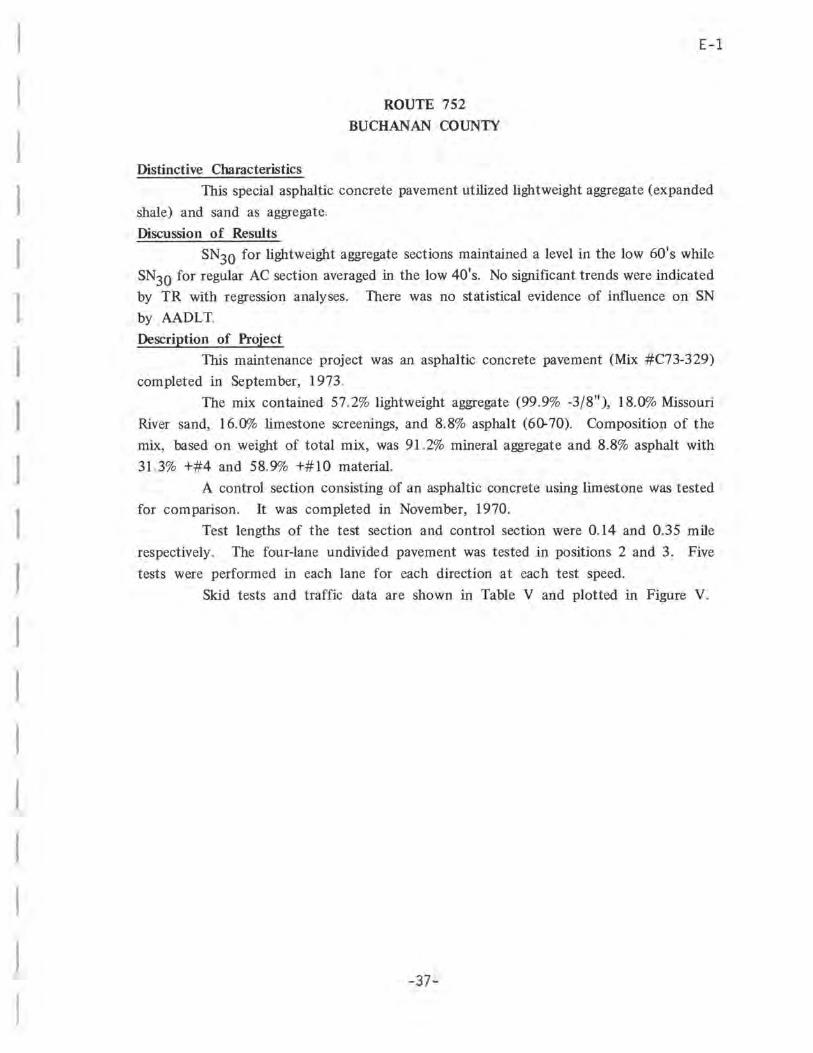
This special asphaltic concrete pavement utilized lightweight aggregate (expanded
shale) and sand as aggregate.
Discussion of Results SN30 for lightweight aggregate sections maintained a level in the low 60's while
SN30 for regular AC section averaged in the low 40's. No significant trends were indicated
by TR with regression analyses. There was no statistical evidence of influence on SN
by AADLT.
Description of Project This maintenance project was an asphaltic concrete pavement (Mix #C73-329)
completed in September, 1973.
The mix contained 57.2% lightweight aggregate (99.9% -3/8"), 18.0% Missouri
River sand, 16.0% limestone screenings, and 8.8% asphalt (60-70). Composition of the
mix, based on weight of total mix, was 91.2% mineral aggregate and 8.8% asphalt with
31.3% +#4 and 58.9% +#10 material.
A control section consisting of an asphaltic concrete using limestone was tested
for comparison. It was completed in November, 1970.
Test lengths of the test section and control section were 0.14 and 0.35 mile
respectively. The four-lane undivided pavement was tested in positions 2 and 3. Five
tests were performed in each lane for each direction at each test speed.
Skid tests and traffic data are shown in Table V and plotted in Figure V.
-37-

E-2
TABLE V
SKID TESTS AND TRAFFIC DATA
ROUTE 752 BUCHANAN COUNTY
SN SN AADT Age in Est. Acc. Date Tested 20 -2Q. /Lane Months Traffic,TR
Lightweight Aggregate Section ~ExEanded Shale} - Position 2 -Eastbound
10/24/74 65.9 60.8 1720 14 732,OpO 4/10/75 69.9 65.1 3243 19 1,127,000 9/15/75 70.1 61.0 3243 24 1,613,000 3/30/76 72.3 66.1 3587 31 2,325,000 9/15/76 56.1 51.0 3587 36 2,863,000 5/ 4/77 77.8 66.0 3587 44 3,724,000 8/ 3/77 64.8 58.1 3587 47 4,047,000
Lightweight Aggregate Section ~ExEanded Shale} - Position 3 -Eastbound
10/ 9/73 67.9 59.1 665 1 20,000 10/24/74 66.2 58.4 637 14 271,000 4/10/75 68.3 65.9 1201 19 417,.000 9/15/75 71.2 66.2 1201 24 598,000 3/30/76 73.6 66.3 1329 31 861,000 9/15/76 54.0 56.2 1329 36 1,061,000 5/ 4/77 1329 44 1,380,000 8/ 3/77 71.7 62.3 1329 47 1,499,000
Lightweight Aggregate Section ~ExEanded Shale} - Position 2 -Westbound
10/24/74 65.6 56.5 1455 14 619,000 4/10/75 68.0 60.4 2742 19 953,000 9/15/75 70.7 62.4 2742 24 1,364,000 3/30/76 77.1 67.7 3033 31 1,966,000 9/15/76 65.7 61.5 3033 36 2,421,000 5/ 4/77 72.7 57.7 3033 44 3,149,000 8/ 3/77 66.5 67.4 3033 47 3,422,000
-38-
1
'1 J
}'
,j
J
J J

Date Tested
TABLE V (Continued)
SKID TESTS AND TRAFFIC DATA
SN 20
ROUTE 752 BUCHANAN COUNTY
SN AADT 30 /Lane
Age in Months
E-3
Est. Ace. Traffic , TR
Lightweight Aggregate Section ~ExEanded Shale~ - Position 3 -Westbound
10/ 9/73 67.4 58 . 5 866 1 26,000 10/24/74 70.6 62.5 830 14 353,000 4/10/75 73.2 69.3 1564 19 543,000 9/15/75 76.8 68.9 1564 24 778,000 3/30/76 76.4 69.2 1730 31 1,121,000 9/15/76 64.5 63.2 1730 36 1,381,000 5/ 4/77 1730 44 1,796,000 8/' 3/77 77.1 65 . 2 1730 47 1,951,000
Regular AC Section - Position 2 - Eastbound
10/24/74 49.6 41.1 1720 48 2,563,000 4/10/75 53.6 48.6 3243 53 2,958,000 9/15/75 52.8 47.3 3243 58 3,445,000 3/30/76 58.0 52.5 3587 65 4,157,000 9/15/76 39.8 36.0 3587 70 4 , 695,000 5/ 4/77 54.4 42.9 3587 78 5 , 556,000 8/ 3/77 38.9 35.2 3587 81 5,878,000
Regular AC Section - Position 3 - Eastbound
10/ 9/73 45.7 36.6 665 35 698,000 10/24/74 51. 2 43.7 637 48 950,000 4/10/75 51.1 47.0 1201 53 1,096,000 9/15/75 44.3 44.0 1201 58 1,276,000 3/30/76 60.0 55.4 1329 65 1 , 540,000 9/15/76 39.8 36.7 1329 70 1,739,000 5/ 4/77 1329 78 2,058,000 8/ 3/77 42.0 32.9 1329 81 2,178,000
-39-

I
f
-40-]

1
I I I I
100 90 80
Z 70 III 60
111- 50 ~ ,
:::: 40
~ i 30
0 ~ 20 III
Figure V
EFFECTS OF TRAFFIC ON SKID NUMBERS ROUTE 752
BUCHANAN COUNTY
Lightweight aggregate section (Expanded .hale}-Po.ition 2 - Eastbound
& &.6&
° & .6
~
A regfellion analysis indicat., thot the .kid numb.rs are not significantly aff.cted by accumulated traffic, ther.for., a dependabl •• eor foctor cannot b. calculated.
6-SN 20
O-SN30
10' 1,1,1,1111 1",'''111 1,,",1111 111""'" .01
100 90 80
Z 70 III 60
vi 50 ~
:::: 40
~ ::l 30 Z 0 ~ 20 III
.1 10
ACCUMULATED TRAFFIC, TR (Millions)
Lightweight aggregate section (Expanded shale}-Position 3 - Eastbound
.6 o
6 o ~&B
@.
6 o
A regfenion onalysis indicat •• that the ,kid number. or. not significontly aff.cted
by accumulated traffic, ther.for •. a dependabl •• ear fador cannot b. colculated .
100
6-SN20
O-SN30
10' ,,,,,,,," ''''''''" ,,'dll'" ,"",,11' .01
100 90 80
Z 70 III 60
vi 50 ~
:::: 40
~ ::l 30 Z 0 ~ 20 III
.1 10
ACCUMULATED TRAFFIC, TR (Millions)
lightweight aggregate section (Expanded shale'-Position 2 - Westbound
6.6.6.6 A 000 °frO
°
A reur.llion analysis indicat •• that the ,kid numbers are not significantly affected by accumulated traffic, therefor., a dependabl. wear factor cannot b. calculated.
100
6-SN20
O-SN30
101 1"""'11 ,1"""'11 IIIdd111 ,I"ddlll
.01 .1 10 100
ACCUMULATED TRAFFIC, TR (Millions)
-41-
E-S

100 96 80
Z 70 VI 60
vi 50 a= .... a:I 40
~ ~ 30 Z Q
~ 20 VI
Figure V (Continued)
EFFECTS OF TRAFFIC ON SKID NUMBERS ROUTE 752
BUCHANAN COUNTY
Lightweight aggregate section (Expanded shale) - Pos ition 3 - Westbound
6 o
6-g ~ e tto 0
A regress ion anolysis indicates that the slcid numb.,. are no' s ignificantly affected by accumulated traffic, ther.fore, a dependable wear foctor cannot b. calculated.
.6o-sN20
o .SN30
10' I! I, ,,' I II I, I, I,' I II I I I, I" '" I, I! I, I I II
.01 .1 10
ACCUMULATED TRAFFIC, TR (Millions)
100.l-Regular AC Section - Position 2 - Eastbound 90 80
Z 70 VI 60
VI- 50 a= .... a:I 40 ~ ~ 30 Z Q
~ 20 VI
tffft.6o
o &%
A regress ion analysis ind icate. that the skid numbers or. not signif icantly aff.cted by accumulated traffic , ther.fore, a dependable wear foctor conno' b. calculated .
100
.6o-sN20
o -SN 30
10' 1,''''''" '''''''III 1, 1 ",1111 1""11111
.01
100 90 80
Z 70 VI 60
VI- 50 a= ::: 40
~ ~ 30 Z Q
~ 20 VI
.1
ACCUMULATED TRAFFIC, TR (Millions)
Regular AC Section - Po s ition 3 - Eastbound
e ~geOB.6o o 0
10
A reg feu ion analysi. indicate. that the skid number. ar. not s ignificantly affected by accumulated traffic, therefore, a dependable .ear factor cannot be calculated.
100
.6o-sN20
o -SN 30
10' I"'!"III 1"""111 III'''''''' ,I"""'" .01 .1 10 100
ACCUMULATED TRAFFIC, TR (Millions)
-42-
E·6 1
1 ]
I 1
1
J
J

Figure V (Continued)
EFFECTS OF TRAFFIC ON SKID NUMBERS ROUTE 752
BUCHANAN COUNTY
100 r- Regular AC Section. Position 2 • Westbound 90 80
Z 70 II> 60
on 50 f¥ ' ... 10 40
~ ~ 30
o loI: 20 II>
6,6. Hffi 6,
o 0 4:>. 0&
A regression analysis indicate, that the skid numbers are not significantly affected by accumulated .traffic, . f.herefor_/ 0 dependable wear factor cannot be calculated.
6·SN 20
o .SN 30
10' 1,1,1,' I II I, 1,1,1 III ',1,',1111 I, 1,1,1 III
.01 .1 10
ACCUMULATED TRAFFIC, TR (Millions)
I00r- Regular AC Section· Position 3 . Westbound 90 80
Z 70 II> 60
on 50 f¥ ... 10 40
~ ;:) 30 Z o loI: 20 II>
6,6.
6,!::ut:P 00 ° 66
o
A regression analysis indicates that the skid numbers or. not significantly affected by accumulated traffic, ther.fore, a dependable wear factor cannot b. cclculated.
100
6·SN 20 ° ·SN 30
101 I.!.!dlll '''''dill ,,,,,,I'" 11,",1111 .01 .1 10 100
ACCUMULATED TRAFFIC, TR (Millions)
-43-
E·7

Distinctive Characteristics
ROUTE 1-70
JACKSON COUNTY
F-l
This special asphaltic concrete pavement utilized lightweight aggregate (expanded
shale), limestone screenings, and sand as aggregates.
Discussion of Results
SN40 on lightweight aggregate sections averaged in the 40's but SN40 on control
sections was in the low 20's. Regression analyses revealed no significant influence from
TR on SN.
Description of Project
This maintenance project was an asphaltic concrete pavement (Mix #LA75-ll)
completed in June, 1975.
The mix contains 56.7% lightweight aggregate (99.9% -3/8"), 19.0% Bethany
Falls limestone screenings, 16.0% Missouri River sand, and 8.3% (60-70). Composition
of the mix, based on weight of total mix, was 91 .7% mineral aggregate and 8.3% asphalt
with 35.7% +#4 and 58.6% +# 1 0 material.
A control section of PCC pavement, built in 1960, was tested for comparison.
Test lengths for the test section and control section were 0.400 mile each. Tests
were performed in positions 2 and 4 of the eastbound lane of the divided pavement.
Each section had three tests in each lane for each test speed. The test section was on
a curve.
Skid tests and traffic data are shown in Table V1 and plotted in Figure VI.
-44-
1
1
1 ]
]
]
J
I
I

Date Tested
TABLE VI
SKID TESTS AND TRAFFIC DATA
SN 40
ROUTE I-70 JACKSON COUNTY
SN AADT 55 /Lane
Age in Months
.F-2
Est. Acc. Traffic,TR
Lightweight Aggregate Section ~ExEanded Shale} - Position 2
7/ 7/75 40.8 35.9 11420 1 343,000 9/26/75 54.1 36.4 11420 4 1,370,000 4/14/76 52.9 41 . 5 12032 10 3,481,000 9/17/76 38.9 35.9 12032 16 5,647,000 5/ 6/77 52.1 40.2 12032 23 8,174,000 8/26/77 46.0 33.2 12032 27 9,617,000
Lightwei~ht A~gregate Section (ExEanded Shale) - Position 4
7/ 7/75 42.2 36.0 15944 1 478,000 9/26/75 47.2 41.5 15944 4 1,913,000 4/14/76 52.0 37.3 16797 10 4,860,000 9/17/76 39.0 29.1 16797 16 7,883,000 5/ 6/77 51.1 45.8 16797 23 11,411,000 8/26/77 41.0 36.7 16797 27 13,426,000
Control Section - position 2 (PeCP}
7/ 7/75 16.6 15.2 11420 180 56,549,000 9/26/75 21.2 17.7 11420 183 57,577,000 4/14/76 26.9 21.5 12032 189 59,687,000 9/17/76 17.7 17.1 12032 195 61,853,000 5/ 6/77 28.1 23.7 12032 202 64,480,000 8/26/77 23.2 21.4 12032 206 65,824,000
Control Section - Position 4 ~PeCP}
7/ 7/75 17.1 14.4 15944 180 78,945,000 9/26/75 20.0 15.9 15944 183 80,380,000 4/14/76 27.1 21.4 16797 189 83,327,000 9/17/76 16.6 14.1 16797 195 86,350,000 5/ 6/77 27.8 21.4 16797 202 89,878,000 8/26/77 21.8 21.9 16797 206 91,893,000
-45-

Figure VI
EFFECTS OF TRAFFIC ON SKID NUMBERS ROUTE 1-70
JACKSON COUNTY
1~~t- lightweight aggregate section (Expanded shale)-Position 2
80 Z 70
'" 60 vi so Go: .
= .. 0 ~ ~ 30 Z Q
~ 20
'"
o g8~
o 8 o
A regression analysis indicate. that the skid numb.r, are not significantly affected by accumulated traffic , ther.'or., a dependable wear factor cannot b. calculated .
o -SN 40
O-SN55
10' ,'''0101111 ,loIoId!!1 .1010101111 ,1.!.!01111 .01 .1 10
ACCUMULATED TRAFFIC, TR (Millions)
10~J- Lightweight aggregote section (Expanded shale)-Position 4 90 80
Z 70
'" 60 ",' so Go: . &&.I ~ .. 0 ~ ~ 30 Z Q
~ 20
'"
o o
8 o o o~
o
A regression analysis indicate. thot the skid numbers or. no' significantly affected by accumulated traffic, ther.for., a dependable .ear 'actor canna. b. calculated .
100
o -SN 4 0
O-SNS5
10' ,1,'''''111 ,1"".1111 ,ltI"tllIl 1.I'!dlll
.01 .1 10
ACCUMULATED TRAFFIC, TR (Millions)
1~~t-Control Section - Po si tion 2 (PCCP)
80 z 70
'" 60
vi SO Go: .... ~ .. 0
~ :::) 30 Z Q
~ 20
'" A regression analysis indicate, tho. the ,kid numbers are not signifieDn,ly affected by occumulat.d traffic , therefore, a dep.ndabl ••• ar 'actor cannot be calculated.
100
o - SN 40
O -SNSS
@
~ @
10 I I ! I "" I " I II "" I II I I I "" I I I I " "" " I
.01 .1 10 100
ACCUMULATED TRAFFIC, TR (Millions)
-46-
F·3 I 1
I
J
J
j

Figure VI (Continued)
EFFECTS OF TRAFFIC ON SKID NUMBERS ROUTE 1-70
JACKSON COUNTY
lOOt-Control Section - Position 4 (PCCP) 90 80
Z 70 VI 60
vi 50 - 111: '
1&1 IG 40
~ ::::I 30 Z Q
~ 20 VI
A rlgreuion analYlis In dicatll that the .kld "t.lmb.,. or. not .Ignificontly affected by accumulated traffic, th.r.for., a dlpendabl. wlar 'actor cannot b. calculated.
D-SN4o
O-SN 55
rn:J @
~ 10' 111,111111 1,.",1111 '''''!!"' 1,1,1,,",
,01 .1 10 100
ACCUMULATED TRAFFIC, TR (Millions)
-47-
F-4

G-l
ROUTE 115
ST. LOUIS COUNTY
Distinctive Charac teristics
This special asphaltic concrete pavement utilized steel slag as coarse aggregate
and sand as fine aggregate.
Discussion of Results
SN40 averaged in the upper 40's on both sections. Significant relationships
between SN and TR were established for SN20 and SN30 in Section L
Description of Project
Project 6-U-IIS-59 was an asphaltic concrete pavement (Mix #SS73-2) completed
in November, 1973
The mIx contained 79 70/1" steel slag (97.6% -3/8"), 11 ,0% Missouri River sand,
40% mineral filler and 53% asphalt (60-70). Composition of the mix, based on weight
of total mix, was 94,7% mineral aggregate and 5.3% asphalt with 1.9% +3/8" and
57,6% +#10 material
Two undIvided pavement sections (each I 000 mile in length) were tested. Each
section had five tests in each direction for each test speed. Tests were performed in
positions I and 2
Skid tests and traffic data are shown in Table VII and plotted in Figure VIL
-48-
1
1 J
1 1
1
J
J

Date Tested
TABLE VIII
SKID TESTS AND TRAFFIC DATA
SN 20
ROUTE 115 ST. LOUIS COUNTY
SN SN MDT 30 40 LLane
Section 1 - Steel Sla~
6/26/74 56.2 47.2 6351 10/17/74 62.6 56.4 49.0 6351
4/29/75 62.9 55.0 49.0 6326 8/26/75 65.6 56.8 50.0 6326 4/28/76 57.9 52.3 46.0 6705 9/21/76 56.3 52.6 45.4 6705 6/ 8/77 53.4 47.4 39.4 6705
Section 2 - Steel Sla~
6/26/74 55.2 48.6 6686 10/17/74 64.4 58.4 52.1 6686
4/29/75 62.4 55.6 50.0 6522 8/26/75 65.1 56.2 49.6 6522 4/28/76 59.7 53.7 47.3 6913 9/21/76 56.3 52.4 45.6 6913 6/ 8/77 58.8 47.0 40.6 6913
-49-
G-2
Age in Est. Acc. Months Traffic,TR
8 1,494,000 12 2,256,000 18 3,396,000 22 4,155,000 30 5,719,000 35 6,725,000 44 8,535,000
8 1,554,000 12 2,356,000 18 3,540,000 22 4,323,000 30 5,935,000 35 6,972,000 44 8,839,000

Figure VII
EFFECTS OF TRAFFIC ON SKID NUMBERS ROUTE 115
ST. LOUIS COUNTY
1001: Sect ion Stee l Slag 90 80
Log SN20
Z 70
'" 60 vi' 50 DC ,
~ 40
~ ::::I 30 Z C
~ 20
'"
Log SN30
1. 779 - .082 (Log TR)
LINEAR REGRESSION ANALYSIS (lOG - lOG RELATIONSHIP) 20 MPH ~ ~
WEAR FACTOR -.132 - .082
s y .x CV (%) ,2
·A regre ss ion by
.022 .019 1.7 1.9
.678 .625 6
ind icate, thot the sk id numb.,. or. not s ignif icantly affected a dependabl. wear factor cannot b. calculated.
6 - SN20
o .SNao
O -SN40
10 I I , I I I" ' " I ! Ie I, I I " ' , I I II I " , , " ' II' " ,
.01 .1 10
ACCUMULATED TRAFFIC, TR (Millions)
100_r-Sect ion 2 - St ee l Slag 90 80
Z 70
'" 60 vi' 50 DC ... 10 40
~ ::::I 30 Z C
~ 20 '" I
o g B8~~ o 0
A r egre ssi on analys is indicates that the sk id numbers or . not s ig nifi cantly affected by accumulat.d traff ic, therefore, a dependab le wear 'actor cannot b. calcu lated .
100
6 · SN20
o . SN 30
o -SN 4 0
10' ,.11111111 ",,,,.,11 1,,",,", ",,,,"11
,01 .1 10 100
ACCUMULATED TRAFFIC, TR (Millions)
-50-
G-3 1 1 I 1
J ~
I

I l
l
H-1
ROUTE 141
ST, LOUIS COUNTY
Distinctive Characteristics
This special asphaltic concrete pavement utilized steel slag as coarse aggregate
and sand as fine aggregate,
Discussion of Results
Although data is very bmlted, SN40 maintained a level in the mid-40's,
Regression analyses did not reveal significant relationships between SN and TR.
Description of Project
Project 6-U-141 -42 was an asphaltic concrete pavement (Mix #SS74-25)
complet ed in May, 1975.
The mix contained 79.5% steel slag (97,6% -3 /8"), 11 .0% Missouri River sand,
4,0% mineral filler, and 5.5% asphalt (60-70). Composition of the mix, based on weight
of total mix, was 94,5% mineral aggregat e and 5.5% asphalt with 5.4% +3 .8" and
59.7% +#10 material .
One undivided pavement section (1 ,. 218 miles in length) was tested, The section
had fIVe tests in position 2 in each direction for each test speed.
Skid tests and traffic data are shown in Table VIII and plotted in Figure VIII.
-51-

TABLE VIII
SKID TESTS AND TRAFFIC DATA
ROUTE 141 ST. LOUIS COUNTY
SN SN SN AADT Age in Date Tested ~ 30 40 /Lane Months
Section 1 - Steel Slag
8/26/75 63.0 54.4 48.7 5745 4 4/29/76 62.7 55.6 46.9 6090 12 9/21/76 60.6 55.6 48.8 6090 17 5/11/77 56.8 48.4 42.5 6090 25 8/ 8/77 63.8 54.3 46.3 6090 28
Figure VI,II
EFFECTS OF TRAFFIC ON SKID NUMBERS ROUTE 141
10~I-S.clioft I .Sleel Slog 90 eo
z 70 <It 60
'" 50 111: -
~ 40
~ :;) 30 Z o ~ 20 III
ST. LOUIS COUNTY
6
8 e @~ o EP
A reg'.lIion analysis indicates tho. the ,kid nulftb.,. are not significantly off.cted by o((ulftulot.d traffic , th.r.'or., a dependable •• or factor cannot b. calculat.d.
H-2
Est. Acc. Traffic,TR
689,000 2,110,000 3,023,000 4,485,000 5,033,000
6·SN 20
O·SN 30
O·SN 40
10' "'11" 1" ""'11'11 ''''',,'ll '11"1111'
,01 .1 10 100
ACCUMULATED TRAFFIC, TR (Millions)
-52-
I 1
1 1 .I
1
I
J

1
I 1 I J
1 ]
I 1 I ]
I I I J
I 1
I
1-1
ROUTE 21
ST. WUIS COUNTY
Distinctive Characteristics
This special asphaltic concrete pavement utilized blast furnace slag and blending
sand as aggregates. Asphalt contents of 6,0% and 6.2% were used on this project.
Discussion of Results
SN40 is maintaining a level between 50 and 60. Regression analyses indicated
SN was not significantly affected by TR
An analysis of variance indicated significant differences in average SN, but the
influencing factor was not apparent.
Description of Project
Project 6-U-2l-5l was an asphaltic concrete pavement (Mixes #BFS75-6 and
#BFS75-7) completed in July, 1975.
Mix #BFS75-6 contained 79.0% blast furnace slag (93.2% -3/8"), 11.1" blending
sand, 3,7% mineral filler, and 6.2% asphalt (60-70). Composition of the mix, based on
weight of total mix, was 93.8% mineral aggregate and 6.2% asphalt with 5.4% +3/8" and
59,5% +10 material.
Mix #BFS75-7 contained 79.2% blast furnace slag (93.2% -3/8"), 11.1% blending
sand, 3.7% mineral filler, and 6.0% asphalt (60-70). Composition of the mix, based on
weight of total mix, was 94.0% mineral aggregate and 6.0% asphalt with 5.4% +3/8" and 59., 7% +# 1 0 material.
Two undivided four-lane pavement sections 0 .155 and 1.156 miles in length)
were tested. Each section had five tests in each direction in each lane for each speed.
Tests were performed in positions 2 and 4.
Test locations were selected without regard to different asphalt content material
locations. As a result, skid numbers shown in the table may represent the average of
less than ten tests.
Skid tests and traffic data are shown in Table IX and plotted in Figure IX
-53-

I- 2
TABLE IX
SKID TESTS AND TRAFFIC DATA
ROUTE 21 ST. LOUIS COUNTY
SN SN SN AADT Age in Est. Acc. Date Tested 30 40 50 LLane Months Traffic,TR
Section 1 - Position 2 - 6.0% Asphalt - Blast Furnace Slag
8/27/75 54.1 48.3 44.9 6224 2 373,000 9/29/75 " 58.0 54.1 48.0 6224 3 560,000 4/27/76 63.7 54.3 49.1 6597 10 1,912,000 9/21/76 59.9 53.2 50.2 6597 15 2,901,000 5/12/77 56.8 49.0 44.5 6597 22 4,287,000 8/ 9/77 59.0 50.4 49.3 6597 25 4,880,000
Section 1 - Position 4 - 6.~1o Asphalt - Blast Furnace Slag
9/29/75 58.6 54.9 50.2 6002 3 540,000 4/27/76 67.9 58.1 53.4 6363 10 1,844,000 9/21/76 61.6 55.8 52.3 6363 15 2,798,000 5/12/77 61.4 54.8 50.9 6363 22 4,135,000 8/ 9/77 59.6 55.3 51.8 6363 25 4,707,000
Section 1 - Position 2 - 6.2% Asphalt - Blast Furnace Slag
8/27/75 53.7 49.0 44.1 6224 2 373,000 9/29/75 55.5 53.1 48.0 6224 3 560,000 4/27/76 65.5 56.1 50.0 6597 10 1,912,000 9/21/76 58.1 52.6 48.5 6597 15 2,901,000 5/12/77 56.9 49.4 46.2 6597 22 4,287,000 8/ 9/77 59.4 54.2 49.1 6597 25 4,880,000
Section 1 - position 4 - 6.2% Asphalt - Blast Furnace Slag
9/29/75 62.1 56.4 52.2 6002 3 540,000 4/27/76 71.6 57.2 48.8 6363 10 1,844,000 9/21/76 63.9 60.0 53.4 6363 15 2,798,000 5/12/77 59.6 53.2 47.5 6363 22 4,135,000 8/ 9/77 62.4 57.5 51.8 6363 25 4,707,000
-54-
' 1\ l ' '1 .1 1
]
]
}
J J

I 1-3
1 TABLE IX (Continued)
1 SKID TESTS AND TRAFFIC DATA
ROUTE 21
I ST. LOUIS COUNTY
1 SN SN SN AADT Age in Est. Acc. Date Tested --2Q 40 --2.Q /Lane Months Traffic,TR
1 Section 2 - position 2 - 6.2% Asphalt - Blast Furnace Slag
I 8/27/75 54.2 49.2 44.5 5705 2 342,000 9/29/75 56.2 53.7 48.4 5705 3 513,000 4/27/76 66.1 56.7 51.6 6047 10 1,753,000
I 9/21/76 58.4 54.2 48.6 6047 15 2,660,000 5/12/77 57.6 50.3 45.4 6047 22 3,929,000 8/ 9/77 57.5 53.4 48.6 6047 25 4,474,000
I Section 2 - Position 4 - 6.0% Asphalt - Blast Furnace Slag
9/29/75 59.8 56.4 51.1 5502 3 495,000
I 4/27/76 68.0 60.5 54.8 5833 10 1,690,000 9/21/76 63.1 57.6 53.7 5833 15 2,565,000 5/12/77 61.6 55.4 51.6 5833 22 3,790,000 8/ 9/77 62.1 58.0 53.6 5833 25 4,315,000
I
-55-

Figure IX
EFFECTS OF TRAFFIC ON SKID NUMBERS ROUTE 21
ST. LOUIS COUNTY
100~S.ction I - Position 2 - 6 .0% Asphalt - Bia s i Furnace Slag 90 80
Z 70
'" 60 ." SO 0/: . ... rtI 40
~ :;:, 30 Z Q
:.i: 20
'"
@ § 'V 9 ~ ~
O·SN 30
D-SN 4o
\7-SN so
A regrellion analysis indicote. that the ,kid numb.r. are not significantly affected by accufllutated traff ic, th.r.'or., a dependable .ear 'octor cannot b. calculoted.
10 I I tI II II 01 I " I II " II 01 I II tI tI 01 01 II I I tI tI "" II! .01
100 90 80
Z 70
'" 60 ." SO 0/: .
:::: 40
~ :;:, 30 Z Q
:.i: 20
'"
.1
ACCUMULATED TRAFFIC, TR (Millions)
S.ction I • Position 4 - 6.0% Asphalt - Biasi Furnace Slag
® 8 § ~
10 100
O·SN 30
D·SN 4o
\7-SN so
10 1 1,1".1111 ,I.!ddlll ,'''''''"1 '''''''"' .01
100 90 80
Z 70
'" 60 ." SO 0/: .
:::: 40
~ :;:, 30 Z Q
:.i: 20
'"
.1
ACCUMULATED TRAFFIC, TR (Millions)
S.ction 1 . Position 2 -6.2% Asphalt - Blast Furnace Slag
@® o o 'V @~
10 100
o ·SN 30
D-SN4o
\7-SN so
A reg,ellion anolysis indicat •• thot the .kid numbers are not significontly affected bv o(Cullu"lot.cI trf;ll'.i4; • • h.r.'or.,_ a dependabl •• eor 'ador cannot b. calculat.d.
10 I I I I II II 01 III I II tI II 01 (( I tI tI 01 01 I II I tI tI .! 01 I II .01 .1 ro 100
ACCUMULATED TRAFFIC, TR (Millions)
-56-
1-4 J
1
I I
,..
I
I I

100 90 80
Z 70
'" 60 vi SO IX '
~ 40
~ ;:) 30 Z Q
~ 201
Figure IX (Continued)
EFFECTS OF TRAFFIC ON SKID NUMBERS ROUTE 21
ST. LOUIS COUNTY
Section 1 - Position 4 -6.2% Asphalt - Blast Furnace Slag
@ o o § Q3 'V 'V ~
A reg,e"ion analysi. indicat •• that the ,kid nUMbers or. not significantly aff.ct.d by o~cUM",lot~d tr~f'i~/_t_h.r.for. ,_ a d.pendable .ear foctor co"no' b. calculated.
o -SN30
O -SN40
'Q-SN 50
10' '''''dill ,laI"d'" ,Id,.tlill ,."""",
.01
100 90 80
Z 70
'" 60 vi SO IX·
~ 40
~ ;:) 30 Z Q
=-: 20
'"
.1
ACCUMULATED TRAFFIC, TR (Millions)
Section 2 - Position 2 - 6 .2% Asphalt - Blast Furnace Slag
o
§ @ \1 @~
10 100
O-SN30
O-SN40
'Q - SN 50
A reoression analysi. indicot., that the skid numb.,. or. no' significantly affected by accumulat.d traffic, ther.for., a dependable .eor 'actor cannot b. calculated.
101 1.1010101111 .Idololill 01010101111 .1,!,1dlll
.01
100 90 80
Z 70
'" 60 ",' SO 0: ' ~ 40
~ ;:) 30 Z
Q
=-: 20
'"
.1
ACCUMULATED TRAFFIC, TR (Millions)
Section 2 - Position 4 _ 6.0% Asphalt - Blast Furnace Slag
® 9 @ ~
10 100
o -SN 30
o -SN 40
'Q-SN SO
A reoreuion analysi. indicote, thot the ,kid numbers or. not significantly aff.cted by accumulated traffic, th.r.for., a dependable wear factor cannot be calculated.
10 1 Ioidolill oIoidollll oIo1o1dlll 01 01 old III .01 .1 10 100
ACCUMULATED TRAFFIC, TR (Millions)
-57 -
1-5

J-l
ROUTE 140
ST. LOUIS COUN1Y
Distinctive Characteristics
This project involved two special asphaltic concrete pavements. Section 1 utilized
blast furnace slag as the coarse aggregate and sand as the fine aggregate. Section 2 utilized
porphyry (trap rock) as coarse aggregate and sand as fine aggregate.
Discussion of Results
SN40 on the blast furnace slag section was about 6 SN higher than on the
porphyry section. Position 4 tests of Section 1 . did not show statistical trends by TR
but all other tests did. SN40 maintained a level in the upper 40's for porphyry and
in the 50's for blast furnace slag.
Description of Project
Project C096-M(3) involved two asphaltic concrete pavements completed in
November, 1969.
Mix #C69-47l contained 79.6% porphyry (99.5% -1/2"), 12.0% Missouri River
sand, 3.4% mineral filler and 5.0% asphalt (60-70). Composition of the mix, based on
weight of total mix, was 95.0% mineral aggregate and 5.0% asphalt with 0.4% +1/2" and
54.3% +#10 material.
Mix #C69-624 contained 79.3% blast furnace slag (99.5% -3/8"), 10.0% Missouri
River sand, 3.7% mineral fIller, and 7.0% asphalt (60-70). Composition of the mix, based
on weight of total mix, was 93.0% mineral aggregate and 7.0% asphalt with 0.4% +3/8"
and 51.4% +#10 material.
The porphyry section had a length of 1.01 miles with five tests in each direction
per lane for each test speed. The blast furnace slag section had a length of 0.15 mile
with three tests in each direction per lane for each test speed. All tests were performed
in positions 3 and 4.
Skid tests and traffic data are shown in Table X and plotted in Figure X.
-58-
1 1 .1 1
1
}
! I

I I I
J
1
1 ]
1 1 1 ]
f
f
'I
1 1
I
Date Tested
TABLE X
SKID TESTS AND TRAFFIC DATA
SN 20 --
ROUTE 140 ST. LOUIS COUNTY
SN SN AADT 30 40 /Lane -- --
Age in Months
Section 1 - Position 3 - Blast Furnace Slag
3/17/71 77.4 68.4 62.0 1386 17 8/ 3/71 79.0 71.8 65.6 1386 21 5/17/72 69.4 64.8 59.3 1728 31 9/ 5/72 65.8 59.1 55.6 1728 34 6/ 8/73 70.0 63.0 55.8 2222 43 9/19/73 68.4 62.8 55.8 2222 47 6/27/74 65.8 62.6 58.0 1832 56
10/16/74 66.1 61.4 55.8 1832 60 4/24/75 63.9 60.0 54.8 3254 66 8/26/75 65.2 61.6 57.5 3254 70 4/28/76 62.6 62.6 56.6 3450 78 9/22/76 61.3 57.7 52.2 3450 83 8/ 8/77 63.3 64.5 57.9 3450 94
Section 1 - Position 4 - Blast Furnace Slag
7/ 8/70 63.2 58.4 1044 8 3/17/71 71.1 64.3 60.0 1386 17 8/ 3/71 72.7 65.5 61.0 1386 21
11/12/71 61.6 55.4 1386 24 5/17/72 64.5 60.9 57.5 1728 31 9/ 5/72 67.4 60.8 56.9 1728 34 6/ 8/73 72.4 63.5 55.9 2222 43 6/27/74 60.4 56.5 50.2 1832 56
10/16/74 68.8 61.8 55.6 1832 60 4/24/75 66.8 61.3 54.8 3254 66 2/26/75 70.5 65.0 57.6 3254 70 4/28/76 67.8 60.8 56.2 3450 78 9/22/76 65.1 60.7 53.8 3450 83 8/ 8/77 68.7 62.8 57.6 3450 94
-59-
J-·2
Est. Acc. Tra~fic,Tg
563,000 730,000
1,197,000 1,352,000 1,893,000 2,159,000 2,689,000 2,909,000 3,409,000 3,800,000 4,604,000 5,122,000 6,260,000
251,000 563,000 130,000 854,000
1,197,000 1,352,000 1,893,000 2,689,000 2,909,000 3,409,000 3,800,000 4,604,000 5,122,000 6,260,000

TABLE X (Continued)
SKID TESTS AND TRAFFIC DATA
ROUTE 140 ST. LOUIS COUNTY
SN SN SN AADT Age in Date Tested -2Q -.lQ 40 LLane Months
Section 2 - Position 3 - Porphyry
3/17/71 72.4 63.5 57.5 1386 17 8/ 3/71 69.0 63.8 58.1 1386 21 5/17/72 62.6 56.6 53.6 1728 31 9/ 5/72 57.2 53.3 49.7 1728 34 6/ 8/73 61.4 54.2 50.6 2222 43 9/19/73 57.2 53.6 46.9 2222 47 6/27/74 61.6 56.0 51.6 1899 56
10/16/74 58.1 52.6 49.0 1899 60 4/24/75 58.0 52.9 48.6 3293 66 8/26/75 52.9 51.2 47.4 3293 70 4/28/76 56.0 54.0 51.4 3491 78 9/22/76 51. 5 48.8 46.0 3491 83 8/ 8/77 54.7 52.7 49.2 3491 94
Section 2 - Position 4 - Porphyry
7/ 8/70 59.4 53.6 1044 8 3/17/71 68.4 60.3 55.4 1386 17 8/ 3/71 66.0 58.4 55.0 1386 21
11/12/71 56.0 50.4 1386 24 5/17/72 59.1 56.1 52.4 1728 31 9/ 5/72 60.0 55.0 51.2 1728 34 6/ 8/73 63.0 54.4 49.0 2222 43 6/27/74 54.4 50.3 46.0 1899 56
10/16/74 58.5 53.4 48.2 1899 60 4/24/75 59.2 55.5 51.0 3293 66 8/26/75 60.4 56.4 51.2 3293 70 4/28/76 56.4 54.6 51.6 3491 78 9/22/76 54.2 53.2 47.6 3491 83 8/ 8/77 53.0 49.2 46.7 3491 9.4
-60-
J- 3
Est. Acc. Traffic,TR
563,000 730,000
1,197,000 1,352,000 1,893,000 2,159,000 2,701,000 2,929,000 3,438,000 3,833,000 4,647,000 5,171,000 6,323,000
251,000 563,000 730,000 854,000
1,197,000 1,352,000 1,893,000 2,701,000 2,929,000 3,438,000 3,833,000 4,647,000 5,171,000 6,323,000
\
I \
I J ~ J
J J
}
I

Figure X
EFFECTS OF TRAFFIC ON SKID NUMBERS ROUTE 140
ST. LOUIS COUNTY
100f-Seelion 1 - Position 3 - 810 s t Fu,nac e Slag 90 80
Z 70 In 60
on so 111: .
~ 40 L ~
Log SN30 1.817 - .051 (Log TR)
Log SN40 = 1. 777 -
Z ILOG - LOG RELATIONSHIPI 20 MPH ~ ~ " 'leo,,,. " .. m,o, """" o WEAR FACTOR -.094 - . 051 -.054
~ 20 S y .. .014 .020 .019 In CV (%) 1. 5 1. 7 1. 8
,2 .833 .420 .481 13 13 13
1.862 - .094 (Log TR)
6 - SN20
O - SN30
D - SN 40
10' '''''"111 1,''''''" 1 .. ",1111 '""11"' .01
100 90 80
Z 70 In 60
on so 111: . ... GI 40
~ J 30 Z 0 ~ 20 In
.1 10
ACCUMULATED TRAFFIC, TR (Millions)
Sect ion 1 - POl it ion 4 - Blast Fu rnace Slag
8 8~~B_~
A regress ion analys is ind icat •• that the sk id numb.r. are not significantly affected by a~cu",ulat.d traff ic, ther.for. t _ a depe ndabl •• ear fa ct or canno t b. calculated.
100
6-SN20
o -SN 30
o -SN 40
10' l'I"eI'II ""'11'" I . I , I,!II' 1 , ." , 1111
.01
100 90 80
Z 70 In 60
on 50 111: .
~ 40
~ J 30 Z o ~ 20 In
.1
ACCUMULATED TRAFFIC, TR (Millions)
Section 2 - Posit ion 3 - Po r p hyry
Log SN30 1 . 769 - .087 (Log TR) ____ ~
Log SN40 1.731 - .076 (Log TR)
LINEAR REGRESSION ANALYSIS ILOG - LOG RELATIONSHIPI 20 MPH ~~
WEAR FACTOR - .115 -. 087 - .076 S y .• .021 .019 .020 CV (%) 1.8 1.9 2.1 ,2 .783 .716 .619
13 13 13
10 100
6 - SN20
o -SN 30
D - SN40
10 I I " II II ' " I ! I ! I! I , " ' II ' II I , " I II ' "I " ,
.01 .1 10 100
ACCUMULATED TRAFFIC, TR (Millions)
-61-
J-4

100 90 80
Z 70 en 60
on 50 111: .
~ 40 ~ ~ 30
Q
~ 20
'"
Figure X (Continu ed)
EFFECTS OF TRAFFIC ON SKID NUMBERS ROUTE 140
ST. LOUIS COUNTY
Section 2 - Position 4 - Po r phy ry
LINEAR REGRESSION ANALYSIS (LOG · LOG RELATIONSHIP) 20 MPH ~ ~
WEAR FACTOR -.084 -.046 -.043
S y.x .019 .016 .018 CV (%) 1.8 1.9 2.1 ,2 .720 .592 .500
12 14 14
6-SN20
O-SN30
O-SN40
10' ""I" " "111111
11 ',,1111111 '""II'"
.01 .1 10 100
ACCUMULATED TRAFFIC, TR (Millions)
-62-
J-S I 1
\
I
.)
1 J
J
J
f

J
1
I 1 I 1 I I 1 I I I f
I {
K-l
ROUTE 40
ST. LOUIS COUN1Y
Distinctive Characteristics
This special asphaltic concrete pavement utilized porphyry (trap rock) as coarse
aggregate and sand as fine aggregate .
Discussion of Results
The lowest SN40 obtained on this project was 41 .8. Average SN40 was 48.
Regression analyses indicated wear factors of -0.068 and -0.077 for SN40 in position 5.
The largest range of SN for a section and position was 12.0 SN in Section 1, position
5. More than five years of testing is represented. An analysis of variance indicated no
significant differences in SN.
Description of Project
Project C096-40(9)U was an asphaltic concrete pavement (Mix #D71-338)
completed in October, 1971.
The mix contained 74.4% porphyry (100.0% _3/8"), 15.4% Missouri River sand,
5.0% mineral filler, and 5.2% asphalt (60-70). Composition of the mix, based on weight
of total mix, was 94.8% mineral aggregate and 5.2% asphalt with 28.3% +#4 and
58.3% +#10 material.
This divided six-lane pavement consisted of two sections, each 1.747 miles in
length. Section 1 was in the eastbound lane and Section 2 was in the westbound lane.
There were five tests per direction in position 2 at the test speed of 30 mph. At 40
mph and 50 mph, there were five tests per direction in each of positions, 2, 4 and 5.
Skid tests and traffic data are shown in Table XI and plotted in Figure XI.
-63-


, K-3
1 TABLE XI (Continued)
SKID TESTS AND TRAFFIC DATA
( ROUTE 40
ST. LOUIS COUNTY
I SN SN SN AADT Age in Est. Acc.
I Date Tested ---1Q 40 50 !Lane Months Traffic,TR
Section 2 - position 2 - Porphyry
J 5/31/72 47.2 39.4 9709 8 2,308,000 6/ 6/73 49.6 43.5 11665 20 6,097,000 6/27/74 43.8 38.3 10757 33 10,483,000
] 10/17/74 50.4 46.8 38.7 10757 37 11,774,000 4/21/75 52.8 47.0 44.2 11325 43 13,778,000 8/27/75 53.7 47.4 42.4 11325 47 15,137,000
I 4/28/76 55.2 48.1 42.3 12004 55 17,937,000 9/22/76 51.8 47.9 41.8 12004 60 19,737,000 8/ 8/77 54.1 48.2 46.6 12004 70 23,339,000
1 Section 2 - position 4 - Porphyry
5/31/72 45.9 40.2 13902 8 3,305,000
1 6/ 6/73 52.4 45.3 16702 20 8,730,000 6/27/74 44.5 40.3 15402 33 15,010,000
10/17/74 47.2 42.6 15402 37 16,858,000 4/21/75 48.9 48.5 16215 43 19,728,000
f 8/27/75 45.9 43.9 16215 47 21,674,000 4/28/76 48.9 45.0 17188 55 25,682,000 9/22/76 47.0 41 •. 5 17188 60 28,260,000
1 8/ 8/77 49.3 44.4 17188 70 33,417,000
Section 2 - Position 5 - PorEhyry
f 5/31/72 55.5 50.7 11799 8 2,805,000 6/ 6/73 50.7 43.1 14175 20 7,409,000 9/19/73 47.9 43.7 14175 24 9,110,000
J 6/27/74 48.2 42.6 13072 33 12,739,000 10/17/74 49.9 44.2 13072 37 14,307,000 4/21/75 46.7 43.6 13762 43 16,743,000
1 8/27/75 47.6 45.2 13762 47 18,394,000 4/28/76 50.0 46.3 14587 55 21,796,000 9/22/76 45.8 40.6 14587 60 23,948,000
{ 8/ 8/77 46.9 41.8 14587 70 . 28,361,000
j
-65-

Figure XI
EFFECTS OF TRAFFIC ON SKID NUMBERS ROUTE 40
ST. LOUIS COUNTY
100 f-Section 1 - Position 2 - Porphyry 90 80
Z 70
"" 60 .,; SO « , ... a:I 40
~ :;) 30 Z Q
~ 20
""
o \7
o~ \7 ~
A regression analysis indicat., that the skid numb.,. are not significantly affected by accumulated traffic, ther.for •• a dependable .ear factor cannot b. calculated .
O - SN30
O -SN40
\7-SN so
.1 10 100
10' I, I!'" , " I! 1,1,1 I I I . 01 I I " "I " , I " II" " ,
ACCUMULATED TRAFFIC, TR (Millions)
100f-Section 1 - Position 4 - Porphyry 90 80
Z 70
"" 60 .,; 50 « , ... a:I 40
~ ~ 30
Q
~ 20
""
o \7
o \7
A regression analysis indicate, that the skid numbers are not s ignificantly affected by accumulated traffic , ther.'or., a dependable .ear factor cannot b. calculated.
~
o -SN 40
\7 - SN so
10' I! 111,1 I II I, I' '" I" I I III I I 1'1 I III "~I III
.01 .1
ACCUMULATED TRAFFIC, TR (Millions)
100r-Section 1 - Position 5 - Porphyry 90 80
Z 70
"" 60 .,; 50 « ... a:I 40
~
~ 30
Q
~ 20
""
LINEAR REGRESSION ANALYSIS ILOG-LOG RELATIONSHIPl
WEAR FACTOR
5 y .x cv (%) r 2
~ - .071
.018 2.1
.610 10
~ -.065
.024 2.3
.419 10
10 100
o -SN 40
\7 - SN 50
10' "1"11 " 1.1111 11 " 1'11" 111 ' 1"",1111
.01 .1 10 100
ACCUMULATED TRAFFIC, TR (Millions)
-66-
K- 4
t
I I I I
I I t \
I J
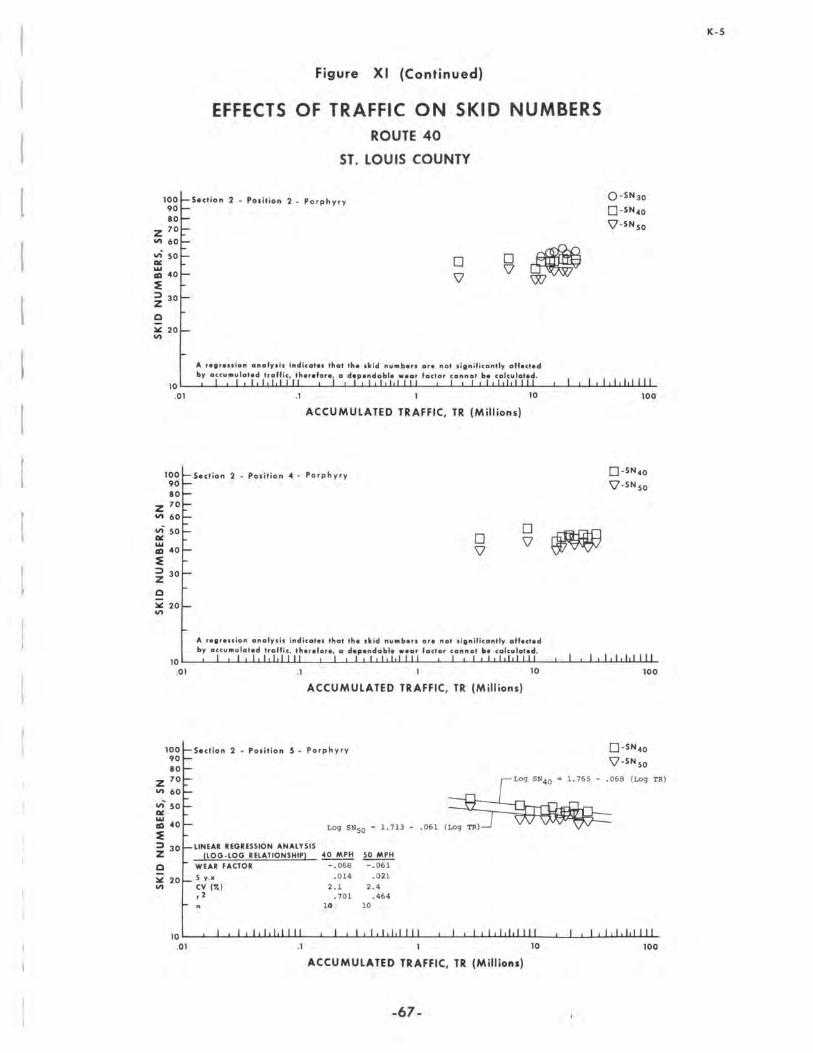
Figure XI (Continued)
EFFECTS OF TRAFFIC ON SKID NUMBERS ROUTE 40
ST. LOUIS COUNTY
100t-Seclion 2 - Position 2 - Porphyry 90 80
Z 70 CIt 60
u; 50~ 11&: . ... III 40
~ ::I 30 Z 0 loi: 20 CIt
0 \l 8~ ~
A reg,e"ion analys .. indicate. thot the ,kid numbers or. not significan.ly aff.ct.d by accumulot.d traffic, ther.for. , a dependable •• ar 'actor cannot b. calculated.
o - SN 30
D-SN 40
\7 - SN 50
10' I!'! 1.1 I 'I I! III •• I I I ,! I ,., I I II "', '" '"
.01 .1 10
ACCUMULATED TRAFFIC, TR (Millions)
100J-Seclion 2 - Position 4 - Porphyry 90 80
Z 70 CIt 60
U; 50 11&: . ... III 40
~ ::I 30 Z o loi: 20 CIt
o \l
o \7
A regression onolYl il indicat •• thot the .kid numbers or. no. lignificantly affected by accumulated traffic, th.r.for., a dependable •• ar 'actor cannot b. calculated.
~
100
o -SN 40
\l - SN 50
10' 11"11"" 111",,111 "11'1111' ","",,,
.01 .1
ACCUMULATED TRAFFIC, TR (Millions)
100l-Seclion 2 - Posilion 5 - Porphyry 90 80
Z 70 CIt 60
u; 50 11&: .
Log SNSO 1. 713 ~ 40
~ LINEAR REGRESSION ANALYSIS
!lOG-lOG RElATlONSHIPI ~ ~ ::I 30 Z 0 WEAR FACTOR -.068 -.061
loi: 20 S y .• .014 .021
CIt CV ('7.) 2.1 2.4 r2 .701 . 464
111 J 10
10 100
o - SN 40
\l-SNSO
TR)
10 I I. I! .,1 I 'I I I I! 1.1 I" ,! 1.11' '" ,,', '" '"
.01 .1 10 100
ACCUMULATED TRAFFIC, TR (Millions)
-67-
K-5

L-l
ROUTE 140
ST. LOUIS COUNlY
Distinctive Characteristics
TIris special asphaltic concrete pavement utilized porphyry (trap rock) as coarse
aggregate and blending sand as fine aggregate.
Discussion of Results
SN30 in position 3 for both sections showed significant trends of influence by
TR. Average SN30 for each section was in the 40's. An analysis of variance indicated
a significant difference between positions 2 and 3 of each section. In this case, distribution
of traffic per lane was probably incorrectly assumed as being equal.
Description of Project
Project C09(r140(2)U was an asphaltic concrete pavement (Mix #C69-l04)
completed in September, 1969.
The mix contained 80.2% porphyry (99.7% -1/2"), 11.0% blending sand, 3.6%
mineral filler and 5.2% asphalt (60-70). Composition of the mix, based on weight of
total mix, was 94.8% mineral aggregate and 5.2% asphalt with 0.2% +1/2" and 51.9% +#10
material.
Two sections of the four lane divided pavement (each 2.118 miles in length)
were tested. Section 1 was in the southbound lane and Section 2 was in the northbound
lane. Each section had five tests in each lane for each test speed. Tests were performed
in positions 2 and 3.
Skid tests and traffic data are shown in Table XII and plotted in Figure XII.
-68-
1
1 J
1
I "1
J
I t

TABLE XII
SKID TESTS AND TRAFFIC DATA
ROUTE 140 ST. LOUIS COUNTY
SN SN AADT Date Tested 20 30 LLane
Section 1 - Position 2 - Porphyry
7/13/70 50.1 39.4 6488 5/31/72 55.8 46.9 6962 6/ 6/73 54.2 48.3 7200 6/25/74 49.0 44.4 7108
10/17/74 48.4 43.2 7108 4/24/75 54.2 48.3 8450 8/27/75 48.7 43.9 8450 4/30/76 49.6 47.6 8957 9/21/76 39.7 39.1 8957 5/12/77 49.8 44.6 8957 8/ 8/77 44.9 42.2 8957
Section 1 - position 3 - Porphyry
5/31/72 59.7 57.9 6962 6/ 6/73 55.2 50.0 7200 9/17/73 54.0 47.5 7200 6/25/74 53.1 47.5 7108
10/17/74 52.9 48.0 7108 4/24/75 56.0 50.3 8450 8/27/75 47.9 44.4 8450 4/30/76 51.1 48.1 8957 9/21/76 46.7 43.8 8957 8/ 8/77 46.8 45.7 8957
Section 2 - position 2 - Porphyry
7/13/70 54.5 45.2 6488 5/31/72 55.0 45.0 7368 6/ 6/73 55.1 48.5 7809 6/25/74 51. 2 45.9 6659
10/17/74 50.0 44.8 6659 4/24/75 56.2 48.6 7124 8/27/75 48.5 45.4 7124 4/30/76 51. 5 49.6 7552 9/21/76 45.9 40.4 7552 5/12/77 50.0 41.6 7552 8/ 8/77 46.7 43.6 7552
-69-
Age in Months
10 33 45 58 62 68 72 80 85 92 95
33 45 49 58 62 68 72 80 85 95
10 33 45 58 62 68 72 80 85 92 95
L-2
Est. Acc. Traffic,TR
1,946,000 6,580,000 9,122,000
11,913,000 1Z,766,000 14,206,000 15,220,000 17,309,000 18,653,000 20,534,000 21,340,000
6,580,000 9,122,000 9,986,000
11,913,000 12,766,000 14,206,000 15,220,000 17,309,000 18,653,000 21,340,000
1,946,000 6,714,000 9,432,000 12,271~000 13,070,000 14,324,000 15,179,000 16,940,000 18,073,000 19,659,000 20,339,000

L-3 1
TABLE XII (Continued ) 1 SKID TESTS AND TRAFFIC DATA
ROUTE 140 J ST. LOUIS COUNTY
~ SN SN AADT Age in Est. Acc. J Date Tested ~ 30 LLan~ Months Traffic,TR
Section 2 - position 3 - Porphyry ~I
5/31/72 62.4 54.3 7368 33 6,714,000 6/ 6/73 55.4 49.3 7809 45 9,432,000 9/17/73 53.1 47.7 7809 49 10,369,000 6/25/74 53.8 48.4 6659 58 12,271,000
10/17/74 53.6 48.8 6659 62 13,070,000 4/24/75 57.1 50.8 7124 68 14,324,000 8/27/75 47.9 44.5 7124 72 15,179,000 4/30/76 52.2 48.8 7552 80 16,940,000 9/21/76 46.5 43.6 7552 85 18,073,000 8/ 8/77 51.1 47.3 7552 95 20,339,000
J
-70-
!

Figure XII
EFFECTS OF TRAFFIC ON SKID NUMBERS ROUTE 140
ST. LOUIS COUNTY
100J-Section I • Position 2 -Porphyry 90 80
Z 70
:::t 6 Go: .
~ 40 0
6e~ o~
~ :l 30 Z C
loI: 20 ."
A regression onalysi. indicat •• thot the ,kid numbers are not lignificontly aff.cted by accumulated traffic , ther.fore, a dependable wear 'actor cannot b. calculated.
6-SN20
o -SN 30
10' I! I! I, I II I! IIIII I I I I!' 'I! I I! I I, I, I, I I II
.01 .1
ACCUMULATED TRAFFIC, TR {Millions}
100l-Section I - Position 3 -Porphyry 90 80
10 100
6-SN20
o -SN 30
Z 70 ." 60
.,,- 50
~~ 1. 940 - . 201 (Log
Go:
~ 40
Log SN30 1 . 880 - . 178 (Log TR)-.-!~
~ :l 30 Z
LINEAR REGRESSION ANALYSIS (LOG-LOG RELATIONSHIP) 20 MPH ~
C WEAR FACTOR - . 201 - .178
loI: 20 ."
S y .x . 018 .022 cv ('7.) 2.0 2. 2 r2 .765 . 638
10 10
10' I! III, I I II I 1111,1 I I I I, 1.111 I! I I, I, I. I I II
.01
100 90 80
Z 70 ." 60
.,,- 50 Go: ... lID 40
~ :l 30 Z C loI: 20 ."
.1 10
ACCUMULATED TRAFFIC, TR {Millions}
Section 2 - Position 2 - Porphyry
6 o
66~ OO~
A regression analysis indicate. that the skid numbers or. not significDntly affected by accumulated traffic, ther.fore, a dependoble .eor factor cannot b. calculated.
100
6-SN20
o -SN 30
10' I! I!'" I II I! I! 1.1 II I I! II! I'" I, I! " I I I I
.01 .1 10 100
ACCUMULATED TRAFFIC, TR {Millions}
-71-
L-4
TR)

100 96 80
Z 70 II> 60
11>- 50 a:: . ~ 40 ~ ;:) 30 Z Q
~ 20 II>
Figure XII (Continued)
EFFECTS OF TRAFFIC ON SKID NUMBERS ROUTE 140
ST. LOUIS COUNTY
Section 2 - Position 3 - Po rphyry
LINEAR REGRESSION ANALYSI S
Log SN20 = 1.942 - .195 (~ .. /\
Log SN30 = 1.827 - . 129 (Log TR)~ (LOG - LOG RELATIONSHIP) 20 MPH ~
WEAR FACTOR -.195 -.129
S y .•
cv ('1.) ,2
. 025 .021 2.0 2.2
. 595 .47 5 10 10
6-SN20
o - SN 30
10' " ,! I" " "" '" "! ,!, "" '" "" '" '" .01 .1 10 100
ACCUMULATED TRAFFIC, TR (Millions)
-72-
L·S I 1 I 1
1
J
~
I f
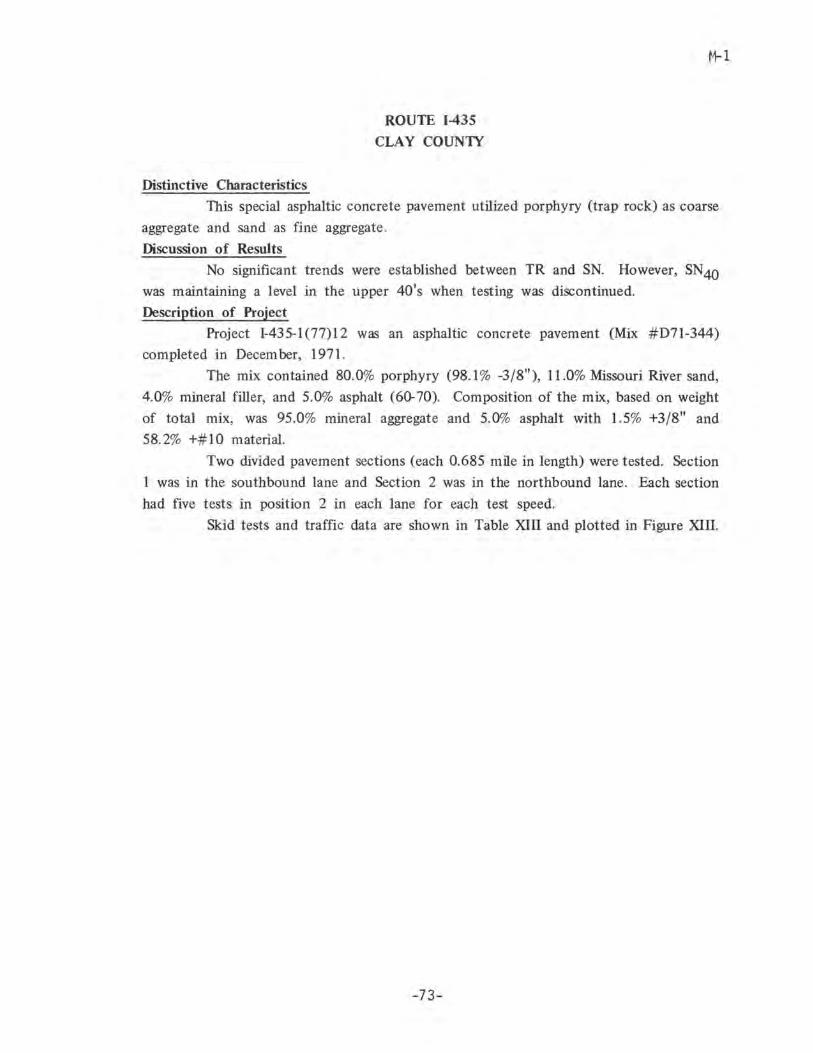
Distinctive Characteristics
ROUTE 1-435
CLAY COUN1Y
M-l
This special asphaltic concrete pavement utilized porphyry (trap rock) as coarse
aggregate and sand as fine aggregate.
Discussion of Results
No significant trends were established between TR and SN. However, SN40 was maintaining a level in the upper 40's when testing was discontinued.
Description of Project
Project 1-435-1(77)12 was an asphaltic concrete pavement (Mix #D7l-344)
completed in Decem ber, 1971.
The mix contained 80.0% porphyry (98.1 % -3/8"), 11.0% Missouri River sand,
4.0% mineral filler, and 5.0% asphalt (60-70). Composition of the mix, based on weight
of total mix, was 95.0% mineral aggregate and 5.0% asphalt with 1.5% +3/8" and
58.2% +# 1 0 material.
Two divided pavement sections (each 0.685 mile in length) were tested. Section
1 was in the southbound lane and Section 2 was in the northbound lane. Each section
had five tests in position 2 in each lane for each test speed.
Skid tests and traffic data are shown in Table XIII and plotted in Figure XIII.
-73-

TABLE XIII
SKID TESTS AND TRAFFIC DATA
ROUTE 1-435 CLAY COUNTY
SN SN SN SN AADT Age in Date Tested --iQ --2Q ~ --IQ /Lane Months
Section 1 - Porphyry
11/ 2/72 5/ 2/73
10/23/74 4/10/75 9/24/75
55.8 45.3 53.0 49.2 50.8 43.7 53.3 49.4 48.2 45.6
44.0 39.8 46.3 43.6
Section 2 - Porphyry
11/ 2/72 5/ 2/73
10/23/74 4/10/75 9/24/75
58.3 51.2 47.9 45.8 52.5 52.4 47.3 46.7 50.3 43.2 53.4 48.8 49.8 47.3
-74-
4658 5552 5552 5774 5774
4658 5552 5552 5774 5774
11 17 35 40 46
11 17 35 40 46
M-2
Est. Acc. Traffic,TR
1,537,000 2,483,000 5,481,000 6,334,000 7,373,000
1,537,000 '2,483,000 5,481,000 6,334,000 7,373,000
I I i I 1 1 I
J
J
!

100 90 80
Z 70 on 60
.,; 50 "". = 40 ~ ::I 30 Z Q
~ 20 on
Figure XIII
EFFECTS OF TRAFFIC ON SKID NUMBERS ROUTE 1-435
S.ction 1 - Porphyry
CLAY COUNTY
o \l 9 ~
O-SN40
\7-SN so
10 I I '"'''' I II I I " "" I I I I I " "" I I I ! I .. "" II I .01 .1 10
ACCUMULATED TRAFFIC, TR (Millions)
lOOr-Section 2 - Porphyry 90 80
Z 70 on 60
.,; 50 "" . ... dI 40
~ ::I 30 Z Q
~ 20 on
8 0 ~
A regression analysis indicat., thot the skid numb.,. or. not significantly affected by occuml.!la •• d _tr~f.ic; , ... her.fore,,- a d~p.ndabl ••• or 'actor cann.' b. calculated.
100
D-SN.4o
\7-SN so
10' 1,I"d'" 1"""'" I!ldllill 111""111
.01 .1 10 100
ACCUMULATED TRAFFIC, TR (Millions)
-75-
M-3

Distinctive Characteristics
ROUTE FF
JASPER COUNTY
N-l
This special plant mix bituminous pavement utilized flint chat as coarse aggregate
limestone screenings as fine aggregate.
Discussion of Results
SN40 averaged around 50 to 55. No significant trends were established with
TR but an analysis of variance indicated a significant difference between sections.
Description of Project
Project C049-FF(l)M was a plant mix bituminous pavement (Mix #BP75-49M)
completed in May, 1975.
The mix contained 75.cY'!o Joplin flint chat (lOcY'!o -1/2"), 25 .cY'!o Warsaw
limestone screenings, and 6.5% asphalt (85-100). Composition of the mix, based on weight
of total mix, is 93.9% mineral aggregate and 6.1% asphalt with 14.8% +#4 and
39.2% +#10 material.
Three undivided pavement sections (2.141, 2.516, and 2.516 miles in length)
were tested. Each section had five tests in position 2 in each direction for each test
speed.
Skid tests and traffic data are shown in Table XIV and plotted in Figure XIV.
-76-
I I ,
I I
1 j
! j
!

J
I I I I f
I I I I
I f
,
TABLE XIV
SKID TESTS AND TRAFFIC DATA
ROUTE FF JASPER COUNTY
SN SN SN AADT Date Tested -1Q 40 --2Q /Lane
Section 1 - Flint Chat
10/ 7/75 55.0 48.2 42.8 415 4/15/76 54.4 51.3 49.0 517 9/ 1/76 55.8 50.8 47.1 517 4/ 5/77 55.3 49.6 46.4 517 8/18/77 54.6 48.8 45.8 517
Section 2 - Flint Chat
10/ 7/75 55.4 47.6 42.8 390 4/15/76 55.0 53.4 49.2 476 9/ 1/76 59.2 54.4 49.9 476 4/ 5/77 57.1 52.4 48.8 476 8/18/77 57.7 52.2 47.5 476
Section 3 - Flint Chat
10/ 7/75 58.2 52.0 46.4 390 4/15/76 59.0 56.7 54.1 476 9/ 1/76 63.4 57.8 53.8 476 4/ 5/77 59.7 55.5 51.5 476 8/18/77 60.6 56.1 52.4 476
-77-
Age in Months
5 11 16 23 28
5 11 16 23 28
5 11 16 23 28
N-2
Est. Acc. Traffic,TR
62,000 146,000 224,000 332,000 410,000
58,000 136,000 208,000 308,000 379,000
58,000 136,000 208,000 308,000 379,000

Figure XIV
EFFECTS OF TRAFFIC ON SKID NUMBERS ROUTE FF
JASPER COUNTY
100l-Section 1 - Flint Chat 90 80
Z 70 II) 60
on 50 111: . III lID 40
~ ;:) 30 Z o ~ 20 II)
o o \l
® § ~@
O-SN30
O-SN40
\7-SN so
A r.or."ion analysis indicat •• that the ,kid numb.,. are no' .ignificantly affected by accu ... ulat.dtraffi~ • . ,her.for.,_ a dependable .ear factor cannot b. calculat.d.
10 1 11.1.1.1111 , I! 1.1,1 III II,I,I.!I!I I ,! I. I., III
.01
100 90 80
Z 70 II) 60
on 50 111: .
~ 40
~ ;:) 30 Z o ~ 20 II)
.1
Section 2 - Flint Chat
o o \7
10
ACCUMULATED TRAFFIC, TR (Millions)
@ ® 00
A regression analysis indica ••• that the ,kid numbers are not significantly affected by accumulated traffic, ther.for., a dependable .ear factor cannot b. calculated.
100
o -SN 30
O-SN40
\7- SN so
10' ,"",1111 ,1"".1111 '''''''"1 ,1"""'11 .01
100 90 80
Z 70 II) 60
on 50 111: .
~ 40
~ ;:) 30 Z o ~ 20 II)
.1 10
ACCUMULATED TRAFFIC, TR (Millions)
Section 3 - Flint Chat
8 @ § 00 \l
A regr ... ion analysis ind ica ••• thot the skid numb.,. are no. significantly affected by a~cu",ulat~d _traffic , ther.for., a dependable .ear factor cannot b. calculated .
10 1 I. 1,1,1 I II . 01 '1.,1,' 'II 1.leldill
.1 10
ACCUMULATED TRAFFIC, TR (Millions)
-78-
100
O - SN30
O-SN40
\7- SN so
','''d'" 100
N-3 I J
1 -1
I
j

Distinctive Characteristics
ROUTE 160
GREENE COUNTY
~-1
This project involved the use of three special plant mix bituminous pavements.
As placed in 1970, the mixes involved three aggregate combinations: (1) limestone as
coarse aggregate and flint chat sand as fine aggregate, (2) limestone and flint chat as coarse
aggregate and flint chat sand as fine aggregate, and (3) flint chat as coarse aggregate and
limestone screenings as fine aggregate, In 1975, all three of the 1970 mixes were overlaid
with a mix of a design identical to aggregate combination (1) above, with limestone as
coarse aggregate and flint chat sand as fine aggregate.
Discussion of Results
It appeared after the first few months, the skid resistance of the mixes had
dropped to a level that it maintained fairly welL The mix with Burlington limestone
and Joplin flint chat sand appeared to have a breaking point with AADLT some place
between 1 000 and 2000" The other two mixes did not show any breaking points with
AADLTo The last resurfacing mix of Burlington limestone and Joplin flint chat sand
did not indicate the same results as the earlier mix even though the mix designs were
identical. However, it was found the later mix contained a higher percentage of minus
#200 material than was specified. Skid resistance averaged about 10 SN lower in the
AADLT ranges which were previously tested. The higher AADLT areas showed even lower
SNo Mixes which utilized flint chat as all or part of the coarse aggregate tend to be
capable of maintaining SN~& of around 50 or higher with AADLT of up to 4000.
Description of Project
Project C039-l60( 6)M involved three plant mix bituminous pavements (Mixes
#BP70-121M, BP70-124M, and BP70-l27M) completed in November, 1970.
Mix #BP70-l27M, (Sections 1, 2, 3 and 4) contained 85.0% Burlington limestone,
1500% Joplin flint chat sand (89.4% -#10), and 53% asphalt (85-100). Composition of
the mix, based on weight of total mix, was 95 ,0% mineral aggregate and 5.0% asphalt
with 30.5% +#4 and 46,9% +#10 material"
Mix #BP70-124M (Sections 5 and 6) contained 45.0% Burlington limestone,
4000% Joplin flint chat (99.4% -1/2"), 15 .. 0% Joplin chat sand (89.4% -#10), and 6.0%
asphalt (85-100)0 Composition of the mix, based on weight of total mix, was 94.3%
mineral aggregate and 507% asphalt with 0,2% +I/t' and 51.7% +#10 material.
Mix #BP70-121M (Section 7), contained 72.0% Joplin flint chat (99.4% _1/2"),
28.0% Burlington limestone screenings (9909% -#10), and 6.0% asphalt (85-100).
Composition of the mix, based on weight of total mix, was 94.3% mineral aggregate and
5.7% asphalt with 0.4% +1/2 11 and 4705% +#10 material.
-79-

0-2
Project C039-160(7)M involved a plant mix bituminous pavement (Mix
#BP75-7M) completed in April, 1975. This project overlaid all of Project C039-160(6)M.
Mix #BP75-7M contained 85.0% Burlington limestone, 15.0% Joplin flint chat
sand (89.4% -#10), and 5.0% asphalt. Composition of the mix, based on weight of total
mix, was 95.0% mineral aggregate and 5.0% asphalt with 30.5% +#4 and 46.9% +#10
material.
Seven undivided sections (2.161, 3.644, 3.644, 1.164, 0.630, 1.200, and 4.061
miles in length) were tested. Each section had five tests in each direction for each test
speed except for tests performed on 7-18-75, which were performed as part of the primary
system inventory. In that case, the number of tests per section varied. All tests were
performed in postion 2.
Skid tests and traffic data are shown in Table XV-A and plotted in Figure XV
for Project C039-160(6)M. For Project C039-160(7)M, the skid tests and traffic data
are shown in Table XV-B and plotted in Figure XV.
-80-
I I I
1
1
J
J

Date Tested SN
TABLE XV-A
SKID TESTS AND TRAFFIC DATA
SN
ROUTE 160 GREENE COUNTY
SN SN SN AADT ~~~~~/Lane
Section 1 - Limestone and Flint Chat Sand
11/16/70 64 . 1 66.0 60.6 685 3/10/71 64.5 61. 7 732 7/13/71 54.8 50.0 732
10/13/71 62.4 53.4 48.0 732 3/14/72 53.4 48.5 780 6/27/72 54.4 48.2 780
11/ 9/72 54.8 49.6 780 4/11/73 67.8 56.2 47.1 802 2/21/74 68.0 58.9 53.0 720
10/ 3/74 64.3 54.5 46.9 720 4/ 3/75 67.6 54.8 50.8 748
Section 2 - Limestone and Flint Chat Sand
11/16/70 65.5 58.4 59.4 800 3/10/71 67.5 63.4 54.4 865 7/13/71 53.0 51.2 43.4 865
10/13/71 64.9 50.6 47.5 41.6 865 3/14/72 57.2 49.0 42.8 930 6/t.7/72 51.9 48.8 40.0 930
11/ 9/72 50.8 43.4 40.2 930 4/17/73 51.0 44.1 38.2 1023 2/26/74 54.4 54.4 43.3 1013
10/ 3/74 47.6 43.6 1013 4/ 3/75 57.4 53.6 44.1 1008
Section 3 - Limestone and Flint Chat Sand
11/16/70 66.9 67.1 56.5 1020 3/10/71 66.8 65.6 63.1 53.7 1040 7/13/71 53.4 50.7 45.8 1040
10/13/71 52.7 46.5 43.7 1040 3/14/72 56.6 50.1 42.7 1060 6/27/72 52.6 48.6 42.1 1060
11/ 9/72 50.6 43.5 39.2 1060 4/17/73 51.2 47.2 38.8 1050 2/26/74 53.4 939
10/ 3/74 54.8 48 '0,8 44.8 939 4/ 3/75 57.0 52.2 45.1 961
-81-
0- 3
Age in Est. Acc. Months Traffic,TR
1 21,000 4 85,000 8 173,000
11 239,000 16 351,000 20 445,000 24 539,000 30 682,000 40 917,000 47 1,069,000 53 1,201,000
1 24,000 4 100,000 8 204,000
11 282,000 16 415,000 20 527,000 24 638,000 30 817,000 40 1,123,000 47 1,336,000 53 1,518,000
1 31,000 4 124,000 8 248,000
11 342,000 16 499,000 20 626,000 24 754,000 30 943,000 40 1,252,000 47 1,449,000 53 1,620,000

-82-
f

1
I I I 1
1
I 1 )
J
J
I J
f
I j
j
Date Tested SN
TABLE XV-A (Continued)
SKID TESTS AND TRAFFIC DATA
SN
ROUTE 160 GREENE COUNTY
SN SN SN MDT _ --2Q.._~ ~ ~ ~ /Lane
Age in Months
Section 7 - Limestone Screenin~ and Flint Chat
11/17/70 69. 2 63.6 62.5 2033 1 3/10/71 66.0 62.2 52.5 2248 4 7/13/71 54.8 52.9 46.7 2248 8
10/14/71 66.3 53.8 50.1 45.2 2248 11 3/14/72 57.0 51.6 44.8 2464 16 6/27/72 59.2 54.4 50.5 2464 20
11/ 9/72 59.0 53.8 48.0 2464 24 4/17/73 61.2 55.0 51.5 3102 30 2/27/74 71.6 63.4 58.1 53.4 4029 40
10/ 3/74 60.8 53.6 51.0 4029 47 4/ 3/75 60.6 55.5 51.2 3984 53
-83-
0-- 5
Est. Acc. Traffic,TR
61,000 257,000 527,000 729,000
1,079,000 1,375,000 1,670,000 2,191,000 3,177,000 4,023,000 4,744,000


1
1
1
1
1
1
1
1
I ]
1 ]
1
J
J
f
I j
j
Figure XV
EFFECTS OF TRAFFIC ON SKID NUMBERS ROUTE 160
GREENE COUNTY
100J-SeClion I -limest o n e end Flint Chat Sand 90 80
Z 70
'" 60
'" SO Do: ... m "[ q", "'.0 UOO - .on ,~. ,,: ~ ;:) 30 LINEAR REGRESSION ANALYSIS Z jLOG-LOG RELATIONSHIP! 20 MPH ~ ~ o WEAR FACTOR -.038 - . 073
~ 20 S y.x .023 .031 '" CV (%) 1.9 2 . 1
,2 .450 .630 • 11 11
A regression analysis indicote, that the skid numbers ore not significantly affected
6-SN20
o .SN JO
O - SN40
by accumulated traffic, ther.for., a dep e ndable wear factor cannot b. calculated. 10\ \,\,\,\"01\11 \1\, \ .1.1.111\ 1,111.1.101111 1.!0I01111
.01.1 10 100
ACCUMULATED TRAFFIC, TR (Millions)
100~SeClion 2 - Lim es ton e and Fl i nt Ch a t Sa nd 90 80
Z 70~ n ,-Log SN,c 1.709 - .068 (Log TR)
'" 60
'" so Do:
:::: 40
~ i 30
0
~ 20
'"
Log SN60 = 1 .569 -LINEAR REGRESSION ANALYSIS
jLOG . LOG RELATIONSHIP! WEAR FACTOR
S y .x
cv (%) ,2
40 MPH -:-:068
.032 2 . 0
. 598 11
50 MPH 60 MPH --:-:-59l -=-:TIT
.027 .021 2 . 2 2.4 Log SNSO 1. 648 - . 091 (Log TR )
.783 . 922 11 8
O-SN40
\7 ·SN 50
O·SN60
101 '''''''III '''''''"I ''''''''II ,,,",1111
Z
.01
100 90
.1 10
ACCUMULATED TRAFFIC, TR (Millions)
Section 3 -Li m eston e and Fl int Cha t Sand
TR)
100
O - SN40
\7 -SN 50
O - SN60
'" Log SN40 1.712 - . 0 75 (Log TR) ",' so Do: ... CO 40
~ i 30
Log SN60 = 1 .591 - . 117 (Log
LINEAR REGRESSION ANALYSIS jLOG-LOG RELATIONSHIP! 40 MPH
o WEAR FACTOR
~ 201- S y.x '" I cv (%)
,2
10' I, '1'1'1 II
- .07 5 .023
1.9 .766
11
~ 60 MPH
-.109 -.117
.026 . 016 2.1 2.3
.844 .936 11 8
I I I ", I I II .01 I I ,,1,1 J I I
.1 10
ACCUMULATED TRAFFIC, TR (Millions)
-85-
''''''''ll 100
0-7

Figure XV (Continued)
EFFECTS OF TRAFFIC ON SKID NUMBERS ROUTE 160
GREENE COUNTY
100l-Section 4 -limestone and Flint Chat Sand 90 80
Z 70~ ,Log SN40 = 1.665 - .117 (Log TR)
." 60
.,,- 50
O-SN30
o -5N 40
\7-SN so O-SN60
111: .
~ 40 SN50 1.623 - .136 (Log TR)
~ :;) 30 Z 0 ~ 20 ."
Log SN60 = 1. 526 - .041 (Log TR)
LINEAR REGRESStON ANALYStS (LOG-LOG RELATIONSHIP) ~
WEAR FACTOR
s y .x cv (%) ,2
-.117
.035 2.3
50 MPH 60 MPH -::-:l36 -::le9-----
.028 .041 2.5 2.9
.778 .892 .861 n 11 10 8 • A regression analysis indicote. thot the skid numbers are not significantly aff.cted
by o.ccumulated traffic, ther.for., a dependable wear factor cannot b. calculat.d.
10' ''''''''" '''''''III '''''''''' '''''''III .01 .1 10
ACCUMULATED TRAFFIC, TR (Millions)
100.l-Section 5 - Limestone , Flint Chat, and Flint Chat Sand 90 80
Z 70 ." 60
'" 50 111: . ... UI 40
~ :;) 30 Z o ~ 20 ."
Log SN40 1.706 - .070 (Log TR)
LINEAR REGRESSION ANALYSIS (LOG-LOG RELATIONSHIP) 20 MPH ~ ~ ~
WEAR FACTOR - . 041 -.070
s y.x CV (%) ,2
n
. 021 1. 8
.553 11
.030 2.1
. 632 11
(Log TR)
• A regression analysis indicate. that the skid numbers at. not significantly affected by accumulated traffic, ther.for., a dependable wear factor cannot b. calculated.
100
6-SN20
o -SN30
o -SN40
\7- SN so
10' '''''''III '''''til!! '''''dill '''''1111' .01
100 90 80
Z 70 ." 60
.,,- 50 III:
~ 40
~ ~ 30
0 ~ 20 ."
.1
ACCUMULATED TRAFFIC, TR (Millions)
Section 6 - Limestone, Flint Chat , and Flint Chat Sand
Log SN40 = 1. 710 -
~ 0
0
LINEAR REGRESSION ANALYSIS (LOG-LOG RELATIONSHIP) 20 MPH ~ ~ ~ 60 MPH
WEAR FACTOR -.062
s y.x CV (%) ,2
.025 2.1
.692 11
10
-A regression analysis indicates that the skid numbers are not significantly affected by accumulated traffic. therefore. a dependable wear factor cannot be calculated.
100
6-SN20
o -SN 30
D-SN40
\7 -SN SO
O-SN60
.1 10 100
10' ,,', ,,' , " ",.1,1 I " I I 1,1.1 I II .01 I" "II III
ACCUMULATED TRAFFIC, TR (Millions)
-86-
0-8 1
1
1
J
]
]
J
J J

1
I I )
J
I J
I J
I I I
J
1
Figure XV (Continued)
EFFECTS OF TRAFFIC ON SKID NUMBERS ROUTE 160
GREENE COUNTY
100rSection 7 - Lim es tone Scr ee n in g a nd Fl i n t C hat 90 80
Z 70
'" 60 ",' 50 eII: . ... ~ 30 lINEA~ REGRESSION ANALYSIS
(Log TR)
o - SN 30
O-SN40
\J -SN so
(>- SN60
~ 'l ~' '"" . L'" - .m ,~, '"
Z !LOG - LOG RELATIONSHIPI ~ o WEAR FACTOR
~ SO MPH ~ Log SN50 1.726 - . 053 (Log TR)
- .052 - .053 -.124
~ 20 S y .• V> CV (% )
,2
.025 .025 .009 1.9 2.0 2.0
.606 .611 .984 n 11 11 ·A regression analysis indicat., that the ,kid numb. r, are not significantly aff.cted
by accumulated traffic , ther.for., a dependable wear factor cannot b. calculat.d . 10' I! 111.1 I II I I I , II! I I I I I I IIII I II I, I, III I II
.01
100 90 80
Z 70
'" 60
." 50 ell:
~ 40
~ ~ 30
0 ~ 20 V>
.1 10
ACCUMULATED TRAFFIC, TR (Millions)
Section 1 A - limestone and Flint Chat San d
o
66 o DO o
A regfession analy s is indicate, that the , kid number s or . not significantly affected ~Y accumulated traffic , ther.fore, a dependable .eor fo ct o r cannot b. calculated .
100
6 - SN20
0 - SN30
O - SN40
10'
I.',I,! " '" 1 ''''" 1111111111 ' 1 ""1111
.01 .1 10
ACCUMULATED TRAFFIC, TR (Millions)
100~Se(tion 2 A - l i m es ton e ond Fl i nt Chat Sa nd 90 80
Z 70
'" 60
E'l CO 40
~ ::;) 30 Z 0 ~ 20 V>
0
DO 0 \78
A regression analysis inditates that the ski d number s a re not s ignif itontly affected by accumulated traffic , therefore, a dependable wear factor cannot be coltulat.d .
100
0 - SN 30
O-SN40
'V - SN 50
10 1 I I I,I,! I II I I I I 1,1,111 I II I I I I I I I IIII I II I' I I III I II
.01 .1 10 100
ACCUMULATED TRAFFIC, TR (Millions)
-87 -
0-9
•
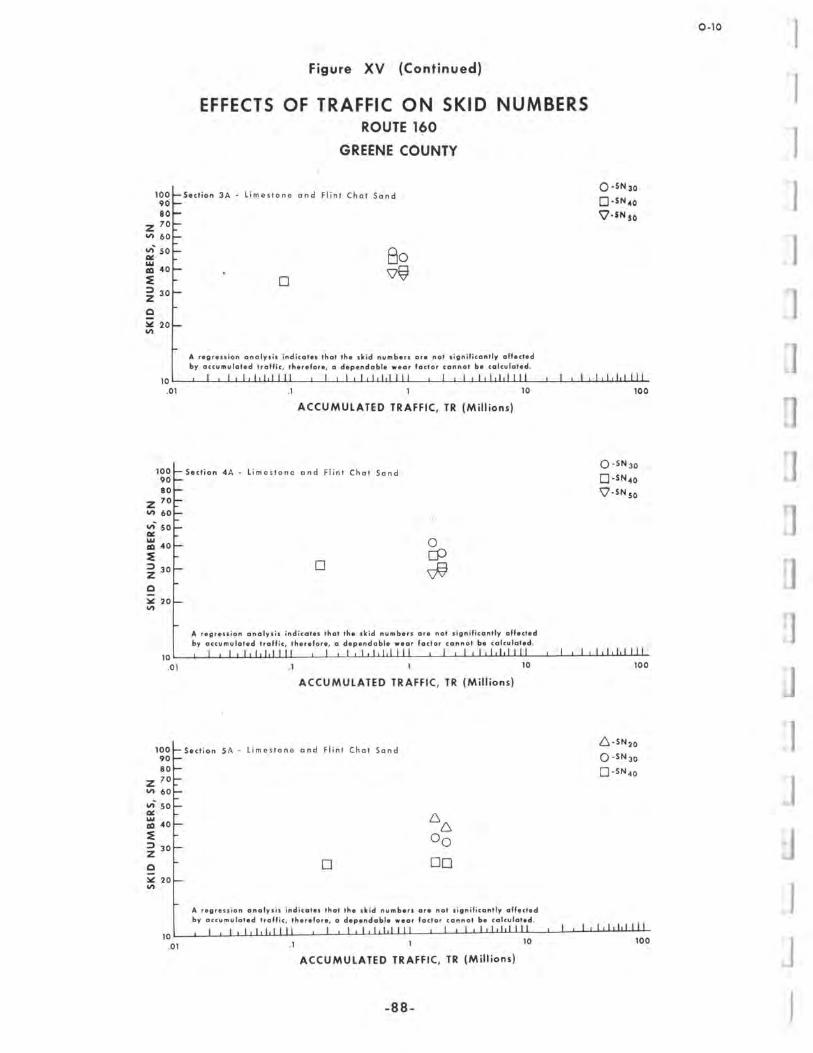
Figure XV (Continued)
EFFECTS OF TRAFFIC ON SKID NUMBERS ROUTE 160
GREENE COUNTY
100l-Section 3A - Limestone and Flint Chat Sand 90 80
Z 70 III 60
~ "~ ~ . .., UI 40
~ ;:) 30 Z Q
~ 20 11\
80
0 \7~
A regression analysis ind icate, thot the skid numbers ar. no. significan.ly affected by accumulated traffic , ther.for. , a dependable .ear foctor cannot b. calculated.
0-SN30
D-SN40
\7- SN so
10' 1,,""'11 ''''''''" '''''''III '''''''''' .01 .1 10
ACCUMULATED TRAFFIC, TR (Millions)
100.1- Section 4A - Limestone and Flint Chat Sand 90 80
Z 70 III 60
111- SO
~ .. ~ ;:) 30 Z Q
~ 20 11\
0
0 c::P ~
A regression analysis indicate, thot the skid numbers are no. significDntly affected by accumulated traffic , ther.for., Q dependable .ear factor cannot b. calculated .
10 1 1.1.1.1 I II . 01 I. 1.101 I II '''''''III .1 10
ACCUMULATED TRAFFIC, TR (Millions)
1001- Section SA - Limestono and Fl int Chat Sand 90 80
Z 70 III 60
.,; SO
~. ~ 66 ; 40
;:) 30 00
Z Q 0 00 ~ 20 11\
A r.grenion analysis indicates that the skid numbers or. not significantly affected by accumulated traffic , ther.fore, a dependable .eor factor cannot be calculated .
100
o -SN 30
D-SN40
\7-SN 50
I , I , "I I "
100
6-SN20
o -SN JO D-SN 4o
10 1 I, 1,1,1 I II , I, 1,1,1 I II I, 1,1,1 III 1'1'1'1 III
.01.1 10
ACCUMULATED TRAFFIC, TR (Millions)
-88-
0-10 1
1 ]
]
J
J J

I
I I )
I I I I J
J
j
Figure XV (Continued)
EFFECTS OF TRAFFIC ON SKID NUMBERS ROUTE 160
GREENE COUNTY
100l-Section 6A - Limestone and Flint Chat Sand 90 80
Z 70
'" 60 ",' SO rtf!
;l :I 30 Z 0 ~ 20
'"
6. 6.
00 0 0
0
A regr.nion analysi. indicat •• that the ,kid numb.r. or. not significantly affected by accumulated traffic, th.r.fore, a dependabl •• ear factor cannot b. calculated.
6.-SN20
o - SN 30
o -SN 40
10 I I I I I I, I I (I I ! I , I! I I II I I I ! "I I II I , I , II I I II
.01 .1 10
ACCUMULATED TRAFFIC, TR (Millions)
100l-Section 7A -Limestone and Flint Chat Sand 90 80
Z 70
'" 60 vi SO rtf! ...
~l :I 30 Z 0 ~ 20
'"
0 0 [p
~
A regr .. ,ion analysis indicat., that the ,kid numb.,. or. not lignificontly affected by accumulat.d traffic , th.r.fore, a dependable •• ar factor connot b. calculated .
100
o - SN JO
o -SN 40
\7 -SN SO
10' ,,11111111 '1'11,1111 '11,111111 ""1"',,
.01 .1 10 100
ACCUMULATED TRAFFIC, TR (Millions)
-89-
0-11

Distinctive Characteristics
ROUTE 160
DADE COUNTY
P-l
This special plant mix bituminous pavement utiHzed limestone as coarse aggregate
and flint chat sand as fine aggregate
Discussion of Results
Since this mix is identical to one of the mixes on Route 160, Greene County,
it's merit should be considered in the same manner as suggested in the Discussion of
Results for that project .
Description of Project
Project C029-39(5)M is a plant mix bituminous pavement (Mix #BP72-80M)
completed in June, 1972.
This mix contained 85 .0% Burlington limestone, 15.0% Joplin flint chat sand
(89.4% -#10), and 53% asphalt (85-100). Composition of the mix, based on weight
of total mix, was 95.0% mineral aggregate and 5.0% asphalt with 30.5% +#4 and
46.9% +# 1 0 material.
One undivided pavement section (4.000 miles in length) was tested. The section
had five tests in position 2 in each direction for each test speed.
Skid tests and traffic data are shown in Table XVI and plotted in Figure XVI.
-90-
I 1
)
I
J
I

J
I I 1
I J
I
I
TABLE XVI
SKID TESTS AND TRAFFIC DATA
ROUTE 160 DADE COUNTY
SN SN SN MDT Age in Date Tested 30 40 50 LLane Months
Section 1 - Limestone and Flint Chat Sand
6/27/72 60.0 58.8 55.5 650 1 11/ 9/72 55.0 50.0 46.2 650 5 4/17/73 55.9 49.6 45.1 698 11 2/21/74 62.2 54.8 45.2 656 21
10/ 3/74 53.6 48.4 42.1 656 28 4/ 3/75 55.6 51. 0 44.4 682 34 3/31/77 51.3 45.0 40.4 682 58 8/16/77 51.3 44.6 39.7 682 63
Figure XVI
EFFECTS OF TRAFFIC ON SKID NUMBERS ROUTE 160
DADE COUNTY
100r-Section I - Limes tone and Fl int Chat Sand 90 80
Z 70
U\ 60~:===~t:======::::~~==~:{;t=7~~~~==jQ~ on 50 .. ... G 40 =:: Log SN 50 = 1. 614 - . 070 (Log TR)
::::I 30 LtNEAR REGRESStON ANALYStS Z (LOG - LOG RELATlONSHtP) ~ ~ ~ Q WEAR FACTOR -.052 -.070
~ 20 S y .. . 0 27 .015 '" CV (7.) 2.1 2.3
,2 .617 .903
" 8 8 • A regfession analYlil indicat •• that the ,kid numb.r. are not lignificantly aff.cted
by accumulat.d traffic , ther.for. , a dependable .ear factor (annat b. calculat.d .
P-2
Est. Acc. Traffic,TR
20,000 98,000
220,000 427,000 565,000 685,000
1,176,000 1,279,000
O-SN30
O - SN40
\7 -SN 50
10 I " " "' II I ! " !" II I I II 1111 " I " I , ,,, " ,
.01 .1 10 100
ACCUMULATED TRAFFIC, TR (Millions)
-91-

Distinctive Characteristics
ROUTE SO
JOHNSON COUNlY
Q-l
This asphaltic concrete pavement utilized limestone as coarse aggregate and sand
as fine aggregate. The noted characteristic was 1.5% +1/2" and 67.1% +#10 material
in the mix.
Discussion of Results
All three sections have SN40 averages in the lower 40's. No significant trends
were established for TR with regression analyses.
Description of Project
Project 4-P-50-19 involved an asphaltic concrete pavement (Mix #C72-19)
com pleted in June, 1972.
The mix contained 67.3% Burlington limestone, 25.0% Missouri River sand, 3.2%
mineral filler, and 4.5% asphalt (60-70). Composition of the mix, based on weight of
total mix, was 95.5% mineral aggregate and 4.5% asphalt with 1.5% +1/2" and 67.1% +#10
material.
Three divided pavement sections (2.212, 2.213, and 2.213 miles in length) were
tested. Five tests were performed in position 2 of the eastbound lane in each section
for each test speed.
Skid tests and traffic data are shown in Table XVII and plotted in Figure XVII.
-92-
1
1 ]
]
J
J J

TABLE XVII
SKID TESTS AND TRAFFIC DATA
SN Date Tested ~
ROUTE 50 JOHNSON COUNTY
SN SN AADT 40 50 Lr.,a l1.e
Section 1 - Limestone (Burlington)
10/21/74 43.8 38.4 34.4 1603 4/15/75 55.8 48.2 41.9 1596 9/24/75 45.9 41.2 37.2 1596 4/12/76 45.6 41.3 36.1 1596 9/17/76 38.0 35.0 29.8 1692 6/ 9/77 42.3 39.9 34.8 1692
Section 2 - Limestone (Burlington)
10/21/74 41.6 37.8 32.3 1576 4/15/75 57.8 51. 0 43.5 1594 9/24/75 43.0 38.5 35.2 1594 4/12/76 47.0 43.1 35.7 1690 9/17/76 38.0 34.7 29.7 1690 6/ 9/77 41.3 37.0 33.7 1690
Section 3 - Limestone (Burlington)
10/21/74 45.4 40.6 35.8 1600 4/15/75 58.3 52.5 46.0 1585 9/24/75 47.7 42.2 38.8 1585 4/12/76 52.2 44.7 39.1 1680 9/17/76 42.6 37.6 33.3 1680 6/ 9/77 45.9 40.0 36.8 1680
-93-
Age in Months --- -
28 33 39 45 51 60
28 33 39 45 51 60
28 33 39 45 51 60
Q-2
Est. Acc. Traffic,TR
1,289,000 1,529,000 1,817,000 2,112,000 2,'417,000 2,874,000
1,275,000 1,513,000 1,800,000 2,095,000 2,400,000 2 , 856,000
1,290,000 1,529,000 1,814,000 2,108,000 2,410,000 2,864,000

Figure XVII
EFFECTS OF TRAFFIC ON SKID NUMBERS ROUTE 50
JOHNSON COUNTY
100J-5ection 1 - Limestone (Burlington) 90 80
Z 70 11\ 60
VI 50 III: ... CD 40 ~ ::I 30 Z C
~ 20 11\
o
§~ 'V
A regression analysis indicate. that the skid numbers are not significantly affected by accumulated traffic, ther.for. , a dependable wear 'actor CO""ot b. calculated.
o -SN30
D-SN40
V'-SN 50
10 I " " II I I " I , " I, I " , I " "" " I " " II' "I .01 .1 10
ACCUMULATED TRAFFIC, TR (Millions)
100J-5ection 2 - Limestone (Burlington) 90 80
Z 70 11\ 60
VI 50 111: ' ... CD 40
~ ::I 30 Z C ~ 20 11\
~ 'V 'V
A regression analysis indicate. that the skid numbers are not significantly affected by accumulated traffic, ther.for., a dependable wear 'actor cannot b. calculated .
100
o -5N 30
o -SN40
V'-SN SO
10' 1.'1""" 1,1,1,1111 111.111111 1,1"11"1
.01 .1 10
ACCUMULATED TRAFFIC, TR (Millions)
100~5ection 3 - Limestone (Burlington) 90 80
Z 70 11\ 60
VI 50 III: ... CD 40
~ ::I 30 Z C ~ 20 III
8 0
~ 'V
A ,egression analysis indicate, that the skid number. are no. significantly affected by accumulated traffic, ther.for., a dependable .ear 'actor cannot be calculated .
100
o -SN 30
D-5N 4 o V' -SN SO
10 1 ""II' " ,,1,1,1'" "1'"1111 ''1'1,,'11
.01 .1 10 100
ACCUMULATED TRAFFIC, TR (Millions)
-94-
Q-3 1
1
1
I J ]

r
J
J
Distinctive Characteristics
ROUTE 1-70
LAFAYETTE COUNTY
R-l
These asphaltic concrete pavements utilized two different limestones as coarse
aggregate and blended sand as fine aggregate.
Discussion of Results
Sections 1, 2 and 3 had an average SN40 of about 36, which was roughly 4
SN less than Sections 4, 5 and 6. None of the sections showed any significant trends
for TR. Likewise, there was no evidence SN was influenced significantly by AADL T. Description of Project
Project C054-70( 1) involved the use of two different asphaltic concrete
pavements (Mixes #C71-258 and #C71-94) completed in August, 1971.
Mix #C71-258, which was used in the westbound lane, contained 66.3% Bethany
Falls limestone, 25.4% blended sand, 3.8% mineral filler, and 4.5% asphalt (60-70).
Composition of the mix, based on weight of total mix, was 95.5% mineral filler and 4.5%
asphalt with 1.7% +1/2" and 66.2% +#10 material.
Mix #C7l-94, which was used in the eastbound lane, contained 65.7% Winterset
limestone, 25.2% blended sand, 4.1 % mineral filler, and 5.0% asphalt (60-70). Composition
of the mix, based on weight of total mix, was 95.0% mineral aggregate and 5.0% asphalt
with 2.0% +1/2" and 66.0% +#10 material.
Six divided pavement sections (3.892, 3.892, 3.892, 3.407, 3.407, and 3.407
miles in length) were tested. Sections 1, 2, and 3 were in the westbound lane and Sections
4, 5 and 6 were in the eastbound lane. Five tests at each test speed were perfonned
in position 2.
Skid tests and traffic data are shown in Table XVIII and plotted in Figure XVIII.
-95-

R-2 I TABLE XVIII J
SKID TESTS AND TRAFFIC DATA
ROUTE I-70 I LAFAYETTE COUNTY
I SN SN AADT Age in Est. Acc. J Date Tested 40 50 /Lane Months Traffic,TR
Section 1 - Limestone (Bethany Falls) rI 10/26/71 40.6 35.5 6204 3 558,000 5/ 3/7 3 36.6 32.7 6136 21 3,900,000
10/22/74 30.8 28.1 4865 39 6,833,000 4/15/75 42.7 38.6 5243 44 7,596,000
10/ 9/75 32.9 29.6 5243 50 8,540,000 4/13/76 34.9 31.5 5556 56 9,512,000
10/15/76 33.4 31.5 5556 62 wO,512,000 5/ 6/77 33.9 33.2 555,6 69 11,679,000 8/ 3/77 33.8 30.6 5556 72 12,179,000
Section 2 - Limestone (Bethanl Falls)
10/26/71 42.3 36.8 6204 3 558,000 5/ 3/73 36.5 32.7 6606 21 3,957,000
10/22/74 32.3 29.5 4607 39 6,924,000 4/15/75 44.1 38.1 5076 44 7,657,000
10/ 9/75 32.3 29.2 5076 50 8,571,000 4/13/76 36.4 32.4 5320 56 9,512,000
10/15/76 33.8 30.7 5320 62 10,481,000 5/ 6/77 36.5 36.5 5320 69 11,611,000 8/ 3/77 34.6 31. 5 5320 72 12,095,000
Section 3 - Limestone (Bethanl Falls)
10/26/71 42.7 37.9 6204 3 558,000 5/ 3/73 39.5 33.4 7384 21 4,050,000 ] 10/22/74 31.6 28.9 5229 39 7,391,000 4/15/75 44.8 39.4 5761 44 8,223,000
10/ 9/75 32.0 30.2 5761 50 9,260,000 4/13/76 34.9 31.8 6107 56 10,328,000
10/15/76 34.4 31.5 6107 62 11,428,000 5/ 6/77 37.5 37.6 6107 69 12,710,000 8/ 3/77 33.7 31. 3 6107 72 13,260,000
~
1
-96-
J

TABLE XVIII (Continued)
SKID TESTS AND TRAFFIC DATA
ROUTE I-70 LAFAYETTE COUNTY
SN SN AADT Date Tested 40 50 L,Lane
Section 4 - Limestone (Winterset)
10/26/71 46.6 39.4 6219 5/ 3/73 39.4 34.0 7053
10/22/74 34.5 31.9 4954 4/15/75 46.0 40.8 5989
10/ 9/75 34.0 31.1 5989 4/13/76 37.8 35.6 6348
10/15/76 37.3 33.3 6348 5/ 6/77 42.0 37.4 6348 8/ 3/77 33.6 28.3 6348
Section 5 - Limestone (Winterset)
10/26/71 46.5 39.4 6219 5/ 3/73 39.8 36.7 6761
10/22/74 35.2 31. 3 4716 4/15/75 48.9 43.0 5701
10/ 9/75 36.9 33.8 5701 4/13/76 40.5 37.0 6043
10/15/76 37.7 34.5 6043 5/ 6/77 43.4 38.9 6043 8/ 3/77 33.2 32.4 6043
Section 6 - Limestone (Winterset)
10/26/71 45.2 37.9 6219 5/ 3/73 41.8 35.0 6157
10/22/74 35.2 31. 6 4294 4/15/75 48.4 42.4 5192
10/ 9/75 37.6 34.5 5192 4/13/76 40.7 36.9 5503
10/15/76 39.6 35.8 5503 5/ 6/77 42.9 40.8 5503 8/ 3/77 35.9 33.7 5503
-97-
Age in Months
3 21 39 44 50 56 62 69 72
3 21 39 44 50 56 62 69 72
3 21 39 44 50 56 62 69 72
R-3
Est. Acc. Traffic,TR
560,000 4,017,000 7,196,000 8,032,000 9,110,000
10,220,000 11,363,000 12,696,000 13,267,000
560,000 3,982,000 7,019,000 7,815,000 8,841,000 9,898,000
10,986,000 12,254,000 12,798,000
559,000 3,910,000 6,675,000 7,400,000 8,335,000 9,297,000
10,287,000 11,443,000 11,938,000

Figure XVIII
EFFECTS OF TRAFFIC ON SKID NUMBERS ROUTE 1-70
LAFAYETTE COUNTY
lOOt-Section 1 - Limestone (Bethany Falls) 90 80
Z 70 .,.. 60
'" 50 Of: , ... 10 40
~ ~ 30 Z o ~ 20 .,..
o \J 8 ~~
A regression analysis indicat •• that the ,kid numbers are not lionificantly aff.cted by occumulated traffic , ther.for. , a dependabl. wear 'actor cannot b. calculat.d.
D-SN40
\7 - SN so
10' 1,1"11'" 1,1,'"111 ,,'''11111 ''''''''" .01 .1 10
ACCUMULATED TRAFFIC, TR (Millions)
100 f- Section 2 - Limestone (Bethany Falls) 90 80
Z 70 .,.. 60
'" 50 Of: ... 10 40
~ ~ 30 Z o ~ 20 .,..
o \J
o o \J~ \J 9~
A reurellion analysis indicot •• that the ,k id numbe" or. no. significon.ly aff.cted by accumulated traffic , _ther.for. , a dependable wear foctor cannot b. calculated.
100
o -SN 40
\J -SN 50
10' 1",111'" 1,1'11 1111 111,11"11 1,1"11'"
.01 .1 10
ACCUMULATED TRAFFIC, TR (Millions)
lOOt-Section 3 - Limestone (Bethany Falls) 90 80
Z 70 .,.. 60
'" 50 Of:
~ 40r 8 ~
o \J
o 9\J~ ~ 30
Z o ~ 20 .,..
A reurellion analysis indicat •• that the ,kid numbers or. no' lignificantly aff.cted by accumulated traffic , ther.for. , a dependable wear factor cannot b. calculated .
100
o -SN 40
\7 -SN so
10 1 """"" ""'11"' "1'11 " " ""11'''1 .01 .1 10 100
ACCUMULATED TRAFFIC, TR (Millions)
-98-
R-4
1
1 I I I
J
J
J
J J

Figure XVIII (Continued)
EFFECTS OF TRAFFIC ON SKID NUMBERS ROUTE 1-70
LAFA YETTE COUNTY
100J-Section 4 - Limestone (Winterset) 90 80
Z 70 on 60 ",. SO ~. ... IICI 40
2: ::) 30 Z Q
~ 20 on
o \] o
\]
o
9~
It. re .. , ... ion analysis indicate. that the .kid numbe" ar. not lignificantly affected by accuMulat.d traffic, ther.for., a dependabl •• ear factor cannot b. calculated.
D -SN.40
\7 - SN 50
10' ""'11'11 ""11"" ".,11"11 ",",,111 .01 .1 10
ACCUMULATED TRAFFIC, TR (Millions)
100l-Section 5 - Lim~stone (Winte,set) 90 80
Z 70 on 60
", SO ~. ... IICI 40
2: ::) 30 Z Q
~ 20
""
o \] 9
o \i~ 8~
A regt.uion onalysi. indicote, that the skid numbers are not .ignificantly aff.cted by accumulated traffic, ther.for., a dependabl •• ear fador connot b. calculated.
100
D-SN 40
\7-SN 50
10' I"tldlll '''''dill ,,,,,,'111 "",.,"' .01 :1 10
ACCUMULATED TRAFFIC, TR (Millions)
100l-Section 6 _ Limestone (Winte,set) 90 80
Z 70 on 60
", 50 ~. ... IICI 40
2: ::) 30 Z Q
~ 20
""
o \7
o \] ~
It. re., ... ion onolysi, inciicat ••• hat the sleid nUMbers are not si,nificantly affected by aCCUMulated traffic, therefore, a dependable .ear factor cannot b. calculat.d.
100
D-SN40
\7- SN so
10' 1.1"",,, 1,'""," '''''''''' "'''11'" .01 .1 10 100
ACCUMULATED TRAFFIC, TR (Millions)
-99-
R-5

5-1
ROUTE 141
ST. LOUIS COUNTY
Distinctive Characteristics
This asphaltic concrete pavement utilized limestone as coarse aggregate and sand
as fine aggregate.
Discussion of Results
Average SN40 for each section was in the middle 30's. No significant trends
were established by the data for TR.
Description of Project
Project 6-U-14l-38 involved an asphaltic concrete pavement (Mix #C73-77)
completed in April, 1973.
The mix contained 63 .0% St. Louis limestone, 28.0% Missouri River sand, 4.4%
mineral filler, and 4.6% asphalt (6(} 70). Composition of the mix, based on weight of
total mix, was 95.4% mineral aggregate and 4.6% asphalt with 12.0% +3/8" and
62.9% +# 1 0 material.
Two four-lane undivided pavement sections (1.236 and 1.212 miles in length)
were tested. Each section had five tests in position 2 in each direction for each test
speed.
Skid tests and traffic data are shown in Table XIX and plotted in Figure XIX.
-100-
1
1 ]
]
I
]
J
J I

TABLE XIX
SKID TESTS AND TRAFFIC DATA
SN Date Tested 30
ROUTE 141 ST. LOUIS COUNTY
SN SN MDT 40 50 LLane
Section 1 - Limestone (st. Louis)
10/16/74 34.9 30.9 27.8 5678 4/28/75 45.6 38.8 32.3 5351 8/26/75 41.0 37.4 31.0 5351 4/29/76 44.8 42.4 36.7 5672 9/21/76 34.1 28.9 26.0 5672 5/11/77 31.6 29.0 25.2 5672 8/ 8/77 38.5 34.4 30.7 5672
Section 2 - Limestone (St. Louis}
10/16/74 38.2 34.1 30.0 10004 4/28/75 50.7 42.6 35.2 9499 8/26/75 44.6 38.8 34.1 9499 4/29/76 51.0 43.6 37.2 10049 9/21/76 35.4 31.4 28.6 10049 5/11/77 31.6 27.2 24.1 10049 8/ 8/77 40.2 33.7 31.0 10049
-101-
Age in Months
19 25 29 37 42 49. 52
19 25 29 37 42 49. 52
S-2
Est. Acc. Traffic,TR
3,406,000 4,389,000 5,031,000 6,354,000 7,204,000 8,396,000 8,906,000
5,905,000 7,645,000 8,785,000
11,131,000 12,638,000 14,748,000 15,653,000

Figure XIX
EFFECTS OF TRAFFIC ON SKID NUMBERS ROUTE 141
ST. LOUIS COUNTY
100J-Section - limestone (St. louis) 90 80
Z 70 ." 60
.,; 50 III: ... 110 40
~ ::> 30 Z Q
~ 20 ."
6~ 6cB~ aQ] c§l
IT]
A regression analysis indicate, thot the skid numbers are not significantly affected by accumulated traffic , therefore, a dependable wear foctor cannot b. calculated.
6-SN20
O-SN30
O-SN40
10' I.,.,!. " "",,"11 I"""!II ",",,111 .01 .1 10
ACCUMULATED TRAFFIC, TR (Millions)
lOOt- Section 2 - Li mestone (St . Louis) 90 80
Z 70 ." 60
.,,- 50 111: ' ... 110 40
~ ::> 30 Z Q
~ 20 ."
66
~O 6 6[gCbB 8 80
A regression analysis indicates that the skid numbers or. not significantly affected by accumulated traffic, therefore. a dependable wear foctor cannot b. calculated.
o
100
6-SN20
O-SN30
O-SN40
10' ",,," '11 •••• 111.11 111,11"11 •• ",1111'
.01 .1 10 100
ACCUMULATED TRAFFIC, TR (Millions)
-102-
S-3 1
·1
1 J 1
]
]
J
J
J 1

Distinctive Characteristics
ROUTE 1-44
NEWTON COUNTY
T -1
This special asphaltic concrete pavement utilized limestone containing
approximately 35% chert as coarse aggregate and blended sand as fine aggregate.
Discussion of Results
Each of the four sections maintained SN40 in the lower to middle 40's. Except
for initial tests, variability was rather small. Several reasonable wear factors were computed
with regression analyses. No significant influence on SN by AADLT was evident.
Description of Project
Project I-FI-44-1(36)0 involved an asphaltic concrete pavement (Mix #C72-300)
completed in October, 1972.
The mix contained 64.7% Burlington limestone containing approximately 35%
chert, 24.0% blended sand (flint chat sand and Missouri River sand), 5.7% mineral filler,
and 5.6% asphalt (60-70). Composition of the mix, based on weight of total mix, was
94.4% mineral aggregate and 5.6% asphalt with 4.4% +3/8" and 62.0% +#10 material.
Four divided pavement sections (each 3.900 miles in length) were tested.
Sections 1 and 2 were in the eastbound lane and Sections 3 and 4 were in the westbound
lane. Each section had five tests in position 2 at each test speed.
Skid tests and traffic data are shown in Table XX and plotted in Figure Xx.
-103-

T-2 I TABLE XX 1
SKID TESTS AND TRAFFIC DATA .-1
ROUTE I-44 NEWWN COUNTY
1 SN SN AADT Age in Est. Acc. J Date Tested 40 50 .LLane Months Traffic,TR
Section 1 - Limestone (Burlington)
11/13/72 57.3 52.8 3866 1 116,000 · 4/24/73 44.1 40.7 4401 7 876,000 9/30/74 47.7 44.6 4079 24 3,034,000 4/ 7/75 48.2 43.4 3918 30 3,753,000
10/ 8/75 45.3 41.2 3918 36 4,459,000 4/15/76 44.0 38.5 4193 42 5,188,000 9/ ·1/76 49.7 44.9 4193 46 5,692,000 4/ 5/77 42.0 37.4 4193 53 6,572,000 8/18/77 47.8 44.0 4193 58 7,201,000
Section 2 - Limestone (Burlington)
11/13/72 60.8 53.4 6005 1 180,000 4/24/73 44.5 39.6 6214 7 1,286,000 9/30/74 44.0 39.9 5397 24 4,235,000 4/ 7/75 45.6 40.1 5611 30 5,226,000
10/ 8/75 42.4 39.0 5611 36 6,235,000 4/15/76 40.3 34.6 6250 42 7,303,000 9/ 1/76 46.0 42.1 6250 46 8,053,000 4/ 5/77 40.0 37.0 6250 53 9,365,000 8/18/77 44.7 38.7 6250 58 10,323,000
Section 3 - Limestone (Burlington)
11/13/72 61.9 53.4 3951 1 119,000
] 4/24/73 47.8 43.0 4695 7 919,000 9/30/74 49.4 44.0 4375 24 3,227,000 4/ 7/75 49.6 44.0 4525 30 3,981,000
10/ 8/75 48.0 43.0 4525 36 4,701,000 4/15/76 43.9 39.4 4810 42 5,495,000 9/ 1/76 49.9 45.3 4810 46 6,072,000 4/ 5/77 44.9 38.8 4810 53 7,082,000 8/18/77 48.6 43.9 4810 58 7,804,000
~
J
J -104- I

TABLE XX · (Continued)
SKID TESTS AND TRAFFIC DATA
SN Date Tested 40
ROUTE I-44 NEWTON COUNTY
SN MDT 50 .L.Lane
Section 4 - Limestone (Burlington)
11/13/72 61.4 53.5 6136 4/24/73 46.2 42.0 6589 9/30/74 47.2 42.6 5576 4/ 7/75 45.8 41.1 5443
10/ 8/75 44.1 40.8 5443 4/15/76 42.0 37.4 5630 9/ 1/76 47.3 43.2 5630 4/ 5/77 40.1 35.8 5630 8/18/77 43.8 39.1 5630
-105-
Age in Months
1 7
24 30 36 42 46 53 58
T-3
Est. Acc. Traffic,TR
184,000 1,343,000 4,430,000 5,422,000 6,401,000 7,398,000 8,073,000 9,256,000
10,100,000

100 90 80
Z 70 ." 60
.,,- SO DO:
~ 40
~ ::l 30 Z Q
:0.:: 20 ."
Figure XX
EFFECTS OF TRAFFIC ON SKID NUMBERS ROUTE 1-44
NEWTON COUNTY
Section 1 . limestone {Burlington}
==9:: Log SN50 1.654 - .052
LINEAR REGRESSION ANALYSIS (lOG-lOG RELATIONSHIPI
WEAR FACTOR
S y .•
CV (%1 ,2
(Log TR)
r;~
~~ -.045
.031 2.3
.444 9
-.052
.035 2.5
.466 9
SN40
1.693 - .045 (Log TR)
9 ~
O-SN40
\7-SN 50
101 ,I,I.!.!III ,1.!.!d!!1 ,I.!ddlll ,I.!""III
.01 .1 10
ACCUMULATED TRAFFIC, TR (Millions)
100J-5e<lion 2 - Limeslone (Burling Ion) 90 80
Z 70 ." 60
.,,- SO DO: ... al 40
~ " '1""" "Gm"" .,,"'" Z jLOG . LOG RELATIONSHIPI Q WEAR FACTOR
!lo: 20 S y .• ." CV (%)
,2
~~ -.081
. 030
2.4 .733
9
Log SN40 1.700 - .081 (Log TR)
o \l
• A regression analysis indicot., that the skid numbers are not significantly offected by accumulated traffic, ther.fore, a dependable wear foctor cannot b. calculated.
100
0-5N 40
\7 -5N SO
10 1 101"""1 1,)""111 1,)0101111 .!.!"0I111
.01
100 90 80
Z 70 ." 60
.,,- SO DO:
~ 40
~ ::l 30 Z Q
:0.:: 20 ."
.1 10
ACCUMULATED TRAFFIC, TR (Millions)
Section 3 - limestone (Burlington)
r LOg SN 40 1. 7lB - .059 (Loq TR)
=B==---'------;:::;-_ Log SN 50 1.664 - . 053 (Log TR).--J -B- ~
LINEAR REGRESSION ANALYSIS (LOG - LOG RELATIONSHIPI ~ ~
W EAR FACTOR -.059 -.053
S y .. -.026 .027 CV (%) 2.2 2.4 ,2 . 677 .604
9 9
100
O - SN40
\7 -SN SO
10 I ,! ,! I. I I II I I ,! '" I II I I I !I,I I II I, I, '" I II
.01 .1 10 100
ACCUMULATED TRAFFIC, TR (Millions)
-106-
T·4 1
1
1
1
J
]
I
I J
1

I I I I J
I J
I I I }
I
j
1
Figure XX (Continued)
EFFECTS OF TRAFFIC ON SKID NUMBERS ROUTE 1-44
NEWTON COUNTY
100~Sect i on 4 - Limestone (Burlington) 90 80
Z 70
'" 60 .,; 50 Dt w aI 40
~
Log SN50 = 1 .662 - .076 (Log TR)
::J 30 Z
LINEAR REGRESSION ANALYSIS (lOG - lOG RelATIONSHIP) 40 MPH ~
o WEAR FACTOR -.083 -.076
:101: 20L- S y .x '" I cv ('7.)
,2
. 026 . 027 2. 3 2.6
.788 . 7 4 5 9 9
Log SN40 1. 712 - .083 (Log TR)
O -SN40
\7 -SN so
10' '''''d'" '''''allll '"d!llli '''''''"' .01 .1 10 100
ACCUMULATED TRAFFIC, TR (Millions)
-107 -
T-5

Distinctive Characteristics
ROUTE 291
JACKSON COUNlY
U-1
This asphaltic concrete pavement utilized limestone as coarse aggregate and sand
as fme aggregate.
Discussion of Results
Average SN40 for each section was in the upper 30's. No significant trends
were established for TIt
Description of Project
Project 4-U-29l-55 involved an asphaltic concrete pavement (Mix #C73-73)
completed in May, 1973.
The mix contained 63 .1% Bethany Falls limestone, 28.0% Missouri River sand,
4.0% mineral filler, and 4.9% asphalt (60-70). Composition of the mix, based on weight
of total mix, was 9501% mineral aggregate and 409% asphalt with 4.8% +3/8" and
64.8% +#10 material.
Two undivided pavement sections (each 2.214 in length) were tested. Each
section had five tests in position 2 in each direction for each test speed.
Skid tests and traffic data are shown in Table XXI and plotted in Figure XXI.
-108-
1 I 1 1 1 ]
1
f
J 1

TABLE XXI
SKID TESTS AND TRAFFIC DATA
SN Date Tested --2Q
ROUTE 291 JACKSON COUNTY
SN SN AADT 40 -2.Q. /Lane
Section 1 - Limestone (Bethany Falls)
10/23/74 40.3 36.7 31. 2 5041 4/10/75 53.0 43.2 37.8 5242 9/24/75 41.8 33.6 30.4 5242 4/ 1/76 53.0 45.8 36.9 6620 9/13/76 36.8 31.7 25.5 6620 5/ 5/77 49.3 39.8 33.0 6620 8/ 3/77 41.6 36.1 29.3 6620
Section 2 - Limestone (Bethany Falls)
10/23/74 42.0 37.4 31.5 4540 4/10/75 54.0 42.2 35.5 4722 9/24/75 40.8 33.6 29.4 4722 4/ 1/76 53.2 43.0 36.3 6570 9/13/76 35.8 30.2 25.2 6570 5/ 5/77- 51.6 41.6 34.0 6570 8/ 3/77 43.7 37.8 31.3 6570
-109-
Age in Months
17 22 28 34 39 47 50
17 22 28 34 39 47 50
U-2
Est. Acc. Traffic,TR
2,598,000 3,372,000 4,316,000 5,384,000 6,377,000 7,965,000 8,561,000
2,340,000 3,037,000 3,887,000 4,904,000 5,889,000 7,466,000 8,057,000

100 90 80
Z 70 V) 60
V)- 50 ~
~ 40 ~ ::I 30 Z Q
~ 20 V)
Figure XXI
EFFECTS OF TRAFFIC ON SKID NUMBERS ROUTE 291
JACKSON COUNTY
Seclion 1 - Limeslone (Belhany Falls)
o 0 0 000 ~
@\7B~~ \7
0-SN30
O-SN40
\7 -SN 50
A regression analysis indicates that the skid numb.rs ore not significantly offected by accumulated traffic , therefore, a dependable wear factor (annat be calculated .
101 1,1.!,I.I.l111 1,1,1.1".1111 ),),1.1.101111 1.1.1.1111 .01 .1 1 10 100
ACCUMULATED TRAFFIC, TR (Millions)
100r-Seclion 2 - Limeslone (Belhany Falls) 90 80
Z 70 V) 60
VI 50 ~ w III 40
~ ::I 30 Z Q
~ 20 II)
o 0 0
8000 cB \70'\/D Q \7 \7OV
\7
0- 5N 30
D-SN40
\7- SN so
A regression analysis indicates that the skid numbers are not significantly aff.cted by accumulated traffic , therefore , a dependable wear factor cannot be calculated .
101 1,1,1,1.101111, 1,1,111".1111 1,I,I,I.I.lIII..L 1.1.1.1111 .01 .1 10 100
ACCUMULATED TRAFFIC, TR (Millions)
-110-
U-3 1
1
1
.1 I
J
J
J j

Distinctive Characteristics
ROUTE 1-44
GREENE COUNTY
V-I
This asphaltic concrete pavement utilized limestone as coarse aggregate and sand
as fine aggregate.
Discussion of Results
For 40 mph tests, the level of skid resistance was maintained in the lower 30's
for the last 3 of 4 years of testing. The wear factors should be used with caution depending
on the weight given to the first two tests, which were considerably higher than the
remainder of the tests. Higher intermediate results such as those on April 20, 1976,
tend to indicate a high degree of variability which is probably caused by precipitation.
In this case, there was rain on the same day but prior to testing.
Description of Project
Project FI-44-2(67)80 involved an asphaltic concrete pavement (Mix #C72-l56)
completed in August, 1972.
The mix contained 69.4% Burlington limestone, 22.0% Arkansas River sand, 4.0%
mineral filler and 4.6% asphalt (60-70). Composition of the mix, based on weight of
total mix, was 95.4% mineral aggregate and 4.6% asphalt with 10.1% +3/8" and 64.8% +# 1 0 material.
Two divided pavement sections (2.595 and 2.594 miles in length) were tested.
Each section had five tests in position 2 for each test speed.
Skid tests and traffic data are shown in Table XXII and plotted in Figure XXII.
-111-

TABLE XXII
SKID TESTS AND TRAFFIC DATA
ROUTE 1-44 GREENE COUNTY
SN SN MDT Age in Date Tested --1Q ---.2Q /Lane Months
Section 1 - Limestone ~Bur1in9ton}
4/19/73 49.5 39.1 6142 9 3/ 6/74 45.0 5664 19
10/ 7/74 31.3 26.5 5664 26 4/ 3/75 36.0 29.8 5638 32
10/ 6/75 33.6 30.5 5638 38 4/20/76 45.9 38.8 6351 45 9/ 2/76 31.4 26.9 6351 49 4/ 1/77 31.3 26.2 6351 56 8/17/77 33.1 27.4 6351 61
Section 2 - Limestone (Burlington}
4/19/73 48.7 42.2 5973 9 3/ 6/74 47.8 5507 19
10/ 7/74 32.8 28.5 5507 26 4/ 3/75 36.8 31. 5 5709 32
10/ 6/75 36.0 33.0 5709 38 4/20/76 49.0 35.6 6373 45 9/ 2/76 32.9 28.7 6373 49 4/ 1/77 33.6 29.9 6373 56 8/17/77 35.8 29.8 6373 61
-112-
V-2
Est. Acc. Traffic,T.B
1,577,000 3,391,000 4,580,000 5,597,090 6,612,000 7,882,000 8,644,000 9,977,000
10,930,000
1,556,000 3,320,000 4,477,000 5,486,000 6,514,000 7,792,000 8,557,000 9,895,000
10,851,000
1 1 "1
)
J
j
J j

Figure XXII
EFFECTS OF TRAFFIC ON SKID NUMBERS ROUTE 1-44
GREENE COUNTY
100 ..... Section 1 - Limestone (Burlington) 90 80
Z 70
O - SN40
\J -SN 50
IA 60 _ 206 (Log TR)
vi SO 111: '
'" II1II 40
~ ~ 30 Z Q
:w: 20 on
LINEAR REGRESSION ANALYSIS (LOG-LOG RElATIONSHIP)
WEAR FACTOR 5 y •• cv (%) ,2
~~ -.206
.063
3.1 .462
~ 9 A r.greuion analYlis indicat •• that the skid nUMb.,. or. not significantly affected by aCCUMulated traff ic, th.r.'or., a dependable •• ar 'octor cannot b. calculated.
10' ""'11'" 1.11111'11 11'''11 1" '''''"'11
.01 .1
ACCUMULATED TRAFFIC, TR (Millions)
100 ..... Section 2 - Limestone (Burlington) 90 80
Z 70
10 100
O-SN40
\J - SN 50
IA 60 1.628 - .156 (Log TR)
vi SO 111: '
'" II1II 40
~ ~ 30 Z Q
:w: 20 on
LINEAR REGRESSION ANALYSIS (LOG -LOG RElATIONSHIP)
WEAR FACTOR
s y .• cv (%) ,2
~~ -.156
.043 3 . 4
.532 n 8 • A reo,e"ion analysis indicate. th at the sleid nu",bers are not s ignificantly affected
by occumulat.d troffic , th.r. 'or., a dependabl •• eor foctor cannot b. calculated .
10' "11""11 "11'11'11 1111',,"1 '"""',, .01 .1 10 100
ACCUMULATED TRAFFIC, TR (Millions)
-113-
V-3

Distinctive Characteristics
ROUTE I-55
PEMISCOT COUNTY
W-l
This test project involved thtee special asphaltic concrete pavements on two
construction projects , One mix had limestone as coarse aggregate and blended sand as
fine aggregate. The other two mixes, which were identical, had a blend of limestone
and crushed gravel as coarse aggregate and blended sand as fine aggregate.
Discussion of Results
Average SN40 for Section 1 was about 30, however, SN40 averages for all other
sections were in the middle 40'so Even though Sections 5 through 9 had an identical
mix design as Sections 2 through 4, they appeared to have less seasonal variability. Wear
factors were computed on some sections" There was no evidence AADLT significantly
affected SN"
Description of Project
Project I-IG-SS- l(l3)11 consisted of two asphaltic concrete pavements (Mixes
#C74-241 and #C73-60) completed in August, 1974.
Mix #C74-241 in Section 1 contained 6306% P1attin limestone, 27.0% blended
sand, 5.0% mineral filler, and 4.4% asphalt (60-70), Composition of the mix, based on
weight of total mix, was 95.6% mineral aggregate and 4A% asphalt with 10.8% +3/8"
and 62.0% +#10 material.
Mix #C73-60 in Sections 2, 3 and 4, contained 32.4% Ste. Genevieve limestone,
43 ,0% crushed Black River gravel, 15.9% Mississippi River sand, 3.3% mineral filler and
5.4% asphalt (60-70). Composition of the mix, based on weight of total mix, was 94.6%
mineral aggregate and 5.4% asphalt with 7.4% +3/8" and 61.8% +#10 materiaL
Project 1-55-1(20)4 consisted of an asphaltic concrete pavement (Mix #C73-61)
completed in August, 1974. Mix #C73-61, in Sections 5, 6, 7, 8 and 9, was identical
to Mix #C73-60,
Nine sections in the southbound lane (L78l, 1.430, 1.300, 1.432, 1.436, 1,305,
1.305, 1.305, and 1.435 miles in length) were tested. Each section had five tests in
position 2 for each test speed ,
Skid tests and traffic data are shown in Table XXIII and plotted in Figure XXIII ,
-114-
1
'1
1
J
1
J
J j

\'1- 2
TABLE XXIII
SKID TESTS AND TRAFFIC DATA
SN Date Tested 40
ROUTE I-55 PEMISCOT COUNTY
SN AADT 50 /Lane
Section 1 - Limestone (P1attin)
10/19/74 37.1 35.2 3449 3/26/75 36.4 33.9 4019
10/ 1/75 31. 3 29.2 4019 5/ 5/76 21.2 19.5 4260
10/20/76 30.9 29.2 4260 3/29/77 30.4 25.7 4260 8/10/77 26.0 26.0 4260
Section 2 - Limestone (Ste. Genevieve) ~B1ack River)
10/19/74 46.3 42.6 3449 3/26/75 49.4 45.2 4019
10/ 1/75 44.4 41.9 4019 5/ 5/76 33.8 31.5 4260
10/20/76 43.5 40.1 4260 3/29/77 45.1 40.1 4260 8/10/77 40.6 42.4 4260
Section 3 - Limestone (Ste. Genevieve) (Black River)
10/19/74 47.7 42.7 3449 3/26/75 50.0 47.2 4019
10/ 1/75 46.3 42.7 4019 5/ 5/76 36.4 34.6 4260
10/20/76 45.7 42.8 4260 3/29/77 46.1 41.5 4260 8/10/77 43.2 40.3 4260
-115-
Age in Est. Acc. Months Traffic,TR
4 414,000 9 983,000
15 1,706,000 22 2,579,000 28 3,346,000 33 3,985,000 37 4,496,000
and Crushed Gravel
4 414,000 9 983,000
15 1,706,000 22 2,579,000 28 3,346,000 33 3,985,000 37 4,496,000
and Crushed Gravel
4 414,000 9 983,000
15 1,706,000 22 2,579,000 28 3,346,000 33 3,985,000 37 4,496,000

w- 3
TABLE XXIII (Continued)
SKID TESTS AND TRAFFIC DATA
ROUTE I-55 PEMISCOT COUNTY
SN SN AADT Age in Est. Ace. Date Tested 40 50 /Lane Months Traffic,TR
Section 4 - Limestone (Ste. Genevieve) and Crushed Gravel (Black River)
10/19/74 49.0 45.2 3449 4 414,000 3/26/75 50.2 47.5 4019 9 983,000
10/ 1/75 46.2 42.4 4019 15 1,706,000 5/ 5/76 39.0 37.4 4260 22 2,579,000
10/20/76 46.6 43.1 4260 28 3,346,000 3/29/77 46.8 41.1 4260 33 3,985,000 8/10/77 44.8 41.4 4260 37 4,496,000
Section 5 - Limestone (Ste. Genevieve) and Crushed Gravel (Black River)
10/19/74 50.1 44.7 3449 4 414,000 3/26/75 50.4 45.9 4019 9 983,000
10/ 1/75 44.6 42.4 4019 15 1,706,000 5/ 5/76 42.9 40.4 4260 22 2,579,000
10/20/76 44.3 41.9 4260 28 3,346,000 3/29/77 44.7 40.9 4260 33 3,985,000 8/10/77 47.8 45.0 4260 37 4,496,000
Section 6 - Limestone (Ste. Genevieve) and Crushed Gravel (Black River)
10/19/74 49.6 45.6 3479 4 418,000 3/26/75 50.0 47.3 4029 9 989,000
10/ 1/75 44.5 42.0 4029 15 1,714,000 5/ 5/76 42.3 40.5 4271 22 2,589,000
10/20/76 43.5 40.5 4271 28 3,358,000 3/29/77 45.5 41.0 4271 33 3,999,000 8/10/77 44.9 41.1 4271 37 4,511,000
-116-
)
rl
)
)
F1
I J I

w- 4
TABLE XXIII (Continued)
SKID TESTS AND TRAFFIC DATA
SN Date Tested 40
ROUTE I-55 PEMISCOT COUNTY
SN MDT 50 /Lane
Section 7 - Limestone (Ste. Genevieve) (Black River)
10/19/74 51.0 46.1 4061 3/26/75 50.9 46.8 4222
10/ 1/75 45.9 42.2 4222 5/ 5/76 44.3 43.0 4476
10/20/76 43.9 41.5 4476 3/29/77 45.2 41.6 4476 8/10/77 48.7 45.0 4476
Section 8 - Limestone (Ste. Genevieve) ~B1ack River)
10/19/74 50.7 47.2 4061 3/26/75 49.4 45.6 4222
10/ 1/75 46.6 41.6 4222 5/ 5/76 45.4 42.4 4476
10/20/76 45.5 41.1 4476 3/29/77 45.7 42.0 4476 8/10/77 48.9 45.5 4476
Age in Est. Acc. Months Traffic,TR
and Crushed Gravel
4 487,000 9 1,111,000
15 1,871,000 22 2,788,000 28 3,593,000 33 4,265,000 37 4,802,000
and Crushed Gravel
4 487,000 9 1,111,000
15 1,871,000 22 2,788,000 28 3,593,000 33 4,265,000 37 4,802,000
Section 9 - Limestone (Ste. Genevieve) and Crushed Gravel lB1ack River)
10/19/74 51.3 45.9 3718 4 446,000 3/26/75 49.8 45.9 3865 9 1,017,000
10/ 1/75 46.4 42.4 3865 15 1,713,000 5/ 5/76 44.7 43.0 4097 22 2,552,000
10/20/76 45.2 41.0 4097 28 3,290,000 3/29/77 45.3 41.7 4097 33 3,904,000 8/10/77 47.3 45.0 4097 37 4,396,000
-117-

Figure XXIII
EFFECTS OF TRAFFIC ON SKID NUMBERS ROUTE I-55
PEMISCOT COUNTY
lOOt-Section 1 - Limestone (Plaltin) 90 80
Z 70
'" 60 ",' 50 0.: ... c:o 40
~ ::::l 30 Z o ~ 20
'"
~ ~ ~ ~O
\RJ
9 A regreuion analysis indicote, that the skid numbers or. not significantly aff.cted by accumulated traffic , therefore, a dependable .ear foctor con"ot b. calculated .
O - SN40
\7 - SN 50
10' IIIIII! " 1,1,111111 111",1111 1II!I""1
.01
100 90 80
Z , 70
'" 60
'" 50 0.:
:::: 40
~ ::::l 30 Z
0 ~ 20
'"
.1 10
ACCUMULATED TRAFFIC, TR (Millions)
Section 2 - limeston e (Ste. G enevie ve) and Crushed Grovel (Black River)
9 ~ ~ ~ SJ
A regression onalysis indicates that the skid numb.,s or. not significontly aff.cted by accumulated traffic , ther.fore, a dependable wear foctor cannot b. calculated.
100
O - SN40
\7 -SN SO
10 I I! I, I. I I II I! I, '1'1 II I I 1,1,1 I II I I I I III III
.01
100 90 80
Z 70
'" 60
vi" 50 0.:
:::: 40
~ ::::l 30 Z
0 ~ 20
'"
.1 10
ACCUMULATED TRAFFIC, TR (Millions)
Section 3 - Lim estone {Ste. G e neviev e )and Crushed Gravel (Black River )
9 Sl ~ ~ ~
A regression analy,i, indicate, that the ,kid numb.r, or. not ,ignificantly affect.d by accumulated traffic , ,h.refore, a dependable wear factor cannot be calculated .
100
O-SN40
\7 - SN 50
10' '111'11 I' 1 1 '1'1'11' 1111111111 1111111111
.01 .1 10 100
ACCUMULATED TRAFFIC, TR (Millions)
-118-
w-s
I 1
1 ~J
1
I J J

100 90 80
Z 70
'" 60
vi" SO III: w In 40
~ ~ 30
C
:..: 20
'"
Figure XXIII (Continued)
EFFECTS OF TRAFFIC ON SKID NUMBERS ROUTE I-55
PEMISCOT COUNTY
Section 4 - lim e stone (Ste . Genev iev e ) and C rush e d Gravel (Black River)
€I ~ ~ e~
A regression analysis indicates that the skid number s are not significant ly affected by accumulated traffic , ther.fore , a dependable wear 'ador cannot be calculated .
D-SN 40
\7 -SN so
la' 1,111,1" 1,1.1,1111 II'!I"III ""111" 1
.01
100 90 80
Z 70
'" 60 ",' SO III: w In 40
~ => 30 Z C
:..: 20
'"
.1 10
ACCUMULATED TRAFFIC, TR (Millions)
Section 5 - lim e stone (St e . G e n e vie ve ) and Cru s hed Gravel (Block River)
o \l ~ Sl ~~
A regress ion analys is indicates t hat the skid numb e rs o r. n ot s ignificontly affected by accumulated traffic , therefo r e , a dependable weor focto r (annat be colculated .
100
o -SN 40
\7-SN so
10' " "'I! " ! '" '" I I I I I III1I I I I I! I, I,! I I I
.01
100 90 80
Z 70
'" 60 ",' 50 III: w In 40
~ => 30 Z C :..: 20
'"
.1 10
ACCUMULATED TRAFFIC, TR (Millions)
Section 6 - lime s tone (St e. Gen e v iev e) and Cru s hed Grovel (Block River)
Log SN 50 1 . 646 - 0 ~ . 62 (Log :R)~ -
LINEAR REGRESSION ANALYSIS (LOG - LOG RELATIONSHIP) ~ ~
WEAR FACTOR
S y .x
cv (%) ,2
- .056 . 020
2 .3 .579
7
- . 062
.016
2.4 .710
'=:;:" -'" ,'"< ,,'
100
o -SN 4 0
\7 -SN 50
10 I " " ,,, " " "" I I " I """ " I " "" I "I
.01 .1 10 100
ACCUMULATED TRAFFIC, TR (Millions)
-119-
W-6

100 96 80
Z 70
'" 60 ",' 50 CIt
~ 40
~ :J 30 Z
Q
:.:: 20
'"
Figure XXIII (Continued)
EFFECTS OF TRAFFIC ON SKID NUMBERS ROUTE I-55
PEMISCOT COUNTY
Section 7 - Limestone (Ste . Genevieve) and Crushed Gravel (Black River)
e ~ eo~
A regression analysis indicate, that the skid numbers or. not significantly affected by accumulated traffic , ther.for. , a dependable wear factor cannot b. calculated .
O-SN40
\7- SN so
10' "',,11 II ""11 " 11 "'''tI'" 11''''''11 .01
100 90 80
Z 70
'" 60 ",' 50 CIt
~ 40
~ :J 30 Z Q
:.:: 20
'"
.1 10
ACCUMULATED TRAFFIC, TR (Millions)
Section 8 - Limestone (Ste . G e nev ieve) and Crushed Gravel (Black River)
@ @ g~W
A regression analysis indicotes that the skid numbers or. not signjficantly affected
by accumulated traffic , therefor • • a dependable wear 'actor cannot b. calculated.
100
O-SN40
\7 -SN SO
10' I, 1,1,1 I II I, I, ,,, I I I I I 'III'I I I I, IIIII I I I
.01
100 90 80
Z 70
'" 60 ",' 50 CIt w CO 40
~ :J 30 Z Q
:.:: 20
'"
.1 10
ACCUMULATED TRAFFIC, TR (Millions)
Section 9 - Lim es tone (St •. G e nev ieve) and Crushed Gravel (Block River)
~""~ ."
LINEAR REGRESSION ANALYSIS (LOG - LOG RELATIONSHIP) ~ ~
WEAR FACTOR - .053
s y .x CV (%) ,2
.014 2 . 2
.7 08
• A regression analysis indicates that the skid numb.r, or. not significontly aff.cted by accumulated traffic, th.r.for., a dependable .ear factor cannot be calculated.
100
O - SN40
\7 -SN SO
10 I I I I, I' I " I , I I '" I II II I I'" I II I , I , II I I I !
.01 .1 10 100
ACCUMULATED TRAFFIC, TR (Millions)
-120-
W-7 r 1
I ]
)
1
J
J
J J

Distinctive Characteristics
ROUTE TT
JASPER COUNTY
X-I
This special asphaltic concrete pavement utilized flint chat as coarse aggregate
and sand as fine aggregate.
Discussion of Results
Average SN40 was about 57. However, very little data was accumulated. No
significant trends were established for TR.
Description of Project
Project 7-U-TT-8 involved a special asphaltic concrete pavement (Mix #JFC75-37)
completed in March, 1976.
The mix contained 74.0% flint chat (Joplin flint chat) (93.8% -3/8"), 13.0%
Missouri River sand, 6.0% mineral fIller, and 7.0% asphalt (6(}'70). Composition of the
mix, based on weight of total mix, was 93.0% mineral aggregate and 7.0% asphalt with
4.6% +3/8" and 49.6% +#10 material.
One four-lane undivided pavement section (0.970 miles in length) was tested.
The section had five tests in position 2 in each direction for each test speed.
Skid tests and traffic data are shown in Table XXIV and plotted in Figure XXIV.
-121-

Figure XXIV
EFFECTS OF TRAFFIC ON SKID NUMBERS ROUTE TT
100~S.ct i on I • Fl i nt Chat 90
Z ~:I- A lit 60E- tj on 50 .. = 40 ~ :» 30 Z o ~ 20 lit
JASPER COUNTY
e o sa
A r •• , ... lon analy.is Ind lcat •• that the sk id numbers or. net . lln itl (an,I, affecteel by a ccuMul.t.d traff ic, ther.for. , a depenclabl ••• ar foctor cannot b. calcu lat.eI.
6 · SN20
O · SN30
D·SN4o
10 I I , I"" I II I II eI II I I I I I I I ," I I II " II ,,' I II
.0 1 .1 ,0 100
ACCUMULATED TRAFFIC, TR (Millions'
-122-
J J J

V-I
ROUTE 1-44
ST. LOUIS COUNTY
Distinctive Characteristics This special asphaltic concrete pavement utilized steel slag and sand as aggregate.
Discussion of Results
Data is very limited on this project. Although SN40 appears to be dropping,
no significant trends have been established for TR.
Description of Project
Project 6-1-44-109 (Third Street Viaduct) was an asphaltic concrete pavement
(Mix #SS75-43) completed in August, 1975.
The mix contained 62.5% 1/2" steel slag (97.0% -3/8"), 17.0% 1/4" steel slag
(98.8% -#4), 1l.0% Missouri River sand, 4.0% mineral filler, and 5.5% asphalt (60-70).
Composition of the mix, based on weight of total mix, was 94.5% mineral aggregate and
5.5% asphalt with 1.9% +3/8" and 57.2% +#10 material.
Two two-lane divided pavement sections (each 0.620 miles in length) were tested.
The eastbound and westbound sections each had five tests in positions 2 and 4 for each
test speed.
Skid tests and traffic data are shown in Table XXV and plotted in Figure XXV.
-123-

TABLE XXV
SKID TESTS AND TRAFFIC DATA
ROUTE I-44 ST. LOUIS COUNTY
SN SN AADT Age in Date Tested --.iQ. --2.Q LLane Months
Eastbound Section - Position 2 - Steel Slag
9/30/75 41.6 35.4 14,182 2 4/30/76 38.4 33.5 15,034 9 9/21/76 36.5 29.7 15,034 14 6/ 7/77 28.5 23.4 15,034 23
Eastbound Section - Position 4 - Steel Slag
9/30/75 40.1 34.7 14,182 2 4/30/76 39.8 32.5 15,034 9 9/21/76 37.0 32.0 15,034 14 6/ 7/77 29'.6 25.7 15,034 23
Westbound Section - Position 2 - Steel Slag
9/30/75 40.9 35.9 14,651 2 4/30/76 41.8 35.7 15,530 9 9/21/76 36.4 33.5 15,530 14 6/ 7/77 32.0 27.6 15,530 23
Westbound Section - Position 4 - Steel Slag
9/30/75 39.0 35.7 14,651 2 4/30/76 41.5 35.4 15,530 9 9/21/76 33.6 31. 0 15,530 14 6/ 7/77 29.2 25.8 15,530 23
-124-
Y-2
Est. Acc. Traffic,TR
851,000 3,931,000 6,186,000
10,246,000
851,000 3,931,000 6,186,000
10,246,000
879,000 4,061,000 6,391,000
10,584,000
879,000 4,061,000 6,391,000
10,584,000
1
1 1
J
J
J

Figure XXV
EFFECTS OF TRAFFIC ON SKID NUMBERS ROUTE 1-44
ST. LOUIS COUNTY
l00r-Eastbound Se ction - Po s it ion 2 - Stee l Slag 90 80
Z 70
'" 60 ",' SO ac ... aJ 40
~ :;, 30 Z
o ~ 20
'"
o \l o
\l o \l o
\l
A regression analysis ind icates that the skid numbers a re not significantly affected by accumulated traffic , therefo re, a dependabl e w e a r factor cannot be calculated.
O - SN40
\7 -SN so
101 1.1""111 '''''''III ,I""dlll ''''''' 1 11 .01
80
100~Eostbound 90
Z 70
'" 60 .;; SO ac ... aJ 40
~ :;, 30 Z o ~ 20
'"
.1
ACCUMULATED TRAFFIC, TR (Millions)
Sect ion - Position 4 -S t eel Slag
o \l
o \l
o \l
10
o \l
A regression analys is ind icates that the sk id number s are not significantly affected by accumu lated traffic , therefore, a dependable we ar factor cannot be calculated .
100
O - SN40
\l-SN SO
101 1.'''''111 I.!tldlll 1""""1 I""dlll
.01 .1 10
ACCUMULATED TRAFFIC, TR (Millions)
100I-Westbound Section - Pos ition 2 - Stee l Sl o g 90 80
Z 70
'" 60
'" 50
~ "~ ~ 30
0 ~ 20
'"
0 0 \l \l 9 0
\l
A regression analysis ind icates that the sk id numbe r s are not s ignificantly affected by accumulated traff ic, therefore, a dependable wear factor cannot b. calculat.d.
100
O - SN40
\7- SN so
10' 1"""111 1"""111 ,.'!I,'"' lelII,' III
.01 .1 10 100
ACCUMULATED TRAFFIC, TR (Millions)
-125-
Y-3

100 90 80
Z 70 en 60
vi 50 co: ... lID 40
~ ::::I 30 Z o ~ 20 on
Figure XXV (Continued)
EFFECTS OF TRAFFIC ON SKID NUMBERS ROUTE 1-44
ST. lOUIS COUNTY
Westbound Section - Pos itio n 4 -Steel Slag
8 o 'V ~ 0
\7
A regression analysis indic ates thot the skid numbers or. not significantly affected by accumulated traffic , ther.fare t a dependable wear factor cannot b. calculated .
O-SN40
\7 - SN so
la' I, IIIII II I, I! III I I! I,!! III I I I !! I, I., I II
.01 .1 10 100
ACCUMULATED TRAFFIC, TR (Millions)
-126-
Y-4
1
1
1 ~1
]
J
J J

11111111111111111 II]ijlijlil~~~~ 11111 11111 11111111
R00008633
~ ". . , I J "' ..
• 'I '. ,,";., " \: : ; " . ' ; ~ ': j I • " , ~ \ :
r r r f
r
r
[
[
l [
[
[ ,
l
L L