an introduction to security valuation - cengage€¦ · an introduction to security valuation 20...
TRANSCRIPT

W E B C H A P T E R
An Introduction to SecurityValuation
20
NEL
We defined an investment as a commitment of funds to derive areturn that would compensate the investor for the time during whichthe funds are invested, for the expected rate of inflation over theinvestment horizon, and for the uncertainty involved. From this defi-nition, we know that the first step in making an investment is deter-mining the required return.
Most investments have expected cash flows and a stated marketprice (e.g., common stock), and you must estimate a value for theinvestment to determine if its current market price is consistent withyour estimated intrinsic value.You must estimate the intrinsic value ofthe security based on its expected cash flows and your required return.
Recall that in Chapter 8 we discussed the two general approachesto the valuation process: (1) the top-down, three-step approach; or(2) the bottom-up, stock valuation, stock-picking approach.The dif-ference between the two is the perceived importance of the economyand a firm’s industry on the valuation of a firm and its stock. Both canbe implemented by either fundamentalists or technicians.
Advocates of the top-down, three-step approach believe that boththe economy/market and the industry effect have a significant impacton the total returns for individual stocks. In contrast, those whoemploy the bottom-up, stock-picking approach contend that it is pos-sible to find underrated stocks relative to their market price, and thesestocks will provide superior returns regardless of the market andindustry outlook.
Both of these approaches have numerous supporters, and advocatesof both approaches have been quite successful.1 In this book, we advo-cate and present the top-down, three-step approach because of itslogic and empirical support. Although we believe that a portfoliomanager or an investor can be successful using the bottom-upapproach, we believe that it is more difficult to be successful becausethese stock pickers ignore substantial information from an analysis ofthe outlook for the market and the firm’s industry.This chapter willfocus on valuation techniques.
After you read this chapter, youshould be able to answer the following questions:
1. When valuing an asset, whatare the required inputs?
2. After you have valued an asset,what is the investment decisionprocess?
3. How do you determine thevalue of bonds and preferredstock?
4. What are the two primaryapproaches to the valuation ofcommon stock and under whatconditions is it best to use either one?
5. What is the dividend discountmodel (DDM), and what is itslogic and its limitations?
6. How do you apply the DDM tothe valuation of a firm that isexpected to experience tempo-rary supernormal growth?
7. How do you apply the presentvalue of operating cash flowand the present value of freecash flow to equity techniques?
8. How do you apply the relativevaluation approach?
9. What additional factors must beconsidered when estimating therequired return and growth ratefor a foreign security?
1 For the history and selection process of a legendary stock picker, see Hagstrom (2001)or Lowenstein (1995).
20Ch20.qxd 1/6/10 3:25 PM Page 51
52 PART 7 Valuation Principles and Practices
NEL
20.1 Theory of Valuation
You may recall from your earlier studies that the value of an asset is the present value of itsexpected returns. This process of valuation requires estimates of (1) the stream of expectedreturns and (2) the required return on the investment (its discount rate).
20.1.1 Stream of Expected Returns (Cash Flows)Estimating an investment’s expected returns encompasses not only the size but also the form,time pattern, and uncertainty of returns, which affect the required return.
Form of Returns Investment returns can take many forms, including earnings, cash flows, div-idends, interest payments, or capital gains (increases in value) during a period.We will con-sider several valuation techniques that use different forms of returns. For example, onecommon stock valuation model applies a multiplier to a firm’s earnings, another model com-putes the present value of a firm’s operating cash flows, and a third model estimates thepresent value of dividend payments. Returns or cash flows can come in many forms, and youmust consider all of them to evaluate an investment.
Time Pattern and Growth Rate of Return An accurate value for a security must include anestimate of the timing and size of the future cash flows. Because money has a time value, youmust estimate the time pattern and growth returns (cash flows) from an investment.
20.1.2 Required Rate of ReturnUncertainty of Returns (Cash Flows) Recall from Chapter 1 that the required return on aninvestment is determined by (1) the economy’s real risk-free return, plus (2) the expected rateof inflation during the holding period, plus (3) a risk premium determined by the uncertaintyof returns.The factor that causes a difference in required rates of return is the risk premium forinvestments,which in turn depends on the uncertainty of the investments’ returns or cash flows.
We can identify the sources of the uncertainty of returns by the internal characteristics ofassets or by market-determined factors. Earlier, we subdivided the internal characteristics fora firm into business risk (BR), financial risk (FR), liquidity risk (LR), exchange rate risk(ERR), and country risk (CR).The market-determined risk measures are the systematic riskof the asset (its beta), or a set of multiple risk factors that were discussed in Chapter 7.
20.1.3 Investment Decision Process: A Comparison of Estimated Values and Market Prices
To ensure that you receive your required return on an investment, you must estimate theinvestment’s intrinsic value using your required return and then compare this value to theprevailing market price. If the market price exceeds your estimated value, you should not buythe investment. In contrast, if the intrinsic value of the investment exceeds the market price,you should buy the investment.
For example, you read about a firm that produces athletic shoes and its stock is listed on theTSX. Using one of the valuation models we will discuss, you estimate the intrinsic stock value is$20 per share.After estimating this value, you look on the web and see that the stock is currentlyselling for $15.You would want to buy this stock. In contrast, if the current market price was $25per share,you would not want to buy because,based upon your valuation, the stock is overvalued.
The theory of value provides a common framework for the valuation of all investments.Different applications of this theory generate different estimated values for various invest-ments because of the different payment streams and security characteristics.A bond’s interestand principal payments differ substantially from the expected dividends and future sellingprice for a common stock.The initial discussion that follows applies the discounted cash flow
20Ch20.qxd 1/6/10 3:25 PM Page 52

WEB CHAPTER 20 An Introduction to Security Valuation 53
NEL
2 The annuity factors and present value factors are contained in Appendix D at the end of the book, although financial cal-culators or Excel can make this calculation very easy.3 If we used annual compounding, this would be 0.239 rather than 0.2314.We use semi-annual compounding because itis consistent with the interest payments and is used in practice.
method to bonds, preferred stock, and common stock.This presentation demonstrates that thesame basic model is useful across a range of investments. Subsequently, because of the diffi-culty in estimating the value of common stock, we consider two general approaches andnumerous techniques for the valuation of stock.
20.2 Valuation of Investments
20.2.1 Valuation of BondsBond valuation is relatively easy because the size and time pattern of cash flows from the bondover its life are known.A bond typically promises
1. Interest payments every six months equal to one-half the coupon rate times the face value ofthe bond
2. The payment of the principal on the bond’s maturity date
For example, in 2010, a $10,000 bond due in 2025 with a 10% coupon will pay $500 everysix months for its 15-year life. In addition, the bond issuer promises to pay the $10,000 prin-cipal at maturity in 2025.Therefore, assuming the bond issuer does not default, the investorknows what payments (cash flows) will be made and when they will be made.
Applying the valuation theory—which states that the value of any asset is the presentvalue of its cash flows—the value of the bond is the present value of the interest paymentsand the present value of the principal repayment.The only unknown for this asset (assumingthe borrower does not default) is the required return that should be used to discount theexpected stream of returns (cash flows). If the prevailing nominal risk-free rate is 7% and theinvestor requires a 3% default risk premium on this bond, the required return would be 10%.
The present value of the semi-annual interest payments is an annuity for 30 periods (15years every six months) at one-half the required return (5%):2
The present value of the principal is likewise discounted at 5% for 30 periods:3
This can be summarized as follows:
Total Present Value of Bond at 10% � $10,000
Present Value of Principal Payment $10,000 � 0.2314 � 2,314
Present Value of Interest Payments $500 � 15.3725 � $7,686
(Present Value of the Principal Payment at 10%)
$10,000 � 0.2314 � $2,314
(Present Value of Interest Payments at 10%)
$500 � 15.3725 � $7,686
20Ch20.qxd 1/6/10 3:25 PM Page 53

54 PART 7 Valuation Principles and Practices
NEL
4 To test your mastery of bond valuation, check that if the required return were 8%, the value of this bond would be $11,729.
This is the price that an investor should be willing to pay for this bond, assuming that therequired return on a bond of this risk class is 10%. If the bond’s market price is more than$10,000, the investor should not buy it because the promised yield to maturity at this higherprice will be less than the investor’s required return.
Alternatively, assuming an investor requires a 12% return on this bond, its value would be:
This example shows that if you want a higher return, you will not pay as much for the bond;that is, a given stream of cash flows has a lower value to you. It is this characteristic that leadsto the often-used phrase that the prices of bonds move in an opposite direction of yields.4
20.2.2 Valuation of Preferred StockPreferred stock owners receive a promise to pay a stated dividend, usually each quarter, for aninfinite period. Preferred stock is a perpetuity because it has no maturity.As was true witha bond, stated payments are made on specified dates although the issuer of this stock does nothave the same legal obligation to pay investors as do issuers of bonds. Payments are made onlyafter the firm meets its debt obligations. Because this increases the uncertainty of returns,investors demand a higher return on a firm’s preferred stock than on its bonds.Although thisdifferential in required return should exist in theory, it generally does not exist in practicebecause dividends paid to corporations are typically tax-exempt.This tax advantage stimulatesthe demand for preferred stocks by corporations; and, because of this demand, the yield onpreferred stocks has generally been below that on the highest grade corporate bonds.
Because preferred stock is a perpetuity, its value is simply the stated annual dividenddivided by the required return on preferred stock (kp) as follows:
Consider a $100 par value preferred stock that pays a dividend of $8 per year. Because of theexpected inflation, the uncertainty of the dividend payment, and the tax advantage to you asa corporate investor, assume that your required return on this stock is 9%.Therefore, the valueof this preferred stock to you is
As before, if the current market price of the share is $95, you would decide against a pur-chase, whereas if it is $80, you would buy. Lastly, given the market price of preferred stock,
� $88.89
V �$8
0.09
V �Dividend
kp
Total Present Value of Bond at 12% � $8,623
$10,000 � 0.1741 � 1,741
$500 � 13.7648 � $6,882
20Ch20.qxd 1/6/10 3:25 PM Page 54
WEB CHAPTER 20 An Introduction to Security Valuation 55
NEL
you can derive its promised yield. Assuming a current market price of $85, the promisedyield would be
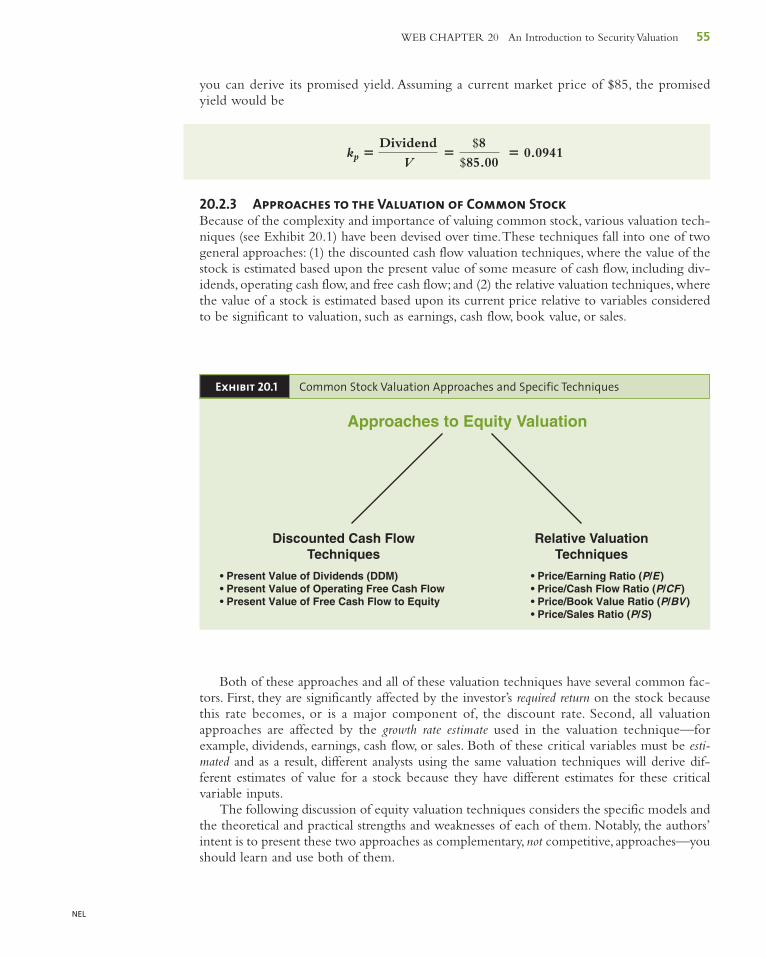
20.2.3 Approaches to the Valuation of Common StockBecause of the complexity and importance of valuing common stock, various valuation tech-niques (see Exhibit 20.1) have been devised over time.These techniques fall into one of twogeneral approaches: (1) the discounted cash flow valuation techniques, where the value of thestock is estimated based upon the present value of some measure of cash flow, including div-idends, operating cash flow, and free cash flow; and (2) the relative valuation techniques, wherethe value of a stock is estimated based upon its current price relative to variables consideredto be significant to valuation, such as earnings, cash flow, book value, or sales.
kp �Dividend
V �
$8$85.00
� 0.0941
Exhibit 20.1 Common Stock Valuation Approaches and Specific Techniques
Discounted Cash FlowTechniques
Relative ValuationTechniques
• Price/Earning Ratio (P/E )• Price/Cash Flow Ratio (P/CF )• Price/Book Value Ratio (P/BV )• Price/Sales Ratio (P/S)
• Present Value of Dividends (DDM)• Present Value of Operating Free Cash Flow• Present Value of Free Cash Flow to Equity
Approaches to Equity Valuation
Both of these approaches and all of these valuation techniques have several common fac-tors. First, they are significantly affected by the investor’s required return on the stock becausethis rate becomes, or is a major component of, the discount rate. Second, all valuationapproaches are affected by the growth rate estimate used in the valuation technique—forexample, dividends, earnings, cash flow, or sales. Both of these critical variables must be esti-mated and as a result, different analysts using the same valuation techniques will derive dif-ferent estimates of value for a stock because they have different estimates for these criticalvariable inputs.
The following discussion of equity valuation techniques considers the specific models andthe theoretical and practical strengths and weaknesses of each of them. Notably, the authors’intent is to present these two approaches as complementary, not competitive, approaches—youshould learn and use both of them.
20Ch20.qxd 1/6/10 3:25 PM Page 55
56 PART 7 Valuation Principles and Practices
NEL
20.2.4 Why and When to Use the Discounted Cash Flow Valuation Approach
Discounted cash flow valuation techniques are obvious choices for valuation because they arethe epitome of how we describe value—the present value of expected cash flows.The maindifference between the techniques is how one specifies cash flow.
The most straightforward measure of cash flow is dividends because these go directly tothe investor, which implies that you should use the cost of equity as the discount rate. How-ever, this dividend technique is difficult to apply to non-dividend-paying firms, or firms thatpay very limited dividends because they have high return investment alternatives available. Onthe other hand, an advantage is that the reduced form of the dividend discount model (DDM)is very useful when discussing valuation for a stable, mature entity where the assumption ofrelatively constant growth for the long term is appropriate.
The second specification of cash flow is the operating free cash flow, which is generallydescribed as cash flows after direct costs (cost of goods, and S, G & A expenses) and afterallowing for cash flows to support working capital outlays and capital expenditures requiredfor future growth, but before any payments to capital suppliers. Because we are dealing withthe cash flows available for all capital suppliers, the discount rate employed is the firm’s weightedaverage cost of capital (WACC ). This is a very useful model when comparing firms with diversecapital structures because you determine the value of the total firm (the entity value) and thensubtract the value of the firm’s debt obligations to arrive at a value for the firm’s equity.
A third cash flow measure is free cash flow to equity, which is a measure of cash flows sim-ilar to the operating free cash flow described above, but after payments to debt holders, whichmeans that these are cash flows available to equity owners.Therefore, the appropriate discountrate is the firm’s cost of equity.
Beyond being theoretically correct, these models allow a substantial amount of flexibilityin terms of changes in sales and expenses that implies changing growth rates over time. Onceyou understand how to compute each measure of cash flow, cash flow estimates can be madefor each year by constructing a pro forma statement for each year or you can estimate overallgrowth rates for the various cash flow values.
A shortcoming with these valuation methods is that they are very dependent on the twosignificant inputs—(1) the growth rates of cash flows (both the rate of growth and the dura-tion of growth) and (2) the estimate of the discount rate.As we will show in several instances,a small change in either of these values can have a significant impact on the estimated value.
20.2.5 Why and When to Use the Relative Valuation TechniquesWhile discounted cash flow valuation models can derive intrinsic values that are substantiallyabove or below prevailing prices depending on how your estimated inputs have been adjusted.An advantage of the relative valuation techniques is that they provide information about howthe market is currently valuing stock at several levels—that is, the aggregate market, alternativeindustries, and individual stocks within industries.
The bad news about relative valuation techniques is that they do not provide guidanceon whether these current valuations are appropriate. This means all valuations at somepoint in time could be too high or too low. For example, assume that the market becomessignificantly overvalued. If you were to compare the value for an industry to the veryovervalued market, you might contend based on such a comparison that an industry isundervalued relative to the market. Unfortunately, your judgment may be wrong becauseof the benchmark you are using—that is, you might be comparing a fully valued industryto a very overvalued market. Alternatively, comparing an undervalued industry to a grosslyundervalued aggregate market, the industry will appear overvalued by comparison.
20Ch20.qxd 1/6/10 3:25 PM Page 56

WEB CHAPTER 20 An Introduction to Security Valuation 57
NEL
Therefore, the relative valuation techniques are appropriate to consider under twoconditions:
1. You have a good set of comparable entities—that is, comparable companies that are similarin terms of industry, size, and, hopefully, risk.
2. The aggregate market and the company’s industry are not at a valuation extreme—that is,they are not either seriously undervalued or overvalued.
20.2.6 Discounted Cash Flow Valuation TechniquesRecall that the basic valuation model says that an asset’s value is the present value of itsexpected future cash flows:
where:Vj � value of Stock jn � life of the asset
CFt � cash flow in Period tk � the discount rate that is equal to the investors’ required return for Asset j, which is
determined by the uncertainty (risk) of the asset’s cash flows
The Dividend Discount Model (DDM) The dividend discount model assumes that the valueof a share of common stock is the present value of all future dividends as follows:5
where:Vj � value of common Stock jDt � dividend during Period tk � required return on Stock j
An obvious question is:What happens when the stock is not held for an infinite period? Asale of the stock at the end of Year 2 would imply the following formula:
Vj � D1
(1 � k) �
D2
(1 � k)2 � SPj2
(1 � k)2
�an
t�1
Dt
(1 � k) t
Vj � D1
(1 � k) �
D2
(1 � k)2 � D3
(1 � k)3 � p � D�
(1 � K)�
Vj �an
t�1
CFt
(1 � k) t
5 This model was initially set forth in Williams (1938) and subsequently reintroduced and expanded by Gordon (1962).
20Ch20.qxd 1/6/10 3:25 PM Page 57
58 PART 7 Valuation Principles and Practices
NEL
The value is equal to the two dividend payments during Years 1 and 2 plus the sale price (SP)for Stock j at the end of Year 2.The expected selling price of Stock j at the end of Year 2(SPj2) is simply the value of all remaining dividend payments.
If SPj2 is discounted back to the present by 1/(1 � k)2, this equation becomes
which is simply an extension of the original equation.Whenever the stock is sold, its value(the sale price at that time) will be the present value of all future dividends.When this endingvalue is discounted to the present, you are back to the original dividend discount model.
What about non-dividend-paying stocks? Again, the concept is the same, except that someof the early dividend payments are zero. Notably, there is an expectation that at some point thefirm will start paying dividends. If investors lacked such an expectation, no one would bewilling to buy the security.A firm that does not pay dividends is reinvesting its capital in veryprofitable projects so that its earnings and dividend stream will be larger and grow faster inthe future. In this case, we would apply the DDM as:
where:
D1 � 0; D2 � 0
For short holding periods, the DDM would show that the value is the present value ofseveral dividend payments plus the present value of a closing price that would reflect all futuredividend payments. For longer holding periods we use the infinite period model, which canindicate what factors affect the price-earnings ratio.
Infinite Period Model The infinite period dividend discount model assumes investors esti-mate future dividend payments for an infinite number of periods.
Needless to say, this is a formidable task. We must make some simplifying assumptionsabout this future stream of dividends to make the task viable.The easiest assumption is thatthe future dividend stream will grow at a constant rate infinitely. This is a rather heroic assumptionin many instances, but where it does hold, we can use the model to value individual stocks aswell as the aggregate market and alternative industries.This model is generalized as follows:
Vj �D0 (1 � g)
(1 � k)�
D0 (1 � g)2
(1 � k)2 � p � D0 (1 � g)n
(1 � k)n
Vj �D1
(1 � k)�
D2
(1 � k)2 �D3
(1 � k)3 � p �D�
(1 � k)�
�D3
(1 � k)3 �D4
(1 � k)4 � p �D�
(1 � k)�
PV (SPj2) �
D3
(1 � k)�
D4
(1 � k)2 � p �D�
(1 � k)�
(1 � k)2
SPj2 �D3
(1 � k)�
D4
(1 � k)2 � p �D�
(1 � k)�
20Ch20.qxd 1/6/10 3:25 PM Page 58
WEB CHAPTER 20 An Introduction to Security Valuation 59
NEL
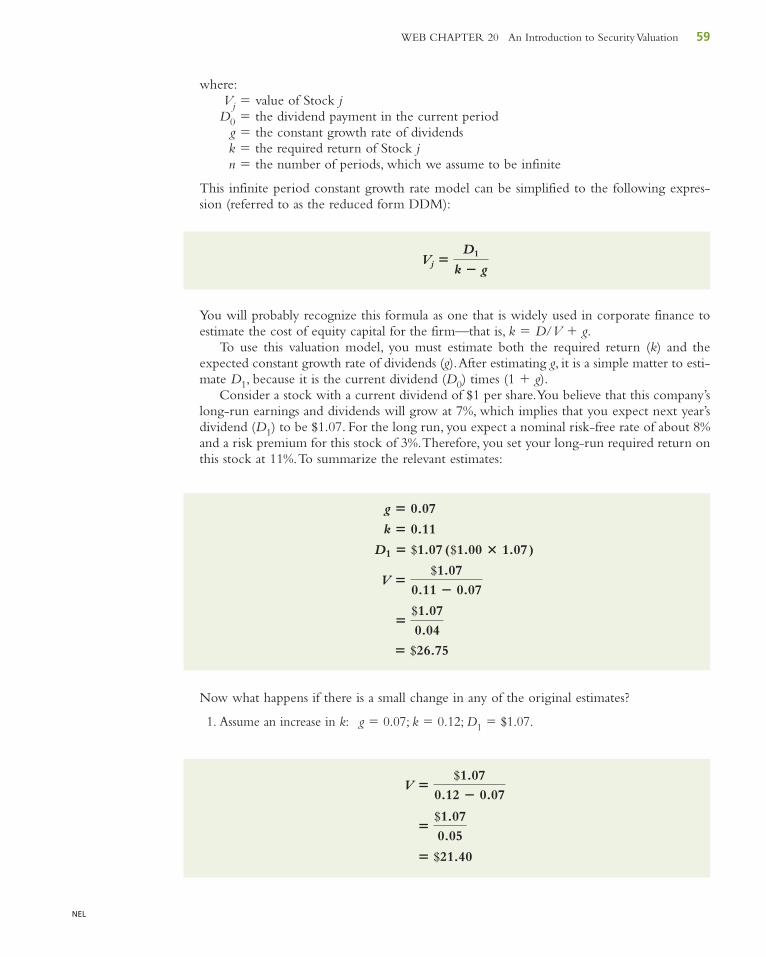
where:Vj � value of Stock jD0 � the dividend payment in the current period
g � the constant growth rate of dividendsk � the required return of Stock jn � the number of periods, which we assume to be infinite
This infinite period constant growth rate model can be simplified to the following expres-sion (referred to as the reduced form DDM):
You will probably recognize this formula as one that is widely used in corporate finance toestimate the cost of equity capital for the firm—that is, k � D/V � g.
To use this valuation model, you must estimate both the required return (k) and theexpected constant growth rate of dividends (g).After estimating g, it is a simple matter to esti-mate D1, because it is the current dividend (D0) times (1 � g).
Consider a stock with a current dividend of $1 per share.You believe that this company’slong-run earnings and dividends will grow at 7%, which implies that you expect next year’sdividend (D1) to be $1.07. For the long run, you expect a nominal risk-free rate of about 8%and a risk premium for this stock of 3%.Therefore, you set your long-run required return onthis stock at 11%.To summarize the relevant estimates:
Now what happens if there is a small change in any of the original estimates?
1. Assume an increase in k: g � 0.07; k � 0.12; D1 � $1.07.
� $21.40
�$1.07
0.05
V �$1.07
0.12 � 0.07
� $26.75
�$1.07
0.04
V �$1.07
0.11 � 0.07
D1 � $1.07 ($1.00 � 1.07)
k � 0.11
g � 0.07
Vj �D1
k � g
20Ch20.qxd 1/6/10 3:25 PM Page 59

60 PART 7 Valuation Principles and Practices
NEL
6 Growth companies are discussed in Salomon (1963) and Miller and Modigliani (1961). Models to value growth companiesare discussed in Chapter 9.
2. Assume an increase in g: g � 0.08; k � 0.11; D1 � $1.08.
These examples show that a small change in either g or k produces a large difference in thestock’s value. The crucial relationship that determines the value of the stock is the spreadbetween the required return (k) and the expected growth rate of dividends (g). Anything causing adecline in the spread will cause an increase in the computed value, whereas any increase inthe spread will decrease the computed value of the stock.
20.2.7 Infinite Period DDM and Growth CompaniesRecall that the infinite period DDM has the following assumptions:
1. Dividends grow at a constant rate and this rate will continue for an infinite period.2. The required return (k) is greater than the infinite growth rate (g). If it is not, the model gives
meaningless results because the denominator becomes negative.
What is the effect of these assumptions if you want to use this model to value the stock of growthcompanies. Growth companies have the opportunities and abilities to earn returns on theirinvestments that are consistently above their required rates of return.6 For example, a firm witha WACC of 12% that is currently earning about 20% on its invested capital would be considereda growth company. In order to exploit these outstanding investment opportunities, these growthfirms generally retain a high percentage of earnings for reinvestment, and their earnings will growfaster than those of the typical firm.You will recall from the discussion in Web Chapter 19 thata firm’s sustainable growth is a function of its retention rate and its return on equity (ROE).
The earnings growth pattern for these growth companies is inconsistent with the assump-tions of the infinite period DDM.First, the infinite period DDM assumes dividends will growat a constant rate indefinitely. Although it is unlikely that these firms can maintain suchextreme growth rates for an infinite period in an economy where other firms will competewith them for these high rates of return.
Second, during the periods when these firms experience abnormally high growth rates,their growth rates probably exceed their required returns.There is no automatic relationshipbetween growth and risk; a high-growth company is not necessarily a high-risk company. Infact, a firm growing at a high constant rate would have lower risk (less uncertainty) than a low-growth firm with an unstable earnings pattern.
20.2.8 Valuation with Temporary Supernormal GrowthSome firms experience periods of abnormally high rates of growth for some finite periods oftime.The infinite period DDM cannot be used to value these true growth firms because thesehigh-growth conditions are temporary and therefore inconsistent with the assumptions of theDDM. In a competitive free enterprise economy, it is not reasonable to expect a company to
� $36.00
�$1.08
0.03
V �$1.08
0.11 � 0.08
20Ch20.qxd 1/6/10 3:25 PM Page 60
WEB CHAPTER 20 An Introduction to Security Valuation 61
NEL
permanently maintain a growth rate higher than its required return as competition will even-tually enter this apparently lucrative business, thus reducing the firm’s profit margins andtherefore its ROE and growth rate.Therefore, after a few years of exceptional growth—thatis, a period of temporary supernormal growth—a firm’s growth rate is expected to decline.Eventually its growth rate is expected to stabilize at a constant level consistent with theassumptions of the infinite period DDM.
To value a temporary supernormal growth company, you must combine the previousmodels. In analyzing the initial years of exceptional growth, examine each year individually.If the company is expected to have two or three stages of supernormal growth, you mustexamine each year during these stages of growth.When the firm’s growth rate stabilizes at arate below the required return, you can compute the remaining value of the firm assumingconstant growth using the DDM and discount this lump-sum constant growth value to thepresent.The technique should become clear as you work through the following example.
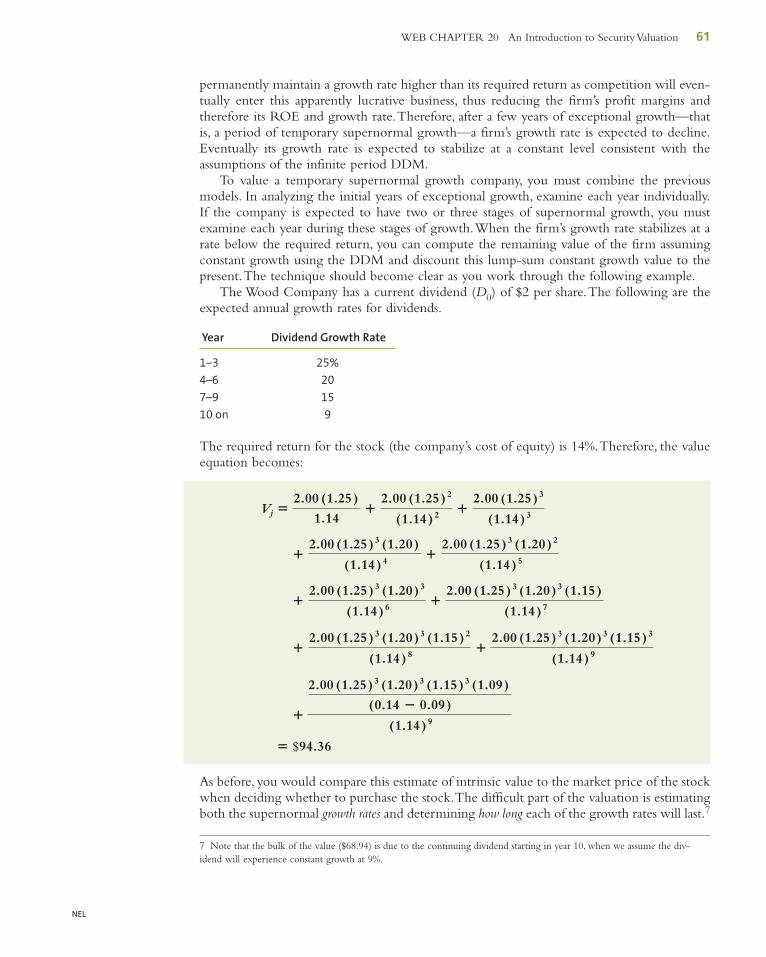
The Wood Company has a current dividend (D0) of $2 per share.The following are theexpected annual growth rates for dividends.
Year Dividend Growth Rate
1–3 25%
4–6 20
7–9 15
10 on 9
The required return for the stock (the company’s cost of equity) is 14%.Therefore, the valueequation becomes:
As before, you would compare this estimate of intrinsic value to the market price of the stockwhen deciding whether to purchase the stock.The difficult part of the valuation is estimatingboth the supernormal growth rates and determining how long each of the growth rates will last.7
� $94.36
�
2.00 (1.25)3 (1.20)3 (1.15)3 (1.09)
(0.14 � 0.09)
(1.14)9
�2.00 (1.25)3 (1.20)3 (1.15)2
(1.14)8 �2.00 (1.25)3 (1.20)3 (1.15)3
(1.14)9
�2.00 (1.25)3 (1.20)3
(1.14)6 �2.00 (1.25)3 (1.20)3 (1.15)
(1.14)7
�2.00 (1.25)3 (1.20)
(1.14)4 �2.00 (1.25)3 (1.20)2
(1.14)5
Vj �2.00 (1.25)
1.14�
2.00 (1.25)2
(1.14)2 �2.00 (1.25)3
(1.14)3
7 Note that the bulk of the value ($68.94) is due to the continuing dividend starting in year 10, when we assume the div-idend will experience constant growth at 9%.
20Ch20.qxd 1/6/10 3:25 PM Page 61

62 PART 7 Valuation Principles and Practices
NEL
8 This includes all debt items and preferred stock.
20.2.9 Present Value of Operating Free Cash FlowsIn this model, the total firm value is determined by discounting the operating free cash flowsprior to the payment of interest to the debt holders but after deducting funds needed tomaintain the firm’s asset base (capital expenditures). Because the total firm’s operating freecash flow is discounted, you would use the firm’s weighted average cost of capital (WACC)as your discount rate. Once the value of the total firm is calculated, you subtract the value ofdebt and preferred stock,8 assuming your goal is to estimate the value of the firm’s equity.Thetotal value of the firm is:
where:Vj � value of Firm jn � number of periods assumed to be infinite
OFCFt � the firm’s operating free cash flow in Period t. The detailed specification ofoperating free cash flow is discussed in Chapter 9.
WACCj � Firm j’s weighted average cost of capital. The computation of the firm’sWACC is discussed in Chapter 9.
Similar to the DDM process, it is possible to envision this as a model that requires estimatesfor an infinite period. Alternatively, if you are dealing with a mature firm whereby its oper-ating cash flows have reached a stage of stable growth, you can adapt the infinite period con-stant growth DDM model as follows:
where:OFCF1 � operating free cash flow in Period 1 equal to OFCF0(1 � gOFCF)
gOFCF � long-term constant growth rate of operating free cash flow
Similarly, assuming that the firm is expected to experience several different growth rates forOFCF, the analyst must estimate the rate of growth and the duration of growth for each ofthese periods.This calculation is demonstrated in Chapter 9.
20.2.10 Present Value of Free Cash Flows to EquityThe third discounted cash flow technique deals with “free” cash flows to equity, which wouldbe derived after operating free cash flows have been adjusted for debt payments (interest andprincipal). These cash flows precede dividend payments to the common stockholder. Suchcash flows are referred to as free because they are what is left after providing the funds neededto maintain the firm’s asset base (similar to operating free cash flow).They are specified as freecash flows to equity because they also adjust for payments to debt holders and to preferredstockholders.
Notably, because these are cash flows available to equity owners, the discount rate used isthe firm’s cost of equity (k) rather than the firm’s WACC.
Vj �OFCF1
WACCj � gOFCF
Vj �an
t�1
OFCFt
(1 � WACCj)t
20Ch20.qxd 1/6/10 3:25 PM Page 62

WEB CHAPTER 20 An Introduction to Security Valuation 63
NEL
where:Vj � value of the stock of Firm jn � number of periods assumed to be infinite
FCFEt � the firm’s free cash flow to equity in Period t.The detailed specification of freecash flow to equity is discussed in Chapter 9.
Again, how an analyst would implement this general model depends upon the firm’s positionin its life cycle.That is, if the firm is expected to experience stable growth, analysts can usethe infinite growth model. In contrast, if the firm is expected to experience a period of tem-porary supernormal growth, analysts should use the multistage growth model similar to theprocess used with dividends and for operating free cash flow.
20.3 Relative Valuation Techniques
Contrasting the various discounted cash flow techniques, the relative valuation techniquesimplicitly maintain that it is possible to determine the value of a market, an industry, or acompany by comparing it to similar entities on the basis of several relative ratios that com-pare its stock price to relevant variables that affect a stock’s value, such as earnings, cash flow,book value, and sales. Therefore, in this section, we discuss the following relative valuationratios: price/earnings (P/E), price/cash flow (P/CF), price/book value (P/BV), price/sales(P/S), and the entity value/EBITDA (EV/EBITDA). We begin with the P/E ratio, alsoreferred to as the earnings multiplier model, because it is the most popular relative valuationratio. In addition, we will show that the P/E ratio can be directly related to the DDM in amanner that indicates the variables that affect the P/E ratio.
20.3.1 Earnings Multiplier ModelMany investors prefer to estimate common stock value by using an earnings multipliermodel.The reasoning for this approach recalls that the value of any investment is the presentvalue of future returns and for common stocks; the returns investors are entitled to receive arethe firm’s net earnings.Therefore, one way investors can estimate value is by determining howmany dollars they are willing to pay per dollar of expected earnings (typically represented by theestimated earnings during the following 12-month period or an estimate of “normalized earn-ings”).For example, if investors are willing to pay 10 times expected or “normal”earnings, a stockthey expect to earn $2 per share during the following year would be valued at $20.The prevailingearnings multiplier, also referred to as the price/earnings (P/E) ratio, is computed as follows:
This indicates the prevailing attitude of investors toward a stock’s value and investors mustdecide if they agree with the prevailing P/E ratio (i.e., is the earnings multiplier too high ortoo low?) based upon how it compares to the P/E ratio for the aggregate market, for thefirm’s industry, and for similar firms and stocks.
�Current Market Price
Expected 12-Month Earnings
Earnings Multiplier � Price/Earnings Ratio
Vj �an
t�1
FCFEt
(1 � kj)t
20Ch20.qxd 1/6/10 3:25 PM Page 63
64 PART 7 Valuation Principles and Practices
NEL
9 When computing historical P/E ratios, the practice is to use earnings for the past 12 months rather than expected earn-ings.Although this will influence the level, it demonstrates the changes in the P/E ratio over time.Although it is acceptableuse past P/E ratios for historical comparison, we strongly believe that investment decisions should emphasize future or for-ward P/E ratios that use expected earnings.10 In this formulation of the model we use P rather than V (i.e., the value is stated as the estimated price of the stock).Although the factors that determine the P/E are the same for growth companies, this formula cannot be used to estimatea specific value because these firms often do not have dividends, the infinite growth rate assumption is not valid, and the(k – g) assumptions don’t apply.
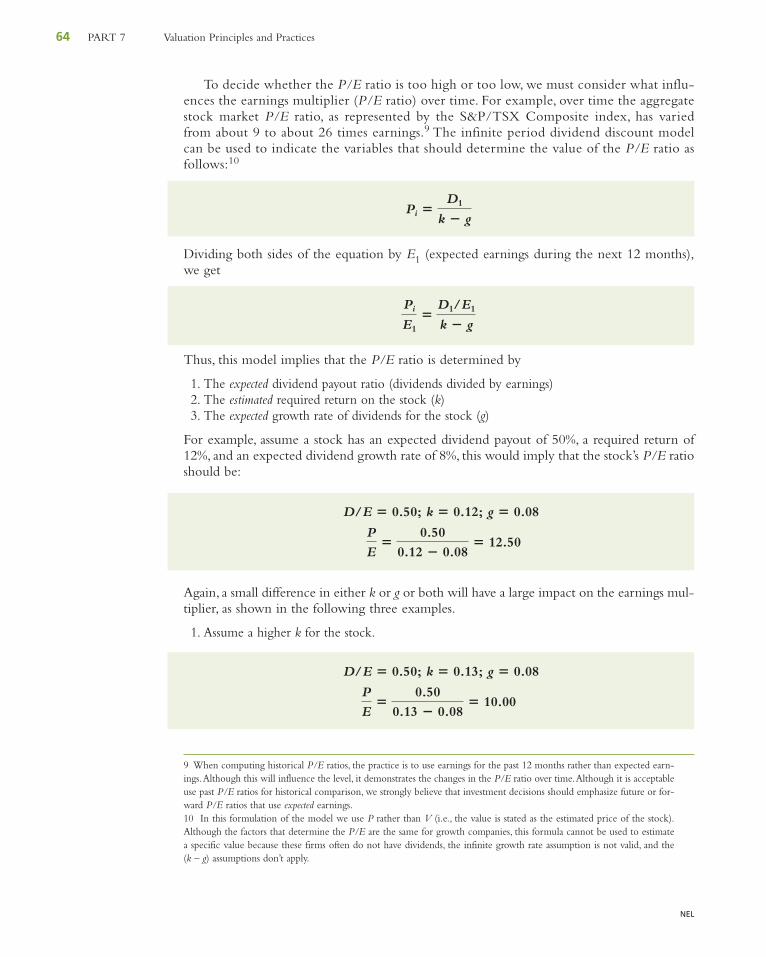
To decide whether the P/E ratio is too high or too low, we must consider what influ-ences the earnings multiplier (P/E ratio) over time. For example, over time the aggregatestock market P/E ratio, as represented by the S&P/TSX Composite index, has variedfrom about 9 to about 26 times earnings.9 The infinite period dividend discount modelcan be used to indicate the variables that should determine the value of the P/E ratio asfollows:10
Dividing both sides of the equation by E1 (expected earnings during the next 12 months),we get
Thus, this model implies that the P/E ratio is determined by
1. The expected dividend payout ratio (dividends divided by earnings)2. The estimated required return on the stock (k)3. The expected growth rate of dividends for the stock (g)
For example, assume a stock has an expected dividend payout of 50%, a required return of12%, and an expected dividend growth rate of 8%, this would imply that the stock’s P/E ratioshould be:
Again, a small difference in either k or g or both will have a large impact on the earnings mul-tiplier, as shown in the following three examples.
1. Assume a higher k for the stock.
P
E�
0.50
0.13 � 0.08� 10.00
D/E � 0.50; k � 0.13; g � 0.08
P
E�
0.50
0.12 � 0.08� 12.50
D/E � 0.50; k � 0.12; g � 0.08
Pi
E1
�D1/E1
k � g
Pi �D1
k � g
20Ch20.qxd 1/6/10 3:25 PM Page 64

WEB CHAPTER 20 An Introduction to Security Valuation 65
NEL
2. Assume a higher g for the stock and the original k.
3. Assume a fairly optimistic scenario where the k for the stock is only 11% and there is ahigher expected dividend growth rate of 9%.
As before, the spread between k and g is the main determinant of the size of the P/E ratio. Althoughthe dividend payout ratio has an impact, we are generally referring to a firm’s long-run targetpayout, which is typically rather stable with little effect on year-to-year changes in the P/Eratio (earnings multiplier).
After estimating the earnings multiple, you would apply it to your estimate of earnings forthe next year (E1) to arrive at an estimated value. In turn, E1 is based on the earnings for thecurrent year (E0) and your expected growth rate of earnings. Using these two estimates, youwould compute an estimated value of the stock and compare this estimated value to itsmarket price.
Consider the following estimates for a firm W:
Using these estimates, you would compute an earnings multiple of:
Given current earnings (E0) of $2.00 and a g of 9%, you would expect E1 to be $2.18.There-fore, the value (price) of the stock is estimated as:
You would then compare this estimated value to the stock’s current market price to decidewhether you should invest in it. This estimate of value is referred to as a two-step processbecause it requires you to estimate future earnings (E1) and a P/E ratio based on expectationsof k and g.These two estimates are discussed in Chapter 9.
20.3.2 The Price/Cash Flow RatioThe relative price/cash flow valuation ratio has become more popular as concerns overthe propensity of some firms to manipulate earnings per share has grown. Cash flow
V � 16.7 � $2.18 � $36.41
P/E �0.50
0.12 � 0.09�
0.50
0.03� 16.7
D/E � 0.50; k � 0.12; g � 0.09; E0 � $2.00
P
E �
0.50
0.11 � 0.09 � 25.00
D/E � 0.50; k � 0.11; g � 0.09
P
E�
0.50
0.12 � 0.09� 16.70
D/E � 0.50; k � 0.12; g � 0.09
20Ch20.qxd 1/6/10 3:25 PM Page 65

66 PART 7 Valuation Principles and Practices
NEL
values are generally less prone to manipulation.The price to cash flow ratio is computedas follows:
where:P/CFj � the price/cash flow ratio for Firm j
Pt � the price of the stock in Period tCFt�1 � the expected cash flow per share for Firm j
The variables that affect this ratio are similar to the P/E ratio. Specifically, the main variablesshould be: (1) the expected growth rate of the cash flow variable used, and (2) the risk of thestock as indicated by the uncertainty or variability of the cash flow series over time.The spe-cific cash flow measure used will vary depending upon the nature of the company andindustry and which cash flow specification (e.g., operating cash flow or free cash flow) is thebest measure of performance for this industry.11 An appropriate ratio can also be affected bythe firm’s capital structure.
20.3.3 The Price/Book Value RatioThe price/book value (P/BV) ratio has been widely used for many years by analysts inthe banking industry as a measure of relative value.The book value of a bank is typicallyconsidered a good indicator of intrinsic value because most bank assets, such as bonds andcommercial loans, have a value equal to book value. This ratio gained in popularity andcredibility as a relative valuation technique for all types of firms based upon a study byFama and French (1992) that indicated a significant inverse relationship between P/BVratios and excess rates of return for a cross-section of stocks.The P/BV ratio is specifiedas follows:
where:P/BVj � the price/book value ratio for Firm j
Pt � the price of the stock in Period tBVt�1 � the estimated end-of-year book value per share for Firm j
As with other relative valuation ratios, it is important to match the current price with thebook value that is expected to prevail at the end of the year.The difficulty is that this futurebook value is not generally available. One can derive an estimate of the end-of-year bookvalue based on the historical growth rate for all series or use the growth rate implied by thesustainable growth formula: g � ROE � Retention Rate.
The factors that determine the size of the P/BV ratio are a function of the firm’s ROErelative to its cost of equity as the ratio would be 1 if they were equal—that is, if the firm
P/BVj �Pt
BVt�1
P/CFj �Pt
CFt�1
11 While there has been a tendency to employ EBITDA as the proxy for cash flow, we do not recommend or encouragethis because of the strong upward bias of this series compared to other cash flow measures, as noted in Web Chapter 19.
20Ch20.qxd 1/6/10 3:25 PM Page 66

WEB CHAPTER 20 An Introduction to Security Valuation 67
NEL
earned its required return on equity. In contrast, if the firm’s ROE is much larger than its costof equity, it is a growth company and investors should be willing to pay a premium price overits book value for the stock.
20.3.4 The Price/Sales RatioThe price/sales (P/S) ratio has a volatile history. It was a favourite of Phillip Fisher (1984), awell-known money manager in the late 1950s, as well as his son Kenneth Fisher (1984) andSenchack and Martin (1987). Recently, the P/S ratio has been suggested as useful by MartinLeibowitz (1997), a widely admired stock and bond portfolio manager.These advocates con-sider this ratio meaningful and useful for two reasons. First, they believe that strong and con-sistent sales growth is a requirement for a growth company. Although they note theimportance of an above-average profit margin, they contend that the growth process begins withsales. Second, given all the data in the balance sheet and income statement, sales informationis subject to less manipulation than any other data item.The specific P/S ratio is:
where:P/Sj � the price to sales ratio for Firm j
Pt � the price of the stock in Period tSt�1 � the expected sales per share for Firm j
Again, it is important to match the current stock price with the firm’s expected sales per share,which may be difficult to derive for a large cross-section of stocks.Two caveats are relevantto the price to sales ratio. First, this particular relative valuation ratio varies dramatically byindustry. For example, the sales per share for retail firms, such as Canadian Tire or ShoppersDrug Mart, are typically much higher than sales per share for computer or microchip firms.The second consideration is the profit margin on sales.The point is, retail food stores havehigh sales per share, which will cause a low P/S ratio, which is considered good until onerealizes that these firms have low net profit margins.Therefore, your relative valuation analysisusing the P/S ratio should be between firms in the same or similar industries.
20.3.5 Implementing the Relative Valuation TechniqueTo properly implement the relative valuation technique, it is essential not only to comparethe various ratios but also to understand what factors affect each of the valuation ratios and,therefore, know why they should differ.The first step is to compare the valuation ratio overtime (e.g., the P/E ratio) for a company to the comparable ratio for the market, for thestock’s industry, and to other stocks in the industry to determine how it compares—is it sim-ilar to or is it consistently at a premium or discount? Beyond knowing the overall relation-ship to the market, industry, and competitors, the real analysis is involved in understandingwhy the ratio has or should not have this relationship and the implications of this mismatch.Specifically, the second step is to explain the relationship.To do this, you need to understandwhat factors determine the specific valuation ratio and then compare these factors for thestock being valued versus the same factors for the market, industry, and other stocks.
To illustrate this process, assume you are valuing the stock of a pharmaceutical companyusing the P/E relative valuation technique.As part of this analysis, you compare the P/E ratiosfor this firm over time (e.g., the last 15 years) to similar ratios for the S&P/TSX HealthCare
P/Sj �Pt
St�1
20Ch20.qxd 1/6/10 3:25 PM Page 67
68 PART 7 Valuation Principles and Practices
NEL
index, the pharmaceutical industry, and specific competitors.This comparison indicates thatthe company P/E ratios are consistently above all the other sets. Following this, the secondpart of the analysis considers whether the fundamental factors that affect the P/E ratio (i.e.,the firm’s growth rate and its required return) justify the higher P/E. A positive scenariowould be that the firm had a historical and expected growth rate that was substantially aboveall the comparables and your risk analysis indicates a lower required return due to a lowerbeta.This would indicate that the higher P/E ratio is justified.The subsequent question thatneeds to be considered is: How much higher should the P/E ratio be? Alternatively, the neg-ative scenario for this stock with a P/E ratio above most comparables would be if the com-pany’s expected growth rate was equal to or lower than the industry and competitors’ whileits required k was higher than for the industry and competitors.This set of conditions wouldsignal a stock that is apparently overpriced based on the fundamental factors that determinea stock’s P/E ratio.
In subsequent sections, we discuss how an analyst arrives at estimates for g and k, and wedemonstrated the process in Chapter 9.At this point, the reader should understand the overallprocess required by the relative valuation technique.
20.4 Estimating the Inputs: The Required Return and the Expected Growth Rate
This section deals with estimating two critical inputs to the valuation process irrespec-tive of the approach or technique used: the required return (k) and the expected earn-ings growth rate and other valuation variables—that is, book value, cash flow, sales, anddividends.
20.4.1 Required Return (k)The required return will be the discount rate for most cash flow models and affects all therelative valuation techniques.There is a difference in the discount rate when using the presentvalue of operating free cash flow technique because, as noted, it uses the weighted averagecost of capital (WACC). Notably, the cost of equity is a critical input to estimating the firm’sWACC.
Recall that three factors influence an equity investor’s required return (k):
1. The economy’s real risk-free rate (RRFR)2. The expected rate of inflation (I)3. A risk premium (RP)
The Economy’s Real Risk-Free Rate This is the absolute minimum rate that an investor shouldrequire. It depends on the real growth rate of the investor’s home economy because capitalinvested should grow at least as fast as the economy. Recall that this rate can be affected bytemporary tightness or ease in the capital markets.
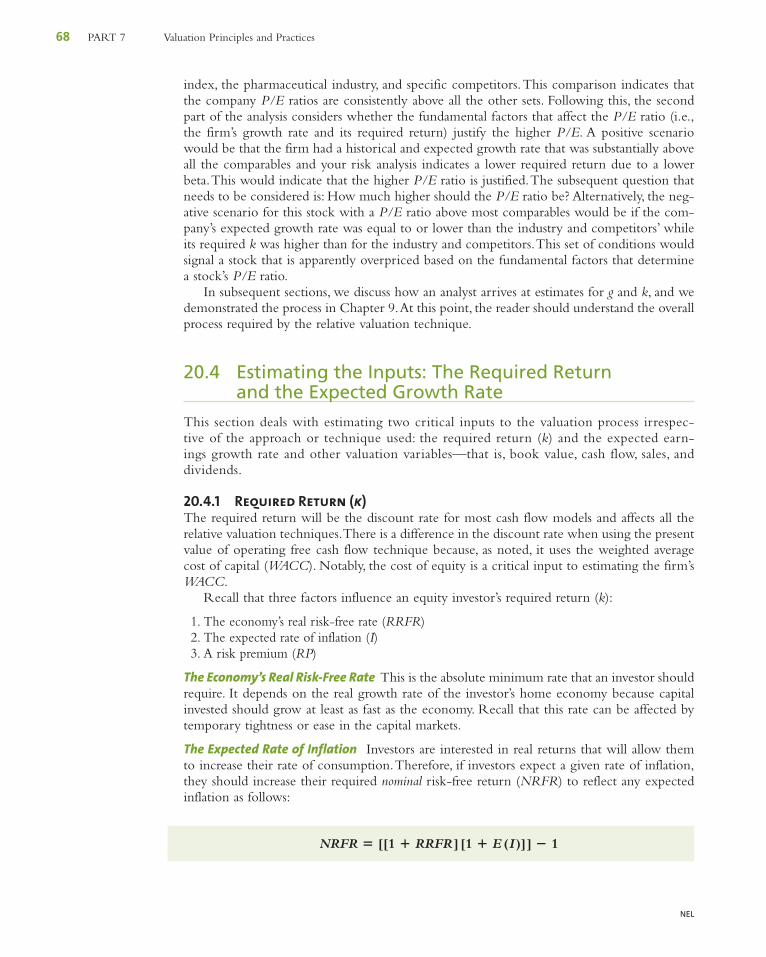
The Expected Rate of Inflation Investors are interested in real returns that will allow themto increase their rate of consumption.Therefore, if investors expect a given rate of inflation,they should increase their required nominal risk-free return (NRFR) to reflect any expectedinflation as follows:
NRFR � [[1 � RRFR][1 � E (I)]] � 1
20Ch20.qxd 1/6/10 3:25 PM Page 68

WEB CHAPTER 20 An Introduction to Security Valuation 69
NEL
where:E(I) � expected rate of inflation
The Risk Premium The risk premium (RP) causes differences in the required returns amonginvestments that range from government bonds to corporate bonds to common stocks.TheRP also explains the difference in the expected return among securities of the same type.For example, this is the reason corporate bonds with different ratings of AAA,AA, or A havedifferent yields, and why different common stocks have widely varying P/E ratios despitesimilar growth expectations.
Recall that risk premiums are demanded because of the uncertainty of returns from an invest-ment.A measure of this uncertainty of returns was the dispersion of expected returns, and sev-eral internal factors influence a firm’s variability of returns, such as its business risk, financial risk,and liquidity risk.As well, firms with significant foreign sales and earnings (e.g., Coca-Cola andMcDonald’s) have additional risk factors, including exchange rate risk and country (political) risk.
Changes in the Risk Premium Because different securities (e.g., government bonds andcommon stocks) have different patterns of returns and different guarantees to investors, weexpect their risk premiums to differ. In addition, a fact that is less recognized is that the riskpremiums for the same securities can change over time. For example, Exhibit 20.2 shows thespread between the yields to maturity for AA and BBB-rated corporate bonds from 2001through 2007.This yield spread, or difference in yield, is a measure of the risk premium forinvesting in higher risk bonds (BBB) compared to low-risk bonds (AA).As shown, the yieldspread varied from about 1% to 1.5% in this short period).
Exhibit 20.2 Time-Series Plot of Corporate Bond Yield Spreads (BBB-AA Yield): 2001–2007
20001
1.05
1.1
1.15
1.2
1.25
1.3
2001 2002 2003 2004Year
Rat
io o
f Rat
es (
%)
2005 2006 2007 2008
Source: Prepared by authors using data from Bloomberg.
20.4.2 Estimating the Required Return for Foreign SecuritiesOur discussion of the required return for investments has been limited to the domesticmarket.Although the basic valuation model and its variables are the same around the world,there are significant differences in the values for specific variables. This section points outwhere these differences occur.
Foreign Real RFR Because the RRFR in other countries should be determined by the realgrowth rate within the particular economy, the estimated rate can vary substantially amongcountries due to differences in an economy’s real growth rate. An example of differences in
20Ch20.qxd 1/6/10 3:25 PM Page 69
70 PART 7 Valuation Principles and Practices
NEL
12 All the estimates of real growth and inflation are from the IMF World Economic Outlook (April, 2008).13 For a thorough analysis of exchange rate determination and forecasting models, see Rosenberg (1996).
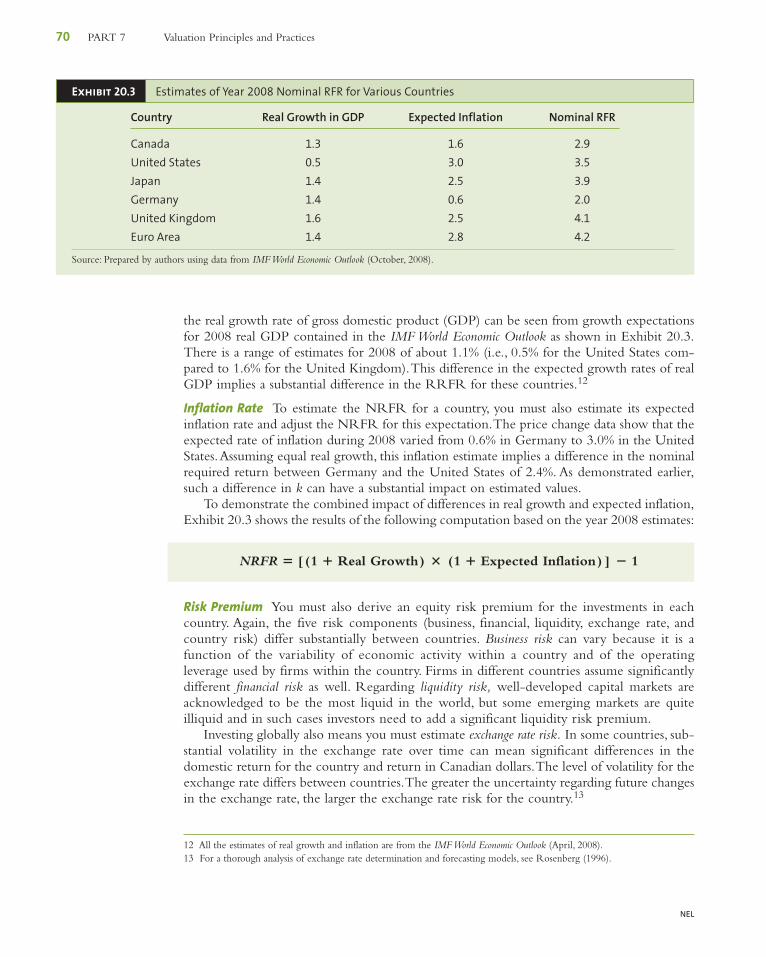
the real growth rate of gross domestic product (GDP) can be seen from growth expectationsfor 2008 real GDP contained in the IMF World Economic Outlook as shown in Exhibit 20.3.There is a range of estimates for 2008 of about 1.1% (i.e., 0.5% for the United States com-pared to 1.6% for the United Kingdom).This difference in the expected growth rates of realGDP implies a substantial difference in the RRFR for these countries.12
Inflation Rate To estimate the NRFR for a country, you must also estimate its expectedinflation rate and adjust the NRFR for this expectation.The price change data show that theexpected rate of inflation during 2008 varied from 0.6% in Germany to 3.0% in the UnitedStates.Assuming equal real growth, this inflation estimate implies a difference in the nominalrequired return between Germany and the United States of 2.4%. As demonstrated earlier,such a difference in k can have a substantial impact on estimated values.
To demonstrate the combined impact of differences in real growth and expected inflation,Exhibit 20.3 shows the results of the following computation based on the year 2008 estimates:
NRFR � [ (1 � Real Growth) � (1 � Expected Inflation) ] � 1
Exhibit 20.3 Estimates of Year 2008 Nominal RFR for Various Countries
Country Real Growth in GDP Expected Inflation Nominal RFR
Canada 1.3 1.6 2.9
United States 0.5 3.0 3.5
Japan 1.4 2.5 3.9
Germany 1.4 0.6 2.0
United Kingdom 1.6 2.5 4.1
Euro Area 1.4 2.8 4.2
Source: Prepared by authors using data from IMF World Economic Outlook (October, 2008).
Risk Premium You must also derive an equity risk premium for the investments in eachcountry. Again, the five risk components (business, financial, liquidity, exchange rate, andcountry risk) differ substantially between countries. Business risk can vary because it is afunction of the variability of economic activity within a country and of the operatingleverage used by firms within the country. Firms in different countries assume significantlydifferent financial risk as well. Regarding liquidity risk, well-developed capital markets areacknowledged to be the most liquid in the world, but some emerging markets are quiteilliquid and in such cases investors need to add a significant liquidity risk premium.
Investing globally also means you must estimate exchange rate risk. In some countries, sub-stantial volatility in the exchange rate over time can mean significant differences in thedomestic return for the country and return in Canadian dollars.The level of volatility for theexchange rate differs between countries.The greater the uncertainty regarding future changesin the exchange rate, the larger the exchange rate risk for the country.13
20Ch20.qxd 1/6/10 3:25 PM Page 70

WEB CHAPTER 20 An Introduction to Security Valuation 71
NEL
Lastly, we need to recognize country risk, such as upheavals in its political or economicenvironment. Before investing in foreign markets, investors must evaluate the additionalreturns they should require to accept this increased uncertainty.
Thus, when estimating required returns on foreign investments, you must assign a uniquerisk premium for each country.
20.4.3 Expected Growth RatesAfter deriving a required return, the investor must estimate the growth rate of sales, cashflows, earnings, and dividends.The initial procedure we describe here is a brief summary ofthe presentation in Web Chapter 19, where we used financial ratios to measure a firm’sgrowth potential. Subsequently, we discuss the use of historical growth rates as an input tothe estimate.
Estimating Growth from Fundamentals The growth rate of dividends is determined by thegrowth rate of earnings and the proportion of earnings paid out in dividends (the payoutratio). Over the short run, dividends can grow faster or slower than earnings if the firmchanges its payout ratio. Specifically, if a firm’s earnings grow at 6% a year and it pays outexactly 50% of earnings in dividends, then the firm’s dividends will likewise grow at 6% ayear.Alternatively, if a firm’s earnings grow at 6% a year and the firm increases its payout, thenduring the period when the payout ratio increases, dividends will grow faster than earnings.Because there is a limit to how long this difference in growth rates can continue, mostinvestors assume that the long-run dividend payout ratio is fairly stable.Therefore, our analysisof the dividend growth rate concentrates on an analysis of the growth rate of equity earnings.Also, as shown in Chapter 9, equity earnings are the main factor driving the operating cashflows or the free cash flows for the firm.
When a firm retains earnings to acquire additional assets, it hopefully earns some pos-itive return on these additional assets.This means the firm’s earnings will increase becauseits asset base is larger. How rapidly a firm’s earnings increase depends on (1) the propor-tion of earnings it retains and reinvests in new assets and (2) the return it earns on thesenew assets.
Recall Equation 19.32 on page 40:
Therefore, a firm can increase its growth rate by increasing its retention rate (reducingits payout ratio) and investing these added funds at its historic ROE or by maintaining itsretention rate but increasing its ROE. For example, a firm retains 50% of net earnings andconsistently has an ROE of 10%; its net earnings will grow at the rate of 5% a year, asfollows:
� 0.05
� 0.50 � 0.10
g � RR � ROE
� RR � ROE
g � Percentage of Earning Retained � Return on Equity
20Ch20.qxd 1/6/10 3:25 PM Page 71

72 PART 7 Valuation Principles and Practices
NEL
14 You will recall from Web Chapter 19 (Exhibit 19.7) that it is possible to employ an extended DuPont system. For pur-poses of this discussion, the three ratios indicate the significant factors and differences among countries. It may be instruc-tive to review that section now.
If the firm increases its retention rate to 75% and can invest these additional funds in projectsthat likewise earn 10%, its growth rate will increase to 7.5%:
Breakdown of ROE Although the retention rate is a management decision, changes in thefirm’s ROE result from changes in its operating performance or its financial leverage.As dis-cussed in Web Chapter 19, the ROE ratio can be divided into three components:
Profit Total Asset Financial� � �
Margin Turnover Leverage
This breakdown allows us to consider the three factors that determine a firm’s ROE.14
Because it is a multiplicative relationship, an increase in any of the three ratios will cause anincrease in ROE.The first two of the three ratios reflect operating performance, and the thirdone indicates a firm’s financing decision.
Knowing this breakdown, you must examine past results and expectations for a firm anddevelop estimates of the three components and therefore an estimate of a firm’s ROE. ThisROE estimate combined with the firm’s expected retention rate will indicate its futuregrowth potential. Finally, it is important to note that when estimating growth, it is necessaryto estimate not only the rate but also the duration of growth (how long the firm can sustainthis rate of growth). Clearly, the higher the growth rate, the more significant the duration ofgrowth estimate is to the ultimate value of the stock. Also, a high growth rate generallyrequires a high ROE, which is difficult to sustain because numerous competitors want toexperience these high rates of return.
Estimating Growth Based on History Although we have a strong bias in favour of using thefundamentals to estimate future growth (i.e., estimating the components of ROE), we alsobelieve in using all the information available to make this critical estimate.Therefore, we sug-gest that analysts also consider the historical growth rate of sales, earnings, cash flow, and div-idends and consider not only the different rates of growth but also the variability in thegrowth pattern over time for these series.
Although we demonstrate these computations for the market, for an industry, and for acompany in Chapters 8 and 9, the following discussion considers some suggestions on alter-native calculations. In terms of the relevant period to consider, one is struck by the cliché“more is better” as long as you recognize that “recent is relevant.” Specifically, about 20 yearsof annual observations would be ideal, but it is important to consider subperiods as well as
ROE � Net Income
Sales �
Sales
Total Assets �
Total Assets
Equity
� 0.075
g � 0.75 � 0.10
20Ch20.qxd 1/6/10 3:25 PM Page 72

WEB CHAPTER 20 An Introduction to Security Valuation 73
NEL
the total period—that is, 20 years, two 10-year periods, and four 5-year periods would indi-cate the overall growth rate but also would indicate if there were any changes in the growthrate during the critical recent periods.
The specific measurement can be done using one or more of three techniques: arithmeticor geometric average of annual percentage changes, linear regression models, and log-linearregression models. Irrespective of the technique used, we strongly encourage a time-seriesplot of the annual percentage changes.
The arithmetic or geometric average technique involves computing the annual per-centage change and then computing either the simple arithmetic average or the geometricaverage of these values for the period.As you will recall from the discussion in Chapter 3, thearithmetic average will always be a higher value than the geometric average (except when theannual values are constant) and the difference between the arithmetic and geometric averagevalues increase with volatility. Remember that the geometric mean is generally preferredbecause it provides the average annual compound growth rate.
The linear regression model goes well with the suggested time-series plot and is asfollows:
where:EPSt � earnings per period in Period t
t � year t where t goes from 1 to nb � the coefficient that indicates the average absolute change in the series during the
period
It would be very informative to superimpose this regression line on the time-series plotbecause it would provide insights on changes in absolute growth.
The log-linear model considers that the series might be better described in terms of aconstant growth rate. This model is as follows:
where:ln(EPSt) � the natural logarithm of earnings per share in Period t
b � the coefficient that indicates the average percentage change in the series duringthe period
Analysis of these historical growth rates both visually with the time-series graph and withthe alternative calculations should provide you with significant insights into the trend of thegrowth rates as well as the variability of the growth rates over time. As discussed in WebChapter 19, this could provide information on the unit’s business risk with the analysis of salesand EBIT growth.
20.4.4 Estimating Dividend Growth for Foreign StocksThe underlying factors determining the growth rates for foreign stocks are similar to thosefor Canadian stocks, but the value of the equation’s components may differ substantially fromwhat is common in Canada.The differences in the retention rate or the components of ROE
ln (EPSt) � a � bt
EPSt � a � bt
20Ch20.qxd 1/6/10 3:25 PM Page 73

74 PART 7 Valuation Principles and Practices
NEL
result from differences in accounting practices as well as alternative management performanceor philosophy.Therefore, it is important to determine the different values for the ratios andthe reasons for the differences.
Retention Rates The retention rates for foreign corporations differ within countries, but dif-ferences also exist among countries due to differences in the countries’ investment opportu-nities. As an example, firms in Japan have a higher retention rate than firms in Canada,whereas the rate of retention in France is much lower.Therefore, you need to examine theretention rates for a number of firms in a country as a background for estimating the stan-dard rate within a country.
Net Profit Margin The net profit margin of foreign firms can differ because of differentaccounting conventions between countries.As noted in Web Chapter 19, foreign accountingrules allow firms to recognize revenue and allocate expenses differently from Canadian firms.Also, different foreign amortization practices require adjustment of earnings and cash flows.
Total Asset Turnover Total asset turnover can likewise differ among countries because of dif-ferent accounting conventions on the reporting of asset values at cost or market values. Forexample, in Japan, a large part of the market values for some firms comes from their real estateholdings and their common stock investments in other firms.These assets are reported at cost,which typically substantially understates their true value.This also means that the total assetturnover ratio for these firms is substantially overstated.
This ratio will also be impacted by leases that are not capitalized on the balance sheet. Ifleases are not capitalized, both assets and liabilities are understated.
Total Asset/Equity Ratio This ratio, a measure of financial leverage, differs among countriesbecause of differences in economic environments, tax laws, management philosophiesregarding corporate debt, and accounting conventions. In several countries, the attitudetoward debt is much more liberal than in Canada.A prime example is Japan, where debt as apercentage of total assets is almost 50% higher than this ratio in Canada. Notably, most cor-porate debt in Japan entails borrowing from banks at fairly low rates of interest. Balance sheetdebt ratios may be higher in Japan than in Canada or other countries; but because of thelower interest rates in Japan, the fixed-charge coverage ratios, such as the times interest earnedratio, might be similar to those in other countries.
Consequently, when analyzing a foreign stock market or an individual foreign stock thatinvolves estimating the growth rate for earnings and dividends, you must consider the threecomponents of the ROE just as you would for a Canadian stock but recognize that the finan-cial ratios for foreign firms can differ from those of Canadian firms, as discussed in WebChapter 19 references.
Summary
1. Valuation techniques require an estimate of the investor’srequired return on the stock and the growth rate.Asboth are estimated, different analysts using the same valu-ation techniques will derive different estimates of valuefor a stock because they have different estimates for thesecritical variable inputs.
2. The investment decision process requires the investor toestimate an investment’s intrinsic value and then comparethis value to the prevailing market price. If the market
price exceeds the estimated value, the investment shouldnot be purchased. In contrast, if the investment’s intrinsicvalue exceeds the market price, you should buy theinvestment.
3. A discounted cash flow method is typically used to valueboth bonds and preferred stock.The cash flows from thebond are valued as an annuity with a lump sum return ofprincipal at maturity while preferred stock dividends arevalued as a perpetuity.
20Ch20.qxd 1/6/10 3:25 PM Page 74

WEB CHAPTER 20 An Introduction to Security Valuation 75
NEL
4. Common stock valuation techniques fall into one of twogeneral approaches: (1) discounted cash flow, where thevalue of the stock is estimated based upon the presentvalue of some measure of cash flow; and (2) relative valu-ation, where the value is estimated based upon thestock’s current price relative to variables considered to besignificant to valuation, such as earnings, cash flow, bookvalue, or sales.
The discounted cash flow techniques allow flexibilityin terms of changes in sales and expenses that implieschanging growth rates over time. Relative valuationtechniques provide information about how the market iscurrently valuing stock at several levels—the aggregatemarket, alternative industries, and individual stockswithin industries.
5. The dividend discount model (DDM) assumes that thevalue of a share of common stock is the present value ofall future dividends.This model assumes that wheneverthe stock is sold, its sale price at that time will be thepresent value of all future dividends. For non-dividend-paying stocks, the concept is the same, except that someof the early dividend payments are zero—notably, there isan expectation that at some point the firm will startpaying dividends. Unfortunately, if there is a small changein either g or k, there will be a significant change in thecomputed stock’s value.
6. The infinite period DDM cannot be used to value firmsthat are experiencing abnormally high rates of growth.These high-growth conditions are temporary, and there-fore, after a few years of exceptional growth, the firm’sgrowth rate is expected to decline and eventually stabi-lize at a constant level consistent with the assumptions ofthe infinite period DDM.To value a temporary super-normal growth company, you estimate each year’sgrowth, and determine the value of the cash flows once
there is constant growth.All of these values are then dis-counted to the present.
7. To determine value using operating free cash flows(operating cash flows before interest and after deductingfunds needed to for capital expenditures), the firm’sweighted average cost of capital (WACC) is used as thediscount rate. Once the value of the total firm is calcu-lated, the value of debt is subtracted.The firm’s cost ofequity capital (k) is used to determine value using thefree cash flows to equity (cash flows after operating freecash flows have been adjusted for interest and principalrepayment).
8. Relative valuation techniques implicitly maintain that it ispossible to determine the value of a market, an industry,or a company by comparing it to similar entities on thebasis of several relative ratios that compare its stock priceto relevant variables that affect a stock’s value, such asearnings, cash flow, book value, and sales.To properlyimplement these techniques, the valuation ratio must becompared over time (e.g., the P/E ratio) for a companyto the comparable ratio for the market, for the stock’sindustry, and to other stocks in the industry to determinehow it compares. Secondly you need to examine the fac-tors that affect each valuation ratio and then comparethese factors for the stock being valued versus the samefactors for the market, industry, and other stocks.
9. The basic valuation models and variables are the samearound the world but there are significant differences inthe values for specific variables when dealing with for-eign investments.The inputs require an estimate of theNRFR as well as derivation of an equity risk premiumfor the investments in each country. Investing globallyalso means that there are differences in accounting prac-tices and management philosophies that the investormust consider.
Key Terms
earnings multiplier model, p. 63growth company, p. 60
perpetuity, p. 54price/earnings (P/E) ratio, p. 63
valuation process, p. 51
Suggested Readings
See “Suggested Readings” in Web Chapter 19.
For Chapter CFA Questions and Problems, please see Appendix A at the end of this text.CFA
❏
20Ch20.qxd 1/6/10 3:25 PM Page 75
76 PART 7 Valuation Principles and Practices
NEL
Problems
1. What is the value to you of a 9% coupon bond with apar value of $10,000 that matures in 10 years if yourequire a 7% return? Use semi-annual compounding.
2. What would be the value of the bond in Problem 1 ifyou required an 11% return?
3. The preferred stock of the Rayman Radiology Com-pany pays a $9 dividend.You require an 11% return onthis stock.What is the maximum price you would payfor it? Would you buy it at a market price of $96?
4. The Big Basketball Company (BBC) earned $10 a sharelast year and paid a dividend of $6 a share. Next year,you expect BBC to earn $11 and continue its payoutratio.Assume that you expect to sell the stock for $132 ayear from now. If you require 12% on this stock, howmuch would you be willing to pay for it?
5. Given the expected earnings and dividend payments inProblem 4, if you expected a selling price of $110 andrequired an 8% return on this investment, how muchwould you pay for the BBC stock?
6. Over the long run, you expect dividends for BBC inProblem 4 to grow at 8% and you require an 11% on thestock. Using the infinite period DDM, how much wouldyou pay for this stock?
7. Based on new information regarding the popularity ofbasketball, you revise your growth estimate for BBC to
9%.What is the maximum P/E ratio you will apply toBBC, and what is the maximum price you will pay forthe stock? Your required return is still 11%.
8. The Shamrock Dogfood Company (SDC) has consis-tently paid out 40% of its earnings in dividends.Thecompany’s return on equity is 16%.What would youestimate as its dividend growth rate?
9. Given the low risk in dog food, your required return onSDC is 13%.What P/E ratio would you apply to thefirm’s earnings?
10. What P/E ratio would you apply if you learned thatSDC had decided to increase its payout to 50%? (Hint:This change in payout has multiple effects.)
11. Discuss three ways a firm can increase its ROE. Make upan example to illustrate your discussion.
12. It is widely known that grocery chains have low profitmargins—on average they earn about 1% on sales. Howwould you explain the fact that their ROE is about 12%?Does this seem logical?
13. Compute a recent five-year average of the followingratios for three companies of your choice (attempt toselect diverse firms):a. Retention rateb. Net profit marginc. Equity turnover
Questions
1. Discuss the difference between the top-downand bottom-up approaches.What is the main assump-tion that causes the difference in these twoapproaches?
2. What is the benefit of analyzing the market and alterna-tive industries before individual securities?
3. Discuss why you would not expect all industries to havea similar relationship to the economy. Give an exampleof two industries that have different relationships to theeconomy.
4. Discuss why estimating the value for a bond is easierthan estimating the value for common stock.
5. Would you expect the required return for a Canadianinvestor in Canadian common stocks to be the same asthe required return on Japanese common stocks? Whatfactors would determine the required return for stocks inCanada versus Japan?
6. Would you expect the nominal RFR in Canada to be thesame as in Germany? Discuss your reasoning in detail.
7. Would you expect the risk premium for an investmentin an Indonesian stock to be the same as that for a
stock from the United Kingdom? Discuss yourspecific reasoning.
8. Would you expect the risk premium for an investmentin a stock from Singapore to be the same as that for astock from Canada? Discuss your specific reasoning.
9. Give an example of a stock where it would be appro-priate to use the reduced form DDM for valuation anddiscuss why you feel that it is appropriate. Similarly,give an example and discuss a stock where it wouldnot be appropriate to use the reduced form DDM.
10. Give an example of and discuss a stock that has tempo-rary, supernormal growth where it would be appropriate(necessary) to use the modified DDM.
11. Under what conditions will it be ideal to use one or sev-eral of the relative valuation ratios to evaluate a stock?
12. Discuss a scenario where it would be appropriate to useone of the present value of cash flow techniques for thevaluation.
13. Discuss why the two valuation approaches (present valueof cash flows and the relative valuation ratios) are compet-itive or complementary.
20Ch20.qxd 1/6/10 3:25 PM Page 76

WEB CHAPTER 20 An Introduction to Security Valuation 77
NEL
d. Total asset turnovere. Total assets/equity
Based on these ratios, explain which firm shouldhave the highest growth rate of earnings.
14. You have been reading about the Moncton ComputerCompany (MCC), which currently retains 90% of itsearnings ($5 a share this year). It earns an ROE of almost30%.Assuming a required return of 14%, how muchwould you pay for MCC on the basis of the earningsmultiplier model? Discuss your answer.What would youpay for Moncton Computer if its retention rate was 60%and its ROE was 19%? Show your work.
15. Great Can Company’s (GCC) latest annual dividend of$1.25 a share was paid yesterday and maintained itshistoric 7% annual rate of growth.You plan to purchasethe stock today because you believe that the dividendgrowth rate will increase to 8% for the next three yearsand the selling price of the stock will be $40 per share atthe end of that time.
a. How much should you be willing to pay for the GCCstock if you require a 12% return?
b. What is the maximum price you should be willing topay for the GCC stock if you believe that the 8%growth rate can be maintained indefinitely and yourequire a 12% return?
c. If the 8% rate of growth is achieved, what will theprice be at the end of Year 3, assuming the conditionsin Part b?
16. On the Canadian Bond Indices website(http://www.canadianbondindices.com) find the averageyield of AA and provincial bonds for a recent month.Compute the risk premium (in basis points) and the per-centage risk premium on AA corporate bonds relative toprovincial bonds. Discuss how these values compare tothose shown in Exhibits 20.3.
20Ch20.qxd 1/6/10 3:25 PM Page 77