an introduction to processing diffusion weighted...
TRANSCRIPT

An introduction to processing diffusion weighted images
Brian WandellStanford Center for Cognitive and Neurobiological Imaging (CNI)
Department of PsychologyStanford University

• What are the neuroscience issues
• Diffusion: Within the voxel
• Diffusion: Across voxels (tractography)
• Applications
Overview

• Why study the human brain
• Why study axons and glia
• Neuroscience for society
Goals

The human brain
macaque
human
mouse
0.5 g 1500 g100 g
Image adapted from J. Horton
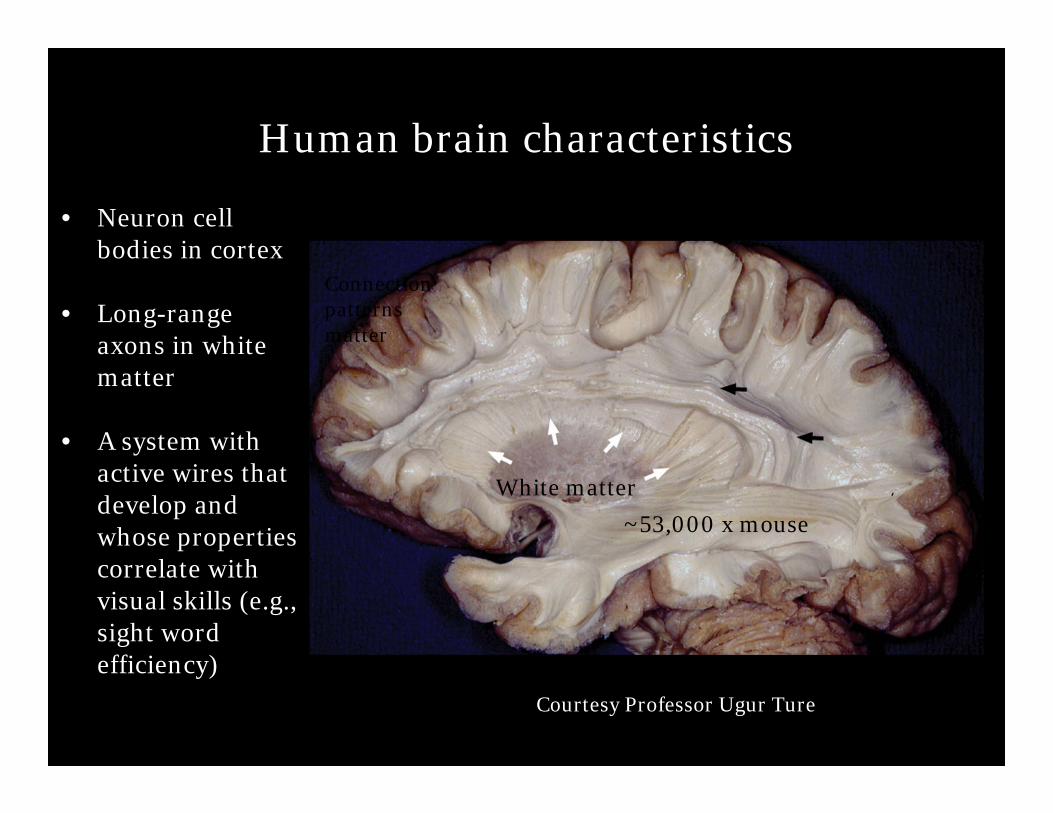
Human brain characteristics
Courtesy Professor Ugur Ture
White matter
Connection patterns matter
~53,000 x mouse
• Neuron cell bodies in cortex
• Long-range axons in white matter
• A system with active wires that develop and whose properties correlate with visual skills (e.g., sight word efficiency)

R. Douglas Fields

An oligodendrocyte in the white matter
Electron micrograph showing the myelin sheath from an oligodendrocytewrapping a single axons (cross-section)
Note the scale bar
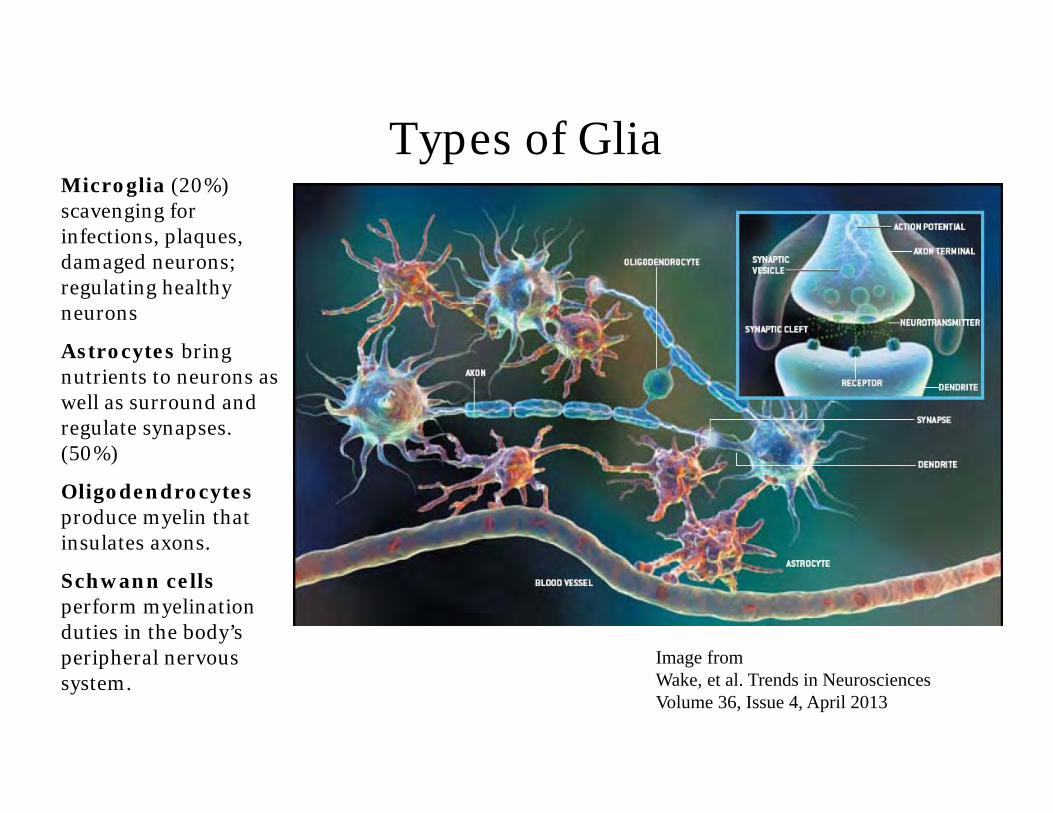
Types of GliaMicroglia (20%) scavenging for infections, plaques, damaged neurons; regulating healthy neurons
Astrocytes bring nutrients to neurons as well as surround and regulate synapses. (50%)
Oligodendrocytesproduce myelin that insulates axons.
Schwann cellsperform myelination duties in the body’s peripheral nervous system.
Image from Wake, et al. Trends in NeurosciencesVolume 36, Issue 4, April 2013

Neuroscience is broadening its view
Bullock, Bennett, Johnston, Josephson, Marder, FieldsScience, 2005
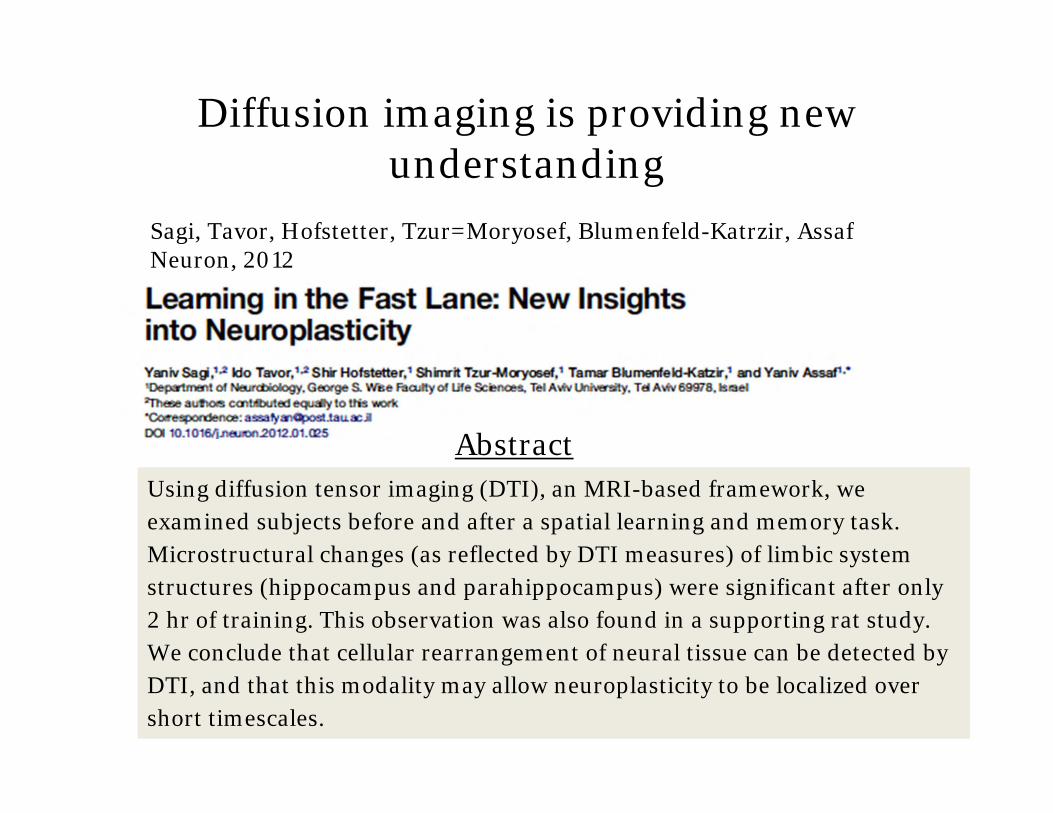
Diffusion imaging is providing new understanding
Using diffusion tensor imaging (DTI), an MRI-based framework, we examined subjects before and after a spatial learning and memory task. Microstructural changes (as reflected by DTI measures) of limbic system structures (hippocampus and parahippocampus) were significant after only 2 hr of training. This observation was also found in a supporting rat study. We conclude that cellular rearrangement of neural tissue can be detected by DTI, and that this modality may allow neuroplasticity to be localized over short timescales.
Abstract
Sagi, Tavor, Hofstetter, Tzur=Moryosef, Blumenfeld-Katrzir, AssafNeuron, 2012
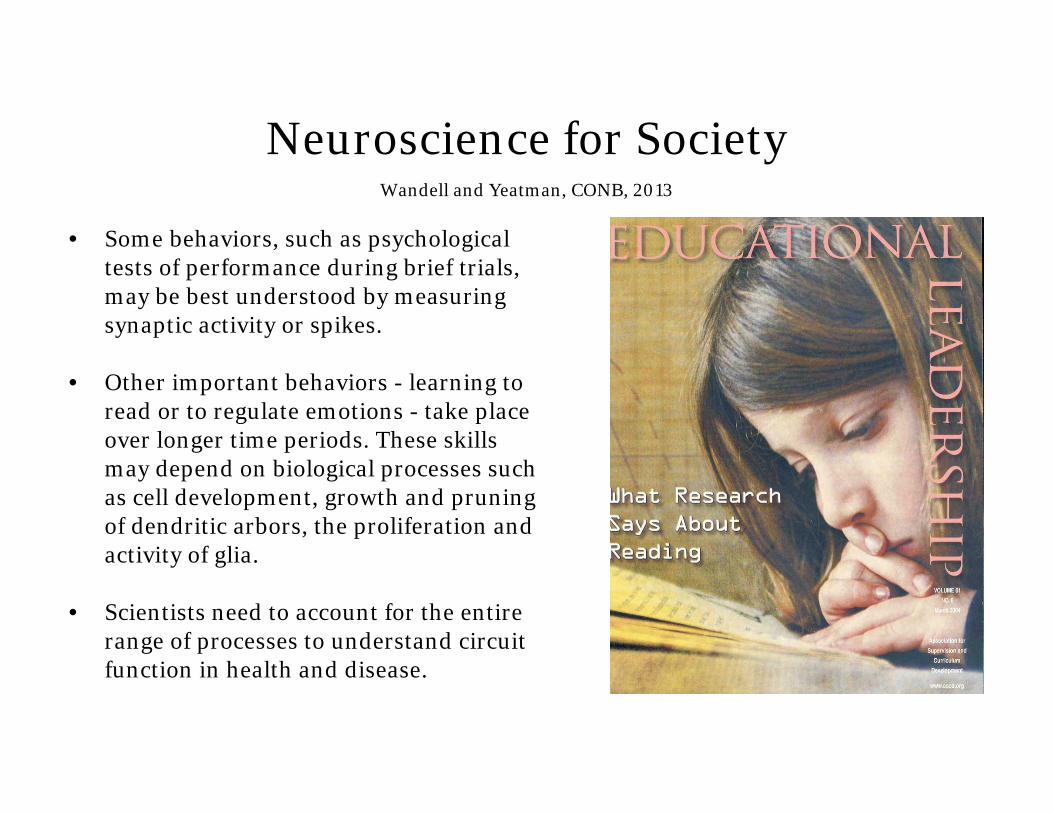
Neuroscience for Society
• Some behaviors, such as psychological tests of performance during brief trials, may be best understood by measuring synaptic activity or spikes.
• Other important behaviors - learning to read or to regulate emotions - take place over longer time periods. These skills may depend on biological processes such as cell development, growth and pruning of dendritic arbors, the proliferation and activity of glia.
• Scientists need to account for the entire range of processes to understand circuit function in health and disease.
Wandell and Yeatman, CONB, 2013

White matter reading tracts(Wandell and Yeatman, Annual Review, 2013)

Diffusion weighted terminology
• Apparent diffusion coefficients• Parallel and perpendicular diffusivity• Diffusion images

Diffusion probes brain microscopic structure
Given a b-value and gradient direction, we measure Apparent Diffusion Coefficient (ADC)
Along the principal direction of axons, within the cytoskeleton, water displacement is large and signal is low
Parallel diffusivity (μm2/ms)
Optic nerve fibresGeorge Bartzokis
Optic nerve fibresGeorge Bartzokis 5 umEquivalent names
• Parallel, axial, longitudinal, principal diffusion direction (PDD)

Diffusion probes brain microscopic structure
Perpendicular to the principal direction of axons, bi-lipid membranes limit water displacement so the signal is higher
Other names• Perpendicular, radial,
transverse
Perpendicular diffusivity (μm2/ms)
Optic nerve fibresGeorge Bartzokis
Optic nerve fibresGeorge Bartzokis 5 um

Non-diffusion MR imageDark means large signal attenuationHigh ADC
b = 0

Diffusion weighting: Directions
Dark means large signal attenuationHigh ADC
b = 800

b = 800 Dark means large signal attenuationHigh ADC
Diffusion weighting: Directions

b=1000
0
200
400
600
800
1000Diffusion-weighting: b-values

b=2000
0
100
200
300
400
Diffusion-weighting: b-values
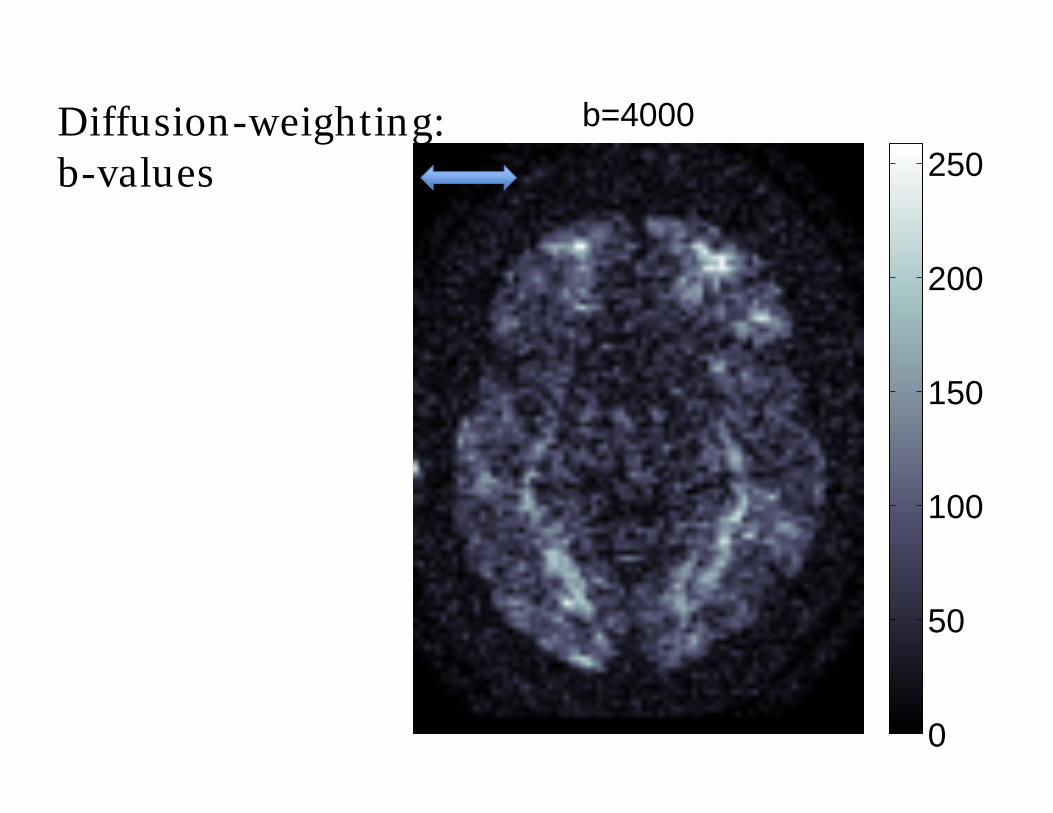
b=4000
0
50
100
150
200
250Diffusion-weighting: b-values

Modeling the diffusion signal• The diffusion signal data in 3-space• The diffusion tensor model (DTM)• The ball-and-stick model (SFM)

Diffusion data analysis
MRI diffusion signal
High angular resolution diffusion imaging (HARDI)
( )0( ) e bDS S
The measured diffusion
signal in a direction, θ, is
related to the apparent
diffusion coefficient in that
direction, D(θ)
Signal Re: b=0
Large displacement
Smalldisplacement

Diffusion data analysis
MRI diffusion signal
High angular resolution diffusion imaging (HARDI)
( )0( ) e bDS S
The measured diffusion
signal in a direction, θ, is
related to the apparent
diffusion coefficient in that
direction, D(θ)
Signal Re: b=0
Large displacement
Smalldisplacement
Small signal, large ADC
Big signal, small ADC

Diffusion tensor model (DTM)
( ( ))0( ) bDS S e
( ) t
t
D QQ A A
One way to model the signal is state a formula for diffusion in different directions (Gaussian)
Model the diffusion term using a quadratic form
Stejskal-Tanner
Basser, Pierpaoli

Diffusion tensor model
Signal re: b=0

The ball and stick model
Predicts the voxel diffusion signal with a model of the sum of fascicles plus isotropic diffusion
( )0 0( ) fbD
ff
S w D w e + + +
Ball Sticks
Larry Frank (2002)Tim Behrens (2003)

The ball and stick model
Predicts the voxel diffusion signal with a model of the sum of fascicles plus isotropic diffusion
Measured Modeled
Visualization

Sparse fascicle model (SFM)
( )0 0( ) fbD
ff
S w D w e + + +
Ball Sticks
• BS model seemed like a bad idea• We estimate the fascicles using a linear method
with a sparseness constraint
Ariel Rokem and I call it this because
Same idea as in spherical deconvolution; different estimation method

Summary
• DTM is a phenomenological description of the diffusion signal (like spherical harmonics)
• The ball and stick model (SFM) uses concepts that are evoke biological structures
References
Moseley, Cohen et al. 1990 Radiology Origins of white matter diffusion
Le Bihan, Mangin, Poupon et al. 2001 Journal of Magnetic Resonance ImagingA nice early review
Basser et al., 1994 – Biophysical Journal Good opening sentence: “This paper describes a new NMR imaging modality-MRdiffusion tensor imaging.”
Basser and Pierpaoli – 1996, Journal of Magnetic Resonance Imaging Introduces FA and univariate statistics for DTM
Klingberg et al., 2000, NeuronFirst application to human cognition
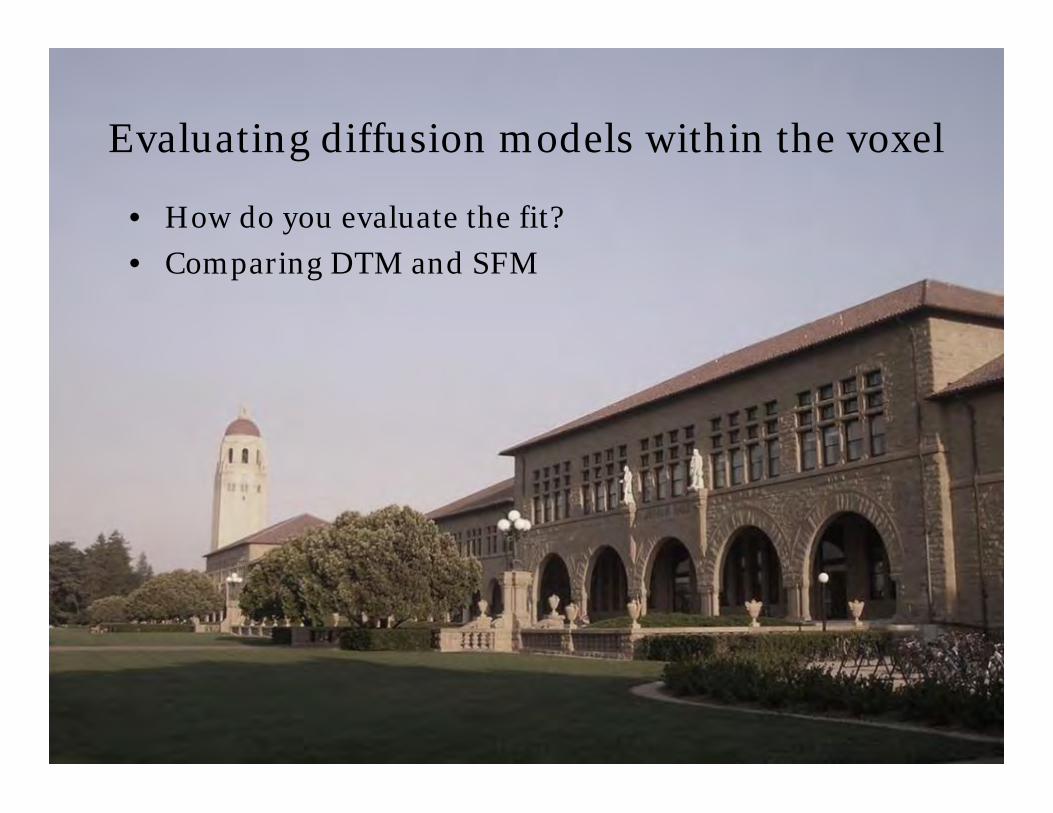
Evaluating diffusion models within the voxel
• How do you evaluate the fit?• Comparing DTM and SFM

Diffusion tensor model (DTM)Predicts the voxel diffusion signal with
a phenomenological equation, motivated by Gaussian diffusion.
Signal Re: b=0
Large displacement
Smalldisplacement

Cross-validation assessment
Data set 1 Data set 2
Fit the model to these data
Measure prediction error with these data
Two data sets, one b-value, many directions, same session
(In the old days, we used to call this testing the model on an independent data set)

Measured and modeledMeasured
Mea
sure
d a
gain
Pred
icte
d
DTM predicts the independent data more accurately than assuming replication
Replication Prediction

Mod
el e
rror
Best possible =
The SFM is slightly better(whole brain analysis)
Both are very good, and just short of best possible performance
12

DTM errors are localized in a few regions(b = 4000)
Model better
Model worse
Optic radiationCentrum semiovale

SFM outperforms DTM in these regions(b = 4000)
Model better
Model worse
Optic radiationCentrum semiovale
Summary
• We have excellent quantitative models of the diffusion signal within a voxel
• The model fits are more reliable predictors of independent measurements than the data; use them for tractography
• People should stop whining about diffusion data.
References
Frank, L.R., 2001. Anisotropy in high angular resolution diffusion-weighted MRI. Magn Reson Med 45, 935–9.
Frank, L.R., 2002. Characterization of anisotropy in high angular resolution diffusion-weighted MRI. Magn Reson Med 47, 1083–99.
Recent directions
• Integrating data from multiple b-values (Diffusion spectrum imaging)
• Estimating properties of axons
• Much more in the pipeline

Summary diffusion measures
• Once you have a model, it is natural to produce summary measures
• For the DTM, the Principal diffusion direction (PDD) and fractional anisotropy (comparing eigenvalues) have been convenientBEWARE
• For the SFM (ball and stick), no standard has emerged but Dell’Aqua et al. (2007) have proposed useful univariate measures

Models and data replication
DTM SFMData 1 Data 2
Low b-value

Models and data replication
Data 1 Data 2
Higher b-value
DTM SFM

Data 1 Data 2DTM SFM
b = 1000
b = 2000
b = 4000

Quantitative MRI rising
Once you think about varying b-level, go nuts people. Ask yourself: What are the implications of varying diffusion time and b-level?
Assaf and colleagues fit a model based on assumptions about the intra-axonal diffusion of water
Tractography tools• Tract generation
• Deterministic and DTM• Probabilistic and ball/stick
• Tract scoring• Tract labeling

Tract generation and visualization packages
MRI studio – http://www.mristudio.org
FMRIB • PROBTRACK
http://users.fmrib.ox.ac.uk/~behrens/fdt_docs/fdt_probtrack.html
• Tract Based Spatial Statisticshttp://users.fmrib.ox.ac.uk/fsl/fslwiki/TBSS
TrackVis - http://www.trackvis.org
DSI studio - http://dsi-studio.labsolver.org/
MRtrix - http://brain.org.au/software/mrtrix/
Exploredti - http://www.exploredti.com/
Camino - http://cmic.cs.ucl.ac.uk/camino/
http://www.nitrc.org/
Central source
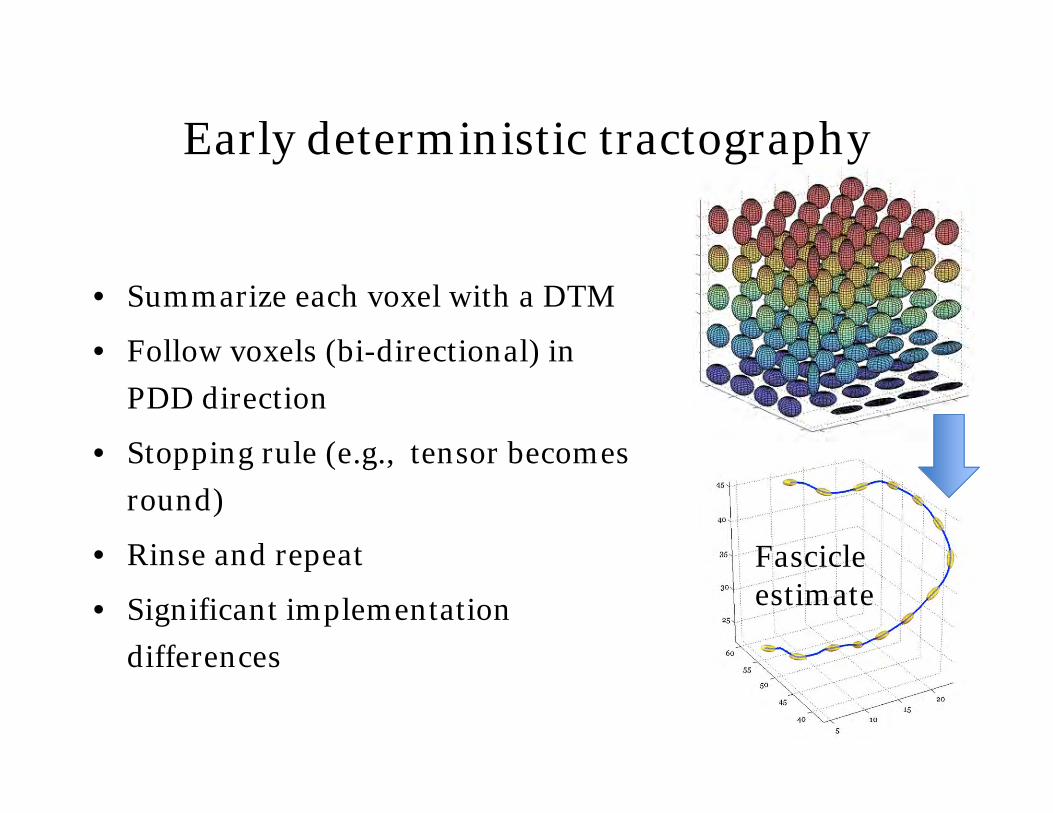
Early deterministic tractography
• Summarize each voxel with a DTM
• Follow voxels (bi-directional) in PDD direction
• Stopping rule (e.g., tensor becomes round)
• Rinse and repeat
• Significant implementation differences
Fascicle estimate

Tracking fibers in the human brain(Mori et al., 1999; Conturo et al, 1999)
Conturo
Mori
• Summarize each voxel with a DTM
• Follow voxels (bi-directional) in PDD direction
• Stopping rule (e.g., tensor becomes round)
• Rinse and repeat
• Significant implementation differences

Limitations of deterministic methods
• Don’t account for noise and uncertainty
• Greedy: Uses the local (voxel) diffusion measurements to estimate global white matter tracts; never measures the whole solution
• Validation

(Fig 1a)
• Use the ball and stick model for local diffusion
• Repeatedly trace a path, choosing directions at each step from a probability distribution of angles determined by local diffusion data
• Stopping rule: No strong direction in local data

(Fig 1a)
• Given a seed in region A, evaluate connection strength to region B as
The number of fibers between the regions A and B divided by the total number of fibers from A
See Sherbondy et al., 2008A for a discussion of the implications of this rule for symmetry and independence

Optic radiation
Occipital callosal
Optic tract
Separating tract discovery and evaluation (Contrack, Sherbondy et al., 2008A,B)

Tract identification
Dougherty et al., 2007, PNAS

Tract segmentation and identificationAutomated Fiber
QuantificationYeatman et al., 2012
TRACULAYendiki A et al., 2011
https://surfer.nmr.mgh.harvard.edu/fswiki/Traculahttps://github.com/jyeatman/AFQ

Summary
• There are high quality toolsfor tract generation
• Visualization is important for understanding the tracts
• The tool set is evolving and expanding to include segmentation, and measurements along tracts (tractometry)

Tractography validation(Pestilli et al., under review)
Linear iterative fascicle evaluation (LIFE)
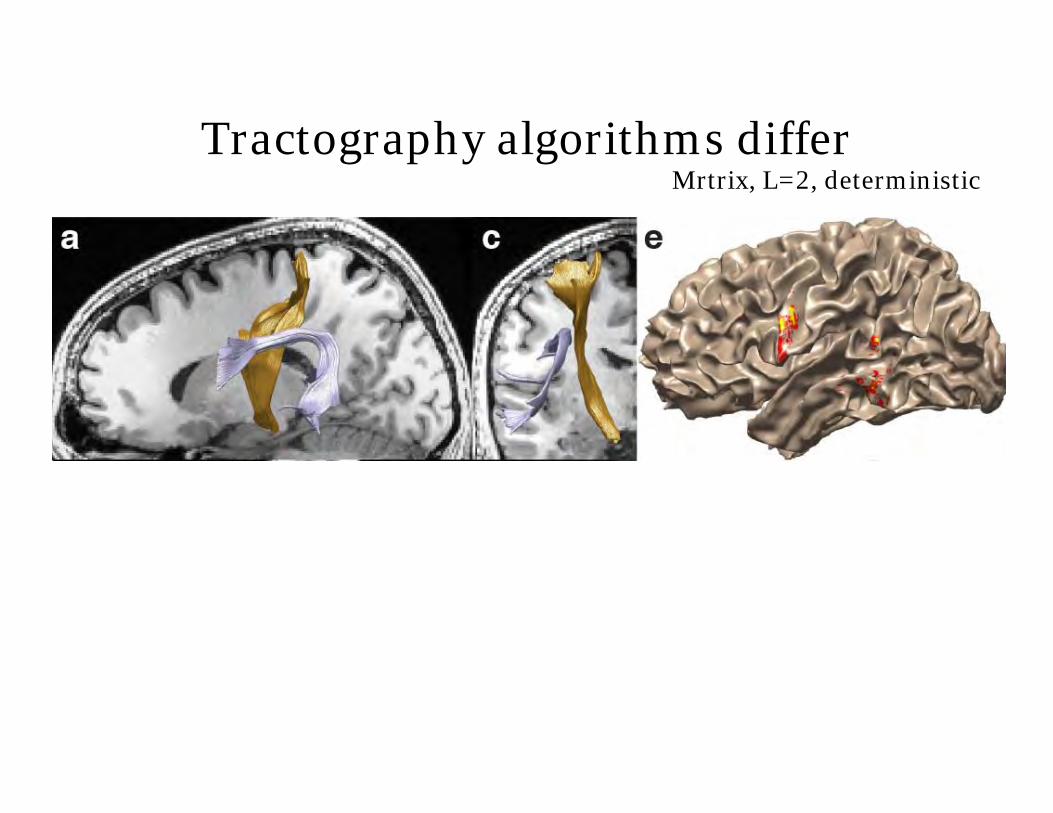
Tractography algorithms differ Mrtrix, L=2, deterministic

Tractography algorithms differMrtrix, L=2, deterministic
Mrtrix, L=8, probabilistic

Validation principles
• Evaluates data at hand; these subjects and this instrument
• Measures individual tracts in individual subjects
• Specifies strength of evidence, not probability of existence
• Compares connectome solutions

TractographyEstimate fascicles from diffusion data

Tractography validationLinear iterative fascicle evaluation
(LIFE, Pestilli et al.)
Compare how well different models and algorithms do

Fascicle contributions• Each fascicle makes
a contribution to the diffusion signal for each voxel it passes through
• The contribution depends on the fascicle orientation
• The fascicles contributions are weighted (size, length)
0 0( ) ( )f ff
S w D w D + +
In each voxel, the fascicles are the sticks
Franco Pestilli © 2013 - Stanford University
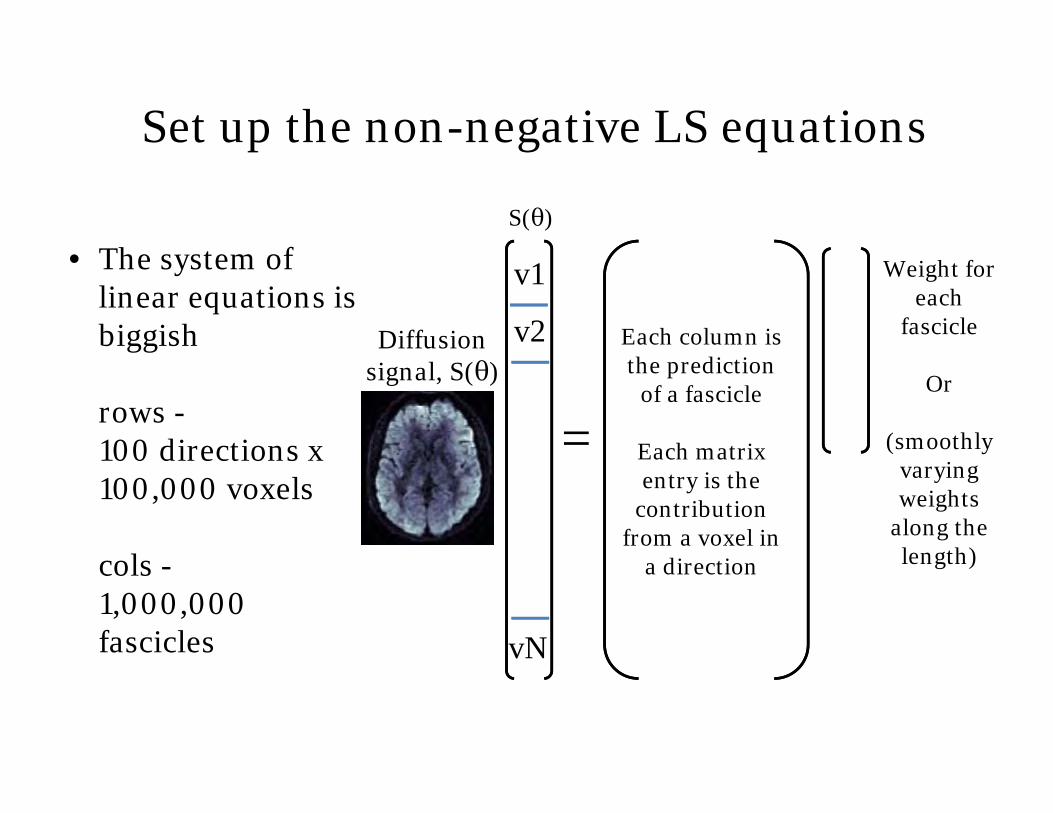
Set up the non-negative LS equations
Each column is the prediction
of a fascicle
Each matrix entry is the
contribution from a voxel in
a direction
S(θ)
Diffusion signal, S(θ)
Weight for each
fascicle
Or
(smoothly varying weights
along the length)
=
• The system of linear equations is biggish
rows -100 directions x 100,000 voxels
cols -1,000,000 fascicles
v1
v2
vN

Compare measurements and connectomepredictions
First data set Connectome
Solving a big system of linear equations (non-negative least-squares)

Compare independent measurements with connectome predictions
Connectome Prediction
Big matrix multiplication

Compare independent measurements with connectome predictions
Prediction Second data set
Subtraction and root mean square error

Scatter density histogram comparing two MRtrix parameters
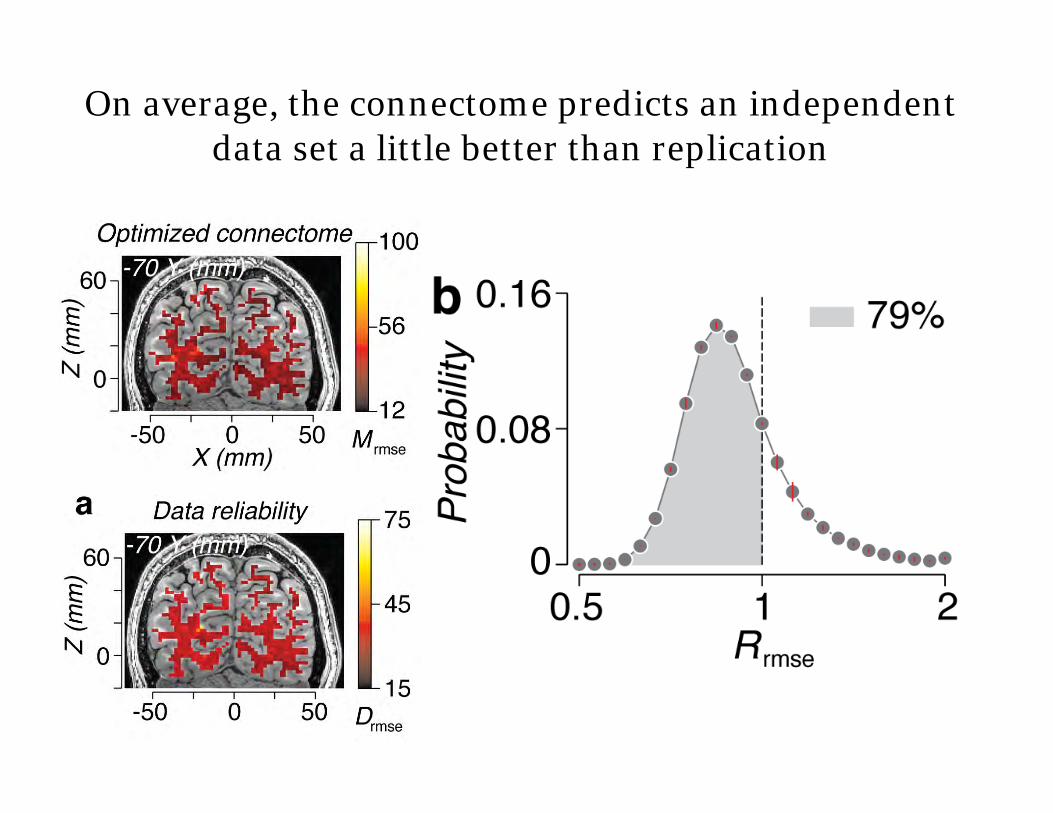
On average, the connectome predicts an independent data set a little better than replication
Summary
• Validation methods should enable us to test hypotheses about human tracts using the internal validation of the data at hand

Neuroscience applications
• The visual map hierarchy• Learning to see words

Vertical occipital fasciculus(Yeatman et al., 2012)
Image courtesy Pestilli and Takemura

Visual field maps in humans
Wandell and Winawer (2011) Vision Res

Macaque field map organization
Human diagram
V3 is much bigger (75% of V2)V3A is accompanied by V3BhV4 position
What about dorsal-ventral segregation
Felleman and Van Essen (1991), Annotated by
Wallish and Movshon (2008)

Dorsal VOF endpoints
S4

Ventral VOF endpoints

Rethinking the human wiring diagram
VOF
VO
Human
V1 V2 V4 IT cortex
Macaque electrophysiology
DiCarlo and Cox, 2007

Neuroscience for Society
• Some behaviors, such as psychological tests of performance during brief trials, may be best understood by measuring synaptic activity or spikes.
• Other important behaviors - learning to read or to regulate emotions - take place over longer time periods. These skills may depend on biological processes such as cell development, growth and pruning of dendritic arbors, the proliferation and activity of glia.
• Scientists need to account for the entire range of processes to understand circuit function in health and disease.
Wandell and Yeatman, CONB, 2013
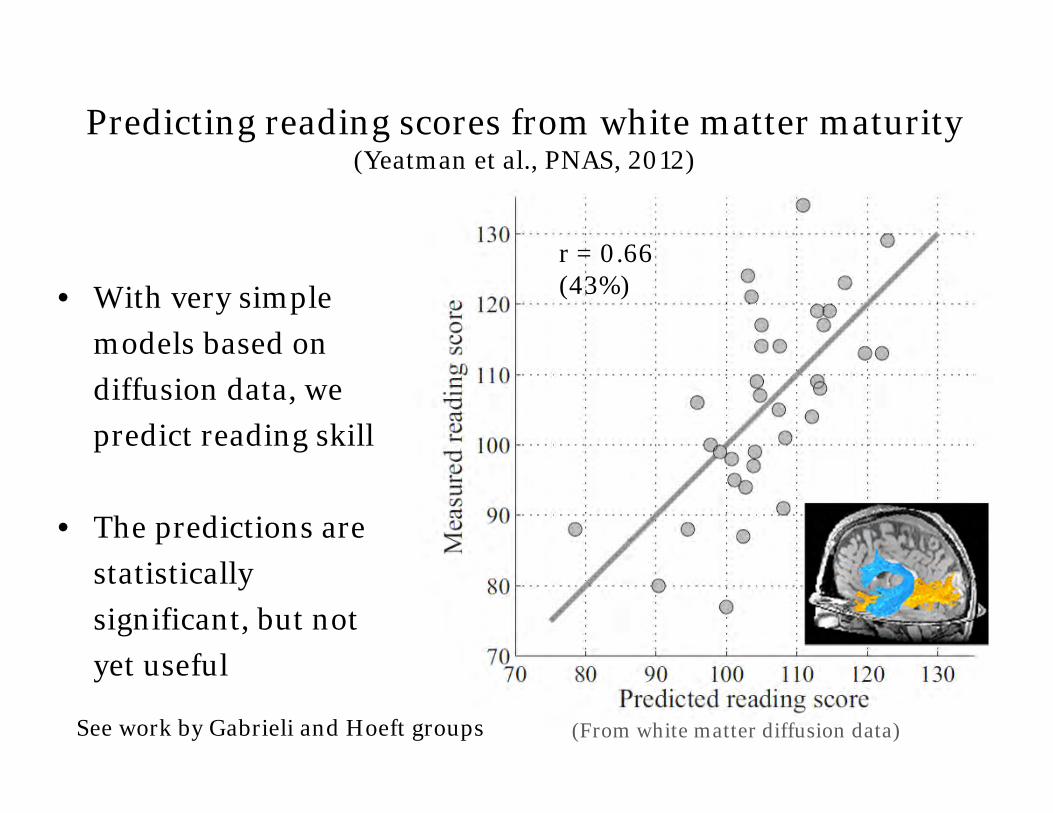
Predicting reading scores from white matter maturity (Yeatman et al., PNAS, 2012)
• With very simple models based on diffusion data, we predict reading skill
• The predictions are statistically significant, but not yet useful
r = 0.66 (43%)
(From white matter diffusion data)See work by Gabrieli and Hoeft groups
Thank you!Stanford PsychologyB. DoughertyJ. WinawerA. MezerM. PerryK. Kay Jason
YeatmanFrancoPestilli
HiromasaTakemura
Ariel Rokem