an in-depth process model for fuel production via
TRANSCRIPT
Processes 2021, 9, x. https://doi.org/10.3390/xxxxx www.mdpi.com/journal/processes
Article 1
An in-depth process model for fuel production via hydrother- 2
mal liquefaction and catalytic hydrotreating 3
Leonard Moser 1,*, Christina Penke 1 and Valentin Batteiger 1 4
1 Bauhaus Luftfahrt e. V., 82024 Taufkirchen, Bavaria, Germany ; [email protected] 5
* Correspondence: [email protected]; Tel.: 089 30784946 6
Abstract: One of the promising technologies for future renewable fuel production from biomass is 7
hydrothermal liquefaction (HTL). Although enormous progress in the context of continuous 8
experiments on demonstration plants has been made in the last years, still many research questions 9
concerning the understanding of the HTL reaction network remain unanswered. In this study, a 10
unique process model of an HTL process chain has been developed in Aspen Plus® for three 11
feedstock, microalgae, sewage sludge and wheat straw. A process chain consisting of HTL, 12
hydrotreatment (HT) and catalytic hydrothermal gasification (cHTG) built the core process steps of 13
the model, which uses 51 model compounds representing the hydrolysis products of the different 14
biochemical groups lipids, proteins, carbohydrates, lignin, extractives and ash for modelling the 15
biomass. Two extensive reaction networks of 272 and 290 reactions for the HTL and HT process step, 16
respectively, lead to the intermediate biocrude (~200 model compounds) and the final upgraded 17
biocrude product (~130 model compounds). The model can reproduce important characteristics, 18
such as yields, elemental analyses, boiling point distribution, product fractions, density and higher 19
heating values of experimental results from continuous experiments as well as literature values. The 20
model can be applied as basis for techno-economic and environmental assessments of HTL fuel 21
production, and may be further developed into a predictive yield modelling tool. 22
23
Keywords: hydrothermal liquefaction, process model, reaction network, advanced biofuel, Aspen 24
Plus, HTL 25
26
1. Introduction 27
28
An increasing number of societies around the globe target climate neutrality by mid-cen- 29
tury [1]. These ambitions require a deep decarbonization of all energy sectors, including 30
an almost complete substitution of crude-oil derived transportation fuels. Hydrothermal 31
liquefaction can convert a broad variety of organic feedstock into intermediate biocrudes, 32
which can subsequently be upgraded by catalytic hydrotreatment into mixtures of liquid 33
hydrocarbon fuels. Comparative assessments of advanced biofuel conversion technolo- 34
gies suggest that the HTL pathway has the potential to get developed into a competitive 35
future solution [2], especially for the treatment of wet waste streams such as sewage 36
sludge [3]. Consequently, there is an increasing number of research and development ef- 37
forts, which explore HTL conversion at pilot scale level. 38
Citation: Moser, L.; Penke, C.; Battei-
ger, V. An in depth process model
for fuel production via hydrother-
mal liquefaction. Processes 2021, 9, x.
https://doi.org/10.3390/xxxxx
Academic Editor:
Received: date
Accepted: date
Published: date
Publisher’s Note: MDPI stays neu-
tral with regard to jurisdictional
claims in published maps and institu-
tional affiliations.
Copyright: © 2021 by the authors.
Submitted for possible open access
publication under the terms and
conditions of the Creative Commons
Attribution (CC BY) license
(https://creativecommons.org/license
s/by/4.0/).
Processes 2021, 9, x FOR PEER REVIEW 2 of 33
The potential competitive advantage of HTL is linked to the hydrothermal pro- 39
cessing conditions, which enable reactor designs with relatively low level of technological 40
complexity. However, these process conditions give rise to a complex reaction network 41
that links the yield and composition of the HTL biocrude to the initial composition of the 42
feedstock. The characteristic composition of the HTL biocrudes further translates into a 43
feedstock specific composition of the final fuel products that result from hydro-pro- 44
cessing. An improved understanding of the product yields and compositions and conse- 45
quently, also the underlying HTL reaction network is of importance for subsequent sys- 46
tem analysis and for the further development of HTL fuel pathways [4]. Consequently, 47
there is already a large number of different HTL models present in literature that can be 48
differentiated by three main objective. One aim of HTL models is to predict the biocrude 49
yield, another one is the investigation of the underlying reaction network and a third ob- 50
jective is to deliver mass and energy balances for a process chain in order to perform fur- 51
ther system analysis in the form of LCA and TEA. HTL biocrude yield prediction models 52
are almost exclusively based on batch experiments with a single model compound or mix- 53
tures of model compounds representing the biochemical groups that are typically found 54
in biomass. Teri et al. [5] first considered a linear prediction model but also added inter- 55
action terms in order to reproduce the actual behavior more precisely. It turned out how- 56
ever that the prediction model incorporating interaction terms was less accurate than the 57
linear prediction model. Another study compared results of HTL experiments with model 58
mixtures and with food processing residues, also applying a linear and polynomial re- 59
gression model for the prediction of biocrude yields [6]. One additional aspect that this 60
study brought up was the difference between monomeric and polymeric model com- 61
pounds. It is generally acknowledged that hydrolysis of polymeric biomass components 62
into monomers and oligomers is the first reaction occurring in HTL and that a fraction of 63
the hydrolysis products repolymerize to form biocrude and solid residue components [7]. 64
However, as shown by Déniel et al., not all polymeric biomass structures behave in the 65
same way and it therefore is important to consider additional aspects, such as rate of hy- 66
drolysis under certain reaction conditions, when using monomeric model compounds [6]. 67
As already mentioned, not all biocrude yield models rely on experiments with model com- 68
pounds. Leow et al. [8]and Li et al. [9] performed a large number of HTL batch experi- 69
ments with microalgae samples having distinctive feedstock properties or a wide range 70
of compositions, respectively. The biocrude yields as well as properties were predicted 71
based on a multiphase component additivity model. Besides the aforementioned HTL bi- 72
ocrude prediction models, also more process engineering oriented models based on sim- 73
ulation software like Aspen Plus have been reported in literature. Hoffmann et al. inves- 74
tigated a combination of an HTL plant with a biogas plant, using two components, phenol 75
and hexadecanoic acid, for the biocrude modeling and eight reactions for the upgrading 76
unit step in the Aspen Plus simulation [10]. The study was able to deliver mass and energy 77
balances that suggest the feasibility of the conceptual process design. Another conceptual 78
biorefinery design incorporating HTL and hydrotreatment as process steps is performed 79
by Snowden-Swan et al. [11]. The study focused on a techno-economic assessment to in- 80
vestigate minimum fuel selling prices for a system that includes a whole process chain. 81
The underlying Aspen Plus model is largely based on previous studies by Knorr et al. [12] 82
and Jones et al. [4] and uses 16 model compounds for modeling the biocrude and 39 model 83
compounds for modeling the upgraded biocrude. Finally, there are also studies that in- 84
vestigate reactions of the individual biochemical groups as single compound experiments 85
or as mixtures in order to get a better understanding of the underlying HTL reaction net- 86
work. Matayeva et al. studied the fate of two amino acids, phenylalanine and leucine, as 87
well as binary mixtures of phenylalanine with tripalmitin and phenylalanine with glucose 88
Processes 2021, 9, x FOR PEER REVIEW 3 of 33
under hydrothermal conditions and derived chemical pathway proposals for the two in- 89
dividual amino acids and the binary mixture of phenylalanine with tripalmitin [13]. Gai 90
et al. investigated two types of low-lipid microalgae under subcritical hydrothermal con- 91
ditions with varying temperatures. Based on experimental results from GC-MS and 1H- 92
NMR characterization, a general reaction network as well as predicted pathway schemes 93
for HTL of lipids, proteins and non-fibrous carbohydrates in low-lipid microalgae were 94
proposed [14]. A combination of predictive biocrude yield and reaction network study 95
was performed by Yang et al. [15]. The prediction model was developed using a mixture 96
design of five model components and verified with results from actual feedstock and mix- 97
tures of model components. Based on the results of the model, synergistic and antagonistic 98
interactions between the individual components could be detected and a generalized re- 99
action network was established. 100
In the present study, the generalized reaction concepts and predicted pathway schemes 101
mentioned in literature are consolidated [13–15], and put into live in a comprehensive 102
Aspen Plus ® simulation for three different feedstock. 51 model compounds are used as 103
representatives of the biomass. The model compounds are reacted under hydrothermal 104
conditions, which builds the first core process step of the model. The intermediate bi- 105
ocrude product is subsequently processed by catalytic hydrotreatment to yield the final 106
upgraded biocrude. This is the second core process step of the simulation. Next to the 107
biocrude however, HTL conversion also yields gaseous, solid and aqueous product 108
phases. The aqueous phase contains a large fraction of the organic content of the feedstock 109
in form of water-soluble compounds. Therefore, it is desirable to utilize the organic con- 110
tent of the aqueous phase to maximize carbon yields and overall process energy efficiency. 111
Catalytic hydrothermal gasification (cHTG) is an example for a conversion technology 112
that produces a biogas for energetic purposes and thereby treats the process water for 113
responsible disposal. cHTG is therefore included in the model as a third core process step. 114
Based on this comprehensive simulation approach, it is possible to reproduce key process 115
parameters with good agreement to literature results. Furthermore, more detailed chem- 116
ical analyses give deeper insights into the chemical compositions of modeled biocrudes 117
and upgraded biocrudes. These findings are in reasonable agreement with literature find- 118
ings for Spirulina and sewage sludge. It is proposed, that results for feedstock with similar 119
compositions to Spirulina and sewage sludge can be deduced. The model can serve as a 120
detailed basis for system analyses studies of HTL fuel production pathways. 121
122
2. Methods 123
In this section, the Aspen Plus ® simulation setup is described in detail. Furthermore, 124
key assumptions and parameters of the model are explained. 125
126
2.1 Process development, biomass modelling, property method and calculations 127
The process model is simulated with Aspen Plus V 10. It is divided into three main 128
process steps, namely HTL, HT and cHTG, which will be described in detail hereafter. An 129
overview of the process chain is shown in Figure 1. Soave-Redlich-Kwong cubic equation 130
of state is chosen for all thermodynamic properties as base property method, while the 131
Petroleum silmulation options were set to “STEAMNBS” for the “free-water method” and 132
to “3” for “water solubility”. 133
134

Processes 2021, 9, x FOR PEER REVIEW 4 of 33
135
Figure 1. Overview of the process chain investigated in this study. 136
137
Biomass is modeled based on the assumption, that hydrolysis is the first reaction occurring 138
in HTL [16]. 51 model compounds were chosen to represent typical hydrolysis products of 139
the individual biochemical groups of lipids, proteins, carbohydrates, lignin, extractives 140
and ash. The amounts of each model compound are adapted to optimally replicate the 141
experimentally measured amounts of biochemical groups as well as the results of 142
elemental analyses. The amounts of biochemical groups chosen for the model, as well as 143
experimental results of elemental analyses of the three investigated feedstock as dry matter 144
(dm) and ash-free are shown in Table 1. 145
146
Table 1. Elemental analysis (dry, ash-free) and amount of biochemical groups of the three 147
investigated feedstock Spirulina, sewage sludge and wheat straw [17] 148
Feedstock C H N O S Lipids Carbohydrates Proteins Lignin Extractives Ash
Spirulina 54.0 7.2 13.5 24.4 0.9 1.3 39.4 50.8 0.4 0.6 7.4
Sewage sludge 54.0 7.4 3.6 34.7 0.3 8.8 48.1 15.8 6.6 1.7 19.1
Wheat straw 54.6 5.9 0.8 38.6 0.2 2.1 83.9 4.8 7.0 0.6 1.6
149
In the case of lipids, typical hydrolysis products are fatty acids and glycerol [16]. Six fatty 150
acids are chosen as model compounds. Cellulose and hemicellulose are chosen as 151
macromolecular representatives for the group of carbohydrates. Hydrolysis of cellulose 152
yields the monomeric sugar glucose, while for hemicellulose, a variety of monomeric 153
sugars, such as xylose, arabinose and others, as well as acetic acid and other acids can be 154
Processes 2021, 9, x FOR PEER REVIEW 5 of 33
obtained [18]. In the simulation, only xylose and acetic acid are chosen as model 155
compounds representing hemicellulose. Proteins are macromolecules consisting of linked 156
amino acids, which are the resulting hydrolysis compounds [16]. Ten amino acids were 157
chosen as model compounds. It should be noted that four of these amino acids, namely 158
cysteine, histidine, proline and arginine could not be modeled directly, due to the missing 159
parameter PLXANT/1st element (data set 1) of the vapor pressure model PL0XANT in the 160
databank NISTV100.NIST-TRC, which caused the simulation to stop. In order to allow the 161
simulation to be completed, these four amino acids were replaced by alternative 162
compounds, namely 3-mercaptopropionic acid for cysteine, 2-ethylimidazol for histidine, 163
pyrrolidine for proline and valeric acid for arginine. Missing amounts of nitrogen are 164
compensated by the addition of ammonia, missing acid moieties are modelled as 165
additional formic acid. Lignin is a highly heterogeneous polymer whose biosynthesis 166
precursors are three lignols, namely coniferyl alcohol, sinapyl alcohol and paracoumaryl 167
alcohol, which are cross-linked in diverse ways [19,20]. During hydrolysis, different 168
linkages are broken, which leads to a variety of possible compounds. Therefore, 13 model 169
compounds are chosen for the representation of the lignin part of biomass. For woody 170
biomass, extractives can contribute a significant portion of up to 10 wt% to the biomass 171
[20]. Therefore, model compounds from different classes of extractives, such as terpenes, 172
waxes and sterols are chosen as representative model compounds. Ash components are 173
modelled as metal oxides, hydroxides and phosphates, representing some of the abundant 174
metals as well as phosphorous. For simplicity, the ash components are assumed to be 175
solids, having no impact on the reactions occurring during the different process steps. 176
However, solids are distributed over the different streams. Missing parameters “standard 177
enthalpy of formation” (DHFORM) and “standard Gibbs free energy of formation” 178
(DGFORM) have been estimated using the properties estimation Joback method based on 179
the Joback Group contribution method [21]. Mass balances are normalized to 1 kg of dry 180
biomass feedstock, considering the different levels of hydrolysis assumed for the different 181
biochemical groups. For further analysis, like LCA or TEA, the flow rate of 1kgh-1 can be 182
adapted as needed. TOC values of the different aqueous phases have been evaluated 183
assuming the volumes of the organic/water mixtures being equal to the mass of water, 184
considerung a density of 1 kg/L. Due to the high ratio of water to organics this 185
approximation seems reasonable. Elemental analyses have been computed using the molar 186
amount of each model component and multiplying it with the corresponding amount of 187
mass of each element present in the model compound. The sum of each element over all 188
model compounds devided by the sum of all elements over all model compounds gives 189
the relative abundance of each element in each process stream. Boiling point distribution 190
curves have been generated by sorting all model compounds according to their respective 191
boiling points in ascending order. The sum of the amounts of masses of the model 192
compounds then gives the theoretical amount of recovered sample up to a certain boiling 193
point. Molar mass distributions have been obtained by plotting the amount of each model 194
component present in a certain stream over the respective molecular mass of the individual 195
model components. cHTG gas compositions are calculated based on molar ratios of species 196

Processes 2021, 9, x FOR PEER REVIEW 6 of 33
present in the gaseous phase. Deoxygenation and denitrogenation rates are calculated 197
according to Haider et al. [22]. Hydrogen consumptions are estimated by the following 198
equation: 199
𝐶(𝐻2) = 𝑚(𝐻2,𝑖𝑛)−𝑚(𝐻2,𝑜𝑢𝑡)
𝑚(𝑏𝑐) (1) 200
whereat C (H2) is the hydrogen consumption, m (H2,in) is the mass of hydrogen input, 201
m (H2,out) is the mass of hydrogen in the output stream and m (bc) is the biocrude mass. 202
203
2.2 Hydrothermal liquefaction unit 204
205
The general setup of the HTL unit process step is shown in Figure 3. The feedstock 206
slurry is modelled as a mixture of 20 wt% dry biomass and 80 wt% water. The slurry is 207
pumped and heated to the HTL reactor (RStoic, 350 °C, 220 bar). The modelled reactions 208
are adapted in such a way, that the biocrude stream matches the experimental results of 209
elemental analysis and boiling point distribution. 210
211
Figure 2. Reaction network based on literature results [6,13–15,23–26]. 212
The resulting stream is depressurized and subsequently cooled down to 2 bar and 100 °C. 213
In the solid separator, parts of the solids can be removed. Subsequently, the phase 214
separation is performed, which results in the HTL gas phase, the aqueous phase and the 215
biocrude phase. The remaining solids are distributed over the aqueous phase and the 216
biocrude phase. The biocrude phase is sent to the HT unit, while the aqueous phase is 217
further treated with a membrane upconcentration. Due to simplicity reasons, the 218
membrane upconcentration is not modelled in detail. All model compounds are assumed 219

Processes 2021, 9, x FOR PEER REVIEW 7 of 33
to be filtered in an equal amount. Therefore, the split fractions, defined in the separation 220
unit, are set to 0.78 for each component, which means, that 78 % of the organic material is 221
separated into the retentate. The resulting permeate is treated as wastewater while the 222
retentate is sent to the cHTG unit. 223
224
Figure 3. Flowsheet diagram of the HTL process step. 225
226
2.3 Catalytic hydrothermal gasification 227
228
Figure 5 shows the flowsheet of the cHTG process step. Since the cHTG catalyst is 229
prone to deactivation, a salt separator has to be integrated into the process. The resulting 230
brine phase is treated as wastewater, while the remaining stream is heated and pressurized 231
to 450 °C and 280 bar, respectively and processed in the cHTG reactor. A process efficiency 232
of 90 % is assumed for the cHTG process. Therefore, the fractional conversion factors for 233
all reactions modelled in the cHTG reactor are set to a value of 0.9. All reactions can be 234
assumed to proceed in the same way, shown in Equation 2. 235
236
a H2O + CCHHNNOOSS b CH4 + c CO2 + d NH3 + e H2S (2) 237
238
This equation can be devided into five equations, one for each element. Combining these 239
equations, a matrix can be obtained. Based on the matrix and the elemental composition 240
for each compound, the stochiometries of each product compound and the reactant water 241
can be calculated. 242

Processes 2021, 9, x FOR PEER REVIEW 8 of 33
243
Figure 4. Matrix for calculating the stochiometry of a reaction as described in Equation 2 for any 244
given compound with the formula CCHHNNOOSS. 245
The resulting stream is subsequently cooled and depressurized to 80 °C and 10 bar and 246
further separated into a gaseous and an aqueous phase. The gaseous phase contains a 247
significant amount of methan, which can be used as source of process energy for the HTL 248
plant. The liquid phase is treated as waste water. 249
250
Figure 5. Flowsheet of the cHTG process step. 251
252
2.4 Hydrotreating 253
254
The flowsheet of the HT unit is shown in Figure 6. The biocrude stream from the HTL 255
unit and hydrogen that is supplied externally in excess, get heated and pressurized. Both 256
streams are combined and reacted in the HT reactor (RStoic) at a temperature of 400 °C 257
and a pressure of 70 bar. The resulting product stream is cooled, depressurized and sepa- 258
rated subsequently, resulting in a gaseous phase, a wastewater stream and the upgraded 259
biocrude. The reactions modelled in the HT reactor are adapted in such a way, that the 260
resulting upgraded biocrude stream best matches experimental results of elemental anal- 261
ysis and boiling point distribution. 262
263

Processes 2021, 9, x FOR PEER REVIEW 9 of 33
264
Figure 6. Flowsheet of the hydrotreating unit. 265
266
3. Results and Discussion 267
In this section, modelling results from the HTL, cHTG and HT process steps of the 268
Aspen Plus ® model with Spirulina, sewage sludge and wheat straw as feedstock are pre- 269
sented and discussed. In the first subsection, mass and energy balances are described. 270
Subsequently, the treatment of the aqueous phase in terms of TOC values, gas composi- 271
tion and methane yield is illustrated. In addition, elemental analysis and a van Krevelen 272
diagram of the most prominent streams, namely feedstock, biocrude and upgraded bi- 273
ocrude are presented. Furthermore, the biocrude and upgraded biocrude streams are dis- 274
cussed in detail, including boiling point distribution, molecular mass distribution and 275
chemical composition. Finally, fuel fractions as well as typical HT characteristics are dis- 276
cussed. 277
278
3.1. Mass and carbon mass balances 279
280
Table 2 shows the mass and carbon mass balances for all relevant streams of each 281
individual process step. The highest biocrude yield can be observed for Spirulina 282
(36 wt%), followed by sewage sludge (34 wt%) and wheat straw (31 wt%). Literature val- 283
ues are in the range of 23 wt% to 40 wt% for Spirulina [27–30], 28 wt% to 44 wt% for sew- 284
age sludge [3,31] and 28 wt% to 44 wt% for lignocellulosic feedstock [32–34]. The model- 285
ling results are in the range of literature values, however, the biocude yields of sewage 286
sludge and lignocellulosic feedstock tend to be higher compared to those of microalgae, 287
which is somewhat contradictory compared to the model results. It should be kept in mind 288
however, that biocrude yields strongly depend on reaction conditions and other experi- 289
mental parameters. The yields of the upgraded biocrudes in the hydrotreatment step be- 290
have differently compared to those of the biocrude. Sewage sludge shows the highest up- 291
graded biocrude yield, followed by wheat straw and Spirulina. The carbon mass balances 292
reveal that the distribution of the carbon is not proportional to the mass distribution. In 293
the case of sewage sludge 59.1 % of the initial carbon in the feedstock can be found in the 294
HTL biocrude, while for Spirulina and wheat straw these values are 55.0 % and 51.1 %, 295
respectively. 296
297
Table 2. Mass and carbon mass balances for the most relevant streams of the three process units, respectively. 298
HTL cHTG HT
Stream Mass /
Carbon flow (kg h-1)
Stream Mass /
Carbon flow (kg h-1)
Stream Mass /
Carbon flow (kg h-1)
Spirulina
Feed 1.00 0.51 RET (1) 1.94 0.13 BC 0.36 0.28

Processes 2021, 9, x FOR PEER REVIEW 10 of 33
Water 4.86 - BRINE 0.37 0 H2 0.16 -
SOLID 0.08 0.01 2 1.58 0.13 GAS 0.21 0.03 GAS 0.31 0.06 GAS 0.22 0.09 WW 0.02 0.00
AP 5.11 0.17 WW 1.36 0.04 UBC 0.29 0.25 BC 0.36 0.28 methane 0.06 0.05
RET 1.94 0.13
PER 3.17 0.04
Sewage sludge
Feed 1.00 0.44 RET (1) 1.78 0.09 BC 0.34 0.26 Water 4.49 - BRINE 0.33 0 H2 0.15 -
SOLID 0.19 0.00 2 1.45 0.09 GAS 0.18 0.02 GAS 0.17 0.06 GAS 0.17 0.07 WW 0.04 0.00
AP 4.79 0.12 WW 1.28 0.02 UBC 0.28 0.24
BC 0.34 0.26 methane 0.05 0.04 RET 1.78 0.09
PER 3.01 0.03
Wheat straw
Feed 1.00 0.47 RET (1) 1.85 0.11 BC 0.31 0.24 Water 4.49 - BRINE 0.33 0.00 H2 0.15 -
SOLID 0.02 0.00 2 1.52 0.11 GAS 0.17 0.01
GAS 0.23 0.09 GAS 0.20 0.09 WW 0.04 0.00 AP 4.95 0.14 WW 1.32 0.02 UBC 0.25 0.23
BC 0.31 0.24 methane 0.07 0.05 RET 1.85 0.11
PER 3.10 0.03
299
Likewise, the carbon yields of the upgraded biocrudes differ from the mass yields. For the 300
hydrotreatment step, wheat straw shows the highest carbon yield (95.8 %), while those of 301
Spirulina (86.2 %) and sewage sludge (85.7 %) are lower. The amounts and compositions 302
of HTL gas streams vary significantly for the different feedstock, which can be explained 303
by the different biochemical compositions and behaviors of the feedstock under hydro- 304
thermal conditions. Minor amounts of carbon can be found in the HTL solids. Besides the 305
biocrude, also the aqueous phases contain considerable amounts of the initial feedstock 306
carbon, which suggest that aqueous phase valorization is key to optimize overall energy 307
and carbon efficiencies. Details of the aqueous phases and the resulting downstream 308
cHTG flows are shown in the following. 309
3.2. Analysis of the aqueous phase, cHTG gas composition and methane yield 310
In this section TOC values of the AP and subsequently produced cHTG gas 311
compositions and methane yields are discussed. 312
3.2.1 Total organic carbon of the aqueous phase 313
As can be seen from the carbon mass balances in Table 2, a significant amount of the 314
initial biogenic carbon ends up in the AP after HTL. In order to increase the total organic 315
carbon (TOC) and make cHTG a more energy-efficient option for treating the AP, an 316
upconcentration step is included into the model. The respective TOC values of the AP, the 317
retentate and the permeate are listed in Table 3. Since the upconcentration is modeled on 318
a simple level and independent of the feedstock, higher TOC values in the AP also lead to 319
higher TOC values in the retentate and permeate. Spirulina shows the highest initial TOC 320
value in the AP, followed by wheat straw and sewage sludge. These values are in good 321
agreement with literature data for Spirulina (6.7 g/L to 79.9 g/L) [29,35,36] and sewage 322

Processes 2021, 9, x FOR PEER REVIEW 11 of 33
sludge (8.3 g/L to 27.8 g/L) [31,35,37]. The TOC value of the modeled aqueous phase of 323
wheat straw is higher than reported in literature (2.8 g/L to 27.8 g/L) [35,36]. 324
325
Table 3. TOC values for the three streams AP, retentate and permeate for each feedstock. 326
TOC / feedstock Spirulina Sewage sludge Wheat straw
TOC (AP) [g/L] 35.0 25.5 30.4
TOC (retentate) [g/L] 78.0 56.9 67.7
TOC (permeate) [g/L] 11.8 8.6 10.3
327
3.2.2 cHTG gas composition and methane yield 328
Based on the matrix calculation described earlier the retentates were converted into 329
gas mixtures under hydrothermal gasification conditions. The gas compositions of the 330
respective gas streams after cHTG are shown in Figure 7. Generally, the gas compositions 331
are dominated by methane (50.7 to 57.8 mol%), carbon dioxide (31.6 to 32.5 mol%) and 332
water (8.1 to 10.2 mol%). Literature results show that also hydrogen is produced in 333
considerable amounts. The exact composition of the gas strongly depends on the catalyst 334
that is used and the chosen experimental conditions. One possible gas composition 335
reported by Stucki et al. comprises 52.4 vol% methane and 38.0 vol%, which is in good 336
agreement with the model results [38]. Minor contributions to the modeled gas are 337
observed from hydrogen, dihydrogen sulfide, carbon monoxide, nitrogen and ammonia. 338
One exception is the case of Spirulina, where the amount of ammonia is quite high (7.9 339
mol%) due to the high amount of proteins in the feedstock and subsequent, nitrogen 340
species in the aqueous phase. In contrast, wheat straw contains much less nitrogen in the 341
feedstock, which is also reflected in the aqueous phase and the resulting cHTG gas phase 342
composition. It should be noted, that the methane yield is not directly proportional to the 343
amount of carbon distributed to the aqueous phase (TOC values), but it is also dependant 344
on the type of compound that is converted. Wheat straw has the highest mass yield 345
(6.7 wt%) and carbon mass yield (10.6 wt%). Sewage sludge has the lowest mass yield 346
(5.3 wt%) but the second highest carbon mass yield (9.0 wt%), while Spirulina has the 347
second highest mass yield (6.1 wt%) and the lowest carbon mass yield (8.9 wt%). The 348
carbon mass yields for methane are also reflected by the share of methane in the gas 349
mixture (Figure 7). 350

Processes 2021, 9, x FOR PEER REVIEW 12 of 33
351
Figure 7. Gas composition of cHTG gases from the three feedstock Spirulina (blue), sewage sludge (orange) and wheat straw (grey). 352
3.3. Elemental analysis and van Krevelen diagram of feedstock, biocrude and upgraded biocrude 353
Table 4 lists the results of the CHNO elemental analysis of feedstock, biocrude and 354
upgraded biocrude streams for all three investigated feedstock. The model results are 355
validated with experimental results obtained in the HyFlexFuel project [39]. All modeled 356
elemental compositions of the feedstock samples are in good agreement with 357
experimental results [17]. Relative deviations are under three percent, with the exceptions 358
of the hydrogen and oxygen contents of wheat straw which show a deviation of 4.0 % and 359
11.4 %, respectively. Biocrude and upgraded biocrude streams show a significant decrease 360
in oxygen and nitrogen content for all three feedstock. The final product consists mainly 361
of hydrocarbons, as indicated by the carbon and hydrogen content. Relative deviations 362
compared to the experiemental values for the sewage sludge biocrude are below 7 % while 363
for Spirulina the nitrogen content in the model is underestimated significantly, leading to 364
a deviation of over 35 %. In the case of the wheat straw biocrude, the nitrogen and carbon 365
content is overestimated, while the hydrogen and oxygen content is underestimated. This 366
leads to relative deviations of up to 35 wt% for the oxygen content. Also for the upgraded 367
biocrudes, wheat straw shows the highest deviations. The hydrogen content is 368
significantly lower than measured experimentally which reveals an overestimation of 369
aromatic compounds with high boiling points. The significant underestimation of 370
nitrogen indicates that the distribution of nitrogen is probably not modelled correctly. In 371
the model, most likely, the nitrogen content in the low boiling components is 372
overestimated while it is underestimated for the high boiling compounds. The elemental 373
composition of the upgraded biocrudes of Spirulina and sewage sludge are represented 374
quite well by the model. Figure A1 in the SI show a graphical representation of the results 375
shown in Table 4. 376
377

Processes 2021, 9, x FOR PEER REVIEW 13 of 33
Table 4. Elemental analysis of feedstock, biocrude and upgraded biocrude from Spirulina, sewage sludge and wheat straw 378
Stream / Feedstock Spirulina Sewage sludge Wheat straw
C H N O C H N O C H N O
Feedstock model [wt%] 55.1 7.1 13.5 23.8 54.2 7.3 3.7 34.2 48.3 6.5 0.8 44.4
Feedstock experiment [wt%]
[17]
54.0 7.2 13.5 24.4 54.0 7.4 3.6 34.7 49.4 6.2 0.7 43.6
Relative deviation [%] 2.0 2.6 0.2 2.2 0.5 1.2 2.4 1.4 2.3 4.0 11.4 1.8
Biocrude model [wt%] [40] 77.6 9.5 5.7 7.3 76.5 8.9 3.0 11.6 78.0 6.2 1.5 14.3
Biocrude experiment [wt%] [40] 75.0 10.4 7.7 6.9 75.6 9.5 3.0 11.8 72.3 7.2 1.2 19.3
Relative deviation [%] 3.3 9.6 35.6 5.0 1.1 6.5 0.1 1.6 7.3 16.0 17.3 34.6
Upgraded biocrude model
[wt%] [40]
85.4 13.7 0.8 0.1 86.2 13.0 0.7 0.1 90.2 9.3 0.4 0.1
Upgraded biocrude experiment
[wt%] [40]
84.8 14.6 0.6 0.1 84.5 14.7 0.8 0.1 87.7 12.1 0.9 0.1
Relative deviation [%] 0.7 6.5 20.9 12.9 2.0 13.3 9.9 16.1 2.8 29.9 121.3 6.8
379
Based on the results of the elemental analysis, van Krevelen diagrams can be generated 380
which give further insight into the differences of the different streams. H:C ratios of the 381
feedstock are in the range of 1.51 to 1.65 and quite similar, while the O:C ratios vary 382
significantly from around 0.7 for wheat straw to 0.5 for sewage sludge and 0.3 for 383
Spirulina. These trends can also be observed for the literature values. Futhermore, the 384
latter trend is also continued in the case of the model and validation biocrudes with O:C 385
ratios ranging from 0.20 for wheat straw over 0.12 for sewage sludge to 0.07 for Spirulina. 386
Literature values do not confirm this trend. O:C ratios of biocrudes from microalgae and 387
lignocellulosic materials vary quite significantly. Also H:C ratios are not similar for 388
biocrudes obtained from different feedstock. However, a trend is visible in this case. 389
Biocrudes from lignocellulosic feedstock tend to have the lowest H:C ratios, while those 390
from microalgae and sewage sludge are similar. The HyFlexFuel results however show a 391
clear trend. H:C ratios are 1.66 for Spirulina, 1.51 for sewage sludge and 1.20 for wheat 392
straw. For wheat straw, this can be explained by the large amount of formed aromatic 393
compounds in the biocrude, which is a result of the high amount of carbohydrates and 394
lignin in the feedstock. For sewage sludge, the high amount of lipids leads to a larger H:C 395
ratio, while significant amounts of carbohydrates and lignin compensate this effect to 396
some degree. In the case of Spirulina, the carbohydrate and especially, the lignin content 397
is quite low, which induces the high H:C ratio. Also the high amount of proteins seems to 398
have a favorable influence on the H:C ratio. For the upgraded biocrudes obtained in the 399

Processes 2021, 9, x FOR PEER REVIEW 14 of 33
HyFlexFuel project, the previously described effect is even more distinct with H:C ratios 400
ranging from 1.66 for wheat straw to 2.07 and 2.09 for Spirulina and sewage sludge, 401
respectively. Since almost all oxygen is removed during hydrotreatment, the O:C ratios 402
are very low for all three upgraded biocrudes. Literature values confirm that upgraded 403
biocrudes from lignocellulosic feedstock tend to have lower H:C ratios and slightly higher 404
O:C ratios compared to upgraded biocrudes from lipid or protein-rich biomass. H:C ratios 405
of upgraded biocrudes from Spirulina tend to be slightly lower than those of upgraded 406
biocrudes from sewage sludge. Model results vary slightly from experimental results for 407
Spirulina and sewage sludge, while greater deviations can be observed for wheat straw, 408
as already observed for the elemental analysis. H:C ratios are underestimated slightly in 409
all cases. For the biocrude and upgraded biocrude of wheat straw however, a large 410
deviation can be observed, which can be explained by the high amount of aromatic high 411
boiling components in the model. O:C ratios for the dry, ash-free feedstock streams are 412
also underestimated slightly. For the biocrude of wheat straw the O:C ratio is 413
underestimated significantly, which is caused by the underestimation of oxygen 414
containing high boiling components. Nevertheless, generall trends that are consolidated 415
by literature values are represented in a reasonable way. 416
417
Figure 8. Van Krevelen diagram showing the atomic H:C ratio over the atomic O:C ratio for feedstock, biocrude and upgraded 418
biocrudes. Model values and results from the HyFlexFuel project [39] for Spirulina (blue), sewage sludge (orange) and wheat straw 419
(grey) are given as circles. Model results are shown in light colours, while experimental results are depicted in dark colours. Literature 420
feedstock values are shown as rhombi, literature biocrude values are given as triangles and literature upgraded biocrude values are 421
depicted as squares [3,27,32,33,41–43]. 422
423
3.4. Analysis of modelled biocrudes from sewage sludge, Spirulina and wheat straw 424
In this section boiling point distributions, molecular mass distributions and chemical 425
compositions of biocrudes from the different feedstock are compared. 426
427
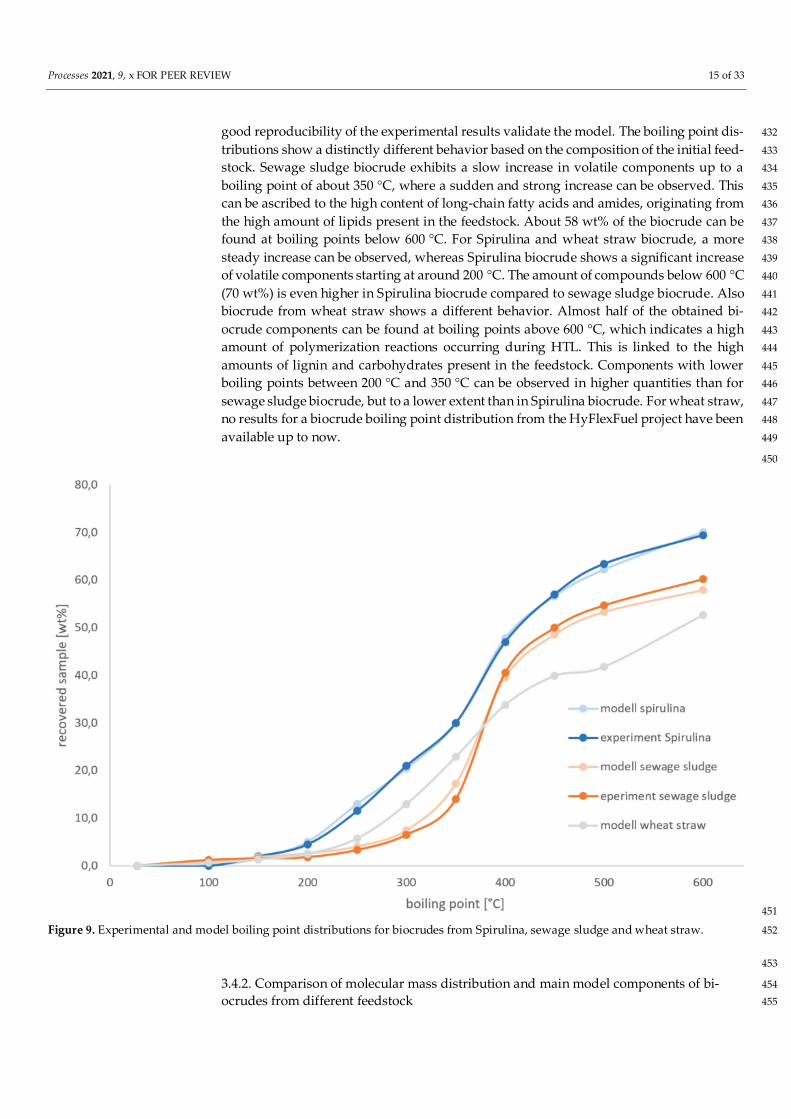
3.4.1. Boiling point distribution 428
The boiling point distributions of biocrudes from three different feedstock Spirulina, 429
sewage sludge and wheat straw are depicted in Figure 9. The model boiling point distri- 430
butions are adapted to experimental results obtained in the HyFlexFuel project [39], the 431
Processes 2021, 9, x FOR PEER REVIEW 15 of 33
good reproducibility of the experimental results validate the model. The boiling point dis- 432
tributions show a distinctly different behavior based on the composition of the initial feed- 433
stock. Sewage sludge biocrude exhibits a slow increase in volatile components up to a 434
boiling point of about 350 °C, where a sudden and strong increase can be observed. This 435
can be ascribed to the high content of long-chain fatty acids and amides, originating from 436
the high amount of lipids present in the feedstock. About 58 wt% of the biocrude can be 437
found at boiling points below 600 °C. For Spirulina and wheat straw biocrude, a more 438
steady increase can be observed, whereas Spirulina biocrude shows a significant increase 439
of volatile components starting at around 200 °C. The amount of compounds below 600 °C 440
(70 wt%) is even higher in Spirulina biocrude compared to sewage sludge biocrude. Also 441
biocrude from wheat straw shows a different behavior. Almost half of the obtained bi- 442
ocrude components can be found at boiling points above 600 °C, which indicates a high 443
amount of polymerization reactions occurring during HTL. This is linked to the high 444
amounts of lignin and carbohydrates present in the feedstock. Components with lower 445
boiling points between 200 °C and 350 °C can be observed in higher quantities than for 446
sewage sludge biocrude, but to a lower extent than in Spirulina biocrude. For wheat straw, 447
no results for a biocrude boiling point distribution from the HyFlexFuel project have been 448
available up to now. 449
450
451
Figure 9. Experimental and model boiling point distributions for biocrudes from Spirulina, sewage sludge and wheat straw. 452
453
3.4.2. Comparison of molecular mass distribution and main model components of bi- 454
ocrudes from different feedstock 455

Processes 2021, 9, x FOR PEER REVIEW 16 of 33
The presentation shown in Figure 10 to Figure 12 and Figure 14 to Figure 16 can be 456
compared to an experimental GC-MS analysis, as e.g. shown in a study by Jarvis et al. [44]. 457
However, some distinct differences have to be kept in mind. Firstly, GC-MS analyses do 458
not show the exact molecular mass of the components and secondly, GC-MS results are 459
limited to the volatile fraction of the sample, while in these figures, the exact molecular 460
mass of the model compounds is depicted on the x-axis and there is no limitation towards 461
high boiling components. In order to give a better overview of the different biocrude sam- 462
ples however, the two heaviest model compounds, namely dohexacontane (C62, 463
871.7 g/mol) and doheptacontane (C72, 1011.9 g/mol) are not shown. In the case of Spir- 464
ulina, these two compounds have a share of 11.0 wt% and 8.2 wt% respectively, while in 465
the case of sewage sludge the amounts are 6.9 wt% and 4.8 wt%, respectively. In the case 466
of wheat straw, these components do not contribute as much (3.0 wt% and 2.8 wt% re- 467
spectively), because the high boiling polymerization compounds are mostly based on ar- 468
omatic monomers from lignin and carbohydrate-originated compounds. Besides this, bi- 469
ocrudes from Spirulina and sewage sludge generally are more similar compared to the 470
biocrude obtained from wheat straw, which is dominated by aromatic compounds and 471
especially a larger fraction of high molecular mass components. Besides some long-chain 472
amines (O, W), which result from reactions of lipids, the Spirulina biocrude (Figure 10) 473
shows a variety of different cyclic and aromatic oxygen and nitrogen containing com- 474
pounds (B, E, F-K) that originate from Maillard reactions of sugars and proteins or from 475
direct dimerization reactions of proteins [14,15]. Furthermore, significant amounts of ox- 476
ygenated cyclic or aromatic compounds (M, P, R) can be observed from the reaction of 477
sugar products, such as 5-hydroxymethylfurfural [6,25], with lignin monomers or with 478
each other. In addition, some aromatic high boiling polymerization products (S, T, V, X) 479
are present [25], but the high boiling fraction is mostly dominated by the long-chain hy- 480
drocarbons that are not depicted. In some cases, model compounds are not expected to be 481
present in real samples in the exact same way, but they rather serve as representatives for 482
a variety of different possible compounds that cannot be modelled easily. This is espe- 483
cially true for high boiling components. 484
485

Processes 2021, 9, x FOR PEER REVIEW 17 of 33
486
Figure 10. Molecular mass distribution and main biocrude model compounds for Spirulina as feedstock. 487
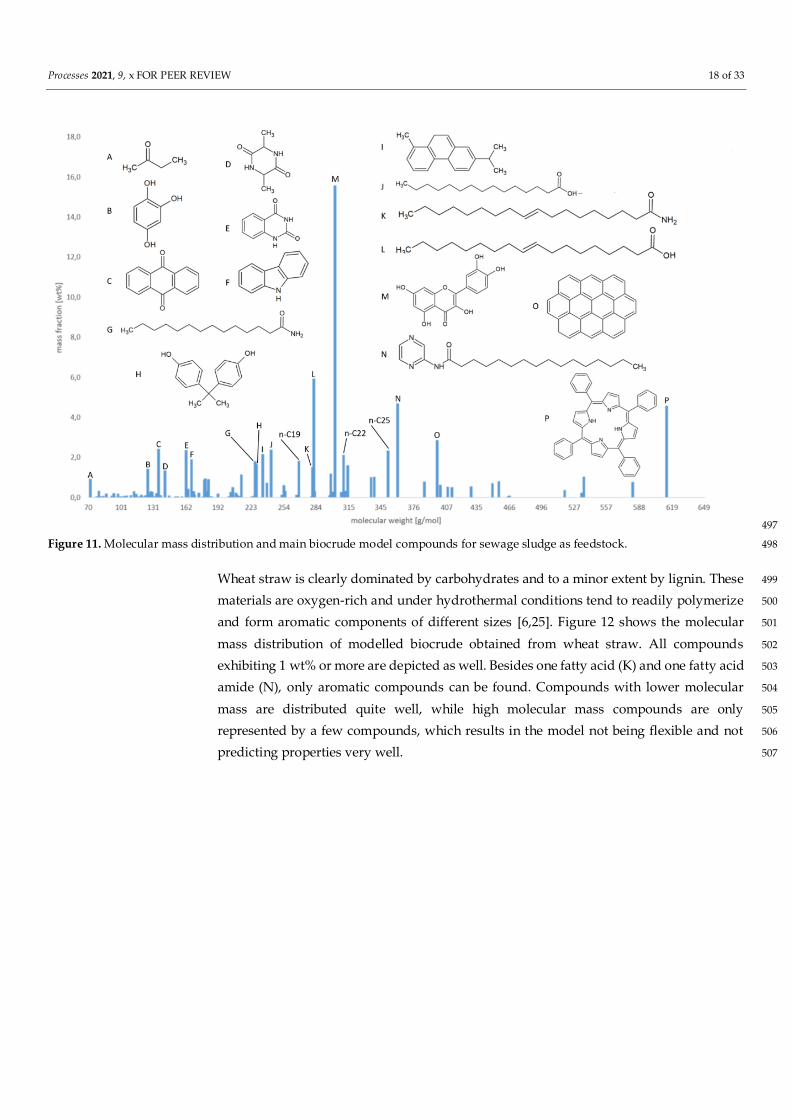
In the case of the sewage sludge biocrude (Figure 11), Maillard reactions products (D-F) 488
are present as well, but to a significantly lower extent, due to the lower amount of proteins 489
in the feedstock. Therefore, larger amounts of oxygenated cyclic and aromatic compounds 490
(B, C, H, M) can be observed, due to the increased amount of carbohydrates in the 491
feedstock [6,25]. Furthermore, an increased number of n-paraffins (n-C19, n-C22 and n- 492
C25), long-chain carboxylic acid and amides (G, J-L, N) can be observed [14], which 493
originate from the higher amount of lipids in the feedstock. High boiling components are 494
dominated by long-chain hydrocarbons, which are not shown and to a small amount 495
consist of aromatic compounds (I, O, P), also containing heteroatoms [25]. 496
Processes 2021, 9, x FOR PEER REVIEW 18 of 33
497
Figure 11. Molecular mass distribution and main biocrude model compounds for sewage sludge as feedstock. 498
Wheat straw is clearly dominated by carbohydrates and to a minor extent by lignin. These 499
materials are oxygen-rich and under hydrothermal conditions tend to readily polymerize 500
and form aromatic components of different sizes [6,25]. Figure 12 shows the molecular 501
mass distribution of modelled biocrude obtained from wheat straw. All compounds 502
exhibiting 1 wt% or more are depicted as well. Besides one fatty acid (K) and one fatty acid 503
amide (N), only aromatic compounds can be found. Compounds with lower molecular 504
mass are distributed quite well, while high molecular mass compounds are only 505
represented by a few compounds, which results in the model not being flexible and not 506
predicting properties very well. 507

Processes 2021, 9, x FOR PEER REVIEW 19 of 33
508
Figure 12. Molecular mass distribution and main biocrude model compounds for wheat straw as feedstock. 509
3.5. Analysis of modelled upgraded biocrudes from sewage sludge, Spirulina and wheat straw and 510
HT process characteristics 511
In this section the boiling point distribution as well as the chemical composition of 512
the upgraded biocrudes are covered. Furthermore, a comparison to the chemical compo- 513
sition of the biocrudes is shown. Subsequently, fuel properties, fuel fractions and HT char- 514
acteristics are investigated. 515
516
3.5.1. Boiling point distribution 517
Figure 13 shows the boiling point distributions of the upgraded biocrudes obtained 518
from Spirulina (blue), sewage sludge (orange) and wheat straw (grey). Experimental re- 519
sults were obtained from the HyFlexFuel project [39] and are shown in dark colors, while 520
model results are depicted in light colors. As already described, Spirulina has a strong 521
emphasis on proteins and wheat straw on carbohydrates. Sewage sludge has a higher li- 522
pid content but generally can be considered to have the most balanced composition of the 523
three investigated feedstock. The different compositions are reflected in the upgraded bi- 524
ocrudes in different ways. While a significant portion of the upgraded biocrude of Spir- 525
ulina can be found at lower boiling points, a strong increase between 275 °C and 325 °C is 526
observed, which can be attributed to n-paraffins (mainly C16 and C18). This effect is even 527
more severe for sewage sludge, due to the significantly higher amount of lipids present. 528
In contrast however, only a small amount of the upgraded biocrude can be found in the 529
low boiling point range. In the case of wheat straw, a smooth and steady, almost linear 530
increase can be observed. Furthermore, the amount of high boiling components (> 350 °C) 531
is significantly higher for the wheat straw upgraded biocrude. This can be explained by 532

Processes 2021, 9, x FOR PEER REVIEW 20 of 33
the high amounts of lignin and especially carbohydrates, which lead to an increased for- 533
mation of aromatic high boiling components [6,25], which is also supported by the low 534
H/C ratio in the van Krevelen diagram (Figure 8). 535
536
537
Figure 13. Experimental and model boiling point distributions for upgraded biocrudes from Spirulina (blue), sewage sludge 538
(orange) and wheat straw (grey). Experimental results are shown in dark colors, while model results are depicted in light colors. 539
540
3.5.2. Comparison of molecular mass distribution and main model components of up- 541
graded biocrudes from different feedstock 542
Generally speaking, compositions of upgraded biocrudes are less complicated than 543
compositions of biocrudes, because the amount of compounds that add up to large parts 544
of the upgraded biocrude is smaller. Figure 14 shows the molecular mass distribution of 545
the upgraded biocrude obtained from Spirulina with the main model compounds incor- 546
porated. A prominent portion of the upgraded biocrude comprises n-alkanes from C5 up 547
to C37, with a clear peak at C16 and C18, originating from lipid containing species in the 548
biocrude. Furthermore, a significant amount of the upgraded biocrude consists of cyclic 549
paraffins (A-D, F, K, M) that originate from hydrotreating of aromatics and heteroaro- 550
matic cyclic compounds. Some of the aromatics (I, J, H, L) could only partially be hy- 551
drotreated and are still present. 552

Processes 2021, 9, x FOR PEER REVIEW 21 of 33
553
Figure 14. Molecular mass distribution and main upgraded biocrude model compounds for Spirulina as feedstock. 554
Considering the overall picture, upraded biocrude from sewage sludge (Figure 15) and 555
Spirulina do not differ overly. The largest portion of the upgraded biocrude from sewage 556
sludge also consists of n-paraffins, although the amount is smaller compared to the 557
Spirulina case. However, the fraction of iso-paraffins is increased significantly. The 558
amount of cyclic paraffins (B-D, F) is quite similar at around 20 wt%. The aromatic content 559
(A, G, H) is increased quite significantly in the case of sewage sludge. This can be attributed 560
to the higher amount of carbohydrates and especially lignin, which tend to form aromatic 561
compounds [6,25]. 562

Processes 2021, 9, x FOR PEER REVIEW 22 of 33
563
Figure 15. Molecular mass distribution and main upgraded biocrude model compounds for sewage sludge as feedstock. 564
Modeled upgraded biocrude from wheat straw is composed mostly of aromatics (A, F, G, 565
H, I, K1, K2, L-N, R-T). Cyclic-paraffins (B-D, Q) can mainly be found in the low molecular 566
mass range. Some n-alkans (n-C13, n-C15 and n-C18), iso-alkanes (E, P) and alkan 567
substituted aromatics (O) are present as well. As seen in Figure 13 the majority of upgraded 568
biocrude can be found at boiling points above 350 °C. In the model, this range is dominated 569
by one single compound, Ovalene (S), which has a share of more than 25 wt% of the overall 570
upgraded biocrude. Certainly, this is far away from reality and the model does not 571
reproduce the actual composition of this range of the upgraded biocrude very well. This 572
indicates that the formation of high boiling poly-aromatic compounds in the HTL step is 573
key for a better understanding of upgraded biocrudes from lignin-rich feedstock. 574

Processes 2021, 9, x FOR PEER REVIEW 23 of 33
575
Figure 16. Molecular mass distribution and main upgraded biocrude model compounds for wheat straw as feedstock. 576
3.5.2. Comparison of molecular weight distributions of biocrudes and upgraded 577
biocrudes 578
Figure 17 shows the comparison of molecular weight distributions of biocrude and 579
upgraded biocrude obtained from Spirulina (a), sewage sludge (b) and wheat straw (c), 580
respectively. A shift of higher molecular masses in the biocrude towards lower molecular 581
masses in the upgraded biocrude can clearly be observed and is also supported by the 582
values of mean molar mass, specified in the Aspen models. The mean molar mass 583
decreases from 198.7 g/mol, 250.0 g/mol and 233.6 g/mol in the biocrude to 158.6 g/mol, 584
182.6 g/mol and 207.0 g/mol in the upgraded biocrude for Spirulina, sewage sludge and 585
wheat straw, respectively. This is also compliant with the observed differences in boiling 586
points distributions. Spirulina biocrude has a higher share of low boiling components, 587
which results in a smaller mean molar mass, sewage sludge biocrude has a higher share of 588
high boiling components, resulting in an increased mean molar mass. Wheat straw 589
biocrude has the highest share of high boiling components. However, these are almost 590
exclusively of aromatic nature which therefore leads to a slightly lower mean molar mass 591
compared to sewage sludge biocrude. For the upgraded biocrudes, mean molar masses 592
strictly follow the observed boiling point distributions and shares of low and high boiling 593
components, respectively. 594

Processes 2021, 9, x FOR PEER REVIEW 24 of 33
595
Figure 17. Molecular mass distribution of biocrude (blue) and upgraded biocrude (orange) for Spirulina (a), sewage sludge (b) and 596
wheat straw (c). 597
598
3.5.3 Chemical composition and properties of upgraded biocrudes 599
600
It is a clear observation, that the modeled upgraded biocrudes from Spirulina and 601
sewage sludge are dominated by paraffins, while the upgraded biocrude of wheat straw 602
is clearly dominated by aromatics. In the case of sewage sludge, the origin of the n-paraf- 603
fins can be traced back to the lipid content (primarily C16 and C18 fatty acids) in the feed- 604
stock, while in the case of Spirulina, parts of the n-paraffins also stem from proteins. The 605
high amount of aromatics in the upgraded biocrude of wheat straw originates to a major 606
extent from the high amount of carbohydrates and to a minor extent from the lignin pre- 607
sent in the feedstock. Generally, these results are in good agreement with literature [44– 608
46]. For batch-hydrotreating experiments, Haider et al. [46] and Castello et al. [45] both 609
report amounts of n-paraffins of over 50 % for microalgae, which is also reflected by the 610
model. Aromatics, O-containing compounds as well as cyclic- and iso-paraffins are in the 611
range of 5 % to 10 %. Minor amounts of upgraded biocrude can be attributed to olefins as 612
well as N-containing and N-O-containing compounds. In the model, the amounts of O- 613
containing and N-containing compounds are inverted, while the amounts of cyclic-paraf- 614
fins and aromatics are slightly overestimated compared to these literature results. In the 615
case of sewage sludge, both Haider et al. [46] and Castello et al. [45] report amounts of n- 616
paraffins of over 80 %. Aromatics, cyclic- and iso-paraffins are below 5 %, while O-con- 617
taining compounds might be slightly over 5 %. These values are not reflected by the 618
model. Although n-paraffins dominate the composition of the sewage sludge upgraded 619
biocrude, the share is only 40 wt%. Aromatics, iso- and cyclic paraffins contribute signifi- 620
cantly, having shares of 19.9 wt%, 13.2 wt% and 20.3 wt%, respectively. The amounts of 621
N- and O-containing compounds are inverted, as already observed for the microalgae 622
feedstock. With miscanthus and pine, Castello et al. [45] and Jarvis et al. [44] also investi- 623
gated lignocellulosic feedstock. The latter publication reports a large amount of multicy- 624
clic and in some cases aromatic compounds in the diesel range and further mentions a 625
lower amount of n-paraffins compared to sewage sludge and microalgae samples. This is 626
observed in the wheat straw model as well, but with reverse amounts. Castello et al. [45] 627

Processes 2021, 9, x FOR PEER REVIEW 25 of 33
also reports lower amounts of n-paraffins between 10 wt% and 20 wt%, depending on the 628
hydrotreating conditions. Furthermore, aromatics and cyclic-paraffins can contribute up 629
to 30 wt% each, while a fraction of at least wt10 % of O-containing compounds is ob- 630
served. The amount of n-paraffins matches quite well with the amounts observed in the 631
model. The sum of aromatics and cyclic-paraffins in the model is slightly higher and the 632
share is shifted to the aromatic side quite significantly. Taking into account the low H:C 633
ratio, it can be concluded that the amount of aromatics in the model is overestimated. As 634
observed for the other two feedstock, the amounts of N- and O-containing compounds 635
are inverted again. When comparing results of different HTL and HT experiments, there 636
are further aspects that should be considered. First of all, the same feedstock can have 637
quite diverse biochemical compositions, which is especially true for sewage sludge. It was 638
found out that the mean value for crude fat content given in literature is 22 wt% with a 639
standard deviation of 84.4 % [17]. This is also reflected by another study, in which one 640
sludge sample (dm) had a fat content of 22.6 wt% and another sludge sample had a fat 641
content of 6.5 wt% [3]. Considering this and the fact that a fat content of 8.7 wt% (dm) was 642
chosen in this model, it seems reasonable that the amount of n-paraffins is significantly 643
lower than reported in literature. Generally, it can be observed that H:C ratios are under- 644
estimated and aromatics are overestimated, which is adhesive. This is especially true for 645
wheat straw, in which large parts of the high boiling range is modelled with only one 646
component, ovalene. In order to generate more reliable results for lignocellulosic feed- 647
stock, which are dominated by carbohydrates and lignin (> 90 wt%), a more diverse mod- 648
elling of the high boiling range is necessary. 649
650
Table 5. Chemical composition of upgraded biocrudes from Spirulina, sewage sludge and wheat straw. 651
Feedstock n-paraffin
[wt%]
i-paraffin
[wt%]
c-paraffin
[wt%]
Olefin
[wt%]
Aromatic
[wt%]
O-contain-
ing [wt%]
N-O-contain-
ing [wt%]
N-contain-
ing [wt%]
Spirulina 54.6 5.8 19.2 0.8 12.0 1.7 0.0 5.8
Sewage
sludge
39.7 13.2 20.3 0.8 19.9 1.0 0.0 4.9
Wheat
straw
18.1 6.7 13.7 0.3 57.3 0.1 0.1 3.6
652
Important fuel properties are e.g. density, calorific value, viscosity and cold flow proper- 653
ties (cloud point, pour point) [47]. Table 6 compares two of these properties, density, 654
which is given based on results from the Aspen simulation and calorific values, which are 655
calculated according to Milne et al. [48], with literature results. The density values of the 656
modeled biocrudes of Spirulina and sewage sludge are generally slightly higher than the 657
literature values, while the densities of the modeled upgraded biocrudes are in good 658
agreement with literature values. In the case of the wheat straw model, especially the bi- 659
ocrude density is quite high, compared to literature values of lignocellulosic biomass. Also 660
the density of the upgraded biocrude is slightly higher in the case of wheat straw. The 661
high density values can be explained by the overestimated amount of aromatics, which 662
generally have higher densities than other classes of hydrocarbons. The higher heating 663
values for both biocrudes and upgraded biocrudes match quite well with literature values, 664

Processes 2021, 9, x FOR PEER REVIEW 26 of 33
except for the wheat straw biocrude. This is most likely caused by the high amount of 665
oxygen and the low H:C ratio in the biocrude. 666
667
Table 6. Densities and higher heating values of biocrudes and upgraded biocrudes from this study and literature. 668
Feedstock Literature
source
Biocrude density
[kgL-1]
Biocrude HHV
[MJ/kg]
Upgraded
biocrude density
[kgL-1]
Upgraded
biocrude HHV
[MJ/kg]
Spirulina this study 1.148 37.5 0.776 47.21
Sewage sludge this study 1.273 36.2 0.818 46.61
Wheat straw this study 1.707 33.0 1.213 43.11
Microalgae [49] 0.97 – 1.04 29.8 - -
Sewage sludge [3] 0.98 39.5 0.79 48.52
Sewage sludge [3] 0.99 38.0 0.81 47.82
Forestry residues [43] 1.055 37.6 0.9659 41.4
Woody biomass [42] 0.97 40.4 0.904 43.73
1 calculated according to Milne et al. [48]. 2 calculated according to Milne et al. [48] based on elemental analysis given in literature. 669
670
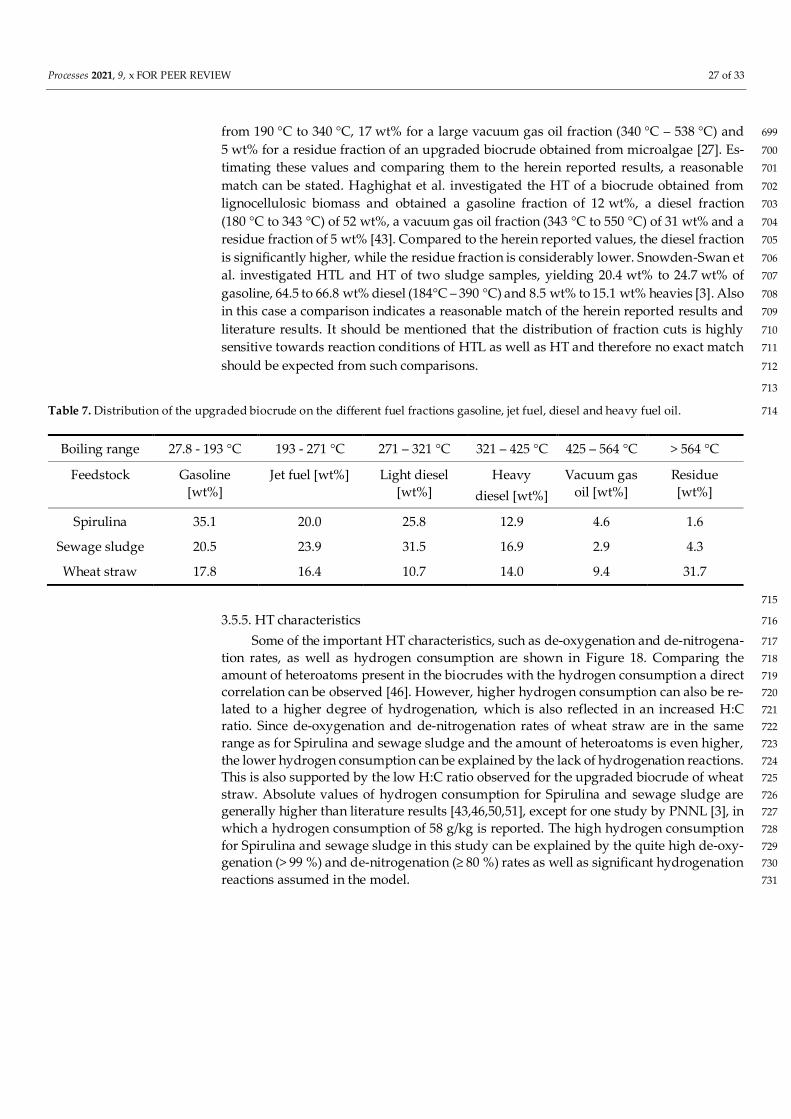
3.5.4. Fuel fractions 671
Based on the results of the boiling point distribution curves, fractions for different 672
fuel cuts can be obtained, as listed in Table 7. The fuel cuts were chosen according to 673
Haider et al. and Castello et al. [45,46]. For Spirulina the gasoline fraction is most promi- 674
nent, followed by the light diesel and jet fuel fraction, also containing more than 20 wt%. 675
The heavy diesel fraction still contains a considerable amount while vacuum gas oil (VGO) 676
and residue fractions only play a minor role. These results are somewhat different to those 677
reported in literature [45,46]. The gasoline fraction is almost half of the herein reported 678
amount, while the VGO and residue fraction contain significantly more upgraded bi- 679
ocrude. In the case of sewage sludge the light diesel fraction is most prominent, due to the 680
high amount of n-paraffins originating mostly from lipids (C16 and C18 fatty acids). The 681
jet fuel, gasoline and heavy diesel fractions contain between 16.9 wt% and 23.9 wt%, while 682
the VGO and residue fraction only makes a minor part of upgraded biocrude. This is in 683
reasonable agreement with the results reported in literature [45], except for the fact, that 684
the VGO and residue fraction are more eminent in the literature results, while the gasoline 685
mass fraction is smaller. As already described, the upgraded biocrude from wheat straw 686
shows a smooth and steady boiling point distribution. This is also reflected by the distri- 687
bution of fuel fractions, except for the heavy fuel oil range, which is quite high. The 688
amount of gasoline (17.8 wt%) is comparable to that of sewage sludge. The amounts of the 689
jet fuel and diesel fractions are 16.4 wt% and 24.7 wt, respectively. This is considerably 690
less than for Spirulina and sewage sludge. The VGO fraction is significantly higher than 691
for the other two feedstock, and the residue fraction almost adds up to one third of the 692
obtained fuel mixture (31.7 wt%). Comparing these results to fractions of an upgraded 693
biocrude obtained from miscanthus, the jet fuel, light diesel, heavy diesel and vacuum gas 694
oil fraction fit quite well. The amount of gasoline fraction in literature is significantly 695
greater, while the residue fraction is significantly smaller [45]. Further comparison to lit- 696
erature results is somewhat complicated, due to the different definitions of fractional cuts. 697
Biller et al. reported 24 wt% for a gasoline fraction, 54 wt% for a diesel fraction ranging 698
Processes 2021, 9, x FOR PEER REVIEW 27 of 33
from 190 °C to 340 °C, 17 wt% for a large vacuum gas oil fraction (340 °C – 538 °C) and 699
5 wt% for a residue fraction of an upgraded biocrude obtained from microalgae [27]. Es- 700
timating these values and comparing them to the herein reported results, a reasonable 701
match can be stated. Haghighat et al. investigated the HT of a biocrude obtained from 702
lignocellulosic biomass and obtained a gasoline fraction of 12 wt%, a diesel fraction 703
(180 °C to 343 °C) of 52 wt%, a vacuum gas oil fraction (343 °C to 550 °C) of 31 wt% and a 704
residue fraction of 5 wt% [43]. Compared to the herein reported values, the diesel fraction 705
is significantly higher, while the residue fraction is considerably lower. Snowden-Swan et 706
al. investigated HTL and HT of two sludge samples, yielding 20.4 wt% to 24.7 wt% of 707
gasoline, 64.5 to 66.8 wt% diesel (184°C – 390 °C) and 8.5 wt% to 15.1 wt% heavies [3]. Also 708
in this case a comparison indicates a reasonable match of the herein reported results and 709
literature results. It should be mentioned that the distribution of fraction cuts is highly 710
sensitive towards reaction conditions of HTL as well as HT and therefore no exact match 711
should be expected from such comparisons. 712
713
Table 7. Distribution of the upgraded biocrude on the different fuel fractions gasoline, jet fuel, diesel and heavy fuel oil. 714
Boiling range 27.8 - 193 °C 193 - 271 °C 271 – 321 °C 321 – 425 °C 425 – 564 °C > 564 °C
Feedstock Gasoline
[wt%]
Jet fuel [wt%] Light diesel
[wt%]
Heavy
diesel [wt%]
Vacuum gas
oil [wt%]
Residue
[wt%]
Spirulina 35.1 20.0 25.8 12.9 4.6 1.6
Sewage sludge 20.5 23.9 31.5 16.9 2.9 4.3
Wheat straw 17.8 16.4 10.7 14.0 9.4 31.7
715
3.5.5. HT characteristics 716
Some of the important HT characteristics, such as de-oxygenation and de-nitrogena- 717
tion rates, as well as hydrogen consumption are shown in Figure 18. Comparing the 718
amount of heteroatoms present in the biocrudes with the hydrogen consumption a direct 719
correlation can be observed [46]. However, higher hydrogen consumption can also be re- 720
lated to a higher degree of hydrogenation, which is also reflected in an increased H:C 721
ratio. Since de-oxygenation and de-nitrogenation rates of wheat straw are in the same 722
range as for Spirulina and sewage sludge and the amount of heteroatoms is even higher, 723
the lower hydrogen consumption can be explained by the lack of hydrogenation reactions. 724
This is also supported by the low H:C ratio observed for the upgraded biocrude of wheat 725
straw. Absolute values of hydrogen consumption for Spirulina and sewage sludge are 726
generally higher than literature results [43,46,50,51], except for one study by PNNL [3], in 727
which a hydrogen consumption of 58 g/kg is reported. The high hydrogen consumption 728
for Spirulina and sewage sludge in this study can be explained by the quite high de-oxy- 729
genation (> 99 %) and de-nitrogenation (≥ 80 %) rates as well as significant hydrogenation 730
reactions assumed in the model. 731

Processes 2021, 9, x FOR PEER REVIEW 28 of 33
732
Figure 18. De-oxygenation and de-nitrogen rates, as well as hydrogen consumption for Spirulina 733
(left), sewage sludge (middle) and wheat straw (right). 734
4. Conclusions 735
A comprehensive model of an HTL process chain consisting of HTL, cHTG and HT 736
has been validated with experimental results from the HyFlexFuel project. Establishing 737
an extensive reaction network in Aspen Plus ® based on proposed reactions from 738
literature for the HTL process step and also modelling the cHTG and HT reactors with 739
large quantities of reactions has proven to be a successful modeling approach. Key process 740
parameters, such as yield of biocrude and upgraded biocrude, TOC values of the AP, 741
methane yields, hydrogen consumption, and fuel fraction yields, which are important 742
quantities for subsequent system analyses like LCA and TEA, can be reproduced 743
confidently and are in good agreement with literature results. Therefore, it is proposed 744
that the model can be used confidently as a basis for these subsequent system analyses. 745
Furthermore, more detailed chemical analyses, such as elemental analysis, boiling point 746
distribution and simulated molar mass distribution, comparable to a GC-MS analysis, give 747
deeper insights into the chemical compositions of modeled biocrudes and upgraded 748
biocrudes. Results for Spirulina and sewage sludge show reasonable results with minor 749
differences compared to literature findings. The wheat straw model shows a lack of 750
variety in the modeling of high boiling components, which results in major differences 751
(EA, chemical composition) compared to literature results. It is proposed that results for 752
feedstock with similar compositions to Spirulina and sewage sludge can be deduced with 753
the herein described model. In order to guarantee reliable results for feedstock with a 754
domination of one biochemical component (e.g. wheat straw, carbohydrates > 80 wt%), 755
the model has to be further improved. For future studies it is proposed that a biorude 756
yield prediction model could be established based on the established reaction network 757
such that biocrude yields can be predicted by the modeling. In combination with the 758
profound chemical analysis of biocrudes and upgraded biocrudes this could be a 759
powerful tool for the understanding of HTL reaction networks and in-depth analyses of 760
HTL fuel conversion pathways. 761
762
763
Processes 2021, 9, x FOR PEER REVIEW 29 of 33
Funding: This project has received funding from the European Union‘s Horizon 2020 research and 764
innovation programme under grant agreement No 764734. 765
766
Data Availability Statement: 767
All additional data is available as supporting information. 768
769
Acknowledgments: 770
The authors would like to thank associate professor Patrick Biller and assistant professor Daniele 771
Castello for kindly providing experimental results. We also thank the HyFlexFuel consortium for 772
making this work possible. 773
774
Conflicts of Interest: 775
The authors declare no conflict of interest. 776
777
References 778
1. A European Green Deal; How China could be carbon neutral by mid-century; The Biden Plan For A Clean En- 779
ergy Revolution and environmental justice. Available online: https://ec.europa.eu/info/strategy/priorities-2019- 780
2024/european-green-deal_en; https://www.nature.com/articles/d41586-020-02927-9; https://joebiden.com/cli- 781
mate-plan/ (accessed on 26 May 2021). 782
2. Jong, S. de; Hoefnagels, R.; Faaij, A.; Slade, R.; Mawhood, R.; Junginger, M. The feasibility of short-term produc- 783
tion strategies for renewable jet fuels - a comprehensive techno-economic comparison. Biofuels, Bioprod. Bioref. 784
2015, 9, 778–800, doi:10.1002/bbb.1613. 785
3. Snowden-Swan, L.; Billing, J.M.; Thorson, M.; Schmidt A.; Santosa M.; Jones, S.B.; Hallen, R.T. Wet Waste Hydro- 786
thermal Liquefction and Biocrude Upgrading to Hydrocarbon Fuels: 2019 State of Technology, Richland, Washington, 787
2020. 788
4. Jones, S.B.; Zhu, Y.; Anderson D.; Hallen, R.T.; Elliott, D.C.; Schmidt, A.J.; Albrecht, K.O.; Hart, T.R.; Butcher M.; 789
Drennan C.; et al. Process Design and Economics for the Conversion of Alga Biomass to Hydrocarbons: Whole Alge Hy- 790
drothermal Liquefaction and Upgrading, Richland, Washington, Atlanta, Georgia, 2014. 791
5. Teri, G.; Luo, L.; Savage, P.E. Hydrothermal Treatment of Protein, Polysaccharide, and Lipids Alone and in Mix- 792
tures. Energy Fuels 2014, 28, 7501–7509, doi:10.1021/ef501760d. 793
6. Déniel, M.; Haarlemmer, G.; Roubaud, A.; Weiss-Hortala, E.; Fages, J. Energy valorisation of food processing res- 794
idues and model compounds by hydrothermal liquefaction. Renewable and Sustainable Energy Reviews 2016, 54, 795
1632–1652, doi:10.1016/j.rser.2015.10.017. 796
7. Demirbas A. Mechanisms of liquefaction and pyrolysis reactions of biomass. Energy Conversion and Management 797
2000, 41, 633–646. 798

Processes 2021, 9, x FOR PEER REVIEW 30 of 33
8. Leow, S.; Witter, J.R.; Vardon, D.R.; Sharma, B.K.; Guest, J.S.; Strathmann, T.J. Prediction of microalgae hydro- 799
thermal liquefaction products from feedstock biochemical composition. Green Chem. 2015, 17, 3584–3599, 800
doi:10.1039/C5GC00574D. 801
9. Li, Y.; Leow, S.; Fedders, A.C.; Sharma, B.K.; Guest, J.S.; Strathmann, T.J. Quantitative multiphase model for hy- 802
drothermal liquefaction of algal biomass. Green Chem. 2017, 19, 1163–1174, doi:10.1039/C6GC03294J. 803
10. Hoffmann, J.; Rudra, S.; Toor, S.S.; Holm-Nielsen, J.B.; Rosendahl, L.A. Conceptual design of an integrated hy- 804
drothermal liquefaction and biogas plant for sustainable bioenergy production. Bioresour. Technol. 2013, 129, 402– 805
410, doi:10.1016/j.biortech.2012.11.051. 806
11. Snowden-Swan, L.; Zhu, Y.; Bearden M. D.; Seiple T. E.; Jones, S.B.; Schmidt, A.J.; Billing, J.M.; Hallen, R.T.; Hart, 807
T.R.; Liu J.; et al. Conceptual Biorefinery Design and Research Targeted for 2022: Hydrothermal Liquefaction Processing of 808
Wet Waste to Fuel, Richland, Washington, 2017. 809
12. Knorr D.; Lukas J.; Schoen P. Production of Advanced Biofuels via Liquefaction Hydrothermal Liquefaction Reactor De- 810
sign: April 5, 2013, Atlanta, Georgia, 2013. 811
13. Matayeva, A.; Bianchi, D.; Chiaberge, S.; Cavani, F.; Basile, F. Elucidation of reaction pathways of nitrogenous 812
species by hydrothermal liquefaction process of model compounds. Fuel 2019, 240, 169–178, 813
doi:10.1016/j.fuel.2018.11.136. 814
14. Gai, C.; Zhang, Y.; Chen, W.-T.; Zhang, P.; Dong, Y. An investigation of reaction pathways of hydrothermal liq- 815
uefaction using Chlorella pyrenoidosa and Spirulina platensis. Energy Conversion and Management 2015, 96, 330– 816
339. 817
15. Yang, J.; He, Q.; Niu, H.; Corscadden, K.; Astatkie, T. Hydrothermal liquefaction of biomass model components 818
for product yield prediction and reaction pathways exploration. Applied Energy 2018, 228, 1618–1628, 819
doi:10.1016/j.apenergy.2018.06.142. 820
16. Peterson, A.A.; Vogel, F.; Lachance, R.P.; Fröling, M.; Antal, J.M.J.; Tester, J.W. Thermochemical biofuel produc- 821
tion in hydrothermal media: A review of sub- and supercritical water technologies. Energy Environ. Sci. 2008, 1, 822
32, doi:10.1039/b810100k. 823
17. Görsch, K.; Schwarzbach, K. Public Report - Final report on feedstock analysis and characteristics. Horizon 2020: 824
HyFlexFuel project, 2020. 825
18. Hydrolysis of Cellulose and Hemicellulose; Wyman C. E.; Decker S. R.; Himmel M. E.; Brady J. W.; Skopec C. E.; 826
Viikari L., Eds., 2005. 827
19. Gellerstedt, G.; Henriksson G. Lignins: Major Sources, Structure and Properties. In Monomers, Polymers and Com- 828
posites from renewable resources; Belgacem M. N., Gandini A., Eds.; Elsevier Ltd.: Oxford, 2008; pp 201–224, ISBN 829
978-0-08-045316-3. 830

Processes 2021, 9, x FOR PEER REVIEW 31 of 33
20. Pettersen R. C. The Chemical Composition of Wood. In The Chemistry of Solid Wood; Rowell, R., Ed.; American 831
Chemical Society: Seattle, USA, 1984; pp 57–126, ISBN 9780841207967. 832
21. Checalc. Chemical Engineering Calculations. Available online: https://checalc.com/solved/property_joback.html 833
(accessed on 21 May 2021). 834
22. Haider, M.; Castello, D.; Michalski, K.; Pedersen, T.; Rosendahl, L. Catalytic Hydrotreatment of Microalgae Bi- 835
ocrude from Continuous Hydrothermal Liquefaction: Heteroatom Removal and Their Distribution in Distillation 836
Cuts. Energies 2018, 11, 3360, doi:10.3390/en11123360. 837
23. Déniel, M.; Haarlemmer, G.; Roubaud, A.; Weiss-Hortala, E.; Fages, J. Modelling and Predictive Study of Hydro- 838
thermal Liquefaction: Application to Food Processing Residues. Waste Biomass Valor 2017, 8, 2087–2107, 839
doi:10.1007/s12649-016-9726-7. 840
24. Wang Z. Reaction Mechanisms of hydrothermal liquefaction of model compounds and biowaste feedstocks. Dis- 841
sertation; University of Illinois, Urbana, 2011. 842
25. Kumar S. Hydrothermal Treatment for biofuels: Lignocellulosic biomass to bioethanol, biocrude, and biochar. 843
Dissertation; Auburn University, Auburn, 2010. 844
26. Déniel, M.; Haarlemmer, G.; Roubaud, A.; Weiss-Hortala, E.; Fages, J. Hydrothermal liquefaction of blackcurrant 845
pomace and model molecules: understanding of reaction mechanisms. Sustainable Energy Fuels 2017, 1, 555–582, 846
doi:10.1039/C6SE00065G. 847
27. Biller, P.; Sharma, B.K.; Kunwar, B.; Ross, A.B. Hydroprocessing of bio-crude from continuous hydrothermal liq- 848
uefaction of microalgae. Fuel 2015, 159, 197–205, doi:10.1016/j.fuel.2015.06.077. 849
28. Han, Y.; Hoekman, K.; Jena, U.; Das, P. Use of Co-Solvents in Hydrothermal Liquefaction (HTL) of Microalgae. 850
Energies 2020, 13, 124, doi:10.3390/en13010124. 851
29. Han, Y.; Hoekman, S.K.; Cui, Z.; Jena, U.; Das, P. Hydrothermal liquefaction of marine microalgae biomass using 852
co-solvents. Algal Research 2019, 38, 101421, doi:10.1016/j.algal.2019.101421. 853
30. Cheng, F.; Jarvis, J.M.; Yu, J.; Jena, U.; Nirmalakhandan N.; Schaub, T.M.; Brewer, E.C. Bio-crude oil from hydro- 854
thermal liquefaction of wastewater microalgae in a pilot-scale continuous flow reactor. Bioresour. Technol. 2019, 855
294, 122184. 856
31. Thomsen, L.; Carvalho, P.N.; Dos Passos, J.S.; Anastasakis, K.; Bester, K.; Biller, P. Hydrothermal liquefaction of 857
sewage sludge; energy considerations and fate of micropollutants during pilot scale processing. Water Research 858
2020, 183, 116101. 859
Processes 2021, 9, x FOR PEER REVIEW 32 of 33
32. Pedersen, T.H.; Grigoras, I.F.; Hoffmann, J.; Toor, S.S.; Daraban, I.M.; Jensen, C.U.; Iversen, S.B.; Madsen, R.B.; 860
Glasius, M.; Arturi, K.R.; et al. Continuous hydrothermal co-liquefaction of aspen wood and glycerol with water 861
phase recirculation. Applied Energy 2016, 162, 1034–1041, doi:10.1016/j.apenergy.2015.10.165. 862
33. Sintamarean, I.M.; Grigoras, I.F.; Jensen, C.U.; Toor, S.S.; Pedersen, T.H.; Rosendahl, L.A. Two-stage alkaline hy- 863
drothermal liquefaction of wood to biocrude in a continuous bench-scale system. Biomass Conv. Bioref. 2017, 7, 864
425–435, doi:10.1007/s13399-017-0247-9. 865
34. Seehar, T.H.; Toor, S.S.; Shah, A.A.; Pedersen, T.H.; Rosendahl, L.A. Biocrude Production from Wheat Straw at 866
Sub and Supercritical Hydrothermal Liquefaction. Energies 2020, 13, 3114, doi:10.3390/en13123114. 867
35. Watson, J.; Wang, T.; Si, B.; Chen, W.-T.; Aierzhati, A.; Zhang, Y. Valorization of hydrothermal liquefaction aque- 868
ous phase: pathways towards commercial viability. Progress in Energy and Combustion Science 2020, 77, 100819, 869
doi:10.1016/j.pecs.2019.100819. 870
36. Madsen, R.B.; Bernberg, R.Z.K.; Biller, P.; Becker, J.; Iversen, B.B.; Glasius, M. Hydrothermal co-liquefaction of 871
biomasses – quantitative analysis of bio-crude and aqueous phase composition. Sustainable Energy Fuels 2017, 1, 872
789–805, doi:10.1039/C7SE00104E. 873
37. Shah, A.A.; Toor, S.S.; Seehar, T.H.; Nielsen, R.S.; H. Nielsen, A.; Pedersen, T.H.; Rosendahl, L.A. Bio-Crude Pro- 874
duction through Aqueous Phase Recycling of Hydrothermal Liquefaction of Sewage Sludge. Energies 2020, 13, 875
493, doi:10.3390/en13020493. 876
38. Stucki, S.; Vogel, F.; Ludwig, C.; Haiduc, A.G.; Brandenberger, M. Catalytic gasification of algae in supercritical 877
water for biofuel production and carbon capture. Energy Environ. Sci. 2009, 2, 535, doi:10.1039/b819874h. 878
39. Horizon 2020 HyFlexFuel project. Available online: https://cordis.europa.eu/project/id/764734. 879
40. Castello, D.; Haider, M.S.; Rosendahl, L.A. Succesful Production and Testing of On-Specification Aviation Bio- 880
fuel from Hydrothermal Liquefaction and Catalytic Hydrotreating. virtual, 27th April 2021. 881
41. Pedersen, T.H.; Jensen, C.U.; Sandström, L.; Rosendahl, L.A. Full characterization of compounds obtained from 882
fractional distillation and upgrading of a HTL biocrude. Applied Energy 2017, 202, 408–419, doi:10.1016/j.apen- 883
ergy.2017.05.167. 884
42. Jensen C. U.; Hoffmann, J.; Rosendahl L. A. Co-processing Potential of HTL Bio-crude at Petroleum Refineries: 885
Part 2: A Parametric Hydrotreating Study. Fuel 2016, 165, 536–543. 886
43. Haghighat, P.; Montanez, A.; Aguilera, G.R.; Rodriguez Guerrero, J.K.; Karatzos, S.; Clarke, M.A.; McCaffrey, W. 887
Hydrotreating of Hydrofaction™ biocrude in the presence of presulfided commercial catalysts. Sustainable En- 888
ergy Fuels 2019, 3, 744–759, doi:10.1039/C8SE00439K. 889

Processes 2021, 9, x FOR PEER REVIEW 33 of 33
44. Jarvis, J.M.; Albrecht, K.O.; Billing, J.M.; Schmidt, A.J.; Hallen, R.T.; Schaub, T.M. Assessment of Hydrotreatment 890
for Hydrothermal Liquefaction Biocrudes from Sewage Sludge, Microalgae, and Pine Feedstocks. Energy Fuels 891
2018, 32, 8483–8493, doi:10.1021/acs.energyfuels.8b01445. 892
45. Castello, D.; Haider, M.S.; Rosendahl, L.A. Catalytic upgrading of hydrothermal liquefaction biocrudes: Different 893
challenges for different feedstocks. Renewable Energy 2019, 141, 420–430, doi:10.1016/j.renene.2019.04.003. 894
46. Haider, M.S.; Castello, D.; Rosendahl, L.A. Two-stage catalytic hydrotreatment of highly nitrogenous biocrude 895
from continuous hydrothermal liquefaction: A rational design of the stabilization stage. Biomass and Bioenergy 896
2020, 139, 105658, doi:10.1016/j.biombioe.2020.105658. 897
47. Pires A. P. P.; Han Y.; Kramlich J.; Garcia-Perez, M. Chemical Composition and Fuel Properties of Alternative Jet 898
Fuels. Bioresources 2018, 13, 2632–2657. 899
48. Milne T.; Brennan A. H.; Glenn B. H. Sourcebook of methods of analysis for biomass and biomass conversion processes, 900
1st ed.; Springer Netherlands, 1990, ISBN 978-1-85166-527-3. 901
49. Hossain, F.; Kosinkova, J.; Brown, R.; Ristovski, Z.; Hankamer, B.; Stephens, E.; Rainey, T. Experimental Investi- 902
gations of Physical and Chemical Properties for Microalgae HTL Bio-Crude Using a Large Batch Reactor. Energies 903
2017, 10, 467, doi:10.3390/en10040467. 904
50. Albrecht, K.O.; Zhu, Y.; Schmidt, A.J.; Billing, J.M.; Hart, T.R.; Jones, S.B.; Maupin G.; Hallen, R.T.; Ahrens T.; 905
Anderson D. Impact of Heterotrophically Stressed Algae for Biofuel Production via Hydrothermal Liquefaction 906
and Catalytic Hydrotreatin in Continuous-Flow Reactors. Algal Research 2016, 2016, 17–27. 907
51. Marrone, P.A.; Elliott, D.C.; Billing, J.M.; Hallen, R.T.; Hart, T.R.; Kadota, P.; Moeller, J.C.; Randel, M.A.; Schmidt, 908
A.J. Bench-Scale Evaluation of Hydrothermal Processing Technology for Conversion of Wastewater Solids to 909
Fuels. Water Environ. Res. 2018, 90, 329–342, doi:10.2175/106143017X15131012152861. 910
911