an holistic approach to the equipment business reporting
TRANSCRIPT

An holistic approach to the equipmentbusiness reporting in a telecommunications
company
Sérgio Vasconcelos Castro
Master’s Dissertation
Supervisor at FEUP: Prof. José Luís Cabral Moura BorgesSupervisor at NOS: João Filipe Gomes
Master in Engineering and Industrial Management
2020-06-29


Abstract
This project was developed in the Customer Relationship Management department of NOS, atelecom provider, with the main objective of reporting the park and park movements of fixedequipment to the Product department, that was in need of such information to help its decision-makers in managing inventory, adjusting offerings and tracking launches and discontinuations ofequipment.
To this end, a dashboard was developed in Power BI, containing information about the Boxand Router equipment, combining in a single dashboard numerous visuals, such as Bar Charts andMaps, and numerous filters that allow the users to navigate information according to, for example,service characteristics or Box and Router specific features. The metrics displayed in the visualswere not only about the park and its movements, but also pertaining the revenue that some of thatequipment brought to the organization.
The project stakeholders expressed an overall positive feedback regarding the final dashboard.It was mentioned that the dashboard fulfilled the requirements and enabled the company to go froma state of low data availability regarding equipment management to a state of weekly reporting ofrelevant metrics that assisted the business management. Improvements in the revenue informationwas the most called upgrade for future revisions of the dashboard.
To complement the dashboard, as a proof-of-concept, a forecasting tool was developed in Ex-cel. This tool shows that the dashboard built provided information that allowed for the predictionof near-term equipment activation movements. With a mean absolute percentual error of 29,7% inits predictions, this tool still needs to be improved, by revising the its methodology and studyingalternative forecasting methods.
i

Resumo
Este projeto foi desenvolvido no departamento de Customer Relationship Management da NOS,uma operadora de telecomunicações, com o objetivo principal de reportar a quantidade de equipa-mentos fixos em parque e os respetivos movimentos ao departamento de Produto, que necessitavadesta informação para assistir os seus decisiores a gerir inventários, ajustar a oferta e dar segui-mento ao lançamento de novos produtos e descontinuação de antigos equipmentos.
Para este fim, foi desenvolvido em Power BI um dashboard contendo inforamção respeitantea Box e Router, combinando num único dashboard vários elementos visuais, como Gráficos deBarras e Mapas, e filtros que permitem aos utilizadores navegar pela informação de acordo comcaratéricas do serviço ou caraterísticas específicas para Box ou Router, a título de exemplo. Asmétricas exibidas pelos elementos visuais refletem não só o parque e os seus movimentos, comotambém informação da receita gerada pelos equipmentos.
Os intervenientes do projecto expressaram uma opinião globalmente positiva acerca do dash-board desenvolvido, mencionando que o mesmo cumpria as suas especificações e, por sua vez,permitia à empresa partir de um ponto de baixa disponibilidade de dados para a gestão de equi-pamentos para um estado de reporting semanal de métricas que assitiam a gestão do negócio.Melhoramentos na informação de receita foram o aperfeiçoamento mais requerido para futurasrevisões do dashboard.
Para complementar o dashboard, foi desenvolvida uma ferramenta de forecasting em Excel,como prova de conceito. Esta ferramenta mostrou que o dashboard construído tem informação quepermite a previsão no curto-prazo de ativações de equipamentos. Com um erro absoluto percen-tual médio de 29,7% nas suas previsões, esta ferramenta ainda precisa de vários melhoramentos,nomeadamente a revisão da sua metedologia e o estudo da aplicação de métodos de previsão al-ternativos.
ii

Acknowledgements
Firstly, to both my supervisors, Prof. José Luís Borges from FEUP and João Filipe Gomes fromNOS, for the mentorship during the project.
Secondly, to NOS in general, and specifically to everyone in the team I worked in, for theopportunity presented in this project and the friendship in the workplace. Also, a particular thankyou to both André and Jorge for the time made available for their interviews, as they were mymain source of feedback for this dissertation.
Thirdly, to my friends from University, from my home town and from Erasmus, for all thesupport demonstrated and always being there for me.
Lastly, to my family, specially my father and my sister, for everything.
iii

iv

To my mother
v

vi

Contents
1 Introduction 11.1 NOS and Telecommunications Market . . . . . . . . . . . . . . . . . . . . . . . 21.2 Project Challenge, Stakeholders and Scope . . . . . . . . . . . . . . . . . . . . . 21.3 Project Methodology . . . . . . . . . . . . . . . . . . . . . . . . . . . . . . . . 31.4 Dissertation Structure . . . . . . . . . . . . . . . . . . . . . . . . . . . . . . . . 4
2 Literature Review 52.1 Business Intelligence . . . . . . . . . . . . . . . . . . . . . . . . . . . . . . . . 5
2.1.1 Business Intelligence in the Telecom Industry . . . . . . . . . . . . . . . 62.1.2 Data Visualization in Business Intelligence . . . . . . . . . . . . . . . . 72.1.3 Dashboards and Business Reporting . . . . . . . . . . . . . . . . . . . . 8
2.2 Predictive Analytics and Forecasting Methods . . . . . . . . . . . . . . . . . . . 102.2.1 Exponential Smoothing Methods . . . . . . . . . . . . . . . . . . . . . . 11
3 Project Description 123.1 Concepts . . . . . . . . . . . . . . . . . . . . . . . . . . . . . . . . . . . . . . 12
3.1.1 Fixed Equipment . . . . . . . . . . . . . . . . . . . . . . . . . . . . . . 123.1.2 Services and Customers . . . . . . . . . . . . . . . . . . . . . . . . . . 163.1.3 Equipment Stock Management . . . . . . . . . . . . . . . . . . . . . . . 173.1.4 Revenues . . . . . . . . . . . . . . . . . . . . . . . . . . . . . . . . . . 18
3.2 Goals and Requirements . . . . . . . . . . . . . . . . . . . . . . . . . . . . . . 18
4 Methodology and Project Execution 204.1 Step 1 - Business Understanding . . . . . . . . . . . . . . . . . . . . . . . . . . 204.2 Step 2 - Reporting Requirements . . . . . . . . . . . . . . . . . . . . . . . . . . 214.3 Step 3 - Data Collection and Treatment . . . . . . . . . . . . . . . . . . . . . . . 254.4 Step 4 - Dashboard construction . . . . . . . . . . . . . . . . . . . . . . . . . . 284.5 Step 5 - User Validation and Fine Tuning . . . . . . . . . . . . . . . . . . . . . . 29
4.5.1 Version 0.1 . . . . . . . . . . . . . . . . . . . . . . . . . . . . . . . . . 304.5.2 Version 0.2, 0.3 and 0.4 . . . . . . . . . . . . . . . . . . . . . . . . . . . 314.5.3 Version 0.5 and 1.0 . . . . . . . . . . . . . . . . . . . . . . . . . . . . . 314.5.4 Version 1.1 and 1.2 . . . . . . . . . . . . . . . . . . . . . . . . . . . . . 32
4.6 Step 6 - Predictive Analysis . . . . . . . . . . . . . . . . . . . . . . . . . . . . . 324.7 Step 7 - Project Conclusion . . . . . . . . . . . . . . . . . . . . . . . . . . . . . 34
5 Results 365.1 "Equipment Universe" Dashboard - Final Version . . . . . . . . . . . . . . . . . 36
5.1.1 Organization . . . . . . . . . . . . . . . . . . . . . . . . . . . . . . . . 365.1.2 Visuals . . . . . . . . . . . . . . . . . . . . . . . . . . . . . . . . . . . 42
vii

viii CONTENTS
5.1.3 Filters . . . . . . . . . . . . . . . . . . . . . . . . . . . . . . . . . . . . 475.2 "Equipment Universe" Dashboard - Stakeholders opinion and utilization statistics 495.3 Forecasting tool . . . . . . . . . . . . . . . . . . . . . . . . . . . . . . . . . . . 52
6 Conclusions and Future Work 54
A Aggregation levels for Router Equipment 59
B Dashboard pages 60
C Dashboard fields translation and explanation 69
D Interviews 71D.1 CRM-RAN team representative . . . . . . . . . . . . . . . . . . . . . . . . . . . 71D.2 Product team representative . . . . . . . . . . . . . . . . . . . . . . . . . . . . . 74
E Forecasting Tool Results 78

Acronyms and Symbols
ARPU Average Revenue Per UserB2C Business-to-ConsumerBI Business IntelligenceBPM Business Process ManagementCA Customer AccountCPU Central Processing UnitCRM Customer Relationship ManagementDTH Direct To HomeERP Enterprise Resource PlanningETL Extract, Transform and LoadFTTH Fiber To The HomeHFC Hybrid Fiber CoaxKPI Key Performance IndicatorMAE Mean Absolute ErrorMAPE Mean Percentual ErrorME Mean ErrorNBO Next-Best-OfferOLAP Online Analytical ProcessingPVP Price Value PointRAM Random Access MemoryRAN Reporting and Business AnalysisSA Service AccountSOA Service-Oriented ArchitectureSSBI Self-Service Business Intelligence
ix

x Acronyms and Symbols

List of Figures
1.1 Step-by-step methodology . . . . . . . . . . . . . . . . . . . . . . . . . . . . . 4
2.1 Traditional BI Process . . . . . . . . . . . . . . . . . . . . . . . . . . . . . . . 7
3.1 From left to right - UMA Box and respective remote controller, GiGA Router andNOS Extender . . . . . . . . . . . . . . . . . . . . . . . . . . . . . . . . . . . . 13
3.2 Comparison between Area and Technology . . . . . . . . . . . . . . . . . . . . 14
4.1 Aggregation levels for Box Equipment . . . . . . . . . . . . . . . . . . . . . . . 254.2 Transformation of original data . . . . . . . . . . . . . . . . . . . . . . . . . . . 274.3 Version 0.1 - All equipment page . . . . . . . . . . . . . . . . . . . . . . . . . . 304.4 Visual representation of the forecasting methodology . . . . . . . . . . . . . . . 33
5.1 Dashboard Banners . . . . . . . . . . . . . . . . . . . . . . . . . . . . . . . . . 385.2 Layout of pages 1.a, 1.b and 1.c . . . . . . . . . . . . . . . . . . . . . . . . . . 385.3 Layout of pages 1.d and 2.f . . . . . . . . . . . . . . . . . . . . . . . . . . . . . 395.4 Layout of pages 2.a, 3.a, 4.a and 4.b . . . . . . . . . . . . . . . . . . . . . . . . 395.5 Layout of pages 2.b and 3.b . . . . . . . . . . . . . . . . . . . . . . . . . . . . . 405.6 Layout of pages 2.c, 2.d, 3.c and 3.d . . . . . . . . . . . . . . . . . . . . . . . . 405.7 Layout of page 2.e . . . . . . . . . . . . . . . . . . . . . . . . . . . . . . . . . 415.8 Visuals on page 1.a . . . . . . . . . . . . . . . . . . . . . . . . . . . . . . . . . 435.9 Visual on page 2.b . . . . . . . . . . . . . . . . . . . . . . . . . . . . . . . . . . 445.10 Visual on page 1.d . . . . . . . . . . . . . . . . . . . . . . . . . . . . . . . . . . 455.11 Visual on page 3.c . . . . . . . . . . . . . . . . . . . . . . . . . . . . . . . . . . 465.12 Alternative Visual for page 3.c - Line Chart . . . . . . . . . . . . . . . . . . . . 465.13 Power BI Report Usage Metrics . . . . . . . . . . . . . . . . . . . . . . . . . . 525.14 Predictions framework . . . . . . . . . . . . . . . . . . . . . . . . . . . . . . . 535.15 Predictions vs actual activation for Box Ultra HD V2 . . . . . . . . . . . . . . . 53
A.1 Aggregation levels for Router Equipment . . . . . . . . . . . . . . . . . . . . . 59
B.1 Page 1.a . . . . . . . . . . . . . . . . . . . . . . . . . . . . . . . . . . . . . . . 60B.2 Page 1.b . . . . . . . . . . . . . . . . . . . . . . . . . . . . . . . . . . . . . . . 61B.3 Page 1.c . . . . . . . . . . . . . . . . . . . . . . . . . . . . . . . . . . . . . . . 61B.4 Page 1.d . . . . . . . . . . . . . . . . . . . . . . . . . . . . . . . . . . . . . . . 62B.5 Page 2.a . . . . . . . . . . . . . . . . . . . . . . . . . . . . . . . . . . . . . . . 62B.6 Page 2.b . . . . . . . . . . . . . . . . . . . . . . . . . . . . . . . . . . . . . . . 63B.7 Page 2.c . . . . . . . . . . . . . . . . . . . . . . . . . . . . . . . . . . . . . . . 63B.8 Page 2.d . . . . . . . . . . . . . . . . . . . . . . . . . . . . . . . . . . . . . . . 64
xi

xii LIST OF FIGURES
B.9 Page 2.e . . . . . . . . . . . . . . . . . . . . . . . . . . . . . . . . . . . . . . . 64B.10 Page 2.f . . . . . . . . . . . . . . . . . . . . . . . . . . . . . . . . . . . . . . . 65B.11 Page 3.a . . . . . . . . . . . . . . . . . . . . . . . . . . . . . . . . . . . . . . . 65B.12 Page 3.b . . . . . . . . . . . . . . . . . . . . . . . . . . . . . . . . . . . . . . . 66B.13 Page 3.c . . . . . . . . . . . . . . . . . . . . . . . . . . . . . . . . . . . . . . . 66B.14 Page 3.d . . . . . . . . . . . . . . . . . . . . . . . . . . . . . . . . . . . . . . . 67B.15 Page 4.a . . . . . . . . . . . . . . . . . . . . . . . . . . . . . . . . . . . . . . . 67B.16 Page 4.b . . . . . . . . . . . . . . . . . . . . . . . . . . . . . . . . . . . . . . . 68
E.1 Actual Activation vs Predictions: BOX 1.0 HD (SAT), BOX 1.0 HD+DVR (CABO),BOX 1.0 HD+DVR (SAT), BOX 1.0 HD+DVR (SAT/TDT), BOX 2.0 HD (CABO)and BOX 2.0 HD+DVR (CABO) . . . . . . . . . . . . . . . . . . . . . . . . . 80
E.2 Actual Activation vs Predictions: Box 3.0 Ultra HD, Box 3.0 Ultra HD v2, DTA,HUB, HUB 3.0, HUB FTTH . . . . . . . . . . . . . . . . . . . . . . . . . . . . 81
E.3 Actual Activation vs Predictions: Modem Multimédia, Powerbox Cabo, Router4.0, Router 4.0 FTTH, Router 4G Pro, Router 5.0, Router 5.0 FTTH . . . . . . . 82
E.4 Actual Activation vs Predictions: Router 5.0v2 . . . . . . . . . . . . . . . . . . . 83

List of Tables
1.1 Telecom Industry Market Share in 2019 - by Revenue, ANACOM (2020) . . . . 2
3.1 Router Generations . . . . . . . . . . . . . . . . . . . . . . . . . . . . . . . . . 143.2 Box Generations . . . . . . . . . . . . . . . . . . . . . . . . . . . . . . . . . . 153.3 Requirements . . . . . . . . . . . . . . . . . . . . . . . . . . . . . . . . . . . . 19
4.1 Dashboard versions . . . . . . . . . . . . . . . . . . . . . . . . . . . . . . . . . 29
5.1 Filters . . . . . . . . . . . . . . . . . . . . . . . . . . . . . . . . . . . . . . . . 47
C.1 Dashboard fields translation and explanation . . . . . . . . . . . . . . . . . . . . 70
E.1 Error analysis . . . . . . . . . . . . . . . . . . . . . . . . . . . . . . . . . . . . 79
xiii

xiv LIST OF TABLES

Chapter 1
Introduction
As the amount of data available to organizations increases, so does the need to use it to gain
competitive advantages. The telecommunications (telecom) industry in Portugal is very competi-
tive as established market players are constantly under "price wars", using promotions and other
marketing efforts to gain market share. Being a competitive market, the organizations operating
in this industry require more and more ways of having not only a larger amount but also better
information to make the correct decisions.
Thus, it is essential that telecom competitors have a clearly defined Business Intelligence (BI)
strategy. To this end, it is of utmost importance to understand how to use customer data to decide
service prices, identify and act on the next best service offer to a new (acquisition strategy) or an
existing (retention strategy) client, as well as judge what are the best options regarding the physical
means in which to deliver such services.
This project represents the final dissertation for the Master Degree in Industrial Engineering
and Management, in the Faculty of Engineering of the University of Porto. It was developed
in a real-world setting, in cooperation with NOS, a Portuguese telecom provider. NOS recently
realized that there was a need to improve the reporting of customer data in what regards the com-
pany equipment. The equipment, mostly a service enabler (the aforementioned physical mean that
delivers services), has been somewhat ignored up to this point, with relevant business-tracking
metrics only being reported in occasional, specific reports, for specific needs. However, as market
competition increases, a more holistic reporting of the equipment business metrics, one that can
meet the needs of all stakeholders, must be considered.
Market competition in the telecom equipment business is not only evident in the telecom mar-
ket itself, but also from substitute products and services from other expanding markets. For in-
stance, in Portugal, Netflix and soon Disney will have video streaming services that are substitutes
to the telecom television equipment and the services they provide. Looking beyond the compet-
itive environment, to the current state of the company assets, more reasons to improve business
tracking become evident. As announced in the 1Q20 Results report by NOS (NOS SGPS (2020)),
client related Capital Expenditure represented 33,4 million euros of investment in the last quarter,
with Terminal Equipment representing 101,2 million euros of tangible assets. Thus, a good or bad
1

2 Introduction
management of the equipment can have a sizable impact on its Profits and Loss account at the end
of each quarter/year.
Taking all this into account, the motivation behind this project is clear: to improve the re-
porting of the equipment business-related metrics, so as to empower decision making to all its
stakeholders.
1.1 NOS and Telecommunications Market
"NOS SGPS" (from now on referred to as NOS) is an organization that was created in 2014 by
the merger of two high-profile communications companies: ZON and Optimus. NOS is an hold-
ing company that has a 100% participation in 12 businesses, including "NOS Comunicações",
where this project was developed in. It also has major to minor participation in 5 other businesses,
making up for a diverse company portfolio. NOS operates in various markets, namely Telecom-
munications, Audiovisuals, Cinemas and Advertising.
In the telecommunications landscape, NOS is one the biggest players in Portugal, providing
services for both B2B and B2C needs. The telecom market in Portugal is comprised of mainly
4 competitors: NOS, MEO, Vodafone and Nowo. As it can be seen in Table 1.1, as of 2019,
NOS was the leader in Multiple Play (particularly quadruple and quintuple play), while being the
runner-up of the Total Telecom market. MEO, the brand owned by Altice Portugal, a subsidiary of
the international group Altice since 2015, is the overall market leader, as well as being the market
leader in the Fixed sector, Double Play and Triple Play. Vodafone Portugal, a subsidiary of the
British international player Vodafone, is a particularly important player in the Mobile segment
where it currently is the leader. Nowo, resulting from the rebranding of Cabovisão in 2016, is still
a relatively small player.
Table 1.1: Telecom Industry Market Share in 2019 - by Revenue, ANACOM (2020)
Company Total Fixed Mobile Total Multiple Play Double Play Triple Play > Triple Play
NOS 32,9 40,9 18,9 42,2 29,5 33,2 47,8MEO 38,8 41,5 34,3 40,7 40,6 38,3 42
Vodafone 25,7 14,3 45,6 14,2 23,5 24,1 8,4Nowo 1,8 2,5 0,6 2,8 5,7 4,5 1,8Outros 0,7 0,8 0,6 0 0,8 0 0
Competitors outside of the four aforementioned ones are almost non-existent, mainly due to
regulatory and investment barriers of entry.
1.2 Project Challenge, Stakeholders and Scope
NOS is a very hierarchical organization, with different departments and teams. This project was
developed under the Business-to-Consumer Marketing (B2C Marketing) department center, thus,

1.3 Project Methodology 3
the project is focused solely in B2C clients. Inside the B2C Marketing department center, this
work was developed under the Customer Relationship Management (CRM) department, which
deals not only with the traditional CRM tasks but also with Churn and Retention analysis, Business
Intelligence and Data Science, Next-Best-Offer (NBO) and Data Engineering. Each of these areas
is the responsibility of a specific team. One of them is one of the two main stakeholders of the
work described in this dissertation.
The aforementioned stakeholder is the Reporting and Business Analysis (CRM-RAN) team.
CRM-RAN is responsible for two fundamental tasks: firstly, to build reports on a daily, weekly,
monthly or yearly basis on various matters concerning the B2C Marketing department center and,
secondly, to develop in-depth business analysis to support decisions such as discontinuation or
continuation of existent services or products. To sum up, the CRM-RAN team builds reports
and analysis that are useful to support decision making in other units inside B2C Marketing, and
that was exactly its role in this project, to work closely with a specific department to deliver the
commissioned reporting tool.
That department is the Product department, the second main stakeholder of the project. It is
responsible for deciding on the various matters regarding the fixed and mobile equipment NOS
sells to its clients. This team had, recently, together with the B2C Marketing department heads,
felt the need to improve the visibility on the amount of terminal equipment the clients had in their
households. In other words, they were looking for a way to have information of all the equipment
under their responsibility in a single tool, as the information that existed was sparse and not tailored
to their routinely needs. All of this, together with a new outlook on their equipment: "With the
possibility of having a unified reporting source, what ’old’ information can now be empowered
and ’new’ information of interest be tracked?". This was the challenge tackled in this project. It
was expected, that, by the end of it, the Product team had a completely functional tool that could
supply them with information related to most of the fixed equipment under their management.
1.3 Project Methodology
This dissertation project followed a 7 step methodology to address its challenge.
Firstly, several meeting were held to understand the business itself: What types of equipment
exist, the business models related to them, which performance indicators are tracked, and so forth.
Secondly, requirements where collected and proposed. Which metrics are to be tracked in the
reporting tool? What visualizations are desired? How do the users want to filter the information?
Thirdly, data collection and treatment. Taking into account the feedback from the first two steps,
a database was accessed to retrieve data to feed the tool. Subsequently, the data was treated so as
to be prepared to be reported. Fourth, dashboard construction, where a dashboard was built using
the previously treated data and taking into account the defined requirements. Fifth, validation and
fine tuning. After the first version of the dashboard was built, stakeholders where iteratively called
to use it and propose changes or upgrades. Steps two to four were continuously reviewed during
this stage. Sixth, predictive analysis. This step was developed side-by-side with the fifth step, to

4 Introduction
show the potential the dashboard had in assisting in the equipment forecasting needs. Lastly, the
seventh step, project conclusion. In this last step, the work developed was prepared to be passed
on to a member of the CRM-RAN team that would be responsible for the dashboard maintenance
and improvement moving forward. The project methodology will be detailed in Chapter 4.
Figure 1.1: Step-by-step methodology
1.4 Dissertation Structure
This dissertation is structured as follows.
In the current chapter, a short introduction to the project was made, with a small review of
the organization where it was conducted, its industry competitors, an explanation on the motiva-
tion behind the dissertation and its stakeholders and the methodology upon which the work was
developed. The second chapter introduces a literature review on the most relevant topics that are
related to this dissertation, ranging from the Telecom Industry to Business Intelligence and Pre-
dictive Analysis. The third chapter introduces the most important concepts of this dissertation
and clarifies the project goals and requirements. The fourth chapter describes the tasks that each
step of the methodology entailed. The fifth chapter presents the project results: it discusses the
final version of the dashboard, the opinion of its users and presents the findings of the forecasting
tool. The last chapter presents the main conclusions of this project and discusses future work and
improvements.

Chapter 2
Literature Review
2.1 Business Intelligence
Business Intelligence is a broad set of tools used to transform data into information ready and
capable of supporting decision-making (Aruldoss et al. (2014)). Although BI has different func-
tionalities according to each specific domain, it is commonly understood as a data driven decision
support system that gathers, stores and analyses the data to provide input to the decision process.
This data often comes from different sources and its transformation process is championed by
different stakeholders inside an organization, be it people or processes.
BI can be seen in different perspectives (Ishaya and Folarin (2012a)). While some consider
it a data driven decision support system, others see it as a strategic information system with a
centralized data repository capable of transforming the data into meaningful information via BI
analytical tools. Under this last perspective, a BI application can be classified into one of two
categories: Operational Support Systems, that support day-to-day operations, and Decision Sup-
port Systems, that support decision-making. BI can also be defined as a process and methods for
improving decision-making through a combination of business processes and effective utilization
of IT to integrate data and information thorough various Data Warehouses, using data mining to
analyse the data and generate reports.
According to Aruldoss et al. (2014), the following components (an examples) of BI can be
identified:
• Data Source Extraction (Data Collection, Data Integration, Data Pre-Processing)
• Data Storage (Data Warehouse, Database)
• Feature Extraction (Feature Filtering, Rule Filtering)
• Knowledge Base (Technological Intelligence, Knowledge Identification, Market Intelligence)
• Data Analysis (Situation Assessment, OLAP)
• Software Agent (Business Agent, Artificial Intelligence Agent, Expert Agent)
5

6 Literature Review
• Reporting (Reporting Tools, Dashboard)
• Information Management (Information Extraction, Unstructured and Structured Informa-
tion)
• Data Mining (Stream Mining, Sales Data Mining System)
• BI Integration (CRM, ERP, SOA, BPM)
BI has seen development in all the aforementioned components throughout the years, not
only in application level development but also in data collection strategies and other retrieval
techniques.
These components can be grouped into different BI design models, which are essential for de-
veloping any underlying BI application. While these models may vary from case to case, there are
three more common components: a data storage model, data analysis model and data visualization
techniques for reporting.
To sum up, a coherent BI application usually consists of a data warehouse, ETL (Extract,
Transform, Load), data mining, analytical tools, data visualization and analysis, dashboard, score-
board, CRM, Enterprise Resource Planning (ERP), Online Analytical Processing (OLAP) and
other related components. Although it is true that all these BI related concepts were thoroughly
investigated in the past, BI brings all of them under a single umbrella. All in all, BI must not only
enable a close monitoring to the performance and operation of the business, but also assist the
decision-makers in developing a business strategy.
2.1.1 Business Intelligence in the Telecom Industry
BI is of extreme importance for service providers, not the least so to telecommunication service
providers. In this sector, BI is still largely based on the traditional approach of data integration,
static in nature, which may not meet up with the constantly changing analysis required to support
decision-making. As customer’s data grows exponentially, a Service Oriented approach is required
to provide real-time data analysis.
As can be seen in Figure 2.1, the BI process starts by uploading data from various sources into
the Data Warehouse using ETL to process the data required. After this data loading process, data
mining tools are deployed to produce reports in a timely and user-friendly fashion.
There are numerous examples of applications of BI tool in the telecom industry. For instance,
BI applications have been used in Taiwan’s Internet service provider industry to identify different
customer clusters in order to help management formulate proper marketing strategies, providing
the necessary knowledge to balance big investments by the company (Li et al. (2008)).
Another instance where a BI solution was proposed for the telecom sector was in the paper
where a Service-Oriented Architecture (SOA) was presented, coupled with BI, to create a Service
Oriented BI to integrate heterogeneous data sources, with the goal of assisting the organization
in making real-time and accurate decisions about the customer tariff plan (Ishaya and Folarin

2.1 Business Intelligence 7
Figure 2.1: Traditional BI Process
(2012b)). Interestingly, BI is a good fit with not only SOA, but also CRM, ERP and Socio-
Environmental indicators (Aruldoss et al. (2014)).
2.1.2 Data Visualization in Business Intelligence
Data visualization, meaning, the use of images to represent information, is a powerful way to
make sense of data and to communicate the information discovered in it to others. It is argued
that nothing in the field of business intelligence can bring us closer to fulfilling the promise of
intelligence in the workplace than data visualization (Few and Edge (2007)).
One of the main issues tackled by BI is how to analyse data without the continuous interference
of specialists. This issue appears due to the difficulty in retrieving flexible data coupled with user-
tuned visuals due to heterogeneity in data sources and structures (Lousa et al. (2019)). To this end,
Self-Service Business Intelligence (SSBI) comes as a solution to this problem. SSBI changed the
paradigm of BI as it enabled various users to perform tasks traditionally done by IT departments,
from accessing data to building full reports and dashboards.
Data Visualization based on images and graphs brings a considerable advantage over text and
number formats, as it not only provides a different perspective to how the data is perceived but also
is more captivating and less tiring to use due to the human’s brain higher receptivity to images and
graphical information.
Inside this SSBI philosophy, several different Data Visualization softwares have been devel-
oped, four of them being Microsof Power BI, Tableau, Sisense and QlikView.
Comparing them, there is no clear winner. Tableau is considered the best in terms of building
dashboards, even if PowerBI also has a very interesting library with standard visuals. QlikView is

8 Literature Review
best suited for data analysis due to its in-memory technology for data discovery, while Sisense has
a more efficient usage of RAM and CPU memory to process large terabytes of data. PowerBI is
a clear winner in connectivity because it can access a plethora of Microsoft’s platforms and func-
tionalities, and its compatibility with Microsoft Excel makes it an overall solid Data Visualization
software (Lousa et al. (2019)).
According to Few and Edge (2007), trends in data visualization include:
• Interactive Analytics, such as visual interactions using filters;
• Drill-down and Highlights;
• Dashboards which combine all the important business or departmental information in a
single screen;
• Geo-spatial visualization using Google Maps and other similar services;
• The use of visual animation to show change through time.
2.1.3 Dashboards and Business Reporting
Business Reporting is essential to any large organization. Not only public business reporting of
financial and operational data to business stakeholders, but, more importantly, operational report-
ing of the organization’s day-to-day activities, to provide information to decision-makers within
an organization to support them in their work. But, as the amount of data to be reported is ever
increasing due to an overload of multi-channel management and the proliferation of product lines
and services, among other factors (Pauwels et al. (2009)), so is the need to summarize that data
and work with the most relevant and important information. Dashboards come as a way to solve
this problem.
In fact, the utilization of dashboards has been driven by 4 main factors (LaPointe (2005)):
• Poor organization of relevant data;
• Managerial biases in not only information processing but also decision making;
• Increasing demands of market accountability;
• Need for cross-departmental integration in performance reporting practises.
The most important characteristic of a Dashboard is the summarization and integration of Key
Performance Indicators (KPI’s). Thus, according to Pauwels et al. (2009), a dashboard can be
defined as a relatively small collection of interconnected key performance metrics and underly-
ing performance drivers that reflect both long and short-term interests to be viewed through the
organization.
This leads to Dashboards promoting not only the integration of data but also of business pro-
cesses and viewpoints, especially in aligning the processes goals and different decision-makers
viewpoints.

2.1 Business Intelligence 9
In what regards the purposes of dashboards, several can be identified. Firstly, to Monitor Per-
formance - which can, in turn, be evaluative to understand what performed well or not; and devel-
opmental, where the monitoring aims at learning. Secondly, to enforce Consistency in measure-
ments and measurement procedures. Thirdly, to Plan which entails knowing were the company
stands and what should the goals and strategies for the future be. And, lastly, to Communicateto important stakeholders not only the operational and/or financial results themselves but what the
organization values by the choice of metrics that are displayed in the dashboards, since the KPI’s
being tracked in the dashboard are targets persecuted by the company. For instance, an Industry
organization that accounts for the level of carbon dioxide emissions in their dashboard is perceived
to value the environmental impact of their activity.
The development of dashboards can be segmented into several stages. According to Pauwels
et al. (2009), it can be synthesized in five stages:
1. Selecting the Key Metrics
Two main approaches can be applied in metric selection. In one hand, a general approach
leads to a lower number of metrics that can be applied to almost all settings, thus, this
approach leads to KPI’s that are more comparable and allow easier benchmarking (inside
the same organization or even comparing with competitors). On the other hand, a tailored
approach leads to more specific metrics to that business unit or organization, and it is recom-
mended that those that use the dashboard or are measured by it should be called to decide on
the metrics. While more specificity may lead to more significant objectives, this approach
may take longer and lead to a very high number of metrics that may be difficult to reduce.
2. Populating the Dashboard with Data
This step, which consists in extracting and preparing the data that will feed the dashboard, is
not a trivial one. As service firms have enormous quantities of data with different periodicity,
data preparation may be one of the most time-consuming steps of developing a dashboard.
3. Establishing Relationships Between the Dashboard Items
This step moves a dashboard from a simple presentation of information (like traditional
reports) to a decision support system by recognising the underlying relationships between
metrics.
4. Forecasting and Scenarios
In this stage, the dashboard’s model is applied to scenario planning and budget setting. In
reality, most dashboards do not achieve this stage of dashboard development (Zeithaml et al.
(2006)), where the focus is more in reporting current operations and less in what-if analysis.
5. Connecting to Financial Consequences
This final stage connects marketing expenditure all the way into sales and to the financial
consequences of the firm, including the link to shareholder value and market capitalization.

10 Literature Review
In the end, dashboard adoption depends largely on the benefits it can provide to an organi-
zation. Therefore, if effectively implemented, a dashboard can bring a number of organizational
benefits, such as:
• Sharing metrics as a way of establishing the culture of the organization (it can be achieved
mostly by doing an inter-disciplinary construction of dashboards);
• Distinguishing between good and poor performance, as well as allowing the evaluation of
different options for remedial action;
• Organizational learning;
• Increased profitability;
• Enhanced decision making.
2.2 Predictive Analytics and Forecasting Methods
Previously, BI was reviewed as an umbrella that covers virtually all of the data management,
transformation and knowledge extraction activities inside a company. In this framework, data
mining is of particular importance, namely Predictive Analytics which aims at determining the
likelihood or probable future outcome of an event.
Predictive Analytics builds predictions based on variables available in Data Warehouses using
analysis such as clustering, market basket analysis, decision analytics, text mining and hypothesis
testing, based on algorithms such as regression modeling, neural networks, genetic algorithms and
more (Aronsson (2015)).
Predictive Analytics, in the BI environment, can be based on three pillars: Customer Pre-
dictive Analytics, with activities such as retaining loyal customers and attract others like them;
Operational Predictive Analytics, where the goal is to maintain infrastructure and maximize capi-
tal efficiency of an organization by, for example, predicting necessary maintenance of equipment;
and Threat & Fraud Predictive Analytics, where detecting suspicious activities and handling claims
more rapidly are key.
In this project, Predictive Analytics was used to apply Statistical Forecasting Methods to pre-
dict the evolution of one of the metrics being reported in the dashboard also built in this project.
According to Abraham and Ledolter (2009), a forecasting method can be classified into two
groups: Qualitative or Quantitative techniques. While Qualitative methods are intuitive, based on
educated guesses which in turn may or may not be dependent on past data, Quantitative methods
are based on mathematical or statistical models, which can be further classified into deterministic
(when the relationship between the variable of interest and the explanatory variables is determined
exactly) and stochastic (when the previously mentioned relationship is not exact due to measure-
ment errors and noise from other uncontrolled variables).

2.2 Predictive Analytics and Forecasting Methods 11
2.2.1 Exponential Smoothing Methods
Of particular interest to this project are the Empirical Forecasting Models, which use observations
(usually time series) to build statistical models between the predictors and the variable to be pre-
dicted. The most simple empirical models are Single Variable Forecasting methods that use the
past history of the series and extrapolate it into the future. These Single Variable Forecasting meth-
ods include Exponential Smoothing techniques, which are methods that exponentially decrease the
weight (importance) of time series observations as they get older (Hyndman et al. (2008)).
Exponential Smoothing Techniques use time series decomposition, usually in the following
components:
• Trend (T), the long-term direction of the series;
• Seasonal (S), a pattern that repeats with a known periodicity;
• Cycle (C), a pattern that repeats with unknown and changing periodicity (for instance, a
business cycle);
• Error (E), the unpredictable component.
The way the components are combined is different according to the different patterns a time
series can have, from purely additive (y = T +S+C+E) to purely multiplicative (y = T SCE).
A time series can be classified according to the:
• Trend growth pattern: None, Additive, Additive Damped, Multiplicative and Multiplicative
Damped;
• Seasonal growth pattern: None, Additive and Multiplicative.
Holt’s Linear Method, that will be the forecasting method used in this project, is an extension
of the Simple Exponential Smoothing method (that has no Trend or Seasonal growth patterns),
that allows forecasts of data with Additive Trend. Values are forecasted using two smoothing
constants, α and β (with values between 0 and 1) and the three following equations:
Level: lt = αyt +(1−α)(lt−1 +bt−1)
Growth: bt = β (lt + lt−1)+(1−β )bt−1
Forecast: yt+h|t = lt +bth
Where yt denotes the real value of the series at time t, yt+h|t is the forecast for future period
t +h at time t, lt is an estimate of the level of the series at time t and bt denotes an estimate of the
slope of the series at time t. bt is a weighted average of the previous growth bt−1 and an estimate
of growth based on the difference between successive levels. The initialization of the variables l1and b1 is the following:
l1 = y1
b1 = 0

Chapter 3
Project Description
In the previous chapter, a literature review was conducted to review the main scientific areas that
this dissertation covers, mainly reporting in business intelligence and forecasting methods. Now,
in this chapter, the most important domain-specific concepts behind the project will be explained
and detailed. Following it up, the goals and respective requirements will be clarified.
3.1 Concepts
There are five main business related concepts that need to be clearly understood in order to deliver
the tools commissioned in this project: what a Fixed Equipment is and what different types exist;
how they are related to the main business lines, in other words, the Services provided by NOS;
what characteristics of the users of such equipment and services, the Customers, are important
to track; the static nature (Park) and dynamic nature (Activation and Deactivation) of EquipmentStock Management and, finally, what are the relevant Revenues directly tied to the equipment
business.
3.1.1 Fixed Equipment
There are three main types of equipment: TV Box, Internet Router and Internet Extender. The
TV Box (from now on, refereed to as Box) is the hardware that delivers the Television services.
Likewise, an Internet Router (or simply Router) is the equipment that delivers the Fixed Internet
services. Finally, an Internet Extender (or just Extender) is an equipment that increases the cover-
age of the Wi-Fi signal of Routers. Figure 3.1 depicts an example for each type of equipment.
Fixed equipment can be used in two different business models:
• Equipment sold as a stand-alone product: In this business model, the equipment is directly
sold to a costumer. Therefore, the client only pays the purchasing price (and possibly other
initial services such as the in-house installation) and becomes the effective owner of the
product from that moment on.
12

3.1 Concepts 13
Figure 3.1: From left to right - UMA Box and respective remote controller, GiGA Router andNOS Extender
• Equipment as part of a service: Under this model, an equipment is not sold to a customer but
provided for free with a paid service. The most important factors that distinguish this busi-
ness model from the previous one is that, for one, the client does not pay for the equipment
but for the service it delivers and, for another, because the company keeps the ownership of
the product.
At the time of this dissertation, all Routers and Boxes were provided as part of a service, while
most Extenders were sold as stand-alone products. In fact, the Extenders were under a transition
period between a "sold as a stand-alone" business model to a "provided as part of a service" one.
However, most were still under the older model.
Taking this into account, it was decided that the project scope, in terms of types of equipment,
would only focus on Boxes and Routers, because one of the main challenges was to have account-
ability for the company-owned stock in the customers sites (houses). Consequently, Extenders
would be revisited in future work, once they moved to a business model similar to the one applied
to Boxes and Routers.
Both Boxes and Routers, due to being fixed equipment, are installed in the customer houses,
usually by a team of NOS technicians. Depending on the location of the house, a fixed equipment
can access the service network using three different technologies. "Direct To Home" (DTH) is the
technology that delivers services through a satellite. This technology covers all of the Portuguese
national territory, therefore, this technology is available to any client that does not have access
to a broadband connection. "Hybrid Fiber Coax" (HFC) is a broadband connection that combines
optical fiber and coaxial cable to deliver the service. Although not covering the entire territory, this
technology is available in most of the cities and villages. Lastly, "Fiber To The Home" (FTTH) is

14 Project Description
Table 3.1: Router Generations
Generation Routers1 Modem Multimedia2 eMTA Wireless3 HUB, HUB FTTH4 HUB 3.05 Router 4.0, Router 4.0 FTTH6 Router 5.0, Router 5.0 FTTH
the newest broadband connection based solely on optical fiber. Being the most recent technology,
FFTH is only available to a restrict amount of locations. Technologies can be grouped into Areas:
the HFC and FTTH technologies, both broadband connections, are considered "Cable" area, while
DTH technology is "Satellite" area (sometimes also called DTH or Wireless). Figure 3.2 sums up
the Areas and Technologies.
Figure 3.2: Comparison between Area and Technology
Depending on the type of equipment, different functionalities can be distinguished to char-
acterize each equipment. For example, Routers can be distinguished by the maximum allowed
Internet Speed while Boxes can be categorized by Image Quality. Groups of different functionali-
ties, when introduced in a certain time-frame, define different Generations of equipment.
The next subsections will detail the different types of equipment addressed in this project:
firstly, Internet Routers and, secondly, TV Boxes.

3.1 Concepts 15
Table 3.2: Box Generations
Generation Boxes1 DTA2 Powerbox3 Box 1.0, Box 1.0 DVR4 Box IRIS, Box IRIS DVR5 Box UMA V1, Box UMA V2
3.1.1.1 Internet Router
The Routers currently in use and their respective generations are presented in Table 3.1. The
Routers in this table use two technologies, HFC and FTTH. Some generations have equipment
with two different names according to the technology in use: without FTTH at the end of the
name are exclusively HFC equipment and with FTTH at the end of the name are exclusively
FTTH equipment. Generations without this distinction (for example, Generation 4) have the same
equipment for both technologies. The difference between the generations of equipment is mostly
related to Internet Speed and overall stability. Generation 1 is composed by exclusively wired
Internet, while Generation 2 represents the first "true" Router with the introduction of the Wi-
Fi technology. The other generations represent changes in internet speed, bandwidth, hardware
design and other aspects.
There is only one Router, not represented on the table, that accesses DTH technology, named
"Router 4G".
3.1.1.2 TV Box
The different generations and respective Boxes that customers used at the time of this project are
displayed in Table 3.2. Like the Routers on Table 3.1, the Boxes on this table can only access
either HFC or FTTH technologies, but, unlike some Routers, all Boxes can access both technolo-
gies. A single equipment, called "Box DTH", is used to access the television content using DTH
technology.
Generation 1, DTA, is the simplest Box, only providing analog channels. Powerbox, in Gen-
eration 2, enables the streaming of Premium channels (such as Sports or Cinema Premium chan-
nels). Generation 3 (Box 1.0) introduced HD channels and simple apps, while, in Generation 4
(Box IRIS), Boxes have a distinct interface, designed to allow the user to navigate through more
functionalities like TV shows recordings. Finally, Generation 5 (Box UMA) is the flagship gen-
eration, with Boxes capable of 4K content and the latest apps and services, like the "App NOS
Share" that allows saving and sharing photos and videos with friends and family that are also NOS
clients.
Boxes can also be classified in two groups according to how they are tied to a service:

16 Project Description
1. Main - If a client only has one Box, this equipment is a Main Box that is provided for free
with the service, as previously explained. If he has more than one Box, then only one of the
Boxes will be considered a Main Box.
2. Multiroom - These are the Boxes that belong to clients with multiple Boxes, and are not
Main Boxes. Usually, these Boxes are not included in the service price, in other words, the
client often pays an extra fee for the utilization of these Boxes.
Simply put: each TV client has a Main Box. If he has more than one Box, the Boxes in excess
are considered Multiroom Boxes, not included in the service price and, therefore, susceptible to
its own pricing. In a multiple Box service, the criteria by which a Box is considered Main or
Multiroom is not always straightforward. However, generally, the Main Box is the Box of the
newest generation and, in case two boxes are tied in this criteria (due to belonging to the same
generation), the newest Box (the one with the newest Activation date) is considered the Main Box.
This approach was also used in this project.
3.1.2 Services and Customers
As explained in the beginning of Section 3.1.1, each type of equipment delivers a specific service
to a client. Characterizing these services and their clients is important for this project because
these characteristics help the organization segment the information: some stakeholders may be
interested in the equipment tied to a specific set of customers and services with certain character-
istics, while others may be interested in a different set. Distinguishing between client and service
characteristics is a difficult task, if not impractical, because clients themselves are characterized
by the services they have. In this dissertation, client and service characteristics are treated as the
same, and will be called "client/service" characteristics.
All services that are provided to customers have the following features:
• They are priced on a monthly basis, that is, the costumer is billed each month with a new
invoice for the agreed service price.
• They are provided to a specific location, meaning, to a specific customer address. This loca-
tion largely influences if the Fixed services are provided by DTH, HFC or FTTH technology,
as their availability varies location by location.
• Under Portuguese law, Telecom companies must provide services under two regimes: with
a loyalty period and without a loyalty period. Services with a loyalty period require the
client to stay in the same service or company for a certain amount of time, from months to
years. Naturally, these services with a loyalty period are less expensive than the equivalent
services without a loyalty period, more prone to the customer cancelling their service.
• A single service can aggregate a set of smaller ones, making up different Profiles. There are
five different basic services that NOS provides: Television, Fixed Internet, Mobile Internet,

3.1 Concepts 17
Fixed Telephone and Mobile Telephone. The combination of these five different basic ser-
vices lead to different Profiles, from 1P (a client with a single basic service, for example,
Television) to 5P (a client with all five aggregated services).
The aforementioned service features or characteristics are tied to a Service Account (SA). The
organization where this project was conducted distinguishes two types of accounts: a Customer
Account (CA) and a SA. Each customer has a CA, while each CA can have one or multiple SA.
Why is it necessary to have these two types of account if, as already mentioned, a single service
can aggregate a set of smaller ones? Isn’t it possible to aggregate all services that belong to a
customer in a single SA, thus eliminating the necessity of having two types of accounts? The truth
is that there are several reasons to why a customer would have several SA, for example:
• A customer has different residencies. In this case, each residence serviced is considered in
a separate SA;
• A customer simply has different services that are not unified under a single SA. For example,
a client may have a CA with two different SA: one for its Television and Fixed Internet and
another only for its Mobile Telephone service. This situation can happen due to lot of
factors, for example, the channel where the sale or service upgrade/downgrade was made or
because the company IT infrastructure still does not allow grouping a specific combination
of basic services in a single SA.
It is important to note that all the client/service characteristics discussed in this dissertation are
related to a SA, not a CA (for example, the classification of 1P, 2P, ..., 5P depends on the number
of services tied to a SA). Not only that, but the distinction between a Main or Multiroom Box
depends on the number of Boxes in the SA. If a client has multiple SA, each with a Television
service, each SA will have its own Main Box.
3.1.3 Equipment Stock Management
Equipment Stock Management relates to how the organization tracks the amount of equipment
that exists in their customer residences. Any kind of stock management entails tracking two dif-
ferent dimensions, a static dimension (the stock itself) and a dynamic dimension (in the form of
increasing and decreasing movements of stock). In the case of Equipment Stock Management,
the entire stock of equipment that NOS has deployed in its customer sites can be tracked by the
following formula:
Park(n) = Park(n−1)+Activation(n)−Deactivation(n) (1)
Where Park(n) is the total amount of equipment being used to service clients at the end of
period n, Park(n− 1) is the total equipment amount at the end of period n− 1 (or start of period
n), Activation(n) represents the total amount of new equipment being connected to the service
network, to start servicing clients, during period n and Deactivation(n) represents the total amount

18 Project Description
of equipment that disconnected from the service network during period n. Therefore, the changes
in the equipment Park (the static dimension) during period n can be calculated by the difference
between the total amount of Activation and Deactivation (the dynamic dimension) over the same
period n.
This equation is true for any type of equipment, regardless if we are looking at the total amount
of Boxes or the total amount of "Boxes UMA V2", for example.
In case we want to track the Park of Multiroom and Main Boxes separately, the formula is
different. In the case of Multiroom Boxes:
Park(n) = Park(n−1)+Activation(n)−Deactivation(n)+PMigration(n)−NMigration(n) (2)
Where PMigration(n) represents the total amount of Boxes that went from Main to Multiroom
over period n, and NMigration(n) the total amount of Boxes that went from Multiroom to Main
over period n. This equation can be replaced by equation (1), though. If the PMigration movement
is considered a Deactivation of a Main Box and the Activation of a Multiroom Box and NMigration
movement is considered a Deactivation of a Multiroom Box and the Activation of a Main Box,
then equation (1) still holds true.
The Park, Activation and Deactivation variables in this stock movement environment is what is
often called inside the company Operational Tracking and are the main metrics that the dashboard
must report. Tracking these metrics enables a tighter control over equipment inventory stocks,
helping decision-makers defining Ordering Policies. They are also indicative of the successful and
unsuccessful product launching, for new products, and product discontinuation, for older products.
3.1.4 Revenues
The Equipment to be tracked in this project usually does not have a revenue directly tied to it, as
revenue is connected to the service itself instead. A client that starts a new service and, with it, gets
a new equipment, receives, in the first invoice, an expense for the same amount as the equipment
Price Value Point (PVP) and, at the same time, a discount for the same amount, leaving no real
revenue to be had. Therefore, the dashboard does not have any relevant revenue to regularly track
because they are tied to the performance of the service and not the equipment.
The only exception is the revenue that comes from Multiroom Boxes. This revenue, that,
as previously explained, comes from the extra-Boxes that the clients have in their houses, is an
important metric to follow in order to measure the success of Multiroom Policies, such as pricing
and segmentation, in the company.
3.2 Goals and Requirements
This project entails two different goals. Each goal has a different importance within the project
framework. Starting with the most important goal:

3.2 Goals and Requirements 19
Table 3.3: Requirements
Goal Requirements
Dashboard
1. Weekly track of total Park, Activation and Deactivation figures of all Boxes and Routers2. Total Equipment Revenue figures on a monthly basis3. Characterize figures by the following client/service characteristics:
- Area, Segment, Profile, Technology, ARPU, Loyalty Period, Location, Best TV & Internet Service4. Characterize figures by the following equipment-specific characteristics:
- Best Box, Best Router, Number of Boxes in the SA, Number Routers in the SA5. Characterize the Multiroom Boxes by their ARPU and Migrations movement6. Characterize the Activation by type, sales channel, exchange for another equipment7. Characterize the Deactivation by Churn type, exchange for another equipment8. Find relationships between Boxes and Routers
Forecasting1. Weekly Predictions of Equipment Activation2. Must use data from the Dashboard Goal3. Simple but with low prediction errors
• Dashboard - Build a Dashboard that allows tracking the weekly fixed equipment Park,
Activation and Deactivation movements and the equipment Revenue on a monthly basis.
This goal is the main output of the project. The following complementary goal was also
established:
• Forecasting Tool - Build a Forecasting tool that allows the prediction of the near-term fixed
equipment Activation amount.
Each goal had different expected results. For the Dashboard Goal, it was expected the delivery
of a very complete dashboard, fully answering the user and other proposed requirements, and,
at the same time, ensuring the utmost care with the data treatment and the future continuity of
the dashboard after the project conclusion. Therefore, this was the goal with the most demanding
output. The Forecasting Tool Goal was expected to result in a tool that could forecast the near-term
Activation equipment movements. This tool was only to be a proof-of-concept that the information
of the dashboard was sufficient to aid in forecasting such movements, therefore, aspects such as
the user interface of the tool were not expected to be the focus.
Looking back to the methodology presented in chapter 1, Steps 1, 2, 3, 4, 5 and 7 relate to
the Dashboard Goal. The Forecasting Tool Goal relates mostly to the Step 6 of the methodology
(Predictive Analysis) and aims to prove that the final dashboard provides data that allows the
prediction of future park movements, in this specific case a forecasting tool that predicts the near-
term evolution of the equipment Activation movements.
Table 3.3 shows the Requirements for each Goal.
In the next chapter, the Methodology presented in Chapter 1 will be deeply analysed: what
was performed and achieved in each step of it. We will also discuss each Requirement from the
Dashboard Goal, in section 4.2, and the Requirements of the Forecasting Tool Goal in section 4.6.

Chapter 4
Methodology and Project Execution
In this chapter, each step of the project methodology will be explained by accounting for how they
were executed, starting in Step 1, where the concepts necessary to deliver the project where first
explored, up until Step 7, where the project was concluded.
4.1 Step 1 - Business Understanding
Business Understanding, in this project, entails the study of the business environment and the
organization’s information infrastructure that ought to be comprehended in order to be able to fully
address the user needs and work with the tools of the organization (for example, its databases). To
deliver this premise, two tasks were conducted:
• Task 1: Delivering a simple report on the monthly Activation of Multiroom Boxes;
• Task 2: Understand the overall equipment business, necessary to start the development of
the final dashboard.
Task 1 was developed to address a more pressing need of visibility on the amount of Multiroom
Boxes being Activated. Its contribution to the end-goal of the project, the final dashboard, was
mainly on the following areas:
1. It introduced the Multiroom Box business. This was important because this business model
is somewhat unique, since the concept of Multiroom does not exist in other equipment,
for example, Routers. So, this first report allowed a first-hand knowledge of this specific
equipment.
2. In order to achieve the desired results, mainly to get the service/client characteristics related
to the Multiroom Boxes, this was the first time some of the databases, which were also nec-
essary for the final dashboard, where used. Therefore, it introduced the data infrastructure
of the organization, and it was here that a first study of which data was available, which
wasn’t, which was updated, which wasn’t, was performed.
20

4.2 Step 2 - Reporting Requirements 21
Since the report built during Task 1 was not one of the final outputs of the project, it won’t be
explained in this dissertation, we’ll focus solely on the process of building the final dashboard.
In task 2, the concepts introduced in section 3.1 were first explored and understood: Which
fixed equipment existed, which of them were relevant to the project, what are the service and
customer characteristics most relevant in the business, the importance that the Equipment Stock
Management metrics would have in the dashboard and which revenues are specific and important
to decision-making in the equipment ecosystem. This was achieved through several one-on-one
meetings between the student and a NOS employee, with the student explaining the project chal-
lenges followed by a discussion of the basic concepts related to them. Some of them were done
with teams/departments not directly tied to this project, such as NBO, who explained which touch-
points their work had with the fixed equipment business in specific. However, there were three
fundamental meetings: one with the responsible of the TV equipment, another with a responsible
of the Fixed Internet equipment and, lastly, a meeting with the responsible for the Extender equip-
ment; each of them explaining the specificities of the type of equipment they were responsible for.
It was at the end of these meetings and further discussion with the company’s project supervisor
that the Extenders were removed from the project scope as its business model did not fit the most
important metrics (Park, Activation and Deactivation) that the dashboard would report.
4.2 Step 2 - Reporting Requirements
Reporting Requirements represents the collection of user requirements and the proposal of new
metrics to be reported in the dashboard. The requirements resulted from the discussions between
the two main stakeholders of the project:
• Product department - This department is the main user of the dashboard, therefore, the most
relevant in proposing requirements;
• CRM-RAN team - Not only the responsible for the dashboard but also one of the final users,
as the information on this dashboard would feed other reports and business analysis done by
the team.
Some discussions about which requirements the dashboard should have were, in fact, done
before the student initiated this dissertation project, for two main reasons: to assess the feasibility
of the project and have an initial project plan. In these discussions, and others while the project
was already under-way, it was common that the Product department would propose a large amount
of requirements that would be filtered by the CRM-RAN team for two reasons: one, infeasibility
in the time-window of the project and, two, lack of updated data on that matter.
One example of this was the equipment revenue data. As previously explained in Sub-Section
3.1.4, equipment revenue is exclusive to multiroom boxes. Due to not being a focus of the company
before this project started, the data about equipment revenue has some issues in its periodicity,
because it was only reported monthly, while the dashboard would be fed weekly information.

22 Methodology and Project Execution
Therefore, this initial requirement by the product company was left aside, and was only added
right at the end of the project execution due to increased necessity of this data. This is why the
revenue data is the only part of the dashboard with monthly information: because it lacks the
weekly baseline that the rest of the report has in its Park, Activation and Deactivation data.
Let’s look back to the requirements of the dashboard, from section 3.2:
1. Weekly track of total Park, Activation and Deactivation figures of all Boxes and Routers;
2. Total Equipment Revenue figures on a monthly basis;
3. Characterize figures by the following client/service characteristics: Area, Segment, Profile,
Technology, ARPU, Loyalty Period, Location, Best TV and Best Internet Service;
4. Characterize figures by the following equipment-specific characteristics: Best Box, Best
Router, Number of Boxes in the SA, Number Routers in the SA;
5. Characterize the Multiroom Boxes by their ARPU and Migrations movement;
6. Characterize the Activation by type, sales channel, exchange for another equipment;
7. Characterize the Deactivation by Churn type, exchange for another equipment;
8. Find relationships between Boxes and Routers.
The two first requirements listed represent what the users actually want to see in the dash-
board. The Park, Activation, Deactivation and Revenue figures are the values that the users are
looking to extract from the dashboard for their own use. The weekly amount of Park, Activation
and Deactivation would be used for tracking the business state in terms of the amount of equip-
ment that clients were using and the weekly increases and decreases of that amount of equipment.
Users want to see the total amount of each of those three metrics not only for the entire universe of
Boxes and Routers but also for each Box and each Router and, specifically for Boxes, distinguish-
ing between Main Boxes and Multiroom Boxes. Therefore, the visuals that represent this data
ought to have the flexibility to represent that data as users want to consult it. The Revenue figures,
related to the Multiroom Boxes, would be used mainly for budgeting purposes. Users wanted to
be able to see the total Revenue for all Boxes and per Box, similarly to the Park, Activation and
Deactivation metrics. However, that was not possible because such information (equipment rev-
enue per equipment) did not exist in any information system of the company. The only equipment
revenue data that existed was tied to service accounts and not the equipment itself. Knowing this
limitation, users required to see the total Revenue equipment information of not just all the SA, but
also to distinguish the total Revenue that came from clients that paid lower revenues from clients
that paid higher revenues. Regarding the time-horizon of the information in the dashboard, it was
agreed that the weeks to be included would be from the first week of 2020 up to the most recent
week at the moment of each released version. Likewise, the first month included was January

4.2 Step 2 - Reporting Requirements 23
2020. The Park, Activation and Deactivation metrics were to be updated every week while the
Revenue data every month.
The following requirement, requirement number 2, meant that the dashboard users wanted to
be able to filter the Park, Activation, Deactivation and Revenue figures according to the enumer-
ated characteristics that are related to the SA to which the equipment in Park/being Activated/being
Deactivated and equipment Revenue are tied to. Filtering, in this context, means removing from
the visual representations the data not related to the characteristics chosen. Area and Technol-
ogy were explained in Sub-Section 3.1.1, while Profile, Loyalty Period and Location have been
addressed in Sub-Section 3.1.2. Segment is another way of distinguishing types of consumers,
for example, comparing with the Area, Segment Cabo Fibra are usually Cable clients, Segment
Wireless are DTH clients while Convergente are clients that have a Mobile Telephone service in
their SA. Average Revenue Per User (ARPU), is the total amount the client pays for something in
specific in their service. In the case of this dashboard, it was decided with the project coordinator
that the most relevant ARPU to filter information would be the Total ARPU (the total amount that
the client pays for the service) and the Premium ARPU (the ARPU that the client pays exclusively
for the Premium television channels). It was important to include both because the Total ARPU is
the most common way of grouping clients by revenue, therefore, users would definitely demand
this filter, while Premium ARPU is important to distinguish clients with and without Premium
content, who sometimes have distinct behaviour and thus users may want to be able to separate
them when consulting the information in the dashboard. Best TV and Best Internet services are
the best service the client has in terms of Television and Fixed Internet, respectively.
Requirement number 3 relates to being able to filter the Park, Activation and Deactivation
metrics according to the equipment characteristics, similarly to requirement number 2. These
characteristics are also tied to the SA of the client: for example, the Best Router that the client has
in his SA, the Number of Boxes the client has in his SA, and so forth. They were included in a
separate requirement because they are specific to the equipment themselves. The Best Router/Box
are the best Internet and TV equipment that the client has in his house (remember the generations
of Routers and Boxes from tables 3.1 and 3.2, respectively; those dictate which Box/Router are
better) and the Number of Routers/Boxes is simply the count of the amount of equipment per SA.
Requirement number 4 is specific to the Boxes, and aims at characterizing their Park, Acti-
vation and Deactivation movements according to their Main or Multiroom nature. To this end,
Multiroom ARPU, the ARPU exclusively from Multiroom equipment, is a desired filter, along-
side with distinguishing Park movements between different periods from Main to Multiroom and
Multiroom to Main as migration movements.
Requirements number 5 and 6 are important to filter the Activation and Deactivation metrics
in specific. Starting with the "Exchange for another equipment", this is simply identifying when
a customer, in his CA, exchanged one equipment for another, in other words, replaced a Router
or Box for another Router or Box, respectively. This leads to three possible movements: an
upgrade for a better equipment, a maintenance for an equipment of the same generation or a
downgrade for a worse equipment. These movements generate a Deactivation of an equipment

24 Methodology and Project Execution
in Park followed by an Activation of a new equipment, thus being important to characterize such
movements. The "Type of Activation" can be with no sale attached, with a sale to a new client
and with a sale to a current client. If the Activation was tied to a sale, it can be done by one of
the many Sales Channels of the company, for example, from a brand owned store or a f ranchised
store. Finally, in a Deactivation it was required to understand the type of churn attached to it
and filter information according to it. Churn, the rate at which customers stop doing business
with an entity, is an important metric to track in every service company. In this case, it can be
characterized by no churn (when the Deactivation of the equipment did not lead to the customer
leaving the company), voluntary churn (when the Deactivation is tied to a customer that made a
conscious choice of leaving the company) and involuntary churn (when the Deactivation is tied to
a client that leaves the company without intending, for example, due to failing to update payment
information, credit card limits, or server errors).
Requirement number 7 was a requirement left open for the project executors to decide. Since
the dashboard is the first ever to include both Boxes and Routers, it was expected that it would in-
clude new information about relationships between Boxes and Routers. It was important, though,
that the new information had the following characteristics:
• Simplicity - The new information ought to be simple, as in, be easily interpretable by all
stakeholders;
• Usefulness - It needed to be information that the users were expected to use to fulfill their
tasks;
• Fitness - the information needed to fit the rest of the dashboard, in other words, the project
executors needed to think how the Park, Activation, Deactivation and Revenue data being
reported according to the other six requirements could now be reported differently.
In the end, after discussing with the project manager, it was decided that an information that
would make sense in this dashboard would be the "Combinations of Routers and Boxes". This
represents the total amount of Box-Router pairs, per Box and Router, that we see in each SA.
These pairs would not only be seen just for equipment in Park (Boxes and which Routers are
in Park, at the same time, for a given SA), but also for equipment Activation (which Boxes and
which Routers are Activated at the same time for a given SA) and Deactivation (which Boxes and
Routers are deactivated at the same time for a given SA). These combinations respect the three
aforementioned characteristics: Simplicity, for they are immediately understandable by all stake-
holders since service accounts are know for having both Boxes and Routers in them; Usefulness as
they represent relevant data, showing which equipment are often put together in the same service
and which are not; and Fitness as they also provide unique information using the Park, Activation
and Deactivation metrics. Furthermore, this "Combinations" concept could also be applied to the
Main vs Multiroom Box vision of the dashboard, since pairings could also be made out of these
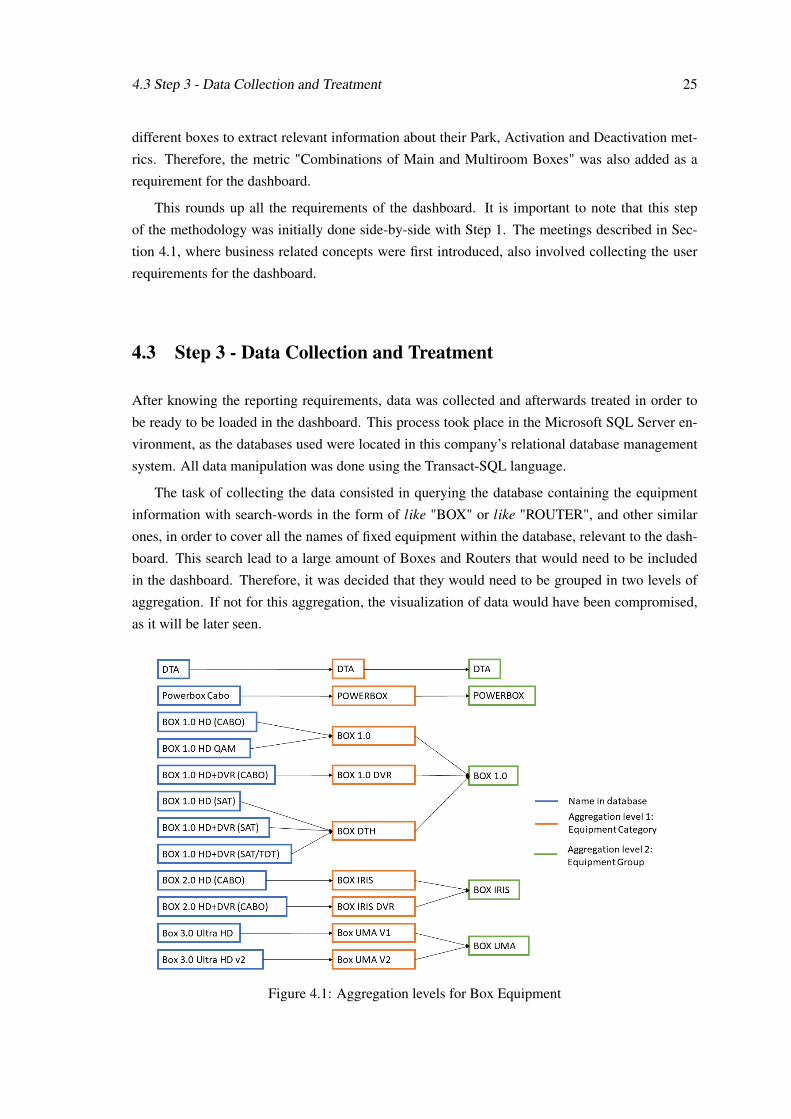
4.3 Step 3 - Data Collection and Treatment 25
different boxes to extract relevant information about their Park, Activation and Deactivation met-
rics. Therefore, the metric "Combinations of Main and Multiroom Boxes" was also added as a
requirement for the dashboard.
This rounds up all the requirements of the dashboard. It is important to note that this step
of the methodology was initially done side-by-side with Step 1. The meetings described in Sec-
tion 4.1, where business related concepts were first introduced, also involved collecting the user
requirements for the dashboard.
4.3 Step 3 - Data Collection and Treatment
After knowing the reporting requirements, data was collected and afterwards treated in order to
be ready to be loaded in the dashboard. This process took place in the Microsoft SQL Server en-
vironment, as the databases used were located in this company’s relational database management
system. All data manipulation was done using the Transact-SQL language.
The task of collecting the data consisted in querying the database containing the equipment
information with search-words in the form of like "BOX" or like "ROUTER", and other similar
ones, in order to cover all the names of fixed equipment within the database, relevant to the dash-
board. This search lead to a large amount of Boxes and Routers that would need to be included
in the dashboard. Therefore, it was decided that they would need to be grouped in two levels of
aggregation. If not for this aggregation, the visualization of data would have been compromised,
as it will be later seen.
Figure 4.1: Aggregation levels for Box Equipment

26 Methodology and Project Execution
Figure 4.1 shows the names in the database and corresponding aggregation levels for the
Boxes. The logic behind the aggregation was the following: the highest aggregation level (Equip-
ment Group) represents the 5 generations of Boxes. The first level of aggregation (Equipment
Category), the middle term between the Equipment Group and the name in the database, are the
names the Product department employees commonly use to refer to each equipment, therefore,
a must have in this dashboard. The aggregation of Routers was done with the same purposes in
mind, as seen in Appendix A.
Following the initial database query, came the data treatment. This was the task that took the
most out of the project time due to the amount of data to be treated and the complexity and details
in doing so. This task entailed three main phases:
1. Transforming the original data;
2. Adding new information;
3. Preparing for dashboard insertion.
Figure 4.2 shows a summary of the Phase 1 of data transformation. The first table extracted
from the equipment database had the characteristics of the Table 1 in Figure 4.2: each line rep-
resented a single equipment, with an Activation and Deactivation date related to it (it also had
the fields SA and CA to which the equipment belonged to, which would be important for phase
2 and 3). Note that a Deactivation date of "99-99-9999" meant that the equipment still remained
in park, yet to be deactivated. This data was then transformed to be in the desired form: each
line representing a movement type for each equipment in a given week. Let’s suppose we want
to transform the data represented in Table 1 of figure 4.2 in the desired form, starting in the first
week of 2020 and ending in the first week of June (week number 23 of 2020). First, we want to
eliminate all equipment Deactivated before the first week of 2020, therefore, Equipment ID 4 is
removed. Then, we want to transform the Activation day in an "Activation week" and a Deactiva-
tion day in a "Deactivation Week". Afterwards, this information is unfolded into a Park, Activation
or Deactivation movement type per week: the week of activation coincides with the first week in
park and the week previous to the deactivation is the last week in park. After this is done, weeks
not belonging in the time-horizon defined are removed, finally resulting in Table 2 of Figure 4.2.
Phase 2 of data transformation, adding new information, was done in two ways:
• By relating the information of the table resulting from Phase 1 (Table 2) with information
from other tables in the services database;
• By analysing the data in Table 2 and defining new variables within it.
Relating the information of Table 2 with information from other tables was necessary to collect
all the client/service characteristics plus the sales (activation) and churn (deactivation) variables, as
this data was available in various separate tables within the same database. The services database
had dozens of tables often with the same or similar information within them. In fact, sometimes

4.3 Step 3 - Data Collection and Treatment 27
Figure 4.2: Transformation of original data
it was hard to decide if it was better to use a variable from one table or a different, very similar
variable from another one. Two criteria were used to select the final variables: for one, closer
fitness to user requirements, and, for another, choosing data fields more commonly used in the
CRM-RAN department. This ensured user requirements were better fulfilled and that the data was
updated. Relating the tables was possible because the tables where the new variables existed had,
mostly, unique lines per week (or month) and SA. Since the Table 2 also had these variables, the
connection was straightforward. Some cases where more difficult, where the week and SA where
not the key attributes of the table. In this case, additional data manipulation was required to ensure
that the lines in the final table were not duplicated.
Analysing the data within the table was the way that the equipment-specific, Multiroom and
"Exchange for another equipment" related variables where calculated. These characteristics were
computed by grouping the information by SA or CA and then determining, for example, the Best
Box/Best Router found in that SA, calculating the sum of the number of Boxes and Routers found
in the SA, and so forth. Multiroom analysis is also based on determining the best Box in the SA
(the Main Box) and considering the remaining ones Multiroom. The "Exchange for another equip-
ment" was the only field not calculated by grouping per SA but by CA, as sometimes a client may,
for example, upgrade his service, and, at the same time, upgrade his equipment while changing his
SA. This movement should be flagged as an equipment upgrade because it is not a set of isolated
Activation and Deactivation movements in different service accounts, but a Deactivation driven by
the client’s desire to upgrade his service.
At the end of Phase 1, the transformed table had dozens of millions of lines with less than 10
variables. Then, at the end of Phase 2, the table had around 20 variables, with the same amount of
lines. This means that, before applying Phase 3, the table would be too big to be properly managed

28 Methodology and Project Execution
by any dashboarding software. Therefore, Phase 3 is necessary to reduce the size of the table. To
this end, four tables smaller tables were created:
• Main Table;
• Box-Router Combinations Table;
• Main-Multioom Combinations Table;
• Revenue Table;
The Main Table feeds most of the information to the dashboard. It is similar to the table at
the end of Phase 2, but it ignores the SA and CA and groups the lines by all the other remaining
variables, counting the amount of Park, Activation and Deactivation. This reduced the amount
of lines by around 90%. The Box-Router Combinations Table relates the Box-Router pairs with
the Park, Activation and Deactivation metrics. The Main-Multioom Combinations Table is very
similar to this one. Both of these tables have a few thousand lines. The Revenue Table was built
by taking from the table at the end of phase 2 all the SA that had Boxes tied to them, and then
extracting, from a different table (the revenue table), the equipment Revenue data. In the end, this
table also has a few thousand lines.
This concluded the Step 3 of the methodology. At the end of data treatment, the dashboard
was ready to be built in a dedicated software.
4.4 Step 4 - Dashboard construction
Dashboard construction is defined in this project as the process of using a software specifically
for the purposes of building a dashboard using the treated data. It consisted in using the four final
tables mentioned at the end of Sub-Section 4.3 to create a dashboard populated with numerous
visual representations of the metrics and several filters to filter the visualizations.
The dashboard was built on Microsoft Power BI, for a specific reason: it is the software of
choice in the organization. Indeed, it is the software used for every dashboard and report built in
NOS (alongside with Microsoft Excel), therefore it was the choice for this project as well. Mi-
crosoft Excel was considered but not chosen because Power BI is more powerful in dashboard
construction, having more features and easier manipulation of visuals and filters. No other soft-
ware besides Excel and Power BI were considered because it would most likely lead to a very low
acceptance or no acceptance at all of the tool.
The dashboard built in this project had several versions. The next section will show and explain
the first released versions of the dashboard, up to the final one. Then, in Chapter 5, we will take a
deeper look at the final dashboard itself.

4.5 Step 5 - User Validation and Fine Tuning 29
Table 4.1: Dashboard versions
Version Nr Week Nr Details0.1 7 First internal version, to be validated and discussed between the student and project coordinator.0.2 9 Second version of the dashboard, presented to the entire CRM-RAN team.0.3 10 Third version, with implemented feedback from presentation to CRM-RAN team.0.4 13 Version presented to the director of the CRM department, after more feedback from CRM-RAN.0.5 15 Version presented to the Product team.1.0 15 First version officially released. It could be fully accessed like any other report/dashboard of the company.1.1 16 Second official version, with weekly update and new features.1.2 17 Second official version, with weekly update and new features. The last update and upgrade by the student.
4.5 Step 5 - User Validation and Fine Tuning
The first version of the dashboard was released at the end of week number 7 of the project, and
updates are still being released after the project conclusion, as it will be later discussed. Therefore,
it is necessary to define a moment where we consider a final version for the purposes of this
dissertation. That moment is week 17 of the project, the penultimate week, because that was the
last moment where the student was responsible for the updates and upgrades of the dashboard.
Taking this into account, Table 4.1 shows the various working versions of the dashboard.
Versions 0.1 to 0.5 where internal versions, meaning that these version were not yet available
for the final users to consult them. They were subject to validation and fine tuning in several
stages: initially, just by the project coordinator, secondly, by the entire CRM-RAN team, thirdly,
by the CRM director and lastly by the Product department, the final users. This approach was
used in order to guarantee that each time it was presented to a new stakeholder, it would have
sufficient quality so as not to be rejected. Therefore, initially, when most of the work was to be
done, it was only showed to the project coordinator. After being in an OK state, it was presented to
the entire CRM-RAN team who would give advises on putting the dashboard up to the standards
of the team. These standards were tied to the colours being used and the names of the fields,
both in the visuals and filters. Then, after implementing the feedback received, it went through
the scrutiny of the CRM director, the department responsible for CRM-RAN’s work. He gave
feedback on how the Product department would most likely react to the dashboard at its current
state, indicating aspects that they would possibly miss having in the dashboard. After looking into
the director feedback and, once again, improving the dashboard, it was finally time to show it to
the Product department, as it was now expected that they would add the most valuable feedback.
The dashboard was released the day following the presentation to the Product department, with
minor changes.
Versions 1.0 to 1.2 where the first three released versions of the dashboard. Each new version
consisted of, for one, updated data from the previous week (since most of the information of the
dashboard is weekly, it was to be updated on a weekly basis) and, for another, upgrades after
receiving feedback from the Product department, who were starting to make an intensive use of
the dashboard.
Before moving into Step 6 of the methodology, an overview of each version and changes
applied to them will be discussed. In Chapter 5, Section 5.1, a deeper look of the final version of

30 Methodology and Project Execution
the dashboard will be taken, in which most of the details regarding the organization, visuals and
filters of the dashboard will be explained.
It is important to note that the data of all the versions of the dashboard has been hidden for the
purposes of this dissertation, as it is classified and only meant for internal use.
4.5.1 Version 0.1
This was the first version of the dashboard and it consisted of three simple pages: one for all
equipment, another for Boxes and another for Routers. All pages where very similar: a filter to
choose the Activation, Deactivation or Park metric on the top left, service/customer related filters
bellow them and two graphs on the right: one Stacked Bar Chart with the count of the selected
metric per equipment and a Line Chart on top of it with the totals. It is interesting to note that,
while much was still to be done, for example, separating the Boxes and Routers in different graphs
in the "all equipment" page and changing the names of the filters to more user-friendly ones (as
the ones in this version come directly from the original table from SQL Server), still some things
remained unchanged: the Activation/Deactivation/Park picker, the location of the service/customer
related filters and area dedicated to the graphs maintained their positions until the final version of
the dashboard.
Figure 4.3: Version 0.1 - All equipment page
4.5 Step 5 - User Validation and Fine Tuning 31
4.5.2 Version 0.2, 0.3 and 0.4
Version 0.2 contained some minor changes, for instance, separating, in the all equipment page,
the graphs per type of equipment: one for Routers and another for Boxes, changing the names
of the filters to clearer ones, adding new filters, grouping the equipment into the two aggregation
levels previously discussed (because, as seen in Figure 4.4, the amount of colours in the charts
makes it difficult to distinguish them properly), among others. Major changes that occurred in-
cluded removing the Line Chart that was on top of the Stacked Bar Chart, because it was deemed
redundant and unnecessary, and adding new pages: an initial introductory page with drill-down
functionalities, map pages for routers and boxes with the geographical distribution of equipment
metrics per district in continental Portugal, two pages, one for the Router-Box combinations and
another with the Main-Multiroom Box combinations and, finally, pages dedicated specifically to
Activation and Deactivation with some specific filters.
Changes between version 0.2 and 0.3 and between versions 0.3 and 0.4 were minor, consisting
mostly of implementing more user-friendly design, for example, a different colour scheme for
the combination tables. Some adjustments to the data treatment were also implemented, after
feedback from the CRM-RAN team. For example, besides the Loyalty Period, another similar
filter was also present in the dashboard at the time, the Seniority of the customer. After feedback,
it was decided that having both filters would likely confuse the users, thus, Seniority was removed.
4.5.3 Version 0.5 and 1.0
Version 5.0 of the dashboard was the first to be shown to the Product department. Changes between
version 0.4 and 0.5 happened mainly in two areas:
1. Consistency in data: some Activation and Deactivation were not considered up to that point.
For example, if an equipment was replaced due to maintenance, it was not flagged has a
Deactivation of an old equipment plus an activation of a new one. Instead, it was sim-
ply considered to be the same equipment in Park, because this movement did not actually
change the Park in terms of equipment quality. However, the CRM director pointed out
that this dashboard should consider such Deactivation plus Activation movements because
the Product team needed this dashboard to manage stock, thus, the maintenance movement
should clearly generate a Deactivation and Activation as a sign of stock rotation;
2. Characterizing Activation by sales channel and Deactivation by churn type. With the new
information from this point and the previous one, we would now have more visibility over
the reasons a client Activated or Deactivated an equipment. For example: Was it due to
maintenance? Was it an upgrade of service (which are promoted by some sales channel)?
Was the churn voluntary or involuntary?
After data consistency and movement characterization was ensured, the dashboard was pre-
sented and, later, after minor changes, released (Version 1.0).

32 Methodology and Project Execution
4.5.4 Version 1.1 and 1.2
Versions 1.1, 1.2, and any other future version released post-project conclusion, would consist of
at least one of two improvements:
1. Weekly update (mandatory) - an update of the data, with the new data from the previous
week added to the dashboard. Also, if a new equipment (Box or Router) was released
during that week, it needed to be added to the dashboard;
2. Upgrades (optional) - more functionalities that resulted from user feedback.
Versions 1.1 and 1.2 had both the weekly update and upgrades. From version 1.0 to 1.1, the
main upgrade was to consider the migration Main to Multiroom Box as a Deactivation of a Main
box and an Activation of a Multiroom Box. This way, looking back at section 3.1.4, the equation
1 can be used, making data easier to manage and validate by the users. From version 1.1 to 1.2,
the main addition was the Equipment Revenue page, the revenue related to the Boxes.
With this, we arrive at the final version of the dashboard. Chapter 5 will detail the organization,
visuals and filters of this final version.
4.6 Step 6 - Predictive Analysis
This step is related to the Forecasting Tool Goal of the project. Here, we are trying to understand if
the data that the dashboard provides allows for the prediction of near-term Activation movements
per Equipment, thus, helping fulfilling one of the main goals of the dashboard which is assisting
in stock management. With this new tool, we are looking for:
• Simplicity: the tool must be simple to use and operate;
• Comprehensiveness: it should be comprehensive, as in, it should predict the activation of
any type of equipment, even those that might be added in the future;
• Low prediction errors: while the aforementioned requirements are important, it is also de-
sirable that forecasts have a low deviation from reality.
After a discussion within the CRM department on the best way to build such predictions, it
was decided that the best forecasting methodology would be the following (a visual representation
of the methodology can be seen in Figure 4.4):
1. Predict the amount of service sales for the next weeks;
2. Calculate the percentage of each type of equipment sold per service package and, conse-
quently, using predictions from Part 1, predict the amount of equipment to be sold.

4.6 Step 6 - Predictive Analysis 33
Figure 4.4: Visual representation of the forecasting methodology
This approach is used to predict the equipment Activation that come from service sales, there-
fore, other equipment Activation sources would be explored in future projects. We can predict
the amount of equipment activation that come from service sales by combining the predictions
of the sales of the services themselves (Part 1) and and the knowledge of the average amount of
equipment activated each time a service is sold (Part 2).
Part 1 was done by, first, querying the Weekly Sales database, a database with the amount of
sales of each service package per week. From this database, the sales of each service package,
by Technology (as sales patterns known to be heavily influenced by the client Technology) and
week are loaded into Excel. Using the last 15 weeks of available data, the Linear−Holt Method
was applied, as service packages in that time-horizon showed, generally, a slight Trend (upwards
or downwards) and no Seasonality, thus, making this method more simple and effective then, for
example, a Simple Exponential Smoothing or Holt−Winters method, as tested for some of the
service packages. Parameters α and β of the Linear−Holt Method were optimized (for each
Technology - service package pair) by minimizing the average square errors of forecasts and, in
the end, resulting in the predictions for each sales package.
Part 2 was fulfilled by querying from the same Main Table that feeds the dashboard (from
Phase 3 of Step 3 of the project methodology) the amount of equipment Activated per service
package in the past week (the service package information was added to the table specifically for
forecasting purposes). This way, it is possible to calculate how many equipment are, on average,
Activated per service package sold, knowing how many service packages were sold, from the

34 Methodology and Project Execution
Weekly Sales database. With this information, and using the service sales predictions of Part 1,
we could finally arrive at the amount of equipment predicted to be Activated in the next week.
Looking at the two-part forecasting methodology, we can see that the construction of the dash-
board (the Main Table that feeds it, more specifically) was essential so as to provide the data for
Part 2, to calculate the average amount of equipment Activated per service package sold. If this
dashboard did not exist, then it would take a lot more effort to arrive at these figures: we would
need to build our own table with equipment Activation per service package from scratch and up-
date it every time we wanted data to build new predictions. With the dashboard being updated
weekly, this would pose no problem: we simply need to query its Main Table for the desirable
aforementioned variables, which are always up-to-date.
4.7 Step 7 - Project Conclusion
Finally, the last step of the methodology: the project conclusion. This last step had one goal: to
guarantee that the all the work just described would be continued by a permanent member of the
CRM-RAN team. This was achieved by the two following items:
1. Ensuring that the forecasting tool built in Step 6 could be improved in the future;
2. Guaranteeing that the dashboard would still be updated and upgraded in the future.
Item 1 was achieved by preparing a PowerPoint document that explained the current state of
the forecasting tool: the content of each page of the tool, which steps the user should take to
perform predictions and the results and conclusions of the study performed, discussed in Section
5.3 and in Chapter 6.
Item 2 was partially achieved by preparing two documents: one explaining how to do the
weekly update of the report, and another explaining how to add a new equipment, in case a new
Box or Router was released. There two documents are, in fact, standard manuals for any dash-
board or report of the CRM-RAN team: they are necessary to ensure that any person within the
team can do the basic task of updating any dashboard or report, in case that the person that is,
at the moment, responsible for such tasks, is unable to do so. These manuals follow a structured
format: they have the "Report Name", the "Report Location" within the department shared file,
the "Time To Execute" the task described in the manual, the "Dependency On Other Documents",
the "Dependency On People" from other departments, the "Necessary Resources" and, finally and
most importantly, the "Step-By-Step Description" of the task execution. The manuals previously
described ensured that the project could be updated by any person in case of an emergency. How-
ever, they don’t guarantee that any person can freely improve or make changes to the dashboard,
as these manuals do not explain the entire process of data extraction, transformation and others
preparations needed to go from the most basic, initial table to the final dashboard. In other words,
they don’t give a complete knowledge of the process behind the dashboard construction.

4.7 Step 7 - Project Conclusion 35
Inevitably, only the student has this holistic knowledge, as he was the one that built the dash-
board in its entirely. However, precautions were taken to ensure that this knowledge could easily
be transmitted:
1. The entire process was accompanied by the company supervisor, as he was called many
times to review the code behind the data treatment and help building the dashboard on its
dedicated software. This enabled him to have a good knowledge of the entire process of the
dashboard construction, which is very important because he would be the responsible for
updating and upgrading the dashboard after the end of the project;
2. The code that prepared the data was heavily commented (through written comments, next
to the code itself) so as to explain what each step of it did. This was initially done as a way
of keeping track of all the changes in the code, but, in the end, it was left up due to the
comprehensiveness it gave to every step of it.
At the end of this step, the project was deemed as concluded. In the next chapter, the results of
the project will be analysed: firstly, the final version of the dashboard will be detailed. Secondly,
user feedback of the utility of the new dashboard will be discussed. Lastly, the findings of the
predictive tool will be explored.

Chapter 5
Results
In this chapter, the results of this project will be presented. Thus, it will start by showing how
the final version of the dashboard is organized, which visuals are present and which filters are
used. Following that, the opinion two users of the dashboard, one from each of the main team
and department of interest to this project (CRM-RAN and Product), will be discussed, as well as
Power BI usage statistics that reflect how well the dashboard has been adopted in the company. To
end the chapter, the results from the forecasting tool will be assessed.
5.1 "Equipment Universe" Dashboard - Final Version
The following sub-sections detail the organization, visuals and filters of the dashboard, explaining
how they address the reporting requirements previously explored. Appendix B shows every page
of the dashboard, to aid the comprehension of the explanations provided in this section. Since the
dashboard was built in Portuguese, Appendix C provides another auxiliary tool, a table with the
translation of the fields in the dashboard coupled with a brief explanation.
5.1.1 Organization
The dashboard is organized in chapters which are then organized into different pages. The chapters
and corresponding pages are as follow:
Chapter 1: All Equipment
Page 1.a - Main Page
Page 1.b - Net Change
Page 1.c - All Equipment view
Page 1.d - Router-Box Combinations
Chapter 2: Box
Page 2.a - General view
Page 2.b - Map view
Page 2.c - Activation - detail
36

5.1 "Equipment Universe" Dashboard - Final Version 37
Page 2.d - Deactivation - detail
Page 2.e - Box Revenue
Page 2.f - Main Box-Multiroom Box Combinations
Chapter 3: Router
Page 3.a - General view
Page 3.b - Map view
Page 3.c - Activation - detail
Page 3.d - Deactivation - detail
Chapter 4: Tables
Page 4.a - Box Table
Page 4.b - Router Table
The chapters are meant to group the pages by type of equipment: The first chapter represents
data concerning all equipment, the second chapter is exclusive to Boxes while the third chapter
only has information concerning Routers. The last chapter, however, doesn’t follow this rule.
Pages 4.a and 4.b are similar to pages 2.a and 3.b, respectively, the only difference being the rep-
resentation of data: pages in chapter 4 represent data in tables while in the other pages in graphics.
The fact that pages 4.a and 4.b are the only ones in the dashboard with tabular representations led
to their separation in a different chapter at the end of the dashboard. This was done due to user
feedback, as, initially, these pages where on the chapter corresponding to their equipment type,
but users wanted a clear separation between pages displaying graphics and pages showing tables.
The chapters can be identified by their corresponding banners at the top of the page. Figure
5.1 shows the banners of each chapter, from top to bottom: chapter 1, chapter 2, chapter 3, page
4.1 and 4.2. The banners on page 4.a and 4.b (chapter 4) are the same as the banners for chapter
2 and 3, respectively, but with higher colour transparency. Every banner displays the name of
the dashboard, "Universo Equipamento", which translates to Equipment Universe and the team
responsible for it, CRM-RAN.
The pages are organized in the following way: page 1.a is the first page of the dashboard, with
information on the amount of Activation/Deactivation/Park of equipment in the most recent week,
with the possibility to choose any past week. Page 1.b is similar to page 1.a but instead of having
to choose between Activation/Deactivation/Park, the user is presented with the Net Change (the
difference between Activation and Deactivation) data. This page was added due to the feedback
of a particular user, that wanted to be able to immediately consult the Net Change data of the most
recent week without having to perform his own calculations using the Activation and Deactivation
info on page 1.a. Page 1.c shows the time series of the Activation/Deactivation/Park for all types
of equipment. The layout of these first three pages can be seen in Figure 5.2.
The layout of the "Combination" pages (page 1.d and 2.f) is displayed in Figure 5.3. In page
1.d information regarding the Box vs Router, in a specific week, is presented, while in page 2.f
this information is instead about the Main vs Multiroom Box data.

38 Results
Figure 5.1: Dashboard Banners
Figure 5.2: Layout of pages 1.a, 1.b and 1.c
Next, page 2.a introduces the weekly evolution of the Activation/Deactivation/Park metrics
specific to the Box equipment. This comes with the added benefit of filters specific to this type of
equipment. Page 3.a is similar to 2.a, but with information and filters specific to Routers instead.
As previously mentioned, the last two pages of the report are tabular representations of the data in
pages 2.a and 3.a. The similarity between the layout of these pages can be seen in Figure 5.4.

5.1 "Equipment Universe" Dashboard - Final Version 39
Figure 5.3: Layout of pages 1.d and 2.f
Figure 5.4: Layout of pages 2.a, 3.a, 4.a and 4.b
Pages 2.b and 3.b show map representations of the distribution of the Activation/Deactivation/-
Park movements of a specific week in the districts of continental Portugal, for Boxes and Routers,
respectively (Figure 5.5).
Pages 2.c and 3.c are exclusively populated with Activation data for Boxes and Router, re-
spectively. Thus, a new set of filters specific to Activation were added, and the ability to choose
between Park, Activation and Deactivation removed (from the Main Filters, more details on Sub-

40 Results
Figure 5.5: Layout of pages 2.b and 3.b
Section 5.1.3). Pages 2.d and 3.d were included with the same objective in mind, but to the
Deactivation movement instead (Figure 5.6).
Figure 5.6: Layout of pages 2.c, 2.d, 3.c and 3.d
Finally, page 2.e is the only page with monthly (instead of weekly) data and with equipment
Revenue data. Since revenue data is only relevant to Boxes, mainly Multiroom Boxes, this page
was included in chapter 2. Figure 5.7 shows the layout of this page.

5.1 "Equipment Universe" Dashboard - Final Version 41
Figure 5.7: Layout of page 2.e
To sum up, the organization of the dashboard follows the following logic: pages are first
grouped into chapters according to the type of equipment, except tabular representations which
are separate. Then each chapter starts with an overview of the data for that category, followed by
more specific details and/or filters such as Activation, Deactivation, Combinations and Revenue.
An important question remains to be answered: How does this dashboard organization relate
to the reporting requirements? The equipment Revenue requirement is addressed in page 2.e, as
that page was built around revenue data. The weekly Park/Activation/Deactivation for Boxes and
Routers requirement is addressed in all the remaining pages, each page proving unique information
according to the other requirements. Page 1.d addresses the Box-Router relations requirement,
pages 2.c and 3.c allow the user to explore the Activation in specific using its related filters, while
pages 2.d and 3.d are the in-depth view of the Deactivation. The client/service characteristics,
equipment-specific characteristics and multiroom Box characteristics requirements are addressed
using the filters that will be discussed in Sub-Section 5.1.3. The only exception was the Location,
a client/service characteristic that is instead addressed by using a different graphical representation
in pages 2.b and 3.b. This was implemented due to user feedback on the preferred way to consult
geographical data. The separation of the information in different chapters (one for Routeres and
Boxes, another just for Boxes and another for Routers) was not an explicit requirement but the fact
that different users with different tasks had different needs (some wanted to consult both Router
and Box together, others just Boxes and others just Routers) lead to that separation to more easily
guide the user in finding the information he/she is looking for.
Up to this point, understanding the Dashboard organization has been the aim. In the next
Sub-Sections, a deeper look into the visuals and filters used in the Dashboard will be taken.

42 Results
5.1.2 Visuals
The visuals are perhaps the most important aspect of any dashboard, because they allow the user
to visualize and interpret the raw data. Given its importance, naturally, the area dedicated to the
visuals and their elements, such as title and legend, occupy from 55% to 80% of each page (as it
can be seen from the black squares in Figures 5.2 to 5.7), with the visual itself occupying most of
that area.
Please note that the data represented in this dissertation is not real, as real data is sensitive and,
thus, only meant for internal use. However, only the data values themselves have been altered,
other aspects such as data labels and titles are the same as in the real dashboard.
Visuals can be divided into two groups:
1. Static Visualizations - These visualizations only represent a single week of data at a time.
In this dashboard, there are Simple Bar Charts (pages 1.a and 1.b), 100% Stacked BarCharts (pages 1.a and 1.b), Basic Maps (pages 2.b and 3.b) and Heat Maps (pages 1.d and
2.f) that fit in this group.
2. Time Series Visualizations - Visualizations that show a Time Series. This dashboard repre-
sents such data through Stacked Bar Charts (pages 1.c, 2.a, 2.c, 2.d, 2.e, 3.a, 3.c and 3.d).
Other than that, the Tables in pages 4.a and 4.b also display data by equipment (columns)
and week (lines).
5.1.2.1 Simple Bar Charts and 100% Stacked Bar Charts
The first two pages of the dashboard, 1.a and 1.b, display info with a couple of Simple Bar Charts
and a couple 100% Stacked Bar Charts.
Figure 5.8 shows the Visuals on the first page of the dashboard. This page has two pairs of
each type of graph, one for each type of equipment. Within each pair, the Simple Bar Chart on
the left displays the total amount of Park/Activation/Deactivation per equipment in the selected
week. This graph has drill-down capabilities, going from the Equipment Group to the Equipment
Category to the Name in the database (remember Figure 4.1 and its explanation in Section 4.3).
The 100% Stacked Bar Chart on the right displays the weight of each Equipment Group within
the selected metric (Total Park/Activation/Deactivation). The second page has the same graphics,
but instead of allowing to chose from Park/Deactivation/Activation, it displays the Net Change,
the difference between Activation and Deactivation for each equipment.
Simple Bar Charts and 100% Stacked Bar Charts were included in the first two pages to allow
the users to quickly see the Park, Activation, Deactivation and Net Change data in the most recent
week. These kind of static visualizations have advantages over the Stacked Bar (used for Time Se-
ries Visualization): Simple Bar Charts allow drill down between the different levels of equipment
aggregation and 100% Stacked Bar Charts allow to see the weight of each Equipment Group in
the Park/Activation/Deactivation/Net Change of that specific week. The major disadvantage is the

5.1 "Equipment Universe" Dashboard - Final Version 43
Figure 5.8: Visuals on page 1.a
impossibility to visualize the time series. As time series visualization was one of the most required
aspects of the dashboard, these two types of charts were only used as an introduction.
Other graphs could have been used to represent the same data, for example, Pie-Charts or Tree
Maps. Simple Bar Charts and 100% Stacked Bar Charts were selected for users preferred Bar
Charts over other representations.
5.1.2.2 Basic Maps
Pages 2.b and 3.b display Basic Maps, that show the distribution of the selected metric (Total
Activation/Deactivation/Park) per Equipment Category in a given week, by district of Continental
Portugal. Customer’s location was grouped by District and not other territorial divisions, for
example, NUT, due to user preference. Drill-down from District to Municipality was not included
due to being deemed unnecessary by the users. Figure 5.9 shows the Basic Map of page 2.b,
concerning the Box Park data in a certain week.
The use of these Maps brings the main advantage of allowing the user to visually compare the
distribution of metrics by location and immediately observe their differences. Looking at Figure
5.9, for example, it is clear that the district of Porto has a lot more equipment in Park than the
others currently appearing in the map, by looking at the diameter of its Pie-Chart. Also, Porto and

44 Results
Figure 5.9: Visual on page 2.b
Braga, compared to other districts, mainly the interior ones, have a lower percentage of equipment
in Park with DTH Technology (recall that the only Box with DTH technology is "BOX DTH").
These insights are not possible using the other visuals present in this dashboard. Other graphics
could be used to replicate the same information, for example, a Stacked Bar Chart with the District
on the X-axis and the amount of metric on the Y-chart by Equipment Type, but the geographical
distribution of the Districts is lost.
5.1.2.3 Heat Maps
Heat Maps are present in the Combination pages: the Box-Router Combinations (1.d) and the
Main-Multiroom Box Combinations (2.f). They are displayed in blue colours: the darkest blue
represents the most common combination while the lightest the least common. This way, the most
and least common combinations of Box-Router and Main-Multiroom box can be easily identified.
There are two aspects to note: for one, maps on both pages have drill-down capabilities from the
Equipment Group to the Equipment Category to the Name in the database. For another, besides
combinations between Box-Router and Main-Multiroom Boxes, it also identifies isolated equip-
ment: for example, if there is a Box with no Router tied to it in the same SA, it will group the Box

5.1 "Equipment Universe" Dashboard - Final Version 45
Figure 5.10: Visual on page 1.d
with another category called "Without another Equipment".
To assist in retrieving data from the Heat Map, an auxiliary table listing the combinations from
most common to least common is displayed at the bottom of the heat map.
This was the type of visualization chosen to portray the Combinations of Router-Boxes and
Main-Multiroom Boxes that are in Park or Activated or Deactivated simultaneously, in the same
SA, in a given week. This data could be represented differently using other charts like bar charts,
pie-charts or tree maps. However, the main advantage of this kind of map is that it allows users to
identify groups of combinations, for example, looking at Figure 5.10, we can see that "HUB 3.0"
forms two groups, a clear one with "BOX IRIS", "BOX IRIS DVR" and "BOX UMA V1" and
another less clear one with "DTA" and "POWERBOX".
5.1.2.4 Time Series Visualization - Stacked Bar Charts
The Stacked Bar chart is the most common sisualization on the report. In fact, every page that
displays a time series has this type of graphic. Figure 5.11 shows an example of such graph,
displaying the amount of Activation for Routers from week number 1 until week number 22 of
2020.
In every Stacked Bar Chart in the Dashboard, the horizontal axis displays the time, in weeks (in
most pages) or months (only in page 2.e). The vertical axis displays the Sum of the metric picked
(Park/Activation/Deactivation in most pages, or Park/Revenue Increase/Revenue Decrease in page
2.e). The column series are either the Equipment Group (in page 1.c), the Equipment Category (in
pages 2.a, 2.c, 2.d, 3.a, 3.c and 3.e) or the Equipment ARPU interval (in page 2.e). At the bottom
right of every graph, there is a filter that lets the user pick any set of Equipment Group/Equipment
Category/Equipment ARPU interval that he wants to display. This, coupled with the other filters
on each page, gives the user numerous ways to consult the information, tailored to his needs.
The graphics just described allow the users to consult the data according to the two first re-
quirements explored in section 4.2. They can see the time series of the Park/Activation/Deacti-
vation per type of box or type of router and the time series of the Revenue per equipment ARPU

46 Results
Figure 5.11: Visual on page 3.c
Figure 5.12: Alternative Visual for page 3.c - Line Chart
(thus, distinguishing clients that paid more or less equipment revenue). Can this information,
however, be transmitted using other visuals? For example, why not use Line Charts, commonly
used for time-series analysis? In this case, Stacked Bar Charts make more sense because users
are looking for the weekly total amount of the metric, both for all Equipment and per Equipment
Category or Equipment Group, and Stacked Bar Charts portray this combined information more

5.1 "Equipment Universe" Dashboard - Final Version 47
Table 5.1: Filters
Group Filter Type of selection Variable type
Main FiltersActivation/Deactivation/Park Single selection CategoricalWeek or Time-horizon Single or multiple selection Time
Client/Service Filters
Area Multiple selection CategoricalTecnology Multiple selection CategoricalSegment Multiple selection CategoricalProfile Multiple selection CategoricalTotal ARPU Multiple selection Numerical ContinuousPremium ARPU Multiple selection Numerical ContinuousLoyalty Period Multiple selection CategoricalMonths until the end of LP Multiple selection Numerical Discrete
Combination FiltersBox&Router selector Multiple selection CategoricalOR Main&Multiroom Box selector Multiple selection Categorical
Box Filters
Nr of Boxes in SA Multiple selection Numerical DiscreteBest Box in SA Multiple selection CategoricalBest TV service Multiple selection CategoricalMain/Multiroom Multiple selection CategoricalMain-Multiroom Migration Multiple selection CategoricalMultiroom-Main Migration Multiple selection CategoricalMultiroom ARPU Multiple selection Numerical Continuous
Router FiltersNr of Routers in SA Multiple selection Numerical DiscreteBest Router in SA Multiple selection CategoricalBest Internet service Multiple selection Categorical
Activation FiltersActivation Type Multiple selection CategoricalSales channel Multiple selection CategoricalExchange (activation) Multiple selection Categorical
Deactivation FiltersChurn Multiple selection CategoricalExchange (deactivation) Multiple selection Categorical
easily than Line Charts. Figure 5.12 shows how the visual in Figure 5.11 would look like using
Line Charts (without totals and data labels): the time series per Router Category are more clear,
as each is represented in its own line, and thus weekly increases and decreases of the metric per
Router Category are more understandable. However, the data labels would more are difficult to
read (as they would overlap), and, if the line with all Routers (the total) was also represented in
the graph, it would either dwarf the other lines or have to be represented in a secondary Y-axis,
mixed with the remaining lines, making its interpretation more difficult.
With this, all visuals present in the report have been explained. Next, we will look to the
dashboard filters.
5.1.3 Filters
Filters are the second most important aspect of the dashboard. While the visuals enable the visual-
ization of data series, filters are the main source of flexibility, as they change the data series being
presented according to their selections.
Table 5.1 shows the summary of the filters in the report. Column "Group" shows the group to
which each filter belongs to, while columns "Type of selection" and "Variable type" pertain to the

48 Results
type of selection allowed in the filter and the type of variable that the filter uses, respectively. In
Figures 5.2 to 5.7, we can see the location of each filter group in each page.
The Main Filters are the filters that manipulate the metric to be displayed and the time-
horizon. The Activation/Deactivation/Park pickers only enable a single selection, therefore, the
visualizations will only display either the Park, Activation or Deactivation (it wouldn’t make sense
any other way since the three different metrics cannot be summed). The Time-horizon picker de-
pends on the type of visual in the page: if it is a static visual, then it will also be a single-week
selector, otherwise, if it is a time series visualization graph, then multiple contiguous weeks may
be chosen. Every filter that is not a Main Filter enables multiples selections, because grouping is
possible in every other variable, and the user should be able to do so freely.
The Client/Service Filters enable the user to filter the metrics according to the characteristics
of the service the client has, as in requirement number 3 of Section 4.2. These characteristics have
already been discussed in that section. An important note though: the Numerical Continuous or
Numerical Discrete variable types have been previously binned during data preparation. There-
fore, the filters enable the user to filter those variables by intervals. This was done for two reasons:
one, because these Numerical variables had hundreds of different values, which would make it
difficult to use in the "drop-down list" filters used in most of the report; two, users are already used
to having those variables in bins in other reports.
The Combination Filters allow to choose which Category or Group of Equipment is to be
displayed in the Heat Maps of pages 1.d and 2.f. The colours of the maps will automatically adjust
to a new maximum or minimum, according to the data being displayed.
The Box, Router, Activation and Deactivation Filters answer requirements number 4 (Box
and Router), 5 (Box - the Multiroom related filters), 6 (Activation) and 7 (Deactivation). Here, in
these groups of filters, the Numerical Discrete variables have not been binned in data preparation,
for the Number of Boxes or Routers in a SA is never bigger than 15, making it easy for users to
use the variables as they originally are.
Finally, the Filters on page 2.e. They were not included in Table 5.1 for they are similar to
some of them. The page also has both Main Filters but instead of Activation/Deactivation/Park,
the user has to pick between Revenue Increase/Revenue Decrease/Park. Park, in this page, is the
total amount of revenue that the clients who have Boxes in Park pay for their equipment. The
increases and decreases in revenue are increases and decreases, respectively, of the amount that
the clients pay for their Boxes. Other than the Main Filters, this page also has all the Client/Service
Filters, equal to the ones in other pages, as well as the Main/Multiroom filter from the Box Filters,
that lets the user pick if he wants to see the Revenue of all Boxes, just the Main Boxes or just
the Multiroom Boxes (although most of the Revenue relates to Multiroom Boxes, there are some
exceptions where a Main Box also has its own revenue, similarly to a Multiroom Box).

5.2 "Equipment Universe" Dashboard - Stakeholders opinion and utilization statistics 49
5.2 "Equipment Universe" Dashboard - Stakeholders opinion andutilization statistics
The final version of the dashboard has just been discussed, but the analysis of its results still lacks
an important reflection: How well has the dashboard been adopted in the company. To understand
the impact of the dashboard in the organization, two tasks were undertaken:
1. Interviews to a representative of the CRM-RAN, the team responsible for the project, and
to a representative of the Product department, the final users of the report;
2. Collection of report usage metrics from Power BI, starting from the first official version of
the report, version 1.0, up until one to two weeks after the project conclusion.
Both interviews followed a similar guideline, which started by asking the interviewee to
present himself and his team, then followed with a series of questions about the dashboard built
in this project. The two interviews are fully in Appendix D. Next, follows a summary of the main
opinions expressed by each interviewee, divided by topics.
• Motivation behind the dashboard
The CRM-RAN representative was the team director himself, responsible for overseeing the
work of the 6 employees that composed the team. As the team responsible, he stated that the
motivation behind this project was the poor management of the equipment business so far in
the company, and the responsibility that his team had in providing valuable information that
allowed to do so. Since equipment are not a main business line but an enabler, it had been
forgotten in terms of Business Intelligence. However, equipment need a good management
as suppliers are located in Asian countries and, thus, delivery times are very long, which may
compromise the company strategy if not carefully planned. The Product team representative
was the responsible for the Television Products team. For him, the motivation that lead to
the commission of the project was the fact that "the equipment vision of the business did
not exist", there was a lack of information on this area to help decision-makers. Specifically
to the Television Product, the Multiroom vision was something he was looking forward to
being addressed, since NOS was starting to invest more time and resources to build a solid
strategy that could penetrate their customers secondary screens, besides the main screen in
the living room.
• Success in meeting expectations
For the CRM-RAN team leader, the dashboard delivered at the end of the project was able
to answer "many of the questions that had no answer to before". He mentions the periodicity
that the new information is delivered (weekly) and the fact that the report puts together and
crosses (thorough the "Combination" pages) in the same tool information about Routers
and Boxes as a major feature and success factor. Also, importantly, the information being
reported was validated by the users, so the process of data treatment was trusted by the

50 Results
stakeholders. Likewise, the Product department representative stated that "this dashboard
clearly meets the requirements we had of being able to, every week, look to the numbers
and understand how the business is evolving", something that was impossible before and
had to be done by looking report by report and calculating not-so precise metrics based on
the scrambled information.
• Most important feature and/or contribution of the dashboard
The CRM-RAN representative reiterated that the most important aspect was the periodicity
at which the data was arriving and that the data itself was "stable and true". Also, an inter-
esting side effect was highlighted: now, the data regarding equipment would be put on the
spotlight, calling for improvements on its collection and treatment from the IT department,
and this would benefit not just the dashboard, that would be fed better data, but also any
other report or analysis on the equipment business. For the Televison Product responsible,
the fact that the dashboard provides a static vision (Park) coupled with the dynamic vision of
the Activation and Deactivation in a single report is the most interesting aspect, as that was
not common in most reports in the organization. Besides that, the various filters and pages
of the dashboard (mainly churn, net adds, revenue and distinguishing Main from Multiroom
Boxes) enables the users to do more focused analysis, such as the one that the Multiroom
business requires.
• Improvements to be made or added
As responsible for guaranteeing a good development process, the CRM-RAN leader would
not change anything in the current dashboard as the methodology behind its construction
deeply involved all stakeholders, therefore, the final version of this project was no surprise to
no one in terms of its quality and meeting the initial requirements. The Product department
representative expressed a similar opinion. Both pointed to the revenue side of the report
as the main point to improve in the future, as it is essential to not only know the amount
of equipment and their variation through time, but also their impact in terms of value to the
company: is value being created or destroyed? To calculate that, revenue data is of utmost
importance.
• Impact on the day-to-day work of their respective teams
To what concerns the CRM-RAN team, the dashboard would alleviate a lot of the routine
work that the team had to do for the Product team because they would now be able to
self-service their own needs through the dashboard. Besides that, due to the fact that the
data feeding the dashboard had been recently studied, future equipment analysis done by
the team was now facilitated as the data understanding stage is now simplified. For the
Television Product team in specific, "everything" changed with the new report because, at
the moment, as the focus of his team was the multiroom business management and, since,
before the dashboard, information was poor or non-existent, the quality of the work being
developed on his department has been greatly elevated.

5.2 "Equipment Universe" Dashboard - Stakeholders opinion and utilization statistics 51
• Dashboard continuity and future
Both interviewees expressed the opinion that the dashboard was just the beginning of a
continuous process of improving the BI infrastructure behind the equipment business. On
the CRM-RAN team, the new dashboard was of great importance as it now joined a set
of three structural reports performed by the team. For the Product team, the need for the
dashboard had long existed, even if ignored for a while, and it would continue to exist in
the future. To sum up, both parties showed invested in keeping improving the dashboard
and using it in the future. As the CRM-RAN director put it: "This was not a project just to
entertain a student, clearly it came to be disruptive in our reality".
Overall, the opinion of both interviewees was positive, with prospects of continuing improving
the tool in the near and far future. It is important to point out that this project was carried at a stage
of low data maturity in the equipment business management of the company. Therefore, the main
idea expressed by both stakeholders interviewed was that the fact that this tool existed in the first
place, fully answering to the requirements for this project, was already something very disruptive
and an important foundation for the future of equipment management.
Looking at the report usage metrics from Power BI, in Figure 5.13, it is clear that the dashboard
has been continuously used throughout time. Its utilization was most common from its launch up
to the start of the last week of the project, mostly in terms of unique viewers. This was likely
because the dashboard was being tested and improved (Stage 5 of the methodology, Validation
and Fine Tuning), therefore, users were more active to find errors and provide feedback. Then, the
utilization lowered in the following week, for two reasons:
1. The last week of the project had two national holidays, consequently, the users did not work
for about half of the week;
2. This was the period of transition of responsibility over updating and upgrading the dash-
board (Stage 7 of the methodology, Project Conclusion), between the student that carried
the project and a permanent member of the CRM-RAN team, therefore, the weekly update
was launched latter into that week.
We can see that after the project conclusion the dashboard utilization started increasing again,
with a peak of views per day on around 1,5 weeks after the project conclusion. This shows that
the users are still actively using the dashboard, even after the project conclusion. Looking at the
views per user (bottom right, the column was duplicated to facilitate reading the values), we can
see that the seven users represented have more than 10 views over the entire period. All of these
seven users are members of the Product department, thus highlighting the impact that the report
had in it. These seven dashboard users represent 1/3 of the department. The user with 46 views is
the department director, while the user with 38 views is the previously interviewed responsible for
the Television Product team. Two other users not listed, from the CRM-RAN team, have 5 or more
views, while the remaining viewers only consulted the dashboard once. All in all, the dashboard,
during the period being analysed, had a total of 194 views from 12 different viewers.

52 Results
Figure 5.13: Power BI Report Usage Metrics
5.3 Forecasting tool
The 2-stage methodology explained in chapter 4.7 was applied to build the forecasting tool re-
quired as the dashboard follow-up goal. After its completion, it was tested to predict, for six
consecutive weeks, the Activation amount of each equipment. For stage 1, a 15 week parameter-
ization horizon was used to forecast the amount of service package activation for the following
period. For stage 2, only one week (the most recent, the one immediately prior to the one being
forecasted) was used to calculate the average amount of each equipment per activated package.
Figure 5.3 shows a visual representation of the time-windows used at each stage of the methodol-
ogy, and the forecasting period. Note that the prediction made for each week was compared with
the actual value of the following week, as it is usual when predicting one week in advance.
After applying the 2 stages for the 6 weeks, results were obtained. Figure 5.15 shows the
results of the most activated equipment, "Box Ultra HD V2". The graphics for the remainder
equipment can be consulted in the figures of Appendix E.
The error of the predictions depended largely from equipment to equipment (see Table E.1 on
Appendix E). Overall, considering all equipment over the 6-week period, the mean error (ME) was
39 units and the mean absolute error (MAE) 46 units. Comparing these two values, it is clear that
the forecasts are biased, usually being lower than the actual activation values, as a quick review of
the graphics will confirm. The mean absolute percentual error (MAPE) was 29,7%, therefore, the
tool still has much to be improved in the future.

5.3 Forecasting tool 53
Figure 5.14: Predictions framework
Figure 5.15: Predictions vs actual activation for Box Ultra HD V2
Chapter 6
Conclusions and Future Work
This project had a set of interesting challenges that made it not only important as a dissertation
project, but also to the organization where it was developed. Indeed, as mentioned throughout this
document, this project came to address a long-time need of the company.
NOS, as any large telecom company, has a strong affinity to Data Science and Business In-
telligence. New information on the organization’s clients and services is updated on a weekly or
even daily basis, letting decision makers know how much each service package is selling, how
many new subscribers were being added, how many were leaving the company, the revenues and
costs related to those movements, among other metrics. All of this was possible due to a strong
IT structure in those fronts, with databases being continuously updated, renewed and improved.
This allows for the construction of powerful reports and dashboards that, in turn, allow for an
easy visualization of data and KPI’s, as well as feeding numerous analysis that, when considered
as a whole, enable the company to know how to position itself in the market in terms of service
offerings, content distribution and pricing policies.
However, this reality was much more different when it came to Equipment Management.
Equipment Management, up to this point, was an afterthought compared to Service Management.
Every information collected regarding equipment came as a direct need for managing services.
Therefore, the aforementioned weekly/daily new information was non-existent for equipment
specifically, and there was no IT structuring approach tailored to the Equipment Management.
Knowing this reality, and knowing the challenges of an effective Equipment Management and the
consequences of a poor one, the company decided it was time to address this issue. The first
step was this project, whose aim was mostly to deliver an holistic dashboard that could accom-
pany all fixed equipment park and movements, and that allowed the users to navigate through the
information using a different set of visuals and filters tailored to their needs.
To this end, the project was a success. As expressed in the opinion of the interviewed stake-
holders, this dashboard allowed the Product department, responsible for managing equipment, to
go from a reality where decision-makers had to consult numerous reports and dashboards to col-
lect numerous data and, with it, calculate average values and perform other calculations to arrive
at a similar figure to the one they were looking to find, to a completely different one, where they
54

Conclusions and Future Work 55
knew that, each week, new information on operational performance was coming in through the
Equipment Universe dashboard, and that it had been previously carefully treated and distribut-
ed/displayed in an easy-to-use tool. The dashboard has the flexibility that allows user to do more
macro-level analysis on the overall Box or Router park and movements or go to more specific
analysis, such as the Multiroom Box business follow-up.
This success did not come without its difficulties. Most of them came as a direct consequence
of this being the first step of a new paradigm in Business Intelligence to manage equipment. The
data used to build this dashboard came mostly from a database with client and service informa-
tion, where equipment specific data was almost non-existent. This made the development process
slower than it ought to be, as every data field had to be checked for its quality and fitness to the
dashboard being built. Perhaps this issue in the data infrastructure should have been the first step
of the new Business Intelligence paradigm, instead of moving straight to the dashboard develop-
ment. As the interviewee from the Product department mentioned, "the dashboards cannot live
isolated from the rest of the company" and "from the starting point, we should identify what are
our reporting necessities and communicate them to the IT department. (...) It is of utmost im-
portance that this need is passed to the IT guys, so that they, when developing their offerings and
configurations, can provide information that can be used by the people that are using the data, in
this case, the CRM-RAN department that you worked on".
Although data infrastructure is clearly something to work on in the future, this project can
actually be seen as a first step, a catalyst, for those improvements. The interviewee from the
CRM-RAN team expressed the opinion that "it is much easier to defend the idea that better data
is needed inside our team and to the infrastructure team that is responsible for it when I say: this
tool already exists and I want to improve it because it is very useful; then saying: I need this data
to create a new tool; in this case, people are not sure if the tool will actually end up being built".
This could mean that the new dashboard will actually work as proof that data is missing or that
data is needed and it will encourage the IT department to work on addressing this matter.
One aspect mentioned by the users that ended up lacking in the dashboard was the revenue
information. Although present in the final version discussed in this dissertation, revenue data was
added right at the end of the project, due to an increased demand for it, even if the information
itself did not fit the requirement of the dashboard of having weekly information. This is also
another point for future improvements: to better the revenue information, by, one, by replacing
the monthly data with weekly data when it becomes available, two, use the equipment revenue by
equipment instead of by SA, which did not exist and would better fit the dashboard, and, three,
by finding ways of tying some of the revenue and costs that come from providing a service to the
equipment itself, instead of designating it entirely to the service as it is done as of this moment. If
this is reflected in the dashboard, then the tool would become much more complete, providing not
only information on the amount of equipment and its variations, but also the actual added value
they bring to the company.
Other future work that the dashboard is subject to is adding new equipment, not only new
Boxes and Routers but also other types of equipment, for example, Routers (once they complete

56 Conclusions and Future Work
transitioning they business model, as discussed in Chapter 3).
Looking the forecasting tool, clearly there is much to be improved before it can be used on
a regular basis. For example, the 2-stage methodology should be reviewed, because although it
may be a good approach to forecast the amount of equipment sold through some sales channel,
it may not be as accurate for others. This is because some sales channel are reactive, as in, it is
the customer that takes the initiative to subscribe to a new service. In these reactive channels, it
makes sense to apply the 2-stage methodology as, when selling a service, it may come with one
or another equipment, usually the one available that is less costly to the company, that can provide
the agreed service. Other sales channel are proactive, in other words, the company takes the first
step to contact the customer or possible future customer to sell a new service. In those channels,
the company already knows beforehand what equipment they want to offer the customer but, at
the same time, the client may not accept the offer. Therefore, in this situation, the forecast should
be based on the equipment that is indexed to a targeted client and the probability of the client
accepting the offer, instead of the average amount of equipment activated per service package sold.
Besides that, other aspects to be worked on are the forecasting methods utilized. The Linear−Holt
was the method used as it is simple and applies to most of the time series of the service packages
sold, but other methods may be better suited for service packages with other time series patterns.

Bibliography
Abraham, B. and Ledolter, J. (2009). Statistical methods for forecasting, volume 234. John Wiley& Sons.
ANACOM (2020). "Factos e Números 2019". https://www.anacom.pt/streaming/Factos_Numeros2019.pdf?contentId=1522084&field=ATTACHED_FILE. (ac-cessed May 02, 2020).
Aronsson, H. (2015). Modeling strategies using predictive analytics: Forecasting future sales andchurn management.
Aruldoss, M., Travis, M. L., and Venkatesan, V. P. (2014). A survey on recent research in businessintelligence. Journal of Enterprise Information Management.
Few, S. and Edge, P. (2007). Data visualization: past, present, and future. IBM Cognos InnovationCenter.
Hyndman, R., Koehler, A. B., Ord, J. K., and Snyder, R. D. (2008). Forecasting with exponentialsmoothing: the state space approach. Springer Science & Business Media.
Ishaya, T. and Folarin, M. (2012a). Business Intelligence in Telecoms Industry: A Service OrientedApproach, volume 29.
Ishaya, T. and Folarin, M. (2012b). Business intelligence in telecoms industry: A service orientedapproach. In Catalan-Matamoros, D., editor, Advances in Customer Relationship Management,chapter 8. IntechOpen, Rijeka.
LaPointe, P. (2005). Marketing by the Dashboard Light: How to Get More Insight, Foresight, andAccountability from Your Marketing Investments. ASSOCIATION OF NATIONAL ADVER-TISERS.
Li, S. T., Shue, L. Y., and Lee, S. F. (2008). Business intelligence approach to supporting strategy-making of ISP service management. Expert Systems with Applications, 35(3):739–754.
Lousa, A., Pedrosa, I., and Bernardino, J. (2019). Evaluation and Analysis of Business Intelli-gence Data Visualization Tools. In 2019 14TH IBERIAN CONFERENCE ON INFORMATIONSYSTEMS AND TECHNOLOGIES (CISTI), Iberian Conference on Information Systems andTechnologies, 345 E 47TH ST, NEW YORK, NY 10017 USA. IEEE. 14th Iberian Conferenceon Information Systems and Technologies (CISTI), Coimbra, PORTUGAL, JUN 19-22, 2019.
NOS SGPS (2020). "Relatório e Contas 1T20". https://www.nos.pt/institucional/Documents/Reportes%20Financeiros/Relat%C3%B3rio%20e%20Contas%201T20%20PT.pdf. (accessed April 26, 2020).
57

58 BIBLIOGRAPHY
Pauwels, K., Ambler, T., Clark, B. H., LaPointe, P., Reibstein, D., Skiera, B., Wierenga, B., andWiesel, T. (2009). Dashboards as a service: Why, what, how, and what research is needed?Journal of Service Research, 12(2):175–189.
Zeithaml, V., Bolton, R., Deighton, J., Keiningham, T., Lemon, K., and Petersen, J. (2006).Forward-looking focus: Can firms have adaptive foresight? Journal of Service Research - JSERV RES, 9:168–183.

Appendix A
Aggregation levels for RouterEquipment
Figure A.1: Aggregation levels for Router Equipment
59

Appendix B
Dashboard pages
Figure B.1: Page 1.a
60
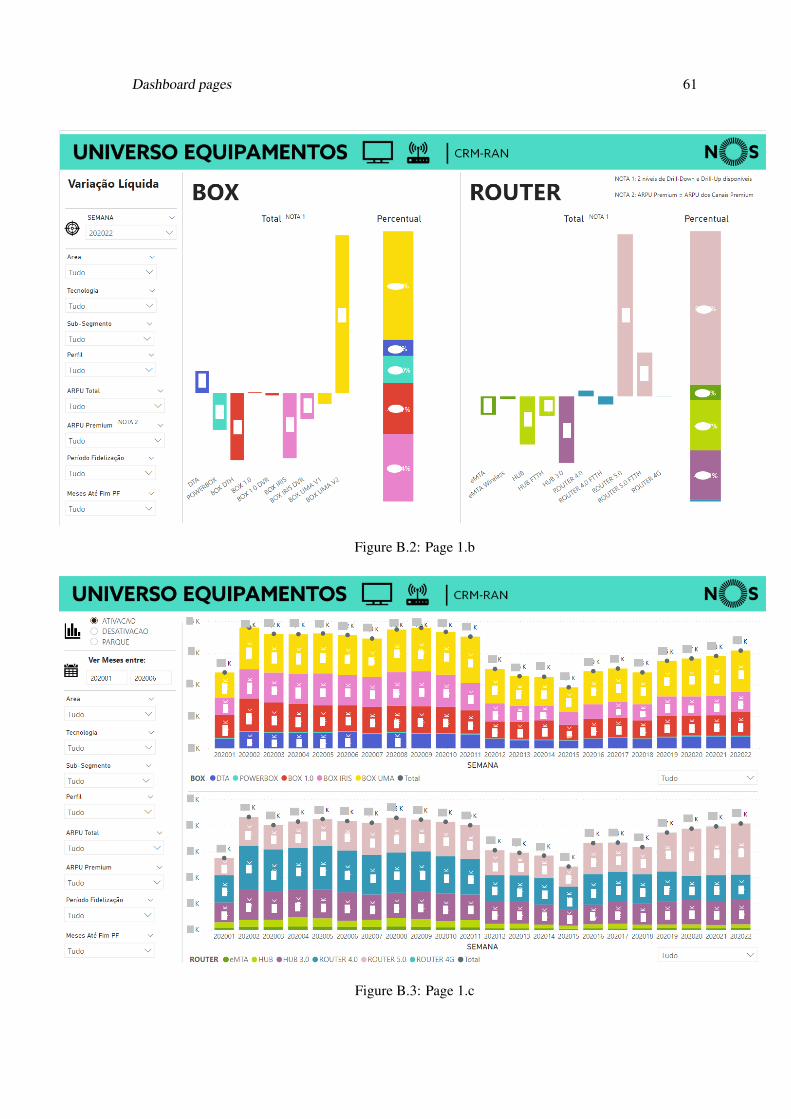
Dashboard pages 61
Figure B.2: Page 1.b
Figure B.3: Page 1.c

62 Dashboard pages
Figure B.4: Page 1.d
Figure B.5: Page 2.a

Dashboard pages 63
Figure B.6: Page 2.b
Figure B.7: Page 2.c

64 Dashboard pages
Figure B.8: Page 2.d
Figure B.9: Page 2.e

Dashboard pages 65
Figure B.10: Page 2.f
Figure B.11: Page 3.a
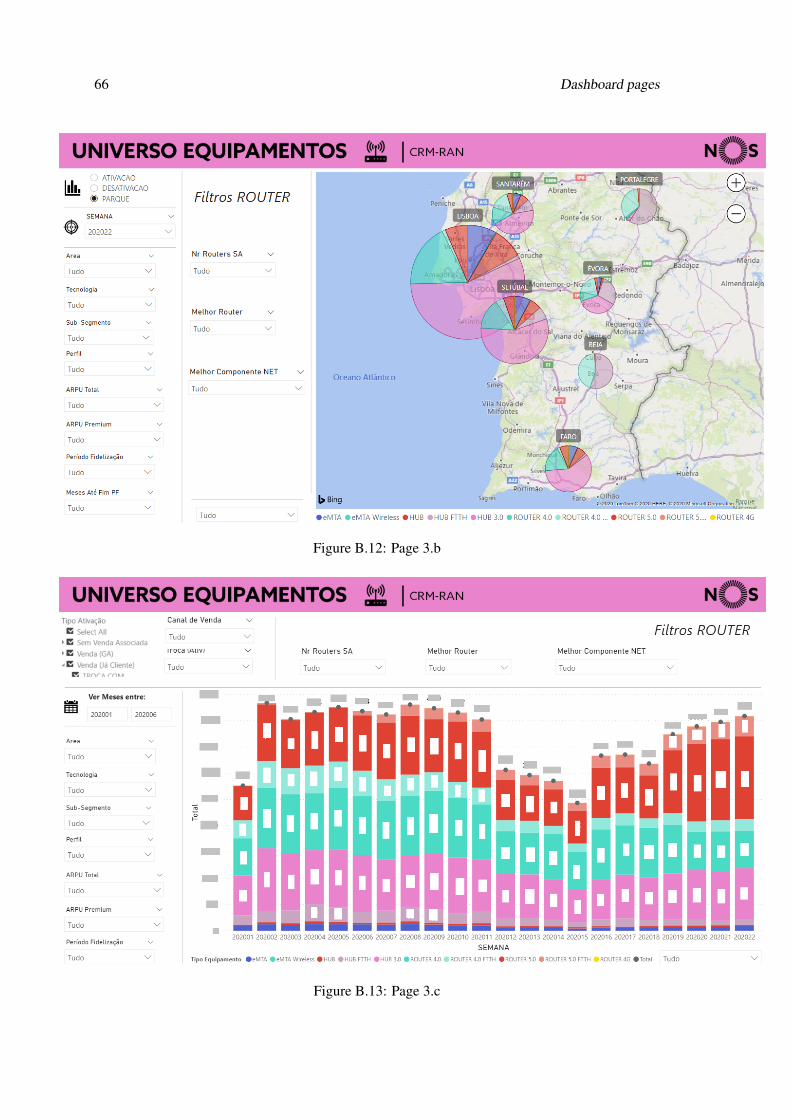
66 Dashboard pages
Figure B.12: Page 3.b
Figure B.13: Page 3.c

Dashboard pages 67
Figure B.14: Page 3.d
Figure B.15: Page 4.a

68 Dashboard pages
Figure B.16: Page 4.b

Appendix C
Dashboard fields translation andexplanation
69

70 Dashboard fields translation and explanation
Table C.1: Dashboard fields translation and explanation
Field Name in English ExplanationArea Area Client/Service filterARPU Box Equipment ARPU Column Series in graphs of page 2.eARPU Multiroom Multiroom ARPU Box filter (for Multiroom analysis)ARPU Premium Premium ARPU Client/Service filterARPU Total Total ARPU Client/Service filterAtivacao Activation Dashboard metricAumento Receita Revenue Increase Dashboard metricCanal de Venda Sales Channel Activation filterChurn Cliente Client Churn Deactivation filterCombinações mais frequentes Most frequet Combionations Title of list with most frequet CombinationsCombinações Principal-Multiroom Main-Multiroom Box Combionations Title of graph with Main-Multiroom Box CombinationsCombinações Router-Box Router-Box Combinations Title of graph with Router-Box CombinationsDesativacao Deactivation Dashboard metricDiminuição Receita Revenue Decrease Dashboard metricFiltros Box Box Filters Some of the Box related filters, excluding Multiroom analysisFiltros de Combinações Combinations Filters Combinations filtersFiltros Multiroom Multiroom Filters Some of the Box Filters, specific for Multiroom analysisMelhor Box Best Box Box filterMelhor Componente Net Best Internet Service Router filterMelhor Componente TV Best TV Service Box filterMelhor Router Best Router Router filterMes Month Time unit represented on X-axisMeses até Fim PF Months until the end of Loyalty Period Client/Service filterMigração Multiroom-Principal Multiroom-Main Box Migration Box filter (for Multiroom analysis)Migração Principal-Multiroom Main-Multiroom Box Migration Box filter (for Multiroom analysis)Multiroom Multiroom Box Columns of Main-Multiroom Box Combinations graphNr Boxes SA Number of Boxes in SA Box filterNr de SA por ARPU Box Number of SA per Equipment ARPU Graph title on page 2.eNr Routers SA Number of Router in SA Router filterNúmero de Clientes Number of Clients Y-axis label on page 2.eParque Park Dashboard metricPercentual Percentage Y-axis label (display weight in percentage of selected metric)Perfil Profile Client/Service filterPeríodo Fidelização Loyalty Period Client/Service filterPrincipal Main Box Rows of Main-Multiroom Box Combinations graphPrincipal/Multiroom Main/Multiroom Box filter (for Multiroom analysis)Receita Revenue Y-axis label on page 2.eReceita por ARPU Box Revenue per Equipment ARPU Graph title on page 2.eSem Outro Equipamento Without another Equipment Line/Row of the Combinations graphs that represent na isolated equipmentSemana Week Time unit represented (on X-axis) or week picker (on Main Filters)Sub-Segmento Segment Client/Service filterTencologia Tecnology Client/Service filterTipo Ativação Type of Activation Activation filterTipo Equipamento Equipment Category Column series of first equipment aggregation levelTotal Total Y-axis label (display total of selected metric)Total Combinações Sum of Combinations Line/Row Sum of the Combinations graphsTroca (Ativ) Exchange (Activation) Exchange for another equipment, Activation filterTroca (Desativ) Exchange (Deactivation) Exchange for another equipment, Deactivation filterUniverso Equipamentos Equipment Universe Dashboard nameVariação Líquida Net Change Dashboard metricVer Meses entre See months between Time filter to select time-horizon to display on graph or table

Appendix D
Interviews
D.1 CRM-RAN team representative
Question (Q): Thank you for accepting doing this interview. The questions I will be making havethe goal of collecting your opinion, as head of the CRM-RAN team and dashboard user, of thecurrent state of the “Equipment Universe” dashboard and future development perspectives. First, Iwould like to ask you to briefly describe what the team you lead, CRM-RAN does in its day-to-day.
Answer (A): Our team, the one you worked on in this project, is responsible for all reportingand all quantitative analysis of the marketing management of NOS, which means it supports fourmanagement teams: Product, Offer management, experience management and value. It also sup-ports the CRM department and directly supports the portfolio director. To sum up, everything thatis periodical reports to be used to manage the business is done by us. Besides that, we have ananalysis module that happen in a non-continuous but punctual manner, about a specific theme orcampaign. The team is composed by 6 people, spread between the Porto and Lisbon offices, andit directly reports to the CRM director.
Q: Now, moving to the dashboard. In your opinion, where did the need for this new reportcome from?
A: NOS, as a telecom company, has lots of information blacks and many different businesslines, both deeply related. We sell services, and, in those services things like mobile phone ser-vices, fixed voice, fixed internet, television, mobile internet, premium channels, mobile phoneinsurance, anti-virus, etc. As you can see, a plethora of services. We also sell products like cellphones and their accessories, extenders, remote controllers, and fixed telephones. With this, wehave a large set of not only product but also service offerings. Coupled with these offerings wehave a layer of stuff that are not business lines but are business line enablers, and this is wherefixed equipment come in. Fixed equipment are Boxes (we do not sell Boxes, at max, we rentthem), most of the boxes are in the equipment park that are part of the TV service, in other words,when the client is paying a certain amount for his service, that among other things always has aTV, the Box is the enabler that allows us to provide that service. The Routers are the same forthe Internet. Only one type of Router, Router V4, is rented in ways that the client may pay anextra fee to have an upgrade but, generally, the Router is also free because it is part of the internetservice bundle. When we sell the service to a client, we never tell him: “we are going to install arouter in your house” because the client already knows that we are going to give him the equip-ment that enables him to use the service as intended. This (the fact that equipment are an enablerand not a business line) has lead this subject to abandonment concerning business intelligence:not only did we not report it (which is our responsibility, and this is what you came to address in
71

72 Interviews
your project) but also our information was very sparse, poorly organized, poorly structured andsometimes not updated; some of the new routers had missing references and you and João foundthose problems. Truth be told, I would say this area had a breath of fresh air three years ago, whenwe (CRM-RAN) started addressing the reporting needs of the marketing department, starting withsales, the operational, and now it was time to address this subject (fixed equipment). Indeed, fixedequipment are very important, even if sometimes forgotten, because many times the upgrades andsales I make to my clients are allowed (or not) depending on the stock that I have or do not haveof equipment. For instance, I cannot upgrade IRIS Boxes to the new UMA Boxes, charging moreor not, depending on the company strategy, because I no longer have Boxes in the warehouse or Ihave a lower number than the desired one and I, therefore, have to limit the amount of upgradesthat I do. Sometimes this actually does happen because these products come from Asian countriesand, therefore, we have to carefully manage this information and this business line and, if we don’thave that information, it is almost impossible to do so. This was the feedback that we had fromthe Product team.
Q: Now that you have seen the final version of the dashboar, does it meet your expectations?Is it able to address the aforementioned needs?
A: Yes, I think that the dashboard, in the way you built it, is able to answer many of the ques-tions that had no answer to before. First, the regularity of the information because this informationexisted in a very odd manner, not periodic at all, and periodicity is very important in businessmanagement. Then, it puts together in the same report various dimensions, the movement dimen-sion and the static dimension, which is the park in the static dimension and the activation anddeactivation in the movement dimension. It also puts together the television and internet areas,well, not only puts them together but also crosses them. Therefore, besides being useful for beingput together (if we had two separate reports, we would also have the same information but sepa-rated in two different tools, so them being together in the same one is a matter of utility), the factthat it also crosses that information gives it a more holistic view because they are two fields thatought to be seen together. When we change a Box, we should also seize the opportunity to alsochange the router in case the router is also planned to be replaced. This simultaneous exchangeis obviously advantageous because we save one maintenance/installation team of having to go tothe client house. So, yes, the dashboard still lacks a revenue overlook, that was not in the initialrequirements but is now planned to be added in a future upgrade of the report.
Q: What do you like the most in the new dashboard? If you had to choose the most usefulfunctionality, which one would be?
Ã: The most useful aspect of the dashboard is the fact that we can manage the business, inthis case the fixed equipment business, in a constant and regular way. For me, it is impossible tocontrol any business if the information is not regular, stable, and true. And this is what the reportbrings to the table. If it is a bit more to the left or to the right, if it has an extra filter or is missinganother one, it doesn’t matter when the report already provides us a huge leap compared to whatwe had before. Now, product managers know that every week they have a report that is updatedwith that information, which is a lot of information, but more important than its amount, is the factthat it will regularly come in, making it a game-changer in the management of fixed equipment.
Q: Would you change anything in the report? What would you add in future releases of it?
A: I wouldn’t change anything because this as always been something you built with constantfeedback from João, from me and from the final users which was a very positive point of the

D.1 CRM-RAN team representative 73
development process, we did it in sync with the dashboard users. Firstly, in the initial commis-sion, afterwards, before the final release, they saw it, used it to understand what you had done.Therefore, I would not change this version. What I do think is that it needs a new revenue chapterin which we put together to these movements (Activation/Deactivation/Park) the value, to under-stand what value they brought to the company, whether positive or negative, very often negativebecause, as I’ve said at the beginning of the interview, equipment most of the time do not have anyvalue attached to them, but they have an installation cost and a very big purchasing cost, some ofthem cost hundreds of euros per unit to NOS and we do not ascribe that cost to the client but it isimportant to know that the costs are real and understand that every activation has these costs, andwe need to understand if the entire park is being profitable or not.
Q: Which factors, for example, missing data, may have limited the dashboard developmentand its final state? Can these facts be eliminated in the future?
A: You can say for yourself which limitations you had in developing the dashboard, but myfeeling is that the data you had to use, firstly, is not as treated as sales data is because the factthat it is not regularly used makes it less structured, with more sporadic and less stable updates.This obviously has an impact because not only did it make the dashboard construction difficult,but it also makes future updates harder to be done. But I am certain that with more utilizationand acceptance of your dashboard and of the data behind it, that this problem will disappear. It isvery common in organizations that everything that is not used is put aside and forgotten, thus, in aworld where time is scarce, people tend to use it to address the most useful things, and, clearly, thisdata, with this dashboard, will be much more useful in the future. Therefore, I think that yes, thelimitations you faced will gradually disappear, and I think that it is because of the new dashboardthat that it will happen.
Q: So, if I am understanding correctly, this dashboard will increase the urgency in improvingthe data infrastructure regarding equipment, so as to have more regular and more quality informa-tion?
A: Yes, and other developments will appear, more equipment to add to the dashboard probably,and it is much easier to defend the idea that better data is needed inside our team and to theinfrastructure team that is responsible for it when I say: this tool already exists and I want toimprove it because it is very useful; then saying: I need this data to create a new tool; in this case,people are not sure if the tool will actually end up being built. In other words, it is much harder todefend an idea when that idea is not attached to a tangible improvement target, that is why I alwaysask for at least a working model and I always ask people on my team to work with what exists,because it is much easier to say: look, do you see this? It is missing this or that; then saying: I amgoing to do something that will likely have this or that. . . In this last situation, the conversationbecomes much more difficult.
Q: In your team, how useful do you think the dashboard will be in the day-to-day life? Whichtasks will be facilitated with its existence?
A: I think there is a set of analysis that we are asked to do regularly, analysis and sometimes thedata itself, by the Product team that will stop existing because the report will give those answers,in other words, they will be doing “self-service” and that will free us of those more routinely tasks.Some analysis that we had to do for them, we had to spare some time to retrieve some data andknow we can consult the dashboard and that gives freedom to the entire team, even the membersthat don’t work with SQL, in accessing that data. Adding to that, I think that by having a dashboardand documentation about that dashboard and about the data that feeds it allows, when someone

74 Interviews
has to use that data for something else, that that data is already studied. One thing that I feel isthat each time that we do a report the data that feeds it is much more used for other side-analysisbecause it is already structured, I don’t have to do the initial part of understanding what is insidethis data block, if it is good, if it is bad, if it has everything, if it does not have everything, etc. SoI think in this sense the dashboard is an accelerator.
Q :This is the last question of the interview. Do you foresee that the dashboard will continuebeing used and improve for the next months and years?
A: The name we gave the dashboard (Equipment Universe) was not random. This was not aproject just to entertain a student, clearly it came to be disruptive in our reality. We gave it thename “universe” because when we call anything “universe” it is because they are very structuredreports. In fact, there are only two other “universes”, which are the “Fixed Universe” and the“Mobile Universe”. They are our two main reports for the Fixed and Mobile areas. In them, wehave information like: how many clients have NOS in fixed and mobile services, how many camein, how many left (these set of metrics we call operationals) then we have a revenue block, and inthe mobile it is also where the mobile manager can understand how his main KPI’s are. And wecalled “Equipment Universe” to this new report because we want it to be the basis of informationfor the equipment area. We have other reports for equipment, for example, for extenders, forrouter v5, more punctual and designed for one specific need, another example is a new report tofollow the launching of an upcoming product. To sum up, these other reports are done need-by-need for campaigns, marketing actions, etc; but this (Equipment Universe) is like a cornerstoneof something to be used and improved for years to come. Obviously with changes and, in a fewyears, it probably will not be in Power BI anymore but in another tool that may in the meantimeappear. The Fixed Universe is new, but there was an Excel document with all that information.The mobile universe is also new, but we did not use to be responsible for the mobile info, onlythe planning and management control department did it, but now it is our responsibility. TheEquipment universe has a similar idea behind it; therefore, it joins an exclusive set of three reportswhich are our team’s structural reports. Thus, to answer your question, yes, the dashboard is notonly meant to be updated, but it will certainly have future work in terms of improvements, notonly revenue, but every time that new products are launched the dashboard users will certainly askfor more information that will have to be added, as it is standard in these kind of reports.
D.2 Product team representative
Q: Thank you for accepting doing this interview. The questions I will be making have the goal ofcollecting your opinion, as a member of the Product team and dashboard user, of the current stateof the “Equipment Universe” dashboard and future development perspectives First, I would liketo ask you to introduce yourself, mainly, your responsibility in the Product team.
A: I am the direct responsible for the Television Product team here at NOS. That team isresponsible for everything done around the Television at NOS in terms of product experience,product aggregation, Box management, etc. So, in a sense, everything related to how the clientswill experience their services in the future. Truth be told, we are the bridge between severalareas, whether more technological or content based, the goal is to have an integrated view ofthe television equipment that respect the macro strategy of the company. To sum up, the job is tofocus on the more operational, technological, and content production areas related to the televisionproducts. That is my responsibility.

D.2 Product team representative 75
Q: Thank you for the introduction. As responsible for the Television Product team, where doyou think the motivation or necessity behind the “Equipment Universe” dashboard came from?
A: The equipment vision was something that was never really a “vision” because it had neverbeen aggregated here at NOS. We have lots of information, focused on the clients, service pack-ages, every week there are reports, even daily in the case of sales, that let us know how much weare selling of each service package and how many new subscribers we are adding to our park, butin what concerns equipment, that information did not exist. So, your work put on the table a veryinteresting tool for product management that is the capability to understand how we are in termsof equipment. In fact, our first equipment (Main Box) is included in the service package for free,but we are now defining a strategy to promote the second or third equipment (Multiroom Boxes),because we know that customers have demand for more than one Box. If we think about it, nowa-days, in Portugal, there are on average 2,3 televisions per house, and we only have, on average,1,4 Boxes per NOS customer. So, we definitely have room to grow, almost 1 Box per customer, ofsecondary equipment demand that we are not fulfilling. Having said this, initially I thought yourreport could be a useful tool to follow this “secondary equipment” strategy, so my necessity of itcomes from the necessity of capturing market and business value, to the client and the companybenefit. This tool also comes to answer the necessity that clients have of having access to morethan one connected television, because, as of today, customers at NOS and every other telecomcompetitor access cable TV channels in their secondary television, as they connect the standardTV cable, but they don’t have access to recordings, to apps, among other things, and we believethat the market trend of on-demand is growing, and that necessity of people seeing TV shows asthey want, for example, watch the news from the start of the program. And we believe that this“secondary equipment” strategy will enable us to answer that demand by letting them have Boxesin every division, from the kitchen to the bedrooms, and enabling in those places the same TVexperience that we currently offer in the living room. We foresee that if we do not take advantageof this necessity soon, someone else will do it for us, with products and services like Smart TVs,Android Boxes and all these surging equipment. Right now, Netflix and, later this year, Disneyare or will be building up their customer base in Portugal. Netflix took seven and a half years tohave 50 million subscribers worldwide and Disney took five months. This rate of growth meansthat the fact that Disney and Netflix are starting to appear as entertainment alternatives to the tele-com operators, makes us want to be present in this market before it is too late. We would like toincrease our number of Boxes per household and, for that, we have to keep track of the businessmetrics to follow its success.
Q: Does the dashboard allow you to track the metrics that you are mentioning?A: The dashboard allows us to have a clear vision of this. It has a lot of filters, one of them
the net adds, the churn, the park, it also lets us see revenue, it distinguished Main from MultiroomBoxes, therefore, all this information that is in the dashboard is the cornerstone of the “secondaryBoxes” business management. More than the main equipment business, already established, italso captures the growth of this new “secondary equipment” business model.
Q: Focusing more on these second and third Boxes and on the necessity of tracking them, doyou think that the dashboard meets the expectations you had of handling those necessities? Doesthe dashboard meet your expectations, in general?
A: We were completely “blind”. Just so you know, to do anything in this subject, in terms ofbudget or future prospects, we had to look into several different reports, calculate averages basedon them and, in the end, we would never have an holistic and clear view about the amount of boxesand how they were distributed in our customer segments. This dashboard provides that holistic

76 Interviews
view, without having to cross-reference a huge amount of information and we have that informa-tion updated on a weekly basis, which is ideal. This dashboard clearly meets the requirements wehad of being able to, every week, look to the numbers and understand how the business is evolv-ing. Before the dashboard, everything was done manually and most of the times we did not havethe information as detailed as we have now in terms of, for example, pricing models, we only hadaverage prices. To sum up, the dashboard gives us a more detailed view that, in my opinion, is theessential to build on top of the current business state. Nowadays, data is the new oil, as we usuallysay.
Q: If you could choose the most useful aspect of the dashboard, which one would you chose?What do you usually look for every time you open the dashboard?
A: The “Universe Equipment” has many views, all of them interesting on their own, but Iwould pick not one but two of them. For one, it has the capability of showing the Multiroom Parkevolution, which I think is extremely important. As I’ve already said, we had lots of things, Boxdata and client data, and then we found ourselves computing metrics like: we have 15 Boxes and10 clients so we have 1,5 boxes per client, of which 0,5 are Multiroom. Now, in this first viewof the dashboard, we have a clear understanding of the multiroom park. I think this is the mainadvantage of the report. The second interesting aspect of the dashboard is also an almost instantcontrol of every equipment addition and removal on a weekly basis. To sum up, there is a clearview of the park, and another view of the park movement, therefore, every week I can understandif the park is increasing or decreasing. This is the most important aspect of the dashboard.
Q: What would you personally add in the dashboard? Do you have any suggestion for futurerevisions of the dashboard?
A: I think that the revenue information should be more structured. The fact that the market isalready very matured gives us challenges in terms of pricing, discounts, etc, because the market isvery dynamic and competitive, which makes the BTL (bellow the line) offerings very importantto manage, so I think it is very important to have a clearer vision about the effective price pointsand discounts to better understand this vision of the offers we make to the clients. Not just thenumber of boxes, like we currently have, but also the pricing and discounts tied to each equipment.We need more details on this matter so that we can better adjust our equipment pricing and offersmoving forward.
Q: How useful is the dashboard in the day-to-day of your team? What tasks are now moreeasily done with this dashboard?
A: Everything. As I’ve said before, we had the knowledge of the amount of Boxes and Clients,and nowadays we have a tool that combines both and lets us dive deeper into topics like multiroom,so, the multiroom offer management without this tool was like walking in the dark. I think that itlets have new insights that we had never had until now. Suddenly, this is a new world. Therefore,this is not even an increment or an improvement to the data we had, this is in fact completelydisruptive comparing to what we had to work with before.
Q: My last question is about the future of the dashboard. Do you think that the EquipmentUniverse dashboard will be updated and improved in the next months/years? Or do you think that,meanwhile, it could be replaced by another entirely new tool, built from scratch?
A: No, I think that the need we had for this dashboard has already been here for a while, andyou came to help building its first foundations. As I have already told you, there are improvementsin the reporting in terms of revenue, pricing and offerings that needs to be more structured and

D.2 Product team representative 77
built on. So, I think this is just the beginning of something that NOS was clearly pursuing and willsurely want to keep doing and improving to let us manage our equipment portfolio more efficientlyand to more easily recognise and answer customer needs that have been arising.
Q: A last minute question: You have been saying that the revenue/pricing/offerings part of thedashboard ended up lacking, and I can tell you that it was partially because of not having access togood data sources that could feed the dashboard that information. What do you have to say aboutit?
A: The dashboards cannot live isolated from the rest of the company. We cannot just go tosomeone that was charged of building one and saying: now that it is your responsibility, find a wayto deliver it on your own. This does not work this way. From the starting point, we should identifywhat are our reporting necessities and communicate them to the IT department. Otherwise, youwill never be able to follow everything. It is of utmost importance that this need is passed to theIT guys, so that they, when developing their offerings and configurations, can provide informationthat can be used by the people that are using the data, in this case, the CRM-RAN department thatyou worked on. I think this needs to keep moving forward, but of course there are difficulties. Thetelco industry is very established, using methods going back to 10 to 20 years ago, but maybe thisis a good insight for your dissertation: I think in terms of IT and database architecture, everythinghas to be thought from inception, so that people that use that data are empowered to do so. Iam certain that organizations like Google, Netflix and Facebook have an extraordinary capacity ofstudying their data because they have every process to do so systematized. It is not at the end of theproject that they would say: “look, we also need this information” and then everybody is fishingfor it. No, since the start of the project, they already know everything that they want to measure atthe end of the road. This is the only way of moving from intuitive knowledge to truly analyticalone. In your project, you had to look into existing databases for data, then define metrics, KPI’s,etc. But those databases themselves also need to be reviewed and improved so that problems suchas the ones you had with nonexistent or poor equipment revenue data do not appear.

Appendix E
Forecasting Tool Results
Note: In the graphs, the orange line represents the Actual Activation time series, while the blueline represents the Predictions.
78

Forecasting Tool Results 79
Table E.1: Error analysis
ME MAE MAPEBOX 1.0 HD (SAT) 62 62 46,8%BOX 1.0 HD+DVR (CABO) 61 61 53,3%BOX 1.0 HD+DVR (SAT) -16 16 53,0%BOX 1.0 HD+DVR (SAT/TDT) 0 0 10,8%BOX 2.0 HD (CABO) 12 13 26,7%BOX 2.0 HD+DVR (CABO) 166 166 20,5%Box 3.0 Ultra HD 5 7 12,4%Box 3.0 Ultra HD v2 2 39 17,8%DTA 54 74 6,3%HUB 19 42 9,6%HUB 3.0 2 2 38,4%HUB FTTH 128 128 28,8%Modem Multimédia 5 5 65,0%Powerbox Cabo 9 9 21,8%Router 4.0 2 4 31,7%Router 4.0 FTTH 65 77 10,3%Router 4G Pro 44 44 35,2%Router 5.0 0 0 4,8%Router 5.0 FTTH 176 176 20,4%Router 5.0_v2 15 19 41,1%

80 Forecasting Tool Results
Figure E.1: Actual Activation vs Predictions: BOX 1.0 HD (SAT), BOX 1.0 HD+DVR (CABO),BOX 1.0 HD+DVR (SAT), BOX 1.0 HD+DVR (SAT/TDT), BOX 2.0 HD (CABO) and BOX 2.0HD+DVR (CABO)
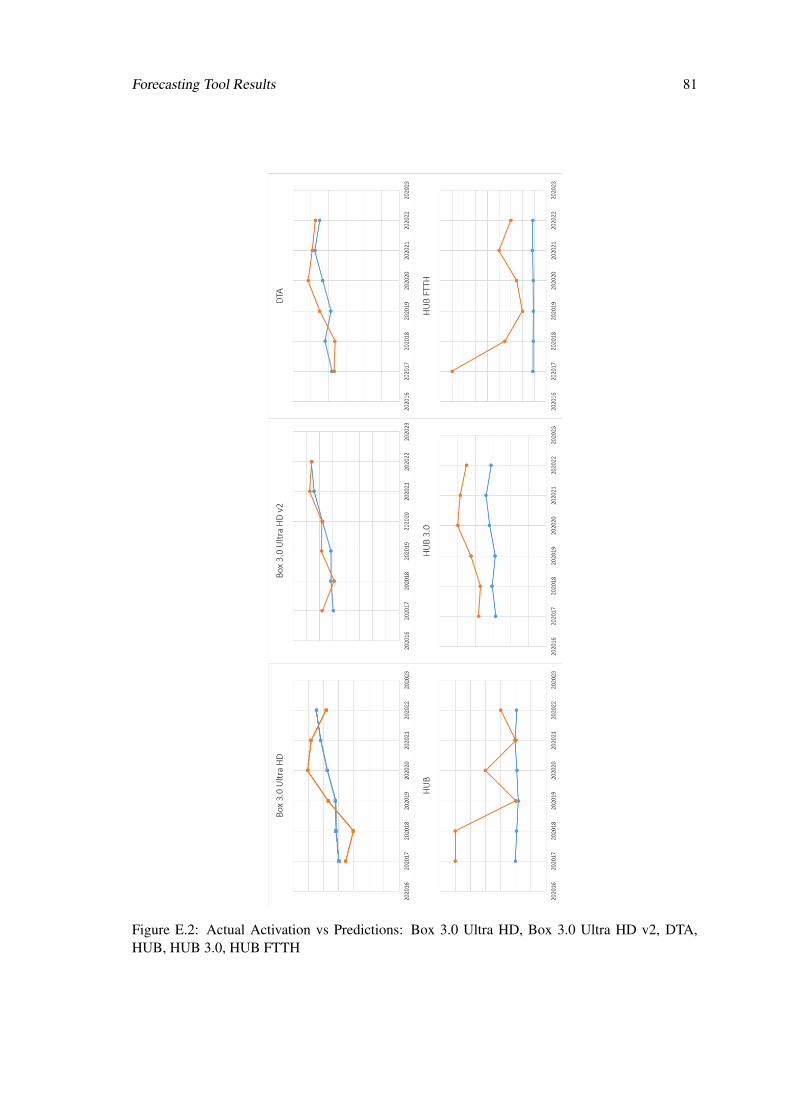
Forecasting Tool Results 81
Figure E.2: Actual Activation vs Predictions: Box 3.0 Ultra HD, Box 3.0 Ultra HD v2, DTA,HUB, HUB 3.0, HUB FTTH
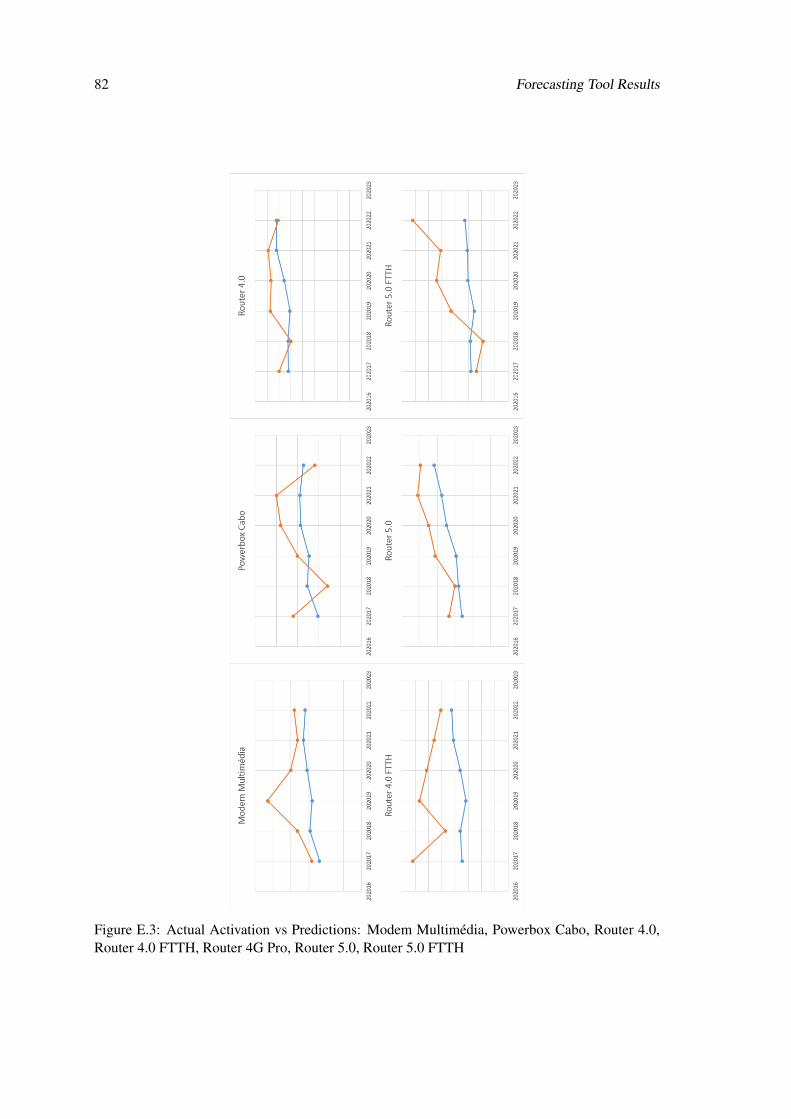
82 Forecasting Tool Results
Figure E.3: Actual Activation vs Predictions: Modem Multimédia, Powerbox Cabo, Router 4.0,Router 4.0 FTTH, Router 4G Pro, Router 5.0, Router 5.0 FTTH

Forecasting Tool Results 83
Figure E.4: Actual Activation vs Predictions: Router 5.0v2