preventing financial reporting fraud: a holistic view of ... · preventing financial reporting...
TRANSCRIPT

Preventing Financial Reporting Fraud: A Holistic View of the Attributions Made
Following Potential Fraudulent Financial Reporting Events
Eric Michael Negangard
Dissertation submitted to the faculty of the Virginia Polytechnic Institute and
State University in partial fulfillment of the requirements for the degree of
Doctor of Philosophy
in
Business, Accounting and Information Systems
J. Gregory Jenkins, Chair
Stephen Kwaku Asare
Danny K. Axsom
Sudip Bhattacharjee
Thomas Bowe Hansen
March 24, 2014
Blacksburg, VA
Keywords: Financial Reporting Fraud, Business Culture, Attribution Theory, Correspondence Bias,
Fundamental Attribution Error
© 2014, Eric Michael Negangard
Preventing Financial Reporting Fraud: A Holistic View of the Attributions Made
Following Potential Fraudulent Financial Reporting Events
Eric M. Negangard
ABSTRACT
Constituents in the judicial process such as jurors and lawyers who often play a critical
role in the aftermath of an alleged financial reporting fraud have largely been ignored in the
accounting literature. Literature in psychology suggests that both laypeople and highly trained
professionals frequently over-attribute causality of an observed behavior to the disposition of the
person performing that behavior. In doing so, these individuals underestimate the power of
situations and fail to recognize important environmental factors that lead to a particular behavior.
Within the context of fraudulent financial reporting, there is little understanding of how jurors
and lawyers initially perceive and react to fraudulent behavior. Consequently, it is possible jurors
and lawyers who are asked to evaluate the causality of a suspected fraudulent event, are
inaccurate in their assessment of the causality of that event.
This study addresses the question of whether or not the various constituents in the judicial
process are biased in their attributions when evaluating causal factors related to financial
reporting decisions. More specifically, it focuses on how individuals outside the profession of
accounting, laymen jurors and corporate lawyers, make attributions when observing decisions
related to fraudulent financial reporting, and whether or not these attributions differ from those
made by corporate accountants. Further, after identifying differences in attributions, this study
attempts to determine the causes of these differences; and whether recent changes in business
culture have been effective in curbing financial reporting fraud.

iii
The late 1990s and early 2000s saw a proliferation of high profile financial reporting
frauds, and as a result, numerous changes have been made within the regulatory environment
governing financial reporting. Many of these changes targeted overall business culture and a
commitment to ethical financial reporting. By studying the attributions of corporate accountants
we learn about their perceptions of the current environment and better understand their
willingness to report something in a manner that would constitute financial reporting fraud.
Evidence demonstrates that laymen, corporate lawyers, and corporate accountants differ in their
attributions and that laymen are typically more biased when observing individuals and their
financial reporting decisions. Laymen are also shown to lack awareness of recent changes in the
financial reporting environment, have unrealistic expectations of the likelihood accountants are
willing to intentionally misreport something, and are not as good at identifying appropriate and
inappropriate financial reporting behaviors. Results also suggest recent changes in business
culture and governance around financial reporting have been effective in convincing corporate
accountants that environmental factors should not lead to, and are not a viable excuse for,
fraudulent financial reporting.
iv
DEDICATION
This dissertation is dedicated to my wife, Dr. Ashley Negangard, my parents, John and
Karen Negangard, and my recently departed dog, Bailey. To my amazing wife and best friend,
none of this would have been possible without your infinite love and support. I have never met
anyone who is as determined and dedicated as you, and I am truly blessed to have a partner in
life who is so supportive and unwavering in her conviction. To my parents, thank you both for
instilling in me the desire to truly be a lifelong learner and for your constant support of my life
adventures. No matter where life has taken me I have always known that you are both proud of
me. For this I can never thank you enough as it is the greatest gift a parent can give. Finally, to
the recently passed Bailey, you showed me that even in the face of life’s extreme hardship a
positive attitude and love, can, and will prevail. Thank you for sitting at my feet for so many
hours as I worked my way through the Ph.D. program and this dissertation. I truly miss you bud
and wish you could have been here to cross the finish line with me.
v
ACKNOWLEDGEMENTS
I must start by wholeheartedly thanking my dissertation chair and highly devoted mentor,
Dr. Greg Jenkins. I have greatly enjoyed getting to know Dr. Jenkins and will forever be
indebted to him for his countless hours of guidance and support. Not only does Dr. Jenkins
provide excellent counsel with regards to success in academia, he has a highly contagious
positive outlook on life that makes everyone around him a better person. Dr. Jenkins is truly the
best mentor I have ever had. I aspire to one day be as helpful to another individual as he has to
me. Thank you Greg for the many ways in which you have helped to advance my career. More
importantly, thank you for making me a better individual. In you I know I have a lifelong
colleague and friend.
I would like to acknowledge and express my sincere gratitude to the members of my
dissertation committee – Dr. Stephen Kwaku Asare, Dr. Danny Axsom, Dr. Sudip Bhattacharjee,
and Dr. Thomas Bowe Hansen. Thank you for your continued guidance, support,
encouragement, and enthusiasm throughout the process. This dissertation and my development
as an academic have benefited tremendously as a direct result of my interactions with each of
you. Thank you Dr. Asare for your willingness to be on my committee as a representative from
an outside institution, and for your tremendous leadership and guidance during my first
publication. Thank you Dr. Axsom for welcoming me and my cohort into your Social
Psychology course in which the idea for this dissertation was born. Thank you Dr. Bhattacharjee
for teaching me how to be a better behaviorist and for always encouraging me to think about
theory. Last but not least, thank you Dr. Hansen for the tremendous feedback and for always
being someone I could talk to whether it be about my dissertation or a much need break from it.
I would also like to acknowledge several additional members of the Department of

vi
Accounting and Information Systems (ACIS) at Virginia Tech. I would specifically like to thank
Dr. Jack Maher for his mentoring and guidance throughout my time in Blacksburg. Dr. Maher
has undeniable care and concern for my future as an academic and for this I will forever be
grateful. I would like to thank Dr. Robert Brown, Dr. Reza Barkhi, Dr. France Belanger, and Dr.
Larry Killough for always supporting me and helping me to “see the forest through the trees.”
Lastly, I would like to thank Kathy Caldwell, Phyllis Neece, and Arnita Perfater for being the
engine behind the scenes that makes the ACIS department run. Thank you ladies for tolerating
my countless demands on your time and for your support. I will miss each of you very much.
I would like to thank many of my fellow Ph.D. students without whom I would not have
been nearly as successful in the program: Dr. Chris Edmonds, Dr. Michele Meckfessel, Dr.
Lucian Zelazny, Dr. Molly Adams, Dr. Rebecca Fay, Dr. Kerry Inger, Dr. Ryan Leece, Dr. Todd
White, Dr. Owen Brown, Dr. Mike Ozlanski, Dr. Jon Pyzoha, Joanna Garcia, Kathy Enget,
Nichole Wright, Gabe Saucedo, Alan Stancill, Christine Gimbar, John Lauck, Joe Rakestraw,
Mark Sheldon, Ian Twardus, Tripp Petzel, and Trent Hinke. A special thanks goes to Dr. Owen
Brown for sharing an office with me for four years, for being a great motivator and workout
partner, and for helping me to see some of my many faults.
Finally, I would like to thank all the participants who donated their time and talents to
this project as well as the numerous people and organizations who supported me and this project
financially. I am particularly grateful for the financial assistance I received during the Ph.D.
program including funding from the ACIS department, the Virginia Tech Institute for Society,
Culture, and Environment, the Virginia Society of CPAs, the John E. Peterson, Jr. & Mary Jane C.
Peterson Ph.D. Fellowship, the Johnny R. Johnson Memorial Scholarship, the Association of Fraud
Examiners Ritchie Jennings Memorial Scholarship, and the PwC INQuires program.
vii
TABLE OF CONTENTS
CHAPTER ONE - INTRODUCTION ................................................................................................................... 1
1. 1 Introduction ........................................................................................................................................ 1
CHAPTER TWO - BACKGROUND AND LITERATURE REVIEW ......................................................................... 4
2. 1 Literature Review ............................................................................................................................... 4
2.1.1 The Fundamental Attribution Error and Correspondence Bias .................................................... 4
2.1.2 The Appropriate Recognition of Environmental and Dispositional Information .......................... 5
2.1.3 Correspondence Bias and the Internality Scale ............................................................................ 7
2.2 Correspondence Bias in Laymen, Professionals, and the Empathetic Observer ................................. 8
2.2.1 Laymen ......................................................................................................................................... 9
2.2.2 Professionals ................................................................................................................................ 9
2.2.3 The Empathetic Observer ........................................................................................................... 10
2.3 The In-Group/Out-Group Relationship Effect on Correspondence Bias ............................................ 10
2.4 Correspondence Bias as it Relates to FFR and the Judicial Process................................................... 11
2.5 Hypothesis Development - Correspondence Bias and the Decision to Commit FFR .......................... 14
2.5.1 FFR Outcome Scenarios .............................................................................................................. 15
2.5.2 Non-FFR Outcome Scenarios ...................................................................................................... 17
2.5.3 Interaction between Relationship Type and Decision Outcome ................................................ 19
2.5.4 The Appropriate Interpretation of Consensus, Consistency, and Distinctiveness ...................... 19
2.5.5 FFR Outcome Scenarios .............................................................................................................. 20
2.5.6 Non-FFR Outcome Scenarios ...................................................................................................... 21
2.5.7 Causes of Correspondence Bias .................................................................................................. 22
CHAPTER THREE – RESEARCH METHODOLOGY .......................................................................................... 27
3.1 Research Design ................................................................................................................................ 27
3.2 Pilot Testing ....................................................................................................................................... 28
3.3 Independent Variables ...................................................................................................................... 29
3.4 Dependent Variables ......................................................................................................................... 30
3.5 Sample ............................................................................................................................................... 31
3.5.1 Laymen ....................................................................................................................................... 32
3.5.2 Corporate Lawyers ..................................................................................................................... 32
3.5.3 Corporate Accountants .............................................................................................................. 33

viii
3.6 Experimental Instrument .................................................................................................................. 33
3.6.1 Introduction ................................................................................................................................ 33
3.6.2 Initial Baseline Estimate of Accountants’ Willingness to Commit FFR ....................................... 34
3.6.3 Case-Based Scenarios ................................................................................................................. 34
3.6.4 Post-Experiment Questionnaire ................................................................................................. 35
CHAPTER FOUR – DATA ANALYSIS .............................................................................................................. 36
4.1 Preliminary Analysis .......................................................................................................................... 36
4.2 The Full Mixed Effects Model ............................................................................................................ 37
4.3 Attributional Differences – Hypotheses H1a-c .................................................................................... 38
4.4 Effect of Information Type – Hypotheses H2a-c ................................................................................. 40
4.5 Causes of Correspondence Bias – Hypotheses H3a-c .......................................................................... 45
4.6 Supplemental Analysis ...................................................................................................................... 48
4.6.1 Business Culture and Environment Questions ............................................................................ 48
4.6.2 Controlling for the Potential Causes of Bias and Differing Perceptions of Business Culture ..... 50
4.6.3 Effect of Technical Knowledge and Character ........................................................................... 51
CHAPTER FIVE – DISCUSSION, CONTRIBUTIONS, AND LIMITATIONS ......................................................... 53
5.1 Discussion .......................................................................................................................................... 53
5.2 Contribution ...................................................................................................................................... 56
5.3 Limitations ......................................................................................................................................... 57
5.4 Future Research ................................................................................................................................ 58
REFERENCES ................................................................................................................................................ 60
APPENDIX A: Experimental Instrument .................................................................................................... 104
Exhibit 1: Welcome Screen ................................................................................................................... 104
Exhibit 2: Initial Estimate of Financial Reporting Fraud ........................................................................ 105
Exhibit 3: Scenario # 1 Introduction ...................................................................................................... 106
Exhibit 4: Scenario # 1 The Controller’s Decision ................................................................................. 107
Exhibit 5: Scenario # 1 Points Assignment ............................................................................................ 108
Exhibit 6: Scenario # 1 Internality Scale ................................................................................................ 109
Exhibit 7: Scenario # 2 Introduction ...................................................................................................... 110
Exhibit 8: Scenario # 2 The Controller’s Decision ................................................................................. 111
Exhibit 9: Scenario # 2 Points Assignment ............................................................................................ 112
Exhibit 10: Scenario # 2 Internality Scale .............................................................................................. 113

ix
Exhibit 11: Scenario # 3 Introduction .................................................................................................... 114
Exhibit 12: Scenario # 3 The Controller’s Decision ............................................................................... 115
Exhibit 13: Scenario # 3 Points Assignment .......................................................................................... 116
Exhibit 14: Scenario # 3 Internality Scale .............................................................................................. 117
Exhibit 15: Demographic Questions ...................................................................................................... 118
Exhibit 16: Demographic Questions (continued) .................................................................................. 119
Exhibit 17: Demographic Questions (continued) .................................................................................. 120
Exhibit 18: Motivation and Mood Questions ........................................................................................ 121
Exhibit 19: Business Culture Questions ................................................................................................ 122
Exhibit 20: Business Culture Questions (continued) ............................................................................. 123
Exhibit 21: Business Culture Questions (continued) ............................................................................. 124
Exhibit 22: Business Culture Questions (continued) ............................................................................. 125
Exhibit 23: Business Culture Questions (continued) ............................................................................. 126
Exhibit 24: Business Culture Questions (continued) ............................................................................. 127
Exhibit 25: Experienced Fraud Question ............................................................................................... 128
Exhibit 26: Overall Financial Reporting Environment Question ........................................................... 129
Exhibit 27: Aftermath of Financial Reporting Fraud Question .............................................................. 130

x
LIST OF FIGURES
FIGURE 1: Predicted Effects of Group on Internality Assessments for FFR and Non-FFR
Outcomes ...................................................................................................................................... 65
FIGURE 2: Predicted Interaction between Relationship Type and Decision Outcome ............... 66
FIGURE 3: Predicted Effects of Information Type and Relationship Type on Internality
Assessments in an FFR Outcome ................................................................................................. 67
FIGURE 4: Predicted Effects of Information Type and Relationship Type on Internality
Assessments in a Non-FFR Outcome ........................................................................................... 68
FIGURE 5: Schedule of Manipulation Assignments by Constituent Group – Nested Block
Design ........................................................................................................................................... 69
FIGURE 6: Flowchart of Experimental Procedures ..................................................................... 72
FIGURE 7: Observed Effects of Constituent Group and Outcome on Internality Assessments .. 73
FIGURE 8: Observed Effects of Outcome and Constituent Group on Internality Assessments .. 74
FIGURE 9: Observed Effects of Information Type and Constituent Group on Internality
Assessments for FFR Outcomes ................................................................................................... 75
FIGURE 10: Observed Effects of Information Type and Constituent Group on Internality
Assessments for Non-FFR Outcomes ........................................................................................... 76
FIGURE 11: Participant’s Original Baseline Estimate that a Typical Corporate Accountant
Would Intentionally Account for Items in a Manner that Would Mislead the Users of Their
Financial Statements shown by Constituent Group ...................................................................... 77
FIGURE 12: Participant’s Scenario Specific Assessment of the Appropriateness of the Action
Taken by the Corporate Controllers shown by Constituent Group and Outcome ........................ 78
FIGURE 13: Participants’ Adjustments from their Original Baseline Estimate to Scenario
Specific Likelihood Estimates Provided Additional Dispositional or Environmental Information
shown by Constituent Group ........................................................................................................ 79
FIGURE 14: Observed Effects of Constituent Group and Outcome on Internality Assessments
Controlling for Potential Causes of Correspondence Bias ........................................................... 80
FIGURE 15: Observed Effects of Information Type and Constituent Group on Internality
Assessments for FFR Outcomes Controlling for Causes of Potential Causes of Correspondence
Bias ............................................................................................................................................... 81

xi
FIGURE 16: Screen Plot from the Confirmatory Factor Analysis Performed on the Questions
Related to Business Culture .......................................................................................................... 82
FIGURE 17: Participant Attributions Specific to (1) the Controller’s Technical Knowledge, (2)
the Controller’s Character, (3) How the Accounting Might Impact the Company’s Financial
Reporting, and (4) Other People’s Attitudes towards Financial Reporting shown by Constituent
Group and Outcome ...................................................................................................................... 83

xii
LIST OF TABLES
TABLE 1: Definition and Operationalization of Consensus, Consistency, and Distinctiveness . 84
TABLE 2: Summary of Information Type Provided, Specific Form Used, and Expected
Attribution ..................................................................................................................................... 85
TABLE 3: Participant Characteristics by Constituent Group ....................................................... 86
TABLE 4: Pearson Correlation Matrix of Select Variables ......................................................... 87
TABLE 5: Results of the Full Mixed Model ................................................................................ 89
TABLE 6: Internality Assessments by Constituent Group and Outcome (H1) ............................ 90
TABLE 7: Internality Assessments by Constituent Group and Information Type (H2) .............. 92
TABLE 8: Business Culture Variables: Means (Standard Deviations) and ANOVAs ................ 94
TABLE 9: Internality Assessments by Constituent Group and Outcome Controlling for Potential
Causes of Correspondence Bias .................................................................................................... 99
TABLE 10: Internality Assessments by Constituent Group and Information Type Controlling for
Potential Causes of Correspondence Bias ................................................................................... 100
TABLE 11: Factor Loadings for Business Culture Variables .................................................... 101

1
CHAPTER ONE
INTRODUCTION
1. 1 Introduction
Accounting research related to fraudulent financial reporting (FFR) has primarily focused
on which companies commit FFR, how companies commit FFR, and how auditors assess the risk
of FFR. More specifically, the accounting literature has examined the causes of FFR (e.g.,
Beasley 1996; Carcello and Nagy 2004; Carpenter and Reimers 2005; Dechow et al. 1996;
Rezaee 2005), the frequency and magnitude of FFR (e.g., Beasley et al. 1999; Beasley et al.
2010), how to identify companies that have committed FFR (e.g., Hennes et al. 2008; Kaminski
et al. 2004), auditor risk assessment related to FFR (e.g., Bell and Carcello 2000; Hammersley
2011; Hoffman and Patton 1997; Hogan et al. 2008; Trompeter et al. 2012), and market
fluctuations as a result of FFR (e.g., Cox and Weirich 2002; Palmrose et al. 2004). While a
significant volume of research related to FFR exists, important constituents such as laypeople
and non-accounting professionals such as corporate lawyers who are often involved in the
prosecution or defense of those who are accused of FFR, have been largely ignored in the
accounting literature.
The literature in social psychology, offers a theoretical framework for examining these
other constituents. Research in social psychology suggests that individuals frequently over-
attribute causality of an observed behavior to the disposition of the person performing the
behavior (Gilbert and Malone 1995; Jones 1979; Ross 1977). In doing so, individuals
underestimate the power of situations and fail to recognize important environmental factors that
lead to a particular behavior. In fact, this tendency to blame the person and not the situation for
acts performed is so pervasive that psychologists call it the “fundamental attribution error” (Ross

2
1977). Since individuals are frequently biased in their assumption that a particular behavior
“corresponds” to a person’s disposition rather than to the situation or the environment the person
is in, psychologists refer to this as “correspondence bias” (Gilbert and Malone 1995). It is
important to note, however, that correspondence bias can also work in the opposite direction and
result in an over attribution to environmental factors.
Within the context of FFR, it is possible that important constituents who observe, hear, or
read about an instance of FFR make the fundamental attribution error and exhibit
correspondence bias. Jurors and professional lawyers are highly involved in the prosecution of
FFR, yet there is little understanding of how these individuals initially perceive and react to FFR
events. The purpose of this research is to (1) determine whether individuals outside the
profession of corporate accounting, specifically jurors and corporate lawyers, over-attribute the
occurrence of FFR to the dispositions of those committing FFR, thereby overlooking critical
environmental factors that may have played a proximate causal role, and (2) determine whether
corporate accountants differ in their attributions by over attributing occurrences of FFR to
environmental factors.
As a result of this research, academics and accounting professionals will better
understand the perceptions of critical constituents in the FFR judicial process, and be better able
to determine whether or not correspondence bias colors interpretations of instances of FFR.
Further, the research helps to identify what leads observers to make these attributions so that they
may be better understood or even mitigated in the future. While it is unrealistic to assume that all
FFR can be eradicated, there have been calls to more fully understand the nature of FFR and how
individuals react to it (AICPA 1987; Beasley et al. 2010; International Audit Networks 2006,
2008; U.S. President 2002). While correspondence bias has been widely studied in the field of

3
social psychology (e.g., Epley et al. 2002; Gilbert and Malone 1995; Heider 1958; Jones 1979;
Ross and Nisbett 1991; Swann 1984; Tetlock 1985), little work has been done to study its
existence or effects within the accounting domain (e.g., Arrington et al. 1985; Kaplan et al.
2007). Finally, by studying the attributions of those who are routinely in a position to commit
FFR (i.e., corporate accountants), we can better understand what effect, if any, recent changes in
the regulatory environment have had on overall business culture as it relates to FFR.
The remainder of this dissertation is organized as follows. Chapter Two provides
background information and a review of the related literature. Chapter Three presents the
research design, experimental instrument, and variables of interest. Chapter Four details the data
analysis and results. Chapter Five provides a discussion of the study’s contributions, limitations,
and suggestions for future research.
4
CHAPTER TWO
BACKGROUND AND LITERATURE REVIEW
2. 1 Literature Review
This thesis draws on numerous areas of accounting and psychology literature to develop
hypotheses regarding the perceptions and subsequent attributions of individuals who observe,
hear, or read about an FFR event. According to Jones (1990, 39), “perceiving others is
synonymous with making sense of their behavior, and this activity typically involves finding the
cause or causes of that behavior.” As observers we “try to ‘find’ appropriate causes in
characteristics of the actor – inferred dispositions that seem to explain why the actor behaved as
he or she did” (Jones 1990, 39).
In his classic work, The Psychology of Interpersonal Relations, Heider (1958) posits that
causal judgments result from evaluating the effective force of an actor to produce an outcome
relative to the effective force of the environment to produce the outcome. Thus, at the simplest
level, causality is assigned internally to the observed actor (i.e., his or her disposition) and
externally to the environment (i.e., the situation) in proportion to perceptions of the effective
force of each (Arrington et al. 1985).
2.1.1 The Fundamental Attribution Error and Correspondence Bias
The fundamental attribution error represents a human psychological tendency to draw
inferences about a person’s inherent disposition from behaviors that can be alternatively
explained by the situations in which they occur (Gilbert and Malone 1995). Correspondence bias
represents the bias that causes the fundamental attribution error (Ross 1977) and has been the
subject of numerous psychology studies (e.g., Gilbert and Malone 1995; Heider 1958; Jones
1979; Ross 1977; Ross and Nisbett 1991; Swann 1984; Tetlock 1985). According to Tetlock

5
(1985), correspondence bias represents a significant shortcoming in how people typically process
information about others and a widespread error or bias in social judgment linked to people’s
reliance on simple, highly overlearned judgmental heuristics in social perception tasks.
Correspondence bias can occur when people observe behavior, such as FFR, and
conclude that the person who performed the behavior was predisposed to do so (Gilbert and
Malone 1995). In other words, “the person’s behavior corresponds to the person’s unique
dispositions and they [observers] draw such conclusions even when a logical analysis suggests
they should not” (Gilbert and Malone 1995, 21). Stated differently, people tend to think that
“others are as they act” (Bonner 2007, 269; Jones and Davis 1965).
Numerous studies (e.g., Arrington et al. 1985; Feigenson 2000; Quattrone 1982; Sherman
1980; Gilbert et al. 1988) demonstrate that individuals routinely fail to recognize situational
influences and over-attribute observed behavior to the disposition of the actor. In other words,
observers succumb to the fundamental attribution error and exhibit correspondence bias when
assessing the behavior of others.
2.1.2 The Appropriate Recognition of Environmental and Dispositional Information
Varying levels of information regarding the context of an observed behavior should
normatively lead to differences in the attributions of that behavior. Accordingly, the failure to
appropriately interpret all the information surrounding an observed behavior is indicative of
correspondence bias. More specifically, research on attribution theory (e.g., Arrington et al.
1985; Jones 1990; Kelley 1967; Nisbett and Ross 1980; McArthur 1972) has identified three
contextual factors as relevant to the attribution process, all of which are also relevant in the
context of FFR. These factors are the consensus, consistency, and distinctiveness of a particular
informative effect. Table 1 provides specific definitions of consensus, consistency, and

6
distinctiveness as they have evolved in the psychology literature and identifies forms of each that
can be operationalized within the context of FFR.
Originating with the Kelley (1967) ANOVA cube, various combinations of information
leading to perceived high or low levels of consensus, consistency, and distinctiveness of a
behavior have been normatively theorized and empirically shown to lead to either dispositional
or environmental1 attributions by observers. For example, a high level of consensus, the degree
to which people other than the observed individual show similar behavior, would normatively
lead to environmental attributions and a low level of consensus would lead to dispositional
attributions. Further, a high level of consistency, the degree to which the person has performed
the action in the past, would normatively lead to dispositional attributions and a low level of
consistency would lead to environmental attributions. Finally, a high level of distinctiveness, the
degree to which other options are not available to achieve a goal, would normatively lead to
environmental attributions, and a low level of distinctiveness would lead to dispositional
attributions (Nisbett and Ross 1980). In summary, and as provided by Arrington et al. (1985), the
normative impact of an appropriate interpretation of each type of information on the attribution
process is as follows:
Attribution Implied
Type of Information High Level Low Level
Consensus Situational Dispositional
Consistency Dispositional Situational
Distinctiveness Situational Dispositional
A failure to appropriately interpret information around the consensus, consistency, and
distinctiveness of a particular behavior is indicative of correspondence bias. Accordingly, the
1 Psychology literature uses the terms “situational” and “environmental” somewhat
interchangeably in reference to external attributions. Except when quoting previous literature,
external attributions are hereinafter referred to as environmental attributions.
7
logical benchmark for assessing correspondence bias within an FFR context can be established
through the inclusion and recognition of various combinations of information pertaining to
consensus, consistency, and distinctiveness. Based upon the attributions implied above, two
combinations of information exist that should clearly generate environmental or dispositional
attributions. Environmental information, or information that should normatively lead to
environmental attributions, can be defined by a combination of additional information that
portrays high consensus, low consistency, and high distinctiveness of a particular behavior.
Dispositional information, the type that should produce dispositional attributions, can then be
defined by low consensus, high consistency, and low distinctiveness. Alternatively, as a third
option, ambiguity can be created by the provision of no additional information around consensus,
consistency, and distinctiveness. Consequently, the presence of additional environmental,
dispositional, or no additional information around a particular behavior can be used to identify
failures to make appropriate attributions in an FFR context.
2.1.3 Correspondence Bias and the Internality Scale
Researchers have developed a way to identify correspondence bias in the attribution
process. In order to measure the perceived effective force of the actor (i.e., internal or
dispositional factors) relative to the effective force of the environment (i.e., external or
situational factors) prior research has taken two distinct approaches towards developing what is
known as an internality scale. The first approach, similar to Kaplan et al. (2007), is simply to ask
the observer to attribute the behavior using a direct scale with dispositional causes as one end
point and environmental as the other. A less direct method was developed by Luginbuhl et al.
(1975) whereby an observer is typically allotted a total of 100 points, and following the
observation of a particular behavior, assigns the points to four attributional categories: two

8
dispositional and two environmental. Net internality is then determined by the difference
between the sum of the two dispositional categories minus the sum of the two environmental
categories. A positive internality score is indicative of dispositional attributions (i.e., the actor is
perceived as a more salient cause of the outcome than is the environment), whereas a negative
score attributes more causality to the environment. Correspondence bias is represented by the
propensity to over-attribute to either dispositional or environmental factors regardless of the
consensus, consistency, or distinctiveness of the observed action.
2.2 Correspondence Bias in Laymen, Professionals, and the Empathetic Observer
While Gilbert and Malone (1995) provide theoretical causes of correspondence bias, they
do not address factors that may help reduce correspondence bias. Considerable research in
psychology has shown that both laymen and professionals (i.e., individuals with specialized
contextual knowledge) exhibit correspondence bias when making attributions for observed
behavior when they view their relationship with the observed individual as an out-group2
relationship (e.g., Arrington et al. 1985; Dripps 2003; Epley et al. 2002; Feigenson 2000; Kunda
1999; Ross 1977; Ross and Nisbett 1991). However, observers who are able to empathize with
the observed individual exhibit less correspondence bias (Arkin et al. 1978; Arrington et al.
1985; Regan and Totten 1975). This indicates that a perceived in-group relationship may help to
eliminate correspondence bias (Arkin et al. 1978; Arrington et al. 1985; Regan and Totten 1975).
The following sections address the presence of correspondence bias for out-group laymen and
professionals, and its potential avoidance for in-group empathetic observers.
2 Social Identity Theory identifies an out-group as a social group with which an individual does
not psychologically identify (Tajfel and Turner 1979). By contrast, an in-group is a social
group to which a person psychologically belongs or identifies with.

9
2.2.1 Laymen
Decades of research in the social sciences suggests that laymen, or “intuitive
psychologists” as Ross (1977) labeled them, exhibit correspondence bias when making
inferential judgments about someone with whom they do not have a relationship. According to
Feigenson (2000, 44), “the evidence that common-sense social judgments, including judgments
about responsibility... may systematically diverge from legal (and/or scientific) norms is
overwhelming.” Further, laymen are melodramatic in their assignment of responsibility, meaning
they tend to exaggerate and sensationalize events, and be overemotional (Feigenson 2000).
Laymen “are inclined to believe that a bad thing... probably occurred because one person did a
deviant (i.e., bad) thing, and that the person behaved that way because of the sort of person he or
she is” (Feigenson 2000, 44). Further, laymen prefer “simple, mono-causal explanations for
events.” Therefore, laymen possess a common-sense schema of responsibility “in which one and
only one party, the 'bad-guy,' is to blame, and the other party [or in this case, the environment] is
more or less innocent” (Feigenson 2000, 44). Social psychology suggests that laymen tend to
prefer simple causal explanations to complex ones out of their need for cognitive closure, which
can lead to correspondence bias.
2.2.2 Professionals
Notwithstanding the voluminous evidence showing correspondence bias in laymen, one
might think that professionals, people with formal education, training, and experience in a
particular field, would be more adept at identifying situational cues that may lead to a particular
behavior. By doing so, they would avoid the fundamental attribution error and its accompanying
correspondence bias. While professional experience might increase awareness of certain
environmental elements and/or lead to more realistic expectations of behavior, considerable

10
evidence shows that well-educated, trained individuals who lack any type of relationship with an
individual they are observing exhibit correspondence bias as well (Arrington et al. 1985; Dripps
2003; Epley et al. 2002; Feigenson 2000; Kunda 1999; Ross 1977; Ross and Nisbett 1991).
Further, according to Dripps (2003, 1385), “psychology research suggests that decision makers
such as public officials charged with the administration of the criminal justice system are likely
to overestimate the causal significance of personal choice, and to correspondingly underestimate
the causal significance of situational factors in the behaviors of others.” Additionally, Arrington
et al. (1985) demonstrate that business owners exhibit correspondence bias when evaluating the
performance of auditors after audit failures.
2.2.3 The Empathetic Observer
Research has shown that empathy and/or the “degree of similarity of social perspective
between an actor and a subject [the observer]” (Arrington et al. 1985, 3) can influence the
attributional process in a manner that reduces or eliminates correspondence bias (Arkin et al.
1978; Arrington et al. 1985; Regan and Totten 1975). Arkin et al. (1978) conclude that the more
observers perceive themselves as similar to the actor, the less they will assign intrinsic causality
for outcomes to the actor. Further, Arrington et al. (1985) demonstrate that CPAs (as opposed to
business owners), when asked to evaluate the performance of auditors, are much more likely to
attribute audit failures to environmental factors as opposed to the disposition of the auditor.
Therefore, there is some evidence to demonstrate that empathy from the observer can reduce or
eliminate correspondence bias.
2.3 The In-Group/Out-Group Relationship Effect on Correspondence Bias
As further evidence of how empathy can influence the attribution process, research in
social psychology identifies the in-group versus out-group distinction as one that can affect
11
cognitive processes (e.g., Allport 1979; Baumeister and Leary 1995; Brewer 1999; Forsyth and
Schlenker 1977; Katz 1991; Leary and Forsyth 1987; Tajfel 2010; Zander 1971) In fact,
Baumeister and Leary (1995, 497) insist that “belongingness appears to have multiple and strong
effects on emotional patterns and on cognitive processes, and therefore people devote
considerable cognitive processing to interpersonal interactions and relationships” and less to
impersonal ones. As a result, people expect more favorable and fewer objectionable actions by
their in-group than by out-group members, and these expectations bias information processing
and memory, leading people to forget bad things (relative to good things) that their fellow in-
group members do (Howard and Rothbart 1980; Baumeister and Leary 1995). People also make
group-serving or “sociocentric” attributions for the performance of the groups to which they
belong. Further, members of a successful group may make group-serving attributions that put the
entire group in a good light, whereas group members may join together in absolving another’s
responsibility after failure (Forsyth and Schlenker 1977; Leary and Forsyth 1987; Zander 1971).
Linville and Jones (1980) show that people tend to process information about out-group
members in extreme, black-and-white, simplistic, polarized ways, whereas similar information
about members of their own group is processed in a more complex fashion. That is, the mere
existence of a social bond leads to more complex information processing, which can reduce or
eliminate correspondence bias. Therefore, one would expect correspondence bias, at least in the
sense of over-attribution to dispositional rather than environmental factors, to exist for out-group
but not in-group relationships.
2.4 Correspondence Bias as it Relates to FFR and the Judicial Process
Existing research related to FFR highlights the necessary factors for fraud. Starting with
the Cressey (1973) fraud triangle, research identifies three elements that must be in place for an

12
individual, or group of individuals, to commit fraud: pressure, opportunity, and the ability to
rationalize the act (e.g., Bell and Carcello 2000; Cressey 1973; Hogan et al. 2008; Rezaee 2004).
However, following an occurrence of FFR (e.g., Enron, WorldCom, Tyco, or the more recent
Madoff investment scandal), individuals tend not to think of the environmental factors that lead
to the occurrence of these frauds; rather they immediately begin to think of the persons involved
and their greed and disregard for the public interest. Ewing (2012) states that “in the aftermath of
a high profile financial reporting fraud, the press, prosecutors, regulators, and perhaps the whole
of society, rush to judgment, settle for superficial answers, and fail to push deep into the real
thrust of what transpired.” As a result, what may be missing is a true understanding of the
individuals who misrepresent their company’s financial statements and, perhaps more
importantly, the environment they operate in.
Following the detection of a potential FFR event, criminal and/or civil litigation is likely.
Therefore, much can be learned by looking at attributional differences that exist between the
constituents involved in the FFR judicial process. If any or all of the constituents involved in the
judicial process exhibit correspondence bias during their initial exposure to a potential FFR
event, their judgments and decisions from that point forward are likely to be affected. Further, if
these constituents fail to fully understand the environmental factors that lead to FFR, it is
unlikely that attempts to reduce the incidence of FFR will be as successful as they could be were
there a full understanding of all contributing factors.
A typical FFR judicial process, regardless of whether it involves criminal or civil
proceedings, includes important constituents in the form of jurors, lawyers, and the accused
accountant or accountants. Each of these constituents is to some extent responsible for, or
devoted to, the determination of both culpability (guilt or innocence) and level of causality

13
related to the FFR event.3 In their consideration of causality, jurors and lawyers are required to
consider both actual and proximate cause since both have to be present to prove guilt (James and
Perry 1951). According to Carpenter (1931, 229), “cause,” in legal terms, “means any and all
antecedents, active or passive, creative or receptive, which were factors involved in the
occurrence of the consequence.” Actual cause, or “cause in fact,” is perhaps the easiest to
identify and is determined with what lawyers refer to as the “but for rule.” The “but for rule” as
applied to FFR considers whether the FFR in question would have occurred “but for” the actions
of the accused accountant (James and Perry 1951).4 Proximate cause, however, is a much more
loosely defined concept in the law and therefore harder to identify. Proximate cause can actually
represent a situation or causal factor whereby the accused “shall be exempt from liability for
effects from which his wrongful act actually contributed,” meaning that, even though actual
cause exists, proximate cause from another factor alleviates some if not all of the defendant’s
culpability (Carpenter 1931, 230).
Within the context of an FFR event, environmental factors can be proximate causes of an
FFR outcome. While it is likely that the accused accountants will recognize and attribute
environmental factors as proximate causes, it less clear whether laymen jurors and professional
lawyers are initially able or willing to recognize environmental factors as proximate causes. If
jurors or lawyers over-attribute the cause of FFR to the disposition of the accused, this bias in
3 In both criminal and civil trials, jurors are responsible for determining both the culpability
(guilt or innocence) of the defendant and the level of causality (who or what is to blame)
attributed to the defendant. The level of causality is reflected in the form of sentencing or
punishment (e.g., prison, probation, fines, etc.) in a criminal trial and the amount of damages
awarded to the plaintiff in a civil trial. Accordingly, lawyers are tasked with providing evidence
to the effect of both culpability and causality in criminal and civil trials. Conversely, accused
accountants are likely to deny culpability and their involvement in any wrongdoing by looking to
ascribe causality to proximate or environmental factors. 4 If an accountant is responsible for financial reporting and knowingly reports something
fraudulently, it meets the actual cause criterion.
14
their initial attributions will limit their ability to fairly evaluate the complete set of causal factors
for FFR.
To examine attributional differences within the FFR environment, I conduct a scenario-
based experiment with three distinct groups of subjects, each representing an important
constituent in the judicial process: (1) laymen (i.e., potential jurors – those who are charged with
assessing culpability and causality during a trial, (2) corporate lawyers (i.e., legal professionals
who would either prosecute or defend individuals accused of committing FFR), and (3) corporate
accountants (i.e., accounting professionals who are in a position to commit and/or be accused of
FFR).5
In sum, the research directly examines three issues: (1) the extent to which laymen,
corporate lawyers, and corporate accountants make different attributions when observing
behavior related to FFR; (2) the extent to which laymen, corporate lawyers, and corporate
accountants fail to consider information related to consensus, consistency, and distinctiveness
(i.e., possible proximate causes) when observing behavior related to FFR; and (3) to the extent
that they exist, what leads to attributional differences between laymen, corporate lawyers, and
corporate accounting professionals.
2.5 Hypothesis Development - Correspondence Bias and the Decision to Commit FFR
FFR is a crime and the observation of an individual who has a choice to commit or not
commit FFR should lead to different attributions depending on the environment and outcome
decision (Gilbert and Malone 1995; Jones 1990; Kelley 1967; Nisbett and Ross 1980; Ross
5 To prevent subjects from assuming a particular role such as juror or lawyer when responding to
the scenarios, all subjects were told during the solicitation process that they are simply needed
for an impression management study.

15
1977).6 For example, the observation of an individual who commits FFR but is surrounded by
environmental factors that are indicative of FFR (e.g., other corporate controllers in the industry
appear to be accounting for the item fraudulently and there are no other readily apparent non-
fraudulent mechanisms to achieve the particular financial reporting goal) should lead to
environmental attributions indicative of a belief that the environment led him or her to commit
FFR. On the other hand, given a scenario where an observed individual decides not to commit
FFR in spite of environmental factors encouraging him or her to do so (e.g., other corporate
controllers in the industry appear to be accounting for the item fraudulently and there are no
other readily apparent non-fraudulent mechanisms to achieve the particular financial reporting
goal), an observer can, and should, make relatively high dispositional attributions. Essentially,
the observer should give credit to the observed individual for having the disposition to overcome
environmental factors that encourage FFR. However, as a result of correspondence bias, the
observer may fail to do so.
The outcome of a decision to commit or not to commit FFR should lead to different
attributions by an individual given a particular scenario with a particular set of dispositional or
environmental factors. With this in mind, separate hypotheses are made for two scenarios – one
in which an individual goes through with inappropriate accounting (i.e., an FFR outcome) and
one in which appropriate accounting is pursued (i.e., a Non-FFR outcome).
2.5.1 FFR Outcome Scenarios
Laymen are likely to view their relationship with someone who is in a financial
accounting position such as a corporate controller as an out-group relationship. Therefore,
6 Observers who witness a behavior such as FFR are likely to be more self-aware of their
attributions as compared to when they observe an expected behavior such as choosing to account
for something appropriately. However, observers can and will make attributions for an expected
behavior when prompted to do so.

16
laymen are unlikely to be empathetic towards such individuals. Laymen are also likely to be
melodramatic and seek mono-causal explanations for behavior as they strive for cognitive
closure (Feigenson 2000). Further, laymen are likely less aware of environmental factors that
exist in a financial reporting environment and have more unrealistic expectations about whether
corporate controllers are willing to commit FFR.
On the other hand, corporate lawyers, as compared to laymen, might have increased
awareness of environmental factors, more realistic expectations of behavior, and be less likely to
seek mono-causal explanations and cognitive closure. However, they will likely still view their
connection with corporate controllers as an out-group relationship. Therefore, corporate lawyers
can be expected to fail to exert the cognitive effort, or undertake the level of information
processing, necessary to avoid correspondence bias.
Finally, corporate accountants should have a much higher awareness of environmental
factors within an FFR environment and more realistic expectations as to whether or not corporate
controllers are willing to commit FFR. Additionally, corporate accountants are likely to view
their connection with corporate controllers as an in-group relationship and therefore have
empathy for the individuals who are in a position to make decisions that affect FFR outcomes.
As a result of a perceived in-group relationship, I predict corporate accountants will engage in
more information processing prior to making attributions.
The combination of in-group versus out-group information processing, with increased
awareness of situations leading to FFR, leads to the following alternative hypothesis for laymen,
corporate lawyers, and corporate accountants in FFR outcomes:
H1a: Laymen are more likely than Corporate Lawyers, and Corporate Lawyers are
more likely than Corporate Accountants, to attribute fraudulent outcomes to the
individual involved as evidenced by more dispositional attributions and higher
internality scores:

17
𝐼lay > 𝐼law > 𝐼acc
where: 𝐼lay = Mean Internality Score for Laymen;
𝐼law = Mean Internality Score for Corporate Lawyers; and
𝐼acc = Mean Internality Score for Corporate Accountants.
2.5.2 Non-FFR Outcome Scenarios
While prior research shows that individuals have a tendency to make dispositional rather
than environmental attributions when observing a behavior that conforms to the observer’s
expectation for that behavior (e.g., Arrington et al. 1985; Bierbrauer 1979; Feigenson 2000;
Gilbert et al. 1988; Jones and Harris 1967; Quattrone 1982; Sherman 1980), less is known about
how individuals make attributions when observing an actor who deviates from an expected
inappropriate behavior. However, if an individual is put in an environment where it appears that
environmental factors would lead him or her to perform an inappropriate behavior, yet the
individual is able to overcome the environmental factors and act appropriately, dispositional
attributions should normatively be made by observers.
Regardless of outcome (i.e., FFR or Non-FFR), laymen will perceive their connection
with corporate controllers as an out-group relationship and are unlikely to be empathetic. As a
result of this perceived out-group relationship, I expect laymen to seek simple explanations and
therefore fail to process information such that they are able to recognize the need for
dispositional attributions provided a Non-FFR outcome. In essence, laymen will fail to
appropriately weight the decision outcome upon learning that the corporate controller did not
commit FFR. Additionally, I expect laymen, as a result of their lack of professional training and
overall unfamiliarity with accounting concepts and acceptable business practices, to misinterpret
(i.e., misunderstand the significance and appropriateness of) FFR and Non-FFR outcomes more
frequently than corporate lawyers and corporate accountants. This misinterpretation will reduce

18
the likelihood that laymen recognize the need for dispositional attributions in Non-FFR
outcomes.
Similar to laymen, corporate lawyers can also be expected to view their relationship with
corporate controllers as out-group, and therefore they may not perform the information
processing needed to weight the decision outcome in a manner allowing them to make higher
dispositional attributions in a Non-FFR outcome. However, corporate lawyers, given their
background and experience, may do better than laymen at interpreting behavior and therefore be
likelier to identify the need for dispositional attributions in a Non-FFR outcome.
Corporate accountants, as a result of their perceived in-group relationship and ability to
empathize with the described corporate controller, can be expected to do more information
processing in determining attributions in a Non-FFR outcome, which will enable them to
interpret behavior better and appropriately weight the decision outcome in their attributions. As a
result, compared to corporate lawyers and laymen, corporate accountants will make higher
dispositional attributions provided a Non-FFR outcome.
Accordingly, I posit the following alternative hypothesis for Non-FFR outcomes:
H1b: Laymen are less likely than Corporate Lawyers, and Corporate Lawyers less
likely than Corporate Accountants, to attribute appropriate financial reporting
outcomes to the individual involved as evidenced by fewer dispositional
attributions and lower internality scores:
𝐼lay < 𝐼law < 𝐼acc
where: 𝐼lay = Mean Internality Score for Laymen;
𝐼law = Mean Internality Score for Corporate Lawyers; and
𝐼acc = Mean Internality Score for Corporate Accountants.
This hypothesis, along with H1a, is plotted graphically in Figure 1.

19
2.5.3 Interaction between Relationship Type and Decision Outcome
As noted in H1a and H1b, out-group observers (corporate lawyers and laymen) can be
expected to make dispositional attributions and in-group observers (corporate accountants) to
make environmental attributions following an FFR outcome. However, in a Non-FFR outcome,
out-group observers can be expected to fail to recognize the need for increased dispositional
attributions. In-group individuals will recognize the need for dispositional attributions and
therefore appropriately change their attributions from environmental to dispositional in a Non-
FFR outcome. Thus, out-group observers will be more responsive to a corporate controller’s
decision outcome and an interaction effect can be expected between relationship type (in-group
versus out-group) and decision outcome (FFR versus Non-FFR). This leads to the following
hypothesis:
H1c: An interaction exists between relationship type (in-group and out-group) and
decision outcome (FFR and Non-FFR outcomes) so that:
𝐼in_non-ffr – 𝐼in_ffr > 𝐼out_non-ffr – 𝐼out_ffr
where: 𝐼in_non-ffr = Mean In-Group Internality Score for Non-FFR;
𝐼in_ffr = Mean In-Group Internality Score for FFR;
𝐼out_non-ffr = Mean Out-Group Internality Score for Non-FFR; and
𝐼out_ffr = Mean Out-Group Internality Score for FFR.
Figure 2 plots this hypothesis graphically.
2.5.4 The Appropriate Interpretation of Consensus, Consistency, and Distinctiveness
Research shows that consensus, consistency, and distinctiveness influence the
attributional process. Therefore, a logical benchmark for assessing correspondence bias within
the FFR context can be established through the inclusion of three different types of information
content (situational, environmental, and no additional information). Similar to H1 above,
separate hypotheses are posited for the interpretation of varying levels of information type for
both FFR and Non-FFR outcomes.

20
2.5.5 FFR Outcome Scenarios
Within an FFR outcome, the inclusion of dispositional information (low consensus, high
consistency, and low distinctiveness) should lead to more dispositional attributions, whereas the
inclusion of environmental information (high consensus, low consistency, and high
distinctiveness) should lead to more environmental attributions for both in-group and out-group
observers. When no additional information is provided, individuals are expected to make
attributions based upon their preconceived notions of dispositional and environmental factors.
Since out-group individuals are generally expected to make more dispositional attributions than
in-group individuals, I expect the out-group internality scores to be higher across all three
information types. Accordingly, the following alternative hypothesis is posited for in-group and
out-group participants across the three information types provided an FFR outcome:
H2a: In-group individuals will have lower internality scores than out-group individuals
when dispositional, environmental, or no additional information is provided such
that in-group individuals make more environmental attributions provided an FFR
outcome:
𝐼in-dis < 𝐼out-dis And 𝐼in-env < 𝐼out-env And 𝐼in-no < 𝐼out-no
where: 𝐼in-dis = Mean Internality Score for In-Group individuals provided Dispositional
Information;
𝐼out-dis = Mean Internality Score for Out-Group individuals provided Dispositional
Information;
𝐼in-env = Mean Internality Score for In-Group individuals provided Environmental
Information;
𝐼out-env = Mean Internality Score for Out-Group individuals provided
Environmental Information;
𝐼in-no = Mean Internality Score for In-Group individuals provided No Additional
Information; and
𝐼out-no = Mean Internality Score for Out-Group individuals provided No Additional
Information.
Figure 3 plots this hypothesis graphically.

21
2.5.6 Non-FFR Outcome Scenarios
Consistent with the interaction hypothesis (H1c) above, in-group individuals are expected
to make appropriate dispositional attributions in a Non-FFR outcome but out-group individuals
are not. An in-group individual’s ability to recognize, and an out-group individual’s failure to
recognize, the need for dispositional attributions following a Non-FFR outcome should occur
when situational and no additional information is provided. This is a result of the in-group’s
ability to think through the various combinations of information provided (or lack thereof in the
instance of no additional information) and outcome. To the extent that dispositional information
is provided, in-group individuals are more likely to attribute Non-FFR action to the environment
(i.e., they are able to interpret the conflicting nature of the dispositional information and
outcome), whereas out-group individuals will fail to process the information any differently from
the other two information types. Accordingly, the following alternative hypotheses are posited
for in-group and out-group participants across the three information types provided a Non-FFR
outcome:
H2b: In-group individuals will have lower internality scores than out-group individuals
when dispositional information is provided such that they make more
environmental attributions provided a Non-FFR outcome:
Iin-dis < Iout-dis
H2c: In-group individuals will have higher internality scores than out-group individuals
when environmental and no additional information is provided such that they
make more dispositional attributions provided a Non-FFR outcome:
𝐼in-env > 𝐼out-env And 𝐼in-no > 𝐼out-no
where: 𝐼in-dis = Mean Internality Score for In-Group individuals provided Dispositional
Information;
𝐼out-dis = Mean Internality Score for Out-Group individuals provided Dispositional
Information;
𝐼in-env = Mean Internality Score for In-Group individuals provided Environmental
Information;

22
𝐼out-env = Mean Internality Score for Out-Group individuals provided
Environmental Information;
𝐼in-no = Mean Internality Score for In-Group individuals provided No Additional
Information; and
𝐼out-no = Mean Internality Score for Out-Group individuals provided No Additional
Information.
Figure 4 plots these hypotheses graphically.
2.5.7 Causes of Correspondence Bias
Although internality scores are indicative of dispositional or environmental attributions
and help to identify correspondence bias within the FFR environment, they do not specifically
indicate why differences in attributions exist or what mediates correspondence bias for laymen,
corporate lawyers, or corporate accountants. According to Gilbert and Malone (1995),
correspondence bias is caused by four distinct mechanisms: (a) lack of awareness, (b) unrealistic
expectations, (c) inflated categorizations, and (d) incomplete corrections. Each of these
mechanisms can individually or collectively lead to correspondence bias.
Differences in contextual awareness for laymen, corporate lawyers, and corporate accountants
likely result from differences in training, level of experience, and overall exposure to the
financial reporting environment. Therefore lack of awareness is assuredly one of the causes of
correspondence bias related to FFR.7 However, it is more difficult to predict how each group of
constituents is affected by their (a) ex-ante expectations of FFR, or what Gilbert and Malone
refer to as possible “unrealistic expectations,” (b) individual perceptions of the observed
behavior (i.e., inflated categorizations), and (c) the possible failure to correct or adjust their
original inferences (i.e., incomplete corrections). The following sections posit hypotheses for
7 A specific hypothesis is not provided for lack of awareness. Lack of awareness is, however,
addressed and controlled for in the supplemental analysis section.

23
whether lack of awareness, unrealistic expectations, inflated categorizations, and/or incomplete
corrections cause correspondence bias for each of the constituent groups.
2.5.7.1 Unrealistic Expectations
Even observers “who are completely aware of the actor’s situation may still have
unrealistic expectations about how that situation should affect the actor’s behavior” (Gilbert and
Malone 1995, 27) and therefore incorrectly estimate the power of certain situations to induce
certain behaviors. Essentially, the “availability heuristic” can lead observers to judge behaviors
that are easily imagined or remembered as especially common differently from those that are not
(Tversky and Kahneman 1973).8 A behavior that “just happens to be common in the observer’s
corner of the world, recent in the observer’s experience, or part of the observer’s own behavioral
repertoire may be seen as enjoying greater consensus than in fact it does” (Gilbert and Malone
1995, 27) and can create a “false consensus effect” (Ross et al. 1977, 280). To the extent that
easily imaginable actions, such as one’s own, are thought to be typical actions or recent
experiences come to the forefront in an observer’s thought process, use of the availability
heuristic can lead observers to have unrealistic expectations for the behavior of others. When
such expectations are violated, unwarranted dispositional attributions may result in
correspondence bias.
As compared to laymen, corporate accountants and corporate lawyers (albeit to a lesser
extent) should have greater awareness of the overall business environment and the factors that
encourage and discourage FFR. Further, corporate accountants and corporate lawyers, as a result
8 Bonner (2007) identifies the availability heuristic as a potential cause of bias in third-party
evaluations and claims that the “most pervasive” of biases is the fundamental attribution error or
correspondence bias whereby third parties “tend to deem person-related causes, particularly
those perceived to be stable characteristics such as personality traits and abilities, as more
important in causing effects than task-related or environmental causes” (Bonner 2007, 268).

24
of their training, expertise, and background, should have a working knowledge of the financial
reporting environment. Laymen, on the other hand, are likely to have limited knowledge of the
financial reporting environment. Additionally, laymen likely have a melodramatic view of the
world when it comes to unfamiliar contexts, and as a result, are likely to have unrealistic
expectations and overestimate the occurrence of FFR. As such, I expect corporate accountants
and corporate lawyers to initially have a lower baseline estimate of the likelihood and/or
prevalence of FFR as compared to laymen. Given corporate accountants increased awareness of
the financial reporting environment as compared to that of corporate lawyers, I expect corporate
accountants to have more realistic expectations about the prevalence of FFR and therefore to
assess a lower likelihood of FFR. Accordingly, I propose the following alternative hypothesis
regarding unrealistic expectations relative to correspondence bias:
H3a: Corporate Accountants will assess a lower likelihood of an FFR outcome than
Corporate Lawyers, and Corporate Lawyers will assess a lower likelihood of an
FFR outcome than Laymen:
𝐿acc < 𝐿law < 𝐿lay
where: 𝐿acc = Mean Likelihood for Corporate Accountants;
𝐿law = Mean Likelihood for Corporate Lawyers; and
𝐿lay = Mean Likelihood for Laymen.
2.5.7.2 Inflated Categorizations
It is possible for a behavior to be misinterpreted even when an observer has complete
awareness and realistic expectations of the behavior.9 When an observer witnesses a behavior,
9 Trope (1986) and Trope et al. (1988) show that an observer’s awareness of a situation can give
rise to expectations for an actor’s behavior that, in turn, may induce the perceptual assimilation
of that behavior. Thus, the very awareness that enables the observer to have a realistic
expectation for behavior may cause the observer to have an inaccurate perception of that
behavior. “The irony… is that the observer’s excellent knowledge of the situation has ‘inflated’
her categorization of the actor’s behavior, which in turn has led her to make an unwarranted
25
that observer’s perception of the behavior is based on his or her prior knowledge of the context
in which the behavior occurred. This prior knowledge can alter the perception of the behavior
and lead to what Gilbert and Malone (1995) refer to as “inflated categorizations” of behavior.10
An observer must properly interpret the observed behavior to avoid inflated
categorizations and make appropriate attributions. Within the context of the FFR environment, it
is important that the observer recognize the difference between appropriate and fraudulent
accounting. Given their knowledge of the financial reporting environment, I predict that
corporate accountants are better than corporate lawyers and laymen at interpreting and
identifying the outcome behavior as either FFR or Non-FFR. Further, given corporate lawyers’
additional expertise and training, I predict that corporate lawyers are better at interpreting and
identifying outcome behavior then laymen. Accordingly, I propose the following alternative
hypothesis:
H3b: Corporate Accountants will more accurately identify FFR and Non-FFR outcomes
than Corporate Lawyers, and Corporate Lawyers will more accurately identify
FFR and Non-FFR outcomes than Laymen:
𝐴acc > 𝐴law > 𝐴lay
where: 𝐴acc = Mean Accuracy for Corporate Accountants;
𝐴law = Mean Accuracy for Corporate Lawyers; and
𝐴lay = Mean Accuracy for Laymen;
dispositional inference about an actor whose situation she understands perfectly” (Gilbert and
Malone 1995, 28). 10 According to Gilbert and Malone (1995), if lack of awareness were the sole cause of
correspondence bias, then one might expect the bias to disappear when observers are completely
aware of the actor’s situation and have realistic expectations for behavior in that situation. This is
not the case. In fact, under certain conditions, awareness of situational constraints may actually
cause correspondence bias. One way to think of the attribution process is as a “matching test” in
which the observer compares the actor’s behavior with their expectations for that behavior and
determines whether the behavior meets those expectations (Gilbert and Malone 1995). The
problem is that observers are only able to use their perceptions of behavior and the interpretation
or categorization of behaviors “may be profoundly affected by knowledge of the context in
which they occurred” (Gilbert and Malone 1995, 28).
26
2.5.7.3 Incomplete Corrections
The fourth potential cause of correspondence bias results from incomplete corrections
made by observers. Incomplete corrections may occur when observers are either unable or
unwilling to correct their original inferences (Gilbert and Malone 1995). Since dispositional
inferences are the “products of a mismatch between the observer’s expectations for, and
perceptions of, the actor’s behavior” (Gilbert and Malone 1995, 29), if an observer “improperly
calculates the value of either of these elements, a ‘false mismatch’ will result, and
correspondence bias may follow” (Gilbert and Malone 1995, 29).
Provided additional dispositional or environmental information, astute observers should
adjust their initial prediction of the likelihood that a corporate controller would commit FFR.
However, consistent with in-group versus out-group information processing, and the evidence
that in-group members engage in more information processing when evaluating similar others, I
expect only corporate accountants to be able to process the additional information in a manner
that will allow them to appropriately adjust their likelihood estimates. I do not expect out-group
laymen and corporate lawyers to correctly adjust their predictions. Accordingly, I propose the
following alternative hypothesis:
H3c: Corporate Accountants will adjust their likelihood estimate more than Laymen
and Corporate Lawyers provided additional dispositional or environmental
information:
𝑋acc > 𝑋lay And 𝑋acc > 𝑋law
where: 𝑋acc = Mean Adjustment for Corporate Accountants;
𝑋lay = Mean Adjustment for Laymen; and
𝑋law = Mean Adjustment for Corporate Lawyers.

27
CHAPTER THREE
RESEARCH METHODOLOGY
3.1 Research Design
In order to test for the existence and magnitude of correspondence bias and to identify its
potential causal factors, I conduct an experiment whereby participants are provided three
different scenario-based case studies after providing an initial baseline estimate that corporate
controllers are willing to account for something in a manner that would mislead users of their
financial statements. Within each case study, information type (environmental, dispositional, and
no additional information) is manipulated, and participants assess the likelihood that a particular
corporate controller will account for a specific item11 inappropriately and in a fraudulent manner.
Participants are then informed whether or not the corporate controller accounted for the item
appropriately and asked to rate the factors they feel contributed to the controller’s action.
Participants’ responses are compared within- and between-subjects to determine (1) whether
attributional differences exist in a financial reporting context, (2) how the inclusion of
information around consensus, consistency, and distinctiveness affects attributions, and (3)
which of the factors identified by Gilbert and Malone (1995) contribute to differences in
attributions should differences exist.
Using variations of the designs found in Arrington et al. (1985) and Kaplan et al. (2007),
the study utilizes a 3x3x2 nested block design with two fixed treatment factors (information type
and outcome) to compare the judgments of laymen, corporate lawyers, and corporate
11 Each of the three scenarios presented a particular expense for which a corporate controller had
to decide to appropriately report in the current period or inappropriately postpone until the next.
The expense type consisted of either (1) a particular portion of payroll, (2) a particular
advertising expense, or (3) a particular consulting contract, and was presented in a randomized
order for each participant. Where appropriate, expense type is included as a random effect within
all analyses.

28
accountants. This design is necessary to test for two- and three-way interactions among
constituent group (laymen, corporate lawyers, and corporate accountants), information type
(dispositional, environmental, and no additional), and decision outcome (FFR and Non-FFR),
and to eliminate the possibility that idiosyncrasies of individual participants lead to differences in
attributions. Manipulations are assigned to participants in accordance with the schedule provided
in Figure 5, which was generated using the Custom Designs tool in JMP® (SAS Institute).
Through the series of three scenarios – which describe a particular accounting decision
and include varying levels of environmental, dispositional, or no additional information –
participant responses are compared within-subject to identify how the various types of
information, as well as the decision by the observed individual to commit or not commit FFR,
influence the attributional process. Additionally, aggregate responses from the different groups
of participants are compared between-subjects to identify how each group makes attributions and
to determine which groups, if any, exhibit correspondence bias. Finally, through a comparison of
participants’ baseline estimates for FFR, subsequent scenario specific likelihood estimates of
FFR, and interpretations of the FFR/Non-FFR outcomes, participant responses are compared
both within- and between-subjects to isolate the potential causes of correspondence bias (e.g.,
unrealistic expectations, inflated categorizations, and incomplete corrections).
3.2 Pilot Testing
To ensure readability of the instrument and to refine the variables of interest, pilot testing
was performed with several distinct subject pools. In total, 177 respondents completed the study
during pilot testing. Pilot subjects were recruited from an undergraduate general business class,
several sections of an undergraduate Principles of Accounting class, and a continuing
professional education conference for CPAs. As a result of pilot testing, refinements were made

29
to the wording of the questions pertaining to the dependent variables, questions were dropped,
and additional questions related to recent changes in overall business culture were added. Pilot
testing also led to a focus on a direct internality scale as a measure attributions rather than an
indirect internality scale.
3.3 Independent Variables
Independent variables include relationship type, constituent group, information type, and
the controller’s decision outcome. Relationship type consists of in-group for corporate
accountants and out-group for corporate lawyers and laymen. Constituent group relates to which
subject pool a participant belongs and consists of corporate accountants, corporate lawyers, or
laymen. As depicted in Table 2, information type is manipulated at three levels: dispositional,
environmental, and no additional information provided. Decision outcome is manipulated at two
levels: the controller proceeds with inappropriate accounting (FFR outcome) or does not proceed
with inappropriate accounting (Non-FFR outcome). Participants from each constituent group are
randomly assigned to the appropriate schedule of manipulations as provided in Figure 5.
Additionally, to ensure participants view each controller’s decision independently, an expense
type is randomly assigned to each scenario but never repeated for a single participant. Within
each scenario a participant reviews a decision related to one of the following (1) payroll expense,
(2) advertising expense, or (3) a consulting expense.
In addition to the independent variables described above, participant’s baseline
expectation about the general occurrence of fraud is collected and used to calculate an
adjustment score. Prior to completing any scenarios, participants provide their overall
expectation (i.e., a baseline estimate of the occurrence of FFR outcomes) of the percentage of
accountants who work at public companies and are responsible for the financial reporting

30
decisions who would knowingly and intentionally account for something in a manner that would
mislead the users of their financial statements. This baseline estimate is compared to the
participant’s scenario specific likelihood estimate that the corporate controller will commit FFR
to determine how participants adjust their initial estimate in accordance with the type of
information provided (see additional description of the adjustment score in the dependent
variable section below). Finally, demographic and personal characteristics such as age,
profession, experience with FFR, professional credentials, mood,12 and overall perceptions of
recent changes in business culture are collected and tested as covariates to control for their effect
on participant attributions and/or correspondence bias.
3.4 Dependent Variables
Dependent variables include an internality score, the adjusted likelihood estimate that a
particular corporate controller will commit FFR, and the assessment of the appropriateness of the
controller’s action. The primary dependent variable, developed in accordance with Kaplan et al.
(2007), is collected using a single slider scale ranging from -10 to 10. The scale is anchored by
“Environmental Factors” (-10) and “The Controller’s Personal Disposition” (10). A positive
score is therefore indicative of dispositional attributions (i.e., the actor being perceived as a more
salient cause of a particular outcome than is the environment) and a negative score indicates
environmental attributions (i.e., the environment being perceived as more salient). Attributional
differences are therefore identified by consistently higher or lower internality scores across
subjects for a particular information type and outcome combination.
Two additional dependent variables are a participant’s adjustment score (i.e., the scenario
specific adjusted likelihood estimate of FFR) and an appropriateness assessment of a particular
12 Measured in accordance with Chung et al. (2008).

31
controller’s outcome decision. In order to evaluate a participant’s adjustment from their initial
baseline estimate to their scenario specific estimate, a difference score is calculated. A
participant’s scenario specific likelihood estimate is compared to their original baseline estimate
and used to identify incomplete corrections as a potential cause of correspondence bias.
Following the indication of each scenario specific decision outcome, participants are
asked to assess the appropriateness of the controller’s decision. Each participant’s understanding
of the appropriateness of the controller’s accounting choice is used to determine whether or not
the participant fully understood the behavior within each scenario. Participants are asked to
evaluate the controller’s action as either appropriate (Non-FFR) or inappropriate (FFR). The
assessment is collected on a nine-point scale with highly inappropriate (1) and highly appropriate
(9) as the end points. This assessment is then used to identify situations in which participants do
not fully understand the controller’s action resulting in what Gilbert and Malone (1995) refer to
as inflated categorizations. Table 4 presents a Pearson Correlation Matrix of the variables used
for analysis.
3.5 Sample
A total of 134 participants (41 laymen, 45 corporate lawyers, and 48 corporate
accountants) participated in the study. Table 3 provides detailed participant characteristics.
During the study, participants from each constituent group were randomly assigned to the
appropriate schedule of manipulations provided in Figure 5. To recruit each group of participants
the following measures were taken.

32
3.5.1 Laymen
Laymen participants were procured through Qualtrics13 and paid a nominal fee for their
participation. In total 53 laymen respondents accessed the online survey. Ten of these
respondents were removed by Qualtrics Panels and not paid for their participation as a result of
the limited time they spent on the survey.14 Additionally, two respondents procured through
Qualtrics Panels indicated within their responses they are licensed CPAs. These respondents
were removed from analysis to eliminate any confounding effects between laymen and
accounting participants.
3.5.2 Corporate Lawyers
Corporate lawyers were procured through personal contacts and relationships maintained
by the ACIS department at Virginia Tech. I contacted attorneys at several large law firms with
whom I have relationships and who specialize in corporate law, and asked if they would be
willing to participant in an online study I was conducting for my dissertation around impression
formation. Additionally, two faculty members at Virginia Tech helped facilitate participation
from several law firms. In order to participate, all lawyers were required to have previously
provided legal counsel to businesses or corporations.
In total, 53 corporate lawyers accessed the online survey. Of these, eight respondents did
not finish the survey resulting in 45 complete corporate lawyer responses.
13 Qualtrics is a global, web-based market research company specializing in survey design, data
collection, and data analysis. Qualtrics provides an easy-to-use Internet platform connecting
researchers with pre-screened experimental participants. According to the Company website
(www.qualtrics.com), approximately 1,300 universities worldwide, including every major
university in the United States, obtains access to Qualtrics. 14 In order to eliminate individual respondents who do not take a survey seriously, Qualtrics
Panels has a policy to remove and not pay any survey respondents who complete a survey in less
than one third of the average time it takes all respondents to complete that particular survey.

33
3.5.3 Corporate Accountants
Similar to corporate lawyers, corporate accountants (predominately CPAs) were procured
through personal contacts and relationships maintained by the ACIS department at Virginia
Tech. All corporate accountants were required to currently be, or have previously been,
employed in a financial reporting role. I contacted several large corporations (predominantly
public), as well as individual corporate accountants with whom I had a previous relationship and
asked if they, as well as any of their financial accounting colleagues, would respond to an online
survey about impression formation. Additionally, a faculty member and former department head
of the ACIS department helped facilitate participation from the financial accounting personnel at
several public companies.
In total 57 corporate accountants accessed the online survey. Of these, nine respondents
did not finish the survey resulting in 48 completed accountant responses.
3.6 Experimental Instrument
Participants were asked to participate in an online academic study via Qualtrics. Figure 6
provides a flowchart of the experimental instrument. The complete instrument as presented to
online participants is provided in Appendix A. Each section of the instrument is described below.
3.6.1 Introduction
All participants received a general overview of the experiment. Within the general
overview, participants were informed that they would be asked to read a total of three distinct
scenarios whereby three different corporate controllers are faced with a particular financial
reporting decision. Participants were told that they would be responsible for making assessments
of each corporate controller’s action and then, upon being informed of the specific action taken

34
by the corporate controller, asked to indicate what factors they feel were relevant to the corporate
controller’s decision.
3.6.2 Initial Baseline Estimate of Accountants’ Willingness to Commit FFR
After reading the introductory materials, participants were asked for their baseline
estimate that an ordinary financial accountant would be willing to commit FFR. Specifically,
participants were asked the following question:
What percentage of accountants who work at publicly traded companies and are
responsible for the financial accounting decisions at their company would knowingly and
intentionally account for something in a manner that would mislead the users of their
financial statements?
_______ % of accountants would knowingly and intentionally account for something in a
manner that would mislead the users of their financial statements.
_______ % of accountants would not knowingly and intentionally account for something
in a manner that would mislead the users of their financial statements.
(Note: Total % must = 100)
3.6.3 Case-Based Scenarios
Participants were then asked to complete a series of three case-based scenarios whereby
the type of information was manipulated as dispositional, environmental, or no additional
information, as specified in Table 2. The order of scenarios, type of information provided, and
decision outcome was specifically assigned to each participant. However, participants were
randomly assigned to the unique combinations of manipulations shown in Figure 5. Within each
scenario participants were first asked to review a particular set of circumstances and provide a
likelihood estimate of the percentage of corporate controllers who would include a specific
expenditure in the current year. Upon providing their likelihood estimate, participants were then
informed of the scenario specific corporate controller’s decision (i.e., chose to report the expense
in the current year or chose not to report the expense). To gauge their perceptions of the
controller’s intent to, or not to, commit FFR, participants then evaluated the appropriateness

35
(from highly inappropriate to highly appropriate) of the corporate controller’s decision.
Participants were then asked to attribute the causes of the corporate controller’s action prior to
proceeding to the next scenario.
3.6.4 Post-Experiment Questionnaire
After completing a third and final scenario, demographic and other information was
collected from participants in a post-experiment questionnaire. Collected demographics and
personal characteristics include participants’ gender, year of birth, profession, years of
experience, experience with FFR, and mood. Additionally, participants answered a series of
questions related to perceived changes in overall business culture. To conclude, participants were
asked if they feel more could be done to improve the overall financial reporting environment and
whether more should be done in the aftermath of financial reporting fraud to understand the
causal factors of the event. To the extent participants indicated that yes more could be done in
response to either question, they were asked to provide free-response suggestions for
improvement.

36
CHAPTER FOUR
DATA ANALYSIS
4.1 Preliminary Analysis
I use linear mixed effect models to test my specific hypotheses. Prior to running the
models, I first perform several preliminary analysis tests to determine whether the data collected
meets the three basic assumptions of parametric linear modeling – independent observations,
normal distribution of the dependent variables, and homogeneity of variance (Keppel 1991, 97).
The first assumption, independent observations, was addressed in experimental design by
randomly assigning participants to the experimental conditions. For the second assumption,
normal distribution of the dependent variables, I visually examined the data using boxplots and
normal probability plots which raised concerns regarding the normality of the dependent
variables. I next obtained Shapiro-Wilk test statistics based on the primary dependent variable,
two additional dependent variables, and three primary independent variables. These tests indicate
that the data often fail to meet the second assumption of normality. For the third assumption,
homogeneity of variance, I use the Leven’s statistic to test each of the dependent variables. In
many instances I do not find evidence of equal variance (p < .10) in the data for the dependent
variables.
Although the F statistic generated by linear models is robust to modest violations of these
assumptions (Ferguson 1981, 245; Kirk 1968; Neter et al. 1996), the number of violations from
the primary dependent variable (i.e., the internality assessment) and the two secondary dependent
variables (i.e., the adjusted likelihood the scenario specific corporate controller will commit FFR
and the appropriateness assessment) lead me to supplement my analysis with Mann-Whitney
37
two-sample rank-sum tests.15 The Mann-Whitney is a nonparametric test that makes no
assumptions regarding the distribution of the data (Mann and Whitney 1947; Wilcoxon 1945).
4.2 The Full Mixed Effects Model
In full consideration of the 3x3x2 design of my study, and recognizing the design
includes both fixed (constituent group, information type, and outcome) and random effects
(expense type and the participant themselves), I use mixed effects models to test the main effects
of relationship type, constituent group, information type, and outcome, as well as the two and
three-way interactions among all variables of interest. The benefit of this model is that it allows
for the inclusion of the random effects of expense type as well as any idiosyncratic biases that
any one individual participant brings to the study (McLean et al. 1991).
As depicted in Table 5, the full mixed models (Panel A presents a model testing the main
effect of relationship type and Panel B presents a model testing the main effect of constituent
group) reveal main effects for constituent group (F = 8.01, p = .001, two-tailed) and outcome (F
= 55.41, p = <.001 in Panel A and F = 48.28, p < .001 in Panel B), but no main effects for
relationship type (F = 0.22, p = .640, two-tailed) and information type (F = 1.22, p = .298, two-
tailed, in Panel A and F = 1.50, p = .226, two-tailed, in Panel B). All two and three-way
interactions are non-significant (all p-values > .100), except for the interaction of relationship
type and outcome (F = 4.20, p = .041, two-tailed, in Panel A) and constituent group and outcome
(F = 2.47, p = .086, two-tailed, in Panel B).16 The finding that relationship type does not have a
main effect in Panel A, but constituent group does in Panel B, combined with the hypothesis
testing below provides evidence corporate lawyers do not process the information they receive
15 Additionally, when possible, I run the Kruskal Wallis ANOVA for all variables of interest and
find the results are consistent with the results of the parametric mixed model tests. 16 All inferences remain the same when controlling for gender, age, mood, and experience with
FFR.

38
consistent with that expected of an out-group relationship. In fact, several of the additional tests
below indicate that corporate lawyers are able to fully incorporate relevant information and
remain relatively unbiased in their attributions. As expected, laymen appear to be biased in their
attributions consistent with an out-group relationship.
Based upon the findings from, and my interpretation of the full mixed model, I proceed
with hypothesis testing using simpler versions of the mixed effects model.17 It should be noted
that all relationships reported, and inferences gained from them, remain the same when running
non-parametric tests except where specifically indicated below. Also, as noted below Tables 5
through 7, all inferences remain the same when controlling for gender, age, mood, and previous
exposure to FFR.
4.3 Attributional Differences – Hypotheses H1a-c
To examine the attributional differences of laymen, corporate lawyers, and corporate
accountants, attributions are examined for both FFR and Non-FFR outcomes using mixed linear
models. Consistent with H1a, I find a significant effect for constituent group for FFR outcomes
(F = 4.50, p = .013, two-tailed, see Table 6 Panel B)18 indicating that constituent groups make
different attributions. As evidence in Table 6 Panel A and Figures 7 and 8, when observing FFR
outcomes, laymen make more dispositional attributions, with a mean = 2.95, than corporate
lawyers, mean = -0.88, and corporate accountants, mean = -0.33. Interestingly, both corporate
lawyers and corporate accountants make neutral attributions that are neither significantly
17 Provided the non-significant two and three-way interactions found in the full model, specific
hypotheses are tested using mixed models that do not include the two and three-way interactions. 18 Results of mixed models analyzing the attributions of each pair of constituent groups indicate
the following for FFR outcomes: Laymen make different attributions than corporate lawyers (F =
14.61, p < .001, untabulated), laymen make different attributions than corporate accountants (F =
10.36, p =.001, one-tailed, untabulated), and corporate accountants and corporate lawyers make
similar attributions (F = 0.32, p = .570, two-tailed, untabulated).
39
different from zero (t = -1.30, p = .099, and t = -0.47, p = .319, respectively), nor different from
each other (t = 0.57, p = .285). The mean laymen attribution is significantly different from zero (t
= 3.98, p < .001) and significantly different from attributions of corporate lawyers and corporate
accountants (t = 3.82, p < .001, and t = 3.22, p = .001, respectively). This is indicative of laymen
exerting correspondence bias and making the fundamental attribution error when observing FFR
outcomes. In addition, these results demonstrate that corporate lawyers and corporate
accountants do not over attribute an observed FFR outcome to either disposition or environment.
For Non-FFR outcomes, H1b predicts that out-group laymen and corporate lawyers fail to
make dispositional attributions, whereas corporate accountants do not. Consistent with H2a, I
find a significant effect for constituent group for Non-FFR outcomes (F = 5.59, p = .005, two-
tailed, see Table 6 Panel C). However, as shown in Table 6 Panel A and Figures 7 and 8, all three
constituent groups on average are able to recognize situations where controllers make
appropriate decisions by making net dispositional attributions. The mean attributions for each
constituent group are 5.41 for laymen, 1.76 for corporate lawyers, and 4.00 for corporate
accountants. Interestingly, laymen make higher dispositional attributions than both corporate
lawyers and corporate accountants when observing Non-FFR outcomes (t = 3.90, p < .001, and t
= 1.73, p = .043, respectively). Further, corporate accountants make more dispositional
attributions than corporate lawyers (t = 2.52, p = .007) and each group’s attributions are
significantly greater than zero (t = 8.95, p < .001, t = 2.49, p = .008, and t = 7.29, p < .001,
respectively). Collectively these results demonstrate that all three constituent groups are able to
appropriately make dispositional attributions when observing Non-FFR outcomes.
H1c predicts an interaction between relationship type (in-group and out-group) and
decision outcome. Results of a mixed model for relationship type and outcome show a non-

40
significant main effect for relationship type (F = 0.22, p = .640, two-tailed, see Table 5 Panel A)
and a significant interaction (F = 4.20, p = .041, see Table 5 Panel A). Provided the findings
from the full mixed model as well as testing for H1a and the idea that lawyers may not
appropriately be categorized as out-group, I also test for an interaction between constituent group
and outcome. As evidenced by the non-significant interaction coefficient (F = 2.16, p = .117,
two-tailed) in Table 6 Panel D, an interaction between constituent group and decision outcome
does not exist for FFR outcomes. The interaction between relationship type and outcome, and
lack of interaction between constituent group and outcome, provide additional evidence that
corporate attorneys are not appropriately classified as out-group. Rather, they are processing
information consistent with members of an in-group.
Because an interaction does not exist between constituent group and outcome, the direct
effects of both constituent group and outcome can be interpreted as presented above in H1a&b and
in Table 6. See Figures 8 and 9 for graphical depictions of internality assessments by constituent
type for each outcome.
4.4 Effect of Information Type – Hypotheses H2a-c
In H2a-c I hypothesize that internality scores will be systematically different between in-
and out-group participants, and that these differences will depend on the type of additional
information provided as well as the outcome. For H2a-c I first compare internality scores across
relationship type and information type using a mixed model. As a result of the findings that
corporate lawyers may make attributions more consistent with in-group corporate accountants, I
also perform this comparison across constituent group when testing H2a-c.
H2a predicts in-group corporate accountants will consistently have lower internality
scores than out-group laymen and corporate lawyers across all information types provided an

41
FFR outcome. I find a non-significant effect for relationship type (F = 1.60, p = .105, one-tailed,
untabulated) and a significant effect for information type (F = 2.41, p = .048, one-tailed,
untabulated) when comparing internality scores across relationship type and information type.
However, I find significant main effects for both constituent group (F = 4.79, p = .010, two-tail)
and information type (F = 3.34, p = .040, two-tailed)(see Table 7 Panel B) when comparing
internality scores across constituent group and information type. As indicated in Figure 9,
corporate accountants do not consistently have lower internality scores than corporate lawyers
but they do compared to laymen.
An inability to interpret the type of additional information and adjust attributions
accordingly is indicative of correspondence bias (Arrington et al. 1985; Kelley 1967; Nisbett and
Ross 1980) and theory indicates that in-group individuals should adjust their attributions
according to the information type provided. However, corporate accountants do not appear to
incorporate the different information types into their attributions, as evidenced by none of their
internality scores across the three information types (dispositional = -0.65, environmental = -
1.08, and no additional information = 0.91, see Table 7 Panel A) being significantly different
from zero (t = -0.56, p = .292, t = -0.86, p = .199, and t = 0.77, p = .226, respectively).
Surprisingly, corporate lawyers appropriately incorporate additional information into their
attributions when environmental information is provided. While the corporate lawyers on
average make more dispositional attributions when provided dispositional information, their
mean internality score (1.18) is not significantly different from zero (t = 1.05, p = .153), nor is it
significantly different from their mean attribution when no additional information is provided
(mean = -0.05, t = 0.71, p = .243).

42
Since in-group corporate accountants should be able to process and incorporate the
varying information types into their attributions, I further investigate the finding that the
information type does not influence corporate accountants’ attributions. I do this by examining
the effect information type has on corporate accountants’ scenario specific likelihood estimate
that the controller will commit FFR (see discussion under Causes of Correspondence Bias for a
detailed description of adjusted likelihood estimate).
In doing so, it is evident corporate accountants do incorporate the information type into
their scenario specific likelihood estimate, specifically for environmental information. When
provided additional dispositional or environmental information, corporate accountants increase
their likelihood estimate of FFR over their estimate when no additional information is provided
by 6.53% and 13.53%, respectively. Results of a mixed model indicate that the scenario specific
estimates are different (F = 4.82, p = .010, two-tailed, untabulated) across information type.
Differences between the revised estimates are significantly different for environmental (t =
2.575, p = .006), but not dispositional information (t = 1.26, p = .106, one-tailed) when compared
to estimates when no additional information is provided. While it is evident that corporate
accountants can interpret environmental information, they do not carry this influence forward to
their attributions of the outcome decision. This result indicates that some other overriding factor
may be influencing corporate accountants’ attributions.
Similar to corporate accountants, laymen make equal attributions across all information
types as the differences between their attributions when dispositional information (mean = 4.00)
and environmental information (mean = 2.53) is provided, as well as the difference between their
attributions when dispositional and no additional information (mean = 2.54) are all non-
significant (t = 0.79, p = .219, and t = 0.78, p = .220, respectively).

43
Collectively these results indicate that corporate accountants and corporate lawyers
consistently make less dispositional attributions than laymen. While corporate lawyers are the
only constituents who incorporate additional information into their attributions, and they only
incorporate additional environmental information, corporate accountants are able to interpret
additional environmental information and adjust their scenario specific likelihood estimates
accordingly. This additional information does not however carry forward to corporate
accountants’ attributions.
H2b, predicts in-group individuals will make less dispositional attributions compared to
out-group individuals for Non-FFR outcomes when dispositional information is provided. When
comparing internality scores across relationship type and information type, I find non-significant
main effects for both relationship type (F = 0.12, p = .735, two-tailed, untabulated) and
information type (F = 0.30, p = .740, two-tailed, untabulated). However, when comparing across
constituent group and information type, I find a significant main effect for constituent group (F =
5.64, p = .005, two-tailed), but not information type (F = 0.10, p = .906, two-tailed)(see Table 7
Panel D).
As evidenced by Figure 10, corporate lawyers make the lowest attributions when
dispositional information is provided. The mean internality scores for laymen, corporate lawyers,
and corporate accountants are 6.63, 0.95, and 3.41, respectively (see Table 7 Panel C). Corporate
lawyers are best able to interpret the conflicting nature of provided dispositional information and
a Non-FFR outcome as they make neutral attributions as evidenced by a mean of 0.95, which is
not significantly different from zero (t = 0.72, p = .239). Additionally, corporate accountants,
with a mean internality score of 3.41, do make less dispositional attributions than laymen whose
mean internality score is 6.63 (t = -2.89, p = .003).

44
Collectively these results show that corporate lawyers and corporate accountants, albeit to
a less extent, interpret the conflicting nature of the additional dispositional information and the
choice of a Non-FFR outcome. The results also demonstrate that by continuing to make overly
dispositional attributions when provided conflicting information (i.e., information indicating the
controller’s poor disposition may have caused them to make inappropriate decisions previously),
laymen exhibit correspondence bias.
H2c predicts in-group corporate accountants will have higher internality scores than out-
group individuals when either environmental or no additional information is provided. As shown
in Figure 10, corporate lawyers and corporate accountants appear to make lower attributions
when provided environmental information (means = 2.57 and 4.00 respectively) than laymen
(mean = 5.57). Further, corporate accountants and laymen appear to make similar attributions
when no information is provided (means are 4.54 and 4.14 respectively). The difference between
corporate lawyers and laymen when provided environmental information is significant (t = 2.01,
p = .050, two-tailed); however, differences between corporate lawyers and corporate accountants
(t = 1.02, p = 3.12, two-tailed) and corporate accountants and laymen are not different (t = 1.13,
p = .263, two-tailed). When provided no additional information, corporate lawyers make similar
attributions to corporate accountants (t = -1.67, p = .103, two-tailed) and laymen (t = -1.34, p =
.189, two-tailed). Collectively these results provide evidence that corporate lawyers are best able
to interpret the combination of additional information and outcome and therefore make
attributions more consistent with in-group cognitive processing. Additionally, laymen do not
engage in the appropriate level of post hoc cognitive processing and therefore fail to
appropriately evaluate information and outcome, which is indicative of correspondence bias.

45
4.5 Causes of Correspondence Bias – Hypotheses H3a-c
H3a considers the original baseline estimates made by each constituent group to
determine whether correspondence bias is caused by unrealistic expectations as they relate to
financial accounting decisions. Prior to completing any scenarios, participants provided baseline
estimate of FFR (i.e., an estimate of the percentage of accountants who would knowingly and
intentionally account for transactions in a manner that would mislead financial statement users).
To test H3a, I compare baseline estimates of FFR between constituents groups using a between
group ANOVA19 and find a significant main effect for constituent group (F = 21.02, p < .001,
untabulated).
As highlighted in Figure 11, laymen, who on average believe that 26.24% of accountants
are willing to mislead financial statement users, have a marginally higher baseline estimates than
corporate lawyers who on average think that 18.2% would be willing to do so (t = 1.59 and p =
.058, one-tail). Further, while corporate lawyers on average have a higher baseline expectation
than corporate accountants who believe that 9.80% of accountants would intentionally misreport
when using parametric tests (t = 2.01 and p = .024, one-tail), non-parametric tests indicate that
corporate lawyer and corporate accountant estimates are the same (z = 0.93 and p = .177, one-
tail). These mean differences between groups are indicative of different expectations for the
prevalence of FFR, and that unrealistic expectations are a potential cause of correspondence bias
for laymen.
For H3b, I compare the accuracy of outcome identification across constituent groups
using mixed models for both FFR and Non-FFR outcomes to identify potentially inflated
19 An ANOVA is used here instead of a mixed model because participants only provide one
baseline estimate. Since this baseline estimate is not scenario specific and was collected before
the introduction of the random expense variables, it is not necessary to include any random
effects in the model.
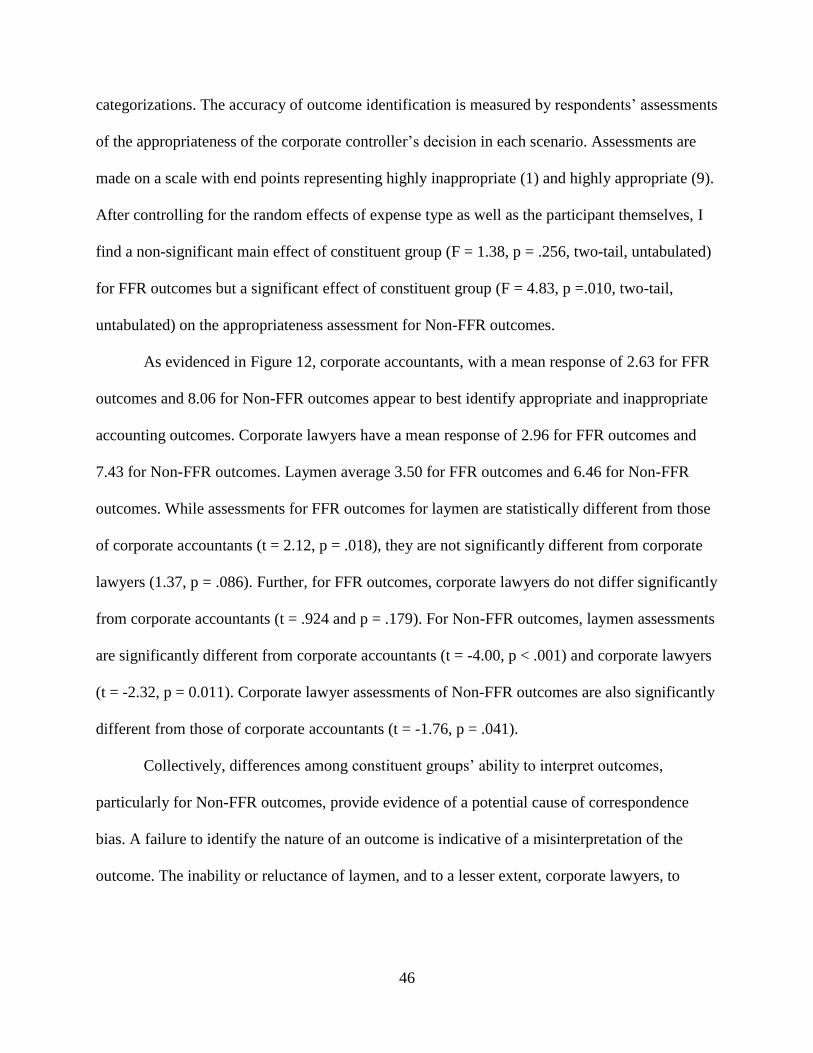
46
categorizations. The accuracy of outcome identification is measured by respondents’ assessments
of the appropriateness of the corporate controller’s decision in each scenario. Assessments are
made on a scale with end points representing highly inappropriate (1) and highly appropriate (9).
After controlling for the random effects of expense type as well as the participant themselves, I
find a non-significant main effect of constituent group (F = 1.38, p = .256, two-tail, untabulated)
for FFR outcomes but a significant effect of constituent group (F = 4.83, p =.010, two-tail,
untabulated) on the appropriateness assessment for Non-FFR outcomes.
As evidenced in Figure 12, corporate accountants, with a mean response of 2.63 for FFR
outcomes and 8.06 for Non-FFR outcomes appear to best identify appropriate and inappropriate
accounting outcomes. Corporate lawyers have a mean response of 2.96 for FFR outcomes and
7.43 for Non-FFR outcomes. Laymen average 3.50 for FFR outcomes and 6.46 for Non-FFR
outcomes. While assessments for FFR outcomes for laymen are statistically different from those
of corporate accountants (t = 2.12, p = .018), they are not significantly different from corporate
lawyers (1.37, p = .086). Further, for FFR outcomes, corporate lawyers do not differ significantly
from corporate accountants (t = .924 and p = .179). For Non-FFR outcomes, laymen assessments
are significantly different from corporate accountants (t = -4.00, p < .001) and corporate lawyers
(t = -2.32, p = 0.011). Corporate lawyer assessments of Non-FFR outcomes are also significantly
different from those of corporate accountants (t = -1.76, p = .041).
Collectively, differences among constituent groups’ ability to interpret outcomes,
particularly for Non-FFR outcomes, provide evidence of a potential cause of correspondence
bias. A failure to identify the nature of an outcome is indicative of a misinterpretation of the
outcome. The inability or reluctance of laymen, and to a lesser extent, corporate lawyers, to

47
identify Non-FFR outcomes as appropriate indicates that inflated categorizations are potentially
causing correspondence bias for these two constituent groups.
For H3c, I compare changes from baseline estimates of FFR to actual scenario specific
likelihood estimates of FFR across constituent group to identify whether incomplete or
inaccurate corrections are made. The introduction of additional information, either dispositional
or environmental, should normatively lead to an increase in a participant’s likelihood estimate
that a scenario specific corporate controller will commit fraud. In order to calculate the
adjustment participants make when provided additional information, a participant’s original
baseline estimate of an FFR outcome is subtracted from that participant’s scenario specific
likelihood estimate that the corporate controller would not include the expense in the current
period’s financials (also an FFR outcome).
H3c predicted that corporate accountants will adjust their likelihood estimates more based
upon the type of information they receive than corporate lawyers, and corporate lawyers would
adjust more than laymen. Using a mixed model I do not find a significant main effect for
constituent group (F = 0.52, p = .595, two-tailed, untabulated). As depicted in Figure 13, results
suggest that neither group adjusts its likelihood estimate differently than the others. More
specifically, the mean adjustment for the corporate accountants (13.99) is not significantly
different from that of the corporate lawyers (mean = 17.77, t = 0.896, p = .186), nor are the
corporate lawyers’ adjustments significantly different from that of the laymen (mean = 11.38, t =
-1.336, p = .092). Collectively these results indicate that correspondence bias is either not
caused, or is equally caused, by incomplete corrections for each constituent group.

48
4.6 Supplemental Analysis
In addition to the hypothesis testing above, I perform supplemental analyses to further
examine constituent group attributions. The following sections present these supplemental
analyses.
4.6.1 Business Culture and Environment Questions
To gauge constituent groups’ perceptions of recent changes in the financial reporting
environment, and in an attempt to capture and control for what Gilbert and Malone (1995) refer
to as lack of awareness, a series of questions are asked after completion of the demographics
portion of the instrument. Table 8 presents these questions along with their means, standard
deviations, and the results of ANOVA and non-parametric tests for differences across constituent
groups. As evidenced by the ANOVA results, and confirmed with non-parametric tests, the
constituent groups differ significantly for nine of the 19 questions. These differences are
indicative of varying perceptions of overall business culture. To isolate and control for
differences in awareness of recent changes to the financial reporting environment, I conduct a
confirmatory factor analysis on the 19 questions. The initial phase of the confirmatory factor
analysis produced the screen plot shown in Figure 16. Four factors emerge with eigenvalues
greater than 1 and together account for an acceptable amount of the overall variance (58%).20,21
To confirm the series of questions captures four unique constructs as they relate to overall
business culture, and to determine which specific questions relate to each factor, I complete the
20 One of the most commonly used criteria for determining the number of factors or components
to include is the latent root criterion, also known as the eigenvalue-one criterion or the Kaiser
criterion. With this approach, one retains and interprets any component that has an eigenvalue
greater than 1.0 (Lance et al. 2006). 21 The analysis resulted in a Kaiser-Meyer-Olkin Measure of Sampling Adequacy of .777 which
is considered good (Hutcheson and Sofroniou 1999, 224-225) and Bartlett’s Test of Sphericity
was significant with p < .001 thereby indicating the correlations in the model are appropriate for
factor analysis (Snedecor and Cochran 1989).

49
confirmatory factor analysis using a Varimax rotation with Kaiser Normalization. The
confirmatory factor analysis produced the rotated component matrix presented in Table 11.
Further analysis of the rotated component matrix indicates that none of the individual statements
load more strongly on other factors.
When designing this part of the experiment, it was my intention to have the questions
capture the following four items: (1) an overall awareness of recent changes in the financial
reporting environment, (2) perceptions of the effectiveness of recent changes to the financial
reporting environment (3) suggested future changes in the regulatory environment, and (4)
perceptions of the causes of financial reporting fraud. The results of the confirmatory factor
analysis are consistent with my expectations and confirm the grouping of questions into the four
factors identified in Table 11.
Since I am primarily interested in the idea that corporate accountants may have more
awareness of recent changes in the financial reporting environment than corporate lawyers and
laymen, I create a scale that combines the six individual questions for Factor 1 into one
variable22 (see Table 11 for a complete listing of the four factors and the questions that load on
each factor). Reliability tests confirm this six-item scale is reliable with a Cronbach’s Alpha of
0.89 (Nunnally and Bernstein 1994). Further, an examination of the inter-item correlation matrix
indicates that the average inter-item correlation is relatively high at 0.572.
22 To combine the individual variables into one single scale, the responses to the six statements
that loaded on component #1 were added together and divided by the number of variables (six).
Since all six were originally measured with a nine-point scale, the variables did not need to be
standardized.

50
After creating the scaled variable for Factor 1, I run a between groups ANOVA,23 to
determine whether the scaled response differs by constituent group and find a significant effect
(F = 8.58, p = .032, one-tailed, untabulated). Corporate accountants score lowest (i.e., more
strongly agree with the statements) on the scale (mean = 3.34), followed by corporate lawyers
(mean = 3.85), and laymen (mean = 3.86). The corporate accountants have a significantly
different response from corporate lawyers (t = -2.05, p = .022) and laymen (t = -2.08, p = .021),
and the corporate lawyer and laymen responses are not significantly different (t = -0.04, p = .97,
two-tailed). These results demonstrate that corporate accountants view the recent changes in the
financial reporting environment differently than corporate lawyers and laymen. Further, they are
consistent with the possibility that corporate lawyers and laymen are not as aware of, or as
sensitive to, recent changes that have occurred within the financial reporting environment.
4.6.2 Controlling for the Potential Causes of Bias and Differing Perceptions of Business Culture
Provided the identification of lack of awareness, unrealistic expectations, and inflated
categorizations as potential causes of correspondence bias, I run the full model used to test H1
and H2 as an ANCOVA24 and control for the effects of these three items as well as gender and
age. Results indicate that all three covariates are significant at p < .10 with lack of awareness
(i.e., Factor 1), unrealistic expectations (i.e., the original baseline estimate of FFR), and inflated
categorizations (i.e., the appropriateness assessment) each having an impact on attributions when
observing FFR outcomes (see Tables 9 and 10). As evidenced by Figure 14, attributions become
much more consistent across outcome when controlling for the three identified potential causes
23 ANOVA is used to test for differences across the scale items because similar to participants’
initial baseline estimates, the business culture questions are only asked once and are not
influenced by any manipulated variables. 24 The model was run as an ANCOVA with expense as a random effect rather than a mixed
model because currently SPSS does not have the capability to produce estimated marginal means
and plots out of a mixed model.

51
of correspondence bias. It should also be noted, as shown in Figure 15, that all three constituent
groups are better able to identify the type of information provided as evidenced by their V-
shaped attributions.
These remaining attributional differences between constituent groups suggest that
correspondence bias remains even after accounting for the four items Gilbert and Malone (1997)
identify as causes of correspondence bias. More specifically, even after controlling for the causes
of correspondence bias, laymen still appear to consistently make more dispositional attributions
suggesting something else is leading them to make dispositional attributions. This is a cause for
concern should such individuals be selected for jury duty related to an FFR case. If in fact these
individuals over attribute cause to the disposition of the accused, they fail to recognize other
proximate causes of the outcome.
4.6.3 Effect of Technical Knowledge and Character
Following the indication of the decision that each scenario specific controller made, and
prior to responding to the direct attribution scale, participants are asked to identify with four
potential causes of the outcome decision. More specifically, participants are asked to allocate a
total of 100 points across four categories represented by (1) the corporate controller’s technical
knowledge, (2) the corporate controller’s character, (3) how the accounting might impact the
company’s financial reporting, and (4) other people’s attitude towards financial reporting. Figure
17 presents the average points allocated to each of the four items for each combination of
constituent group and outcome.
Of particular interest is that regardless of outcome, corporate lawyers tend to focus on
technical knowledge (overall mean = 37.64) and corporate accountants tend to focus on character

52
(mean = 40.80).25 Provided the results of the hypotheses testing and an overall conclusion that
laymen suffer from correspondence bias more so than corporate lawyers and corporate
accountants, this result gives credence to the idea that recent changes in business culture have
created an environment whereby corporate accountants have an overarching belief that
regardless of the environmental factors involved, another accountant who commits FFR must
have poor character.
25 Both items, the accountants’ mean for controller’s character and the lawyers’ mean for
technical knowledge, are significantly different from their respective next highest item with p
values < .001.

53
CHAPTER FIVE
DISCUSSION, CONTRIBUTIONS, AND LIMITATIONS
5.1 Discussion
This dissertation examines the attributions important constituents in the judicial process
make when observing the financial reporting decisions of corporate controllers. Research in
psychology and in accounting demonstrates the existence of correspondence bias and a tendency
to commit the fundamental attribution error by consistently over attributing an observed behavior
to the disposition of the individual performing that behavior. Research also shows that this bias is
mitigated or removed when in-group cognitive processing is present. To test for the existence of
this bias within the context of fraudulent financial reporting, I conduct an experiment whereby
laymen, corporate lawyers, and corporate accountants observe corporate controllers making
financial reporting decisions.
My initial predictions were that out-group laymen and corporate lawyers would over
attribute a fraudulent decision, and under attribute a non-fraudulent decision, to the disposition of
the individual making that decision. While it is clear that attribution differences exist between
these constituent groups, and that laymen exert correspondence bias, it is surprising, yet
somewhat assuring to learn that corporate lawyers are actually well equipped to process
contextual information and make unbiased attributions around financial reporting decisions. This
is contradictory to a substantial body of research (e.g., Arrington et al. 1985; Dripps 2003;
Feigenson 2000; Ross 1977; Ross and Nisbett 1991, etc.) showing experienced professionals
exert correspondence bias and make the fundamental attribution error. More specifically,
professionally trained corporate executives in Arrington et al. (1985) over attribute audit failures
to the disposition of auditors performing the audit. Further, Dripps (2003, 1385) insists that

54
“decision makers such as public officials charged with the administration of the criminal justice
system are likely to overestimate the causal significance of personal choice, and to
correspondingly underestimate the causal significance of situational factors in the behaviors of
others.” Whereas these studies show circumstances where experienced professionals exhibit
correspondence bias, the current study provides evidence that, at least within the context of
financial reporting, corporate lawyers do not exhibit the bias.
As evidenced by their neutral attributions and ability to incorporate varying levels of
dispositional and environmental information into their ex-post attributions, lawyers do in fact
appear to devote an appropriate level of cognitive processing towards their attributions of blame.
Lawyers do not appear to be processing information in extreme, black and white, simplistic, or
polarized ways (cf., Linville and Jones 1980). Accordingly, they are better equipped to evaluate a
more complete set of proximate causes within the context of an alleged financial reporting fraud.
Of particular interest is another finding that corporate accountants do not make
environmental attributions when observing another accountant commit fraud. Corporate
accountants, the constituent group which, based upon numerous studies (e.g., Arkin et al. 1978;
Arrington et al. 1985; and Regan and Totten 1975), would normatively be in a position to
empathize with an observed corporate controller and make environmental attributions, instead,
make neutral attributions. Findings here indicate corporate accountants do not attribute the cause
of fraudulent behavior to the environment. Rather, they equally attribute the observed action to
both dispositional and environmental factors. Whereas previous research has shown that
individuals who perceive their relationship with the observed individual to be that of “in-group”
tend to make group serving or “sociocentric” attributions, within the context of fraudulent
financial reporting, corporate accountants do not. Further, while corporate accountants appear to

55
be able to incorporate information that normatively would lead to more dispositional or
environmental information into their likelihood estimates of a particular behavior, they do not
allow such information to influence their attributions upon actually observing the behavior.
To address the idea that some other factor might be influencing corporate accountants’
attributions, I perform supplemental analysis to examine changes in business culture and
accountants’ specific attributions. Supplemental analysis shows that corporate accountants
anchor on the character of the individual when asked to identify potential causes of a financial
reporting behavior. Consistent with their reluctance to empathize with corporate controllers and
attribute FFR behavior to environmental factors, a consistent anchoring on character when
observing both FFR and Non-FFR outcomes demonstrates a belief that no matter what
environmental circumstances exist, these situational pressures or opportunities should not lead an
accountant to commit FFR. This finding provides credence to the recent changes in the financial
reporting environment and demonstrates that the recent regulatory focus on the prevention of
FFR has been effective by creating an overall perception that there is a tremendous focus on the
prevention of fraud and character matters.
For laymen, results show they are prone to correspondence bias and the fundamental
attribution error within the context of financial reporting. Laymen consistently over attribute an
observed fraudulent outcome to the disposition of the individual making the financial reporting
decision. Further, laymen fail to interpret information that would normatively lead to
dispositional or environmental attributions. While the bias in laymen was expected, it causes
concern when these individuals serve as members of a jury and are asked to assign guilt and
punishment. If in fact, these constituents are biased in their original attributions and assumptions,

56
this bias colors their judgment and decision making process. Ultimately this bias must be
overcome during a trial in order to ensure a fair outcome.
Lastly, another focus of this study was to determine which of the four causes of
correspondence bias, as conjectured by Gilbert and Malone (1995), are prevalent within the
context of financial reporting. Results indicate three of the four causes posited by Gilbert and
Malone likely play a role in the ex-post attributions of individuals who observe a financial
reporting fraud. More specifically, results suggest that a lack of awareness of recent changes in
the financial reporting environment, unrealistic expectations towards the likelihood of fraudulent
behavior, and inflated categorizations of that behavior contribute to correspondence bias within
the context of fraudulent financial reporting. Further, when these items are controlled for,
attributions become more consistent between the constituent groups and each constituent group
is better able to incorporate the type of information provided into their attributions. However,
while the attributions become more consistent among the constituent groups, differences still
exist which could be indicative of additional and currently unknown sources of correspondence
bias within the financial reporting environment.
5.2 Contribution
This study extends prior literature in accounting by examining the effects of FFR on
critical constituents in the judicial process. The recognition and understanding of the attributions
made by laymen and non-accounting professionals related to FFR is paramount. Equipped with
the knowledge that laymen are in fact biased in their attributions specific to fraudulent outcomes,
and lawyers are not, the legal system can adapt accordingly. While results show that laymen do,
in fact, over attribute blame to the disposition of the individual, it is reassuring to know that
corporate lawyers are much more balanced in their attributions. This means that the prosecution
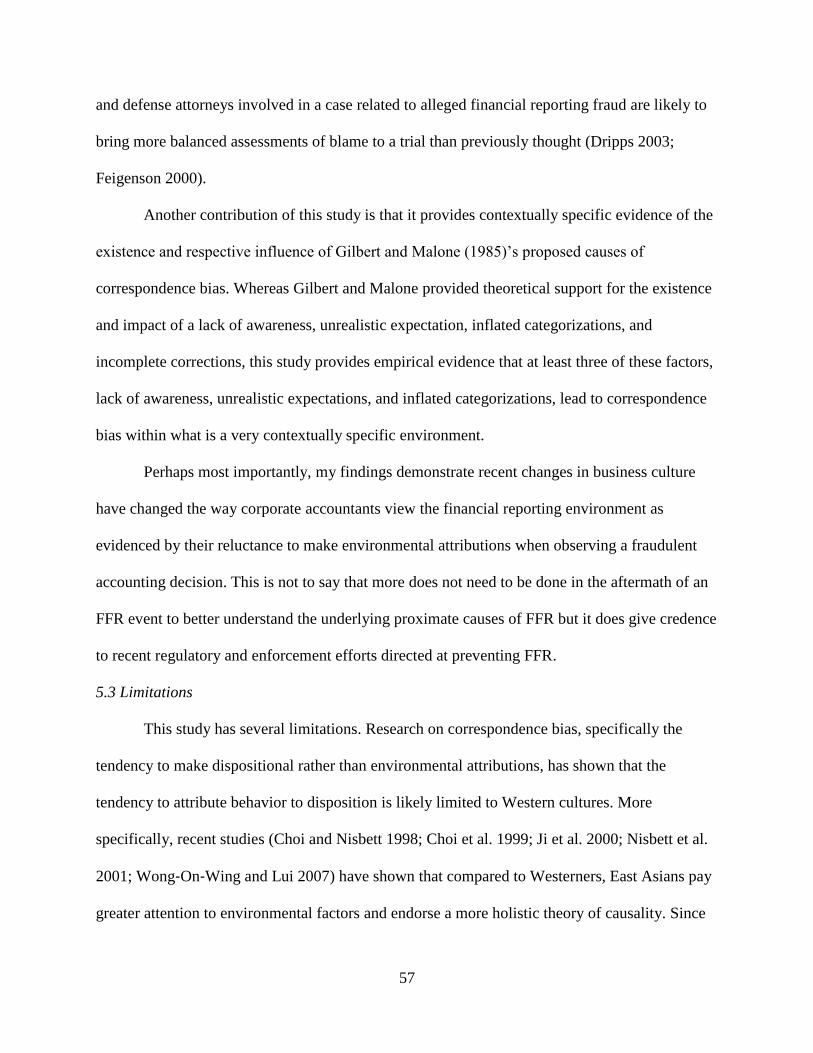
57
and defense attorneys involved in a case related to alleged financial reporting fraud are likely to
bring more balanced assessments of blame to a trial than previously thought (Dripps 2003;
Feigenson 2000).
Another contribution of this study is that it provides contextually specific evidence of the
existence and respective influence of Gilbert and Malone (1985)’s proposed causes of
correspondence bias. Whereas Gilbert and Malone provided theoretical support for the existence
and impact of a lack of awareness, unrealistic expectation, inflated categorizations, and
incomplete corrections, this study provides empirical evidence that at least three of these factors,
lack of awareness, unrealistic expectations, and inflated categorizations, lead to correspondence
bias within what is a very contextually specific environment.
Perhaps most importantly, my findings demonstrate recent changes in business culture
have changed the way corporate accountants view the financial reporting environment as
evidenced by their reluctance to make environmental attributions when observing a fraudulent
accounting decision. This is not to say that more does not need to be done in the aftermath of an
FFR event to better understand the underlying proximate causes of FFR but it does give credence
to recent regulatory and enforcement efforts directed at preventing FFR.
5.3 Limitations
This study has several limitations. Research on correspondence bias, specifically the
tendency to make dispositional rather than environmental attributions, has shown that the
tendency to attribute behavior to disposition is likely limited to Western cultures. More
specifically, recent studies (Choi and Nisbett 1998; Choi et al. 1999; Ji et al. 2000; Nisbett et al.
2001; Wong‐On‐Wing and Lui 2007) have shown that compared to Westerners, East Asians pay
greater attention to environmental factors and endorse a more holistic theory of causality. Since

58
all participants in this study are from the U.S., the results may not generalize to non-Western
cultures or societies.
Accountability, or the pressure to justify one’s causal interpretations of behavior to
others, has been shown to reduce or eliminate the correspondence bias (Tetlock 1985). Further,
research has shown that when observers learn of the existence of multiple, possibly rival,
motives for an actor’s behavior, they are less likely to fall prey to correspondence bias than when
they learn of the existence of environmental factors that may have constrained the actor’s
behavior (Fein 1996; Fein et al. 1990). In this study, participants are made aware of a single
motive for FFR, the desire to meet earnings forecasts. As such, results from this study may not
extend to situations in which individuals are required to justify themselves to others and/or when
multiple and/or ulterior motives for the actor are suspected.
Lastly, the presence of correspondence bias has been shown to be moderated by age
(Blanchard-Fields and Horhota 2005) and mood (Forgas 1998; Mienaltowski and Blanchard-
Fields 2005). Specifically, research has shown that younger individuals are less prone to
correspondence bias than are older individuals (Blanchard-Fields and Horhota 2005) and that
negative mood can decrease, and positive mood increase, correspondence bias as a result of the
information-processing consequences of affective states (Forgas 1998). While I control for both
age and mood in my analyses, it is possible that my results will not generalize across all ages and
affective states.
5.4 Future Research
In the future, research could more specifically consider the role that culture,
accountability, suspicion of ulterior motives, age, and mood play in attributions within the
context of FFR. Additionally, future research could consider how correspondence bias changes

59
with time. In other words, does the tendency to make dispositional attributions increase as time
progresses beyond a particular FFR event? Finally, whereas this study focuses on several
constituent groups in the judicial process, future research could consider the existence, causes,
and effects of correspondence bias on auditors and regulators in an attempt to determine what
activities increase their awareness of, and expectations for, FFR events.
While this study identifies which of Gilbert and Malone (1995)’s causes of
correspondence bias exist in an FFR context, and demonstrates that constituents in the judicial
process for FFR exert correspondence bias, it is not able to differentiate specifically among them.
Multiple causes are identified and this study is unable to provide insight into which causal factor
plays a bigger role. Future research could attempt to distinguish between individual causes for
particular constituents while also addressing what other sources of correspondence bias exist
within the financial reporting domain.

60
REFERENCES
Allport, G. W. 1979. The Nature of Human Prejudice. Reading, MA: Addison-Wesley.
American Institute of Certified Public Accountants, A. 1987. Report of the National Commission
on Fraudulent Financial Reporting (NCFFR). In Treadway Commission. New York:
AICPA.
Arkin, R. M., W. K. Gabrenya, and B. McGarvey. 1978. The role of social perspective in
perceiving the causes of success and failure. Journal of Personality 46 (4):762-777.
Arrington, C. E., C. D. Bailey, and W. S. Hopwood. 1985. An attribution analysis of
responsibility assessment for audit performance. Journal of Accounting Research 23
(1):1-20.
Baumeister, R. F., and M. R. Leary. 1995. The need to belong: Desire for interpersonal
attachments as a fundamental human motivation. Psychological Bulletin 117 (3):497-529.
Beasley, M., J. V. Carcello, and D. Hermanson. 1999. Fraudulent financial reporting: 1987-1997
An analysis of US public companies. Committee of Sponsoring Organizations of the
Treadway Commission.
Beasley, M., J. V. Carcello, D. Hermanson, and T. L. Neal. 2010. Fraudulent financial reporting:
1998-2007 An analysis of US public companies. Committee of Sponsoring Organizations
of the Treadway Commission.
Beasley, M. S. 1996. An empirical analysis of the relation between the board of director
composition and financial statement fraud. The Accounting Review 71 (4):443-465.
Bell, T. B., and J. V. Carcello. 2000. A decision aid for assessing the likelihood of fraudulent
financial reporting. Auditing: A Journal of Practice & Theory 19 (1):169-184.
Bierbrauer, G. 1979. Why did he do it? Attribution of obedience and the phenomenon of
dispositional bias. European Journal of Social Psychology 9 (1):67-84.
Blanchard-Fields, F., and M. Horhota. 2005. Age differences in the correspondence bias: When a
plausible explanation matters. Journals of Gerontology Series B-Psychological Sciences
and Social Sciences 60 (5):P259-P267.
Bonner, S. E. 2007. Judgment and Decision Making in Accounting: Pearson/Prentice Hall.
Brewer, M. B. 1999. The psychology of prejudice: Ingroup love and outgroup hate? Journal of
Social Issues 55 (3):429-444.
Carcello, J. V., and A. L. Nagy. 2004. Audit firm tenure and fraudulent financial reporting.
Auditing: A Journal of Practice & Theory 23 (2):55-69.
Carpenter, C. E. 1931. Workable Rules for Determining Proximate Cause--Part I. Cal. L. Rev.
20:229.
Carpenter, T. D., and J. L. Reimers. 2005. Unethical and fraudulent financial reporting: Applying
the theory of planned behavior. Journal of Business Ethics 60 (2):115-129.
Choi, I., and R. E. Nisbett. 1998. Situational salience and cultural differences in the
correspondence bias and actor-observer bias. Personality and Social Psychology Bulletin
24 (9):949-960.
Choi, I., R. E. Nisbett, and A. Norenzayan. 1999. Causal attribution across cultures: Variation
and universality. Psychological Bulletin 125 (1):47-63.
Chung, J. O. Y., J. R. Cohen, and G. S. Monroe. 2008. The effect of moods on auditors'
inventory valuation decisions. Auditing: A Journal of Practice & Theory 27 (2):137-159.
Cox, R. A., and T. R. Weirich. 2002. The stock market reaction to fraudulent financial reporting.
Managerial Auditing Journal 17 (7):374-382.

61
Cressey, D. R. 1973. Other People's Money: A Study in the Social Psychology of Embezzlement.
Montclair, N.J.: Patterson Smith.
Dechow, P. M., R. G. Sloan, and A. P. Sweeney. 1996. Causes and consequences of earnings
manipulation: An analysis of firms subject to enforcement actions by the SEC.
Contemporary Accounting Research 13 (1):1-36.
Dripps, D. A. 2003. Fundamental retribution error: Criminal justice and the social psychology of
blame. Vanderbilt Law Review 56 (5):1383-+.
Epley, N., K. Savitsky, and T. Gilovich. 2002. Empathy neglect: reconciling the spotlight effect
and the correspondence bias. Journal of Personality and Social Psychology 83 (2):300-
312.
Ewing, J. 2013. ungagged.net 2012 [cited 4/1/2013 2013]. Available from www.ungagged.net.
Feigenson, N. 2000. How Jurors Think About Accidents. Washington, DC, US: American
Psychological Association.
Fein, S. 1996. Effects of suspicion on attributional thinking and the correspondence bias. Journal
of Personality and Social Psychology 70 (6):1164-1184.
Fein, S., J. L. Hilton, and D. T. Miller. 1990. Suspicion of ulterior motivation and the
correspondence bias. Journal of Personality and Social Psychology 58 (5):753-764.
Ferguson, G. A. 1981. Statistical Analysis in Psychology and Education. New York, NY:
McGraw Hill.
Forgas, J. P. 1998. On being happy and mistaken: Mood effects on the fundamental attribution
error. Journal of Personality and Social Psychology 75 (2):318-331.
Forsyth, D. R., and B. R. Schlenker. 1977. Attributing causes of group-performance: Effects of
performance quality, task importance, and future testing. Journal of Personality 45
(2):220-236.
Gilbert, D. T., D. S. Krull, and B. W. Pelham. 1988. Of thoughts unspoken: Social inference and
the self-regulation of behavior. Journal of Personality and Social Psychology 55 (5):685.
Gilbert, D. T., and P. S. Malone. 1995. The Correspondence Bias. Psychological Bulletin 117
(1):21-38.
Hammersley, J. S. 2011. A review and model of auditor judgments in fraud-related planning
tasks. Auditing: A Journal of Practice & Theory 30 (4):101-128.
Heider, F. 1958. The Psychology of Interpersonal Relations. New York: Wiley.
Hennes, K. M., A. J. Leone, and B. P. Miller. 2008. The importance of distinguishing errors from
irregularities in restatement research: The case of restatements and CEO/CFO. The
Accounting Review 83 (6):1487-1519.
Hoffman, V. B., and J. M. Patton. 1997. Accountability, the dilution effect, and conservatism in
auditors' fraud judgments. Journal of Accounting Research 35 (2):227-237.
Hogan, C. E., Z. Rezaee, R. A. Riley, and U. K. Velury. 2008. Financial statement fraud:
Insights from the academic literature. Auditing: A Journal of Practice & Theory 27
(2):231-252.
Howard, J. W., and M. Rothbart. 1980. Social categorization and memory for in-group and out-
group behavior. Journal of Personality and Social Psychology 38 (2):301-310.
Hutcheson, G. D., and N. Sofroniou. 1999. The multivariate social scientist: Introductory
statistics using generalized linear models: Sage.
International Audit Networks, I. 2006. Global Capital Markets and the Global Economy: A
Vision From the CEOs of the International Audit Networks
http://www.gti.org/Publications/Vision-of-international-CEOs.asp.

62
———. 2008. Global Dialogue with Capital Market Stakeholders: A Report From the CEOs of
the International Audit Networks http://www.deloitte.com/assets/Dcom-
Global/Local%20Assets/Documents/GPPC_Vision%20Roundtables%20Report_Final.pd
f.
James, F., and R. F. Perry. 1951. Legal Cause. The Yale Law Journal 60 (5):761-811.
Ji, L. J., K. P. Peng, and R. E. Nisbett. 2000. Culture, control, and perception of relationships in
the environment. Journal of Personality and Social Psychology 78 (5):943-955.
Jones, E. E. 1979. The rocky road from acts to dispositions. American Psychologist 34 (2):107-
117.
Jones, E. E. 1990. Interpersonal Perception. New York: Freeman.
Jones, E. E., and K. E. Davis. 1965. From acts to dispositions the attribution process in person
perception. Advances in Experimental Social Psychology Volume 2:219-266.
Jones, E. E., and V. A. Harris. 1967. The attribution of attitudes. Journal of Experimental Social
Psychology 3 (1):1-24.
Kaminski, K. A., T. S. Wetzel, and L. Guan. 2004. Can financial ratios detect fraudulent
financial reporting? Managerial Auditing Journal 19 (1):15-28.
Kaplan, S. E., J. C. McElroy, S. P. Ravenscroft, and C. B. Shrader. 2007. Moral judgment and
causal attributions: Consequences of engaging in earnings management. Journal of
Business Ethics 74 (2):149-164.
Katz, I. 1991. Gordon Allport's "The Nature of Prejudice". Political Psychology 12 (1):125-157.
Kelley, H. H. 1967. Attribution Theory in Social Psychology. Current Theory and Research in
Motivation, a Symposium 15:192-238.
Keppel, G. 1991. Design and analysis: A researcher's handbook: Prentice-Hall, Inc.
Kirk, R. E. 1968. Experimental Design; Procedures for the Behavioral Sciences [by] Roger E.
Kirk: Belmont, Calif., Brooks/Cole Publishing Company [1968].
Kunda, Z. 1999. Social Cognition: Making Sense of People: MIT press.
Lance, C. E., M. M. Butts, and L. C. Michels. 2006. The Sources of Four Commonly Reported
Cutoff Criteria What Did They Really Say? Organizational Research Methods 9 (2):202-
220.
Leary, M. R., and D. R. Forsyth. 1987. Attributions of responsibility for collective endeavors.
Review of Personality and Social Psychology 8:167-188.
Linville, P. W., and E. E. Jones. 1980. Polarized appraisals of out-group members. Journal of
Personality and Social Psychology 38 (5):689-703.
Luginbuhl, J. E. R., D. H. Crowe, and J. P. Kahan. 1975. Causal attributions for success and
failure. Journal of Personality and Social Psychology 31 (1):86-93.
Mann, H. B., and D. R. Whitney. 1947. On a test of whether one of two random variables is
stochastically larger than the other. The Annals of Mathematical Statistics 18 (1):50-60.
McArthur, L. A. 1972. The how and what of why: Some determinants and consequences of
causal attribution. Journal of Personality and Social Psychology 22 (2):171.
McLean, R. A., W. L. Sanders, and W. W. Stroup. 1991. A Unified Approach to Mixed Linear
Models. The American Statistician 45 (1):54-64.
Mienaltowski, A., and F. Blanchard-Fields. 2005. The differential effects of mood on age
differences in the correspondence bias. Psychol Aging 20 (4):589-600.
Neter, J., M. H. Kutner, C. J. Nachtsheim, and W. Wasserman. 1996. Applied linear statistical
models. Vol. 4: Irwin Chicago.

63
Nisbett, R. E., K. P. Peng, I. Choi, and A. Norenzayan. 2001. Culture and systems of thought:
Holistic versus analytic cognition. Psychological Review 108 (2):291-310.
Nisbett, R. E., and L. Ross. 1980. Human Inference: Strategies and Shortcomings of Social
Judgment. Englewood Cliffs, N.J.: Prentice-Hall.
Nunnally, J. C., and I. H. Bernstein. 1994. Psychometric theory. 3rd ed. New York: McGraw-
Hill.
Palmrose, Z. V., V. J. Richardson, and S. Scholz. 2004. Determinants of market reactions to
restatement announcements. Journal of Accounting & Economics 37 (1):59-89.
Quattrone, G. A. 1982. Overattribution and unit formation - When behavior engulfs the person.
Journal of Personality and Social Psychology 42 (4):593-607.
Regan, D. T., and J. Totten. 1975. Empathy and attribution: Turning observers into actors.
Journal of Personality and Social Psychology 32 (5):850-856.
Rezaee, Z. 2004. Restoring public trust in the accounting profession by developing anti-fraud
education, programs, and auditing. Managerial Auditing Journal 19 (1):134-148.
———. 2005. Causes, consequences, and deterence of financial statement fraud. Critical
Perspectives on Accounting 16 (3):277-298.
Ross, L. 1977. The intuitive psychologist and his shortcomings: Distortions in the attribution
process. Advances in Experimental Social Psychology 10:173-220.
Ross, L., D. Greene, and P. House. 1977. The “false consensus effect”: An egocentric bias in
social perception and attribution processes. Journal of Experimental Social Psychology
13 (3):279-301.
Ross, L., and R. E. Nisbett. 1991. The Person and the Situation: Perspectives of Social
Psychology. Philadelphia: Temple University Press.
SAS Institute. [cited. Available from http://www.jmp.com/applications/doe/.
Sherman, S. J. 1980. On the self-erasing nature of errors of prediction. Journal of Personality
and Social Psychology 39 (2):211-221.
Snedecor, G. W., and W. G. Cochran. 1989. Statistical Methods: Iowa State University Press.
Swann, W. B., Jr. 1984. Quest for accuracy in person perception: a matter of pragmatics. Psychol
Rev 91 (4):457-477.
Tajfel, H. 2010. Social Identity and Intergroup Relations. Vol. 7: Cambridge University Press.
Tajfel, H., and J. C. Turner. 1979. An integrative theory of intergroup conflict. The Social
Psychology of Intergroup Relations 33:47.
Tetlock, P. E. 1985. Accountability - a social check on the Fundamental Attribution Error. Social
Psychology Quarterly 48 (3):227-236.
Trompeter, G., T. Carpenter, N. K. Desai, K. Jones, and D. Riley. 2012. A synthesis of fraud
related research. Auditing: A Journal of Practice & Theory.
Trope, Y. 1986. Identification and inferential processes in dispositional attribution.
Psychological Review 93 (3):239-257.
Trope, Y., O. Cohen, and Y. Maoz. 1988. The perceptual and inferential effects of situational
inducements on dispositional attribution. Journal of Personality and Social Psychology
55 (2):165-177.
Tversky, A., and D. Kahneman. 1973. Availability: A heuristic for judging frequency and
probability. Cognitive Psychology 5 (2):207-232.
U.S. President. 2002. Executive Order 13271. Establishment of the Corporate Fraud Task Force.
In Weekly Compilation of Presidential Documents, 1162-1164.
Wilcoxon, F. 1945. Individual comparisons by ranking methods. Biometrics 1 (6):80-83.

64
Wong‐On‐Wing, B., and G. Lui. 2007. Culture, implicit theories, and the attribution of morality.
Behavioral Research in Accounting 19 (1):231-246.
Zander, A. F. 1971. Motives and Goals in Groups. New York: Academic Press.

65
FIGURE 1:
Predicted Effects of Group on Internality Assessments for FFR and Non-FFR Outcomes
Laymen Corporate Lawyers Corporate Accountants
FFR
Non-FFR
H1b
H1a
Inte
rnal
ity S
core
Envir
onm
enta
l
Dis
posi
tional
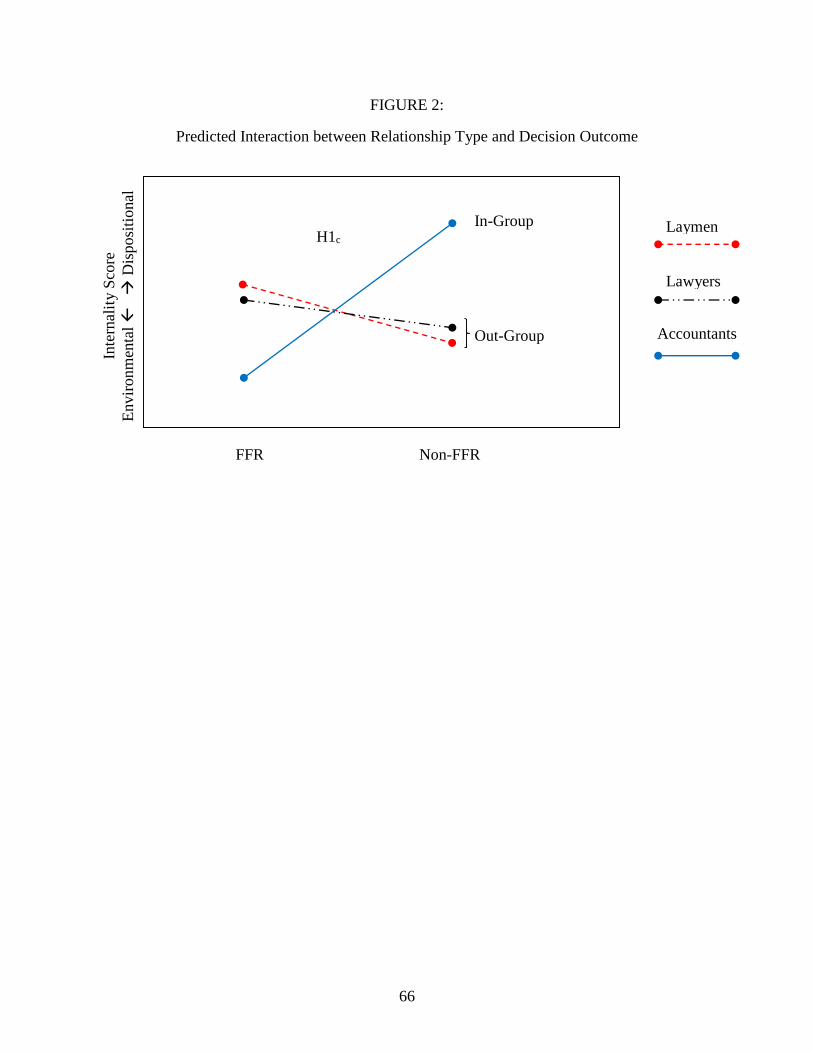
66
FIGURE 2:
Predicted Interaction between Relationship Type and Decision Outcome
Lawyers
FFR Non-FFR
Accountants
Laymen
Out-Group
In-Group H1c
Inte
rnal
ity S
core
Envir
on
men
tal
Dis
posi
tional
67
FIGURE 3:
Predicted Effects of Information Type and Relationship Type on Internality Assessments in an
FFR Outcome
Dispositional Environmental No Information
In-Group
Out-Group
H2a
Inte
rnal
ity S
core
Envir
onm
enta
l
Dis
posi
tional

68
FIGURE 4:
Predicted Effects of Information Type and Relationship Type on Internality Assessments in a
Non-FFR Outcome
Dispositional Environmental No Information
Out-Group
Inte
rnal
ity S
core
Envir
onm
enta
l
Dis
posi
tional
In-Group
H2c
H2b
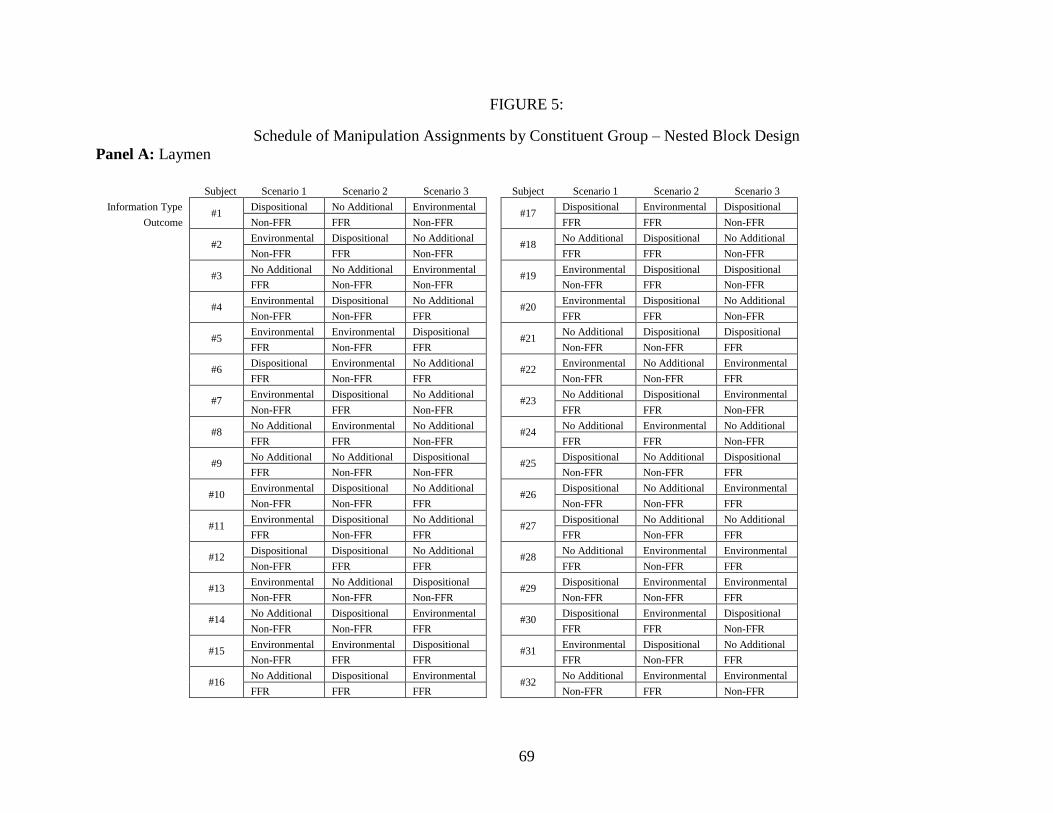
69
FIGURE 5:
Schedule of Manipulation Assignments by Constituent Group – Nested Block Design
Panel A: Laymen
Subject Scenario 1 Scenario 2 Scenario 3
Subject Scenario 1 Scenario 2 Scenario 3
Information Type #1
Dispositional No Additional Environmental
#17
Dispositional Environmental Dispositional
Outcome Non-FFR FFR Non-FFR
FFR FFR Non-FFR
#2
Environmental Dispositional No Additional
#18
No Additional Dispositional No Additional
Non-FFR FFR Non-FFR
FFR FFR Non-FFR
#3
No Additional No Additional Environmental
#19 Environmental Dispositional Dispositional
FFR Non-FFR Non-FFR
Non-FFR FFR Non-FFR
#4
Environmental Dispositional No Additional
#20
Environmental Dispositional No Additional
Non-FFR Non-FFR FFR
FFR FFR Non-FFR
#5
Environmental Environmental Dispositional
#21
No Additional Dispositional Dispositional
FFR Non-FFR FFR
Non-FFR Non-FFR FFR
#6
Dispositional Environmental No Additional
#22
Environmental No Additional Environmental
FFR Non-FFR FFR
Non-FFR Non-FFR FFR
#7
Environmental Dispositional No Additional
#23
No Additional Dispositional Environmental
Non-FFR FFR Non-FFR
FFR FFR Non-FFR
#8
No Additional Environmental No Additional
#24 No Additional Environmental No Additional
FFR FFR Non-FFR
FFR FFR Non-FFR
#9
No Additional No Additional Dispositional
#25 Dispositional No Additional Dispositional
FFR Non-FFR Non-FFR
Non-FFR Non-FFR FFR
#10
Environmental Dispositional No Additional
#26
Dispositional No Additional Environmental
Non-FFR Non-FFR FFR
Non-FFR Non-FFR FFR
#11
Environmental Dispositional No Additional
#27
Dispositional No Additional No Additional
FFR Non-FFR FFR
FFR Non-FFR FFR
#12
Dispositional Dispositional No Additional
#28
No Additional Environmental Environmental
Non-FFR FFR FFR
FFR Non-FFR FFR
#13
Environmental No Additional Dispositional
#29
Dispositional Environmental Environmental
Non-FFR Non-FFR Non-FFR
Non-FFR Non-FFR FFR
#14
No Additional Dispositional Environmental
#30 Dispositional Environmental Dispositional
Non-FFR Non-FFR FFR
FFR FFR Non-FFR
#15
Environmental Environmental Dispositional
#31 Environmental Dispositional No Additional
Non-FFR FFR FFR
FFR Non-FFR FFR
#16
No Additional Dispositional Environmental
#32
No Additional Environmental Environmental
FFR FFR FFR
Non-FFR FFR Non-FFR

70
FIGURE 5 (continued)
Panel B: Corporate Lawyers
Subject Scenario 1 Scenario 2 Scenario 3
Subject Scenario 1 Scenario 2 Scenario 3
Information Type #1
Dispositional No Additional Environmental
#17 No Additional Dispositional Environmental
Outcome Non-FFR Non-FFR FFR
FFR FFR Non-FFR
#2
Dispositional Environmental Dispositional
#18
Environmental No Additional Environmental
Non-FFR Non-FFR FFR
Non-FFR Non-FFR FFR
#3
Dispositional Environmental No Additional
#19
Environmental No Additional Dispositional
FFR FFR Non-FFR
Non-FFR FFR Non-FFR
#4
Environmental No Additional Dispositional
#20
Environmental No Additional Dispositional
Non-FFR FFR FFR
FFR FFR Non-FFR
#5
No Additional Environmental Dispositional
#21
Environmental Dispositional Environmental
Non-FFR FFR FFR
FFR FFR Non-FFR
#6
Dispositional No Additional Dispositional
#22 Environmental No Additional Dispositional
Non-FFR Non-FFR FFR
Non-FFR Non-FFR Non-FFR
#7
Environmental Dispositional No Additional
#23 No Additional Environmental Dispositional
Non-FFR FFR FFR
FFR Non-FFR Non-FFR
#8
Environmental No Additional No Additional
#24
No Additional Environmental No Additional
FFR Non-FFR FFR
Non-FFR Non-FFR FFR
#9
Environmental Dispositional Dispositional
#25
Dispositional No Additional No Additional
FFR FFR Non-FFR
FFR FFR Non-FFR
#10
Environmental No Additional Dispositional
#26
Dispositional No Additional No Additional
FFR FFR Non-FFR
FFR FFR Non-FFR
#11
Environmental Dispositional Environmental
#27
No Additional Dispositional Environmental
FFR FFR Non-FFR
FFR Non-FFR FFR
#12
No Additional Environmental No Additional
#28 Dispositional Environmental Environmental
Non-FFR FFR FFR
Non-FFR FFR Non-FFR
#13
Dispositional Environmental Environmental
#29 Environmental No Additional Dispositional
Non-FFR FFR Non-FFR
FFR FFR FFR
#14
No Additional Dispositional Dispositional
#30
No Additional Dispositional Dispositional
Non-FFR Non-FFR FFR
Non-FFR Non-FFR FFR
#15
No Additional Dispositional Dispositional
#31
No Additional No Additional Environmental
FFR FFR Non-FFR
FFR Non-FFR Non-FFR
#16
Environmental No Additional Dispositional
#32
Environmental No Additional Environmental
Non-FFR Non-FFR Non-FFR
FFR Non-FFR Non-FFR

71
FIGURE 5 (continued)
Panel C: Corporate Accountants
Subject Scenario 1 Scenario 2 Scenario 3
Subject Scenario 1 Scenario 2 Scenario 3
Information Type #1
Dispositional Dispositional Environmental
#17 Environmental Dispositional No Additional
Outcome FFR Non-FFR FFR
Non-FFR FFR FFR
#2
Environmental No Additional Environmental
#18
Dispositional No Additional Environmental
FFR FFR Non-FFR
Non-FFR FFR Non-FFR
#3
Dispositional No Additional Environmental
#19
No Additional Environmental Dispositional
Non-FFR Non-FFR Non-FFR
FFR FFR Non-FFR
#4
Environmental Dispositional No Additional
#20
Dispositional No Additional Environmental
Non-FFR Non-FFR FFR
FFR FFR FFR
#5
Environmental Dispositional No Additional
#21
Dispositional Environmental No Additional
Non-FFR FFR Non-FFR
FFR FFR FFR
#6
No Additional No Additional Dispositional
#22 Dispositional No Additional Environmental
Non-FFR FFR Non-FFR
Non-FFR Non-FFR FFR
#7
No Additional Dispositional Environmental
#23 Dispositional Environmental No Additional
Non-FFR Non-FFR Non-FFR
FFR FFR Non-FFR
#8
Dispositional No Additional Environmental
#24
Dispositional No Additional Dispositional
FFR Non-FFR Non-FFR
FFR Non-FFR Non-FFR
#9
No Additional No Additional Environmental
#25
No Additional Dispositional Dispositional
Non-FFR FFR FFR
FFR FFR Non-FFR
#10
No Additional Dispositional Dispositional
#26
Dispositional Dispositional No Additional
Non-FFR FFR Non-FFR
Non-FFR FFR FFR
#11
Environmental Dispositional Dispositional
#27
Environmental Environmental No Additional
Non-FFR Non-FFR FFR
Non-FFR FFR Non-FFR
#12
No Additional Dispositional No Additional
#28 No Additional Environmental No Additional
Non-FFR FFR FFR
Non-FFR Non-FFR FFR
#13
Environmental No Additional Dispositional
#29 Dispositional No Additional Environmental
FFR Non-FFR Non-FFR
FFR Non-FFR Non-FFR
#14
Dispositional No Additional Environmental
#30
Environmental Environmental No Additional
Non-FFR FFR FFR
FFR Non-FFR FFR
#15
Dispositional Environmental Environmental
#31
No Additional Environmental No Additional
FFR Non-FFR FFR
Non-FFR FFR FFR
#16
Dispositional Environmental Environmental
#32
Environmental Dispositional Environmental
Non-FFR FFR Non-FFR
Non-FFR FFR FFR
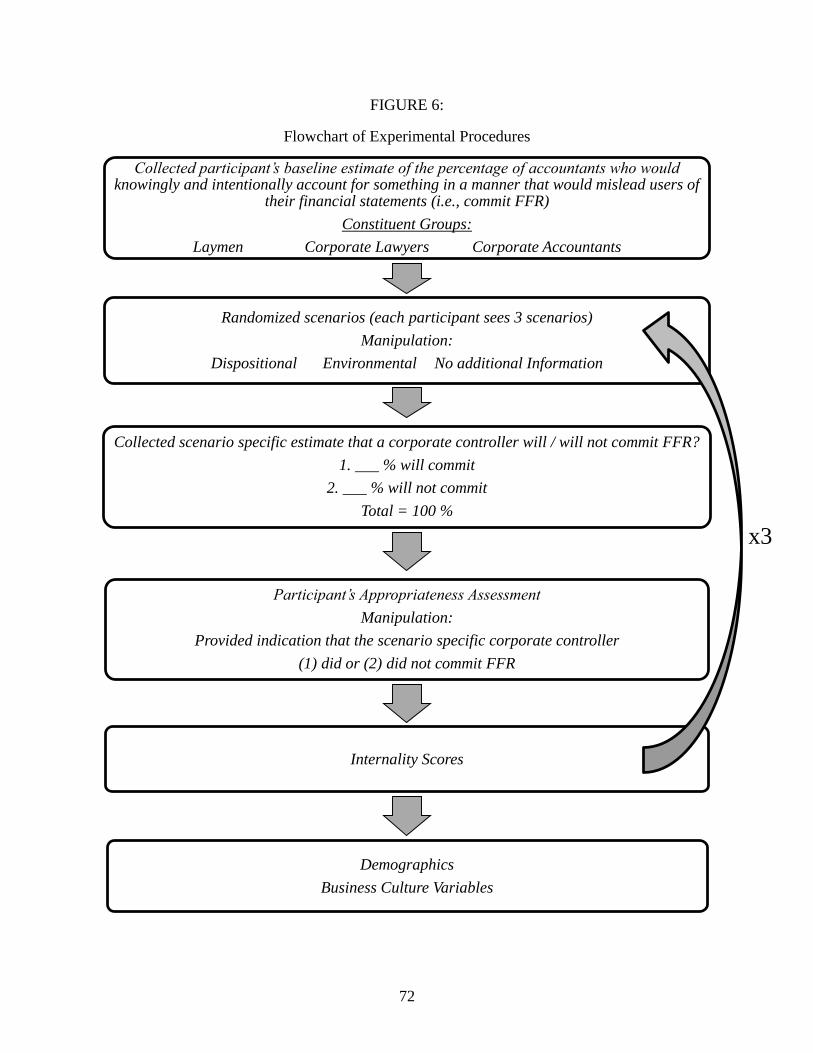
72
FIGURE 6:
Flowchart of Experimental Procedures
Collected participant’s baseline estimate of the percentage of accountants who would knowingly and intentionally account for something in a manner that would mislead users of
their financial statements (i.e., commit FFR)
Constituent Groups:
Laymen Corporate Lawyers Corporate Accountants
Randomized scenarios (each participant sees 3 scenarios)
Manipulation:
Dispositional Environmental No additional Information
Collected scenario specific estimate that a corporate controller will / will not commit FFR?
1. ___ % will commit
2. ___ % will not commit
Total = 100 %
Participant’s Appropriateness Assessment
Manipulation:
Provided indication that the scenario specific corporate controller
(1) did or (2) did not commit FFR
Internality Scores
Demographics
Business Culture Variables
x3

73
FIGURE 7:
Observed Effects of Constituent Group and Outcome on Internality Assessments
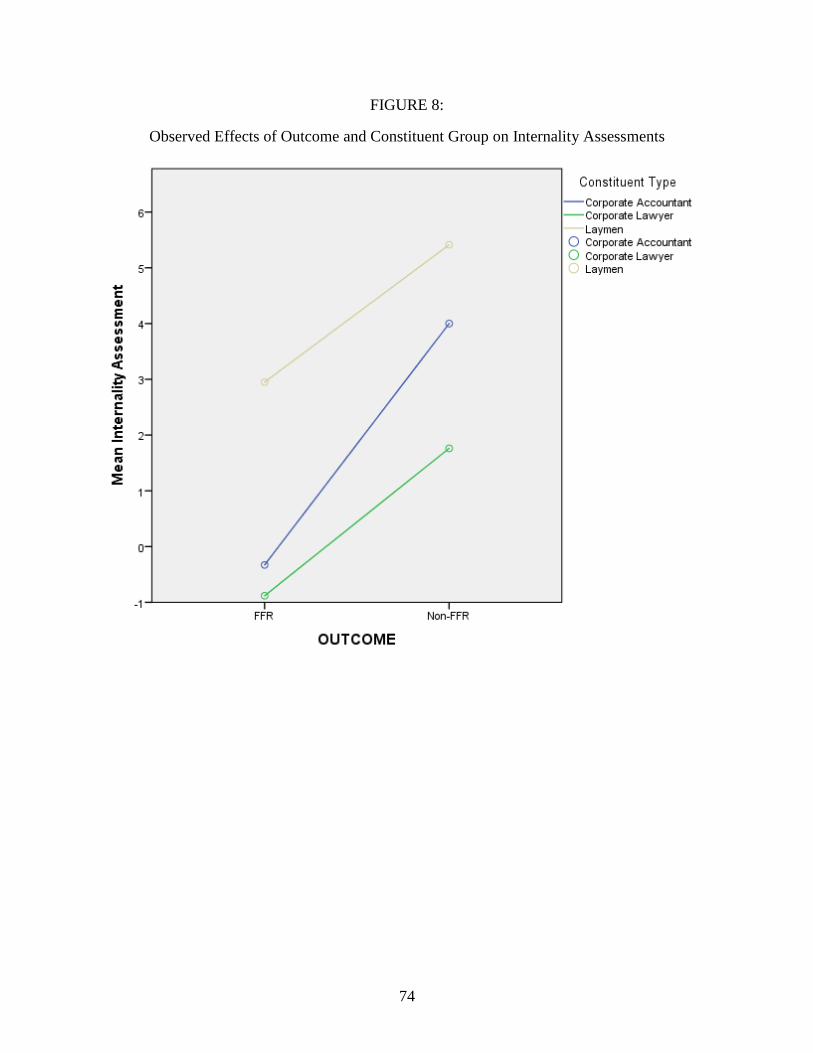
74
FIGURE 8:
Observed Effects of Outcome and Constituent Group on Internality Assessments

75
FIGURE 9:
Observed Effects of Information Type and Constituent Group on Internality Assessments for
FFR Outcomes

76
FIGURE 10:
Observed Effects of Information Type and Constituent Group on Internality Assessments for
Non-FFR Outcomes

77
FIGURE 11:
Participant’s Original Baseline Estimate that a Typical Corporate Accountant Would
Intentionally Account for Items in a Manner that Would Mislead the Users of Their Financial
Statements shown by Constituent Group
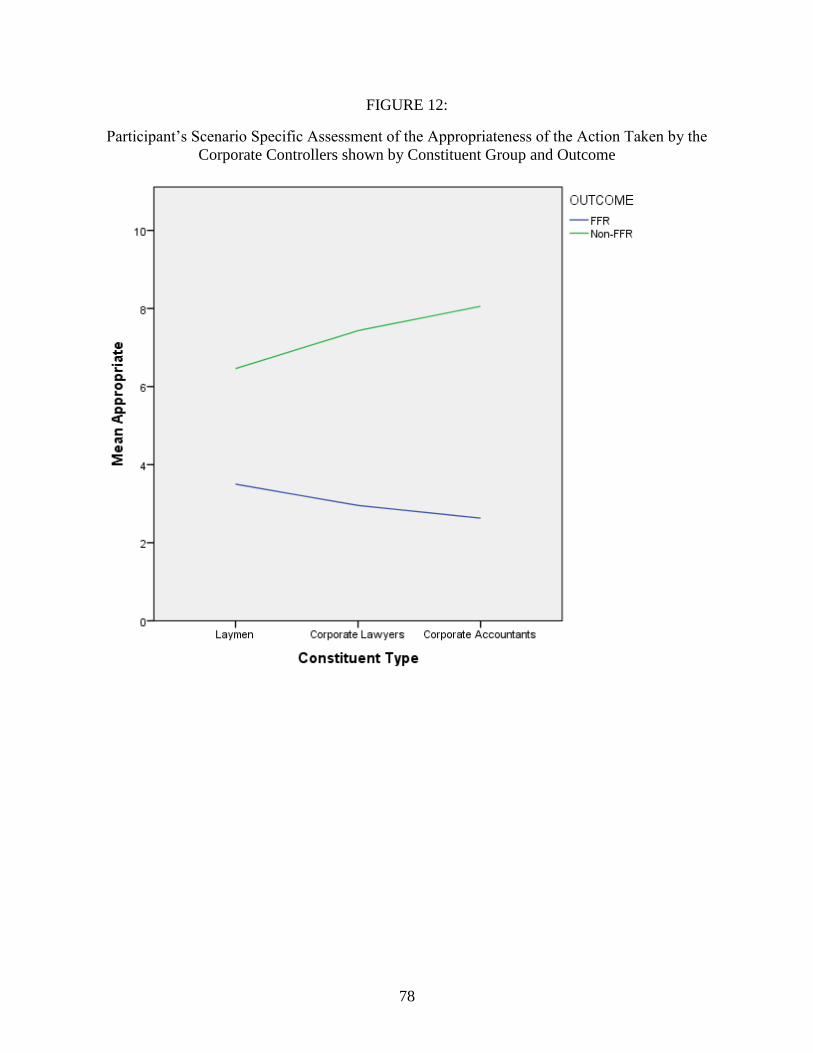
78
FIGURE 12:
Participant’s Scenario Specific Assessment of the Appropriateness of the Action Taken by the
Corporate Controllers shown by Constituent Group and Outcome

79
FIGURE 13:
Participants’ Adjustments from their Original Baseline Estimate to Scenario Specific Likelihood
Estimates Provided Additional Dispositional or Environmental Information shown by
Constituent Group
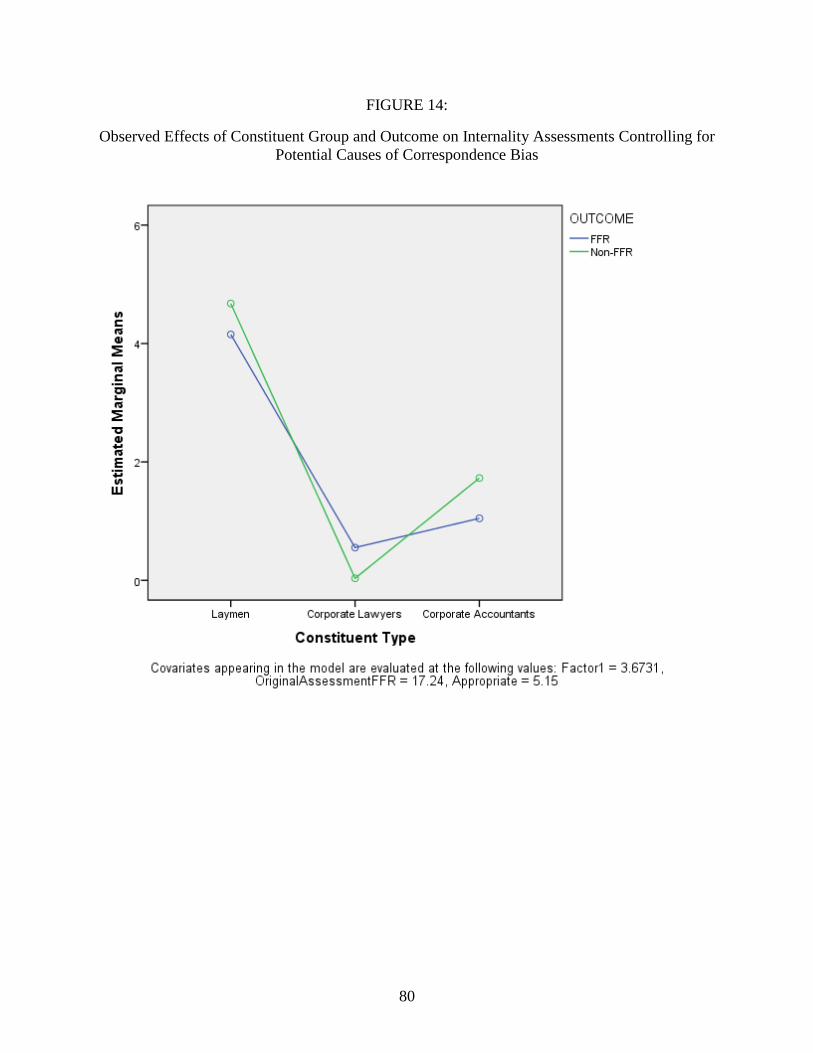
80
FIGURE 14:
Observed Effects of Constituent Group and Outcome on Internality Assessments Controlling for
Potential Causes of Correspondence Bias

81
FIGURE 15:
Observed Effects of Information Type and Constituent Group on Internality Assessments for
FFR Outcomes Controlling for Causes of Potential Causes of Correspondence Bias

82
FIGURE 16:
Screen Plot from the Confirmatory Factor Analysis Performed on the Questions Related to
Business Culture

83
FIGURE 17:
Participant Attributions Specific to (1) the Controller’s Technical Knowledge, (2) the
Controller’s Character, (3) How the Accounting Might Impact the Company’s Financial
Reporting, and (4) Other People’s Attitudes towards Financial Reporting shown by Constituent
Group and Outcome

84
TABLE 1:
Definition and Operationalization of Consensus, Consistency, and Distinctiveness
Intended
Informative Effect
Construct Definition
(Nisbett and Ross 1980)
Construct
Operationalization
Consensus The degree to which people other than
the target actor show the effect.
Other companies in the same
industry account for (do not
account for) the item as proposed.
Consistency The degree to which the effect is
observed reliably when a particular
causal candidate is present.
The corporate controller has (has
not) accounted for the item
similarly in the past.
Distinctiveness The degree to which the effect occurs
primarily in the presence of one
causal candidate and not in the
presence of others.
There are other (This is the only)
accounting decisions (decision),
which, if made, will allow the
company to meet its goals.

85
TABLE 2:
Summary of Information Type Provided, Specific Form Used, and Expected Attribution
Information Type Provided Specific Form Used in This Study Expected Attribution
Environmental
Consensus (High)
Other companies in the industry typically
account for the item as proposed.
Environmental attributions are expected since the
observed behavior does not vary across other companies.
Therefore the observed corporate controller is not a
salient cause of the outcome.
Consistency (Low) The corporate controller has not accounted
for the item in this manner in the past.
Environmental attributions are expected since the
corporate controller has not demonstrated a consistent
record of inappropriate accounting.
Distinctiveness (High) This is the only accounting decision,
which, if made, will allow the company
to meet forecasts.
Environmental attributions are expected since there are no
other accounting decisions that would allow the
company to make forecasts.
Dispositional
Consensus (Low) Other companies in the industry do not
typically account for the item as
proposed.
Dispositional attributions are expected since the observed
behavior did not follow industry (social) norms.
Therefore the actor is a salient causal force.
Consistency (High) The corporate controller has consistently
accounted for the item in this manner in
the past.
Dispositional attributions are expected since the corporate
controller demonstrates a pattern of inappropriate
accounting decisions, suggestive of a lack of credibility.
Distinctiveness (Low) There are other accounting decisions,
which if made, will allow the company to
meet forecasts.
Dispositional attributions are expected since this decision
represents the only option the company has to make
forecasts.
No Additional No additional environmental or dispositional information provided
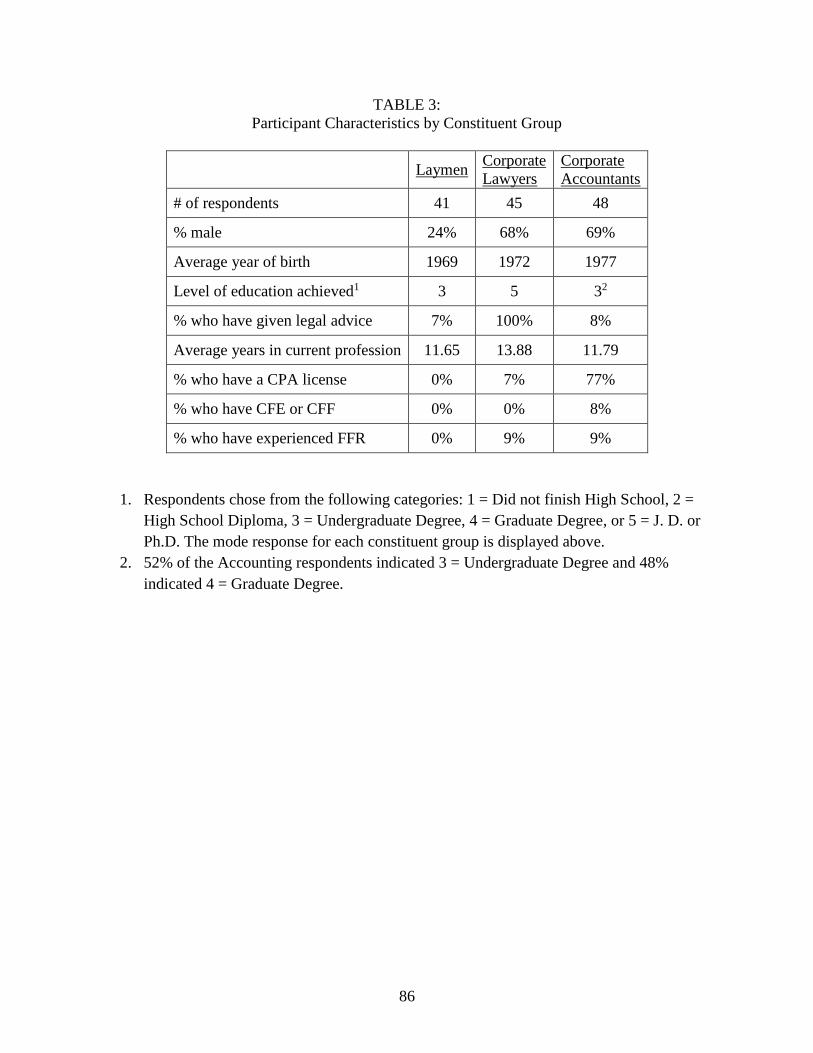
86
TABLE 3:
Participant Characteristics by Constituent Group
Laymen Corporate
Lawyers
Corporate
Accountants
# of respondents 41 45 48
% male 24% 68% 69%
Average year of birth 1969 1972 1977
Level of education achieved1 3 5 32
% who have given legal advice 7% 100% 8%
Average years in current profession 11.65 13.88 11.79
% who have a CPA license 0% 7% 77%
% who have CFE or CFF 0% 0% 8%
% who have experienced FFR 0% 9% 9%
1. Respondents chose from the following categories: 1 = Did not finish High School, 2 =
High School Diploma, 3 = Undergraduate Degree, 4 = Graduate Degree, or 5 = J. D. or
Ph.D. The mode response for each constituent group is displayed above.
2. 52% of the Accounting respondents indicated 3 = Undergraduate Degree and 48%
indicated 4 = Graduate Degree.

87
TABLE 4:
Pearson Correlation Matrix of Select Variables
Correlation
(p-value) C
onst
ituen
t
Gro
up
Info
Type
Dec
isio
n
Expen
se
Ori
gin
al
Est
imat
e
Sce
nar
io
Est
imat
e
Appro
pr.
Ass
essm
ent
Inte
rnal
ity
Ass
essm
ent
Gen
der
Yea
r B
orn
Educa
tion
Lev
el
Inte
rrupti
on
FF
R A
dju
st
Constituent
Group
1 -.051 .015 .000 -.309** .236** .037 -.158** -.355** .311** .270** .148** .018
.311 .760 1.000 .000 .000 .457 .002 .000 .000 .000 .003 .722
InfoType -.051 1 .000 .004 -.025 .082 -.017 .002 .046 -.038 -.020 -.018 -.055
.311
1.000 .940 .620 .101 .735 .972 .360 .451 .690 .716 .269
Decision .015 .000 1 .030 .008 .008 -.689** -.277** .022 -.022 .018 .056 -.013
.760 1.000
.542 .872 .871 .000 .000 .655 .661 .715 .263 .790
Expense .000 .004 .030 1 .000 -.009 .004 -.021 .000 0.000 .000 0.000 .008
1.000 .940 .542
1.000 .860 .938 .677 1.000 1.000 1.000 1.000 .873
Original
Estimate
-.309** -.025 .008 .000 1 -.273** .003 -.001 .036 -.028 -.152** -.101* -.500**
.000 .620 .872 1.000
.000 .955 .986 .471 .583 .002 .044 .000
Scenario
Estimate
.236** .082 .008 -.009 -.273** 1 .037 .068 .004 -.030 -.036 .017 -.697**
.000 .101 .871 .860 .000
.460 .170 .930 .548 .479 .739 .000
Appropr.
Assessment
.037 -.017 -.689** .004 .003 .037 1 .349** -.030 -.023 -.016 -.014 -.035
.457 .735 .000 .938 .955 .460
.000 .545 .645 .744 .785 .480
Internality
Assessment
-.158** .002 -.277** -.021 -.001 .068 .349** 1 .004 -.130** -.273** .087 -.061
.002 .972 .000 .677 .986 .170 .000
.940 .009 .000 .085 .222
Gender -.355** .046 .022 .000 .036 .004 -.030 .004 1 .007 -.240** -.145** -.031
.000 .360 .655 1.000 .471 .930 .545 .940
.890 .000 .004 .542
**. Correlation is significant at the 0.01 level (2-tailed).
*. Correlation is significant at the 0.05 level (2-tailed).
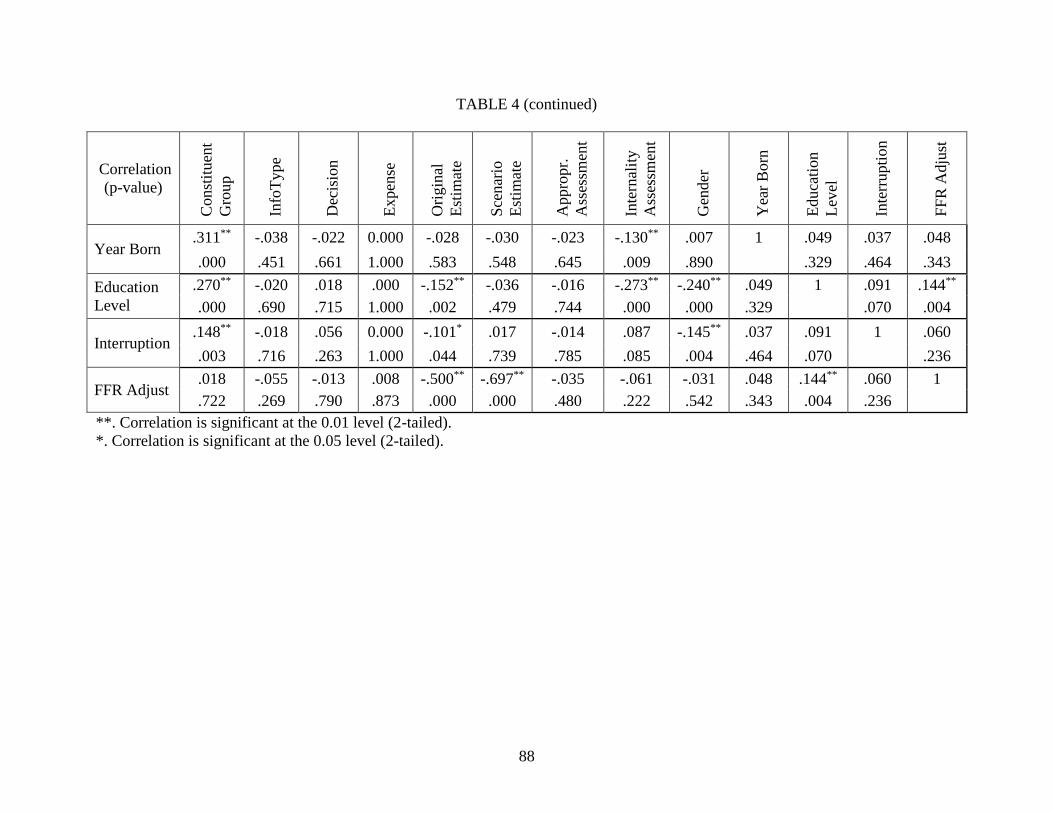
88
TABLE 4 (continued)
Correlation
(p-value) C
onst
ituen
t
Gro
up
Info
Type
Dec
isio
n
Expen
se
Ori
gin
al
Est
imat
e
Sce
nar
io
Est
imat
e
Appro
pr.
Ass
essm
ent
Inte
rnal
ity
Ass
essm
ent
Gen
der
Yea
r B
orn
Educa
tion
Lev
el
Inte
rrupti
on
FF
R A
dju
st
Year Born .311** -.038 -.022 0.000 -.028 -.030 -.023 -.130** .007 1 .049 .037 .048
.000 .451 .661 1.000 .583 .548 .645 .009 .890
.329 .464 .343
Education
Level
.270** -.020 .018 .000 -.152** -.036 -.016 -.273** -.240** .049 1 .091 .144**
.000 .690 .715 1.000 .002 .479 .744 .000 .000 .329
.070 .004
Interruption .148** -.018 .056 0.000 -.101* .017 -.014 .087 -.145** .037 .091 1 .060
.003 .716 .263 1.000 .044 .739 .785 .085 .004 .464 .070
.236
FFR Adjust .018 -.055 -.013 .008 -.500** -.697** -.035 -.061 -.031 .048 .144** .060 1
.722 .269 .790 .873 .000 .000 .480 .222 .542 .343 .004 .236
**. Correlation is significant at the 0.01 level (2-tailed).
*. Correlation is significant at the 0.05 level (2-tailed).

89
TABLE 5:
Results of the Full Mixed Model
Panel A: Mixed Model Results for Relationship Type, Information Type, and Outcome1
Variable
Num.
df
Den.
df F stat
P value
(two-
tailed)
Relationship Type 1 131 0.22 .640
Information Type 2 286 1.22 .298
Outcome 1 297 55.41 .000
Relationship Type x Information Type 2 286 0.39 .676
Relationship Type x Outcome 1 297 4.20 .041
Information Type x Outcome 2 292 1.67 .191
Relationship Type x Information Type x Outcome
2 292 0.85 .427
Panel B: Mixed Model Results for Constituent Group, Information Type, and Outcome1
Variable
Num.
df
Den.
df F stat
P value
(two-
tailed)
Constituent Group 2 130 8.01 .001
Information Type 2 286 1.50 .226
Outcome 1 291 48.28 .000
Constituent Group x Information Type 4 286 0.94 .441
Constituent Group x Outcome 2 291 2.47 .086
Information Type x Outcome 2 292 2.31 .101
Constituent Group x Information Type x Outcome
4 292 0.60 .661
1. When running the model and controlling for gender, age, mood, and previous exposure to
fraud, all inferences remain the same.
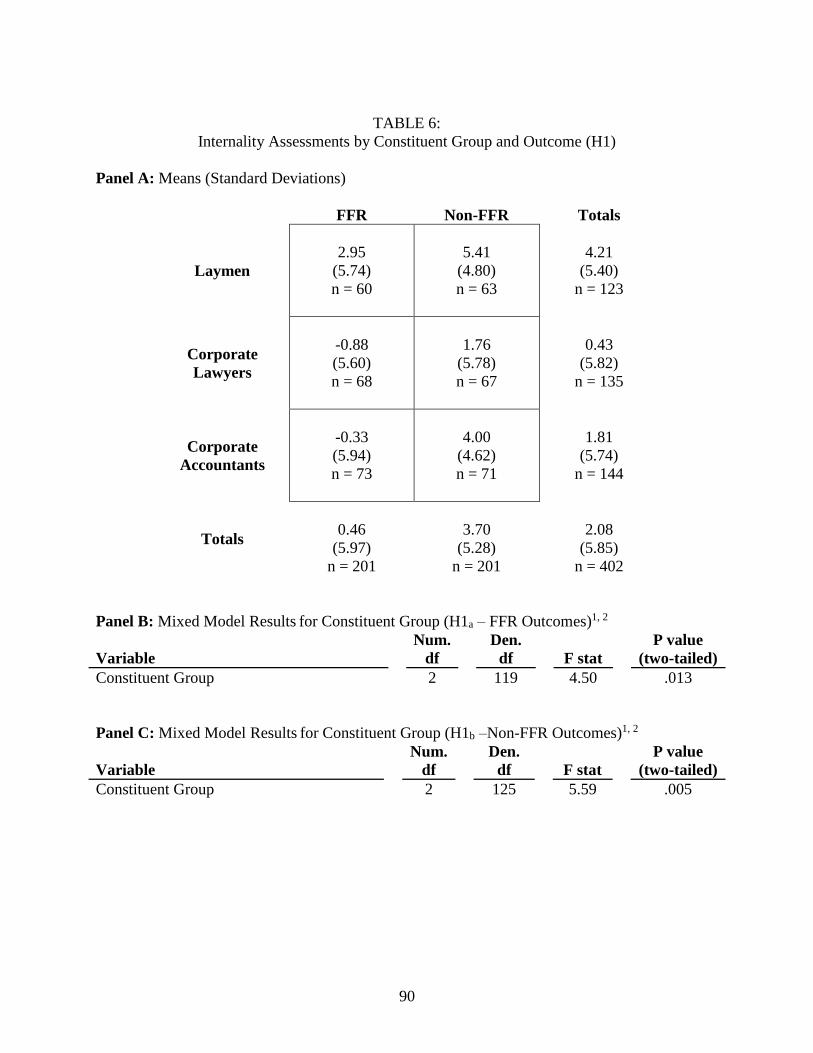
90
TABLE 6:
Internality Assessments by Constituent Group and Outcome (H1)
Panel A: Means (Standard Deviations)
FFR Non-FFR Totals
Laymen
2.95
(5.74)
n = 60
5.41
(4.80)
n = 63
4.21
(5.40)
n = 123
Corporate
Lawyers
-0.88
(5.60)
n = 68
1.76
(5.78)
n = 67
0.43
(5.82)
n = 135
Corporate
Accountants
-0.33
(5.94)
n = 73
4.00
(4.62)
n = 71
1.81
(5.74)
n = 144
Totals
0.46
(5.97)
n = 201
3.70
(5.28)
n = 201
2.08
(5.85)
n = 402
Panel B: Mixed Model Results for Constituent Group (H1a – FFR Outcomes)1, 2
Variable
Num.
df
Den.
df F stat
P value
(two-tailed)
Constituent Group 2 119 4.50 .013
Panel C: Mixed Model Results for Constituent Group (H1b –Non-FFR Outcomes)1, 2
Variable
Num.
df
Den.
df F stat
P value
(two-tailed)
Constituent Group 2 125 5.59 .005

91
TABLE 6 (continued)
Panel D: Mixed Model Results for Constituent Group and Outcome (H1c)1
Variable
Num.
df
Den.
df F stat
P value
(two-tailed)
Constituent Group 2 131 7.98 .001
Outcome 1 301 52.06 .000
Constituent Group x Outcome 2 301 2.16 .117
1. When running the model and controlling for gender, age, mood, and previous exposure to
fraud, all inferences remain the same.
2. Results of a Kruskal Wallis ANOVA lead to similar conclusions.

92
TABLE 7:
Internality Assessments by Constituent Group and Information Type (H2)
Panel A: Means (Standard Deviations) for FFR Outcomes (H2a)
Dispositional Environmental No Additional Totals
Laymen
4.00
(5.67)
n = 17
2.53
(5.23)
n = 17
2.54
(6.21)
n = 26
2.95
(5.74)
n = 60
Corporate
Lawyers
1.18
(5.27)
n = 22
-3.4
(4.52)
n = 25
-0.05
(6.15)
n = 21
-0.88
(5.60)
n = 68
Corporate
Accountants
-0.65
(6.00)
n = 26
-1.08
(6.26)
n = 25
0.91
(5.55)
n = 22
-0.33
(5.94)
n = 73
1.18 -1.03 1.23 0.46
Totals (5.89) (5.81) (6.00) (5.97)
n = 65 n = 67 n = 69 n = 201
Panel B: Mixed Model Results for Constituent Group and Information Type (H2a – FFR
Outcomes)1
Variable df MSE F stat
P value
(two-tailed)
Constituent Group 2 119 4.79 .010
Information Type 2 95 3.34 .040
Constituent Group x Information Type 4 95 1.30 .276
1. When running the model and controlling for gender, age, mood, and previous exposure to
fraud, all inferences remain the same.
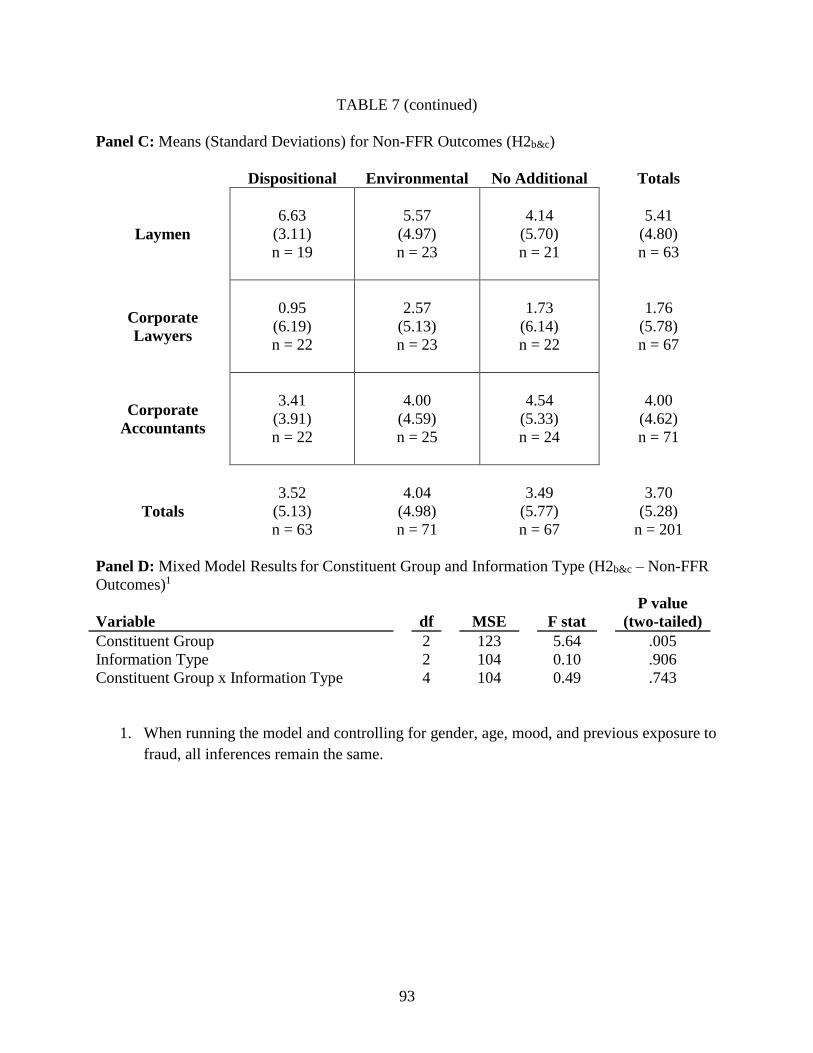
93
TABLE 7 (continued)
Panel C: Means (Standard Deviations) for Non-FFR Outcomes (H2b&c)
Dispositional Environmental No Additional Totals
Laymen
6.63
(3.11)
n = 19
5.57
(4.97)
n = 23
4.14
(5.70)
n = 21
5.41
(4.80)
n = 63
Corporate
Lawyers
0.95
(6.19)
n = 22
2.57
(5.13)
n = 23
1.73
(6.14)
n = 22
1.76
(5.78)
n = 67
Corporate
Accountants
3.41
(3.91)
n = 22
4.00
(4.59)
n = 25
4.54
(5.33)
n = 24
4.00
(4.62)
n = 71
3.52 4.04 3.49 3.70
Totals (5.13) (4.98) (5.77) (5.28)
n = 63 n = 71 n = 67 n = 201
Panel D: Mixed Model Results for Constituent Group and Information Type (H2b&c – Non-FFR
Outcomes)1
Variable df MSE F stat
P value
(two-tailed)
Constituent Group 2 123 5.64 .005
Information Type 2 104 0.10 .906
Constituent Group x Information Type 4 104 0.49 .743
1. When running the model and controlling for gender, age, mood, and previous exposure to
fraud, all inferences remain the same.

94
TABLE 8:
Business Culture Variables: Means (Standard Deviations) and ANOVAs
Variables
Scale
Constituent Group
ANOVA-F
(p value)
Overall
Means
n = (134)
Laymen
(n = 41)
Lawyers
(n = 44) Accountants
(n = 48) Bold are
Significant
at p < .05
In your opinion, how frequently do situations
arise where corporate controllers (i.e.,
accountants responsible for financial
reporting) have the opportunity to knowingly
misreport their financial statements?
1 = Very
Frequently
9 = Very
Infrequently
3.68 4.46 3.39 3.29 3.185
(2.42) (2.50) (2.36) (2.30) (0.045)
How likely is it that a corporate controller
will get away with knowingly misreporting
financial statements in today’s business
environment?
1 = Very Likely
9 = Very Unlikely 4.96 4.39 5.07 5.35 2.455
(2.10) (2.07) (2.14) (2.04) (0.090)
In your opinion, have the opportunities for
corporate controllers to knowingly misreport
financial statements increased or decreased
over the past twenty to thirty years?
1 = Significantly
Increased
5 = Remained
Relatively the
Same
9 = Significantly
Decreased
5.11 4.59 5.02 5.60 3.003
(1.97) (1.85) (2.11) (1.85) (0.053)
In your opinion, have controls over financial
reporting gotten stronger, weaker, or
remained relatively the same over the past
twenty to thirty years?
1 = Much Weaker
5 = Remained
Relatively the
Same
9 = Much
Stronger
6.36 5.65 6.27 7.04 9.398
(1.60) (1.63) (1.60) (1.30) (0.000)

95
TABLE 8 (continued)
Variables
Scale
Constituent Group
ANOVA-F
(p value)
Overall
Means
n = (134)
Laymen
(n = 41)
Lawyers
(n = 44)
Accountants
(n = 48) Bold are
Significant
at p < .05
In your opinion, is the overall business
culture today weaker, stronger, or relatively
the same as it was twenty to thirty years ago?
1 = Weaker
2 = Remains
relatively the
same
3 = Stronger
2.142 1.902 2.067 2.417 5.823
(0.76) (0.70) (0.78) (0.71) (0.004)
In your opinion, is the overall commitment to
ethical financial reporting weaker, stronger,
or relatively the same as it was twenty to
thirty years ago?
1 = Weaker
2 = Remains
relatively the
same
3 = Stronger
2.134 1.707 2.044 2.583 17.909
(0.78) (0.68) (0.82) (0.58) (0.000)
Recently enacted laws which are intended to
curb corporate misreporting (e.g., the
Sarbanes-Oxley Act, the Dodd-Frank Act,
etc.) have drastically reduced the prevalence
of inappropriate behavior related to financial
reporting.
1 = Strongly
Agree
9 = Strong
Disagree
4.65 4.88 4.84 4.29 1.607
(1.76) (1.79) (1.49) (1.93) (0.204)
Recently enacted laws which are intended to
curb corporate misreporting (e.g., the
Sarbanes-Oxley Act, the Dodd-Frank Act,
etc.) have effectively reduced shortcomings in
business culture.
1 = Strongly
Agree
9 = Strong
Disagree
5.06
(1.76)
5.07
(1.72)
5.39
(1.79)
4.75
(1.74)
1.512
(0.224)
Recently enacted laws which are intended to
curb corporate misreporting (e.g., the
Sarbanes-Oxley Act, the Dodd-Frank Act,
etc.) have increased awareness of the need for
strong governance.
1 = Strongly
Agree
9 = Strong
Disagree
3.76
(1.76)
4.27
(1.87)
3.73
(1.87)
3.35
(1.45) 3.093
(0.049)1
1. Kruskal Wallis ANOVA shows p = .081

96
TABLE 8 (continued)
Variables
Scale
Constituent Group
ANOVA-F
(p value)
Overall
Means
n = (134)
Laymen
(n = 41)
Lawyers
(n = 44)
Accountants
(n = 48) Bold are
Significant
at p < .05
Recently enacted laws which are intended to
curb corporate misreporting (e.g., the
Sarbanes-Oxley Act, the Dodd-Frank Act,
etc.) have improved corporate governance.
1 = Strongly
Agree
9 = Strong
Disagree
4.20 4.51 4.61 3.52 5.841
(1.73) (1.73) (1.99) (1.22) (0.004)
Recent increases in the level of controls over
financial reporting have been effective in
preventing companies from intentionally
misstating their financials.
1 = Strongly
Agree
9 = Strong
Disagree
4.47 4.78 4.55 4.15 1.462
(1.76) (1.83) (1.53) (1.88) (0.236)
Continuing to increase controls over financial
reporting will help to further prevent financial
reporting fraud.
1 = Strongly
Agree
9 = Strong
Disagree
4.41 4.37 4.27 4.57 0.286
(1.94) (2.19) (1.70) (1.95) (0.752)
Regulators and prosecutors should continue to
increase their enforcement actions against
individuals and companies who misreport
their financials.
1 = Strongly
Agree
9 = Strong
Disagree
2.76 2.88 2.86 2.57 0.462
(1.68) (1.81) (1.94) (1.26) (0.631)
Legislators should continue to develop and
enact laws that target intentional financial
misreporting.
1 = Strongly
Agree
9 = Strong
Disagree
3.65 3.29 3.86 3.73 0.807
(2.12) (2.14) (2.49) (1.69) (0.449)
In general, I feel like I can trust corporate
controllers (i.e., accountants responsible for
financial reporting) to do the right thing when
making decisions related to financial
reporting.
1 = Strongly
Agree
9 = Strong
Disagree
3.80 4.68 3.91 2.91 11.758
(1.85) (1.78) (2.04) (1.27) (0.000)

97
TABLE 8 (continued)
Variables
Scale
Constituent Group
ANOVA-F
(p value)
Overall
Means
n = (134)
Laymen
(n = 41)
Lawyers
(n = 44)
Accountants
(n = 48) Bold
Significant
at p < .05
In general, individuals who decide to
intentionally misreport their company's
financials choose to do so because they are
inherently bad people.
1 = Strongly
Agree
9 = Strong
Disagree
5.69 5.38 6.25 5.44 2.989
(1.89) (2.02) (1.83) (1.76) (0.054)2
In general, individuals who decide to
intentionally misreport their company's
financials choose to do so because of
situational pressures.
1 = Strongly
Agree
9 = Strong
Disagree
3.12 3.41 3.05 2.96 1.044
(1.51) (1.45) (1.48) (1.60) (0.355)
Do you feel more can be done within
the overall financial reporting environment to
better prevent financial reporting fraud? In
other words, can anything else be done by key
stakeholders (e.g., regulators, law
enforcement, auditors, Congress, etc.) to
better prevent financial reporting fraud?
1 = Yes - more
can be done to
prevent FFR
2 = No - recent
changes in the
financial reporting
environment are
enough
1.38 1.29 1.32 1.52 3.100
(0.49) (0.46) (0.47) (0.50) (0.048)
2. Kruskal Wallis ANOVA shows p = .043

98
TABLE 8 (continued)
Variables
Scale
Constituent Group
ANOVA-F
(p value)
Overall
Means
n = (134)
Laymen
(n = 41)
Lawyers
(n = 44)
Accountants
(n = 48) Bold are
Significant
at p < .05
Do you feel more should be done in
the aftermath of an occurrence of financial
reporting fraud to better understand the
complete set of its causal factors? In other
words, should more be done by key
stakeholders (e.g., regulators, law
enforcement, auditors, Congress, etc.) to
better understand what caused the financial
reporting fraud?
1 = Yes - more can
be done in the
aftermath to better
understand the
causal factors
2 = No - what is
currently done is
enough
1.32 1.20 1.42 1.34 2.345
(0.47) (0.41) (0.50) (0.48) (0.100)

99
TABLE 9:
Internality Assessments by Constituent Group and Outcome Controlling for Potential Causes of
Correspondence Bias
Panel A: Estimated Marginal Means (Standard Errors)
FFR Non-FFR Totals
Laymen
4.18
(0.76)
n = 59
4.93
(0.71)
n = 61
4.55
(0.54)
n = 120
Corporate
Lawyers
-0.03
(0.69)
n = 66
-0.02
(0.70)
n = 66
-0.03
(0.46)
n = 132
Corporate
Accountants
.877
(0.70)
n = 71
2.09
(0.74)
n = 67
1.48
(0.48)
n = 138
Totals
1.67
(0.45)
n = 196
2.33
(0.45)
n = 194
2.00
(0.26)
n = 390
Panel B: ANCOVA Results for Constituent Group and Outcome Controlling for Potential
Causes of Correspondence Bias, Gender, and Age
Variable df MSE F stat
P value
(two-tailed)
Constituent Group 2 536.52 20.01 .000
Outcome 1 22.49 0.84 .360
Constituent Group x Outcome 2 12.19 0.45 .635
Covariates:
Lack of Awareness (Factor 1) 1 110.83 4.13 .043
Unrealistic Expectations (Baseline Estimate) 1 118.09 4.41 .036
Inflated Categorizations (Appropriateness) 1 683.03 25.48 .000
Gender 1 110.14 4.11 .043
Age 1 102.20 3.81 .052

100
TABLE 10:
Internality Assessments by Constituent Group and Information Type Controlling for Potential
Causes of Correspondence Bias
Panel A: Estimated Marginal Means (Standard Errors) for FFR Outcomes
Dispositional Environmental No Additional Totals
Laymen
4.38
(1.42)
n = 17
1.29
(1.47)
n = 16
2.78
(1.17)
n = 26
2.82
(0.85)
n = 59
Corporate
Lawyers
0.59
(1.22)
n = 21
-3.98
(1.11)
n = 25
0.01
(1.24)
n = 20
-1.13
(0.69)
n = 66
Corporate
Accountants
-0.25
(1.10)
n = 26
-1.47
(1.16)
n = 24
0.73
(1.27)
n = 21
-0.33
(0.73)
n = 71
Totals
1.57
(0.70)
n = 64
-1.39
(0.72)
n = 65
1.17
(0.68)
n = 67
0.45
(0.39)
n = 196
Panel B: ANCOVA Results for Constituent Group, Information Type, and Outcome Controlling
for Potential Causes of Correspondence Bias, Gender, and Age
Variable df MSE F stat
P value
(two-tailed)
Constituent Group 2 189.71 6.29 .002
Information Type 2 148.96 4.94 .008
Constituent Group x Information Type 4 23.92 0.79 .531
Covariates:
Lack of Awareness (Factor 1) 1 98.19 3.26 .073
Unrealistic Expectations (Baseline Estimate) 1 87.46 2.90 .090
Inflated Categorizations (Appropriateness) 1 177.48 5.89 .016
Gender 1 26.86 0.89 .346
Age 1 71.55 2.37 .125

101
TABLE 11:
Factor Loadings for Business Culture Variables
Variable Name Statement
Component Loading
1 2 3 4
Fact
or
1
DrasticReduceBehavior
Recently enacted laws which are intended to curb corporate
misreporting (e.g., the Sarbanes-Oxley Act, the Dodd-Frank Act,
etc.) have drastically reduced the prevalence of inappropriate
behavior related to financial reporting.
.839
BusCultureShortcoming
Recently enacted laws which are intended to curb corporate
misreporting (e.g., the Sarbanes-Oxley Act, the Dodd-Frank Act,
etc.) have effectively reduced shortcomings in business culture.
.807
ControlsPreventCompanies
Recent increases in the level of controls over financial reporting
have been effective in preventing companies from intentionally
misstating their financials.
.801
ImprovedGovernance
Recently enacted laws which are intended to curb corporate
misreporting (e.g., the Sarbanes-Oxley Act, the Dodd-Frank Act,
etc.) have improved corporate governance.
.751 -.338
AwarenessGovernance
Recently enacted laws which are intended to curb corporate
misreporting (e.g., the Sarbanes-Oxley Act, the Dodd-Frank Act,
etc.) have increased awareness of the need for strong governance.
.654 -.311
ControlsPreventFFR
Continuing to increase controls over financial reporting will help to
further prevent financial reporting fraud.
.599 .400

102
TABLE 11 (continued)
Variable Name Statement
Component Loading
1 2 3 4
Fact
or
2
OpportIncDec
In your opinion, have the opportunities for corporate controllers to
knowingly misreport financial statements increased or decreased
over the past twenty to thirty years?
.791
ControlsStongWeak
In your opinion, have controls over financial reporting gotten
stronger, weaker, or remained relatively the same over the past
twenty to thirty years?
.757
CommitmentEthical
In your opinion, is the overall commitment to ethical financial
reporting weaker, stronger, or relatively the same as it was twenty to
thirty years ago?
.698
BusCultureStrongWeak
In your opinion, is the overall business culture today weaker,
stronger, or relatively the same as it was twenty to thirty years ago?
.633
TrustControllers
In general, I feel like I can trust corporate controllers (i.e.,
accountants responsible for financial reporting) to do the right thing
when making decisions related to financial reporting.
.420 -.528
Fact
or
3 MoreFraudAftermath
Do you feel more should be done in the aftermath of an occurrence
of financial reporting fraud to better understand the complete set of
its causal factors? In other words, should more be done by key
stakeholders (e.g., regulators, law enforcement, auditors, Congress,
etc.) to better understand what caused the financial reporting fraud?
.730
ContinueEnactLaws
Legislators should continue to develop and enact laws that target
intentional financial misreporting.
.314 .716
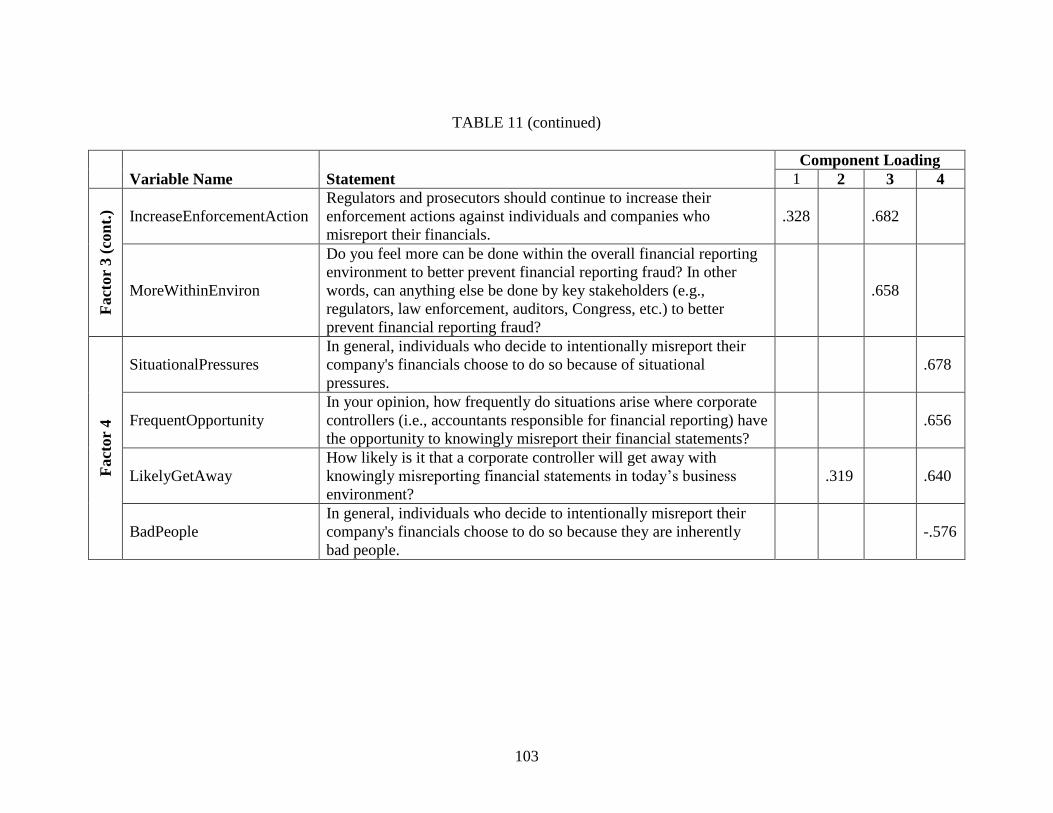
103
TABLE 11 (continued)
Variable Name Statement
Component Loading
1 2 3 4
Fact
or
3 (
con
t.) IncreaseEnforcementAction
Regulators and prosecutors should continue to increase their
enforcement actions against individuals and companies who
misreport their financials.
.328 .682
MoreWithinEnviron
Do you feel more can be done within the overall financial reporting
environment to better prevent financial reporting fraud? In other
words, can anything else be done by key stakeholders (e.g.,
regulators, law enforcement, auditors, Congress, etc.) to better
prevent financial reporting fraud?
.658
Fact
or
4
SituationalPressures
In general, individuals who decide to intentionally misreport their
company's financials choose to do so because of situational
pressures. .678
FrequentOpportunity
In your opinion, how frequently do situations arise where corporate
controllers (i.e., accountants responsible for financial reporting) have
the opportunity to knowingly misreport their financial statements?
.656
LikelyGetAway
How likely is it that a corporate controller will get away with
knowingly misreporting financial statements in today’s business
environment?
.319 .640
BadPeople
In general, individuals who decide to intentionally misreport their
company's financials choose to do so because they are inherently
bad people.
-.576
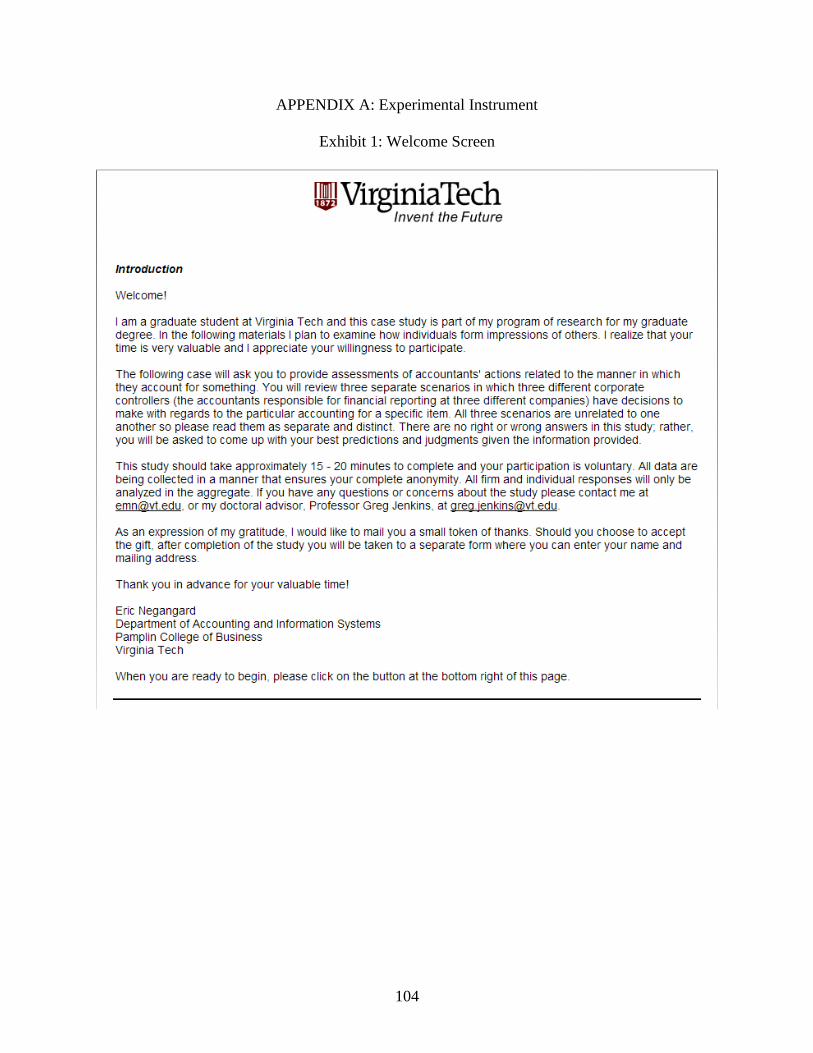
104
APPENDIX A: Experimental Instrument
Exhibit 1: Welcome Screen
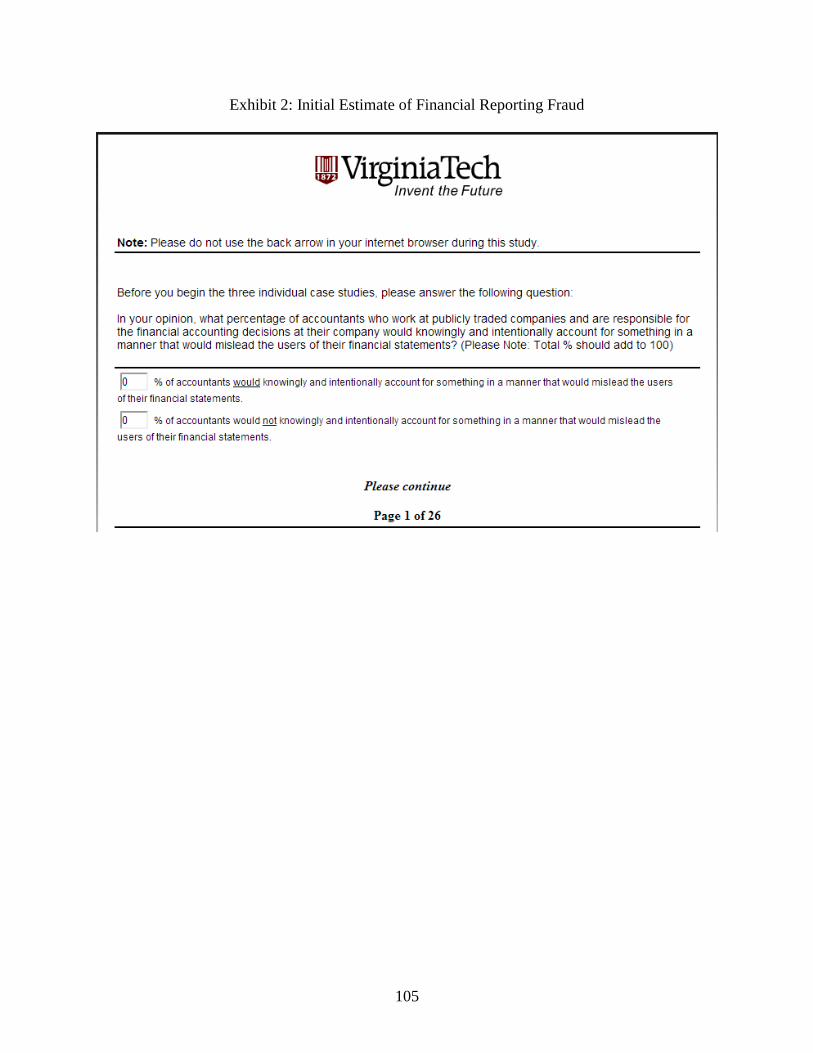
105
Exhibit 2: Initial Estimate of Financial Reporting Fraud
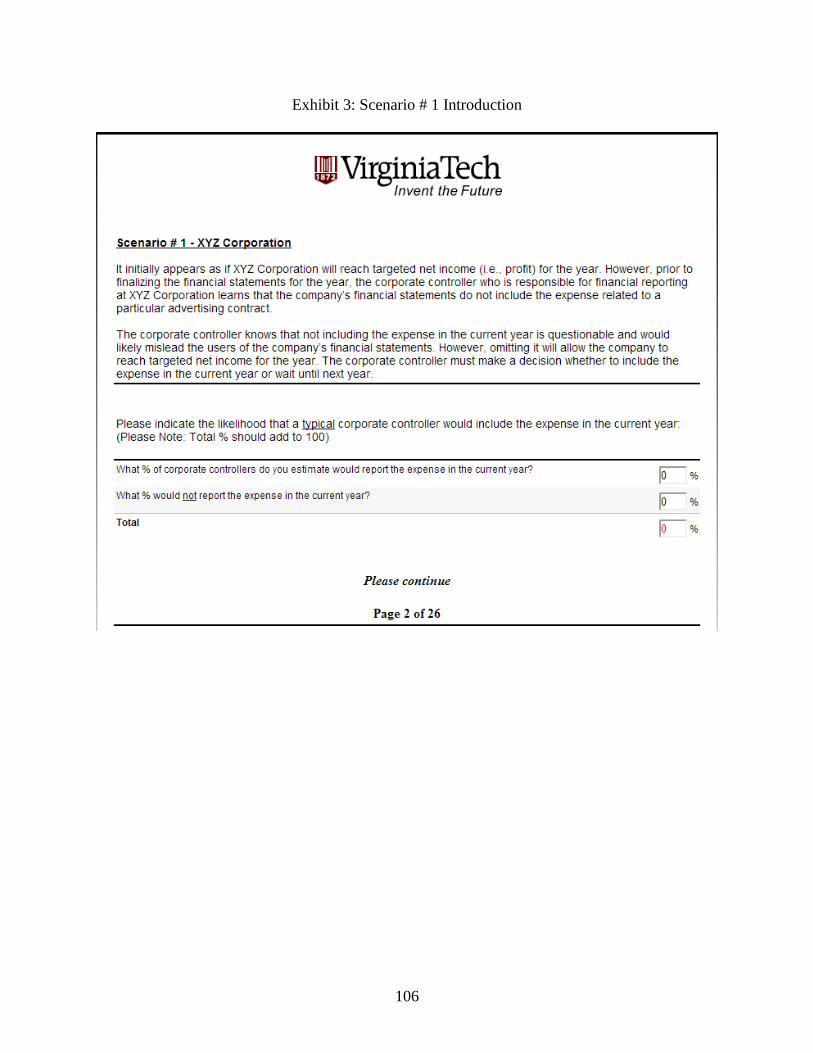
106
Exhibit 3: Scenario # 1 Introduction
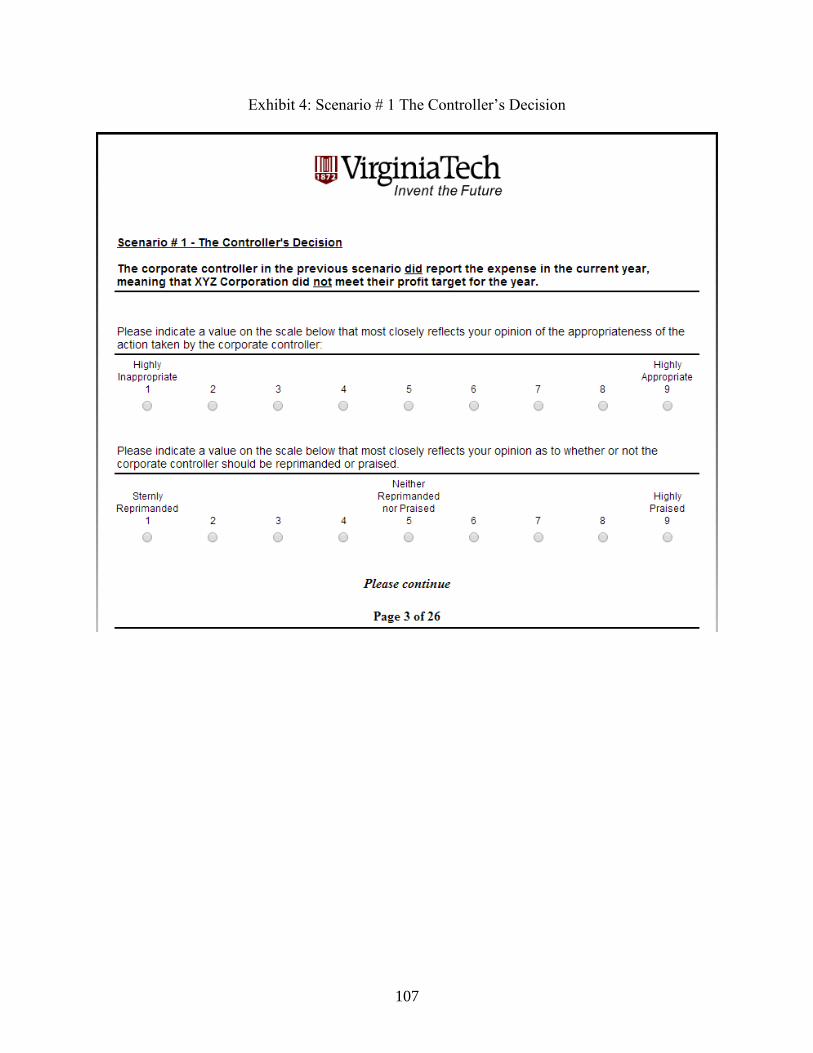
107
Exhibit 4: Scenario # 1 The Controller’s Decision

108
Exhibit 5: Scenario # 1 Points Assignment

109
Exhibit 6: Scenario # 1 Internality Scale

110
Exhibit 7: Scenario # 2 Introduction
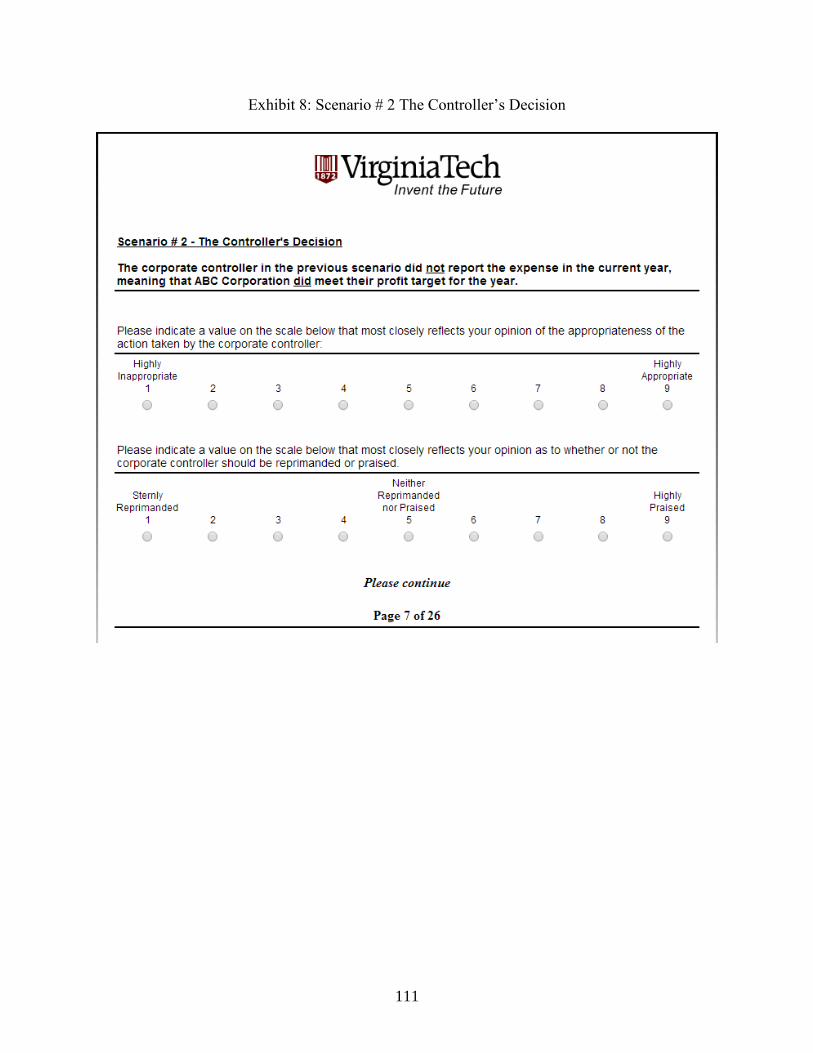
111
Exhibit 8: Scenario # 2 The Controller’s Decision

112
Exhibit 9: Scenario # 2 Points Assignment

113
Exhibit 10: Scenario # 2 Internality Scale

114
Exhibit 11: Scenario # 3 Introduction

115
Exhibit 12: Scenario # 3 The Controller’s Decision
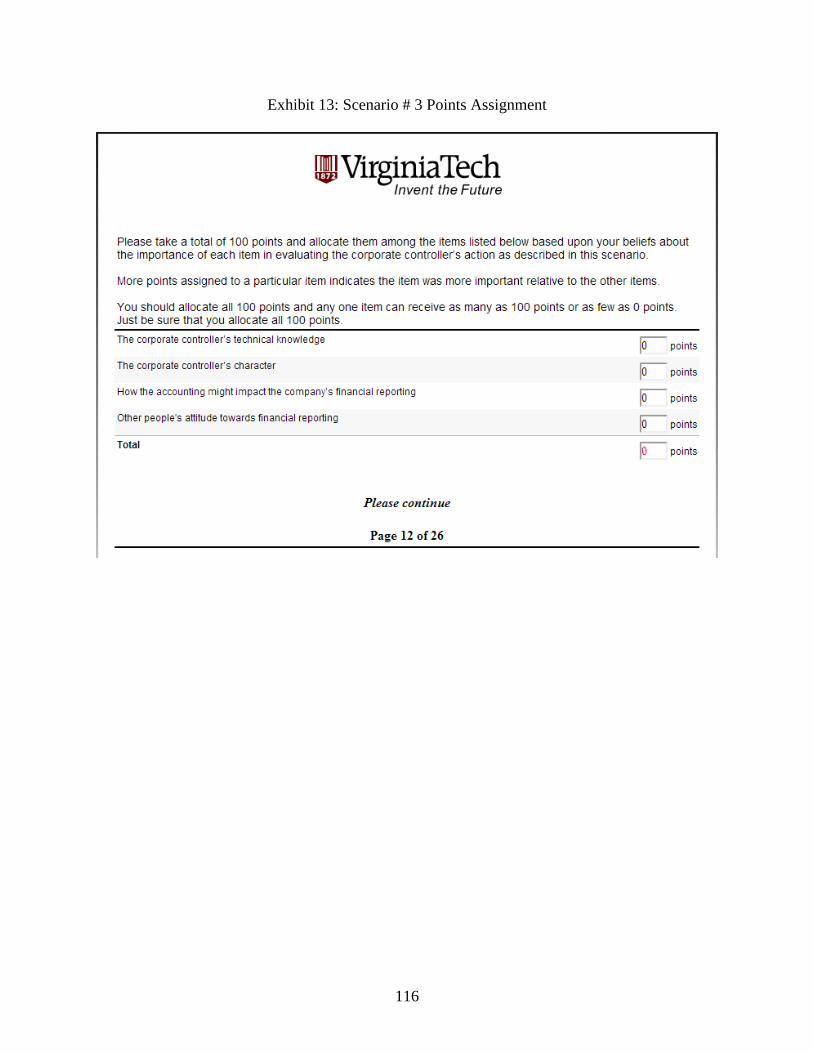
116
Exhibit 13: Scenario # 3 Points Assignment
117
Exhibit 14: Scenario # 3 Internality Scale
118
Exhibit 15: Demographic Questions

119
Exhibit 16: Demographic Questions (continued)

120
Exhibit 17: Demographic Questions (continued)
121
Exhibit 18: Motivation and Mood Questions

122
Exhibit 19: Business Culture Questions

123
Exhibit 20: Business Culture Questions (continued)
124
Exhibit 21: Business Culture Questions (continued)
125
Exhibit 22: Business Culture Questions (continued)

126
Exhibit 23: Business Culture Questions (continued)

127
Exhibit 24: Business Culture Questions (continued)

128
Exhibit 25: Experienced Fraud Question

129
Exhibit 26: Overall Financial Reporting Environment Question

130
Exhibit 27: Aftermath of Financial Reporting Fraud Question