an experimental study of tracers for labeling of …
TRANSCRIPT

NCWiUuOB^
NI f V - •«
AN EXPERIMENTAL STUDY OF TRACERS FOR LABELING OF
INJECTION GAS IN OIL RESERVOIRS
by
ØYVIND DUGSTAD Institutt for energiteknikk
P.O. Box 40 2007 Kjeller
Norway
The Thesis work for the partial fulfilment of the Dr. scient degree
DEPARTMENT OF PHYSICS UNIVERSITY OF BERGEN
NORWAY 1992

PREFACE
This thesis work consists of tour papers presented in section II, preceded by a literature review, some general theory and the results from supplementary experiments carried out in the laboratory at Institutt for energiteknikk. The work was carried out in the period 1988-1992.
The objective of the work has been to study gas tracers and their properties in the reservoir. Equipment has been built to study the tracers in dynamic processes under simulated reservoir conditions. Of special interest has been to study the potential of perfluorocarbon compounds as reservoir tracers. Problems addressed have been retention of tracers by interaction with the rock surface, partitioning of the tracers between gas/oil and partitioning of the tracers between gas/water.
Most of the work has been carried out within projects supported by oil companies. I wish to thank OP, Phillips Petroleum Company and Statoil for the permission to publish data achieved in the projects.
I will like to thank Institutt for energiteknikk (IFE) for the permission to apply parts of my working hours to fulfil this work.
Special thanks are expressed to Dr. philos. Tor Bjørnstad at Institutt for energiteknikk for his contribution, encouragement and inspiration through this work.
I will also like to thank Dr. philos. Kristoffer Koltveit, University of Bergen, for his advice and support, senior engineer Ingleiv Hundere (IFE) for his contribution, advice and support, and engineer Odd B. Haugen (IFE) for his help with the work carried out in the laboratory.
CONTENTS
PARTI Introduction
Section Ease 1 Introduct ion 1
2 Tracer application-a l i terature rev iew 3 2.1 Introduction 3 2.2 Dry gas - pulse injection 4 2.3 Dry gas - continuous injection 6 2.4 Water-alternating-gas (WAG) injection 7 2.5 High-pressure miscible injection 8 2.6 Estimation of oil saturation by partitioning tracers 9 2.7 Summary 10
3 Tracer re tent ion in interwell flow 11 3. 1 Introduction 11 3.2 Partition coefficients 11 3.2.1 Partition coefficient- definitions and fundamental relations 11 3.2.2 Kp from equation rf state (EOS) calculations 13 3.2.3 Estimation of partition coefficient 15 3.2.4 Partition coefficient from experiments 20 3.3 Adsorption to grain surface 24 3.4 Isotopic exchange 25 3.5 Thermal and chemical degradation 29
4 T h e t r a c e r s a p p l i e d 30 4.1 The radioactive tracers 30 4.2 The perfluorocarbons 30
5 Gas t r a c e r d e t e c t i o n 33 5.1 Radioactive tracers 33 5.2 Chemical tracers 34 5.2.1 Laboratory experiments 34 5.2.2 Field analyses 34
Section
6 Experiments 37 6.1 The slim-tube apparatus 37 6.2 Tracer retention on liquid free slim-tube 38 6.3 Kt-values between gas and decane from slim-tube experiments 41 6.3.1 The fluids applied 41 6.3.2 Results from dynamic experiments in the decane/methane system 44 6.3.3 Results from dynamic experiments in the decaue/nitrogen system 47 6.4 Results from dynamic experiments in the methane/water system 47 6.5 Static Kc-value experiments 50 6.6 PMCP and PMCH as tracers in a field experiment 51
7 Discussion 52 7.1 Partitioning of the tracer in the reservoir 52 7.2 Comparison of Kc-values measured in different systems 53
8 Conclusion and Outlook 55
9 Nomenclature 56
10 References 58
PART 2 Papers
Dugstad 0, Bjørnstad T, Hundere I, "Construction of a Slim-tube Equipment for Gas-Tracer Evaluation at Simulated Reservoir Conditions" Applied Radiat. Isot. Vol. 43, No. 4 pp. 527-535,1992.
Dugstad 0, Bjørnstad T, Hundere I, "Measurements of Gas Tracer Retention under Simulated Reservoir Conditions". Submitted for publication.
Dugstad 0, Bjørnstad T, Hundere I, "Measurements and Application of Partition Coefficients of Compounds Suitable for Tracing Gas Injected into Oil Reservoirs" Revue de L'Institut Francais du Petrole Vol 47 No 2 Mach-April 1992.
Ljosland E., Bjørnstad T. Hundere I. and Dugstad 0. Application of PFC tracers at the Gullfaks Field in the North Sea" Submitted for publication.

I Introduction
A reliable reservoir description is important to enable a best choice of production strategy when secondary production methods as gas or water injection is carried out. If one considers EOR techniques which employ expensive fluids as surfactants, micellar fluids or polymers, it is from an economical point of view even more important to choose the best production strategy to avoid loss of expensive injection fluids in the reservoir.
Tracers have been used as a tool in the oil industry to improve the reservoir description. Tracers have been applied to monitor mud infiltration to enhance reliability of near well chemistry analyses. They have been applied to measure oil saturation from single well push and pull studies. Most extensively applied is, however, the tracers as a tool to measure properties of a reservoir segment between an injection and a production well. Tracers are applied to identify preferred flow directions, channels, heterogeneities, flow velocities and volumetric sweep. In order to enhance the potential of the tracer technique, improved tracer knowledge is important. Improvements of the reservoir simulation tool which incorporate effects as partitioning of the tracers between the different phases and adsorption to the grain surfaces demand better knowledge about the physical/chemical properties of the tracer.
Large fields as in the North Sea where several injections and production wells are operating, demands a multiple of tracers to tag the different wells. The number of applicable radioactive tracers, however, is limited and it is therefore important to identify other suitable compounds.
Several properties have to be evaluated to enable selection of a reliable gas tracer. The tracers may be retained or absorbed by the rock matrix or by partition into the liquid phase. Loss of tracers may occur by chemical reactions or isotopic exchange. Partitioning of the tracer into the liquid phase will give a delay which is a function of the partition coefficient, the saturation and the fractional flow of three phases (water, oil, gas). The compounds which are candidates as tracers have to be stable at the pressure and temperature conditions in the reservoir. Radioactive tracers may be degraded by isotopic exchange, where the radioactive element in the tracer molecule exchanges place with a similar element in one of the liquid phase molecules.

2
In this work experiments are carried out to study some of these effects. An apparatus is developed to carry out dynamic flooding experiments in porous media. The porous media configuration applied is a packed slim-tube which may be either 6 or 12 meters long and the inner diameter is 5 mm. Automatic sampling and analyses system for the effluent gas is designed for recording of both chemical and radioactive tracers. A description of this equipment is given in paper No. I.
Retention caused by interaction between the tracer and various grain materials are studied in paper No. II. Partition coefficients are calculated from experiments where the pores contain a certain saturation of a liquid phase (decane or water). In addition some partition coefficient measurements are carried out from static batch experiments.
According to the literature the most widely applied gas tracers have been tritiated methane and 8 5 K r . In this thesis tritiated methane has been studied together with 1 4C-labelled ethane and several "new" gas tracers selected from the perfluorocarbons (PFC). The compounds have been studied in experiments where pressure and temperature are comparable with reservoir conditions. The main part of the experiments are carried out in a system where decane is applied as a model oil. Some experiments have, however, also been carried out with reservoir oil.
The perfluorocarbons studied are perfluoromethylcyclopentane (PMCP) and perfluoromethylcyclohexane (PMCH). The perfluorocarbons are candidates as reservoir tracers because they have good stability and low detection limit when an electron capture detector (ECD) is applied. The PFCs studied are non-toxic (Dietz et al. 1983) and compared with the handling of radioactive tracers few precautions are necessary. The low detection limit of the PFC compounds enable tagging of injection gas in large North Sea reservoirs with only a few kg of the tracer. In paper IV results from field studies are reported. An experimental procedure is developed to measure the concentration of PMCP and PMCH from field samples.
As a supplement to the experimental results reported in the four papers some additional results are reported in chapter 6.

3
2 Tracer applications - a literature review
2.1 Introduction
Several authors have reported the use of tracers as a technique to follow the movement of injected gas in petroleum reservoirs. E.M. Frost (1946) reported the use of natural Helium as gas tracer as early as 1946. The detection limit of this gas is however not low enough to enable efficient measurements in well to well studies in large fields as in the North Sea.
Since 1946 several tracer studies are reported and even more are carried out without being published in open literature. In this chapter a review of papers are presented to elucidate the feasibility of tracers as a tool to improve the reservoir characterization. The review is limited to gas tracers.
Wagner (1977) pointed out six areas where tracers could be used as a tool to improve the reservoir description in interwell tracer studies:
"1 Volumetric Sweep: The volume of fluid injected at an injection well until breakthrough of the traced fluid at an offset producer is indicative of the volumetric sweep efficiency between that pair of wells. Very small injected volumes to breakthrough (relative to the interwell pore volume) would indicate the existence of an interwell open, fracture (or a very thin high permeability stringer) and would give an idea of the volume of that channel. Knowledge of channel is important to the sizing of remedial treatment.
2 Identification of Offending Injectors: Problem injection wells can be identified by associating the breakthrough of a specific tracer to its point of injection, and it is at this well that a remedial treatment to seal a channel normally would be applied.
3 Directional Flow Trends: When fluids are injected in a regular pattern (five-spot, nine-spot, line drive etc) and the fluids injected at each well tagged with a different tracer, any directional flow trends will be obvious from the repeated early tracer breakthrough at producers located in a preferential direction from the injectors. Where directional flow trends are prevalent, the interwell sweep efficiency often

AN EXPERIMENTAL STUDY OF TRACERS FOR LABELING OF
INJECTION GAS IN OIL RESERVOIRS
ØYVIND DUGSTAD

4
can be improved by altering the injection pattern and/or the injection and withdrawal rates at selected wells.
4 Delineation of Flow Barriers: Faults with large displacement along the fault plane and permeability pinchouts can represent barriers to the flow of fluids perpendicular to their axis. Normally, such barriers are detected by bottom-hole pressure build-up surveys run in wells located in the vicinity. However, the course of these barriers can be delineated further from the production wells response, or lack of response to traced water injection at an array of wells surrounding the producer.
5 Relative Velocities of Injected Fluids: When different fluids are injected simultaneously, alternately, or sequentially in the same well, each fluid being tagged with a different non-adsorbing tracer, the relative velocities of these fluids can be measured from the individual tracer arrival time at offset producers. For example, assume that traced solvents and traced water were being injected alternately in the same well. The early arrival of one of the traced fluids at the producing well would indicate that the early arriving fluid had contacted less of the reservoir than the late arriving fluid. This would show a need to alter one of the fluid injection cycles to achieve more uniform sweep of the reservoir. Similarly, in a micellar flood where a water are injected sequentially, the overrunning or fingering of one injected fluid through another would point out the need for better fluid mobility control to achieve more uniform sweep by the various injected fluids.
6 Evaluation of Sweep Improvement Treatments: Remedial treatment to correct sweep problems can be evaluated by comparing the before-and-after treatment interwell volumetric sweep as determined by tracing."
The gas tracers have been used to follow the recycled gas in both slug and continuous injections. The gas tracer have also been used to follow injected CO2, N2, air and solvent (enriched gas) under WAG injection programs.
2.2 D r y gas - pu l s e injection
Welge (1955) describes one of the pioneering work of tracer application to follow injected gas. The communication between the wells in a small part of the Cromwell pool in centra] Oklahoma was investigated. The well spacing in the
s
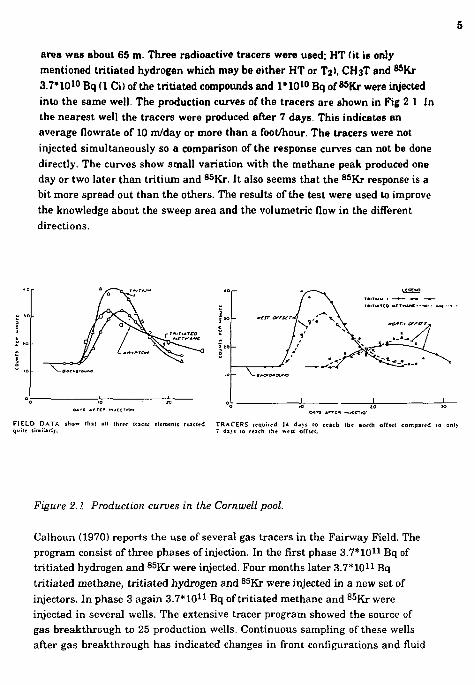
area was about 65 m. Three radioactive tracers were used; HT (it is only mentioned tritiated hydrogen which may be either HT or T2), CH3T and ^Kr 3.7»1010 Bq (1 Ci) of the tritiated compounds and l ' lO 1 0 Bq of ̂ Kr were injected into the same well. The production curves of the tracers are shown in Fig 2 1 In the nearest well the tracers were produced after 7 days. This indicates an average flowrate of 10 m/day or more than a foot/hour. The tracers were not injected simultaneously so a comparison of the response curves can not be done directly. The curves show small variation with the methane peak produced one day or two later than tritium and 8 5 Kr. It also seems that the 8 5 Kr response is a bit more spread out than the others. The results of the test were used to improve the knowledge about the sweep area and the volumetric flow in the different directions.
FIELD DATA show lhal alt three tracer dementi reacted TRACERS required 14 djjs (o reach the «orth offset compared to onl> ouite siraitarlj. 7 dais to reach the «est offset.
Figure 2.1 Production curves in the Cornwell pool.
Calhoun (1970) reports the use of several gas tracers in the Fairway Field. The program consist of three phases of injection. In the first phase Z.7*\Q11 Bq of tritiated hydrogen and 8 5 Kr were injected. Four months later 3.7*10 n Bq tritiated methane, tritiated hydrogen and 8 5 Kr were injected in a new set of injectors. In phase 3 again 3.7*1011 Bq of tritiated methane and 8 5 Kr were injected in several wells. The extensive tracer program showed the source of gas breakthrough to 25 production wells. Continuous sampling of these wells after gas breakthrough has indicated changes in front configurations and fluid
6
migration pattern chanced to reduce fingering of the injected gas. Thi* knowledge has been useful in alternating injection cycles and rates to control GOR's at a reasonable level. Radioactive tracer results also indicate that high pressure gas injection at the Fairway is yielding additional oil recovery, either through swelling of the residual oil or by partial miscibility.
Tinker (1973) reports the use of tritiated hydrogen and 8 5 K r as tracers under methane injection in the Trembler Zone II reservoir of the East Coalinga field, California. The tracers revealed that desaturated intervals were often continuous over wide areas of the field. Those intervals could greatly influence an injection project by acting as thief zone for injection water. The tracer study suggested generally better reservoir sand continuity than could be inferred from a related outcrop study.
2.3 Dry gas - cont inuous injection
8 5 K r has been used (Burwell 1965) to trace the injected air in an underground combustion project. By measuring the transit times of the injected gas through the reservoir, the permeability trends, and the relative percent of gas production from pat tern wells were determined.
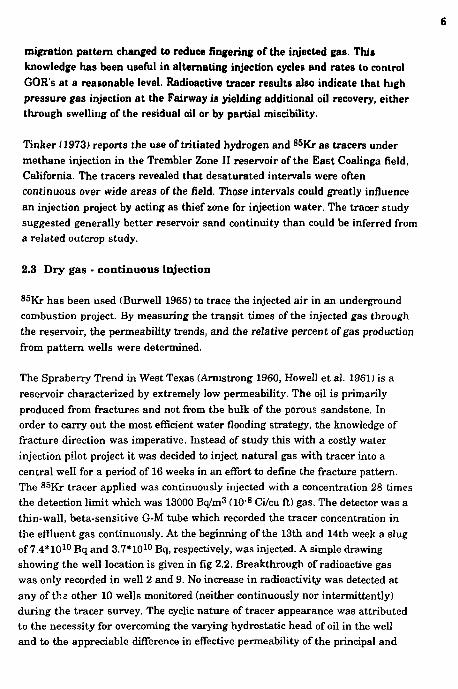
The Spraberry Trend in West Texas (Armstrong 1960, Howell et al. 1961) is a reservoir characterized by extremely low permeability. The oil is primarily produced from fractures and not from the bulk of the porous sandstone. In order to carry out the most efficient water flooding strategy, the knowledge of fracture direction was imperative. Instead of study this with a costly water injection pilot project it was decided to inject natural gas with tracer into a central well for a period of 16 weeks in an effort to define the fracture pattern. The 8 5 K r tracer applied was continuously injected with a concentration 28 times the detection limit which was 13000 Bq/m 3 (10 - 8 Ci/cu ft) gas. The detector was a thin-wall, beta-sensitive G-M tube which recorded the tracer concentration in the effluent gas continuously. At the beginning of the 13th and 14th week a slug of 7.4*10 1 0 Bq and 3.7*10 1 0 Bq, respectively, was injected. A simple drawing showing the well location is given in fig 2.2. Breakthrough of radioactive gas was only recorded in well 2 and 9. No increase in radioactivity was detected at any of the other 10 wells monitored (neither continuously nor intermittently) during the tracer survey. The cyclic nature of tracer appearance was attributed to the necessity for overcoming the varying hydrostatic head of oil in the well and to the appreciable difference in effective permeability of the principal and

7
crossfracture systems Apparently neither well 2 nor well 9 intersected the same fracture plane as the injection well The tracer survey confirmed predictions about the general line of fracture orientation in the lower formation of Spraberry Trend
I I
Figure 2.2 Tracer injection and breakthrough wells in the Spraberry Trend.
2.4 Water-alternating-gas (WAG) inject ion
In the South Swan Hills Unit, Alberta, Canada tracers were applied to follow enriched gas in a water/solvent cyclic injection program. This is a limestone reservoir. The tracers applied were tritiated hydrogen gas, tritiated ethane and 85Kr (Davis et al (1976), Wagner (1974), Griffith et al. (198D). To gain information early in the life of the project about the interwell reservoir characteristics, relath fluid velocities and "•olumetric sweep efficiency, it was desirable to trace the interwell movement of both the injected solvent and the water. Tracers were added in as much as 14 solvent and 14 water injectors. In some cases the tracer response has identified unexpected flow directions. The results have given a qualitative indication of sweep pattern. As a consequence of the results the injection program was redesigned in order to achieve better sweep efficiency.
In the Prudhoe Bay Field 8 5 K r , tritiated methane, ethane and propane have hucn used (Rupp 1984) as tracers for an enriched. WAG, miscible flooding. Nu tracer production had occurred when the paper was written.

8
2.5 High pressure miaelble injection
In the Joy/Little Escambia Creek (LBC) Field five radioactive and one chemical tracer were used to tag injected N2 (Langston et al. 1985). The radioactive tracers used were 8 8Kr. tritiated hydrogen, methane, ethane and propane. Sulphur hexafluoride was the only chemical tracer. Nitrogen was injected at approximately 7600 psig for a period of 2 weeks before the wull was switched over to water injection. When the paper was written, tracers had been produced in three wells (Fig. 2.3). The tracers produced were 8 eKr and tritiated propane. The main purpose of the tracer injection was to determine the source of N2 breakthrough. This knowledge will enable the adjustment of injection rates and volumes to improve areal convergence on the production wells.
/
JAT/LCC tICCNO
' • j i c r i o * wen. • »aQDvcfiOM w e n 0 * l « *oon«o 10c I T 10»
0 • , • • t * i l M a o u o wctA FOSIIIVC l*ACt*
S W ' u * NCi*n.uQ*<oc TftfN*TCD KTD«0CCN TAimTCO MCTMAHI I « I I ( * t « 0 CTHAKC TMIUATfa r«Q»«H[
'tOw
Figure 2.3 The Jay f LEC field where injection wells, breakthrough wells and communication lines are shown.
Also in the Fordoche Field (Mayne C.J. 1986) 85Kr, HT, CH3T and C 2H 5T have been applied in a high pressure (> 7000 psig) miscible injection program. The jas injected was dry natural gas with a N2 content of approximately 59c. The tracer production data will be used in a gas sweep model to predict gas movement and to localize u.iswept areas.

9
PP Craig (1986) reports the use of halogen compounds to trace injected CO2 The compounds applied were freon-11, freon-12, freon-113 and sulphur hexafluoride. The haiocarbon content in the produced fluids was measured in concentrations down to 0.5 ppb in the laboratory. The analyses were carried out by separation trough a GC column and registration by an electron capture detector. The Tour tracers were injected in nine injection wells and registration of the tracers were carried out from 23 production wells.
2.6 Estimation of oil saturation by partitioning tracers
J.S. Tang and B. Harker (1990) presented a paper where chemical tracers were used in interwell tracing to study residual oil saturation. The tracers applied were SF6 and the two freons F13B1 (bromo-triflouro-methane) and F12 (dichloro-diQuoro-methane). The area investigated had first been tested with tritiated hydrogen gas and tritiated methane to verify the communication between the injection well and the producer. The tritium gas was never produced probably due to oxidation of the tritium gas to tritiated water near the injector wellbore. From this test two wells 150 m apart was selected for the saturation measurements. This test was specially designed for measurement of residual oil saturation.
2.7 Summary
Several reports are describing the application of gas tracers to measure sweep efficiency, relative fluid velocities and breakthrough times. Few of these reports are dealing with the problem of partitioning of the tracer into the oil phase. In cases where miscible displacement is achieved only one phase is flooding and partitioning have no meaning, but when both gas and oil phase is presented simultaneously a delay of the gas tracers will occur. Estimated flow rates and breakthrough times for injection gas may therefore be wrong.
The tracers reported applied are listed in tables 2.1 and 2.2. Only two radioactive nuclides are used for labelling: tritium and 8 5 Kr. Krypton is an inert gas. The 8 5 Kr isotope has a half-life of 10.76 years and emits a beta particle with energy (P-max) 0.68 MeV. 8 5 Kr also emits some gamma radiation. Logging tools will pick up the gamma radiation where 8 5 Kr is presented in large quantities. Being inert, krypton has low adsorption to reservoir rock and does not enter into the animal biological processes. This material has a density about five times that of methane and is recommended to be injected in a carrier gas such as argon

10
(Wagner 1977). The tritium isotope is a pure beta emitter with very low energy Tritium has a half-life of 1232 years. The isotope is used to label all the lighter hydrocarbons from CI to C4 to make gas tracers. In addition tritiated hydrogen is used The beta emission from tritium is not detectable by a gamma ray logging tool, therefore, its presence will not interfere with well logging operations.
Table 2.1 Applied radioactive gas tracers.
Tracer Application CH 3T The tracer is the most applied gas tracer for reservoir studies. C2H 5T The tracer have been applied in some miscible displacement
projects C3H7T The tracer has been applied in some miscible displacement
projects C4H9T The tracer has been applied in some miscible displacement
projects «SIG Together with CH3T this is the most applied tracer. HT Some few papers are reporting application of this tracer. HT (H2) is
reactive and in most cases the tracer is lost in the reserven r.
Table 2.2 Applied chemical jas tracers.
Tracer Chemical formula
Limit of detection
Application
SF6 SF6 0.2 ppb* Wide spread application in atmospheric studies. A few applications in reservoir studies
Freon-11 CCI3F Applied successfully as tracer for CO2 Freon-12 CCI2F2 6ppb* Applied successfully as tracer for
saturation studies and as tracer for CO2 Freon-113 C2CI3F3 Applied as tracer for CO2 Freon-13Bl CBrF 3 2 ppb* Applied successfully as tracer for
saturation studies
* (Tang et al.)

u 3 Tracer retention in interwell flow
3.1 Introduction
When the tracers are flowing through the reservoir several reactions may occur which influence the tracer response curves in the recipient wells. The gas tracer may be retained with respect to the average linear gas velocity by partitioning between the fluids in the reservoir. The tracer may also be retained by adsorption to the grain surface. Loss of tracer may occur by chemical reactions, bacteriological degradation or by thermal decomposition. Radioactive tracers may also be lost by isotopic exchange reactions. This chapter will focus on the above mentioned retention or loss mechanisms for the gas tracers in interwell tracer studies.
3.2 Part i t ion coefficients
3.2.1 Part i t ion coefficient • definitions and fundamental relations
The gas tracers in the reservoir will partition between the oil, water and gas. When the composition, the temperature and the pressure are given, each component will have a given partition coefficient at equilibrium. The coefficient may be defined in different ways. In this thesis two definitions will be applied.
def Kc=-5s_ (3.1)
d e f « P - S (3.2)
When the molar composition and the densities of the two phases are known the relation between the two values can be expressed by:
S L X J'j M w j
8 G S *j Mwj K P' (3.3)
At low pressure the partitioning between the phases will obey Henry's law and the Henry's law constant (Hc) is then:

12
e "i (3.4)
In the case where also Raoults law is valid (ideal solution) the partial pressure of the component in the gas phase is given as:
Pi = XJPVA (3.5)
In addition:
* P (3.6)
Combining these two equations gives simply:
yi _ PVA _ y *i ~ P ^ (3.7)
The K p value is therefore, in the ideal situation, given by the vapour pressure of the pure component divided on the total pressure. This relation will not be valid for complex mixtures at high pressure and temperature as in the reservoir.
The parameter fugacity (f) was introduced to substitute vapour pressure in equilibrium calculations. The fugacity of a component is a thermodynamic quantity defined in terms of the change in free energy in passing from one state to another state. From a fundamental thermodynamical point of view the system is in equilibrium when Gibbs free energy is at a minimum for a given pressure and temperature.
(dG)pr= 0 (3.8)
For an arbitrary change between equilibrium states in a closed system we may write:
dG = VdP - SdT (3.9)
From this relation we may write:
(SGI =V (3.10)

13
If the substance behaves like ideal gas and one mole of the substance is considered we may substitute V in expression 3.10 with:
P (3.11)
This gives:
dG = RTdlnP (3.12)
For a real substance we will still like to use such a simple relation and Lewis introduced the fugacity in such a way that a similar relation is valid.
dG = RT dlnf (3.13)
In the single component two phase system the equilibrium is achieved when the fugacity in the two phases is equal.
fL = fG (3.14)
Lewis and Randall (1923) have shown that the fugacity of a component in a mixture is equal to the fugacity of that component in the pure state multiplied by the mole fraction of the component in the mixture. Thus:
(fGi)mix = yi (foi)pure (3.15)
(fLi)mix = XJ (fLi)pure (3.16)
The criterion for equilibrium is that the fugacity of each phase is equal. The two above equations therefore give:
y i = i k - K • x i f G i " P ' (3.17)
3.2.2 K p from equat ion of s t a t e (EOS) ca l cu l a t i ons
The simplest form of the equation of state for an ideal gas is
PV = nRT (3.18)

14
For multicomponent systems this equation has to be extended and the literature gives plenty of proposals to improve this equation. The first improvement was to expand into a cubic equation of state as the van der Waals equation. The improvements of the equation have moved along different directions depending on the problems to be solved. In oil industry and science several models are today applied. The most used are the Soava Redlich Kwong and the Peng-Robinsen EOS. The original Redlich Kwong equation and the modifications by Wilson and by Soava have a common shortcoming i.e they give bad prediction for liquid densities and an unrealistic universal critical compressibility factor. Peng Robinson modified the original Redlich Kwong equation to alleviate these shortcomings. The EOS has in the present work been used to estimate the liquid and gas densities and the Peng Robinson equation has therefore been chosen. The equation may be written:
P = ^ T _ V - b V(V + b) + b(V - b) (3.19)
,R T c b = 0.077796-!
a = 0.457235^-31 a
(3.20)
(3.21)
a°-5 = 1 + (0.37646 + 1.54226 co - 0.26992 a?*. 1 - Tr0-5) (3.22)
The above equations are given for a single component system. In a multicomponent system certain mixing rules have to be applied to give the right set of a and b in the equations. In the Peng-Robinson equation these rules are:
b = £ xjbj i (3.23)
«= £2>i*j(»i»jF0- k«) i j (3.24)
The value of binary interaction parameters ky are usually obtained from experimental vapour/liquid equilibrium data on binary mixtures. In this work the binary interaction parameters used are given in table 3.1.

15
Table 3.1 Binary interaction parameters applied for EOS calculations
Bin. dec Bin. met. Bin. eth. Bin. N 2
CH 3T 0.0350 . 0 0.1200 "C2H6 0.100 0 . 0.1200
To enable calculation of the P, T and V relation for a given mixture of components an iterative process called the successive substitution is carried out.
K p i m + 1 = ($Li/0Vi>m = K pim(fLi/fvi)m = K p i
m R i m (3.25)
<(> is the fugacity coefficient given by equation 3.27, m is here the iteration number. The iteration process continues until the error function E is within a small predetermined number (e ):
E = X ( R i - l ) 2 < H (3.26)
The fugacity coefficient may be calculated from the EOS.
In 41 = RT
nim .EI Jv[l5nit,Vt,n J V t
dVt-lnZn (3.27)
3.2.3 Es t imat ion of part i t ion coefficient
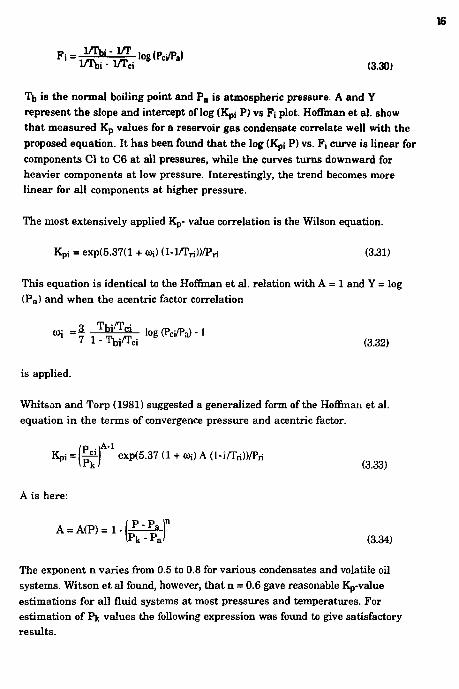
Several expressions have been used to estimating K p-values. Hoffman, Crump and Hocott (1953) proposed a method for correlating K p-value which has received widespread applications. Their equations are:
log (Kpi P) = AFi + Y (3.28)
Kpi 10 ,AFi + Y (3.29)
where
16
p'" iff* "iff loe'p^»» l/Tbi - 1/Tci (3.30)
Tb is the normal boiling point and P a is atmospheric pressure. A and Y represent the slope and intercept of log (Kpi P) vs Pi plot. Hoffman et al. show that measured K p values for a reservoir gas condensate correlate well with the proposed equation. It has been found that the log (Kpj P) vs. Fj curve is hnear for components CI to C6 at all pressures, while the curves turns downward for heavier components at low pressure. Interestingly, the trend becomes more linear for all components at higher pressure.
The most extensively applied Kp- value correlation is the Wilson equation.
Kpi = exp(5.37(l + a*) (l-l/IYjW/Pn (3.31)
This equation is identical to the Hoffman et al. relation with A = 1 and Y = log (P a) and when the acentric factor correlation
«H = f i y ^ log(Pci/Pa)-l 7 1-Ttø/Tci (3.32)
is applied.
Whitson and Torp (1981) suggested a generalized form of the Hoffman et al. equation in the terms of convergence pressure and acentric factor.
Kpi =(1^) exp(5.37 (1 + coO A (l-i/Tri))/Pri (3.33)
A is here:
A = A ( p ) = i - ( p ^ t r (3.34)
The exponent n varies from 0.5 to 0.8 for various condensates and volatile oil systems. Witson et al found, however, that n = 0.6 gave reasonable Kp-value estimations for all fluid systems at most pressures and temperatures. For estimation of Pk values the following expression was found to give satisfactory results.

17
Pk (psia) m 60 MC7+ - 4200 (3.35)
Standing (1979) suggested that the Hoffman et al. method can be used to generate a low-pressure equation accurate for surface separator calculation (separation pressure < 70 bar (1000 psia) and separation temperature < 93°C (200°F)). Standing fitted A and Y as functions of pressure using Kp-value data from an Oklahoma City crude oil. Also, he presented special relations for r e
values of the C7+. The standing equations are:
log (Kpj • P) = A Fj + Y (3.36)
where
Fi = Bi(l/Tbi-1/T) (3.37)
B . _ log (Pci/Pa) 1 1/Tbj - 1/Tci (3.38)
A = 1.2 + 4.5 • IO"4 P +15 • IO"8 P 2 (3.39) Y = 0.890 -1.7 • lO-^P-3.5-10-8 P2 ^3.40)
B 7 + = 1013 + 324 n - 4.256 n 2 (3.41)
Tb7+ = 301 + 59.85 n - 0.971 n 2 (3.42)
n = 7.3 +0.0075 T+0.0016 P (3.43)
with P in psia, T in CR (except in eqn. 3.43 where it is °F). Modified values of B;
and Tbi are suggested by Standing for nonhydrocarbons (CO2, N2 and H2S),
methane and ethane. Glasø and Whitson (1982) show that these equations are
accurate for separator flash calculations of crude oils with GOR ranging from
300 to 1500 scf/STB and API gravity ranging from 26° to 48°API. The Kp-values
of tritiated and 1 4 C labelled hydrocarbon tracers may therefore be satisfactorily
estimated by the above expression in separator systems.
Parti t ion coefficients of lighter hydrocarbons may be found in NGAA charts
(Fig 3.1) These curves are based on crossplotting and extrapolation of empirical
data . The curves are plotted for a certain convergence pressure.

18
Figure 3.1 NGAA charts showing the Kp values of methane and ethane.

19
In models applied to estimate partition coefficients the two parameters "acentric factor" and "convergence pressure" are applied. These two parameters are explained below.
• Acentric factor:
If the vapour pressure (saturation pressure) is interpreted as an expression for the energy needed for molecules to escape from the liquid to the vapour, it would be reasonable to expect the vapour pressure to follow the usual exponential energy-temperature relation.
ps _ e-kT
or
InPs~- l / r (3.44)
or in reduced variables
In P rs - - l / r r (3.45)
By plotting log P against 1/T, it was observed that at a reduced temperature of 0.7 the so-called simple fluids (Ar, Xe, Kr) went trough the value -1 (Fig. 3.2). For the so-called quantum gases H2 and He the vapour pressure was above -1 and for all other compounds it was below. The acentric factor (co) is the deviation from the -1 value.
co = - (log P? - l)r r = 0.7 (3.46)
(See also equation 3.32).

20
log Pr 0
v pimple fluid
actual fluid Tr= 0.7 1/T r
Figure 3.2 The acentric factor is the deviation from -J at a Tr ofO. 7 for the log(Pr
s) curve.
• Convergence pressure
The K p at equilibrium for all constituents will converge to the value of 1 when the pressure increases. This point is termed the convergence pressure. The system may have a dew point or a bubble point at a pressure less than the convergence pressure and therefore exists as a single phase a t the convergence pressure. As equilibrium ratio is undefined in the single-phase region, it is the extrapolation of the actual value which approximately converges at 1.
3.2.4 Part i t ion coefficient from experiments
There are basically two different experimental methods to measure partition coefficients.
Static experiments where two phases are mixed together and samples from each phase are taken. Each phase is analyzed individually to get the concentration (or mole fraction) of each component. Partition coefficients based on mole fractions require the knowledge of the composition of each phase.
Dynamic flooding experiment in a chromatographic column, where the retention of each component is a function of saturation and partition coefficient.

21
One mixing cell apparatus is described by Orr et al. (1990). To achieve accurate measurements the phases have to be mixed long enough to obtain equilibrium, and a sampling system must be designed to enable collection of representative samples of each phase. In addition an analytical procedure to measure the concentration of each phase is imperative.
Measurement of partition coefficients from gas chromatographic studies is a well established technique. In usual gas-liquid-chromatography the liquid phase applied is essentially nonvolatile (vapour pressure < 0.1 torr) at the temperature it is to be used, and the pressure is low (typical < 5 bar). The carrier is an inert gas with minimal dissolution into the stationary liquid phase. The partition coefficient is given by the expression:
Kc-- V R - V Q V L (3.47)
VR is equal to the flow rate multiplied by the retention time ( Rt). The Rt is measured from the peak of the response curve. The shape of the response curve will be influenced by several parameters. In chromatographic literature two parameters are applied to evaluate the column: -the plate number (n p ) and the height equivalent to a theoretical plate (H). The relation between H and n is simply: n p = IVH (Pecsok 1968).
H 16 Iff (3.48)
W is the peak width (Fig. 3.3).
Tangent to Point of Inflection
Figure 3.3 Schematic chromatogram showing the peak width and retention time definitions.

22
From t\ fundamental understanding of the parameter* involved in the process, van Deemter has expressed the H as:
H - A + B/u + Cu (3.49)
The term A is a function of the size and uniformity of the particles of the packing material in the column. The value of A is close to zero in chromatographic columns and therefore negligible, but in the reservoir this dispersion term will give the main contribution to the discrepancy from optimal conditions. The B/u term represents the diffusion in longitudinal direction. With increased velocity the effect of this term will vanish. The last term, Cu, takes care of the effect caused by non-equilibrium conditions. With increased velocity, equili-brium will not be established and the tracer peak will be smeared out. In the reservoir the flow will be low, in the order of one foot per day. In slim-tube experiments in the laboratory such low velocities will be very time consuming and the velocity applied is therefore an order of magnitude higher.
To allow calculation of real Kc-values the following assumptions have to be valid:
The equilibrium is achieved at all plates in the tube.
The sample volume upon introduction into the column occupies only a negligible portion of the tube volume.
The pressure remains constant along the column length, that is pressure drop is negligible ( high permeability).
The partition coefficient is constant throughout the range of concentrations encountered.
Stalkup et al. (1963) reported several independent measurements of Kc-values of aliphatic hydrocarbon systems at low pressure applying dynamic gas-liquid partitioning chromatography (GLPC). These experiments were carried out with inert gases as nitrogen, hydrogen or helium as carrier. Stalkup et al. however developed a method to measure Kp-values at pressures up to 138 bar ( 2000 psi) and temperatures up to 71 °C (160°F).
For a measurement of K p values Stalkup et al. gave the following calculation:
23
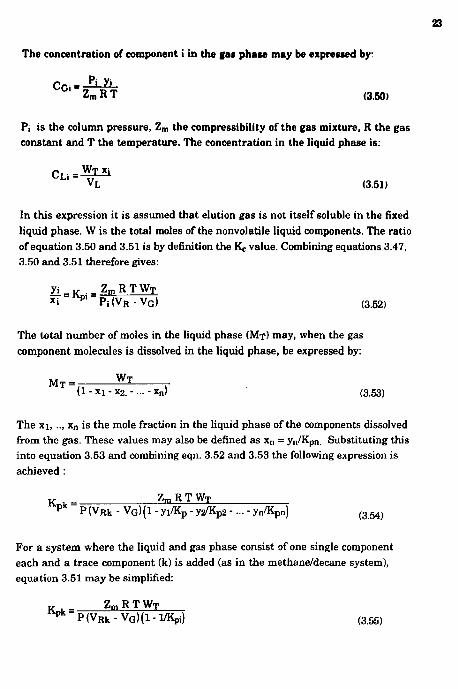
The concentration of component i in the gas phase may be expressed by:
C G - - ^ L Z m R T (3.60)
Pi is the column pressure, Z m the compressibility of the gas mixture, R the gas constant and T the temperature. The concentration in the liquid phase is:
VL (3.51)
In this expression it is assumed that elution gas is not itself soluble in the fixed liquid phase. W is the total moles of the nonvolatile liquid components. The ratio of equation 3.50 and 3.51 is by definition the Kc value. Combining equations 3.47, 3.50 and 3.51 therefore gives:
y i = K . = Z m R T W T x i ^ " P i ( V R - V G ) (3.52)
The total number of moles in the liquid phase (MT) may, when the gas component molecules is dissolved in the liquid phase, be expressed by:
M T Wl . (1 - xi - x 2. -... - xn) (3.53)
The xi, .., x n is the mole fraction in the liquid phase of the components dissolved from the gas. These values may also be defined as x n = yn/Kpn. Substituting this into equation 3.53 and combining eqn. 3.52 and 3.53 the following expression is achieved :
K n k = Z m R T W T p k P ( V R k - VG) (1 - yi/Kp - y 2/Kp2 -... - y„/K p nj (3.54)
For a system where the liquid and gas phase consist of one single component each and a trace component (k) is added (as in the methane/decane system), equation 3.51 may be simplified:
** k "P(VR k -V G ) ( l - l /Kpi ) (3.55)

a
This equation may be used to calculate the Kp of the compounds in a multi-tracer experiments where the carrier is a pure gas with a known partitioning into the liquid phase. The two parameters VQ and WT have to be estimated from separate measurements.
3.3 Adsorption to grain surface
The flow of the tracer through the reservoir may be influenced by adsorption to the grain surface. To come into contact with the grain surface the gas tracer may need to diffuse through a film of oil, water or both. The adsorption will then depend on the partitioning of the tracer into the two liquid phases in the reservoir. Different models are applied to describe the adsorption on the grains. The most simple form is the linear relation where the adsorbed amount (a(c)) is proportional with the concentration in the contacting phase (c). The proportionality constant is J
a(c) = J c (3.56)
A tracer in a dynamic system will in this situation be retained independent of concentration. In many cases, however, the active adsorption states on the surface will be saturated and the amount adsorbed will not increase linearly by the concentration. In these cases the adsorption can be expressed by the Langmuir isotherm:
a(c) = U C 1 + V c (3.57)
U and V are two parameters which determine the shape of the curve for the actual system at a specific temperature. At low concentration, which is the case when tracers are considered, this equation will be a straight line with the slope U.
Some systems are not behaving like the Langmuir isotherm and for the Freundlich isotherm the relation between the concentration and the adsorbed amount is given by:
a(c) = A * c l Æ B>1 (3.58)
The Freundlich isotherm is as the Langmuir isotherm a convex function. A

25
and B are parameters which determine the shape of the isotherm. Concave isotherms may also occur if additional reactions take place on adsorption which enhance the overall adsorption process. Such cases are however umommon Different adsorption isotherms will influence the shape of the produced peak.
Concentration in Mobil* Phose. CM
Figure 3.4 The figures shows different absorption isotherms and their influence on the response curves in dynamic experiments.
3.4 Isotopic exchange
Statistically it is always a possibility that equal atoms within a molecule or in
neighbouring molecules change places. The activation energy for the process is
usually so high that it is very unlikely that such reactions will occur.
Bjørnstad (1990) refers results from experiments where tritiated hydrogen (HT)
is exposed to both oil and water. No significant reaction was measured between
the oil and HT. For the water/HT system, however, an isotcpic exchange of 10-
20% took place.
HT + H 2 0 = H 2 + HTO
The ordinary isotopic exchange reactions are the reversible process by which
two isotopes of the same element exchange place as shown in the equation
(Evans 1965):

26
AX + BX A - AX A + BX
The A indicates another isotope of the element X. Whan the tritium and U C labelled tracers are introduced in the reservoir some of the radioactive atoms may exchange with stable isotopes in the petroleum fraction. The tritiated methane may react with the reservoir fluids in such a way that tritiated water or tritiated liquid hydrocarbons are formed:
H20 + CH3T = HTO + CH4
C x H y + CH3T = CxHy.iT + CH4
No ordinary chemical mechanisms are available to explain these reactions. Thermodynamically it is, however, favourable to distribute the labelled elements between the various molecules to increase the entropy. Boltzman distribution law (Nash 1974) shows, however, that the probability to find the H-atom in an energy level equal to the dissociation energy (100 kcal/mole) is negligible and an exchange between neighbouring molecules is therefore unlikely.
Radioactive radiation may, however, induce reactions where new molecules are generated. The beta particle emitted from tritium and 1 4 C will create a track of exited molecules, free radicals and ions in the exposed material. These primary radiolytical products may undergo chains of chemical reactions before the excess energy is absorbed as vibrational energy or emitted as low energetic electromagnetic radiation. The yield of the final products depends on the nature of the radiation and its energy, as well as on the nature of the target substance.
Exchange of a radioactive isotope between the gas phase and the two liquid compounds, water and decane have been studied by Dugstad et al (1992) (Fig 3.5). The labelled gas molecules will partition between the gas phase and the liquid phase. Beta particle traces will therefore be created in both phases. The final radiolytical products may be a series of different molecules. Some of which will be components in the liquid phase. When labelled gas molecules take part in these reactions, some of the radioactive isotopes may be transferred from the gas phase to the liquid phase.
The kinetics of such reactions will depend upon the properties of the radioactive element and the dissolution of the gas molecules in the liquid phase. The 1 4 C has a 9 times higher beta energy than the tritium; 0.155 MeV and 0.018 MeV

27
respectively. The beta radiation from U C will therefore create more reactive molecules than the radiation from tritium. Because of the lone half life of the , 4 C (5736 years) with respect to the tritium (12.43 years), several hundred times more 1 4 C atoms are needed to create the same number of disintegrations per time unit as the tritium. Considering these two effects it is expected that 1 4 C will give a higher isotopic exchange yield than tritium.
The results given in fig 3.5 show that increased exposure time gives increased isotopic exchange yield. The results are, however, too scarce to give a general description of the yield/time curve. In some of the experiments it seems as the curve has reached an upper plateau after six month, but for other experiments the yield is still increasing at the end of the experimental period.
The results show an overall trend that increased temperature gives increased exchange between phases. Most clearly is this shown in the water system. After six month as much as 3.2 % of the tritium in the ethane has been transferred to the water phase when the temperature is 150°C, while a t 90°C only 0.06 % is exchanged. One important factor in the explanation of this effect may be the difference in vapour pressure between the two temperatures. At higher pressure there is a greater potential for exchange reactions in the gas phase, because of a higher concentration of the liquid phase molecules.
High dissolution of the radioactive gas molecules in the liquid phase will increase the probability for the exited moltv . ' ; n the beta track to react with labelled molecules. The results general)} gher exchange yield for ethane than methane.
From a comparison of the results of the exchange yield of the tri t ium and 1 4 C labelled gases, no geneal conclusion can be drawn. Higher percentage yield is measured for the 1 4 C labelled methane compared with the tritium, but for ethane this is just the opposite. In the interpretation it must be noticed that the initial concentration of the 1 4 C labelled compounds is much lower than the tr i t iated compounds.

28
A)
0.5
0.45
0.4
£ 0.35 -a 0.3 >\ & 0.25 -c 5 0.2
0.15
0.1
0.05
0
ul
Months
B) CH3T / water C2H5T / decane
Months + CHjT/decane x '"CrWdecane
« CH3-CH2T/water v '"CHJ-CHJ/ decane
Figure 3.5 Isotopic exchange of the six systems studied . The exchange is given as a function of the time the to phases have been mixed together,
a) 90°C, b) 150°C

29
Applying the results as a guide for the exchange potential during a gas injection into an oil reservoir one should have in mind that the initial concentration of the tracer is much higher than in the present experiments. In most of the time, however, the gas will be diluted and the concentration will be considerably lower than the experimental conditions in the work referred.
3.4 Thermal and chemical degradation
The molecules applied as tracers have to be stable and not undergo chemical reactions with the molecules in the reservoir. The tracers which are labelled aliphatic hydrocarbon gases are already represented in the reservoir. It is therefore not likely that these components will undergo considerable chemical reactions.
The tritiated hydrogen is a reactive gas and loss of this tracer is reported by Tang and Harker (1990). They assumed that the loss was caused by the oxidation near the wellbore. If the injection is not oxygen free, oxidation of other hydrocarbon tracers may also occur at the conditions in the reservoir. It is however also a possibility that the loss of TH was caused by isotopic exchange.
The noble gases as 8 5 Kr are known for its stability and it is unlikely that this molecules undergo reactions in the reservoir.
The PFCs studied are selected partly because of their stability and the compounds are not degraded in the reservoir.

30
4 T h e tracers app l i ed
4.1 The radioactive tracers
In these thesis work three radioactive tracers have been applied in dynamic flow experiments. The compounds are the tritiated methane and the 1 4 C labelled ethane and 8 5 K r . The physical parameters of the compounds and the corresponding radioactive nuclide is given in table 4.1
Table 4.1 The table gives the radioactive tracers applied in this study
Tracer Radioactive isotope
P-max (MeV)
tl/2 (year)
Pc (bar)
T c
(°K) Acentric
factor CH 3 T T 0.018 12.43 45.4 90.6 0.08
"C2H3-CH3 14C 0.155 5736 48.2 305.4 0.94 85Kr 85Kr 0.67 10.76 54.9 209.4 0.00
4.2 T h e p e r f l u o r o c a r b o n s
Several of the freons (see table 2.1) which have been used as tracers in reservoir studies have previously been applied as tracers in ventilation and atmospheric studies. Together with the halocarbons another group of compounds, the perfluorocarbons, have been applied successfully in environmental studies. The principal use of the PFCs has been as coolants for electronic equipment; because of their chemical inertness and high dielectric strength, they are extremely useful for cooling by convection or boiling. The chemical inertness of the PFCs assists in their separation from other interfering compounds during chromatographic analysis. By catalytic combustion other compounds as freons or hydrocarbons will be destroyed while the PFCs are more stable and will remain unchanged if temperature is not too high. The stability of the PFCs prevents their loss in the reservoir by degradation through chemical reactions. The stability of the compounds makes them also biologically inactive; thus they are perfectly safe to use (Dietz 1983).
In t reatment of highly diluted samples, loss of PFCs by adsorption to surfaces have to be considered. The PFCs can be adsorbed onto the surface of carbon steel and they are soluble in fluoroelastiomeres ( e.g Viton), silicon rubber, and fluoropolymers (e.g. Teflon) so these material should be avoided. Polyolefins,

31
polyurethane and nylon urs, however, quite compatible, as are stainless steel and specially treated aluminum.
Like almost all hydrocarbons, PFCs readily adsorb onto charcoal-like materials. Unlike most hydrocarbons, however, the PFCs are thermally stable to quite high temperatures in the absence of any reducing catalysts, thus permitting thermal recovery for subsequent analysis.
Besides their inertness the PFCs are potential tracers because of their high affinity for reaction with electrons. This makes them some of the most sensitive compounds for detection on the ECD. The most sensitive PFCs have lower limit of detection in air samples of 0.2 10"151/1 (Dietz 1987).
The selection of potential PFCs as gas tracers in reservoir injection has to be restricted to cyclic compounds (higher detectability) with a boiling point making sure that the compounds will be mainly in the gas phase in the reservoir. This does not imply that the compounds have to be a gas at standard conditions. The high dilution of the tracer ensure that the partial pressure of the compound will not exceed the vapor pressure. Besides the two PFCs studied, PMCP and PMCH, several others have properties which make them possible tracer candidates. Among these are the PDCB (perfluorodimethylecyclobutane), PDCH (perfluoro-dimethylcyclohexane) and the PTCH (perfluorotrimethylcyclohexane). Table 4.2 gives some properties of the compounds.
Table 4.2 The table gives some of the physical parameters of the perfluorocarbons studied.
Mol weight Tb C O
Pc (atm)
Tc CK)
Acentric factor
PMCP 300 4S 22.5 451 0.43 PMCH 350 76.3 21.5 483 0.49 PDCB 300 45 - . . PDCH 400 102 - . . PTCH 450 125 - - -

32
O CARBON
• FLUORINE
PMCP PMCH
PDCH PTCH PDCB
Figure 4.1 The perfluorocarbons which are the most likely tracer candidates.

33
5 Gas tracer detection
5.1 Radioactive tracers
Different analytical techniques are available for the radioactive gas analyses. The most efficient method depends upon the kind and energy of the radioactivity. From table 2.1 it is evident that only a few radioactive nuclides have been applied in field experiments. These are tri t ium and 8 5 K r . The tritium isotope has been applied in several different molecules. A third radionuclide 1 4 C may also be of special interest because it can be used for labelling of the hydrocarbons and COz-
The analytical techniques available are liquid scintillation, solid scintillation (Nal), proportional counters, ion chambers and geiger chambers. For the very low energy beta emission from tritium the radioactive gas has to be in direct contact with the detector without any shielding from the walls of a vial or tubing.
Because of the low concentration of the tracer in the production gas it is in most cases imperative to upconcentrate the tracer. Garder et al. (1988) directed the gas stream through a combustion chamber and the produced water was analyzed by liquid scintillation counting technique. By the combustion of one liter of methane gas 1.6 ml of water is produced. In a liquid scintillation analyses a typical amount of sample is 10 ml. This represents 6.2 1 of methane gas at s tandard condition. In good equipment the background will be less than 1 cpm. To get counting rates significant above this rate 0.05 Bq are needed in the sample. The combustion technique will not separate different hydrocarbons labelled with tritium. If several compounds are labelled with the same radionuclide these compounds have to be separated prior to the oxidation process. Different lighter hydrocarbons may be separated by cryogenic distillation.
The 8 5 K r may also be measured by liquid scintillation after separation through several steps of adsorption/desorption on charcoal and cryogenic distillation. In the scintillation vial the Kr will constitute the gas phase above the liquid scintillator. Before transferring to the liquid scintillation vial the samples have been stored for one month to ensure that naturally ocor r ing radioactive 2 2 2 R n which has not been removed in the separation process has died away.

34
5.2 Chemical tracers
5.2.1 Laboratory experiments
The main group of chemical tracers applied in oil field investigations (table 2.2) are halogenated hydrocarbons and SFg. These compounds are analyzed by separation on a GC column and detected by an electron capture detector. The detector contains a radioactive source (usually 6 3Ni) which emits beta radiation. Compounds are detected by their capability to capture electrons.
Laboratory experiments may be carried out with relatively high concentration of the tracer and it is therefore rather easy to obtain reliable analyses. In the dynamic flow experiments carried out in this thesis work to study the PFCs the analytical parameters applied have been:
Instrument HP 5890A gas chromatograph Detector 6 3 Ni Electron Capture Detector Column 6 feet stainless steel, Carbopak C with 0.1% SP1000 Temperature 110°C Flow rate 50 ml/min Carrier gas N2 (purity < 99.995)
5.2.2 Field analyses
The PMCP and PMCH have recently been applied as gas tracers in reservoir studies (see paper IV). To analyze these compounds in small concentrations it is necessary to remove the hydrocarbon molecules which may appear at nearly the same retention time as the tracers in the chromatogram. It will also be necessary to upconcentrate the tracer. To achieve these goals a method is developed where a certain volume of the produced gas is directed, together with O2, through a tube filled with vanadium pentoxide (V2O5). The tube is kept at a temperature of 400°C. This procedure will oxidize most of the hydrocarbons in the gas without destroying the PFCs.
V2O5 + CxHx > V + H 2 0 + C 0 2
The effluent from the oxidation chamber is directed through an absorption bed consisting of Ambersorb 347 XZ (Ambersorb 464). Before entering the bed the water produced is collected in a cool trap (ice water). The absorption bed is

35
placed in an auto injection loop on the gas chromatograph. After heating to 400°C the released gas is injected into the column. By this technique it is possible to measure concentrations down to 10 - 1 2 1/1. Concentrations higher than 10 - 1 11/1 may be measured directly without any upconcentration (paper IV). This method has been applied in field experiments where the tracer concentration has been as high as 5*10 -8 1/1.
To be able to analyze concentrations down to 10"1 5 1/1 more sophisticated methods are needed. Figure 5.1 gives a picture of an analyses system developed at Brookhaven National Laboratory (BNL) (Draxler et al. 1991). The gas which is thermally desorbed from the absorption trap is processed by flowing through a precut column, several catalysts and a second absorption trap before entering the main column.

SAMPIE TUBE
IS PSI REGULATOR
RAP
Schematic of the laboratory GC plumbing system, showing the sampling valve (SV), precut column backflush vaive (PC), flow direction valve (FD), and Florasil trap valve (FS).
All valves are shown in their off position.
Figure 5.1 To enable analyses of tracer concentrations down to 1015 III a system, containing several catalytic combustion systems and absorption traps are needed. The above picture gives the method applied at the Brookhaven National Laboratory.

37
6 Experiments
6.1 The slim-tube apparatus
The developed slim-tube equipment is described in paper I. The basic idea with this equipment is to measure the chromatographic effect of the various tracers under conditions comparable with those in the reservoir. The system is build for measurement of the retention of both radioactive and chemical tracers.
The slim-tube equipment allows experiments to be carried out at temperatures and pressures realistic for oil reservoirs (up to 350 bar and 120 °C). The filling material in the tube is of the same kind as found in reservoirs. The pore structure is, however, not reproduced. Parameters which depend upon the packing of the porous material, such as dispersion, porosity and permeability, are therefore not directly related to reservoir conditions.
c« , Mobile Phase —*~
A y\ V \ X
Stationary Phase
<«> (6) (c)
Figure 6.1 Concentration profiles through a zone in a chromatographic column: (a) ideal chromatography; (b) band spreading caused by diffusion and dispersion; (c) band spreading caused by slow equilibration between the phases.
The shape and retention of the tracer response curves recorded are influenced by the dispersion, the partitioning of the tracer between the different phases and the degree of equilibrium achieved at each position in the tube (Fig. 6.1). The dispersion will mainly influence the peak width while the partitioning will influence retention. Slow equilibrium between the phases may give asymmetric response curves at high flow rates. With a flow where an approximate equilibrium is achieved at all places in the tube the shape will be gaussian.

3B
If equilibrium is not achieved, either the flow rate must be decreased or the liquid phase saturation must be decreased to achieve a thinner layer of the liquid. In figure 6.2 three experiments are carried out with variations in flow rate, saturation, temperature and pressure. All these experiments show that the response curves are very near gaussian which is interpreted as equilibrium is achieved.
The response curves are used to measure the relative retention of the various tracers and the partition of the tracer between the phases.
6.2 Tracer retention on liquid free slim-tube
In paper II retention measurements are reported where the tube contains only the porous matrix and no liquid phase. The porous matrix in the tube has been Ottawa sand, Ottawa sand + 0.5% kaolinite, Ottawa sand + 2.5% kaob'nite and limestone.
Different absorption isotherms have been proposed in chapter 3.3 to describe the interaction between the tracers and the grain surface. Only distribution coefficients which are constant with respect to concentration will give a gaussian production profile. The distribution coefficient (Dc) may be expressed:
n - a< CG> CG (6.1)
In the dynamic experiments carried out the fraction of the time in which the tracer is flowing in the gas phase (FR) can be expressed:
VR (6.2)
On the other hand at equilibrium the fraction of time in which the tracer is in the gas phase can be expressed as the amount of tracer in the gas phase divided by the total amount of tracer:
F n = Vr, Co a(CG) S A + V G CQ (6.3)

39
a)
b)
c)
19 l i ,
m CI^T
^ * • PMO» 1
* II - J. . 10 - —_
_| • J I f 1 i * ] 1 I fi i f • ' i 1 \ / V
0 - i\ .-L tjt -^
J k
: • :
. 4 m -4J • f \ I j V ^ 0 - , - r f t t i J w.
0 0 T 9
2 1
1
1 9 8
1 o -1 . -
Retention time
Figure 6.2 Tracer response profiles at three different conditions a) 50 °C, 100 bar, So =33%, b) 100°C, 150 bar So=23% c) 120% 250 bar So=24%.
40
The combination of the two equations gives:
V R - V G = ? ! % L S A = D C S A
VG (6.4)
The surface (SA) is a complex parameter to measure. The effective surface area is a function of the molecular size of the gases considered. Small H2 molecules (or N2 molecules usually applied for surface area determinations) will have access to a greater surface area than the PFC molecules.
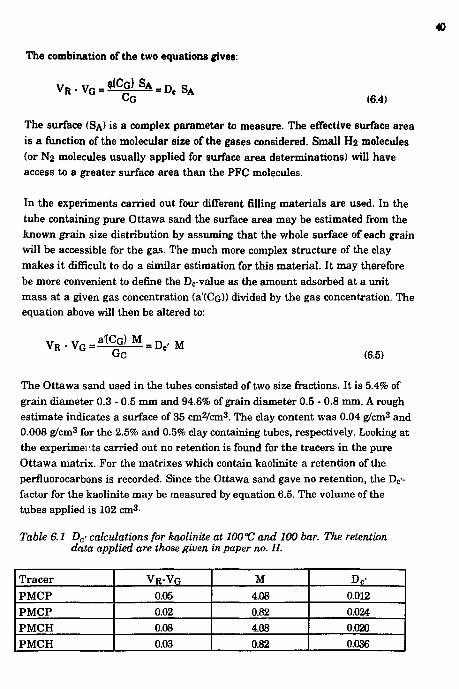
In the experiments carried out four different filling materials are used. In the tube containing pure Ottawa sand the surface area may be estimated from the known grain size distribution by assuming that the whole surface of each grain will be accessible for the gas. The much more complex structure of the clay makes it difficult to do a similar estimation for this material. It may therefore be more convenient to define the Dc-value as the amount adsorbed at a unit mass at a given gas concentration (a'(CQ)) divided by the gas concentration. The equation above will then be altered to:
V R . V G = ^ ) _ M = D C ' M IrC (6.5)
The Ottawa sand used in the tubes consisted of two size fractions. It is 5.4% of grain diameter 0.3 - 0.5 mm and 94.6% of grain diameter 0.5 - 0.8 mm. A rough estimate indicates a surface of 35 cm2/cm3. The clay content was 0.04 g/cm3 and 0.008 g/cm3 for the 2.5% and 0.5% clay containing tubes, respectively. Looking at the experimei \ts carried out no retention is found for the tracers in the pure Ottawa matrix. For the matrixes which contain kaolinite a retention of the perfluorocarbons is recorded. Since the Ottawa sand gave no retention, the Dc'-factor for the kaolinite may be measured by equation 6.5. The volume of the tubes applied is 102 cm3-
Table 6.1 -Dc- calculations for kaolinite at 100°C and 100 bar. The retention data applied are those given in paper no. II.
Tracer V R - V G M D C ' PMCP 0.05 4.08 0.012 PMCP 0.02 0.82 0.024 PMCH 0.08 4.08 0.020 PMCH 0.03 0.82 0.036

41
From the experiments carried out the calculated Dc' values show that a model where the amount absorbed is proportional with the clay content is impossible to apply.
The accessible surface area is in these experiments most likely not proportional with the mass of the clay. The model (6.4) may therefore give a better description of the absorption situation, but the model cannot be tested because the data on the surface area of the clay is not available.
When the pressure is increased to 250 bar only a minor retention of the tracers is recorded.
In the measurements of the interaction between the tracer and the clay only kaolinite is studied (the structural form of the kaolinite is not considered). This type of clay is of special importance in the Ura reservoirs as Snorre, Statfjord, Troll, Gullfaks and Oseberg. For other clay minerals as smectite and illite a higher retention is expected because of the more complex structure. The perfluorocarbons studied are molecules which are large with respect to the openings in the clay structure, which means that only a fraction of the clay surface is accessible for these molecules.
The limestone matrix gave considerable retention of the PMCP and PMCH at a pressure of 100 bar. This retention was in the order of 10 %. At a pressure of 250 bar, however, the retention is minimal.
At 250 bar the methane carrier gas has a density which is approximately 2.5 times higher than at 100 bar. Sites on the grain surfaces which contribute to retention at 100 bar may at 250 bar be occupied by the methane molecules. At 250 bar the diffusion constant is reduced and the time needed to enter dead end pores will therefore increase. Equilibrium may therefore not be achieved at all places and the retention effect is reduced.
6.3 Kc-values between gas and decane from slim-tube experiments
6.3.1 The fluids applied
Decane has been used as a model oil in most of the experiments carried out. A real oil will be a less defined system from which general conclusions may be

42
difficult to draw. In petroleum description terminology the decane will be a heptane* fraction with molecular weight 142.
Hydrocarbon systems containing decane and various lighter components are described in the literature. The system decane-methane which is the one of major interest in this thesis is described by Sage et al. (1949) and Reamer et al.. (1942). Figure (6.3) shows the locus of the phase composition in the two phase system at various temperatures. The Kp value at the actual conditions may be calculated by dividing the mole fraction at second and first crosspoint between the curve and the isobar .The ethane-decane system is described by Reamer (1962). Vairgas et al. (1971) have measured the phase distribution in the methane-ethane-propane-pentane-n-hexane-n-decane system. In the present experimental work only methane and ethane have been used as tracers, bui, as seen in chapter 2 also the other lighter hydrocarbons have been applied in field experiments.
Figure 6.3 The phase composition in the methane I decane system at various temperatures (Reamer et al. 1942).
To enable calculation of K^-values from slim-tube experiments an accurate measurement of the phase saturation is needed. A correct estimation of the saturation implies a correct estimation of the phase densities. Phase densities

43
may be estimated from EOS, but experimental data would be more reliable. Densities for the methane/decane system are estimated from crossplotting of data from Sage et al. (1942). Sage et al. give the specific volumes of mixtures of methane and decane. The data for bubble point have been recalculated to densities and plotted as a function of pressure for the various temperatures (Figure 6.4). From these curves the density of the liquid phase at the actual temperature and pressure conditions has been estimated.
0.52 - — 0.5 -I 1 1 1 1 1 1 1 1 1 1 1
0 40 80 120 160 200 240 Pressure (bar)
• 21.1 C + 37.7C • 71.1 C * 104.4C x 121.1 C
Figure 6.4 Density of decane in a decane I methane system. The density is calculated from data reported by Sage et al..
The density of the gas phase has been estimated by application of compressibility factors for pure methane. The decane component in the gas phase is less than 1% in all the experiments and is regarded as negligible.
In the decane N2 system the densities of the liquid and gas phase is estimated from Peng-Robinson EOS.

44
6.3.2 Results from dynamic experiments in the decane/methane system
The measurement of Kc-values from dynamic experiments are reported in paper II and III. In addition to these results a series is carried out at a temperature of 50°C. These results are given in table 6.4. The results from the 50°C experiments give generally a slightly higher Kc- value than Kc-values at the higher temperatures reported in paper III.
Table 6.2 The table gives the Kc values for ethane, PMCP and PMCH in the decane /methane system at 50°. The data are supplements to the
data given in paper three, table 4.
Bar Ethane PMCP PMCH 100 1.9 3.2 5.5 150 1.4 1.7 2.8 200 1.3 1.4 2.0 250 1.3 1.2 1.6
Table 6.3 gives the results of Kc measurements in six experiments carried out at the same temperature and pressure conditions (250 bar, 100°C), but with different flow rates, saturation and filling material in the tube. The experiments show rather good agreement in the results in spite of these variations. This indicates that the Kc values measured are real physical values which do not change with the experimental parameters. Paper III gives the full explanations of the parameters needed to enable calculation of the Kc value. The paper also gives uncertainty calculations.
Table 6.3 The table gives the ifc values at a pressure of 250 bar and a temperature of 100 °C. The variations between the experiments are the
flowrate, decane saturation and the porous matrix.
Exp. para
meters
Matrix Ottawa Limestone Limestone Limestone Limestone Limestone Exp. para
meters
So% 34.6 68.9 67.5 66.7 65.5 64.7 Exp. para
meters Flow rate (ml/min)
0.26 0.26 0.056 0.056 0.6 0.028
Kc-values
CH 3T 0.38 0.47 0.47 0.49 0.46 0.47 Kc-values 1 4 CH 3 .CH 3 1.27 1.30 1.32 1.33 1.29 1.33
Kc-values
PMCP 1.21 1.13 1.14 1.19 1.16 1.24
Kc-values
PMCH 1.72 1.68 1.71 1.74 1.71 1.79

45
Some comparisons have, in paper III, been done between the results and available models for estimation of partition coefficients. The models applied give the K p value. A full transformation of the K« values to Kp values is done in table 6.4.
The Kp-values have been estimated by models like the Wilson equation and the Whitson equation. The agreement between the measured values and the two models have not been very good. The equations are made for estimations of K p
values for the hydrocarbon system. The PFCs are another group of components. The Wilson equation gives, for the ethane and methane, an approximate value, but fails as a model at higher pressure. The Whitson equation is designed to overcome this shortcoming and also to give a better prediction at pressures of several hundred bar. To model the experimental values the Whitson equation was applied, but the acentric factor was substituted with an experimental factor to match the data achieved. The best fit was achieved when the acentric factor for PMCP and PMCH was substituted with the new values -0.95 and -0.35 respectively (Fig 6.5).
Table 6.4 The table gives the Kp values of the tracers in the decane I methane system. Density data from Sage et al. is applied in the recalculation
of the Kc data.
°c Bar Ethane PMCP PMCH 80 100 1.08 0.70 0.42 80
150 0.96 0.72 0.49 80
200 1.06 0.95 0.67
80
250 0.96 0.95 0.74 100 100 1.08 0.72 0.47 100
150 0.99 0.76 0.48 100
200 0.85 0.76 0.57
100
250 0.80 0.80 0.69 120 100 1.14 0.82 0.54 120
150 1.10 0.87 0.62 120
200 0.92 0.83 0.65
120
250 0.79 0.77 0.66

46
3>
• Exp. val — Whit w*=-0.2S
Whit w = 0.43
a)
*¥
b)
1.9 1.8 1.7 1.6 1.5 1.4 1.3 1.2 1.1
1 0.9 0.8 0.7 0.6 0.5 0.4 0.3 0.2 0.1
0
-
: \
• Exp. val
— Whit w*=-0.80
Whit w = 0.49
:
i i • - | - n
-
— i — i — i — i — i — i — i — i - i i • - | - n 40 80 120
Pressure
160 200 240
Figure 6.5 The curves give the Kp values estimated by the Whitson equation compared with the experimental values. The two curves in each figure are plotted with the acentric factor and the best experimental substitution, a) PMCP b) PMCH.
47
6.3.3 Results from dynamic experiments in the decane/nitrogen system
A series of experiments is carried out to compare the decane/methane system with the decane/nitrogen system. Nitrogen is applied as injection gas to maintain the pressure during the production when recycling of gas is uneconomical. Nitrogen at high pressure may also be used to obtain miscible displacement.
The results are reported in paper III. Only minor variations are found between the two systems with respect to retention of the tracer. Variation in peak shape may be noticed in the figures mainly because the methane/decane experiments are carried out with a 12 m long slim-tube while the nitrogen/decane experiments are carried out with a 6 m long tube. The experiments carried out at a 6 m long tube are less time consuming, but the tube is long enough to minimize error in experiments caused by end effects. In paper III, figs. 4 and 5, two experiments carried out at the same temperature and pressure are presented. Besides a minor deviation in flow rate and saturation, the main differences are the carrier gas and the slim-tube. In the shorter tube (the N2 system) the tracer peaks are considerably more spread out. This is most likely an effect caused by the length of the tube. According to equation 3.48 the peak width in second potence increases proportionally with the column length. Another variation between the systems which influences the peak width is the quality of the column. The 12 m long tube is a commercial column manufactured by DB Robinson & Associated while the 6 m column is selfmade. The selfmade tube is filled by injection of the matrix material under high pressure and with a continuous vibration of the tube.
6.4 R e s u l t s f rom d y n a m i c e x p e r i m e n t s i n t h e m e t h a n e / w a t e r sy s t em
Experiments were carried out to investigate the retention of the four tracers CH3T, 1 4C-labelled C2H6, PMCP and PMCH on a slim-tube containing a residual water saturation. The water used was distilled. The tracers were produced before one pore volume was eluted (Fig 6.6). This indicates that only a par t of the gas in the tube is contributing effectively to the flow. Some gas may be trapped in dead end pores. It is therefore impossible to calculate Kc-values from these experiments. It is, however, possible to draw some conclusions from the study.

48
0.2 0.4 0.6 0. 1 1.2 1.4 Relative time (inj.- ol/PV)
Figure 6.6 Tracer response curves in the water!methane system. 100°C, 100 bar, Sw = 25%.
/
$1 t $ V
o y^ / K / J/ / UJ s / / / < 1 % y / # ' / 1
^ \ S\ /\ 't~rr •5
1 ^ \ S\ /\ A \ \y A y / V
z •.K. -̂ / & p, •s .«<• f < \ .
v •A ^ o -̂ s2
O B «00
0 -C
0 0 ! a 3 -
TEMPERATURE, -f
Figure 6.7 Solubility of methane in water. The data are applied to estimate the partition coefficient of methane (Handbook of Natural Gas
Engineering).

49
In all the experiments the PMCP and PMCH are arriving in front of the methane and ethane. This effect can not be explained by the partitioning of the methane and ethane into the water phase because this effect is minimal. Figure 6.7 gives data applied to estimate the partition coefficient of methane in the water/gas system.
The Kc value of methane is too low to have any significant effect on the retention of the tracer and the tracer is therefore expected to be produced when one mobil pore volume is eluted. What is observed is, however, that the methane is produced after 90% of the volume is eluted while the PFCs are produced when 80% is eluted.
Table 6.5 The table shows relative retention (relative to methane) times measured in the water Imethane system
100°C, 100 bar Matrix Sw Ethane PMCP PMCH Ottawa 23.1 0.98 0.91 0.91 CaCQ 3 63.4 0.97 0.89 0.88
100°C, 250 bar Matrix Sw Ethane PMCP PMCH Ottawa 38.5 1.02 0.98 0.98 CaCQ 3 59.9 1.02 0.93 0.93
The tracers may be produced before one pore volume i? eluted if not all the pores contribute in the flow. Dead end pores may, if the pore inlet is small, not be "seen" by the tracers. The pilot effect of the PFCs cannot be explained by this theory unless the pore throats have a size which distinguishes between the large PFCs and the smaller methane and ethane molecules. If the PFCs are always in the high flow region of the pores while the ligher component? diffuse into dead end pores the observed effect may occur.
The pilot effect of the PFCs is not recorded in the system where decane is the stat ionary phase. The differences between the two situations are difficult to explain. In both cases the liquid phase is expected to be the wetting phase. The wettability may, however, be different. Most probably the water will form a thin film covering most of the pore walls. This may have as effect that small pore inlets will be even smaller. The decane, expexting to be less wetting (larger
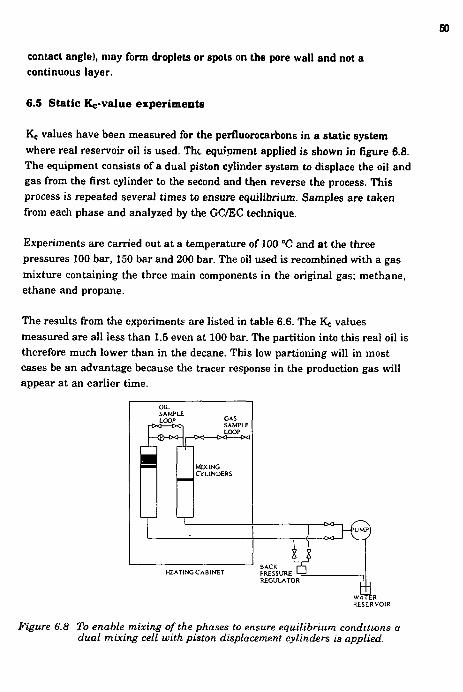
50
contact angle), may form droplets or spots on the pore wall and not a continuous layer.
6.5 Static Kc-value exper iments
Kc values have been measured for the perfluorocarbons in a static system where real reservoir oil is used. Tht equipment applied is shown in figure 6.8. The equipment consists of a dual piston cylinder system to displace the oil and gas from the first cylinder to the second and then reverse the process. This process is repeated several times to ensure equilibrium. Samples are taken from each phase and analyzed by the GC/EC technique.
Experiments are carried out a t a temperature of 100 °C and a t the three pressures 100 bar, 150 bar and 200 bar. The oil used is recombined with a gas mixture containing the three main components in the original gas; methane, ethane and propane.
The results from the experiments are listed in table 6.6. The Kc values measured are all less than 1.5 even at 100 bar. The partition into this real oil is therefore much lower than in the decane. This low partioning will in most cases be an advantage because the tracer response in the production gas will appear at an earlier time.
on. SAMPLE LOOP
I—<&-t~Hr
GAS SAMPLE LOOP
MIXING CYLINDERS
HEATING CABINET
r>© BACK PRESSURE ' REGULATOR
WATER
Figure 6.8 To enable mixing of the phases to ensure equilibrium conditions a dual mixing cell with piston displacement cylinders is applied.

51
GC Oil
—i sampl
Flow controller
itrogen
vials witr heal control
Figure 6.9 The samples from the oil phase is analyzed by stripping of the tracer from the oil by N2.
Table 6.6 Revalues measured in the Elk Hill oil by the application of a dual mixing cell apparatus.
PDCB PMCP PMCH PDCH PTCH 100 1.11 1.12 1.54 2.06 2.20 150 0.59 0.66 0.92 1.30 1.37 200 0.55 0.57 0.74 0.99 1.03
6.6 PMCP and PMCH a s tracers in a field experiment
The two compounds PMCP and PMCH have been applied as tracers in a WAG pilot a t the Gullfaks field. 10 kg of PMCP was injected at the start of the first gas injection period while 30 kg of PMCH was injected at the start of the second gas injection period. A tracer detection technique was developed to analyze both the produced gas and oil. The results from the field experiments are reported in paper rV. The results prove communication between different layers and across faults in the formation.

7 Discussion
7.1 Partitioning of the tracer in the reservoir
The partition coefficients measured are either between the gas and the liquid phase or between the gas and the solid rock surface. In a pore in the real reservoir the most likely phase distribution in a three phase system is that the water is covering the grain surface and the gas is flowing in the middle of the pores while the oil is between these two phases.
To adsorb to the grain surface the tracer molecules have to diffuse through the oil phase and the water phase. Very low partitioning is measured in the water phase and the equilibration process is therefore expected to be slow when the water layer has to be crossed. In an oil-wet reservoir where the water saturation is high enough to give a continues layer of water also the partitioning to the oil will be delayed. The wettability behaviour is, however, complex and few reservoirs are regarded as fully water-wet. Treiber et al. (1972) measured the wettability of 32 core plugs and found that more than 50% was regarded as oil wet. 88% of the cores from chalk reservoirs were oil-wet. Most of the cores are not either strong water wet or strong oil-wet both in an intermediate condition. It is possible to find spots or channels which have an other wettability than the main part of the pores (Anderson 1980). Situations where the gas has direct access to the grain surface also have to be considered.
I 1 | 1 I 1 I 1
I
• in imi • Gas Water Oil Rock
Figure 7.1 Different wettability situations may influence the possibility to achieve equilibration between gas, water, oil and grain surface. The figure shows five different situations, a) one phase, b) oil-wet I two phases, c) water-wet I three phases, d) oil-wet I three phases.

S3
To analyze the phase distributions described in fig 7.1 six different partition values are needed. These are the partition values for the oil/gas, water/gas, rock/gas, oil/water, rock/oil and rock/water systems. These values are named K°e, K*g, K r e, Kow. Kr<\ K r w respectively. Doing a similar analyses as in equation 6.1 to 6.4 the following five equations are needed to define the problems in a situation where only the gas phase is flowing and equilibrium is achieved at all positions:
1) V R - V G = K>-eSA (7.1)
2) VR - V G = K°e V 0 + K°e K™ S A (7.2)
3) V R - V G = K«g V w + K w e K™ S A (7.3)
4) V R - V G = Kye V w + K«g K™ V 0 + K w g K ° w K r ° S A (7.4)
5) V R - V Q = K°g * Vo + (Kog/Kow) V w + (K°g/K°w) K™ S A (7.5)
In a reservoir containing mainly quarts ^ s Ottawa sand) the partitioning to the grains from the gas phase is almost zero. Assuming a similar low partitioning of the tracer from the oil and water phases to the grains the last addend in all the five equations above can be neglected. That means that situation 1 and 3 will not contribute to retention of the tracer. In situation 4 the tracers have to pass through the layer of water before dissolution into oil. This will probably cause a considerably delay in the equilibration process. The possibility to apply tracers for saturation measurements in interwell flow studies necessitate equilibrium a t all places. The saturation is a direct function of retention only if equilibrium is achieved.
Situations may occur where oil or water are droplets in the middle of the pores while the gas is flowing along the grain surface. This situation may be described by combinations of the above equations.
7.2 C o m p a r i s o n of Kc-values m e a s u r e d in di f ferent s y s t e m s
Experiments have been carried out by different methods and in different systems to measure the partition coefficient of the tracers between the gas and liquid phases. Table 7.2 gives a summary of Kc values achieved in the different

54
systems. The table is limited to the experiments carried out at a temperature of 100°C.
Table 7,2 Comparison of Kc values measured in different systems and by different methods. The table gives only values measured at 100°C. *Results from static experiments.
100 bar PMCP PMCH
Decane/methane 2.53 3.90 Decane/nitrogen 2.12 3.71 Elk Hill system* 1.12 1.54
150 bar PMCP PMCH
Decane/methane 1.77 2.82 Decane/nitrogen 1.74 2.76 Elk Hill system* 0.66 0.92
200 bar PMCP PMCH
Decane/methane 1.51 2.02 Decane/nitrogen 1.37 2.14 Elk Hill system* 0.57 0.74
250 bar PMCP PMCH
Decane/methane 1.18 1.47 Decane/nitrogen 1.21 1.70 Elk Hill system* - -
The Kc values are lowest in the real oil system. Compared with the decane/methane the Kc values are about one third. The variation in Kc-values for different systems shows that individual measurements for the liquid/gas systems considered are important. Dynamic experiments in the real oil system have also given approximately the same results as those measured in the static experiments.

56
8 Conclusion and Outlook
The thesis work has demonstrated the feasibility of the PMCP and PMCH as tracers in field experiments. These compounds have properties which make them as well suited for well to well studies as the more common tracers CH3T and 8 5 K r . In the injection project carried out at the Gullfaks field the two PFCs verified communication between wells, which implies communication between different geological layers in the reservoir and also communication across faults within the same layers.
The laboratory study carried out has focused on the retention of the tracers in dynamic flooding experiments under conditions comparable with those in the petroleum reservoirs. Simultaneous injection of a variety of tracers has shown individual variations in tracer retention which are caused by important reservoir parameters as fluid saturation and rock properties. By proper design of field injection programs the tracer response may therefore be used to estimate fluid saturation if actual rock properties are known.
Relative retention of the tracers CH3T, 1 4 C 2 H6, PMCP and PMCH has been measured under a variety of conditions. The retention date has been applied to calculate parti t ion coefficients which are necessary in saturation calculations. The partition coefficients have been compared with available models for K p-value estimation. The partition coefficient varies with pressure and temperature and a model is important to enable estimation of the tracer flow in the continuously changing conditions from the injection to the production well.
The two PFCs applied are chosen among several perfluorocarbons which may be actual tracers. More research should be carried out to study other of these compounds. Another task for future work is to measure tracer behaviour in three phase systems where real reservoir fluids are used.

56
9 Nomenclature
a = flow crossection a(CG)= amount tracer absorbed on the unit surface when the gas concentration
isCG a'(CG)= amount tracer absorbed on the unit mass when the gas concentration
i sCG c = concentration of adsorbed component Co = concentration of tracer in the oil phase C G = concentration of the tracer in th* gas phase C M = concentration of component in mobile phase C s = concentration of component in stationary phase D = dead volume at the ends of the slim-tube D c = distribution coefficient between gas and water D G = density of gas phase D L = density of liquid phase fG = fugacity of gas phase fL = fucacity of liquid phase F r = flow rate of water into injection cylinder F R = fraction of time the tracer is in the gas phase G = Gibbs free energy H = height equivalent to a theoretical plate H c = Henry's law constant Kc = partition coefficient based on the concentration ratio kij = binary interaction parameter Kp = partition coefficient based on the mole fraction ratio L = length of column M = mass of filling material in the tube MC7+ = average molecular mass of the heptane+ fraction M T = the total moles in the liquid phase M w = molecular weight n = number of mole n p = plate number P = pressure P a = absolute pressure (1 bar) P c = critical pressure Pk = convergence pressure P r = reduced pressure ps = saturat ion pressure

57
R = gas constant Ri = correction factor in K p calculations Rt = retention time S = surface area SA = entropy SG = gas saturation So = oil(decane)saturation Sw = water saturation T = temperature T c = critical temperature T r = reduced temperature u = linear flow rate VG = volume of gas phase V 0 = oil volume VL = volume of liquid phase VR = retention volume V w = water volume W = width of response peak Wst = weight of oil and gas in the slim-tube Wx = the total moles of nonvolatile liquid xi = mole fraction of component i in liquid phase yj = mole fraction of component i in gas phase Z = volume factor (compressibility ratio multiplied by temperature ratio) Z m = compressibility V = volume 8G = density of gas 8L = density of liquid tp = porosity (flj = acentric factor of component i <ji = fugacity coefficient i j ,k,n = indexes denoting the component considered

58
10 References
Amyx J.W., Bass D.M. and Whiting R.L., "Petroleum Reservoir Engineering"
McGraw-Hill Book Company 1960.
Anderson W.G., "Wettability Literature Survey- Par t 1: Rock/oiUbrine
interactions, and the effect of core handling on wettability." JPT, Oct 1986.
Antonsen B., Johansen T. and Sagen J., "The Use of Partitioning Tracers as a
Tool for Determination of Breakthrough Times". A Theoretical Study. SPOR-
Seminar 1990.
Armstrong F.E., "Field use of Radioactive Gas Tracers" The Petroleum
Engineer, Dec. 1960.
Asgarpour S., Crawley A.L. and Springer S.L., "Performance Evaluation and
Reservoir Management of a Tertiary Miscible Flood in the Fenn-Big Vally
South Lake D-2A Pool", Paper No. 87-38-07 presented at "The 38th Annual
Technical Meeting of the Petroleum Society of CIM", Calgary, June 7-10, 1987.
Bjørnstad T., Garder K., Hundere I. and Michelsen O.B., "Tracer Tests in Oil
Appraisal and Reservoir Evaluation:State of the Art" North Sea Oil & Gas
Reservoirs-II Graham & Trotman 1990.
Brown G.G., Katz D.L., Oberfell G.G. and Allen R.C., "Natural Gasoline and the
Volatile Hydrocarbons", National Gasoline Association of America, Tulsa,
Oklahoma, 1948.
Calhoun T.G. and Hurford G.T., "Case History of Radioactive Tracers and
Techniques in Fairway Field." J. Pet. Tech., p. 1217, Oct. 1970.
Craig F.F., "Field Use of Halogen Compounds To Trace Injected CO2", SPE-
J4309, Nov. 1985.
Davis J.A., Blair R.K. and Wagner O.R. "Monitoring and Control Program for a
Large Scale Miscible Flood". SPE-6097 Oct 1976.
Dietz R.N., "Perfluorocarbon Tracer Technology", BNL-38847, Sept 1987.

59
Dietz R.N. and Dabberdt W.F., "Gaseous-Tracer Technology and Applications" BNL-33565 July 1983.
Draxler R.R., Dietz R.N., Lagomarsino R.J. and Start G., "Across North
America Tracer Experiment (ANATEx): Sampling and Analysis",
Atmospheric Environment 25A, p. 2815 - 36, March 1991.
Dugstad 0 . and Bjørnstad T., Unpublished results 1991.
Evans E.A., "Tritium and its Compounds" Butterworths, p. 240, 1965 .
Garder K., Hundere I., "Tracer methods for Reservoir Studies" SPOR-OPT
IFE/KR/F-88/098 1988.
Galimberti M. and Campbell J.M., "New Method Helps Correlate K values for
Behavior of Paraffin Hydrocarbons", Oil and Gas J., Nov. 3 1969.
Glasstone S. and Lewis D., "Elements of Physical Chemistry", Macmillan and
Company Limited, Chapt. 1,1970.
Glass 0 . and Whitson C.H. "The Accuracy of PVT Parameters Calculated from
Computer Flash Separation at Pressure Less Than 1000 psia". J.Pet.Tech 1811-
13, Aug. 1982.
Gonduoin M., Cornier J.J. and Thibierge P., "Etude du champ petrolifere
d'Hassi Messaoud par injection de methane, ethane, propane et butane trities",
Proc. Symp. Radioisot. Tracer in Industry and Geophys. Intern Atom. Energy
Agency, Vienna, p. 161, 1967.
Katz L.D, Cornell D.,Kobayashi R., Poettmann F.H.,Vary J.A.,Elenbaas J.R.and
Weinaug C.F., "Handbook of Natural Gas Engineering" McGraw-Hill Book
Company, 1959.
Hoffman A.E., Crump J.S. and Hocott C.R.,"Equilibrium Constants for Gas-
Condensate Systems," Pet. Trans. AIME, Vol. 198, p. 1-10, 1953.
Howell W.D, Armstrong F.E and Wade Watkins J., "Radioactive gas tracer
survey aids waterflood planning" World Oil, Vol. 152, pp. 41-45,1961.
eo
Langston E.P. and Shirer J.A., "Performance of JayLEC Fields Unit Under Mature Water-lood and Early Tertiary Operation", J.Petr.Tech. Feb. 1985.
Lewis G. N. and Randall M.,"Thermodynamics and the Free Energy of Chemical Substances." McGraw-Hill Book Company, Inc., New York, 1923.
Mayne C.J. and Pendleton R.W., "Fordoche: An Enhanced Oil Recovery Project Utilizing High Pressure Methane and Nitrogen Injection", SPE 14058, Beijing, China, March, 1986.
Mclntyre F.J. and Polkowski G., "Radioactive Tracer Application to Monitoring Solvent Spreading in the Rainbow Kag River B Pool Vertical Hydrocarbon Miscible Flood". SPE-14440, Las Vegas, Sept. 1985.
Nash L.K., "Elements of Statistical Thermodynamics" Addison-Wesley Publishing Company, Inc. 1974.
Omoregie Z.S.,Vasicek S.L., Jackson G.R., and Martinson L.A., "Monitoring the Mitsue Hydrocarbon Miscible Flood,-Program Design, Implementation and Preliminary Results" Paper No.87-38-06 presented at "The 38th Annual Technical Meeting Of the Petroleum Society of CIM", Calgary, June 7-10.1987.
Orr F.M, Silva M.K., " Equilibrium Phase Composition of CO2 Hydrocarbon Mixtures- Par t 1: Measurement by a Continuous Multiple-Contact Experiment". SPE 10726. Tulsa, April 1982.
Pecsok R.L. , Shields L.D., Cairns T., and McWilliam I.G. "Modern Methods of Chemical Analysis", John Wiley & Sons, Inc., Chapt. 8, 1968.
Reamer H.H.,01ds R.H.,Sage B.H. and Lacey W.N.,"Phase Equilibria in Hydrocarbon Systems". Industrial and engineering chemistry Vol 34, p. 1526 1942.
Reamer H.H. and Sage B.H., "Phase Equilibria in Hydrocarbon Systems". Journal of Chemical and Engineering Data Vol.7 No. 2 April 1962.
Roland C.H., Smith D.E. and Kaveler H.H., "Equilibrium Constants for a Gas -Distillate System", Oil and Gas J., p.127 -132 March 27, 1941.
Rupp K.A., "Design and Implementation of a Miscible Water-Alternating-Gas

61
flood at Prudhoe Bay", SPE-13272, Houston, Sept. 1984.
Rzasa M.J., Glass E.D. and Opfell J.B., "Prediction of Critical Properties and Equilibrium Vaporization Constants for Complex Hydrocarbon Systems," Chem.Eng. Progr.Symposium Ser., 1952.
Sage B.H., Lavender H.M. and Lacey W.E., "Phase Equilibria in Hydrocarbon Systems", Industrial and Engineering Chemistry, p.743, May 1940.
Stalkup I. and Kobayashi R.,"High-Pressure Phase-Equilibrium Studies by Gas-liquid Partition Chromatography". A.I.Ch.E Journal Vol 9, No. 1 Jan. 1963.
Standing M.B, "A Set of Equations for Computing Equilibrium Ratios of Crude Oil/Natural Gas Systems at Pressure Below 1000 psia". J.Pet.Tech., p. 1193-1195. Sept 1979.
Tang J .S. and Harker B.C., "Interwell Tracer Test to Determine Residual Oil Saturation in a Gas-Saturated Reservoir'.Part 1: Theory and Design" JPT 1991.
Treiber L.E., Archer D.L and Owens W.E, " A laboratory evaluation of the wettability of fifty oil producing reservoirs". Soc. Pet. Eng. J., 12, p. 531-540,1972.
Vairogs J.,Klekers A.J. and Edmister W.C., "Phase Equilibrium in the Methane-Ethane-Propane-n-Pentane-n-Hexane-n-Decane System". AIChE Journal, p. 308. March 1971.
Wagner O.R., "The Use of Tracers in Diagnosing Interwell Reservoir Heterogeneities Field Results". J. Pet. Tech., p. 1410, Nov. 1977.
Wilson G.M., "A Modified Redlich-Kwong Equation of State, Application to General Physical Data Calculation". Paper Presented at the 65th National AIChE Meeting, Cleveland, 1969.
Whitson C.H and Torp S.B., "Evaluating Constant Volume Depletion Data". SPE 10067, San Antonio, October 5-7,1981.

PART 2 Papers
Appl Kodiai hoi Vol 4J. No 4. pp 527-SJ5. |W2 lm J Radiai Appl Injt'wn Pan A Primed in Ore*l Britain All n|hu r«erved
63
Construction of a Slim-tube Equipment for Gas Tracer Evaluation at Simulated
Reservoir Conditions
0 DUGSTAD, T. BJØRNSTAD and I. A. HUNDERE
Institutt for energiteknikk. 2007 Kjeller. Norway
(Received 9 May 1991; in revised fonn I July 1991)
For several years the application of tracers has been a supplementary technique to monitor fluid flow in oil and gas reservoirs. This work describes the design and construction oT a slim-tube equipment for evaluation of different gas tracers under reservoir conditions. The intention behind the construction and build-up of this high-pressure equipment is to study the interaction between the rock matrix and various tracer molecules, and the interaction between oil and the tracer molecules. Chemical tracers, i.e. perfluorinaied hydrocarbons, are analysed on-line by gas chromatography with EC-detection. Radio-actively labelled tracer gases are analysed by automatic sample collection fol" id by liquid scintillation counting directly on the gas phase.
1. Introduction
Thorough knowledge of the oil reservoirs is of crucial importance to be able to design the most efficient production program. Seismic data, geological interpretation, core analyses, well logging and single and internet! pressure testing are the main sources of information. Tracer testing is an additional technique which has been widely used especially in the design of secondary or enhanced production programs.
Wagner (1977) has pointed out 6 areas where tracers can give valuable information: volumetric sweep, identification of offend ing injectors, directional flowtrends.delineationofflowbarriers, relative velocities of injected fluids, evaluation of sweep improvement treatments (before and after measurements).
A number of papers in the open literature report application of tracers to monitor gas movement in reservoirs. Calhoun and Hurford (1970) have used , sKr, tritiated methane (CHjT) and tritiated hydrogen (HT). These radioactive tracers were applied to measure inter-well connections, the configuration of displacement fronts, variation in sweep patterns and also the relative velocities of injected fluids behind the displacement fronts.
Gonduoin ei a!. (1967) report the use of tritiated methane, ethane, propane and butane to follow the gas/oil front from injection in four different wells. Rupp ei at. (1984) reported the use of "Kr, tritiaied methane, ethane and propane to detect the different slugs in a WAG injection program. Mclnlyrfi and Polkowski (1985) have applied trilialcd methane.
ethane and butane in a first contact miscible flood. Craig (1985) has used non-radioactive sulphur tiexa-fluoridc (SF t) and two different halo-carbons to follow the flow of CO, in a miscible flood. In addition, SF 4 has been applied by Langston and Shirner (1985) and by Omoregie et al. (1987) who also reported the successful use of Freon-11 in the Mitsue Gilwood Sand Unit No. I in Slave Lake.
The adsorption and retention of gas tracers may in some gas injection programs cause difficulties in interpretation of the obtained resjlts. The different tracers will exhibit variation in retention while flow* ing through the reservoir. The heavier hydrocarbon gases ethane, propane and butane will have a greater partitioning to the oil phase than the methane. The implication is that these hydrocarbons will be delayed with respect to the flowing gas in a methane gas injection.
Tritiated or l4C-labelled methane will behave as the non-radioactive methane in the reservoir. These are therefore ideal tracers for methane. Hcwever, also methane has a partitioning to the oil phase, [fa slug of radiolabeled methane is injected in an ongoing methane injection it is therefore expected that the tracer will be retained with respect to the average gas flow velocity.
Despite these difficulties, the various field tracer tests reported have resulted in increased information on the reservoirs. However, a full exploitation of the recorded data has been hampered because of limitations in the simulation models and lack of reliable physical and chemical data of the tracers.

0 DUOSTAO et ai
tn order to improve the understanding of gas tracer behaviour at reservoir conditions, we have felt the necessity to construct an experimental equipment which allows the dynamic tracer study at controlled variation of important parameters like temperature, pressure, liquid saturation, oil and gas composition and rock type. The present article describes (he construction and implementation of this equipment, and gives, for demonstration purpose, a few examples of typical results The main bulk of experimental results obtained will be published in forthcoming articles
2. Equipment Evaluations 2. I. Porous medium configuration
The "slim-tube" applied for miscible displacement studies has been evaluated as the most suitable configuration of the porous media. This concept has been chosen to minimize heterogeneity effects and gravity segregation The tracer response curve is therefore expected to be influenced mainly by sorption to rock material, partitioning between the different phases, and diffusion/dispersion effects. Channelling effects are largely avoided. If channelling occurs, the estimation of the effective mobile pore volume is impossible. This volume is important for interpretation of the results and evaluation of the significance of the tracer interaction with rock material or stationary fluids.
The retention mechanism for tracers in the reservoir may, to the first approximation, be compared with those in a chromatographic column. Simulating the reservoir wi'h a slim-tube, the chromatographic theory may be direct'y applied to interpret the results (Pecsok ei &/., 1968). The retention of the different tracers will be a function of the amount and nature of the stationary phase in the column. This stationary phase may. for instance, be the dry rock substrate in order to evaluate ihe retention caused by the rock material itself. The stationary phase may also be the rock material impregnated with liquids tike oil or water (at rci^ual liquid saturations). In the latter case, precautions have to be taken to avoid changes during the experiment in liquid saturations and compositions.
2.2. Tracer detection Radiotracers. The most commonly applied radio
active gas tracers for reservoir evaluation are the tritiated and "C-labellcd light organic aliphatic gases methane, ethane, propane and butane. The most applicable noble gas tracer is "Kr. Tritium and M C are soft beta-emitters with Efrntl at IB and 158 keV, respectively. , 5Kr has an £,„», = 695 keV and, in addition a weak gamma-branch of E. = 5l4keV (0.43%).
Due to the nature of their radiation, the applicable detection techniques are in practice restricted to ionization chamber counting, gas proportional
counting and solid or liquid scintillation counting In this case we round the latter technique to be the most reliable and roost easily implemented in combination with the slim-tube chromatographic experiments. The effluent gas may be sampled directly into a pre-evacuated scintillation vial containing 10 mL of a suitable scintillation cock Hit. An equilibrium partition of the tracer gas between the liquid and the gas phases has to be ensured before counting is started Although the partition coefficient of the tracers between the phases (scintillation cocktail/gas) may be < 1. the sensitivity is still sufficient in order to obtain accurate and reproducible results with modest amounts of tracer.
Chemical tracers. Previously applied polyhalo-genated hydrocarbons are the SF t and the freons as mentioned above. In addition. Diett (1987) has reported the use of a different class of tracers in environmental pollution studies. These are perfluon-nated cyclic hydrocarbons. They are chemically very stable at typical reservoir temperatures of lOO-lSOX, non-toxic and have a reported detection limit of < I 0 - I i L/L when analysed with a state-of-the-art gas chromatograph (GC) equipped with an electron cap-lure (EC) detector. This family of molecules will also be studied as potential reservoir gas tracers in (he experiments described here. The experimental equipment is therefore also equipped with a GC/EC system (model HP 5835) for semicominuous in-flow sampling of the effluent gas for perfluorocarbon analysis.
3. Experimental Details 3.1. Flow~rig for tracer studies
A schematic drawing of the slim-tube equipment is presented in Fig. I.
Carrier gas. The carrier gas needed for one experiment is placed in a piston cylinder outside the heating cabinet. The piston cylinders shall be kept at a stable temperature to avoid thermal gas expansion during the experiment. Safety precautions have to be taken when methane is used as earner gas. The equipment is placed in a ventilation chamber.
The piston cylinder is pressurized by water using an HPLC pump. The weight of tf,e water container is continuously \f-m'' *&,-. These data are used to calcuk ~. when the Mowing gas enters the heat cabinet, the gas is expanding and a temperature modified flow rate in the slim-tube has to be calculated.
When the equipment is operated to measure retention in a slim-tube containing a specific oil saturation, the flowing gas is equilibrated with the oil before entering the slim-tube. This is necessary to avoid time-dependent saturation in the slim-tube. The equilibration is performed by bubbling the gas through a dual cylinder trap containing decane. The cylinders are filled with steel wool to enhance (he contact between gas and oil.

66
Slim lut* equipment for $u incei evaluation
Tncer loop
-0-
Equil cyliiu
[uiUbraiiof iden
1 S i
i^^. Pump Balince To analysis
Condensation trap
Fig I. Schematic oulline of the slim-lube apparatus.
Slim-tube and subsiraie. The slim-tube used in these experiments is 12 m tong and has an inner dia of S mm. The tube is filled with the grainy substrate by application of compressed air. For the present experiments the substrate is Ottawa sand (-35% porosity) or limestone ( -67% porosity). The pore volume of the packed tube is measured by He-porosimetry.
Oil saiuraiion. The oil saturation of the substrate is carried out in two steps:
1 After column evacuation, decane is allowed to soak into the porous medium under an overpressure of a few bar. A full saturation is further ensured by pumping several pore volumes of decane through the lube at a back pressure of approx. 100 bar.
2 The saturation is then reduced from 100% to a residual value S 0 by flooding the lube with the carrier gas at real experimental conditions (flow rate, temperature, pressure) until no further oil is produced. The end-valves are closed, the tube dismounted and the weight recorded. From this weight the oil and gas saturations are calculated.
The densities of the two phases at the actual experimental conditions have to be known from elsewhere (see below).
Tracer injection. The tracers are introduced through a tube section with a volume of 0.5 mL which is pressurized from the same system as the injection cylinder for the carrier gas. The tracer pressure is the same as the process pressure In order to inject the tracer into the slim-tube, the valve (a) is closed, and
the two other valves (b, c) arc opened to direct the inlet carrier gas through the tracer loop.
The outlet system. The pressure in the system is maintained by a back pressure regulator (BPR). The BPR (Temco) used in this equipment includes a pressure reaction chamber function of which is to smooth out the valve operation to ensure fast, sensitive and accurate response. The low-pressure side of (he system is mounted outside the heat cabinet and a trap is taking care of the condensed oil produced after pressure and temperature decline.
3.2. Tracer analysis Radioactive tracers. The gas from the condenser is
flowing through a valve system (Fig. 2) to enable sampling of reproducible amounts of effluent gas. Using a four valve system (Fig. 2), a certain volume of the outlet gas is isolated while switching of another valve directs the continuously flowing gas through a by-pass tubing. The isolated sample is transferred by an automatic sample changer to preevacuated liquid scintillation vials filled with 10 mL of InsiaGel II. The spectroscopic capability of the liquid scintillation process allows simultaneous detection of two or more radionuclides provided -heir beta energies (£ f f m i l ) are sufficiently spaced. This is (he case for tritium and MC. A typical scintillation spectrum is exemplified in Fig. 3.
Chemical tracers. The effluent gas first enters the valve system for radioactive sample collection and (hen continues to an auto injection system in front of (he gas chroma(ographic column A 0 5 mL volume of the gas is injected in one sample. The GC column consists of a 6 feet long stainless steel lube filled wilh

ii DiÆir*o ei al
Bypa»
=tX^—!
Sample loop M ( x t = Auiomatic sample changer
i a •D Scintillation vials
Fig 2 Equipment for radioactive gas sampling Gas samples are injected directly into the liquid scintillation vials
Carbopak C with 0 . 1 % SPI000 (Diet i . 1987). The analyses are performed with a carrier gas flow rale of 50 mL/min, and the temperature in the oven is I lO eC.
The high-resolution G C separation followed by the sensitive EC detection enables simultaneous analysis o f a number of different polyhalogenated molecules provided their retention times on the chromatographic column are not identical. Figure 4 shows a typical gas chromatogram of the two chemical tracers o f special interest for these experiments, perfiuoro-methylcyclopentane (PMCP) and perfluoromethyl* cyclohexane (PMCH).
4. Results and Discussion
In order to demonstrate the applicability of the constructed equipment, results from seven experiments are reported here. In the first five experiments the applied carrier gas was melhane, in experiments 6 and 7 the carrier gas was N j . The tracers used were tritiated methane, "C-1 a belled ethane, PMCP, PMCH and , ! K r . The model oil used was decane. A few physical constants for the applied tracer molecules are given in Table I. The pertinent experimental pa rem ters are given in Table 2.
CHANNEL NUMBER
Fig 3 (A) Liquid scintillation spectrum of inltaied methane and UC-labelled ethane measured together (B) The individual spectra for the two radionuclides

67
Slim-tube equipment for gas tracer evaluation
Time (min)
Fig. 4 A typical gas chromalogram of PMCP and PMCH recorded with an HP GC with EC-deiector
As mentioned above, the oi l saturation is derived f rom estimated densities of the gas and o i ! phases and f rom the measured weight of the slim-tube.
The estimation of the decane density was done by extrapolat ion o f the data for bubble point densities in the methane/decane system (Sage ex at, 1940). The methane density was estimated using compressibility factors found in N G A A (National Gasoline Associat ion o f America) tables (Brown er al.. 1948). The decane vapour in the gas phase was neglected. Under N j injection the densities were found by applying Peng-Robinson equation of state.
In order to simplify the investigation of the various tracers' relative behaviour, they have al l . except for , J K r , been injected together in the same experiments. The recorded tracer production profiles directly
Table I Physical properties of the (racers tested
Tracer CH,T l4CH,—C PMCP PMCH
Beta Mol . rÉ
energy De la t ion weighi ( C ) (keV) system
IB - 1 * 4 18.6 Liq unnt 32 - 8 8 6 156 Liq scint
300 48 — GC/EC 350 76.3 — GC/EC 85 - 1 5 2 3 695 Liq scint
reflect their relative dynamic behaviour. In these experiments the gas flow-rate has been higher than the average flow-rate in the reservoir. Application o f realistic field linear flow-rates of * -0.5m/day would be prohibit ive due to time limitations. However, the flow-rate should not exceed the level required to maintain equi l ibr ium conditions in the tube. The recorded response curves have a near Gaussian shape. We interpret this as an indication o f equi l ibr ium.
The measured retention nmes are converted into units of mobile volume by mult ipl ication wi th the flow-rate and division by the actual gas volume, Vm, in the tube column. These relative retention volumes, VR,, are given in Tables 3 and 4.
The first three expenmenis have been carried out on dry rock. On Ottawa sand, where the porosity is 35%, a minor retention of the various tracers is recorded (experiments 1 and 2. and Figs 5 and 6 respectively). The same experiment on limestone (experiment 3, Fig. 7) gives a retention o f both PMCP and P M C H in the order o f 10%. The porosity in this lube is as high as 6 1 % . The ratio between the grain surface and the pore volume is not known. In a real reservoir situation, however, the importance of the
Table 2 Applied experimental paramciers
Exp 1 Exp 2 Exp. 3 Exp 4 Exp S Exp 6 Exp ? Dry Dry Dry Oil-wet Oil-wet Oil-wei Oil wet
Ottawa Ottawa lime Ottawa Ouaw» Ouawa lime-sand sand stone sand sand sand sione
TVO 120 120 120 50 120 100 100 Ptb*t) 150 150 100 100 250 250 250 t (mL.'min) 0.57 0.57 0 3 0 009 0 24 o y* n ; ? S„ (%> 0 0 0 32 2* '5 f>S
( ihe oil saturation i Ihe ilim-lube

0 DUCSTAD et al
Table ] 1 Measured rrljnvc retention volumes. VR,
Tracer E.p 1 Exp 2 Exp i Exp 4 Exp 5
CH,T 102 1 00 100 1 30 1 32 " C H , — C H , 1 02 — 101 191 1 44
PMCP 102 — 108 2 53 143 P M C H 1 02 _ i 12 3.69 I 52 " K r - 1 00 - - -retention is minor due to the fact thai the rock grains are normally coated with water, oil or both.
In the slim-lube with a residual water or oil saturation this will also be the case. However, in order to demonstrate ihe dependence of the measured retention volume on the oil saturation, any hypothetical interference from the rock surface has been removed by conducting these experiments with oil-wet Ottawa sand as the stationary phase.
Running the experiment with a stationary decane saturation gives a considerable retention of the tracers, even of the methane (Table 3). tn experiment 4 (Fig. 8). where the saturation is 32%, the PMCH is delayed with respect to the methane with a factor of 2..84 In experiment 5 (Fig. 9), however, the different tracers appear closer together. The ratio between the retention time of methane and PMCH is reduced to 1.15. The differences in relative retention between the two experiments are a consequence of the differences in saturation and changes in the temperature and pressure. Accordingly, the experiments demonstrate the possibility of applying partitioning tracers to measure residual oil saturation, provided their partitioning coefficients, K, are known. On the other hand, dynamic experiments of this type with controlled oil saturation may also be used to measure the dynamic (effective) partition coefficient at the appropriate reservoir conditions.
Table 4 Comparison or *-values measured on iwo different filling materials
Exp 6
y/t, K
Exp 7 Exp 6
y/t, K ert, x
C H , T " C H p - C H , PMCP P M C H
120 167 164 191
0 31 1.21 1.21 1 72
1 98 0 47 3 73 1.32 3.36 1 14 4.54 1.71
In the present paper K is defined as the concentration of (he tracer in the stationary phase C, divided by the concentration in the mobile phase C„.
K = k to In order to derive K from measured retention
volumes V,, volumes of stationary oil Vt and mobile gas Vm, the following simple relations apply:
let rm = the fraction cf time the tracer spends in the mobile phase. Then
C.'V. <.C.'V„ + Ct.V.) (2)
Rearrangement and combination with equation (I) gives:
{,+K'rJ tm may also be expressed by:
- = V f ,
(3)
(4)
22 -
20 - • CHjT
18 - + " C B J - C H J
16 - • PMCP
14 - Å P M C H
12 -
10 -
8 -
6 -
4 -
2 -
0 - l i m *t<*»r—i i — >^1>B> » • • •
RELATIVE RETENTION VOLUME
Fig 5 Experiment I Tracer reiennon measured by ihe detected iraccr concentration as a funclion of injected pore volumes ol" carrier gas (methane) on dry Oilau-a sand ai I 2 0 C and 150 bar

69
Slim-iurx equipment for gas iracei evaluation
A 20 - A • CHjT
I I - h + , 5 K r
16 - r , 14 - \ 12 •
10 -
8 - \ 6 - \ 4 - \ 2 - J V
0.8 0.9 1 1.1 12 RELATIVE RETENTION VOLUME
Fig. 6. Experiment 2 Tracer retention measured by ihc detected tracer concentration as a function of injected pore volumes of carrier gas (methane) on dry Ottawa sand at 120°C and ISO bar
Combination of equations (3) and (4) and rearrangement gives:
(S)
This equation has been used to derive /C-values of the tracers in the system of N,-carner gas and decane at I00°C and 250 bar on the basts of tracer retention volumes as measured in experiments (6) and (7).
These experiments were conducted in order to obtain a feeling for the reliability of /f-values measured by the presently described dynamic method. The results are given in Table 4. Very good agreement is obtained for PMCH while the agreement for PMCP and ethane is reasonable and within 5-6%. For methane, the measured values agree within 24% In general, the reliability of the ^-measurements increases with increasing Af-values. The accuracy of the it-values determined depends on several measured values like
e
20 - • CH3T
18 - + " C H J - C H J
16 - * PMCP
14 -l A PMCH
10 -
8 -
6 -
4 - / y ; 2 - yy r r * ^
RELATIVE TIME (inj.vol/PV)
Ftg. 7. Experiment 3 Tracer reiention measured by the detected tracer concentration as a funcne injected pore volumes of carrier gas (methane) on dry limestone at 120=C and 100 bar

70
0 DUGSTAD ei al
2.2 2.6 3 4 3.8 4.2
RELATIVE RETENTION VOLUME Fig 8 Espen me ni 4 Tracer retention measured by the detected tracer concentration as a function of injected pore volumes of carrier gas (methane) on Ottawa sand with an oil saturation of 32%. 50'C.
100 bar and a flow rale of 0.094 mL/min
the flow-rate, the retention time, the dead volumes, the pore volume and the weight of the tube. The accuracy also depends on the reliability of values found in the literature for liquid and gas densities and compressibility factors. It is not trivial to evaluate the relative importance of all these factors which may vary from experiment to experiment. We estimate, however, that for a tracer with K ? I, the gross total error is a ^ 10% of the measured value. Increasing K implies decreasing a.
5. Conclusion
1. In this paper a new laboratory technique for evaluation of the applicability of different gas tracer candidates has been introduced. The technique can be used for dynamic measurements under reservoir temperature and pressure.
2. Analytical techniques are implemented to enable analyses of both chemical and radioactive tracers during the same experiment. The chemical analyses
I 1.2 1.4 [.6 1.8
RELATIVE RETENTION VOLUME
Fig 9 Experiment 5 Tracer retention measured by the detected tracer concentration as a function of injecied pore volumes of carrier gas (methane) on Ottawa sand with an oil saturation of 24%. I20*C.
250 bar and a Mow rate of 0 24 mL>min

71
Slim-tut* equipment Tor gas tracer evaluation
are optimized for recording of perfluorocarbones which are a new group of tracers with a great potential for appl icat ions in reservoir studies.
3. Dynamic response curves for five different tracers, three radioact ive and two chemical compounds , have been measured under selected experimental condi t ions and published here in order to demons t ra le the developed method's feasibility to s tudy relative and absolute tracer behaviour. A considerable retent ion is measured for the larger chemical tracers at low pressure and temperature. At more realistic reservoir condi t ions the relative retention is reduced. Results f rom a more comprehensive study of relative dynamic behaviour and measurement of K-values will be publ ished elsewhere.
4. Part i t ion coefficients for gas tracers may be measured with good accuracy at simulated reservoir condi t ions by the slim-tube based dynamic flow equ ipment developed here.
5. Reversely, the present experiments indicate that par t i t ioning t racers may be applied to measure oil sa tura t ion provided their A'-values are known. This topic will be further treated and published in a for thcoming article.
Acknowledgement—This work has been supported financially by BP Exploration, BP Norway Limited U.A. We also kindly acknowledge the permission by BP to publish the results.
Re fe r ences Brown G G., Katz D. L., Oberfell G. G and Alten R. C.
(1948) Natural 'Jasolme and the Volatile Hydrocarbons.
National Gasoline Association of America, Tulsa, Oklahoma
Calhoun T G. and Hurford G. T. (1970) Case history of radioactive tracers and techniques in Fairway Field. J. Pel. Tech Oct.. 1217.
Craig F F. (1985) Field use of halogen compounds lo trace injected CO,. SPE-14309. Nov.
Dietz R. N (1987) Perfluorocarbon tracer technology. BNL-38847, DES7.
Gonduoin M.. Cornier 1. J. and Thibierge P. (1967) Etude du champ petrolifere d'Hassi Messaoud par injection de methane, ethane, propane et butane trities Proc. Symp. Radiouot. Tracer in industry and Ceophys. Int. Atom. Energy Agency. Vienna, p. 161.
Langsion E. P. and Shimer S. A. (1985) Performance of Jay/LEC fields unit under mature water flood and early tertiary operations. Pet Tech. Feb., 261.
Mclnlyre F. J. and Pollcowski G. (1985) Radioactive tracer application to monitoring solvent spreading in the rainbow Kag River B Pool vertical hydrocarbon miscible flood SPE-14440. Las Vegas, Sept.
Omoregie Z. S-, Vasioek S. L.. Jackson G. R. and Martinson L. A. (1987) Monitoring the Mitsue hydrocarbon miscible flood-program design, implementation and preliminary results. Paper No. 87-38-07 presented at The 3Sih Annual Technical Meeting of the Petroleum Society ofCIM, Calgary, 7-10 June 1987.
Pecsok R. L„ Shields L. D , Cairns T. and McWilliam I G. (1968) Modern Methods of Chemical Analysis, Chap. 8. Wiley. New York.
Rupp K. A., Nelson W. C , Christian L. D., Zimmerman K. A . Metz B. E. and Slyler J. W. (1984) Design and implementation of a miscible water-altema ling-gas flood at Prudhoe Bay. SPE-13272, Houston. Sept.
Sage B. H.. Lavender H. M. and Lacey W. E. (1940) Phase equilibria in hydrocarbon systems. Ind. Engng Chem. May, 743.
Wagner O. R. (I977) The use of tracers in diagnosing •nterwell reservoir heieroge nei ties-field results. J. Pet. U.hn. Nov., 1410.

72
PAPER 2
Submitted for publication Journal of Petroleum Science i Engineering
MEASUREMENTS OF GAS TRACERS RETENTION UNDER SIMULATED RESERVOIR CONDITIONS
Ø.Dugstad, T. Bjørnstad and I.A.Hundere Institutt for energiteknikk, N-2007 Kjeller, Norway
ABSTRACT
Measurements are carried out to investigate the behaviour of gas tracers under reservoir conditions. The interactions between the tracer and the rock matrix and between the tracer and the residual oil are studied. Two chemical compounds, the perfluoromethylcyclopentane and the pefluorometlylecyclohexane, are studied to evaluate their potential as gas tracers in oilfield investigations. The chemical tracers are compared with the behaviour of radiaoctive methane and ethane tracers.

73
1 Introduction
Tracing of gas and water which are injected into the reservoirs has been a widely used method to increase the knowledge of fluid movements. The tracers applied have mainly been radioactively tagged molecules. These molecules may by special techniques be measured down to very small concentrations. This is important because of the very high dilution of the injected fluid in the reservoir. The radioactive nuclides used may be isotopes of elements in naturally occurring reservoir gases or tagged on chemicals which are not common in the reservoir. Th<= tracers most frequently reported in the literature are tritiated hydrogen or methane and 8 5 K r . 1 4C-labelled light hydrocarbon gases are also applicable PS tracers, but they have been less commonly used truly because of higher costs.
F.E Armstrong (1960) reports the application of gas tracers to define fracturing directions in reservoirs. Directional permeability may be identified early in the reservoir processes so that steps can be taken to maximize recovery efficiency.
In order to be able to trace the injected gas from various injection wells each well has to be labelled with different tracers. At present, the number of available and applicable radioactive tracers are restricted and it is therefore of interest to find additional tracer candidates which can be applied in reservoir measurements . Before implementation of new tracers in field applications the behaviour of the compounds should be extensively studied in laboratory experiments to ensure the most efficient injection strategy.
An ideal tracer should follow the traced phase closely. Under injection of methane gas radioactively labelled methane will be an ideal tracer. Methane may be radioactively labelled either by substituting one of the hydrogen atoms by tritium or likewise exchange 1 2 C by 1 4 C . Though these tracers may be considered as ideal relative to methane they will have a partitioning between the oil phase and the gas phase like stable methane itself. The partitioning coefficient of methane is available in the literature of reservoir engineering. All gas molecules have partitioning between the phases. The tracer molecules will travel a t the velocity of the liquid phase when it is dissolved into the liquid and a t the velocity of the gas when it stays in the gas phase. A tracer molecule with a high partitioning into other phases may therefore be considerably delayed in the the reservo'" *i respect to the average gas flow. The tracers may also be

74
delayed by the interaction with the rock surface. These delay mechanisms may in some cases cause difficulties in interpretation of the results. In the search for new applicable tracers it is therefore important to quantify these delays to improve the interpretation of the data collected from field tests.
2 Gas Tracres in Reservoir S tud ie s
2.1 Radioactive Tracers
Several authors report the use of radioactive tracers in oilfield applications. The most common tracers are tritiated hydrogen gas (Calhoun et al. 1970,Calhoun e ta l . 1968, Fearon 1957, MaynegLal.l986,Rupp eta l . 1984, Tinker 1973),tritiated methane Calhoun eLal.1970, Calhoun §t_al.l968, Davis e ta l . 1976, Gonduoin et al. 1967, Mayne e t a l . 1986,Rupp e ta l . 1984, Welge 1985) and 8 5 K r (Armstrong 1960, Calhoun e ta l . 1970, Calhoun 1968, Davis e ta l . 1976, Howell e ta l . 1961, Mayne etal . 1986, Rupp etal . 1984,Tinker 1973, Welge 1985). Some papers have described the application of tritiated ethane, propane and even butane (Gonduoin et al. 1967, Mayne e t a l . 1986) as tracers. All these tracer molecules, except 8 5 K r , are tritium labelled compounds. Tritium is a week beta emitter. Small concentrations of tritium labelled tracers may be detected directly in the gas phase by proportional counter technique or the gas may be oxidized to produce water which is counted by liquid scintillation technique.
2.2 Chemical Tracers
Only a few papers on the application of chemical gas tracers in reservoir studies have been published. F.F Craig (1985) has reported the use of halocarbons and sulphur hexafluoride as trac "or carbon dioxide. T h ^ e tracers were applied successfully in a miscible uood. As early as in 1946 E.M.Frost (1946) reports the use of helium as tracer under gas injection.
When looking for new "near-ideal" tracers a few main principles have to be taken into consideration. A tracer must fulfil the following criteria:
Very low detection limit Stability under reservoir conditions Must follow the phase which is tagged and have a minimal

75
partitioning into other phases No absorption to rock material The environmental consequences of the application must be a t a m i n i m u m
Dietz has reported the application of perfluorinated hydrocarbons as tracers for air in environmental studies. These tracers have a very low detection limit which make them compatible with radioactive tracers with respect to detectability. The fluorine compounds have been reported to be analyzed in concentrations down to 10"' 5 - 10"1 61/1 in air samples. Such a high sensitivity makes these molecules interesting as oil field tracers.
The analysis of the perfluorocarbons (PFC) are performed using a gas-chromatograph (GO connected to an electron capture (EC) detector. The EC detector is extremely sensitive to perfluorinated hydrocarbons and especially the cyclic compounds.
Senum et al. (1989) have reported a method to analyse the PFC content in a hydrocarbon gas from a production stream. The gas contained in pressure bombs is flushed through active carbon to absorb the PFC's. The PFC containing pellets are thermally desorbed and the gas is directed trough a system composed of a precolumn, catalysts and traps to remove the hydrocarbons before the PFC's enter the main separation column for determination of the amount of each tracer.
Such tracers have been applied in pilot projects on the Norwegian continental shelf.
3 E x p e r i m e n t a l S t u d i e s
In the presently reported experiments the two perfluorocompounds perfluororaethylcyclopentane (PMCP) and perfluoromethylcyclohexane (PMCH) and the three radioactive tracers tritiated methane, 1 4C-labelled ethane and 8 5 K r have been studied. The purpose of the experimental work has been to s tudy the behaviour of the tracers under elevated temperature and pressure, i.e a t simulated reservoir conditions.
Some physical constants of the tracers are listed in table 1. From the table it is

76
evident that the PFC's are liquids at standard conditions. The methane, ethane and krypton are real gases with a boiling point far below 0°C.
Table 1 Physical constants for the studied gas tracers
PMCP PMCH Methane Ethane Krypton Formula C6F12 C7F14 CH 3 T MCH3CH3 »Kr MW 300 350 18 32 85 BP(°C) 48.0 76.3 -164 -88.6 -152
The tracers have been studied in dynamic flooding experiments. Retention has been measured while the gas containing the tracer has been flooded trough a porous medium.
The experimental equipment and procedures applied in this study are described by Dugstad et al. (to be published). The tracer mixture confined in a small-volume tubing section just prior to the entrance of the slim tube, is flushed by the injection gas through the column. The effluent is analysed by automatically sampling the gas into scintillation vials for counting of the radioactivity and by automatic injection into a gas chromatograph for detection of the chemical tracer.
Several series of experiments have been carried out to study the retention caused by interaction between the tracer and the rock matrix. The packing material applied in the tubes was dry sand (Ottawa sand, - nearly pure quartz ) or limestone. Different amount of kaolinite clay has been added to the pure Ottawa sand to measure the effect of the clay. The addition of the kaolinite was carried out by making a water slurry of the clay and the Ottawa sand. The mixture was dried in a climate chamber. This gave a thin layer of clay distributed onto the quartz grain surface. Two different clay concentrations were prepared, 0.5 % and 2.5 % by weight. The limestone applied was crushed material from the Ekofisk formation taken on-shore in Denmark. The tubes prepared was 6 meter long and the inner diameter was 0.5 cm.
One other series of experiments has been performed to investigate the interaction between the tracer molecules and the oil in the porous medium. In a porous medium partly filled with different fluids the main retention mechanism is the tracer partitioning between the different phases. To study this effect a 12 meter long slim tube with a inner diameter of 0.5 cm was

77
applied. The tube filling material was pure Ottawa sand.
All gases will to some extent dissolve into the liquid phases until an equilibrium is achieved. The transport velocity of the tracer in the reservoir will therefore be the sum of the fraction of time spent in the liquid phase multiplied with the liquid velocity and the fraction of time spent in the gas phase multiplied by the gas velocity. Tracers which partition between gas and liquid phases will therefore be retained when the liquids are flowing with a lower velocity than the gas. In the presently reported retention studies 'Jie column has been prepared to residual oil saturation with model oil (decane) and the oil phase is therefore considered as stationary. No water was present.
The injection gas was methane. The experiments were carried out a t four different temperatures and four different pressures. Since we have used a model oil, the conditions are not quite identical with those in a reservoir. If the oil in the tube should be characterized by standard oil characterization it would have a mole fraction of methane in the range of 0.3-0.7 and a heptane+ fraction in the range of 0.7-0.3 depending on temperature and pressure. The heptane+ fraction (pure decane) will have a mole weight of 142. According to "Handbook of Natural Gas Engineering" (1959) the partitioning coefficients for methane in this system may be found in NGAA (Brown et al. 1948) data charts drawn for a convergence pressure of 5000 psia.
To enable calculation of effective pore volumes an estimation of oil and gas densities have to be carried out. In this work data from B.H. Sage et al. (1940) has been applied to calculate the density of the decane. NGAA's compressibility factor charts for pure methane is used to calculate the gas density.
4 R e s u l t s a n d D i s c u s s i o n
Results from the experiments carried out to study retention caused by the interaction with the surface of the reservoir material are given in table 2.
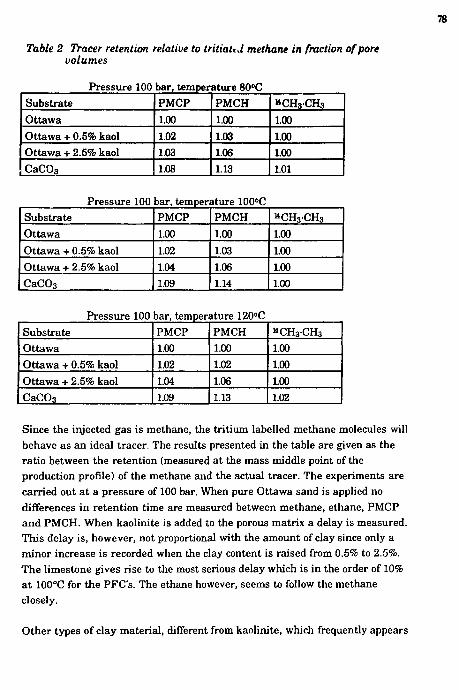
78
Table 2 Tracer retention relative to tritiaUd methane in fraction of pore volumes
Pressure 100 bar, temperature 80°C Substrate PMCP PMCH «CH3CH3 Ottawa 1.00 1.00 1.00 Ottawa + 0.5% kaol 1.02 1.03 1.00 Ottawa + 2.5% kaol 1.03 1.06 1.00 C a C 0 3 1.08 1.13 1.01
Pressure 100 bar, temperature 100"C Substrate PMCP PMCH B C H 3 C H 3
Ottawa 1.00 1.00 1.00 Ottawa + 0.5% kaol 1.02 1.03 1.00 Ottawa + 2.5% kaol 1.04 1.06 1.00 C a C 0 3 1.09 1.14 1.00
Pressure 100 bar, temperature 120°C Substrate PMCP PMCH *>CH 3CH 3
Ottawa 1.00 1.00 1.00 Ottawa + 0.5% kaol 1.02 1.02 1.00 Ottawa + 2.5% kaol 1.04 1.06 1.00 C a C 0 3 1.09 1.13 1.02
Since the injected gas is methane, the tritium labelled methane molecules will behave as an ideal tracer. The results presented in the table are given as the ratio between the retention (measured at the mass middle point of the production profile) of the methane and the actual tracer. The experiments are carried out a t a pressure of 100 bar. When pure Ottawa sand is applied no differences in retention time are measured between methane, ethane, PMCP and PMCH. When kaolinite is added to the porous matrix a delay is measured. This delay is, however, not proportional with the amount of clay since only a minor increase is recorded when the clay content is raised from 0.5% to 2.5%. The limestone gives rise to the most serious delay which is in the order of 10% a t 100°C for the PFC's. The ethane however, seems to follow the methane closely.
Other types of clay material, different from kaolinite, which frequently appears

79
in reservoir rock may also contribute to the retention. The effect of clay on the retention is however reduced by the fact that the grains are covered with water or oil. The presently studied gas tracers are expected to have negligible partitioning into the water phase and the water will therefore not contribute significantly to the retention.
Figures 1, 2 and 3 illustrate the results from three independent tracer experiments. The tracer response curves are plotted as a function of injected pore volume. In figure 1 the experiment has been carried out on a dry slim tube. The temperature was only 50°C and the pressure was 250 bar. A small retention is then measured for the PFC's. At the same pressure and temperature conditions (50°C, 250 bar), but with a decane saturation of approximately 30%, a time lag is measured for all the tracers, even for the methane. The PMCH which is the perfluorocarbon with the highest molecular weight and the highest boiling point is the most heavily retained tracer. At these conditions more than 1.7 pore volumes are needed to flush the PMCH through the porous medium. When the pressure is decreased to 150 bar, 2.2 pore volumes are needed before the PMCH has moved through the slim tube. Comparing the PMCP and the ethane it is noteworthy that at 250 bar the PMCP is in front of the ethane while at 150 bar the situation is reversed and the ethane will flow with a higher average velocity.
Table 3 gives the relative retention of the ethane, PMCP and PMCH with respect to methane a t the four pressures 100 bar, 150 bar, 200 bar and 250 bar and at the four temperatures 50°C, 80°C, 100°C and 120°C.
The calculation of the relative time given on the x-axis in the figures will be influenced by the accuracy of several process parameters. A small shift may therefore occur and the most valuable method to compare the results will therefore be to give the relative retention with respect to the ideal methane tracer. This is carried out in table 3. For each experiment also the liquid saturation is given. The saturation has to be measured individually in each experiment and is a consequence of the applied temperature and pressure.

æ
Table 3 Retention ofPMCP, PMCH and 14C labelled ethane relative to tritiated methane as a function of temperature, pressure and oil saturation
Temperature 50°C Pressure (bar) 100 150 200 250
Oil sat. (%) 32.7 30.7 29.9 31.3
* C H 3 C H 3 1.47 1.40 1.27 1.21
PMCP 1.95 1.47 1.31 1.18
PMCH 2.84 1.91 1.51 1.29
Temperature 80°C Pressure (bar) 100 150 200 250
Oil sat. (%) 19.6 22.6 25.6 30.1
«CHsCHs 1.27 1.24 1.19 1.17
PMCP 1.49 1.33 1.23 1.18
PMCH 1.95 1.59 1.37 1.28
Temperature 100°C Pressure (bar) 100 150 200 250
Oil sat. (%) 20.8 22.5 23.9 262
« C H 3 C H 3 1.27 1.24 1.16 1.11
PMCP 1.49 135 1.21 1.11
PMCH 1.94 1.62 1.34 1.18
Temperature 120°C Pressure (bar) 100 150 200 250
Oil sat. (%) 12.0 13.9 17.2 242
* C H 3 C H 3 1.11 1.09 1.98 1.09
PMCP 1.19 1.13 1.12 1.10
PMCH 1.33 1.22 1.19 1.15
The relative retention should therefore not be compared directly. An increase in saturation will give an increase in the relative retention value. The retention measured may, however, be recalculated to give the retention at 20 % saturation. This may be done by calculating the ratio between the concentration of the tracer in the gas phase (Cm) and in the liquid phase (Cs) This ratio is a constant independent of saturation and may therefore be used to derive the
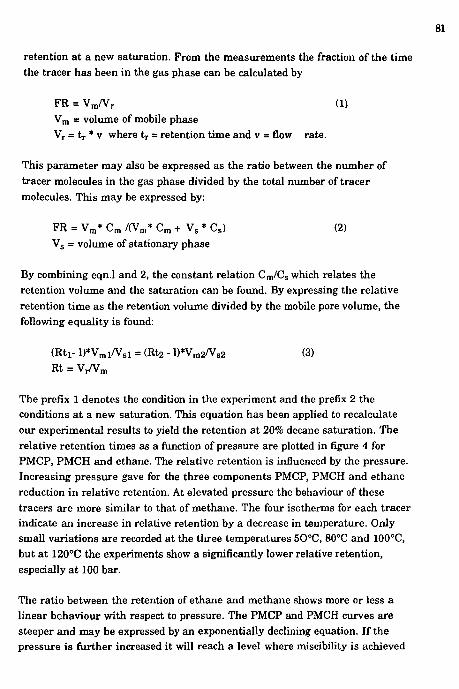
81
retention at a new saturation. From the measurements the fraction of the time the tracer has been in the gas phase can be calculated by
FR = V m /Vr (1) V m = volume of mobile phase V r = tr * v where t,- = retention time and v = flow rate.
This parameter may also be expressed as the ratio between the number of tracer molecules in the gas phase divided by the total number of tracer molecules. This may be expressed by:
FR = V m * C m / r v m * C m + V s * C.) (2) V s = volume of stationary phase
By combining eqn.l and 2, the constant relation C m / C s which relates the retention volume and the saturation can be found. By expressing the relative retention time as the retention volume divided by the mobile pore volume, the following equality is found:
(Rti- l ) * V m X / V s l = (Rt 2 - D * V m 2 / V s 2 (3) Rt = VrNm
The prefix 1 denotes the condition in the experiment and the prefix 2 the conditions a t a new saturation. This equation has been applied to recalculate our experimental results to yield the retention a t 20% decane saturation. The relative retention times as a function of pressure are plotted in figure 4 for PMCP, PMCH and ethane. The relative retention is influenced by the pressure. Increasing pressure gave for the three components PMCP, PMCH and ethane reduction in relative retention. At elevated pressure the behaviour of these tracers are more similar to that of methane. The four isotherms for each tracer indicate an increase in relative retention by a decrease in temperature. Only small variations are recorded at the three temperatures 50°C, 80°C and 100°C, but a t 120°C the experiments show a significantly lower relative retention, especially a t 100 bar.
The ratio between the retention of ethane and methane shows more or less a linear behaviour with respect to pressure. The PMCP and PMCH curves are steeper and may be expressed by an exponentially declining equation. If the pressure is further increased it will reach a level where miscibility is achieved

82
and the whole system will be one phase flowing with the same velocity. PMCH is the tracer with the most dramatical reduction in retention when the pressure is increased. At 100 bar and 50°C the average flow rate of PMCH is more than 100 % higher than that of the methane but at 250 bar this difference is reduced to approximately 20%. The PMCP shows always a lower delay than PMCH. A small delay of less than 20 % will be acceptable in studies of directional flow and fracturing in the reservoirs. Increase in delay will increases the time spent in the field test before a tracer response is detected in the production well. For testing of communication in the reservoir it is preferable that the tracer follows the injected gas closely.
When the pressure in the system increases, more of the methane is dissolved in the liquid phase. By applying the concept of convergence pressure the mole fraction of the methane in the liquid phase at 150°C and 100 bar can be estimated to 0.3 while at 50°C and 250 bar the mole fraction is estimated to 0.7. The chemical properties of the liquid phase are therefore considerably changed from experiment to experiment. When the amount of methane in the liquid phase increases, the dissolution of the ethane and the PFC's are reduced. By increasing the temperature more of the tracer molecules enter the gas phase and the retention decreases.
The comparison of the methane and the 8 5 K r gives as seen in figure 5, a small retention of the krypton with respect to the methane. This retention is, however, minimal. Among the four tracers compared with methane, 8 5 K r is the one which follows most closely.
5 Conclusion
Perfluorocarbons have properties which make them suitable as tracers in reservoir evaluation programs. They fulfil the criteria of being easy to detect and to be stable under reservoir conditions.
No retention is measured for the tracers when they are flooded through pure Ottawa sand. When clay is added a small retention is measured. On limestone a retention of the PFC's is measured while the ethane is following the methane closely.
Experiments carried out on a porous medium containing a certain oil (decane)

63
saturation show large variations in retention time as the total pressure is changed. At the highest pressure investigated, 250 bar, none of the tracers were retained more than 20% with respect to methane.
The dynamic experiments carried out show that the PFC tracers follow methane well enough at high pressure to become valuable tracers in reservoir characterization studies. When quantities as gas the velocity and sweep efficiency are going to be estimated however, the retention of the compounds have to be taken into con-sideration.
The chromatographic effect of the gas tracers demonstrated in these experiments may be used for deter-mination of residual oil saturation (or rather gas-contactable oil) in a reservoir. This subject will be treated in a forthcoming article.
A c k n o w l e d g e m e n t s
We are indebted to the British Petroleum Company Norway for financial support of these experiments and for the permission to publish this paper.

84
6 R e f e r e n c e s
Armstrong, F.E. (1960). Field Use of Radioactive Gas Tracers, Petroleum Engineer, 32 (13), B34.
Brown, G.G., Katz.D.L., Oberfe'l.G.G. and Allen, R.C.(1948). Natural Gasoline and the Volatile Hydrocarbons, National Gasoline Association of America, Tulsa , Oklahoma.
Calhoun.T.G. and Hurford,G.T.U970). Case History of Radioactive Tracer and Techniques in Fairway Field. J. Petr. Techn., Vol. 22, No. 10, 1217.
Calhoun.T.G. and Tittle, R.M (1968). Use of Radioactive Isotopes in Gas Injection. SPE-2277.
Craig, F.F.(1985). Field Use of Halogen Compounds To Trace Injected C 0 2 , SPE-14309.
Davis.J.A., Blair, R.K. and Wagner,O.R.(1976). Monitoring and Control Program for a Large Scale Miscible Flood, SPE-6097.
Dietz, R.N. Perfluorocarbon tracer technology, BNL-38847, DE87.
Dugstad, 0. , Bjørnstad T. and Hundere, I.A. (1990). Construction of a slim-tube equipment for gas tracer evaluation at simulated reservoir conditions. Appl. Radiat. Isot. Vol. 43, No. 24, pp. 527-535,1992.
Fearon, R.E. (1957). Tritium - Newest Tool for Tracing Reservoir Flow, World Oil. 145. 114.
Frost,E.M. (1946), Helium Tracer Studies in the Elk Hills, California, Field, BM-Rl-3897.
Gonduoin, M., Cornier,J.J. and Thibierge, P.(1967). Etude du champ petrolifere d'Hassi Messaoud par injection de methane, ethane, propane, et butane trities, Proe. Sym. Radioisot. Tracers in "Industry and Geophys", Intern. Atom. Energy Agency, Vienna, p.161-175,
Howell.W.D., Armstrong, F.E.and Wade Watkins, J.(1961). Radioactive Gas Tracer Survey Aids Waterflood Planning, World Oil, 152 (2), 41.
Katz, D.L.,Cornell, D., Kovayashi, R., Poettman, F.H., Vary, J.A., Elenbaas, J.R., Weinaug, C.F. (1959). Handbook of Natural Gas Engineering, McGraw-Hill Book Company,
Mayne C.J. and Pendleton, R.W. (1986). Fordoche: An Enhanced Oil Recovery Project Utilizing High Pressure Methane and Nitrogen Injection, SPE 14058.
Rupp.K.A., Nelson, W.C., Christian.L.D., Zimmerman, K.A., Metz, B.E. and Styler, J.W. (1984). Design and Implementation of a Miscible Water-A) femating-Gas Flood at Prudhoe Bay, SPE 13272.

85
Sage, B.H., Lavender, H.M. and Lacey, W.E. (1940). Phase Equilibria in Hydrocarbon Systems, Industrial and engineering chemistry, p.743.
Senum, G.I., Cote, E.A., D'Ottavio, T.W.and .Dietz, R.N. (1989). Hydrocarbon precombusting catalyst survey and optimization for perfluorocarbon tracer analysis in subsurface tracer applications, BNL Informal Report.
Tinker, G.E. (1973). Gas Injection with Radioactive Tracer to Determine Reservoir Continuity East Coaling Field, California", J. Petr. Techn., Vol. 25, No. 11, 1251.
Welge, H.J. (1985). Super Sleuths Tracer Flow of Injected Gas, The Oil and Gas Journal, 54, 77-
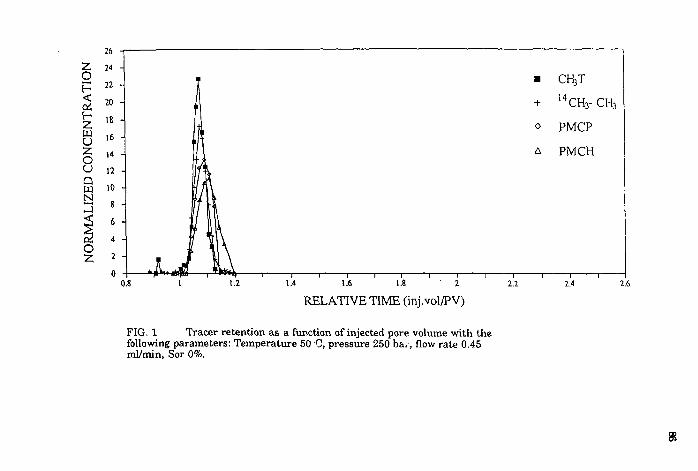
RELATIVE TIME (inj.voI/PV)
FIG. 1 Tracer retention as a function of injected pore volume with the following parameters: Temperature 50 C, pressure 250 ba, , flow rate 0.45 ml/min, Sor 0%.
0.8
• CH,T
+ M C H 3 - C H 3
o PMCP
A PMCH
J | l i i < É ^ t | 4 f a t |
2.2 —r~ 2.1
RELATIVE TIME (inj.vol/PV)
FIG. 2 Tracer retention as a function of injected pore volume with the following parameters: Temperature 50°C, pressure 250 bar, flow rate 0.24 ml/min, Sor 31%.
2.6
9

15
2 14 O n < 12
(5 n 2 10
9 2 O U Q ID N
OS O 2
7 6 5 4 3 -2 -1 -0 - •
0.8 r**>*¥
• CH3T
+ 1 4CH 3-CH 3
o PMCP
A PMCH
*•»***<•* 1.4 1.6 1.8 2
RELATIVE TIME (inj.vol/PV) 2.4 2.6
FIG. 3 Tracer retention as a function of injected pore volume with the following parameters: Temperature 50°C, pressure 150 bar, flow rate 0.24 ml/min, Sor 31%.
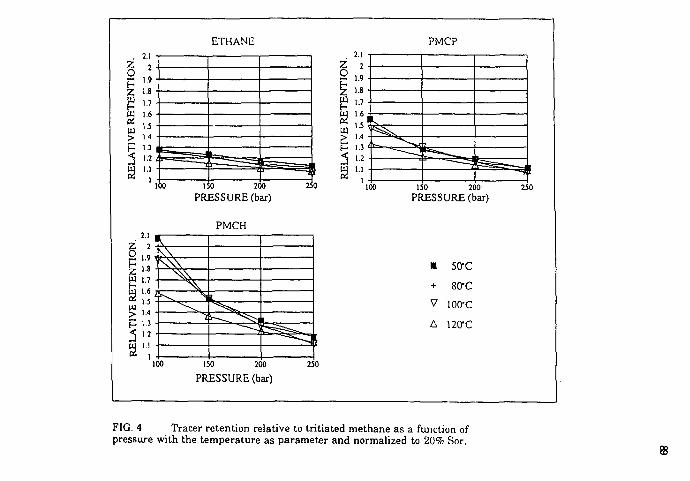
ETHANE PMCP
Z o p Z W
< a
100 150 200 PRESSURE (bar)
>k ' " ^ w /w. ""-->-<
150 200-PRESSURE (bar)
250
PMCH
Z O H Z W H
W
' l ,s\ ^ \ \
^ X K \ L
^ V O ^ i
"<S t^^*~. ^-<i i
150 200
PRESSURE (bar) 250
• 50-C
+ 80-C
V 100-C
A 120*C
FIG. 4 Tracer retention relative to tritiated methane as a function of pressure with the temperature as parameter and normalized to 20% Sor.

z o p < z w u 2 o u Q W N
O 2
0.8 1.2 1.4 RELATIVE TIME (inj.vol/PV)
FIG. 5 Tracer retention as a function of injected pore volume with the following parameters: Temperature 100°C, pressure 250 bar, flow rate 0.22 ml/mi n, Sor 12%.
8

91
PAPER 3
MEASUREMENTS AND APPLICATION OF PARTITION COEFFICIENTS OF COMPOUNDS SUITABLE FOR TRACING GAS INJECTED INTO OIL RESERVOIRS
0 . DUGSTAD, T. BJØRNSTAD and t. HUNDERE tnsiiiuf) lor Energi leVnikk
( I ) PosiDoks 40. N. 2007 Kjeller Norway
MESURES ET APPLICATIONS OES COEFFICIENTS DE PART AGE OE COMPOSANTS UTlLlSABLES COMME GAZ TRACEURS INJECTÉS OANS OES RESERVOIRS DE PETR0LE
Les iracaurs representant un outil preaeux pour amaliorar la description des gisements On las a utilises pour oblenir des ranseignements sur la configuration de I'ecouiemanl des fluide» tniectés et sur leur vitesse. sur 1'mstant de percé das venues d'eau et sur leur ongine precise, sur les trai-tements d'amelioration du ba lavage, sur las hétérogénéités importantas talles que fractures, barriørts d'ecoulemeni al slralilications de la permeabihté. Dans les gisements im-portants com por tant plusieurs puits de production et plu-sieurs puits d'injection, >i est done souhaitabte de disposer de plusieurs traceurs afin de pouvoir mjecter different: ira-ceurs ou melanges de traceurs dans les différents puiis L'article presente ici esl une contribution a Teflon fait pour étendre le norn bre de gaz traceurs fiables applicable* aux gisements
L'article presente les résuftais d'essais dynamiques en la* boraioires dans lesqueis on mjecte des traceurs å Iravers un milieu poreux. Lorsqu'iis traversent un reservoir, les gaz traceurs sont retarrJés du laii de leur segregation dans la phase huile La connaissance de ce phenomena esl impor* lånte pour une mierpréiaiion optimale des essais de traceurs realises in-silu. Cette segregation est quantifiée a 1'aide du coefficient de partage. On presente un modéle mono-dimensionnel permen ant de prévoir la vitesse d'ecou-lement du Iraceur en loncnon du coefficient de saturation, du coefficient de pariage et de la fraction ecoulée tors de 1'mjeclion disconlinue d'un traceur dans un milieu poreux On a étudié deux traceurs chimiques, le perfluorométhylcy-clopentane (PMCP) et le perfluorométhylcyclohexane (PMCH), ainsi qu'un compose radioactif, de 1'éthane marque au , 4 C . Les deux composes chimiques sont nouveau x comme traceurs apphqués au* reservoirs; la littérature disponible ne fait étal daucun resultat m-situ qui aurait éié oblenu avec ces substances Les hydrocarbures liuores soni mtéressanis comme naceurs poteniiels du fait de leur
••':*'b G J '

r • U * • * , " . A * B r • - . * • * , ' 1 •• « V I * . * *
B2
subline v comp"t oa«» i t» eoodtimn» ca*acia'>«i*qwas oat <t t t»vo»t at da ieu> f t * taib't t tu i i d t d t i tc t«A ic tqu * t torn anaiy i t» pa* cniomaiograpnie on pnat t g a i t v u a t lociaa a un d t t tc i tu i a capiu't d t i tc t iont La meu»*u't tontibilt it i ia detection as) obit nut pour las composts eycliqutt polylluoita comportani una ou plut»tu>t cnøkttt tala r alas, ce qui asi te cas pour ta PMCP at ie P lCH NoKa group* a («ctmmtni uMisa avec succes ses d tu* composes comme traceurs dans un rtstrvoit de la mei du No'0 La PMCP. le PMCH et 1'eihane marqua au '*C oni « i t t l u dies a i*a>da d'essai» dynamiquts Le milieu po ' tm utilise esi un tube da 6 m de long, d un diamtlrt mttntur. de 0.5 cm rtmph de sable d Ottawa On nnce ie tube jusqu'a robtention de decane puis on mjecte une quantna tim* de traceur ans le ga* vtci tui . tuste a 1'amont de i t n u t e du lube mince Les ligures 4 et 5 donneni les courbts de re-pons* types de traceur dans i« gaz effluent Les figures monlront que le iraceu' de reference, du methane marqut au tritium, est elue le premier le PLCH. compose >ourd. apparall comme te dernier pic sur le chroma logr amme. les pics d'ethane marque au " C et de PMCP se situani entre les deux. Oans certaines conditions expénmenialts. 1'arn-vée déthane precede celle du PMCP. mais a des pressions supéneurts. 1'ordre esl inverse
Deux series d'expenences oni été réalisées. lune dans la-quelle le gaz injecta est du methane. I'autre dans laqueMe le gaz injecté est de I'azote Dans les deux series, on a fait varier la pression de 100 a 250 bars en ia temperature de 80°C a 120°C. Lorsque la phase de décane est station-na ire et que (adsorption du traceur sur la surface des grains de sable peut étre considérée comme négligeable. la retention devieni une fonclion du coefficient de pariage et du coefficient de saturation en hu ile. Dans les essais présentés ici. le coefficient de saturation en huile est ob-lenu par une mesure pondérale: on enregisfv le temps de retention pour le pic de réponse du traceur. A partir de ces deux paramétres. on caicuie le coelficienl de partage (equation 8) . Pour les tro is traceurs considérés. ce dernier (Kc. cf. equation 2) dimmue lorsque ia pression augments Une augmentation de la temperature lend égaiement a abaisser les valeurs de Kc. mais celte relalion est moins marquée Pour le PMCH utilise avec du methane et des décane. la valeur de Kc varie de 4.37 å 80°C et 100 bar å 1.42 å 120°C et 250 bar. Les valeurs correspondantes pour le PMCP sont de 2.45 et de 0.86 Les tendances som gioba-lement les mémes avec I'azoie Sous injection d'azote. tou-telois. tes valeurs de Kc sont légerement plus éievées å basse pression et légerement plus faibles a hauls pression, comparées avec les résuftals des essais au methane. L'em-ploi d'huile provenant de reservoirs reels est susceptible d'entralner des valeurs de Ke drfférenles. La figure 1 donne le debit relatif des traceurs pour différentes valeurs de Ke L'iniersection des courbes correspond au point pour lequet la vitesse d'ecoulemeni des deux phases est la rnéme En ce point, le debit de iraceur est indépendant du coefficient de partage. Pour Ke = 1, ce debit est indépendani du coefficient de saturation Par consequent, pour Kc = 1. les traceurs ne conviennenl pas pour une estimation du coefficient de saturation in-silu Kc = I
• t p * o t * n i * toutt'o*» une »a*tu* •ova* DOV* • ett>mai«n du volume tout det p e t s 0*ns i t t eludes d t composfbon o* t p t i ' o t t * cw»<»*n i dø panag* xp a i l h«r>iu«ii«mtni øtlm* cemmt la liacfeOA mot*»* du compouni dam la prujt* g a i t u t t dmtee pa* ta it*cito«t mount du mem* eompoMM daa» ta pnaa* u-quid*, c t qm d'titrt da la ddttmnoo das «aieu/f da *» m * . t u ' t e t d a m la p ' t t tme «lude On a convert* «n K» let vaieuu de Kc mt tur t ts On a compai* i t ratunai au* v j i tur t d t Kø calculttk a ra id* d t t mtinodti connott d t prediction du coefficient d t panag* On a uui't* • * • equations d * Wilson t l Wilson, comma i t monuent let ta-bitaux 7 at B. pour Its perfiuo'ocafburts its predictions det valours dt K0 obtenuts a i aide a t cts modtlts torn trts mtdiocrtt
MEASUREMENTS AND APPLICATION OF PARTITION COEFFICIENTS OF COMPOUNDS SUITABLE FOR TRACING GAS INJECTED INTO OIL RESERVOIRS Tracing ot injection gat m oil reservoirs >s a technique used
. to improve Iht description of permeability distributions in f situ Results from dynamic laboratory experiments of ga t
tracers ar t reported Gas tracers art delayed when Hooding through a reservoir by the partitioning into the oil phase A knowledge of this ellect is important to optimize the interpretation ol lieid tracer lests The pariition is quantified by the partition coefficient K Two chemical tracers ptr-fluoromethylcydopeniane (PMCP) and perfiuoromothyicy-clohexane (PMCH) and the radioactive > 4 C labelled ethane have been studied here The two chemical compounds are new as reservoir tracers and no field results with these tracers are reported m th*j open literature Our group has. however, recently applied these compound successfully as tracers in a North Sea reservoir
MEDIDAS Y APLICACIONES DEL COEFICIENTE DE PARTICION DE COMPUESTOS ADECUADOS PARA SER INYECTADOS COMO GASES TRAZAOORES EN YACIMIENTOS DE PETROLEO
La téenica de myeccion de gases trazadores en yacimientos de petrbleo se utihza para descnbir vanaciones de la per-meabilidad in situ. A conimuacibn se presentan en estp ar-ticulo resuitados de expenmentos dmamicos de taboraiono con gazes tiazadotes Los gases trazadores Huyendo a t raves de un yacimiento sutren un rela r do al repanirse en la fase oleosa. La repariicidn entre las fases se mide por el coeficiente de particion K. Dos Irazadores quimicos. el perflurometilcidopentano (PMCP) y el pertluorometiictclo-hexano (PMCH) como también el etano marcado con , 4 C son estudiados en este articuto. Los dos trazadores quimicos son nuevos en to que respecia a su uso como trazadores en yacimtentos de petrdleo. por lo lanto no se han pubiicado aun en ta literaiura actual, tesultados de campo obtenidos con eslos tarzadores Sin embargo, nueslro grupo ha obtenido recientemenie. resuiiados exito-sos usando eslos compuestos como trazadores en yacimtentos del Mar del Norte
B
NOMENCLATURE
» l l o » cross section C . concentration of the tracer in the oil pha'-e Cg concentration of the tracer in the gas phase O dead volume at the ends of ihc slim tube £>* density of gas phase Dt density of liquid phase F, flow rale of water into injection cylinder FR fraction of time ihe tracer stays in the gas
phase ft fractional flow of gas f„ fractional flow of oil ft " f ract ional" flow of tracer A*. partit ion coefficient based on the concentra
tion ratio KP partit ion coefficient based on the mol fracuon
ratio P pressure P„ absolute pressure ( I bar) P, cr i t ical pressuie Pi convergence pressure Pr reduced pressure PV pore volume Sg gas saturation S„ oil (decane) saturation Tf reduced temperature u volumetric flow rate U*ai linear f low rate of the gas Uhq linear f low rate of the liquid phase Hit l inear f low rate of the tracer Vm volume of mobile phase Vr = retention
volume v\ volume of stationary phase .1, mole fraction of component i in liquid phase y, mole fraction of component i in gas phase Z* volume factor (compressibility ratio multi
plied by temperature ratio) Wxt weight of o i l and gas in the slim-tube to acentric factor q> porosity i.j denotes the tracer considered
1 INTRODUCTION
Application of tracers is a valuable tool to improve Ihe reservoir description Tracers have been used lo obtain information aboul flow pattern and rale of movement of injected fluids, accurate breakthrough timet and source of breakthrough, sweep improvement treatments, and large heterogeneities like fractures, barriers to flow and permeability stratifications (Bjernsiad ei al.. 1990). In large fields with several producers and injectors, it is therefore desirable to have a multiple of available tracers to enable injection of different tracers or tracer mixtures in each well.
A tracer test involves injection of a tracer slug driven by a chase fluid followed by monitoring of the tracer concentration at adjacent producers. The tracers used in Ihe reservoir will undergo a considerable dilution before entering the production well. The requirement for an actual tracer is therefore very strong with respect lo the lower detection limit. Radioaclively labelled compounds are detectable in very low concentrations and suitable labelling may give feasible tracers for reservoir purposes. The applied radioactive nuclide should have a half-life long enough to ensure that the concentration will be sufficiently maintained during the experimental period which for some tests in large reservoir can be in the range of years. The radionuclides have to be substituted into molecules which are stable under reservoir conditions. From available literature the most common tracers applied are tritiated hydrogen gas and tritiated petroleum gases as methane, ethane, propane and in some cases also butane. In these compounds one of Ihe stable hydrogen atoms is substituted with tritium. The chemical properties of these labelled compounds will not be significantly changed. An other, but more expensive labelling would be to substitute one of the carbon atoms in the compound with l 4 C . A third class of radioactive tracers is the noble gases among which 8 s K r is the most applicable. The number of applicable radioactive gas tracers is limited and it is therefore desirable to look for other suitable tracers among the non-radioactive chemical compounds.
Among candidate reservoir tracers are the cyclic perfluorocarbons (PFC). These tracers have
' " . l a . - " ' ! - U "••'•.: V.AK'D AVP!! 1 9 9 /

Mi*3UKMfNli W » MVCOION Ot MtMlOM COI"«*MS O COWfOuNOi SWUW M
•ot IUCNCo>s»«nt >^oo> nvhon
been used in environmental studies to follow air flow ( D i e » . 198?) The tracers are delectable in concentrations down to 10"" liter/liter which is comparable with ihe radioactive compounds The perfluorocarbons ire analyzed by an electron capture (ECD) detector after separation on a gas chromatographic (GC) column.
An ideal tracer will follow the traced phase closely. An eventual partitioning into other phases should not be significantly different from that of the traced phase. The demand of equal (an in fact negligible) partitioning is met by several water tracers, but for gas tracers this requirement is more difficult to fulf i l . All gases wi l l , to some extent dissolve into the oil or water phases. A knowledge of this partitioning is important in order to enable a better interpretation of the tracer response curves measured. For the petroleum gases Ihe partition coefficient (/f-value) may be estimated by equation of state (EOS) calculations when the molar composition of the petroleum phases is known.
For the new tracers studied in the present work the parameters needed for estimation of K-values (binary interaction parameters) are not known and /f-values from laboratory studies are therefore important.
Several reservoir simulators are handling tracer f low, but few have options for tracers which arc partitioning between the phases. B. Antonsen et ai, 1990, give, however, a description of simulations where partitioning tracers are used to provide a signal before water breakthrough. The increased interest in and the improvement of the simulation tools require also improved knowledge of Ihe chemical/physical interactions between the reservoir fluids and the actual tracers. Especially for gas labelling where all the tracers have a partitioning into the oil. a better knowledge and quantification of this effect is important. To enable incorporation of this effect into the model a knowledge of the partition coefficient is needed.
Decane is used as model oil in this study. The decane/methane system and also the de-cane/methane/ethane system are well known from the literature (Sage el al., 1940; Vairgos el al., 1971). The experiments presently reported have been accomplished to measure the partitioning of the three compounds 1 4 C labelled
ethane. PMCP and P M C H in the methane/decane system and N,/dccanc system
2 THEORY
2.1 Estimation* of Partition Coefficient»
The tracers in the gas phase will have a partitioning to the oil phase which causes a retention of the tracer relative to the volumetric gas flow while moving trough the reservoir. The various tracers will therefore show different mean flow rate in the reservoir. The partition coefficient is usually defined in the petroleum literature (Eq. I ) as molar relation and in chromatographic literature (Eq. 2) as concentration relation.
K - y ' Kr'-7 (I)
K'r-F- <2)
Conversion from one to the other is possible when the molar composition and the density of the two phases are known. Carts giving the /revalue for the different reservoir gases are available in textbooks (Amyx et al.. I960). These charts give Kp values as a function of pressure and temperature. The charts are based on the concept of convergence pressure which has to be estimated to enable application of the right set of curves.
In compositional reservoir simulators the partition coefficient is usually modified from an initial setting by carrying out the flash calculations. The equilibrium in a gas/oi! system is achieved when the fugacity of each component is the same in each phase. The fugacity may be calculated from the EOS. The flash calculations use the fugacity ratio to modify the K p-value in each iteration until the fugacity ratio is below a predetermined lower limit. When the tracers are radioactively labelled hydrocarbon gases Ihe Kp-value may be estimated through the flash calculation by giving the labelled compound the same Kp-value as the corresponding non-radioactive component in the oil/gas system. The tracers

96
will have no influence on the calculation since ihe concentration is negligible The A',-value of the PMCP and PMCH cannot be calculated with the aid of EOS because of lack of known values of the interaction parameters for the other petroleum components
Different authors have proposed equations to give an estimate of ihe R v a l u e Wilson. 1969. gave an expression (Eq 3) based only on properties of the component itself and not on the fluid system. Whnson. 1981. has proposed an improvement of this equation (Eq. 4) where also properties of Ihe fluid system are taken into consideration.
The Wilson equation applies the reduced temperature (7",) and pressure (P, ) and the acentric (O),) factor to calculate the partitioning coefficient {Kp, value):
exp 5.3727(1 +0),) 1
(3)
This equation should only be used for low pressures. Whitson has in addition incorporated the convergence pressure of the fluid system in the model to give a better prediction also at higher pressures.
Kn,
s < / t - N e * P 5.3727 4 (1 +0),) 1
A=A{p)=i •
P,
P-Po
(4)
(5)
2.2 M e a s u r e m e n t o f Par t i t ion C o e f f i c i e n t
The partition coefficient may be measured directly by measuring the concentration of the component in each of the two phases in an equilibrated system.
In a dynamic situation the /Rvalue can be found by measuring the retention time of the actual component. This is the method applied in the present study. Kc values can be calculated when the saturation and the retention lime is
known In i dynamic column experiment where Ihe column contains only two phases the fraction of lime (FR) the tracer slays in the gas phase may be expressed is the number of tracer molecules in the gas phase in a reference block of the column divided on the total number of tracer molecules in the same reference block
FR,= C V
C V + C V (6a)
C V C V + C V V.7-\ <°>>>
I + «•m T h e tracer is p r o d u c e d w h e n one r e t e n t i o n
v o l u m e V, has been i n j e c t e d . T h i s v o l u m e m u l t i p l i e d w i t h the f r a c t i o n o f the t i m e the t r a c e r stays in the m o b i l e gas v o l u m e is e q u a l to the gas v o l u m e in the s y s t e m ( the l i q u i d v o l u m e is s t a t i o n a r y ) .
V,
A c o m b i n a t i o n o r E q s . 6 b and 7 g i v e s :
*•<:. r,—
(7)
(8)
2 .3 Tracer F low M o d e l s
The application of tracers will not contribute to changes in the physical behaviour of the fluid in the reservoir. The tracer flow equation may be expressed on a general dimensionless form (5 = saturation, c ^ concentration, K = partition coefficient, and / = fractional f low) when dispersion is neglected (Antonsen el at.. 1990):
| [( j + ( I - s ) K ) c l + ! ; [ ( / + ( l - / ) K ) c ) J = 0 (9)
As the tracers are flowing partly in the gas phase, partly in the liquid phase, the linear velocity of the gas and liquid phases are here given as:
u'--li\ wi,,=
<-V„ =
acp
mp
(10)
( I I )

æ
As previously shown the fraction of time the tracer stays in the gas may be expresses by Eq (6a) The mean velocity of the tracer in a two-phase flow may therefore be expressed by:
u„ = '"'[t l+K, W (12)
Rearrangement gives:
7,+ *,./» o„ -Kc S* [aifj J'-[a<fj (13)
This tracer flow velocity model may be applied when the R v a l u e s are known. Fig. I gives a graphical outline o f / , for five different partitioning coefficients. The fractional flow curve for the gas (fg) is arbitrary chosen. T h e / , curves are all I at the saturation where fJS0 = / , / 5„ . i.e. when both phases are flowing with the same linear velocity. When the A^-value is 1, the tracer flow rate is independent of saturation and shape of the fractional flow curve. The / , curves plotted in the figure show that the relative flow of the tracers depends strongly on the saturation. Below the gas saturation where the two phases flow with the same linear velocity.
1.5 1.4 U 1.2 1.1
1 0.9 0.8 0.7 0.6 0.5 -0.4 0.3 -0.2 0.1
0
^ ^
•
^ - _
V •
.T.L«. :fcP : £ : 5 ° - 5
•
0.1 0.2 0.3 0.4 0.S 0.6 0.7 0.8 0.9 1 S,
Figure I
"Fractional flow" of %*\ iracer*. The /, differenl AVvalue* The /,
given for : rve v. arbitrary chosen
the lower partitioning tracers will be in front while above that saturation decreasing K, value will give increasing flow rate.
In the most simple system where the oil saturation is stationary, the S„ may be calculated from the knowledge of the partition coefficient of two tracers and the peak of the tracer response curve by Eq (14):
v, - v. + 1 (14)
A sensitivity evaluation of this equation shows that it is preferable to apply two tracers with Ai r-values far apart from each other The most efficient would be to include one tracer which has no partitioning to the liquid phase
3 E X P E R I M E N T A L M E A S U R E M E N T S
In a previous paper Dugstad el ai. I 9 9 I . have described an experimental technique to evaluate tracers under reservoir conditions. The technique applies a long slim tube packed with Ottawa sand as the porous medium. A back pressure regulator is controlling the pressure while the gas is flowing through the tube. The tube is placed in a heat cabinet to ensure a stable temperature. The tracers are added to the injected gas when equilibrium is achieved between the gas and the decane in the tube. The analytical equipment applied to monitor the (racer response was selected in order to enable detection of both the radioactive and the chemical tracers in the same experiment.
This technique has been applied to measure the retention of each tracer at various conditions. From the measurement of the retention and the oil/gas saturation the /^-values have been calculated. The calculation of the Rva lues (See Eq. 8) by Eq. (15) involves several measured values (Fr. T, D. Ws„ PV) and several values found in the literature (£>,, Ds. Z).
F,ZT,-D+ ----
PV-
Wv-JVD,
w\,- PV D, ( I S )
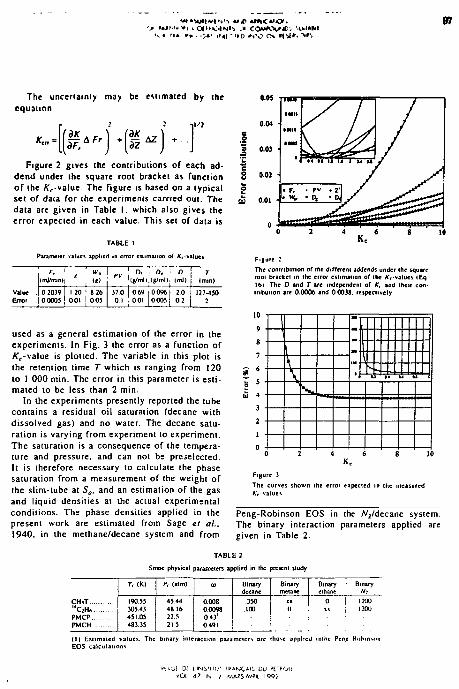
97
The uncertainly may be estimated by the equation
•.OS
*.„ = IsH*(M Figure 2 gives the contributions of each ad
dend under the square root bracket as Function of the K f -value The figure is based on a typical set of data for the experiments carried out. The data are given in Table I . which also gives the error expected in each value. This set of data is
TABLE I
Parameter values applied tn error estimation of l v a l u e s
Value Error
0 2039 I 20 ' 8 26 00005 001 i 00S
Di i D, i O Mg/mlhlg/ml) imll
370 069 0096 0 1 | 001 0005
T tmin)
127-150 2
used as a general estimation of the error in the experiments. In Fig. 3 the error as a function of r? c-value is plotted. The variable in this plot is the retention time T which is ranging from 120 to 1 000 min. The error in this parameter is estimated to be less than 2 min.
In the experiments presently reported the tube contains a residual oil saturation (decane with dissolved gas) and no water. The decane saturation is varying from experiment to experiment. The saturation is a consequence of the temperature and pressure, and can not be preselected. It is therefore necessary to calculate the phase saturation from a measurement of the weight of the slim-tube at Sar and an estimation of the gas and liquid densities at the actual experimental conditions. The phase densities applied in the present work are estimated from Sage el al, 1940, in the methane/decane system and from
Figure 2 The contribution of the different addends under (he square root bracket in the error estimation of the AVvalues tEq 161 The D and 7" are independent of K, and their contribution are 0.0006 and 0 0038. respectively
1 IN i i i - i — | 1 1 1 1 1—|
1 : t : : : : : : : : : 1 V mt V
5* \ \ ' J U «• 14 U
rror
^ V .
0 •
Figure 3
T h e curves shown (he error expected in the measured /( . -•value*
Peng-Robinson EOS in the A^/decane system. The binary interaction parameters applied are given in Table 2.
T A B L E 2
Some physical parameter* applied in the present study
T , (K ) P, (aim) UJ Binary Binary Binary Binary decane metane ethane <v>
C H i T 19055 45.44 0.008 .350 ( X 0 1200 "ftH. 305.43 48 16 0 0 0 9 8 .100 II I X 1201) P M C P 451.05 22.5 0 4 3 1
P M C H 483 35 21 5 0 491
( I ) Est imated values. The binary i n f r a c t i o n parjmeters are those jpp l tcJ inthc Peng Rohirw EOS ca lcu lannn*
••ul Di l i N S ' i l . J ' IP ANC Ai i DU PEIP Oi l vOt d ? N i r/APS AVPll IQQ 'i

i, #. J I M 1 I ' | | ? . » ; O ( J K W J * . . W »
»
The iV r-values of the tracers under the Iwo injection regimes are expected lo be slightly different because of considerable differences in the chemical interactions when methane is exchanged with nitrogen. The solubility of methane in decane is higher than ihe solubility of Nj in decane. As an example ihe mole fraction of methane in the liquid phase is as high as 0 5 ai a temperature of 120°C and a pressure of 250 bar (Table 3). The mole fraction of nitrogen at the same conditions is 0.24 (estimated by Peng-Robinson EOS).
250 bar the X,-values are increasing with ihe temperature
The ethane is following ihe same trend as ihe PFC's. but the declination of ihe /f,-curve with increased pressure is less sleep At lower pressures ihe ethane has a lower retention than the PFC's This implies a lower Af,-value. Al Ihe highest pressure (250 bar), however, the PMCP is less retained than ihe ethane
Molar composition of Ihe liquid phase under nitrogen and melhane injection
100 bar. S0°C 250 bar. 120°C
0 12 01*
0 87 0 76
010 051
070 0 «
The three tracers studied are the radioactive tracer l 4 C labelled ethane, and the two chemical tracers perfluoromethylecyclopentane (PMCP) and perfluoromethylecyclohexane (PMCH) . the so-called PFC tracers. The tritiated methane molecule is used as a reference tracer. The slim-tube technique is not very accurate for estimation of low partition coefficients like that for the methane. Petroleum components as methane and ethane can. however, be estimated from the EOS.
Experiments have been carried out at 100. 150. 200 and 250 bar and at the three temperatures 80. 100 and I20°C.
4 R E S U L T S A N D D I S C U S S I O N S
Two typical tracer response curves are shown in Figs. 4 and 5. The / f r -value measurements are listed in Tables 4 and 5. The results are also plotted in Figs. 6 -11 .
A decrease in the /^-values for the PFC's with a factor of 2-2.5 is measured when the pressure is increased from 100 to 250 bar. At the two lower pressures (100 bar and 150 bar) a decrease in the /^-values for the PFC's when the temperature is increased is also measured. At the higher pressure this trend, however, is less significant, and under melhane injection at
1.2 1.6 2 Relative time
Figure 4 Tracer response curves of methane, eihane PMCP and PMCH al I00°C and 200 bar under melhane injection. S„ = 2 4 *
0.8 1.2 1.6 2 Relative time
Figure 5 Tracer response curves of melhane. eihane PMCP and PMCH at l(K)"C and 201) bar under nitrogen injection S„ * 2.Ml

t i r , * ,<(-; ^ •( v |^ . ; . f
69
TABLE 4 TABLE 5
A. t a lu t t tn Ihc mcihaiw/decar* \ y * i * m a r - ta lurt in iNc ruiiofcnrdecanc t t u c m
W C 80"C
B i r 1 100 ! ISO r 200 250 Bar ; too 1 150 ' 200 250 C i H a : ; s i 1 ' " 105 106 C ; H , 1 6 ) 1 53 13» 1 24
P M C P ' 2 42 1 7 6 1 17 107 P M C P ! 2 45 i ' ' > 1 ) 2 124 P M C H l J 08 | 2SS 167 1 J7 P M C H i 4 J 7 | 3 0 ) 113 1 ( 0
I00«C lore Bat i IO» ! iso 200 250 Bar 1 100 ' 150 200 250 C j H » 1 69 1 36 1 ) 5 1 2 8 C l H . 1 l 4 9 145 1 ) 9 1 27 P M C r 2 53 1 "' 1 51 1 29 PMCP 1 2 16 1 51 1 37 1 21 P M C H 3 9 0 1 282 2 02 1 59 P M C H 3 78 ; " 2 , 4 1 72
I 2 C C I20°C
Bar | 100 1 ISO 200 2S0 Bar i 100 IM1 200 2S0 O H . 1 6 2 1 26 1 29 137 C:H» 153 1 27 1 ) 1 103 P M C P 2 27 ' 1 59 1 41 1 4 2 P M C P 2 16 1 47 146 0 9 6 P M C H 5 43 1 2 2J 1 84 164 P M C H 154 2 " 2 0 0 1 42
From a comparison of the nitrogen and methane injection it is seen that at the lowest temperature the K r-values under the nitrogen injection is higher than for the methane injection, but when the temperature is increased to I20°C this effect is no longer significant.
The K f-values measured may be compared with available Kp charts for ethane found in the literature. According to M.J. Rzasa el al., 19S2. the convergence pressure applied for our experiments should be approximately 5000 psia. Rzasa
ei al. have developed charts which give the convergence pressure as a function of temperature when the product of m o d u l a r weight and specific gravity at 60°F for the hepthane + fraction is known. In our experiments the hepthane + fraction is pure decane.
Converting the measured R va l ues to Upvalues has been carried out for the methane/de-cane system. These calculations are based on interpolation of molar composition data obtained from Sage el al., 1940.
-- • sire * 100'C • 120'C
---
100 ISO 200 Pressure (bar)
Figure ft
The if, -value of ethane under methane injection
— 1
—
• SO'C • 100 'C • 120 'C
-
. .._... _ — . .._... _ —
— = = ^ ^ : —
100 150 200 Pressure (bar)
Figure 7 The A. \ j l u c \ of ethane under nurngcn mjcctttin
vOi A7 IN-' 3 MABV, Avfrii i o o ;
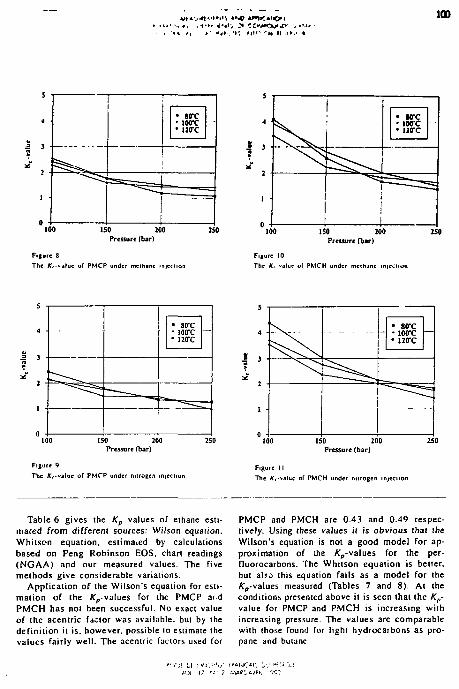
100
• wrc • iwc • litre
X X
0 •
• I •• -1 ISO 200
Pressure (bar)
Figure 8 The AVtalue of PMCP under methane injecn
250
1
1 1 • tore • IOCC • uirc
1
• —
100 ISO 200 Pressure (bar)
Figure 10 The K, value of PMCH under methane infection
150 200 Pressure (bar)
Figure 9 The AVvalue of PMCP under nitrogen injection
^ N ^ N • wrc - 100T • 120-C
-
^ N
^ ^
100 ISO 200 Pressure (bar)
Figure 11 The AVvaluc of PMCH under nitrogen injection
Table 6 gives the Kp values oT ethane estimated from different sources: Wilson equation. Whitson equation, estimated by calculations based on Peng Robinson EOS, chart readings (NGAA) and our measured values. The five methods give considerable variations.
Application of the Wilson's equation for estimation of the /^-values for the PMCP aid PMCH has not been successful. No exact value of the acentric factor was available, but by the definition it is, however, possible lo estimate the values fairly well. The acentric factors used for
PMCP and PMCH are 0.43 and 0.49 respectively. Using these values it is obvious that the Wilson's equation is not a good model for approximation of the /Vp-values for the per-fluorocarbons. The Whitson equation is better, but also [his equation fails as a model for the Kp-values measured (Tables 7 and 8). At the conditions presented above it is seen that the revalue for PMCP and PMCH is increasing with increasing pressure. The values are comparable with those found for light hydrocarbons as propane and bulane
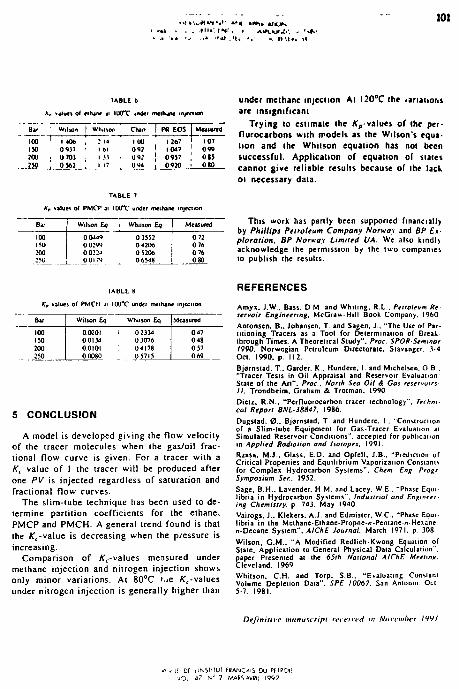
..* ''«it . »U '«' * ft •>!»
101
Bar
1ABLE D
values of «iKarw «1 IllCC umki mclhanc inieciion
Wilson ( Whilson ! C h a r t [ Pfi EOS i Measured
-r 100 1406 150 0°37 20U > U 70) 250 I 0)62
: 14 I 00 I 267 107 161 042 ' 1047 ' 099 I 3.1 092 I 0957 ,' 015 I 17 0 94 1 0920 ! 0 80
TABLE 7
Kp values of PMCP ai iO0"C under methane injection
100 150 200 250
Wilson Eo. Whilson Eq
0 0449 00299 00224 0 0179
0 3552 04206 0 5206 0 6548
0 72 0 76 0 76 080
under methane injccuon Al I20°C Ihe .arijnor.s
are insignificant
Trying 10 estimate the K,-values of Ihe per-
flurocarbons with models as the Wilson's equa
tion and Ihe Whilson equation has not been
successful. Application of equation of stales
cannot give reliable results because of Ihe lack
01 necessary data.
This work has partly been supported financially by Phillips Petroleum Company Norway and BP Exploration. BP Norway Limned UA. We also kindl> acknowledge the permission by ihe two companies 10 publish the results.
TABLE 8
K, values of PMCH it I00UC under melhane injection
Bu Wilson Eq Whilson Eq. Measured
100 150 200 250 m
i 047 0.48 0.57 069
5 CONCLUSION
A model is developed giving the flow velocity
of the tracer molecules when the gas/oil frac
tional flow curve is given. For a tracer with a
Kc value of I the tracer wit! be produced after
one PV is injected regardless of saturation and
fractional flow curves.
The slim-tube technique has been used to de
termine partition coefficients for the ethane,
PMCP and P M C H . A general trend found is that
the /s?f-value is decreasing when the pressure is
increasing.
Comparison of /jfc-values measured under
methane injection and nitrogen injection shows
only minor variations. At 80°C f .e ^ -va lues
under nitrogen injection is generally higher than
REFERENCES
Amyx. J.W.. Bass. D M and Whiltng. R.L.. Petroleum Re strvoir Engineering, McGraw-Hill Book Company. I960
Antonsen, B.. Johansen. T. and Sagen, J.. "The Use of Partitioning Tracers as a Tool for Determination of Breakthrough Times. A Theoretical Study". Proc. SPORSemmar 1990, Norwegian Petroleum Directorate. Siavanger. V4 Oct. 1990. p. 112.
Bjørnstad. T., Garder. K , Hundere. I. and Michelsen. O B . "Tracer Tests in Oil Appraisal and Reservoir Evaluation-State of the A n " . Proc.. North Sea OH A Cos reservoirs-II. Trondheim. Graham & Trotman, 1990
Dietz. R.N.. "Perfluorocarbon tracer technology". Technical Report BNL-38847. 1986.
Dugsiad, 0 . . Bjørnstad. T and Hundere. I . "Construcuon of a Slim-lube Equipment for Gas-Tracer Evaluanon at Simulated Reservoir Conditions'*, accepted for publication in Applied Radiation and Isotopes. 1991.
Rzasa. M.J.. Glass. E.D. and Opfell . J.B.. "Prediction of Critical Properties and Equilibrium Vaporizanon Constants for Complex Hydrocarbon Systems". Chem Eng Progr Symposium Ser.. 1952.
Sage, B.H.. Lavender. H.M. and Lacey. W.E., "Phase Equilibria in Hydrocarbon Systems". Industrial and Engineering Chemistry, p. 713. May 1940.
Vairogs, J.. Kickers. A.J. and Edmister. W.C.. "Phase Equilibria in the Methane-Eihane-Propne-n-Pentane-rt-Hexane-n-Decane System". AlChE Journal. March 1971. p. 308 Wilson, G . M . . "A Modified Redlich-Kwong Equation of State. Application (o General Physical Data Calculation". paper Presented at the 65th National AlChE Meeting. Cleveland, 1969.
Whilson. C.H. and Torp. 5.B.. "Evaluating Constant Volume Depletion Data". SPE I0067. San Antonio. Oct 5-7, 1981.
Definitive manuscript rvcetwtl in Novcmher / V W
Of , iNSniUl FRANCES Du PflPOi: ,"jt a? N'1 ? MACS AVPlI IOQ?
UB
fWTIB 4
Su&nitced fov publ i ca t ion Journal ol Petroleum Selene* t Cnaw—ring
Perfluorocarbon tracer studies at the Gullfaks field in the North Sea.
Eva Ljosland3, Tor Bjørnstad .̂ Øyvind Dugstadb and Ingleiv Hundereb
a Statoil Drifudivisjon, Bergen, Norway
b Institutt for energiteknikk, Kjeller, Norway

HB
Abstract
The Gullfaks Held in ihe North Sea is a complex reservoir with oil production from five
differem formations. The field is laterally divided into nearly 40 fault blocks with
varying degree of communication. The main production strategy is pressure
maintenance above bubble point by water injection. A WAG pilot was started in spring
1991. To improve the evaluation of the WAG pilot it was decided t? inject tracers in
the gas phase at the start of the first two gas injection periods. The WAG pilot will
form the basis for the decision on full field WAG. The tracers applied were two non
radioactive chemical tracers, perfluoromethylcyclopeniane (PMCP), and
perfluoromethylcyclohexane (PMCH), previously not used in field reservoir studies.
Exiensive laboratory testing where the compounds are studied in dynamic flow
experiments under reservoir conditions are, however, reported. The compounds are
measured in samples of produced gas and oil by gas chromatography (GC) in
connection with an electron capture detector EC. The compounds have a higher
partitioning to the oil phase than the ideal tracer tmiaied methane, causing a minor
retention of the tracer with respect to the average gas velocity in the reservoir. The
tracer results are valuable contributions to the interpretation of the WAG pilot
mechanism and the communication in the area.
IM
I Introduction
1.1 The Guliraks Field
The Gullfaks field in the North Sea, put on production in December 1986, is an
unsaturated oil field containing recoverable reserves of 2.3* 10" Sm3 of oil. and
2.5* 10 1 0 Sm 3 of associated gas. Three main separate Jurassic sandstone reservoirs are
active, the Brent group, and the Cook and Statfjord formations (Fig. I) Heavy faulting
divides the field inio nearly 40 fault blocks (Fig. 2).
The original field development plan specified five reservoir zones to be developed
separately, Tarben, Ness, Lower Brent (comprising Elive and Rannoch formations).
Cook and Statfjord. Presuming sealing faults, the number of reservoir units to be
handled separately was huge. The main drive mechanism was pressure maintenance by
water injection from day one (Petterson et al. 1989).
After a short production history it was obvious that the faults represented varying
degree of communication. In the current reservoir development plan observed
communication is taken into account, and the number of separately handled reservoir
units is reduced to 12. Several wells are planned for commingled production or
injection between two to three of the five originally separate reservoir zones. Still, the
total planned number of wells is approximately one hundred.
The complexity of the reservoir development justified an extensive data acquisition
program comprising, in addition to the standard methods, permanent down hole
pressure and temperature gauges in each reservoir and major fault block, and a waier

106
tracer program started when the first water injection well was put on stream (ftogde
1990)
From the production data it was obvious that the field had a typical lower Brent water
flood behaviour. The highly permeable Etive formalion caused water override despite
all the Lower Brent production and injection wells were perforated in the Rannoch
formation only. The result was high water cuts and reduced oil rates from each well.
The possibility of enhanced recovery in pans of the field by creating a secondary gas
cap became apparent in 1990. The WAG pilot was started in spring 1991.
The WAG pilot will form the basis for the decision on full field WAG. Data on its
performance are therefore of major importance. Particularly in a complex field like
Gullfaks, with ambiguous interpretation of production performance, supplementary
data acquisition methods are found very useful. One pan of the extensive data
acquisition during the WAG pilot was the injection of water tracers and gas tracers.
1.2 Description of the WAG Strategy and the Injection Area
The WAG pilot is confined to one fault block in the central Gullfaks A area, (Fig. 3).
The target for improved recovery is primarily attic oil in the Lower Brent. The Ness
formation above Lower Brent is also influenced, through a minor fault between the
injector and the main recipient.
The alternating injection of water and gas is performed in well A-11, a previous Lower
Brent water injector perforated in the water zone in the lower pan of the Rannoch
formation (Fig. 4). Due to low permeability in the lower Rannoch combined with the
necessity of high injection rates to maintain pressure, the well was deliberately

106
hydraulically fractured when pu! on stream in November 1987
The main recipient is A-10, a Lower Brent oil producer perforated in Rannoch. Well A-
19, a Ness producer, is located between the two Lower Brent wells. The injection of a
water tracer in A-11 before the WAG was started confirmed Lower Brent injection
water breakthrough in the lower pan of Ness in A-19. Although not a part of the WAC
strategy, A-19 has provided a splendid observation well for the tracer performance.
The WAG program was implemented from March 1991 through March 1992 . There
have been three gas injection periods, each of a duration of between two and three
months (Fig. 5). To maintain material balance the gas injection rate was kept fairly
constant at 1.5 mill. Sm3/day during all the three gas injection periods, except for
minor rate variations caused by operational circumstances.
The tracer program comprised two injections of water tracer and two injections of gas
tracer. The water phase was labelled with HTO in July 1990, and relabelled with CI-36
in February 1991. The gas phase was labelled with new gas tracers of the perfluorinated
type short after each of the first two gas injection periods were started. Apart from a
test injection in the Ekofisk field in 1986, the present tracer test represents the first
serious attempt to apply this kind of gas tracers in well-to-well examinations.
2 Chemical Gas Tracers in Previous Field Application
Traditionally, reservoir gas tracers have been radioactively labelled substances due to
very low detection limits and chemical compatibility with reservoir gases

107
The most extensively applied radiotracer has been tniiited methane, CH3T. but even
minted versions of hydrogen, eihane. propane and butane have been reported used In
addition to ihe radiolabeled natural gases (which also may be labelled, more
expensively, with l 4C). the noble gas nuclide 8 5Kr has found some use due to suitable
half-life and acceptable performance (Bjørnstad 1991).
The application of non-radioactive gas tracers has been limited. The main reason is the
lack of sufficiently substantial preparative laboratory studies dedicated to describe the
tracer behaviour under reservoir conditions, and improvements in analytical techniques
for tracer analysis in reservoir fluids.
The last years, however, a few reports are published on the use of chemical tas tracers.
Except for a very early report on the use of helium gas (Frost 1946), the main interest
has been on halogenaied molecules and on poly- and perhalogenated hydrocarbons in
particular. The reasons are their chemical, thermal and microbial stability, their low
natural background and their high detectability by gas chromatography separation
followed by electron capture detection (GC/ECD).
Among the halogenaied compounds in general, sulphurhexafluoride, SF6, has become a
safe choice. It has been used in field investigations by several authors of which the
following may be a representalive selection:
1. By Langston and Shirer (1985) to trace injected N2 in a WAG project at the
Jay/LEC field in Florida panhandle and south Alabama,
2. by Craig (1985) to identify the source of produced CO2 in a field-wide
miscible flood project in the Alvord South Unit in Wise County, Texas,
3. by Omoregie ei al. (1987) to evaluate and optimize a hydrocarbon miscible flood

108
project ai the Musue Gilwood Sand Unit No. I in Slave Lake. Alberta
•1. and by Tang and Harker (1991) as a conservative (racer in an inierwell
measurement of residual oil saturation in the carbonate reservoir Golden Spike
D3 "A" Pool close to Edmonton. Alberta.
Freons of various compositions have also been applied successfully: Omoregie et al al.
(1987) have used Freon-11 (CCI3F) and Freon-12 (CCI2F2). Craig (1985) has used both
Freon-l 1, Freon-12 and Freon-113 (C2CI3F3) while Tang and Harker (1991) have used
Freon-12 and Freon-13B1 (CBrF3).
The field tests of both Craig and Tang and Harker were based on extensive laboratory
studies on the tracer behaviour at simulated reservoir conditions by application of slim-
tube flow-rig facilities.
While there was ambiguity in the results of Freon-113 (due to contamination), the
others performed satisfactory. The field experience indicates that Freon-11 travels with
very nearly the same speed as methane while SF6 moves somewhat faster. The rate of
movement is largely a function of the oil/gas partition coefficient.
For the tracer compounds mentioned above, one may preliminary conclude that SF6,
will probably remain to be an applicable gas tracer in tests where the well spacing
(dilution volume) is not too large and where tracer enrichment is rjoj needed in the
produced gas samples. In contrary, due to environmental considerations, serious
restrictions are expected on the use of chlorine-containing freons. On this basis and the
fact that the North Sea oil and gas reservoirs are relatively large, it has been of highest
interest to search for substitute tracers with acceptable performance under North Sea
reservoir conditions.

UB
One class of interesting possibilities is the perfluorinated cyclic hydrocarbons, the so-
called PFCs, partly due to exceptionally low detection limits, partly to their proven
inertness in previous atmospheric transport experiments (R.N. Dietz 1986).
A few years ago, an introductory test injection was performed in the Ekofisk field in
the North Sea where only 50 grams of each of the PFCs perfluoromethylcyclopentane
(PMCP), perfluoromethylcyclohexane (PMCH) and perfluorodimethylcyclohexane
(PDCH) were injected. Weak signs of breakthrough were found for all three
compounds in the nearest production wells (I. Hundere 1989), but the data was too
sparse to enable derivation of production profiles. In addition, a serious contamination
problem made the interpretation of the analytical results difficult.
A succeeding single-well push-and-pull test was made in the Gullfaks field in an
attempt to measure gas storage capacity and sealing efficiency of a specific rock
formation (Ljosland et al., 1989) Although analytical responses were good, some
analytical difficulties were experienced especially for samples of wet gas.
These introductory tests led to a series of dedicated laboratory studies of these tracers
both with respect to their dynamic properties at reservoir conditions and their analysis
in samples of collected reservoir fluids. Today, this technology has progressed to a
point where efficient field application is possible, and the present article is the first,
though preliminary, demonstration of this new achievement.

110
3 I'FC Tracer Technology
3.1 General
As mentioned above, the PFC tracer technology is well established as a tool in
atmospheric transport studies (R.N. Dietz 1986), in house ventilation examinations
(R.N. Dietz et al 1983) and even in groundwater (CM. Thompson et al. 1974) and
marine (A.S. Watson et al. 1986) tracing and water mixing processes (E. Fogelqvist et
al. 1984). For use in water, an emulsion procedure is needed due to very low direct
solubility.
The success of the PFC compounds is mainly due to high deiectability and chemical
inertness. Molecules with a cyclic structure and with one or more c-.'iphatic branches
attached (like PMCP, PMCH and PDCH and others) are those which are most sensitive
to electron capture (EC) detection. In addition, they are non-flammable and, as far
known, nontoxic.
3.2 Dynamic Behaviour at Reservoir Conditions
In a petroleum reservoir the surrounding conditions are different from those in the
surface geosphere. Higher temperature and pressure, the existence of various reservoir
fluids and minerals, a different microbial environment etc. put additional sixains on the
tracer. A good behaviour at surface conditions cannot be extrapolated to reservoir
conditions.
By definition, an ideal (or passive) tracer should follow the traced fluid completely.
Since natural gas is a mixture of different molecular components, each with their

U l
individual values on diffusion and partition coefficients, no single gas tracer can be an
ideal tracer for naiural gas. However, CH3T, has for all practical purposes the same
physical and chemical behaviour as the CKi-component in natural gas (like the
corresponding tritiated versions of the higher homologues behave like their non
radioactive molecules). Accordingly, CH3T may be regarded as an ideal tracer for CH4.
In fact, CH3T has become a reference tracer against which all other tracer candidates
for natural gas movement are compared in laboratory experiments.
CH4 has, however, a considerable partitioning to the oil. The CH3T tracer will
therefore be delayed in the reservoir with respect to the mean linear gas velocity. The
delay is a function of the oil saturation and partition coefficient K (K = Co/Cg). The
value of K changes with changing reservoir conditions.
Thus, the main requirement to a gas tracer of the PFC type is that its behaviour should
not be too different from methane and its light homologues.
Even if several of the cyclic PFCs may be applicable as reservoir tracers, we have in
the present field test used only PMCP and PMCH. Some physical characteristics are
given in Table 1. These molecules are extensively tested against CH3T (and 14CH3CH3) in laboratory experiments at simulated reservoir conditions (0. Dugstad et
al. 1991 - 1992). Like all other gases, they partition between the reservoir fluids. While
the partitioning to the water is negligible, it is considerable to the oil phase, and in
contrary to CH3T, the K-values generally decrease with increasing pressure. At
pressures of 200 bar, K-values considerably below 1 have been measured for reservoir
oil. The temperature has a minor influence on the K value. Considering the gross
dynamic behaviour of the tracers in slim-tube experiments at simulated reservoir
conditions, the break-through of the methane tracer at moderate pressure appears before
112
the ethane tracer followed by PMCP and PMCH. Increasing pressure to 250 bar leads
to a convergence of the tracer retention peaks with (he PMCP peak now appearing
between the peaks of the two hydrocarbon gases.
3.3 PFC Delegability
Dietz et al. report the lower detection limit of PMCP and PMCH in air samples to be
less than a femtoliter per liter (10-151/1) with packed colunm gas chromatography and
electron capture detection. This low limit is achieved after enrichment of the tracer
from the air sample by selective absorption on activated carbon followed by a thermal
desorption in a carrier gas directly into the GC.
For reservoir gas samples, however, the hydrocarbon gas components may cause some
difficulties: Lowering of the capacity for selective absorption of PFCs of the activated
carbon trap (so-called CATS) by reversible hydrocarbon absorption, surface coverage
of the absorbent by wet-components in the gas, chromatographic disturbances from
hydrocarbon components etc. Methods have recently been developed (G.I. Senum et al
1989) where hydrocarbons are removed by catalytic combustion followed by
absorption traps for the combustion products prior to the CATS and GC analysis. The
methods applied in the present work, are modifications of the one mentioned and will
be described more closely in section 4.3 below.

113
4 Experimental
4.1 Tracer Injection
Two tracer injections have been carried out in well A-11. The first tracer, PMCP. was
injected on March 20. 1991 (see tracer data in Table 2) in the start of the first gas cycle
in the WAG injection program (Fig. 5). Approximately 10 kg (5.8 1) of the tracer was
injected as a single pulse at constant injection rate within 7 hours which gives a rate of
15 cc/min (the injection system is schematically illustrated in Fig. 6). The gross gas
injection rate in this period varied from 62.000 Smtyh to 70.000 Sm3/h. The well-head
pressure was about 270 bar. To ensure a complete removal of the tracer from the
injection system, the equipment was flushed with hexane to rinse the tubing and the
tracer reservoir container. In the main gas injection stream the PMCP will be diluted to
a concentration of approximately 10 ppm.
The second tracer injection in well A-11 was carried out on August 27, 1991, during
the next gas cycle after a water injection period of 2 months. Due to difference in
detectabilily between PMCP and PMCH a total of 30 kg of PMCH was injected. The
injection time was 80 min at a constant rate of 270 cc/min. The gas injection rate
during tracer injection was 62.000 Sm3/h.
The initial reservoir temperature at Gullfaks was approximately 70 °C. Due to the
injection of cold sea water the formation was however cooled down to approximately
30 °C in the vicinity of the injector at the time the WAG started.
IM
4.2 Sampling
The tracer partitioning between the gas and the oil phases will continuously change as
the pressure is released through the tubing. Samples are collected from the test
separator at 70 bar. The separator temperature changes with well. In principle, the
partition coefficient will have a specific voire at these conditions at equilibrium. If this
value was known and the corresponding GOR was continuously logged, sampling of
the gas phase only would have been sufficient to monitor the actual tracer producrion
rate. Because of high flow rates and improper mixing in the production tubing,
equilibrium cannot be gu-rameed. Accordingly, simultaneous sampling from both the
gas and the oil phases is recommended and implemented. 500 cc samples of both
phases at separator conditions are collected at approximately 2 weeks interval, and
stored separately in pressurized containers before transportation to the IFE laboratories
for analysis.
Several production wells around the WAG injector are sampled although the most
frequent sampling is done from well A-10 and A-19.
4.3 Analysis
Two methods are applied for analysis of PMCP and PMCH in gas samples. The first
and most work-demanding for expected tracer concentrations in the range < 10"1' 1/1
and the second and simplest for expected concentrations > 10"" 1/1. In the first method
the sample gas is directed, together with a surplus of oxygen, through a column filled
with the catalyst V2O5 kept at a temperature of 400 C C (Fig. 7). By this treatment the
disturbing hydrocarbons are oxidized to CO2 and water while the PFCs are passing
unaffected. The water produced in this combustion process is condensed in a cooling"

llfi
trap The remaining mixture of CO2/O2/PFCS passes a bed of activated carbon (CATS)
which selectively collects the PFCs. After a measured amount of gas has been
combusted, the PFCs are rapidly thermaily desorbed from the CATS into a high-purity
nitrogen stream by flush-heating to 400 °C and transponed directly to the injection port
of the HP 5860 GC equipped with a packed chromatography column and an electron
capture detector. The safe application of this method requires extensive rinsing of the
upconcentration equipment between each sample.
The decontamination, especially of PMCH, has proved to be rather time consuming.
Therefore, a simpler method is applied for higher concentrations where enrichment
steps are not required. The natural gas containing tracer is released from the sample
cylinder and led through an autosampler which injects 5 cc of the sample directly into
the GC column. This method gives a reproducibility of parallel samples of
approximately 10%.
The oil samples cannot be analyzed directly. The gas dissolved in the pressurized oil is
expanded into a polyethylene (PE) bag of some 201. The remaining dcpressurized oil
in the sample cylinder is then stripped with nitrogen by bubbling a stream of 50 cc/min
through the oil which is now heated to 80 °C. A total niuogen volume of 6 1 is applied.
The strip gas is directed to the same PE-bag and mixed with the natural gas. The
volume is measured. The gas in the bag is now analyzed with respect to PFC
concentrations by the same methods as described above for gas samples.
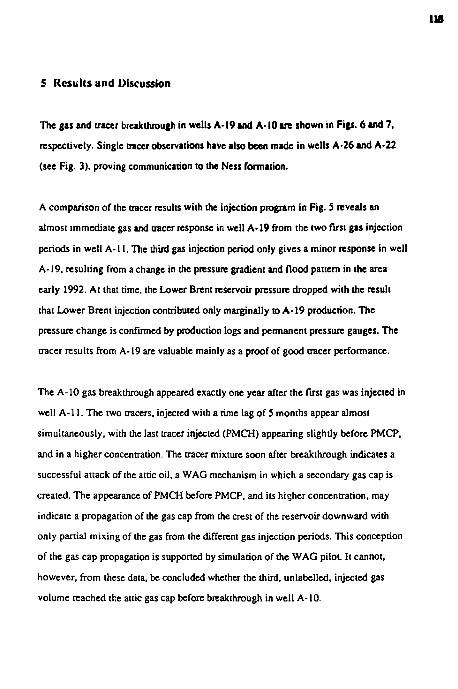
116
5 Results and Discussion
The gas and tracer breakthrough in wells A-19 and A-10 are shown in Figs. 6 and 7.
respectively. Single tracer observations have also been made in wells A-26 and A-22
(see Fig. 3), proving communication to the Ness formation.
A comparison of the tracer results with the injection program in Fig. S reveals an
almost immediate gas and tracer response in well A-19 from the two first gas injection
periods in well A-11. The third gas injection period only gives a minor response in well
A-19. resulting from a change in the pressure gradient and flood pattern in the area
early 1992. At that time, the Lower Brent reservoir pressure dropped with the result
that Lower Brent injecdon contributed only marginally to A-19 production. The
pressure change is confirmed by production logs and permanent pressure gauges. The
tracer results from A-19 are valuable mainly as a proof of good tracer performance.
The A-10 gas breakthrough appeared exactly one year after the first gas was injected in
well A-11. The two tracers, injected with a time lag of 5 months appear almost
simultaneously, with the last tracer injected (PMCH) appearing slightly before PMCP,
and in a higher concentration. The tracer mixture soon after breakthrough indicates a
successful attack of the attic oil, a WAG mechanism in which a secondary gas cap is
created. The appearance of PMCH before PMCP, and its higher concentration, may
indicate a propagation of the gas cap from the crest of the reservoir downward with
only partial mixing of the gas from the different gas injection periods. This conception
of the gas cap propagation is supported by simulation of the WAG pilot. It cannot,
however, from these data, be concluded whether the third, unlabelled, injected gas
volume reached the attic gas cap before breakthrough in well A-10.
117
6 Conclusions
ln conclusion, the Gullfaks WAG Held tracer test indicates near ideal tracer
performance of PMCP and PMCH for the gas phase. This conclusion is drawn from the
results from observation well A-19.
PFC tracers in field samples are easily measured in concentrations down to 10'" 1/1
without upconcentration and time-consuming preparation of the samples. This detection
efficiency gives reliable tracer breakthrough curves. In the well A-19 concentrations as
high as 2.9 10"' l/I is measured in the gas phase.
The tracer results from the main WAG recipient well A-10 have contributed to the
interpretation of the WAG improved recovery performance.
The ongoing sampling and analysis program are expected to further clarify
communication paths and the final WAG interpretation.
Tracer observations made in other neighbouring wells have verified former unproved
communication paths. Data on communication is generally of major importance in a
complex reservoir like Gullfaks.

118
Acknowledgment
We gratefully acknowledge Norsk Hydro .Saga Petroleum and Statoil for the
permission to publish the field data in (his paper.
References
Bjørnstad T. , "Selection of Tracers for Oil and Gas Reservoir Evaluation", Technical
Report, IFE/KR/E-91/009. Institutt for energiteknikk, Kjeller (1991), 43pp.
Craig F.F., "Field Use of Halogen Compounds to Trace Injected CO2", SPE 14309,
1985.
Dietz R.N., Goodrich R.W.. Cote E.A. and Wieser R.W., "Brookhaven Air Infiltration
Measurement System (BNL/AIMS), Description and Application". BNL-33846,
1983, 14 pp.
Dietz R.N., "Perfluorocarbon Tracer Technology, BNL-38847, 1986, 24 pp.
Dugstad 0., Bjørnstad T. and Hundere I.A., "Construction of a Slim-Tube Equipment
for Gas Tracer Evaluation at Simulated Reservoir Conditions", Appl. Radiat.
Isot., 43, (1992) 527-535.
Dugstad 0., Bjørnstad T. and Hundere I.A., "Measurement of Gas Tracer Retention
under Simulated Reservoir Conditions", presented at the EAPG Conference,
Florence 1991.

119
Dugstad 0 , Bjørnstad T and Hundere I.A.. "Measurements and Application of
Partition Coefficients of Compounds Suitable for Tracing Gas Injected Into Oil
Reservoirs". Revue de f'nstitut Francais du Petrole. 47(2), (1992) 205-215.
Fogelgvist E., Krysell M. and Øhmann P., "Evaluation of Perfluoromethyldecalin as a
Deliberate Tracer for the Study of Water Mixing Processes". Marine Chem., 26,
(1989) 339-349.
Frost E.M., Jr, "Helium Tracer Studies in the Elk Hills, Calif., Fields", Bureau of
Mines Research Report BM-RI, 3897, 1946, 6pp.
Hundere I., Garder K., Senum G., Unpublished results, Institutt for energiteknikk,
Kjeller, 1989.
Langston E.P. and Shirer J.A., "Performance of Jay/LEC Fields Unit Under Mature
Waterflood and Early Tertiary Operations", J. Petr. Tech. (Feb. 1985) 261-268.
Ljosland E., Hundere I. A., Bjørnstad T., Senum G., Unpublished results, Statoil,
Driftsdivisjon Bergen, and Institutt for energiteknikk, Kjeller, 1989.
Omoregie Z.S.,Vasicek S.L., Jackson G.R. and Martinson L.A., "Monitoring the
Mitsue Hydrocarbon Miscible Flood,- Program Design, Implementation and
Preliminary Results, Paper No. 87-3806 presented at "The 38th Annual Technical
Meeting of the Petroleum Society of CIM", Calgary, June 7-10, 1987.
120
Pciierson. O . Siorli A.. Ljosland E. and Massie I. "The Gullfaks Field Geology and
Reservoir Development". Nonh Sea Oil & Gas Reservoirs, II, Graham &
Troiman, 1989, 67-90.
Rogde S.A., "Inicrpreiaiion of Radioactive Tracer Observations in the Gullfaks Field".
Paper presented ai the "International Energy Agency Symposium on Rest- voir
Monitoring", Paris, October 8, 1990.
Senum G.I., Cote E.A.. D'Ottavio T.W.. Dietz R.N., "Hydrocarbon Precombusting
Catalyst Survey and Optimization for Perfluorcarbon Tracer Analysis in
Subsurface Tracer Applications", BNL 42769, May 1989, 34 pp.
Tang J.S. and Harker B., "Interwell Tracer Test to Determine Residual Oil Saturation
in a Gas-Saturated Reservoir. Pan II: Field Applications", J. Can. Perr. Tech. 30,
(1991)34-42.
Thompson G.M., Hayes J.M. and Davis S.N., "Fluorocarbon Tracers in Hydrology",
Geophys. Res. Lett., 1, (1974) 177-180.
Watson A.J., Liddicoat M.I. and Ledwell J.R., "Perfluorodecalin and Sulphur
Hexafluoride as Powerful Marine Tracers: Some Deployment and Analysis
Techniques", Deep-Sea Res., 34. (1986), 19-31.

121
Table I Selected physical parameters for PMCP and PMCH
Tracer Formula Boiling
point (°C)
Density at
20°C<R/CC)
Critical
temp. (°C)
Critical
pressure (bar)
PMCP CfiF,, 48 1.72 177.9 22.5
PMCH C 7 Fu 76 1.80 210.2 21.2
Table 2 Data on the injected tracers
PMCP PMCH
Producer/supplier Rhone-Poulenc Rhone-Poulenc
Product name PP1C PP2
Purity > y >95%
Contaminations:
Low boiling perfluorocarbons 1-2% 0-3%
Isomers 3-7% .
High boiling perfluorocarbons 0-2% 0-2%

T P N / L B P T / N P N/RI Cl SP Sl
TP TARBERT PRODUCER NP NESS PRODUCER LBP LOWER BRENT PRODUCER CP COOK PRODUCER SP STATFJORD PRODUCER
SUPER WATER NJECTOR ICSS HECTOR COOKNjECTOft STATWORO NJECTOR
* HorltonUI tctl* appoKlmtMty 3 x vwvctf 1 1 M h r £ M £ A & £ S A M A N O V e K n C A L
| ~ ) H W P E R N C A B L E S A M ) & \ f E R T K > L V M n S
j | LOW PERKCMLE SWC&. VEHTCAL ÉARWtWS
Pig. I East-West cross section through the GulJfaks Field showing the three reservoir: Brem Group, Cook Formation and Statfjord Formation
B

123
2 1 5
210" 2*15"
• PRODUCTION WELL - f DRY WELL. PLUCGEO AND
ABANDONED o DRILLING
• • • F A U L T
o •• HORIZONTAL WELLS
-f- OIL. PLUGGED AND ABANDONED « • INJECTION WELL O PLANNEO WELL
Fig.2 Gullfaks well and fault block overview.

12*
Fig.3 Top Rannoch formation structural map of the WAG Area.

1700- A-19 projected A-11 \
A-10
1800- t*ss \ l l \ tf_ £ EJNE. g ^ — * ^ E
" >w \ N ^______ J ^ T " W * * * >Wv ^sT" B "V P
1900- N > V \ " " \ _ - — - V " " ^Sc
^^rrr3C^^rrrr^_^„ DRMÆ \ , *^k2
- £ - ^ B ^~-~~~~\ 2000- ^ % N ^ *
\ \ \
coc*\
2100- \ \
2200- \ ® ^ \
X̂ 2300-
2400- s ^ FJOPO
1700
-1800
1900
2000
•2100
2200
2300
2400
I !•• -i Cioss section through Gul l faks A and W A G Wel l A -10 and A - 1 1 .
S

126
a) 200 WATER ( IQ 1 m' ) CAS (IP* Sm'j
n 1 t I Jl
200 ISO
• 160 MO 120 100 80 60 «0 20
1 2 3 4 5 6 7 8 9 10 11 12 1 2 3 4 5 6 • i WATER CHGAS
GOR GAS l/l—oil g /ml (10" )
,* 1 5 0 - A / !r\ - 2 0
f \ ' i ' \ -15 1 0 0 - •' \ / '' \ 5 0 -
/ \ _,-'' ! u \ .... -10
- 5 5 0 - . — _ ,• fy \
1 1 1 1 1 1 1 1 / / l l ^ M M - t e t - B T f 1 r S s d 1 1 1 1 1 1 1 1 1 1 1 1 1 1
-10
- 5
f - T -1-1 H I r i i i i l i r r r i i M i n i i i i i i i i i i i i i i | - * L d L » i - J t O - * t ^ i n v l « D — U U l v J I D ' U U l ^ l O ' 1 Ol Ifl Nl *o — u N
g WEEK 8 — to
w /. 3 0 0 -
/ *, f /'•'•:
- 20
-15 2 0 0 -
•7 /' \ - 10
1 0 0 - J/ ' - 5 1 0 0 -
/ - 5
1 1 1 1 i 1 1 1 1 1 f f 1 1 1 t 1 I 1 1 1 1 1 1 1 1 1 t 1 1 1 Jp\ 1 I I 1 1 0 1
T 1 M 1 1 1 11 1 1 1 1 1 1 1 H i 1 I n - H - r l ' l 1 1 t r H 1 HH r w "^ - > l * U i - J < 0 - O < t / < - O ( O - W U » s J * > — Ct ( » %l <0 •* 1 - W W M ID - i N
8 WEEK |
CAS PMCP OIL PMCP GAS PUCH OH. PUCH GOR
Fig.5 a) Well A-11 monthly water and gas injection volumes, b) Well A-19 gas and tracer breakthrough, c) Well A-10 gas and tracer breakthrough.

TRACER RESERVOIR
; >t;.
PUMP
PRESSURE GAUGE
tx}-
WELL HEAD
rKH
CHECK VALVE
DRAINAGE
t
Fig.6 The tracer injection system
§

SAMPLE CYLINDER
PISTON CYLINDER
PUMP
mt mt 9 mt 9 WATER
Fig.7 Analy t ic sys'.em for gas tracer detection.
SAMPLE PREPARATION ANO INJECTION LOOP
CONDENSER
§