an experimental research on eating pattern on survival...
TRANSCRIPT

575
AN EXPERIMENTAL RESEARCH ON EATING PATTERN ON SURVIVAL CRAFT
Kazusei YAMAMOTO 1, Yuki IKEDA 2
1 Marine Technical College, 12-24, Nishikura-cho, Ashiya City, Hyogo Pref., 659-0026, Japan, Tel:+81-797-38-6255, Fax: +81-797-32-7904 [email protected] 2 Fukuju Kigyo Co.,Ltd., 3-3, Asahi-cho, Shimizu-ku, Shizuoka City, Shizuoka Pref., 424-0822, Japan, Tel: +81-54-352-5126, Fax: +81-54-352-5223 [email protected]
ABSTRACT
In order to ensure of survival on drift with lifeboat and life raft from emergency embarkation, Seafarers are required to the proficiency in survival craft in the STCW Chapter VI. Then the SOLAS TRAINING MANUAL teaches us Distribution of drinking water and rations and that a man can live for a considerable period without food. In 1952 Alain Bombard drifted for 65 days without drinking water or rations and survived. I consider his knowledge and skills as a doctor made his success. Then an eating pattern on survival craft was tested by the current seafarers. During the experiment collaborators drank 1.5 liters of drinking water per person and ate 10,000 KJ/P of ration per person, and they went about their daily lives. The results were summarized as follows:
(1) The weight of collaborator did not decrease as it is all same because each of the Basal Metabolic Rate was different.
(2) There was not the change of blood test results almost before and after the experiment. (3) Some person hardly ate the food ration during the experiment, because they felt that the food ration
was not delicious. Keywords: Ration, Drinking water, Metabolism
1. INTRODUCTION Many shipwreck drifts are reported. The experience of the survivor is various, and it is so severe to use it as a success example and everyone is unlikely to be able to return by it. The example of the recent drift returning alive was in the Daily Yomiuri on 12th March 2007. It said that on 12th February 2007 three men were drifting for 3 days off the Cape Toi on the south Kyusyu with a life raft and were rescued, they divided 6 pieces of crackers each other during drift and surpassed hunger, although they had the drinking water of 2 PET bottles they hardly drank them, because it was cold. There are food ration and drinking water on a life raft, however it was not written whether those were used. At present, we seldom drift for the several days, because GMDSS is established. However, we must bear drift for a few days, until a rescue party arrives, in the case we drifted. The food ration and drinking water are the last hope for the several days.
In this paper, the authors eat only food ration in order to survival from drift and the efficacy of food ration is discussed. 2. LITERATURE SURVEY The drift experiment was reported by Alain Bombard in the past1). Then the experiment regarding the drinking of the sea water in the drift was reported by Minoru Saito2). Because the experimental conditions are so severe in these reports, the success of the experiment was feared. Figure 1 shows 1 package of food ration and a 500 ml of bottle of drinking water.

576
Figure 1: Food ration and Drinking water
The important matter of the food ration and the drinking water are shown in LSA Code, paragraph 4.1.5.1.18/193) and be in the follows: A food ration totaling not less than 10,000kJ (2,389 kcal) for each person the life raft is permitted to accommodate. These rations should be palatable, edible throughout the recommended shelf life, and packed in a manner which can be readily divided and easily opened. The rations shall be kept in airtight packaging and be stowed in a watertight container; Watertight receptacles containing a total 1.5 liters of fresh water for each person the life raft is permitted to accommodate, of which either 0.5 liters per person may be replaced by a desalting apparatus capable of producing an equal amount of fresh water in two days or 1 liter per person may be replaced by a manually powered reverse-osmosis desalinator, as described in paragraph 4.4.7.5, capable of producing an equal amount of fresh water in two days. The usage of the food ration and the drinking water are shown in SOLAS Training4) and be in the follows:
Distribution of drinking water; If possible, the quantity of water taken by a person a day in ideally 500 ml. Depending on the circumstances, this quantity shall be further reduced. (It has been recorded that a man drifted for a considerable period with about 150 ml of water a day.); Do not gulp water. Take it slowly, holding it little by little in the mouth, moistening lips, and gargling to satisfy the desire to drink; Distribution of rations;
1. Rations shall be saved as far as possible, considering that a man can live for a considerable period without food. Take no food until 24 hours have passed since abandonment;
2. A concrete example of distributing is as follow; a. Emergency rations are divided equally into three; b. Two thirds of rations are divided by the number of days it is expected to take until the life raft is
rescued, thus the quantity to be distributed in one day is fixed; c. The remaining one thirds is reserved for days beyond the expected rescue day;
3. Chew food slowly so that it can be completely digested. 3. FOOD RATION EXPERIMENT The experiment that sends a daily life by only food ration 1 package and drinking water 1.5 liters was carried out in order to investigate the efficacy of them in drift. 3.1. Experiment Method During the experiment, the collaborator led life usually and the meal is only food ration and drinking water, and they led the life like Table 1.

577
Table 1: Experimental Life Day Meal
1st
15:00 measure weight/body fat Do blood test
After dinner the experiment start No eating and no drinking
2nd
No eating and no drinking 15:00 measure weight/body fat
Do blood test 1st dinner is food ration and drinking water
3rd food ration and drinking water 4th food ration and drinking water
5th
food ration and drinking water 15:00 measure weight/body fat
Do blood test The experiment completion
The age of the collaborator is from 19 to 43 years old, and then the gender and number of persons are 5 males and 1 woman. Each datum of the collaborators is shown in Table. 2. Cooperator A~E live in the student dormitory in the college and cooperator F is attending college with 20 minutes by walk, 20 minutes by bus and 40 minutes by train.
Table. 2: Data of the collaborators
Collaborator Height (cm)
Weight (kg)
Age (year) Gender
A 176 61.5 19 M B 173 66.7 19 M C 187.5 80 19 M D 176 72.4 19 M E 152 56.8 20 F F 170 67.2 43 M
The followings were explained to the collaborators before the experiment and the safe measure of the experiment was taken.
You are hungry and feel bad you can stop the experiment right away. And, you must go to the health care room. You must tell it to the charge teacher and also the charge student. When you felt abnormality you must tell it to someone. The experiment is explained to the public health nurse before the experiment.
The food ration and drinking water shown in Fig. 2 were given to each collaborator. Fig. 3 shows the nutrition of food ration.

578
Figure 2: Food ration and drinking water for the experiment
Carbohydrate69%
Fat23%
Protein8%
Figure 3: Nutrition of Food Ration
3.2. Change of Weight
Figure 3 shows that the weight after the experiment (WAE) to the weight before the experiment (WBE) with percentage about each collaborator. (Numbers) means the energy that each collaborator ate food ration. The weight decrease after the fasting was 1%. And, the weight decrease was 4~8% after the experiment.
90
92
94
96
98
100
Before Fast ing After Fast ing After Experiment
WAE/ WBE(%)
A(597kcal)B(2389kcal)C(1327kcal)D(2123kcal)E(2389kcal)F(2389kcal)
Figure 4: Change of Weight
The weight decrease of collaborator A and D are very bigger in comparison with other collaborators. The weight decrease of C is bigger than that of D, even though the quantity that C ate is less than that of D, when C and D are compared. Then when the quantity that ate is same the weight decrease is in the same trend almost. The reason that the quantity that cooperator ate differs is because several collaborators do not like food ration.
579
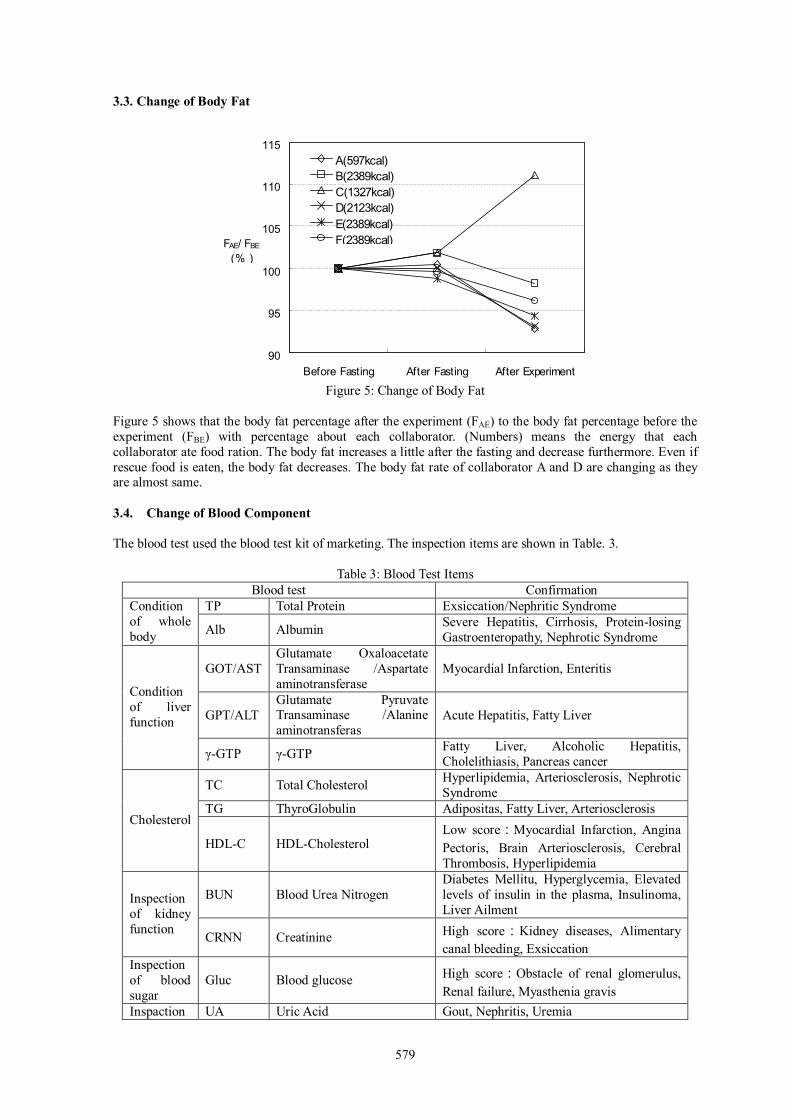
3.3. Change of Body Fat
90
95
100
105
110
115
Before Fasting After Fasting After Experiment
FAE/ FBE
(%)
A(597kcal)B(2389kcal)C(1327kcal)D(2123kcal)E(2389kcal)F(2389kcal)
Figure 5: Change of Body Fat
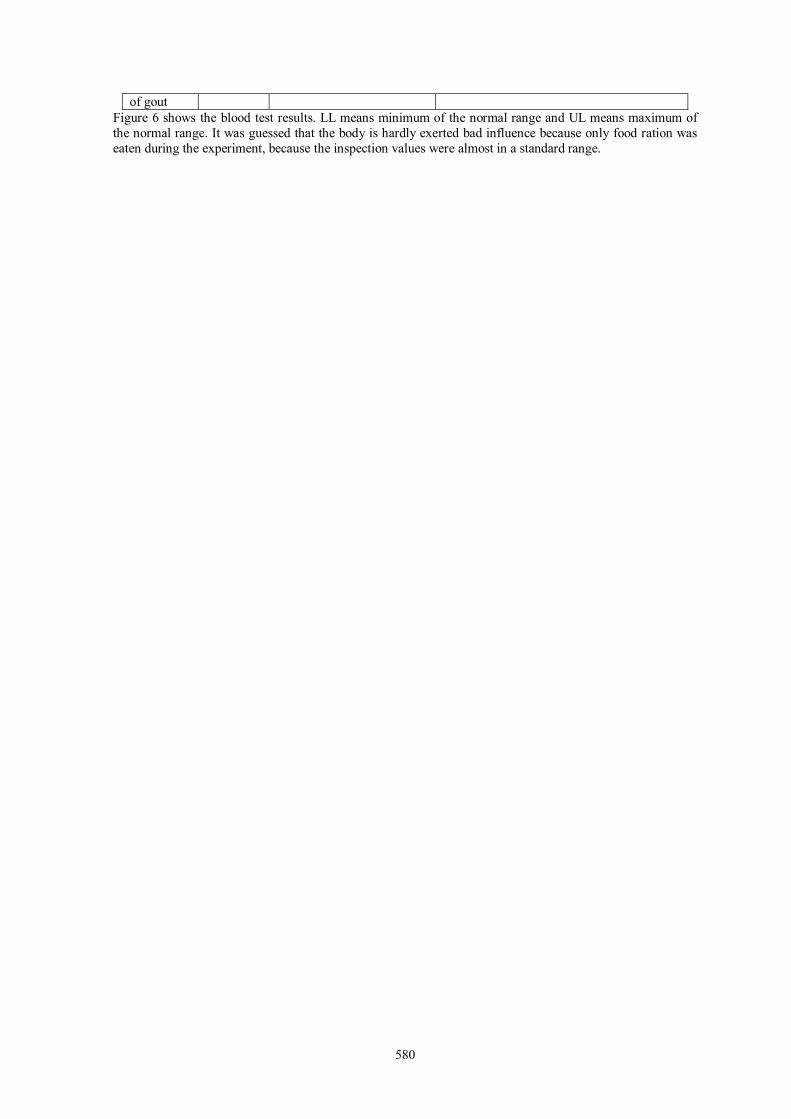
Figure 5 shows that the body fat percentage after the experiment (FAE) to the body fat percentage before the experiment (FBE) with percentage about each collaborator. (Numbers) means the energy that each collaborator ate food ration. The body fat increases a little after the fasting and decrease furthermore. Even if rescue food is eaten, the body fat decreases. The body fat rate of collaborator A and D are changing as they are almost same. 3.4. Change of Blood Component The blood test used the blood test kit of marketing. The inspection items are shown in Table. 3.
Table 3: Blood Test Items
Blood test Confirmation TP Total Protein Exsiccation/Nephritic Syndrome Condition
of whole body Alb Albumin Severe Hepatitis, Cirrhosis, Protein-losing
Gastroenteropathy, Nephrotic Syndrome
GOT/AST Glutamate Oxaloacetate Transaminase /Aspartate aminotransferase
Myocardial Infarction, Enteritis
GPT/ALT Glutamate Pyruvate Transaminase /Alanine aminotransferas
Acute Hepatitis, Fatty Liver
Condition of liver function
γ-GTP γ-GTP Fatty Liver, Alcoholic Hepatitis, Cholelithiasis, Pancreas cancer
TC Total Cholesterol Hyperlipidemia, Arteriosclerosis, Nephrotic Syndrome
TG ThyroGlobulin Adipositas, Fatty Liver, Arteriosclerosis Cholesterol
HDL-C HDL-Cholesterol Low score:Myocardial Infarction, Angina Pectoris, Brain Arteriosclerosis, Cerebral Thrombosis, Hyperlipidemia
BUN Blood Urea Nitrogen Diabetes Mellitu, Hyperglycemia, Elevated levels of insulin in the plasma, Insulinoma, Liver Ailment
Inspection of kidney function CRNN Creatinine High score:Kidney diseases, Alimentary
canal bleeding, Exsiccation Inspection of blood sugar
Gluc Blood glucose High score:Obstacle of renal glomerulus, Renal failure, Myasthenia gravis
Inspaction UA Uric Acid Gout, Nephritis, Uremia
580
of gout Figure 6 shows the blood test results. LL means minimum of the normal range and UL means maximum of the normal range. It was guessed that the body is hardly exerted bad influence because only food ration was eaten during the experiment, because the inspection values were almost in a standard range.

581
4. ANALYSES AND DISCUSSION
6.0
6.5
7.0
7.5
8.0
8.5
Before Fasting After Fasting After Experiment
TP(g/
d?)
ULABDEFLL
(a)
3.5
4.0
4.5
5.0
5.5
Before Fasting After Fasting After Experiment
Alb(
g/dl)
ULABDEFLL
(b)
0.0
10.0
20.0
30.0
40.0
50.0
Before Fasting After Fasting After Experiment
GOT(
AST)
(IU/L
) ULABDEFLL
(c)
0.0
10.0
20.0
30.0
40.0
50.0
Before Fasting After Fasting After Experiment
GPT(
ALT)
(IU/L
) ULABDEFLL
(d)
0.0
20.0
40.0
60.0
80.0
100.0
Before Fasting After Fasting After Experiment
γ-G
TP(IU
/L) UL
ABDEFLL
(e)
140.0
160.0
180.0
200.0
220.0
Before Fasting After Fasting After Experiment
TC(m
g/dl)
ULABDEFLL
(f)
20.0
60.0
100.0
140.0
Before Fasting After Fasting After Experiment
TG(m
g/dl)
ULABDEFLL
(g)
30.0
50.0
70.0
90.0
Before Fasting After Fasting After Experiment
HDL-
C(m
g/dl)
ULABDEFLL
(h)
5.0
9.0
13.0
17.0
21.0
25.0
Before Fasting After Fasting After Experiment
BUN(
mg/
dl)
ULABDEFLL
(i)
0.5
0.7
0.9
1.1
1.3
Before Fasting After Fasting After Experiment
CRNN
(mg/
dl)
ULABDEFLL
(j)
60.0
70.0
80.0
90.0
100.0
110.0
Before Fasting After Fasting After Experiment
Gluc
(mg/
dl)
ULABDEFLL
(k)
2.0
3.0
4.0
5.0
6.0
7.0
8.0
Before Fasting After Fasting After Experiment
UA(m
g/dl)
ULABDEFLL
(l)
Figure 6: Blood Test Results
582
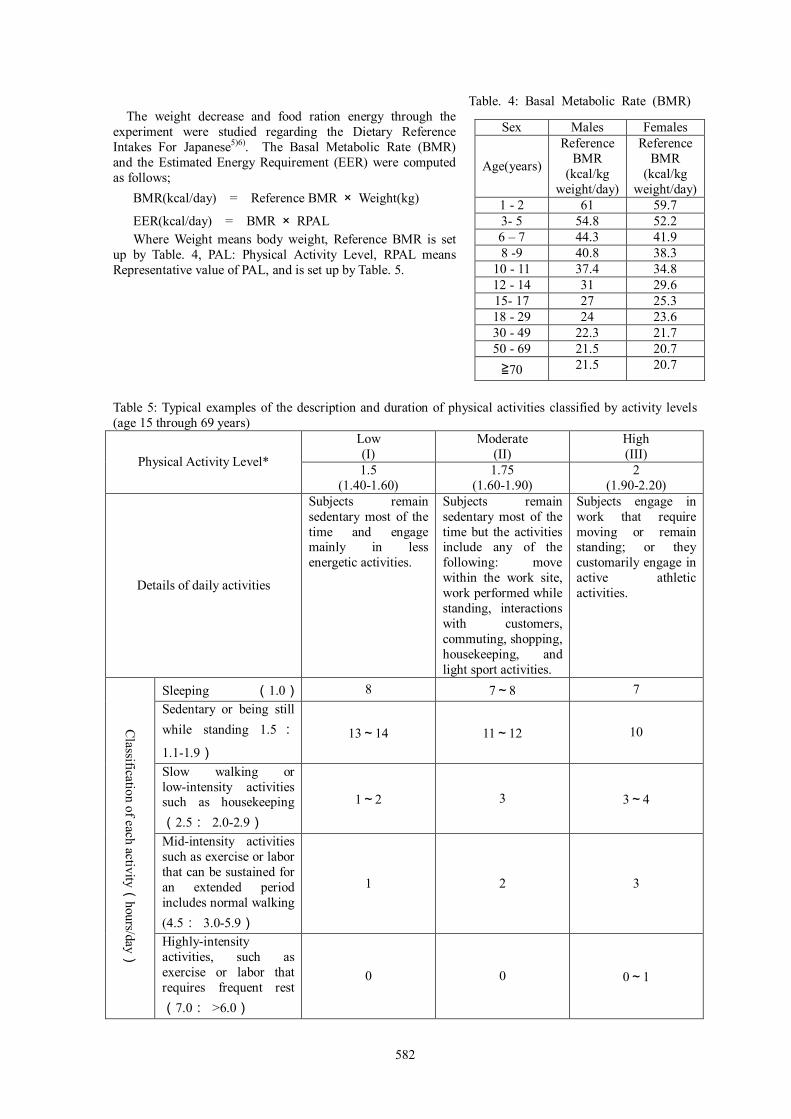
Table. 4: Basal Metabolic Rate (BMR) The weight decrease and food ration energy through the
experiment were studied regarding the Dietary Reference Intakes For Japanese5)6). The Basal Metabolic Rate (BMR) and the Estimated Energy Requirement (EER) were computed as follows;
BMR(kcal/day) = Reference BMR × Weight(kg)
EER(kcal/day) = BMR × RPAL Where Weight means body weight, Reference BMR is set
up by Table. 4, PAL: Physical Activity Level, RPAL means Representative value of PAL, and is set up by Table. 5.
Table 5: Typical examples of the description and duration of physical activities classified by activity levels (age 15 through 69 years)
Low (I)
Moderate (II)
High (III) Physical Activity Level* 1.5
(1.40-1.60) 1.75
(1.60-1.90) 2
(1.90-2.20)
Details of daily activities
Subjects remain sedentary most of the time and engage mainly in less energetic activities.
Subjects remain sedentary most of the time but the activities include any of the following: move within the work site, work performed while standing, interactions with customers, commuting, shopping, housekeeping, and light sport activities.
Subjects engage in work that require moving or remain standing; or they customarily engage in active athletic activities.
Sleeping (1.0) 8 7~8 7 Sedentary or being still while standing 1.5 :
1.1-1.9) 13~14 11~12 10
Slow walking or low-intensity activities such as housekeeping(2.5: 2.0-2.9)
1~2 3 3~4
Mid-intensity activities such as exercise or labor that can be sustained for an extended period includes normal walking (4.5: 3.0-5.9)
1 2 3
Classification of each activity(
hours/day)
Highly-intensity activities, such as exercise or labor that requires frequent rest(7.0: >6.0)
0 0 0~1
Sex Males Females
Age(years)
Reference BMR
(kcal/kg weight/day)
Reference BMR
(kcal/kg weight/day)
1 - 2 61 59.7 3- 5 54.8 52.2 6 – 7 44.3 41.9 8 -9 40.8 38.3
10 - 11 37.4 34.8 12 - 14 31 29.6 15- 17 27 25.3 18 - 29 24 23.6 30 - 49 22.3 21.7 50 - 69 21.5 20.7
≧70 21.5 20.7

583
*Representative values. The range is shown in parentheses.
Table. 6: Calculated EER and Food Ration
Cooperator A B C D E F
Age (years) 19 19 19 19 20 43
Sex M M M M F M
Weight (kg) 61.5 66.7 80 72.4 56.8 67.2
Reference BMR (kcal/kg weight/day) 24 24 24 24 23.6 22.3
Representative value of PAL on the experiment 1.75 1.75 1.75 1.75 1.75 1.75
BMR on the experiment
(kcal/day) 1476.0 1600.8 1920.0 1737.6 1340.5 1498.6
EER on the experiment
(kcal/day) 2583.0 2801.4 3360.0 3040.8 2345.8 2622.5
Representative value of PAL on survival craft 1.5 1.5 1.5 1.5 1.5 1.5
EER on survival craft
(kcal/day) 2214.0 2401.2 2880.0 2606.4 2010.7 2247.8
Food ration per package (kcal) 2388.9 2388.9 2388.9 2388.9 2388.9 2388.9
Food ration eaten (kcal) 597 2389 1327 2123 2389 2389
Decrease of weight (kg) 5.0 2.9 4.0 4.7 2.6 2.5
Table. 6 shows the calculation result. When RPAL was 1.75 at the experiment, the energy of 1 package of the food ration was 0.7 - 1.0 times of EER and was 1.2 - 1.8 times of BMR. When RPAL was 1.5 at the drift by a life raft, the energy of the energy of 1 package of the food ration was 0.8 - 1.2 times of EER. When the food ration in a day was that 2/3 of 1 package divided 3 days from the guideline of the SOLAS Training, that energy was 0.18 – 0.26 times of EER.
5. CONCLUSION
In this research the influence that only food ration eating infect the body for 3 days after the fasting was investigated. Several collaborators did not eat because food ration was not delicious under the usual life. Then after the experiment young collaborators could eat usual meals but the middle-aged collaborator could not eat usual meals because he felt that the taste of usual meals was deep. The obtained results are summarized as follows:
(1) The body weight and the body fat decreased in usual life that meals were only the food ration and drinking water, in the suspected 4 days drift.
(2) The body fat increased just after fasting. (3) On the blood test there was not abnormality in health. (4) It was guessed that the 4 days drift is put up with. (5) The weight of collaborator did not decrease as it is all same because each of the BMR was different. (6) There was not the change of blood test results almost before and after the experiment. (7) Some person hardly ate the food ration during the experiment, because they felt that the food ration
was not delicious.
6. REFERENCES
584
Bombard, A., Kondo, H. (Translation) (1955). Jikken Hyoryuki (NAUFRAGE VOLONTAIRE), Hakusuisya, 8.5
Saito, M. (1980). Minoru Saito, Taiheiyo Hyoryu Seikatsu 50 nichi, Doshinsya, 1980.1, ISBN-13: 978-4494018086
IMO (2003), LIFE-SAVING APPLIANCES, ISBN92-801-5143-6 19 Ministry of Land, Infrastructure, Transport and Tourism, SOLAS TRAINING MANUAL, THE
ASSOCIATION FOR PROMOTING SAFETY AND SANITATION FOR SEAFARES, 2002.4, pp.169-173
Teiji Nakamura, Eiyo no kihon ga wakaru zukaijiten, Seibido Shuppan, ISBN 978-4-415-02604-6 Ministry of Health, Labour and Welfare, Dietary Reference Intakes For Japanese (2005). Access Date
28,7,2008, http://www.mhlw.go.jp/houdou/2004/11/h1122-2.html.