an expanding gas phase portfolio - agilent an expanding gas phase portfolio for your expanding...
TRANSCRIPT

1
An Expanding Gas
Phase Portfolio For your expanding Analytical
Needs
January 8, 2013
Agilent Confidential
Badr Astiphan
GCMS Product Sales Specialist
1-866-524-7936
302-290-5631 cell

Agilent Restricted
Page 3
5975C SQ 7890 GC
2007
Agilent GC/MS Portfolio

January 8, 2013
Agilent Confidential
4
5975E SQ 7820 GC
5975T LTM SQ
7000 TQ 7890 GC
240 IT 7890 GC
5977A SQ 7890B GC
7200 Q-TOF 7890GC
More Choices – Better Solutions
Agilent GC/MS/MS
Agilent GC/MS

January 8, 2013
Agilent Confidential
5
Perf
orm
an
ce
240 IT 7890 GC
7000 TQ 7890 GC
5977A SQ 7890 GC
220 IT 7890 GC
5975E SQ 7820 GC
with Tray support
Q-TOF 7890 GC
5975T SQ
LTM GC
Price
Agilent GC/MS Portfolio

January 8, 2013
Agilent Confidential
6
MassHunter GC/MS Acquisition for GC/MSD
Unified GC/MS Acquisition and
MassHunter Data Analysis; with
MSD ChemStation workflow for GC/MSD

Agilent 5977 MSD
January 8, 2013
Agilent Confidential
7

Proven Technologies Improving the Industry Standards for GC/SQ
Gold Quartz Quad Triple Axis Detector
High Temperature
Inert Source
Unique Entrance
Lens Design
All of 5975’s features also built in 5977, such as “Gold Quad”, SIM/Scan, Gain
tuning, Triple-Axis Detector, Trace Ion Detection, Auto CI, etc..
January 8, 2013
Agilent Confidential
8

January 8, 2013
Agilent Confidential
9
GC/MSD Software MassHunter Qual
MassHunter Quant MH
CS
MassHunter GC/MS Acquisition
And Use Either
MassHunter Data Analysis
OR
MSD ChemStation Data Analysis MSD ChemStation DA
G1701FA

Agilent Confidential
Page 10
Market’s Best S/N (SNR) > 1500:1
Market’s Best Scan Rate = 20,000 u/s
Market’s ONLY IDL < 10 fg
Better from Agilent
Statistical confirmation of entire system’s
performance
January 8, 2013

Agilent Restricted
Page 11
7000B Triple Quad GC/MS
Ultimate tool for the
analysis of trace level
components in complex
matrix
Dedicated GC MS/MS system

Why a Quadrupole GC/MS/MS System?
• Lower detection limits in complex matrices than SQ scan
or SIM
• Accurate quantitation of target compounds even in high
chemical background samples
• Better precision and linearity than ion trap MS/MS

GC/MS Triple Quad (QQQ) for GC/MS/MS
Detector Quad 1
Mass Analysis
Collision Gas (Ar, N2, He)
Quad 2
Collision Cell
Ion Source
•Ionize Quad 3
Mass Analysis
Carrier Gas (He, H2 )
Mean Free
Path Long Long Short
Collisions No No Yes
MS MS

MS/MS Succeeds Where MS Fails
GC/MS Triple Quad SRM
GC/MS Single Quad SIM
A chromatographer’s
dream: single peak on
flat baseline
Interfering matrix
peaks = chemical
noise

7000 Series Quadrupole MS/MS
Optimized for Gas Chromatography How to Set Up an MS/MS experiment

EI Spectrum with
all analyte and
background ions
How to Set Up an MS/MS experiment

7000 Series Quadrupole MS/MS
Optimized for Gas Chromatography
Q1 mass filters all
ions other than the
precursor; only
target ion 210
pass through

7000 Series Quadrupole MS/MS
Optimized for Gas Chromatography
Collision cell
dissociates m/z 210
into product ions

7000 Series Quadrupole MS/MS
Optimized for Gas Chromatography
Q2 monitors only
characteristic fragments
158 and 191 from m/z
210 for quant and qual

MS/MS Eliminates Scan and SIM Interferences
analyte
Product 1 Product 3
Product 2
Single Quad MS selectivity proportional to
spectral resolution
no selectivity against ions
with same m/z
Triple Quad MS Precursor selectivity same as MS but
high probability that one or more of the
product ions will be a unique dissociation
product of the precursor only
AND NOT the interference
Interference*
analyte
interference
unit mass resolution
*Because the concentrate of the matrix may be much greater than the analyte,
even matrix isotope ions (A+1, A+2, etc) may be a significant interference

As Matrix Increases - MS/MS is More Valuable
100 fg HCB in Clean Matrix 300 fg HCB in Diesel
Sin
gle
MS
: S
IM 2
83.8
M
S/
MS
: 283.8
:213.9
S/N=37:1 RMS
S/N=26:1 RMS
SIM about equal to MS/MS in clean matrix
MS/MS 15x better than SIM in complex matrix

Garlic: Single Quad SIM v.s. GC-QQQ
MRM
10 ppb Omethoate, MRM
Compound was confirmed easily
40 ppb Omethoate, SIM
Ion ratios were seriously distorted
GC-QQQ removes matrix interference and provides more reliable confirmation

Agilent Restricted
Page 23
240 Ion Trap GC/MS
• All Internal Ionization IT functionality • Liquid PCI, MS/MS, EI – all in one run
• Optional External Source • EI, PCI, NCI, Hybrid CI
• Higher performance scan function • Increased EI sensitivity
• Faster scanning (10K) for shorter cycle time
• Enhanced charge capacity
• MS/MS and MSn
7890A/240 Ion
Trap GC/MS
Agilent Restricted
Page 24
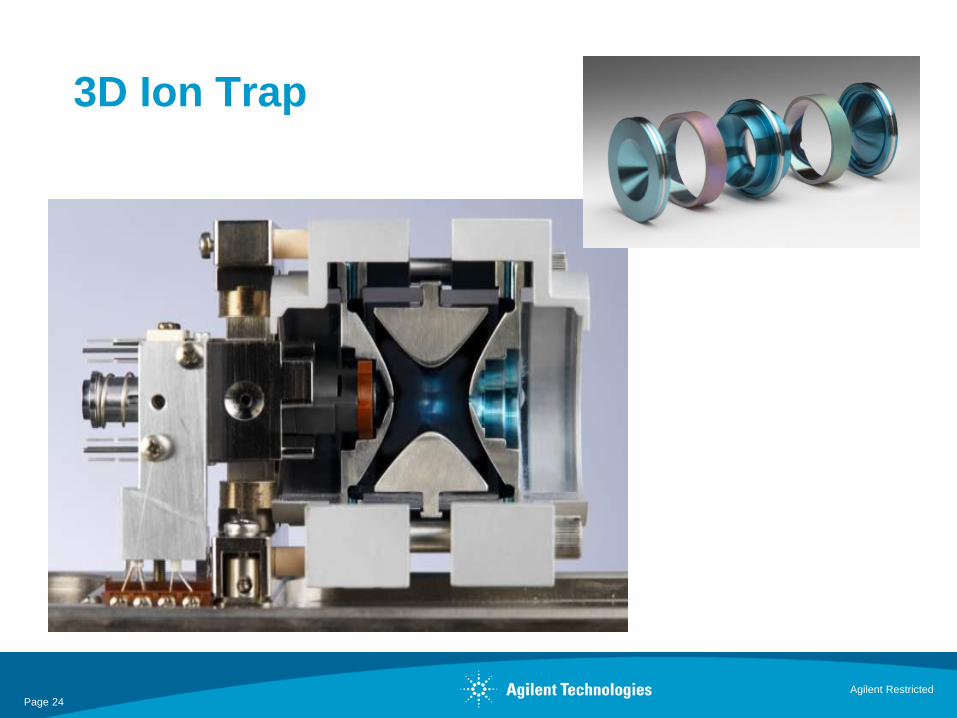
3D Ion Trap

Page 25
Different ionization (EI and CI) and scanning options (Full scan, MS/MS and
SIS) can be utilized even in the same run to enhance both the qualitative and
quantitative information content of the results.
EI/MS
CI/MS
CI/MS/MS
EI/MS/MS
EI/SIS EI/MS
IT-MS Changing Modes During a Single Analysis Winning Benefits

Page 26
7200 Series Q-TOF for GC/MS A new analytical tool for solving complex analytical problems
Badr Astiphan GC/MS Product Specialist
Mid America

Page 27
= +
What is it? 7890 + 7000 + 6500 = 7200 GC/Q-TOF
Quadrupole Time of Flight MS
Time of Flight MS
Triple Quadrupole GC/MS

Page 28
Merging two proven platforms
7000B TQ 6500 Q-TOF
NEW
Optics NEW
Removable
Ion Source
Two
300 L/s Turbos
Page 29
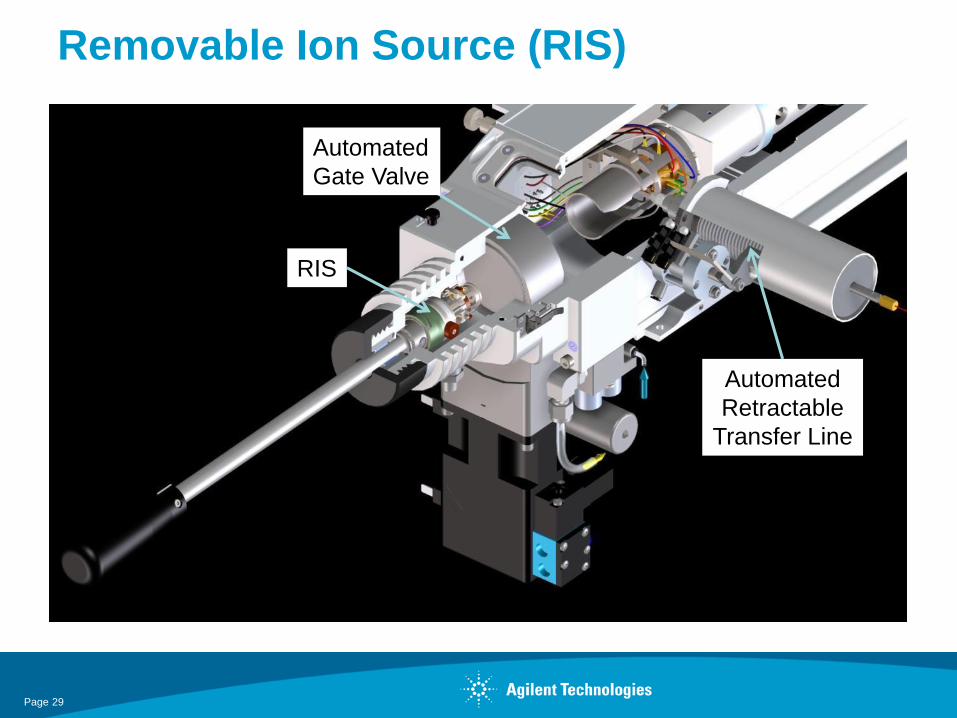
Removable Ion Source (RIS)
Automated
Retractable
Transfer Line
RIS
Automated
Gate Valve

Jan.-Apr. 2009
Expert Tour
Page 30
Q-TOF Fundamentals
September, 2008 Page 30
Ion optics Common with Q & QQQ
Flight tube Common with TOF
Octopole 1
DC Quad
Collision cell Common with QQQ
Rough Pump
Turbo Turbo Turbo
Quad Mass Filter (Q1)
Collision Cell Lens 1 and 2
Octopole 2
Ion Pulser
Ion Mirror
Detector
Turbo
Two key concepts for TOF:
1. Exact Mass
2. Mass Error

Page 31
How TOF Works
t0
V
t
3 simple equations:
𝐸 = 1
2𝑚𝑣 2
𝐸 = 𝑧 𝑉
𝑣 = 𝑑
(𝑡 − 𝑡0)
These combine to give the equation
for time-of-flight:
t = (m/z)1/2 * d / (2 * V)1/2 + t0
Which simplifies to the mass
relationship:
𝑚/𝑧 = 𝐴 (𝑡 – 𝑡0)2
Where A is an instrument design
constant
v
m/z

Page 32
A Time of Flight “Scan”
Pulser Detector
1. Pulse ions every 100 microseconds (10E-6), 10kHz
2. Measure at detector each nanosecond (10E-9)
3. 100,000 data points in each transient
4. Sum 500 – 10000 transients into one scan
5. Produces spectra with excellent ion statistics
15 µsec – m/z 69
45 µsec - m/z 614
Mirror
Flight Tube

Resolving Power & Mass Accuracy
R = 614/0.68 = 903
Δmz = 0.1/614
= 160 ppm
Pw=0.68
Mz=614
SQ
TQ
IT
TOF
Q-TOF
R = 614/0.0423 = 14522
Δmz = 0.0004/613.96
= 0.7 ppm
Resolving Power:
R=mz/FWHM
Mass Accuracy: Δmz=dm/mz*106,
parts per million (ppm)
PFTBA mass 614
C12F24N=613.964203
1 Da.
1 Da.

240.1218
240.0785
Flurenol methyl ester
m/z = 240.0781
Mass error = 1.7 ppm
Dimetilan
m/z = 240.1217
Mass error = 0.4 ppm
~13,500 resolution FWHM
How Much “R” is Enough?
No IRM corrections applied
Dm = 0.043 Da.

How Much Accuracy is Needed?
1
10
100
1000
10000
0.1 1 10 100 1000
# P
oss
ible
Ch
emic
al F
orm
ula
s
mass uncertainty, ppm
Possible Number of Chemical Formulas at m/z 272
Formulas made of:
C,H,N,O,F, & Cl
mass uncertainty
ppm amu # of Possible
Formulas 1000 0.3 7657
368 0.1 4050 100 0.03 1223
37 0.01 466 10 0.003 120
4 0.001 43 1 0.0003 11
0.4 0.0001 5 0.1 0.00003 2
Octafluoronaphthalene
(CAS 313-72-4)
C10F8
271.986677420 amu
Accurate mass reduces risk of investing effort on the wrong molecule
MSD
TOF 4 ppm
1 ppm
35

Jan.-Apr. 2009
Expert Tour
Page 36
What does “Exact Mass” mean?
September, 2008 Page 36
Element Atomic Number Exact Mass
H 1 1.007825
C 6 12.000000
N 7 14.003074
O 8 15.994915 C15H10NO3ClI2 287.0349209 Clioxanide
C8H18NO4PS2 287.0414860 Vamidothion
C16H15N3F2Si 287.1234039 Flusilazol
C6H6Cl6 287.8600665 Lindane
C10H12N2O6S 288.0416000 Carbasulam
C9H21O2PS3 288.0441285 Terbufos
C13H21O3PS 288.0949000 Iprobenfos
C15H17N4Cl 288.1141743 Myclobutanil
C12H21N2O4P 288.1238937 Diazoxon
C11H20N4O3PS 288.1256000 Epronaz
C11H21N4O3P 288.1351000 Pirimetaphos
C16H20N2O3 288.1473925 Imazamethabenz
0.2874 amu
The Key for getting useful TOF results is good mass accuracy.

Mass Uncertainty Measurements
0.1
1
10
100
1 10 100 1,000 10,000 100,000 1,000,000
Mass u
nc
ert
ain
ty,
pp
m
Number of Ions Detected
37
Maximizing Accurate Mass - Internal Reference
Mass (IRM)
• Engineering goal: minimize source of drift
– Proprietary INVAR flight tube
– Electronics optimized
– Ion Beam Flattening
– IRM correction often not needed
• IRM ions may be an interference with analyte ions
• Proprietary IRM delivery system is “backup” correction
– “Locks” mass axis to known background ions
• Tris(pentafluoroethyl)-s-triazine
– “On the fly” mass axis correction
38

Comparing Quad & TOF Sensitivity
Orthogonal Acceleration
TOF will lose low mass
sensitivity compared to a
Quad instrument but gain at
the mid and high mass
range.
Sensitivity is generally
between that of SIM and
Scan on a SQ or MRM and
Product Ion Scan on a TQ
39

TIC
EIC 283.8096+/- 0.5 Da.
EIC 283.8096+/- 2 ppm (+/- 0.0005 Da.)
Hexachlorobenzene – 600 ppb in marine sediment extract
a
b
c
Target compound quantitation and confirmation
No matrix interference
• Good quantification
• Good confirmation
Background
200X smaller

Accurate mass Target compound quantitation
Hexachlorobenzene
1 ppb – 5000 ppb
EIC window +/- 20 ppm
R2 > 0.9979
Linear response > 5X10³
Good quantification

Structure Elucidation
Nominal loss = 38 m/z
-H20, -HF
F
F
F F
F
F
F
F
F
OH2+
-F2
F
F
F F
F
F
F
OH2+
CH2+
F
F
F F
F
F
F F-H2O -HF
Exact Mass: 265.0269
Exact Mass: 38.0168Exact Mass: 227.0102
Exact Mass: 227.0301
C+
F
F
F F
F
F
F F
Exact Mass: 37.9968
Acronym Observed Base Peak m/z Molecular ion -F2 m/z Dppm Molecular ion -H20, -HF m/z Dppm
4:2 FTOH 227.0104 227.0301 86.7726 227.0102 -0.8810

MS/MS: When Resolution Is Not Enough?
• MS/MS product ions are generally well separated in mass
– Product ion masses do not shift due to lack of resolution
• Why use Q-TOF rather than triple quadrupole?
• Sometimes qualifier ions have low abundance
• Accurate mass measurement of quantitation ion offers more
confirmatory information than using a low abundance qualifier ion

MS/MS Chemical Noise Reduction BB1-1pg OFN in PFTBA Background
Evolution of GC/MS
Page 44
MS
m/z 272
54:1 S/N
MS/MS
272:222
216:1 S/N
Analyte
ions
Matrix ions Analyte ions with minimal
matrix ions

Q-TOF Example of Identification — Compound “B”
C16H14O4 (Rings + Double Bonds = 10)
Evolution of GC/MS
Page 45
(M – H)+
269.0802
Candidate
structures m/z
(experimental)
Formula Error
(ppm)
Score
269.0802 C16H13O4 2.2 80.7
193.0494 C10H9O4 0.6 96.7
167.0334 C8H7O4 3.0 N/A
166.0259 C8H6O4 0.6 N/A
138.0310 C7H6O3 1.1 98.1
110.0359 C6H6O2 3.0 N/A
95.0127 C5H3O2 0.9 99.5
– CH2=CH–C6H5
– CO
– CH3
– CO
– H
– C6H5
– CH=CH–C6H5
For the 5 candidate structures, only one fit the losses identified by
CID experiments on multiple precursor ions

Page 46
Value of TOF and Q-TOF
• High resolution full scan spectra
• Higher selectivity without MS/MS
• > 12K versus < 1K for SQ (15-20X higher)
• Accurate mass measurements
• Better qualitative decisions (molecular formula information)
• < 5 ppm versus 350-400 for SQ (70-80X better)
• Fast acquisition of full spectra range
• With consistently greater sensitivity than SQ
• 50 Hz max versus typically < 5 Hz max for SQ
• MS/MS with Product Ion spectra
• More selective than TQ (due to higher resolution)
• With accurate mass information for each product ion
• Powerful structural elucidation tools
Ideal tools for solving complex analytical problems

Page 47
Agilent GC/MS Portfolio
Industry-standard
workhorse
Routine analyses
(environmental, food,
tox, pharmaceutical,
chemical, materials)
High-throughput,
targeted quantitative analyses
(food, drugs, environmental)
Highest speed & sensitivity;
New MassHunter SW
Ultimate combination of qualitative
and quantitative capability
Demanding analyses (R&D and routine)
(metabolomics, food, toxicology)
Industry-leading performance,
usability, reliability, and support
Routine to unknowns analysis
(academia, environmental, food)
Foundation:
Q-TOF
GC/MS
Triple Quad
GC/MS
Single Quad GC/MS
Ion Trap GC/MS Greater flexibility between
EI, CI, and MS/MS modes

Page 48
Q&A Discussion