an evaluation of waste-to-energy options for monongalia
TRANSCRIPT

An Evaluation of Waste-to-energy Options for Monongalia County, West Virginia
Evan Hansen Joseph James Evan Fedorko
Downstream Strategies
295 High Street Suite 3
Morgantown, WV 26505 www.downstreamstrategies.com
August 29, 2016

ii | P a g e
An Evaluation of Waste to Energy Options for Monongalia County, West Virginia Evan Hansen, Joseph James, Evan Fedorko
Restate the title here
List the authors again here
ABOUT THE AUTHORS
Evan Hansen, M.S., President. Mr. Hansen explores resource and environmental problems and solutions in three areas: water, energy, and land. He manages interdisciplinary research teams, performs quantitative and qualitative policy and scientific analyses, provides litigation support and expert testimony, develops computer tools, provides training, and performs field monitoring.
Joseph James, B.A., Staff Scientist. Mr. James is experienced in a broad range of resource management topics. He has professional experience in the public, non-profit, and private sectors and has worked extensively in energy policy analyses, geographic information system development, database management, environmental data analysis, and environmental outreach.
Evan Fedorko, M.A., Project Geographer. Mr. Fedorko is an experienced multi-disciplinary scientist, researcher, and GIS analyst. He has an extensive background in GIS software and technology and has applied those and other geographic principles to areas of health and epidemiology, environmental impact assessment, public safety, evacuation management, natural resources, economic development, geology, tourism, environment, recreation, public policy, logistics and E-government.
ACKNOWLEDGEMENTS
The authors would like to thank the Monongalia County Solid Waste Authority for funding this report. We would particularly like to thank Mr. Hayward Helmick (Chair), David Dial (Vice Chair), Robert McConnell (Treasurer), H. R. Scott, and David Custer.
We would also like to thank Randy Bennett and Andreas Tsangaris (Plasco Energy Group), Sudhir Patel (WVDEP), Nelson Rekos (USDOE/NETL), Quingyn Sun (US-China Energy Center, WVU), Barbara Maclennan (West Virginia University), and Michael K Knaggs (USDOE/NETL).

iii | P a g e
TABLE OF CONTENTS
1. INTRODUCTION ............................................................................................................................................. 1
2. BACKGROUND ............................................................................................................................................... 2
2.1 GASIFICATION PLANTS IN THE UNITED STATES AND ELSEWHERE ................................................................................... 3 2.2 PARTNERS IN MONONGALIA COUNTY .................................................................................................................... 4 2.3 FACTORS INFLUENCING THE FEASIBILITY OF A SYNGAS FACILITY ..................................................................................... 4
3. WASTE-TO-ENERGY TECHNOLOGIES UNDER CONSIDERATION ....................................................................... 6
3.1 REFUSE-DERIVED FUEL/MECHANICAL-BIOLOGICAL TREATMENT ................................................................................... 6 3.1.1 General description ................................................................................................................................... 6 3.1.2 Case study: Entsorga WV .......................................................................................................................... 7
3.2 GASIFICATION ................................................................................................................................................... 8 3.2.1 General description ................................................................................................................................... 8 3.2.2 Case study: Plasco Energy – Trail Road Facility ........................................................................................ 9 3.2.3 Case study: Chinook Sciences -- RODECS................................................................................................. 10 3.2.4 Case study: TCG Global ........................................................................................................................... 11
4. FEEDSTOCKS AND END PRODUCTS FOR A FACILITY IN MONONGALIA COUNTY ........................................... 12
4.1 FEEDSTOCK AVAILABILITY ................................................................................................................................... 12 4.1.1 Municipal solid waste ............................................................................................................................. 12 4.1.2 Waste tires .............................................................................................................................................. 14 4.1.3 Coal ......................................................................................................................................................... 15 4.1.4 Summary ................................................................................................................................................. 15
4.2 MARKETS FOR END PRODUCTS ............................................................................................................................ 16 4.2.1 Refuse-derived fuel ................................................................................................................................. 16 4.2.2 Diesel ...................................................................................................................................................... 16 4.2.3 Hydrogen ................................................................................................................................................ 17 4.2.4 Ammonia ................................................................................................................................................ 18
5. GREENHOUSE GAS EMISSIONS ASSOCIATED WITH A WASTE-TO-ENERGY FACILITY IN MONONGALIA COUNTY ............................................................................................................................................................... 19
5.1 DIRECT EMISSIONS ........................................................................................................................................... 19 5.2 AVOIDED INDIRECT EMISSIONS ............................................................................................................................ 19
6. CONCLUSIONS.............................................................................................................................................. 21
6.1 TECHNOLOGY CHOICE ....................................................................................................................................... 21 6.2 FEEDSTOCKS ................................................................................................................................................... 21 6.3 END PRODUCTS ............................................................................................................................................... 21 6.4 GREENHOUSE GAS EMISSIONS ............................................................................................................................. 22 6.5 FEASIBILITY DETERMINATION .............................................................................................................................. 22
7. PROPOSED PLAN FOR PHASE 2 .................................................................................................................... 24
7.1 TASKS ............................................................................................................................................................ 24 7.2 TIMELINE ........................................................................................................................................................ 25 7.3 BUDGET ......................................................................................................................................................... 25
REFERENCES ......................................................................................................................................................... 26

iv | P a g e
TABLE OF TABLES
Table 1: Active and planned commercial gasifiers in the United States and elsewhere ...................................... 3 Table 2: Daily feedstocks for model facilities (tons per day) .............................................................................. 12 Table 3: Annual feedstocks for model facilities .................................................................................................. 12 Table 4: Estimated composition of Monongalia County’s waste stream ........................................................... 14 Table 5: Amount of diesel produced by different feedstocks (gallons) .............................................................. 16 Table 6: Annual diesel production for model facilities (million gallons per year) .............................................. 16 Table 7: United States ammonia-based fertilizer imports and exports in 2012 ................................................. 18 Table 8: Avoided indirect emissions from model facilities and other facilities (MT CO2e per year) .................. 20
TABLE OF FIGURES
Figure 1: Recent diesel prices in the United States ($/gallon) .............................................................................. 5 Figure 2: Recent natural gas prices in West Virginia ($/MMcf) ............................................................................ 5 Figure 3: The mechanical-biological treatment process ....................................................................................... 7 Figure 4: The Plasco facility ................................................................................................................................. 10 Figure 5: The Chinook facility in Hollidaysburg, Pennsylvania ............................................................................ 11 Figure 6: Recent coal production in West Virginia and Monongalia County ...................................................... 15 Figure 7: No. 2 diesel sales in West Virginia (million gallons per year) .............................................................. 17
ABBREVIATIONS
CO2 Carbon dioxide CTL Coal-to-liquids G3P Green3Power Operations Inc. GHG Greenhouse gas GPS Global Positioning Systems kWh Kilowatt-hour MBT Mechanical-biological treatment MCSWA Monongalia County Solid Waste Authority MSW Municipal solid waste MW Megawatt NETL National Energy Technology Laboratory RDF Refuse-derived fuel SRF Solid recovered fuel Syngas Synthesis gas USDOE United States Department of Energy WTE Waste-to-energy WVU West Virginia University

1 | P a g e
1. INTRODUCTION
The Monongalia County Solid Waste Authority (MCSWA) is investigating the feasibility of building a plant that would convert municipal solid waste (MSW), waste tires, and other feedstocks into synthesis gas (syngas), a mixture of carbon monoxide and hydrogen. Globally, most syngas is produced from coal and utilized as a feedstock in chemical manufacturing; however, it has a number of other applications, including:
fuel for electricity and steam (via power generation);
as a feedstock for diesel or other liquid transportation fuels (via liquefaction);
as synthetic natural gas (via methanization); or
for the production of chemicals including hydrogen, methanol, ammonia, or other chemicals (via chemical conversion) (Wilson 2013).
Also under consideration is the production of refuse-derived fuel (RDF), a solid fuel derived from sorting and shredding MSW in order to create an optimal blend of refuse for use in combined heat and power facilities.
MCSWA’s mission is to provide the residents of Monongalia County with the facilities and services to adequately deal with solid waste and litter control. In an effort to fulfill this mission, MCSWA is seeking innovative solutions to address solid waste issues currently facing the County now and for decades into the future. Gasification and RDF plants both offer potential solutions that would put the county’s solid waste to productive use, creating a marketable product, generating jobs, and spurring innovation.
A syngas or solid fuel plant would create jobs and place Monongalia County into a role as a regional leader in new energy technology adoption. However, the potential environmental impacts of the plant are equally as important as jobs, revenues, expenses, and profits. In particular, understanding the greenhouse gas (GHG) emissions associated with the full life cycle of the plant is important in terms of deciding on the best technology, suitable fuel stock (MSW, waste tires, and/or other feedstocks), and end product (liquid fuel, electricity, or other end product). An accurate assessment of emissions is also critical in terms of generating public and financial support.
This report presents results from Phase 1 of MCSWA’s feasibility study and covers two broad subjects. First, we assess the feasibility of such a facility, with an overview of available technologies and an examination of the state of deployment. Secondly, we examine the potential environmental impacts of a proposed waste- to-energy plant, with a focus on carbon dioxide (CO2) and other GHGs. We then propose more detailed topic areas for a Phase 2 study.

2 | P a g e
2. BACKGROUND
Across the country and around the world, MSW is an ever-present feature of modern society. Garbage is generated constantly, and the mechanics of collecting, transporting, and disposing it occupy government at all levels. Landfilling (following materials recovery) is far and away the most prevalent solution in the United States, although incineration of MSW is also practiced, accounting for approximately 20% by weight of the total post-recovery waste stream. (United States Environmental Protection Agency, 2015) Around the world, MSW incineration facilities are commonly used for combined heat and power generation, but these facilities are notorious polluters, generating significant GHGs, particulates, and other toxics. (Center for Sustainable Systems, University of Michigan, 2015) Landfilling, too, while comparably easier to manage in a way that avoids excess air and water pollution, produces significant GHG emissions by way of methane from decomposition. All of this begs the question: Given MSW’s nature as an energy-rich, renewable fuel stream, can it be utilized more effectively?
In 2013, the United States generated 254 million tons of municipal solid waste, 87 million tons of which was recovered for recycling or composting (USEPA, 2015). Forty-two percent of U.S. GHG emissions are associated with materials management, which includes the harvesting, transport, provision of services, and end of life management of goods (USEPA, 2009). This number highlights the necessity for increased materials recovery from MSW. Seizing the opportunity, solid waste authorities have started to enact policies and plans that promote technology-driven waste management facilities that focus on using MSW, which would typically be discarded in a landfill, as a renewable resource. This increased interest by waste management officials has spurred growth and innovation in the waste recovery and waste-to-energy (WTE) technology markets. (Navigant Research, 2012; Grand View Research, 2015)
Globally, MSW collection is increasingly utilizing “smart” technologies, which includes a broad array of features, from general improvements in logistics by way of Global Positioning Systems (GPS) and improved routing, to intelligent processing of MSW with new advanced material recovery facilities (MRFs) and energy recovery by way of waste-to-energy and waste-to-fuel facilities of various stripes and landfill gas capture. (Maclennan, 2016; Lawrence, 2014; Chandak, 2010) Together, globally, smart technologies are utilized to some degree in the management of approximately 40% of the world’s MSW. This percentage is expected to remain steady as the volume of waste produced increases, although revenue from associated efficiency improvements and products produced is expected to increase. (Lawrence, 2014)
Globally today, the most common “smart” downstream use of MSW is enhanced material recovery followed by energy recovery from combined heat and power through of incineration (Maclennan, 2016; World Energy Council, 2013). Interest in other conversion technologies—including waste-to-liquids and thermal conversion (of which the production of syngas is included)—is increasing globally but remains rare.
3 | P a g e
2.1 Gasification plants in the United States and elsewhere
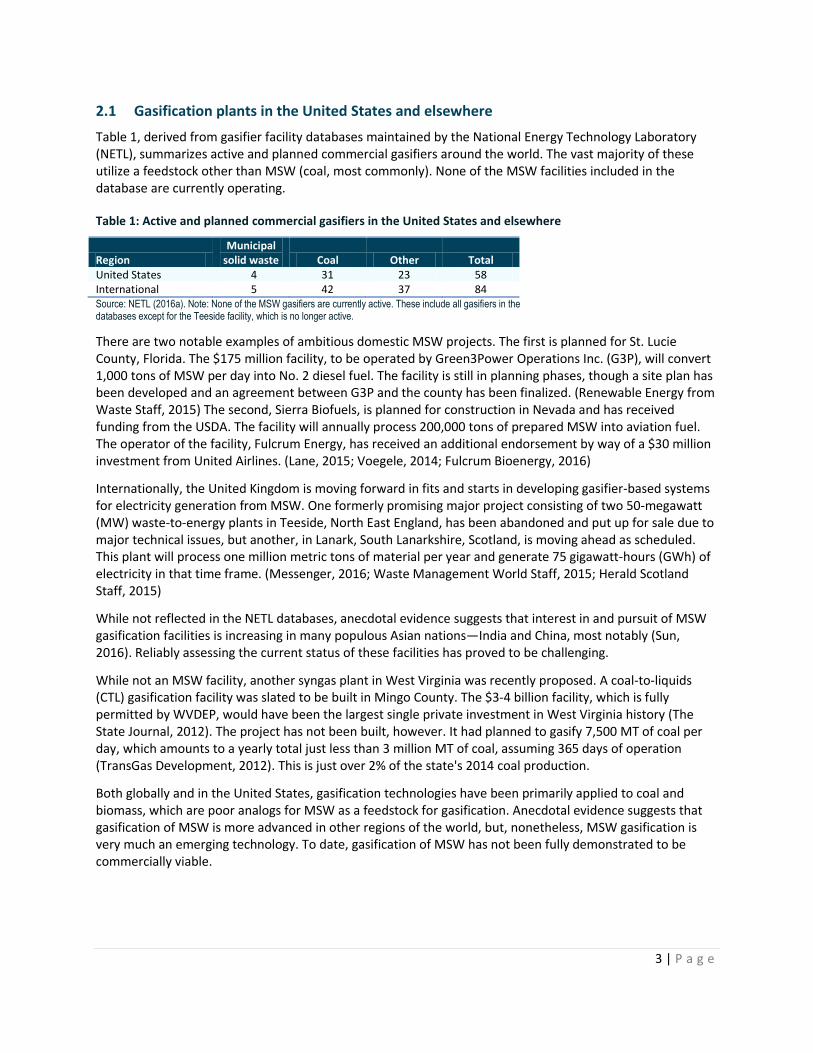
Table 1, derived from gasifier facility databases maintained by the National Energy Technology Laboratory (NETL), summarizes active and planned commercial gasifiers around the world. The vast majority of these utilize a feedstock other than MSW (coal, most commonly). None of the MSW facilities included in the database are currently operating.
Table 1: Active and planned commercial gasifiers in the United States and elsewhere
Region Municipal
solid waste Coal Other Total United States 4 31 23 58 International 5 42 37 84 Source: NETL (2016a). Note: None of the MSW gasifiers are currently active. These include all gasifiers in the databases except for the Teeside facility, which is no longer active.
There are two notable examples of ambitious domestic MSW projects. The first is planned for St. Lucie County, Florida. The $175 million facility, to be operated by Green3Power Operations Inc. (G3P), will convert 1,000 tons of MSW per day into No. 2 diesel fuel. The facility is still in planning phases, though a site plan has been developed and an agreement between G3P and the county has been finalized. (Renewable Energy from Waste Staff, 2015) The second, Sierra Biofuels, is planned for construction in Nevada and has received funding from the USDA. The facility will annually process 200,000 tons of prepared MSW into aviation fuel. The operator of the facility, Fulcrum Energy, has received an additional endorsement by way of a $30 million investment from United Airlines. (Lane, 2015; Voegele, 2014; Fulcrum Bioenergy, 2016)
Internationally, the United Kingdom is moving forward in fits and starts in developing gasifier-based systems for electricity generation from MSW. One formerly promising major project consisting of two 50-megawatt (MW) waste-to-energy plants in Teeside, North East England, has been abandoned and put up for sale due to major technical issues, but another, in Lanark, South Lanarkshire, Scotland, is moving ahead as scheduled. This plant will process one million metric tons of material per year and generate 75 gigawatt-hours (GWh) of electricity in that time frame. (Messenger, 2016; Waste Management World Staff, 2015; Herald Scotland Staff, 2015)
While not reflected in the NETL databases, anecdotal evidence suggests that interest in and pursuit of MSW gasification facilities is increasing in many populous Asian nations—India and China, most notably (Sun, 2016). Reliably assessing the current status of these facilities has proved to be challenging.
While not an MSW facility, another syngas plant in West Virginia was recently proposed. A coal-to-liquids (CTL) gasification facility was slated to be built in Mingo County. The $3-4 billion facility, which is fully permitted by WVDEP, would have been the largest single private investment in West Virginia history (The State Journal, 2012). The project has not been built, however. It had planned to gasify 7,500 MT of coal per day, which amounts to a yearly total just less than 3 million MT of coal, assuming 365 days of operation (TransGas Development, 2012). This is just over 2% of the state's 2014 coal production.
Both globally and in the United States, gasification technologies have been primarily applied to coal and biomass, which are poor analogs for MSW as a feedstock for gasification. Anecdotal evidence suggests that gasification of MSW is more advanced in other regions of the world, but, nonetheless, MSW gasification is very much an emerging technology. To date, gasification of MSW has not been fully demonstrated to be commercially viable.

4 | P a g e
2.2 Partners in Monongalia County
Monongalia County is home to institutions and scientists with considerable knowledge of waste-to-energy options. At the United States Department of Energy (USDOE) National Energy Technology Laboratory (NETL) in Morgantown, researchers maintain a robust program on the subject of gasification, or conversion of solid material into synthesis gas. This program originated with a focus on the gasification of coal, but has expanded to include gasification of other materials such as biomass and MSW. The research group also maintains numerous key informational resources such as the Gasifipedia, a one stop shop for gasification science, and a database of gasification plants around the world (NETL, 2016b).
West Virginia University (WVU) professors and researchers at several units within the university have already participated in discussions regarding a proposed syngas plant in Monongalia County, including the US-China Energy Center; the National Research Center for Coal and Energy; the Energy Institute; and the Davis College of Agriculture, Natural Resources, and Design. Like USDOE/NETL, these groups boast varying levels of experience with gasification of coal, though recent research endeavors of NRCCE and the US-China Energy Center have begun to include energy recovery from MSW as a research focus. (Sun, 2016)
2.3 Factors influencing the feasibility of a syngas facility
In order for a syngas facility to be commercially viable, it must operate at a profit, even if it relies on initial support from the government. Revenue streams include tipping fees and the sale of end products. If a facility can reduce GHG emissions and can capture the value of those reduced emissions in a market—including, for example, a carbon trading market or a renewable portfolio standard—then the environmental benefits may create a third revenue stream.
Tipping fees that waste haulers pay in order to drop their MSW at the facility, therefore, present one important economic factor. While it is beyond the scope of this Phase 1 report to conduct an economic analysis, the ability to charge an appropriate and competitive tipping fee that generates sufficient funds is important (See, for example, the discussion of the Plasco Energy facility in Section 3.2.2).
The sales revenue that can be generated from end products is the other critically important income stream. Generating sufficient sales revenue from the diesel fuel, however, is likely to be a challenge given that the price of diesel is so low today compared with the price captured in most of the previous 10 years (See Figure 1). Diesel is further discussed in Section 4.2.2.
The price of ammonia, another end product considered in this report, is tied to the price of natural gas, because ammonia is typically produced using natural gas as a feedstock. As illustrated in Figure 2, natural gas prices are very low now. This is due to a huge spike in production from horizontally drilled, hydraulically fractured natural gas wells in the Marcellus Shale basin in West Virginia and Pennsylvania, coupled with the lack of sufficient pipelines to transport the gas to distant markets. Supply exceeds demand, leading to a lowering of price. Ammonia is further discussed in Section 4.2.4.

5 | P a g e
Figure 1: Recent diesel prices in the United States ($/gallon)
Source: United States Energy Information Administration (2016b). Note: The prices shown are No. 2 diesel retail prices in the United States.
Figure 2: Recent natural gas prices in West Virginia ($/MMcf)
Source: United States Energy Information Administration (2016a). Note: The prices shown are the citygate prices in West Virginia.
$0.00
$0.50
$1.00
$1.50
$2.00
$2.50
$3.00
$3.50
$4.00
$4.50
$5.00
2007 2008 2009 2010 2011 2012 2013 2014 2015 2016
Die
sel p
rice
($/g
allo
n)
0
2
4
6
8
10
12
2006 2007 2008 2009 2010 2011 2012 2013 2014 2015
Nat
ura
l gas
pri
ce ($
/MM
cf)

6 | P a g e
3. WASTE-TO-ENERGY TECHNOLOGIES UNDER CONSIDERATION
Many technologies can convert MSW to energy, including facilities that create RDF, facilities that create syngas, incinerators, and other options. Based on discussions with MCSWA members and others, factors related to feedstock availability and desirable end products were used to narrow the range of technologies.
It was decided that an end product of electricity, in absence of a single, reliable customer, would be unlikely to provide a strong enough revenue stream to make a waste-to-energy project feasible. For this reason, incinerators were not considered further as their sole output is heat and power.
It was also decided that a facility that creates RDF would be considered, because such a facility is currently under construction in West Virginia (See Section 3.1.2).
Finally, it was decided that a facility that creates syngas would also be considered, with certain specific constraints regarding feedstocks and end products. Three factors regarding feedstocks for a syngas facility were considered:
1. The technology must work well with MSW. Whether or not the facility begins by using MSW or a different resource as a feedstock, the ultimate goal of this project is to use MSW as a feedstock.
2. The technology must also be able to use waste tires, even if it begins by using a different resource as a feedstock.
3. Feedstocks must be able to change over time. This would allow flexibility regarding feedstocks as economics, environmental factors, or other factors change over the course of years or decades. Also, this flexibility would allow the facility to begin by accepting one feedstock, even if the ultimate goal is to utilize MSW.
Electricity was not considered as an end product for a syngas facility based on the reasoning stated above; however, three other end products were investigated, based on feedback from MCSWA:
1. ammonia, 2. diesel, and 3. hydrogen.
The following subsections provide detailed descriptions and case studies of RDF facilities (Section 3.1) and syngas facilities (Section 3.2).
3.1 Refuse-derived fuel/Mechanical-biological treatment
3.1.1 General description
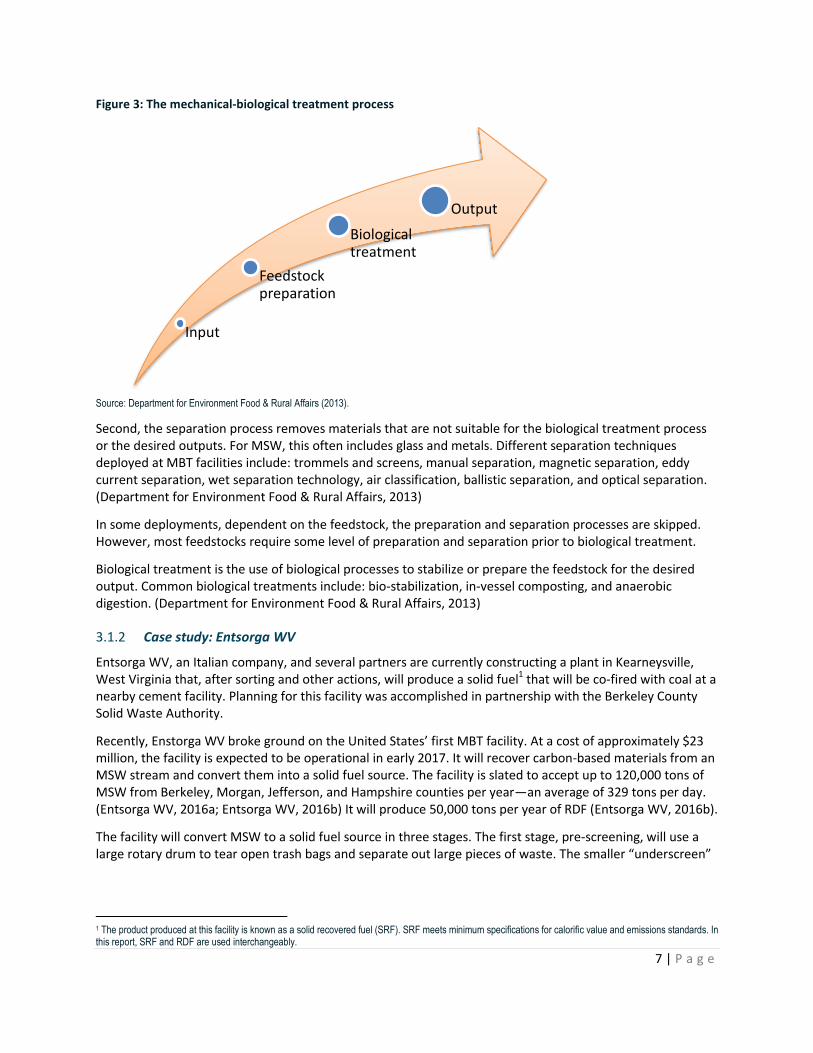
Producing RDF from MSW is a relatively well-established process from the mechanical-biological treatment (MBT) suite of technologies. MBT is a form of waste recovery that combines selective mechanical sorting processes with a biological treatment process to create either a compost-like output (CLO), biogas, or RDF. Biological treatment processes can be aerobic or anaerobic (See Figure 3).
Each MBT facility is configured based on the chosen feedstocks and desired outputs; however, generally speaking, an MBT facility can be broken up into three distinct processing stages.
The first, feedstock preparation, includes the use of tools like hammermills, shredders, rotating drums, ball mills, wet rotating drums with knives, and bag splitters. (Department for Environment Food & Rural Affairs, 2013) These tools are used to prepare the feedstock for the subsequent separation processes.
7 | P a g e
Figure 3: The mechanical-biological treatment process
Source: Department for Environment Food & Rural Affairs (2013).
Second, the separation process removes materials that are not suitable for the biological treatment process or the desired outputs. For MSW, this often includes glass and metals. Different separation techniques deployed at MBT facilities include: trommels and screens, manual separation, magnetic separation, eddy current separation, wet separation technology, air classification, ballistic separation, and optical separation. (Department for Environment Food & Rural Affairs, 2013)
In some deployments, dependent on the feedstock, the preparation and separation processes are skipped. However, most feedstocks require some level of preparation and separation prior to biological treatment.
Biological treatment is the use of biological processes to stabilize or prepare the feedstock for the desired output. Common biological treatments include: bio-stabilization, in-vessel composting, and anaerobic digestion. (Department for Environment Food & Rural Affairs, 2013)
3.1.2 Case study: Entsorga WV
Entsorga WV, an Italian company, and several partners are currently constructing a plant in Kearneysville, West Virginia that, after sorting and other actions, will produce a solid fuel1 that will be co-fired with coal at a nearby cement facility. Planning for this facility was accomplished in partnership with the Berkeley County Solid Waste Authority.
Recently, Enstorga WV broke ground on the United States’ first MBT facility. At a cost of approximately $23 million, the facility is expected to be operational in early 2017. It will recover carbon-based materials from an MSW stream and convert them into a solid fuel source. The facility is slated to accept up to 120,000 tons of MSW from Berkeley, Morgan, Jefferson, and Hampshire counties per year—an average of 329 tons per day. (Entsorga WV, 2016a; Entsorga WV, 2016b) It will produce 50,000 tons per year of RDF (Entsorga WV, 2016b).
The facility will convert MSW to a solid fuel source in three stages. The first stage, pre-screening, will use a large rotary drum to tear open trash bags and separate out large pieces of waste. The smaller “underscreen”
1 The product produced at this facility is known as a solid recovered fuel (SRF). SRF meets minimum specifications for calorific value and emissions standards. In this report, SRF and RDF are used interchangeably.
Input
Feedstock preparation
Biological treatment
Output

8 | P a g e
material goes into a holding area where the organic portion of the waste can be rapidly composted with an air circulation system. This air circulation system starts the aerobic composting fermentation process.2
Next, during the biological treatment stage, the underscreen material is placed on a concrete floor. Processed air is moved through slots in the floor and re-circulated with fresh air. The result is a dry paper-like product.
Finally, in the refining stage, the underscreen material is re-introduced to the large pieces of waste separated out during the first stage. Metals are separated out and sent to the County Recycling Center, and polyvinyl chloride (PVC) plastics are removed and sent to the local landfill. What is left is then shredded into smaller pieces, which can be used as an alternative solid fuel.
The Essorc Cement Company of Martinsburg has signed an off-take agreement with Enstorga WV. Essorc will be using the output from the facility to replace traditional fuels that are currently being used to power its production process. Enstorga WV estimates this will result in a reduction of GHG emissions of approximately 24,800 tons CO2e per year.
3.2 Gasification
3.2.1 General description
Gasification refers to any process by which a feedstock is converted to syngas, or synthesis gas—a mixture of hydrogen and carbon monoxide. While gasification can be used to convert MSW into end products, it can also utilize coal, waste tires, and other feedstocks. Syngas, like natural gas, is combustible and can be utilized in gas-fired turbines to generate electricity. Also like natural gas, it can be used to produce other end products such as ammonia, diesel, or hydrogen.
Gasification technologies generally fall into one of three categories: pyrolysis, conventional gasification, and plasma arc gasification. The primary differences between these categories are the operating temperature, make-up of the reactant (steam, air, pure oxygen, all resulting in varying amounts of oxygen), and reaction time. These factors result in significant differences in capabilities and efficiencies.
As technologies advance, the differences between these technologies blur somewhat, with developers opting to utilize different technologies at different steps of their process in order to maximize conversion of hydrocarbons.3 Still, at this stage of the process, it is instructive to consider each technology separately.4
Pyrolysis
Pyrolysis gasification is carried out in in a very low to zero oxygen environment at temperatures ranging from 600 to 800 degrees Celsius (Wilson, 2013). A variation of pyrolysis gasification known as fast pyrolysis is frequently discussed as well, and this method operates on the higher end of the temperature range. Pyrolysis gasification is somewhat unique in that it is often utilized to produce a liquid product known as pyrolysis oil, or bio-oil. These oils require processing for further use, however, and a lack of standardization of the product has hampered use and adoption. Fuel utilized in a pyrolysis gasifier must be shredded to a small size and dried to a moisture level at or below 10%. The need for very low moisture feedstock is one of the principal limiting factors for pyrolysis gasification of MSW. Additionally, the nature of pyrolysis reactions is such that a smaller quantity of gas is produced per unit of feedstock than conventional or plasma arc gasification. The principal advantage of pyrolysis is the in-process creation of a liquid product, and research suggests that 2 House Bill 4540, which lifts the prohibition on the disposal of electronic waste at West Virginia landfills, would have introduced a need for an additional level of sorting; however, the Berkeley County Solid Waste Authority voted to continue the ban at the Berkeley County landfill. Thus, Entsorga WV will not have to sort out electronic waste. 3 A common example is use of a plasma torch as a final conversion step in an otherwise conventional gasifier. 4 Specific deployments of gasification technology range in size and feedstock processing capacity, from small and mobile (GIPO, Echo Energy) to large and highly customized (Chinook, TCG, Plasco Energy). For the purposes of this project, only large deployments were extensively researched.

9 | P a g e
conversion of MSW to a liquid fuel would best be completed by way of liquefaction of syngas. (Wilson, 2013; Stantec, 2011)
Conventional gasification
Conventional or air-fed gasification systems operate at temperatures between 800 and 1,800 degrees Celsius and utilize pure oxygen or forced air as a reactant. Most coal and biomass gasifiers currently operating in the United States fall into this category. Like pyrolysis gasifiers, conventional gasifiers require a feedstock with a relatively low moisture content, although not to the same degree. A key component of conventional gasification is the need for a feedstock of consistent composition. Conventional gasification of MSW generally requires sorting, drying, and blending of feedstocks to create a consistent fuel, although many vendors of this technology claim otherwise (See, for example, Chinook (2016a and b)). As in other gasification methods, MSW is shredded prior to use. The fuel blend for conventional gasification of MSW can accommodate up to a 50% blend of high-BTU fuel such as waste tires or coal. (Wilson, 2013; Stantec, 2011)
To date, in the United States, conventional gasification of MSW has enjoyed the most support from the United States Department of Energy (USDOE). USDOE’s database of domestic gasification facilities lists three planned facilities that will utilize MSW as a feedstock for the production of ethanol (1) and liquid fuels (2). (USDOE, 2016) The international version of that same database lists four relatively large conventional gasification-based waste-to-energy facilities as under construction in the UK, as well as one waste-to-liquids facility. (USDOE, 2016) None of the facilities included in the database are currently operating commercially.
Plasma arc gasification
Plasma arc gasification differs from the previous two technologies in a number of ways, but one of the chief differences is the use of a plasma torch, which operates at extremely high temperatures—from 2,000 to 2,800 degrees Celsius—with a low fuel-to-air ratio. Plasma arc gasification systems operate at temperatures typical of combustion systems, but at a significantly lower fuel-to-air ratio. Because of the very high temperatures, plasma gasification theoretically has less concern with feedstock moisture level or feedstock heterogeneity. For this reason, plasma gasification has proven useful for disposing of otherwise difficult to deal with industrial hazardous waste such as asbestos, munitions, and catalytic converters. (Wilson, 2013; Stantec, 2011; Sun, 2016)
Small plasma gasification facilities (10-20 tons per day) have been operating successfully in Japan and other Asian countries for some time now, although these facilities all utilize homogenous feedstocks (specific types of hazardous waste, most commonly) with a very low moisture content. Adoption and commercial viability of the technology appears to be increasing, particularly in China, which already has a fairly well-established coal gasification industry as well as a pressing need to deal with very high volumes of MSW. (Sun, 2016; Willis, 2010; Wikipedia, 2016; NETL 2010)
3.2.2 Case study: Plasco Energy – Trail Road Facility
Plasco Energy is based in Ontario, Canada. Utilizing a plasma arc gasification system, the company operated a test facility at the Trail Road Landfill in Ottawa. The Trail Road Facility converted MSW to syngas that then fueled reciprocating gas engines to generate electricity.
The facility had the ability to process up to 135 tons of MSW per day without any pre-sorting; however, Plasco made an effort to sort out any recyclable material. Remarkably, through the gasification process, Plasco was able to convert 95% of the MSW feedstock to syngas at a rate of 30,000 cubic feet per ton. Factoring in consumption at the facility, it was able to produce approximately 800 kWh of electricity per ton of waste—108,000 kWh per day.
10 | P a g e
Figure 4: The Plasco facility
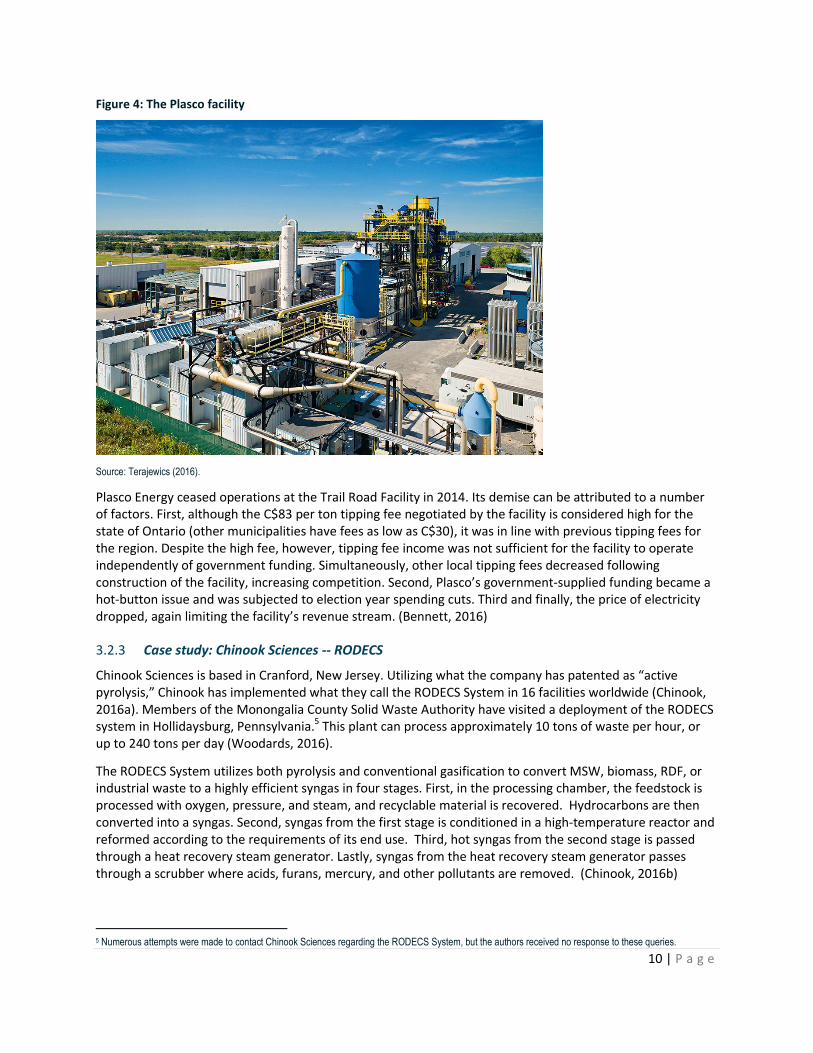
Source: Terajewics (2016).
Plasco Energy ceased operations at the Trail Road Facility in 2014. Its demise can be attributed to a number of factors. First, although the C$83 per ton tipping fee negotiated by the facility is considered high for the state of Ontario (other municipalities have fees as low as C$30), it was in line with previous tipping fees for the region. Despite the high fee, however, tipping fee income was not sufficient for the facility to operate independently of government funding. Simultaneously, other local tipping fees decreased following construction of the facility, increasing competition. Second, Plasco’s government-supplied funding became a hot-button issue and was subjected to election year spending cuts. Third and finally, the price of electricity dropped, again limiting the facility’s revenue stream. (Bennett, 2016)
3.2.3 Case study: Chinook Sciences -- RODECS
Chinook Sciences is based in Cranford, New Jersey. Utilizing what the company has patented as “active pyrolysis,” Chinook has implemented what they call the RODECS System in 16 facilities worldwide (Chinook, 2016a). Members of the Monongalia County Solid Waste Authority have visited a deployment of the RODECS system in Hollidaysburg, Pennsylvania.5 This plant can process approximately 10 tons of waste per hour, or up to 240 tons per day (Woodards, 2016).
The RODECS System utilizes both pyrolysis and conventional gasification to convert MSW, biomass, RDF, or industrial waste to a highly efficient syngas in four stages. First, in the processing chamber, the feedstock is processed with oxygen, pressure, and steam, and recyclable material is recovered. Hydrocarbons are then converted into a syngas. Second, syngas from the first stage is conditioned in a high-temperature reactor and reformed according to the requirements of its end use. Third, hot syngas from the second stage is passed through a heat recovery steam generator. Lastly, syngas from the heat recovery steam generator passes through a scrubber where acids, furans, mercury, and other pollutants are removed. (Chinook, 2016b)
5 Numerous attempts were made to contact Chinook Sciences regarding the RODECS System, but the authors received no response to these queries.

11 | P a g e
Chinook touts the RODECS System as having “black bag” capability (Chinook 2016c). Unlike similar gasification technologies, no pre-sorting or uniformization of non-homogenous feedstocks is required.
Figure 5: The Chinook facility in Hollidaysburg, Pennsylvania
Source: America.Pink (2016).
3.2.4 Case study: TCG Global
TCG Global, based in Englewood, Colorado, designs, builds, and operates gasification facilities. Recently, TCG Global developed a pro forma looking at the feasibility of a coal gasification facility in Morgantown that would produce diesel fuel. Among other things, this analysis calculated the price of diesel that would be required in order for the facility to turn a profit. Detailed results from this analysis are confidential.
The TCG process has four stages. First, the feedstock is taken through a pyrolysis chamber. Second, carbon char from the pyrolysis chamber is moved into an externally heated gasification reactor where carbon is converted to gas. Third, by way of the water-shift reaction, syngas is produced. Finally, hot syngas is cleaned through a proprietary process. (TCG, 2011)
Although facilities built by TCG can utilize any carbon based feedstock, they have not built a facility to run on MSW (Wiley, 2016). A facility based on the TCG process was put into commercial operation in 2007 in Colorado. It could process more than 175 tons of coal or petroleum coke per day and was eventually bought and moved to the University of Toledo. (TCG, 2011) This facility is no longer operational.

12 | P a g e
4. FEEDSTOCKS AND END PRODUCTS FOR A FACILITY IN MONONGALIA COUNTY
In this chapter, we consider basic information regarding the feedstocks and end products that could be used or generated by:
an MBT facility that creates a solid RDF, and
a conventional syngas facility that creates ammonia, diesel, or hydrogen.
Three model facilities are considered (See Table 2), all of which accept 200 tons per day of feedstocks. The first two facilities are fed by MSW only and differ only in that one is a RDF fuel facility, while the other is a syngas facility. The third, which is a syngas facility, is still predominantly fed by MSW, but it also includes 2 tons of waste tires and 23 tons of coal per day.
The size of these facilities is consistent with others mentioned above, including the Entsorga WV RDF facility (329 tons per day), the Chinook facility in Hollidaysburg, Pennsylvania (up to 240 tons per day), the Plasco facility (135 tons per day), and the TCG facility (175 tons of coal or petroleum coke per day).
Table 2: Daily feedstocks for model facilities (tons per day)
Facility Municipal solid
waste Coal Waste tires Total Refuse-derived Fuel Model Facility 200 0 0 200 Syngas Model Facility 1 200 0 0 200 Syngas Model Facility 2 175 23 2 200
Table 2 provides feedstock amounts in tons per day, which is instructive for questions regarding facility sizing and end product generation. Table 3 converts these feedstock amounts into annual amounts, for comparison with feedstock availability figures in Section 4.1. While the MSW and coal amounts are converted to tons per year, the waste tire amount is converted to tires per year.
Table 3: Annual feedstocks for model facilities
Facility
Municipal solid waste
(tons per year) Coal
(tons per year) Waste tires
(tires per year) Refuse-derived Fuel Model Facility 73,000 0 0 Syngas Model Facility 1 73,000 0 0 Syngas Model Facility 2 63,145 9,125 39,353
4.1 Feedstock availability
Three specific feedstocks are being considered for a waste-to-energy plant: MSW, waste tires, and coal. Availability of each feedstock is described below.
4.1.1 Municipal solid waste
The majority of solid waste in Monongalia County is managed by Republic Services. Waste is collected from residences, businesses, and industries throughout Morgantown, hauled to a transfer station at the Morgantown Industrial Park, and then loaded and sent to Short Creek Landfill near Wheeling, West Virginia. (Simcoe, 2014) Notably, Morgantown Disposal Services, a startup waste removal company, has recently

13 | P a g e
expanded its routine waste pickup services to over 500 homes in Monongalia County (Farrell, 2016). The company, which hauls the waste to a Pennsylvania landfill, is not subject to requirements of the PSC to obtain a certificate of convenience to operate (Baumgarten, 2016)
Diverting MSW from its current destinations, landfills, to new destinations such as a waste-to-energy facility presents a host of regulatory and other challenges. These include potential conflicts with current contracts, changes in solid waste law (e.g., the 2016 alteration of the West Virginia electronics disposal law) as well as questions about the regulatory environment for construction of materials recovery facilities in West Virginia. However, in this Phase 1 report, we do not consider these potential obstacles in detail. If this investigation continues into a second phase, these challenges will be considered in greater detail (See Chapter 6). Therefore, in this section, we consider the amount of waste that could potentially be diverted to a waste-to-energy facility should these challenges be addressed.
Monongalia County is the third-highest monthly producer of MSW in West Virginia, averaging 6,851 tons per month from January to December, 2013. (WVSWMB, 2015) The Mountaineer Transfer Station (MTS), located in Monongalia County, reports an average monthly intake of 8,846 tons. (Republic Services, 2015) The discrepancy between these two numbers is, we assume, due to either non-MSW waste included in the transfer station’s report, waste from outside of the county arriving at MTS, or an increase in MSW production between the respective reporting years (2013 and 2015).
The West Virginia Solid Waste Management Board (WVSWMB) anticipates a 27% increase in population over the next 20 years for Monongalia County, corresponding to an increase of monthly solid waste volumes for the county to 8,743 based on the 2015 number from WVSWMB, or 11,234 tons based on the number from MTS (WVSWMB, 2015).
Roughly, then, Monongalia County will be generating approximately 10,000 tons per month or 120,000 tons per year of MSW. This is significantly more MSW that required to feed the model facilities (See Table 3).
In addition to quantity, the composition of the county’s MSW is important with regards to waste-to-energy facilities, because different materials have different qualities in regards to their usefulness in creating RDF or syngas. Most waste-to-energy facilities under consideration in this report sort the MSW prior to any processing (or as part of the processing), but high quantities of undesirable or difficult-to-sort material will be an important factor in facility design.
No specific research on the composition of Monongalia County’s waste stream was found; however, two sources provide an indication of the composition. The first is a study, conducted by GAI on behalf of WVSWMB in 1997, was a waste characterization study for two wastesheds (Wastesheds F and H) in West Virginia. This study included 14 southern counties, excluding most of the coalfield counties. This study area is geographically diverse, including very rural areas and numerous large municipalities, including Charleston and Huntington. The first column in Table 4 presents results from this study, which are a summation of results from all counties. (WVSWMB, 2015)
A second source is a recent national waste characterization study that looked at the composition of municipal waste streams in 2010. This was summarized by WVSWMB in its 2015 report. Results from this study are shown in the second column in Table 4. (WVSWMB, 2015)
The percentage of the waste stream made up of paper is the most glaring difference between these two characterizations, and the difference between these two numbers is likely accounted for by an overall increase in recycling.
Waste composition is a crucial element of the planning process for a syngas facility, as well as a component of a facility’s daily operation. Glass and metals, for example, cannot be converted to syngas; these components typically must be removed from the waste stream via a sorting process. Biological waste may
14 | P a g e
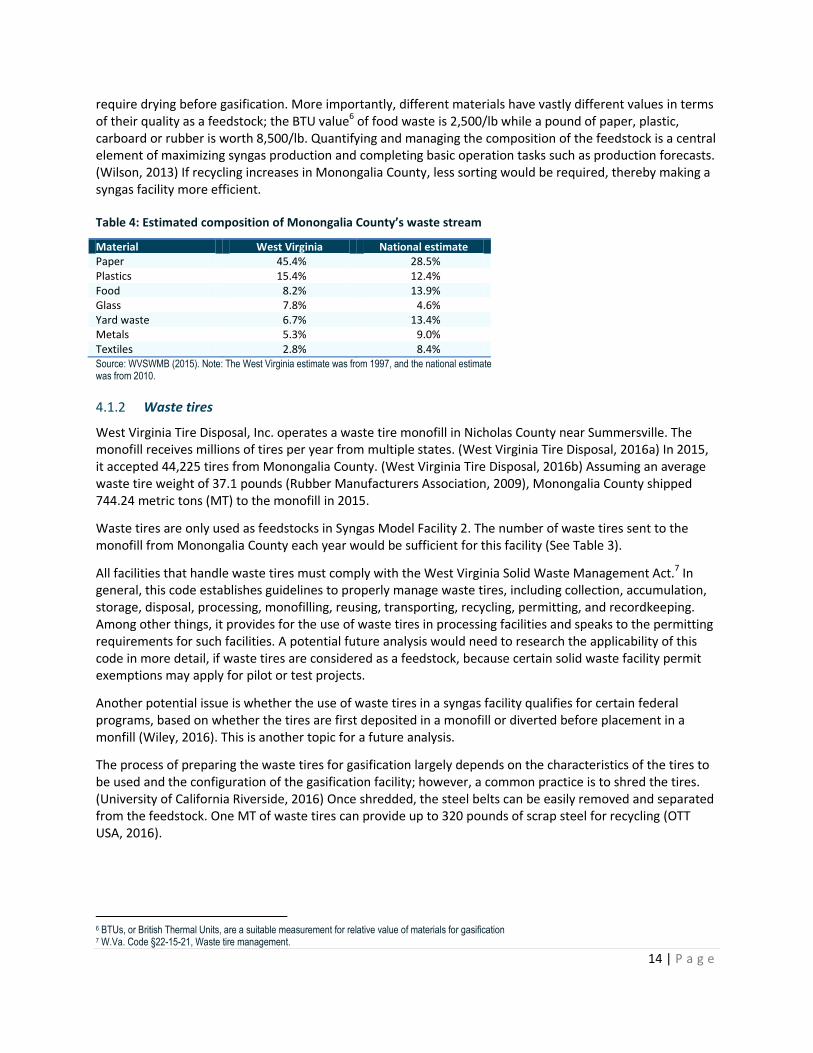
require drying before gasification. More importantly, different materials have vastly different values in terms of their quality as a feedstock; the BTU value6 of food waste is 2,500/lb while a pound of paper, plastic, carboard or rubber is worth 8,500/lb. Quantifying and managing the composition of the feedstock is a central element of maximizing syngas production and completing basic operation tasks such as production forecasts. (Wilson, 2013) If recycling increases in Monongalia County, less sorting would be required, thereby making a syngas facility more efficient.
Table 4: Estimated composition of Monongalia County’s waste stream
Material West Virginia National estimate Paper 45.4% 28.5% Plastics 15.4% 12.4% Food 8.2% 13.9% Glass 7.8% 4.6% Yard waste 6.7% 13.4% Metals 5.3% 9.0% Textiles 2.8% 8.4% Source: WVSWMB (2015). Note: The West Virginia estimate was from 1997, and the national estimate was from 2010.
4.1.2 Waste tires
West Virginia Tire Disposal, Inc. operates a waste tire monofill in Nicholas County near Summersville. The monofill receives millions of tires per year from multiple states. (West Virginia Tire Disposal, 2016a) In 2015, it accepted 44,225 tires from Monongalia County. (West Virginia Tire Disposal, 2016b) Assuming an average waste tire weight of 37.1 pounds (Rubber Manufacturers Association, 2009), Monongalia County shipped 744.24 metric tons (MT) to the monofill in 2015.
Waste tires are only used as feedstocks in Syngas Model Facility 2. The number of waste tires sent to the monofill from Monongalia County each year would be sufficient for this facility (See Table 3).
All facilities that handle waste tires must comply with the West Virginia Solid Waste Management Act.7 In general, this code establishes guidelines to properly manage waste tires, including collection, accumulation, storage, disposal, processing, monofilling, reusing, transporting, recycling, permitting, and recordkeeping. Among other things, it provides for the use of waste tires in processing facilities and speaks to the permitting requirements for such facilities. A potential future analysis would need to research the applicability of this code in more detail, if waste tires are considered as a feedstock, because certain solid waste facility permit exemptions may apply for pilot or test projects.
Another potential issue is whether the use of waste tires in a syngas facility qualifies for certain federal programs, based on whether the tires are first deposited in a monofill or diverted before placement in a monfill (Wiley, 2016). This is another topic for a future analysis.
The process of preparing the waste tires for gasification largely depends on the characteristics of the tires to be used and the configuration of the gasification facility; however, a common practice is to shred the tires. (University of California Riverside, 2016) Once shredded, the steel belts can be easily removed and separated from the feedstock. One MT of waste tires can provide up to 320 pounds of scrap steel for recycling (OTT USA, 2016).
6 BTUs, or British Thermal Units, are a suitable measurement for relative value of materials for gasification 7 W.Va. Code §22-15-21, Waste tire management.

15 | P a g e
4.1.3 Coal
Like any other carbonaceous feedstock, coal can be directly used in a gasifier, and it is available and abundant in the region. In recent years, coal production in West Virginia has dropped significantly. In the period from 2006 through 2015, coal production in West Virginia peaked in 2008, and it has dropped almost every year since then. While coal production in Monongalia County has also generally dropped in this time period, the largest decrease, by far, occurred from 2014 to 2015.
Figure 6: Recent coal production in West Virginia and Monongalia County
Sources: West Virginia production from United States Mine Safety and Health Administration (2016). Monongalia County production from West Virginia Office of Miners’ Health Safety and Training (2016).
Coal is only used as a feedstock for Syngas Model Facility 2. The amount of coal historically mined in Monongalia County each year is significantly greater than the amount that would be used (See Table 3). With coal production declining in West Virginia, any new demand for coal would likely be easily met.
4.1.4 Summary
Sufficient feedstocks are available for both of the model waste-to-energy facilities considered above. While feedstocks are sufficient, challenges will still need to be overcome in order to make MSW and waste tires available.
The most pressing challenge regarding MSW would be to divert waste currently under contract to be hauled to landfills.
The most pressing challenge regarding waste tires would be to clarify the state or federal regulations or laws that require tires to be sent to monofills rather than being diverted for local use.
No challenges are foreseen regarding generating sufficient coal for such a project.
0
2
4
6
8
10
12
0
20
40
60
80
100
120
140
160
180
2006 2007 2008 2009 2010 2011 2012 2013 2014 2015
Co
al m
ine
d in
Mo
no
nga
lia
Co
un
ty (m
illi
on
to
ns)
Co
al m
ine
d in
We
st V
irgi
nia
(mil
lio
n t
on
s)
West Virginia
Monongalia County

16 | P a g e
4.2 Markets for end products
Four specific end products are being considered for a waste-to-energy plant. The first end product, RDF, would be generated by a RDF plant. The other three—ammonia, diesel, and hydrogen—would be generated by a syngas facility. Potential markets for each end product are described below.
4.2.1 Refuse-derived fuel
The Refuse-derived Fuel Model Facility would generate approximately 30,417 tons per year of RDF (assuming the same ratio of tons of RDF per ton of MSW projected for the Entsorga WV facility).
Facilities that may be able to use RDF include those that currently use coal, with the exception of power plants that utilize pulverized coal-fired boilers. The consistency of the RDF would have to be finer than what is technically possible in order to work with that type of boiler configuration (Douglas, 2016).
Another potential customer for RDF would be an incinerator or mass-burn facility. These facilities generally prepare a custom blend of RDF optimized for their particular system. West Virginia does not have any such facilities, but there are a small number in neighboring states, including three in the region of Harrisburg, Pennsylvania (Michaels and Shiang, 2016).
A third option, as in the case of the Entsorga WV facility, would be to substitute RDF for coal or other fossil fuels in an industrial operation such as a cement plant or a facility that utilizes a coal-fired boiler. Substituting RDF for coal to fuel industrial or commercial boilers should also be investigated.
Because RDF is not widely known or used, it will be important to negotiate an agreement with a buyer before deciding to build an RDF plant. Even after finding a local facility, the price of the RDF would have to be competitive with the price of coal.
4.2.2 Diesel
A syngas facility can produce diesel using the Fischer-Tropsch process, a catalytic chemical reaction that converts carbon monoxide and hydrogen in syngas into liquid transportation hydrocarbon fuels. (USDOE, 2016c)
Of the three feedstocks under consideration, more diesel is produced per MT from waste tires than from coal or MSW (See Table 5).
Table 5: Amount of diesel produced by different feedstocks (gallons)
Feedstock Production per metric ton
of feedstock Waste tires 143 Coal 75 Municipal solid waste 38 Sources: MSW and wastes tires from OTT USA (2016). Coal from CTL Fuels (2016).
These factors allow an estimate to be calculated of the diesel that could be produced from Syngas Model Facility 1 and Syngas Model Facility 2 (See Table 6). The amount of diesel produced by these model facilities would be only approximately 1% of the total diesel sales in West Virginia (See Figure 7), suggesting that if a syngas plant could produce diesel fuel at a competitive price, it is likely that the diesel could be marketed.
Table 6: Annual diesel production for model facilities (million gallons per year)
Facility Diesel production Syngas Model Facility 1 2.5 Syngas Model Facility 2 2.9

17 | P a g e
Figure 7: No. 2 diesel sales in West Virginia (million gallons per year)
Source: United States Energy Information Administration (2016c).
4.2.3 Hydrogen
By way of the water-gas-shift reaction, carbon dioxide can be used as a chemical reducing agent to convert syngas entirely to hydrogen (Syngaschem, 2014).
Hydrogen is considered to be a clean transportation fuel and has the potential to reduce the country’s dependence on foreign petroleum (Deaton, 2016). It can be used as fuel in converted internal combustion engines, or for fuel cells. There are currently 29 public and 25 private hydrogen fueling stations in the United States, none of which are located in West Virginia (US Department of Energy, 2016a). West Virginia University owns a hydrogen fueling station in Morgantown, West Virginia, but it is not operational at this time (Davis, 2016).
Beyond the transportation industry, hydrogen has numerous industrial applications, including uses in the glass, plastics, and pharmaceutical industries (Royal Society of Chemistry, 2016).
The majority of hydrogen production in the United States is located at or very near to where it is ultimately consumed and is produced via steam reforming of natural gas, which is the cheapest, most efficient means of producing hydrogen (USDOE, 2016b). Oil refineries are a large producer and consumer of hydrogen, as it is used extensively in the production of transportation fuels. Because of this, domestic hydrogen production is centered in California, Louisiana, and Texas, although high levels of production are also found in the Mississippi River valley and Northeastern United States. (Lipman, 2011)
Hydrogen is utilized for many other applications, although the production of hydrogen fuel cells is the market sector that has experienced the largest growth in recent years. Hydrogen of sufficient quality to be utilized in fuel cells is more difficult to store and deliver, however, causing distance to market from place of production to become a very important factor. (Lipman, 2011)
0
50
100
150
200
250
300
350
400
450
500
2003 2004 2005 2006 2007 2008 2009 2010 2011 2012
Die
sel s
ale
s (M
illio
n g
allo
ns)

18 | P a g e
In Monongalia County, local barriers to a hydrogen market include large volumes of cheap natural gas, high costs of conversion for internal combustion gas engines to accept fuel cells, and the reluctance of companies producing fuel cell vehicles to bring that technology to West Virginia. (Davis, 2016)
Because hydrogen is not widely used, it will be important to negotiate an agreement with a buyer before deciding to build a syngas plant that generates hydrogen as an end product.
4.2.4 Ammonia
Hydrogen produced by way of the water-gas-shift reaction can be combined with nitrogen through the Haber-Bosch process to create ammonia (Clark, 2014).
Ammonia has many potential commercial applications, however, 87% of domestically produced ammonia is consumed by the agricultural industry for use in fertilizer (Apodaca, 2011). Within this industry, it is used to manufacture a range of fertilizers, which include raw ammonia, ammonium nitrate, ammonium dihydrogen phosphate, sulfate, and urea. Outside of agriculture, ammonia is used in alkaline cleaners and in the manufacture of numerous goods, including synthetic fibers and resins, plastics, and explosives (Apodaca, 2011; EasyChem, 2016).
Table 7: United States ammonia-based fertilizer imports and exports in 2012
Exports Imports
Commodity Short tons Million dollars Short tons Million dollars Ammonium Nitrate (Solid) 369,362 107 938,283 251 Ammonium Sulfate 1,428,243 361 274,619 73 Anhydrous Ammonia 41,504 22 6,938,744 3,593 Aqua Ammonia 6,549 4 96,517 15 Monammonium Phosphate (MAP) 2,653,545 1,277 546,707 282 Sulfur - 0 2,259,686 0 Urea (Solid) 370,694 209 7,654,464 3,211 Source: United States Department of Agriculture (2016).
The domestic ammonia industry is centered in Louisiana, Oklahoma, and Texas, in no small part due to the large amount of natural gas and associated infrastructure in that region. Outside of these three states, the majority of US ammonia plants are located in Midwestern states, presumably in geographic proximity to high-intensity agriculture. (Brown, 2013) In 2010, 56% of the United States’ ammonia consumption was from ammonia produced in the United States, and the remainder was imported. Today, there are no ammonia plants in West Virginia; however, 33 facilities “produce, process, or use” ammonia in the Mountain State (U.S. Department of Health and Human Services, 2004).

19 | P a g e
5. GREENHOUSE GAS EMISSIONS ASSOCIATED WITH A WASTE-TO-ENERGY FACILITY IN MONONGALIA COUNTY
Whether a waste-to-energy plant results in net increases or decreases in GHG emissions is an important question. If it results in a decrease in emissions, then the facility may garner additional support from the public and from government agencies, and it could potentially capture the value of those reduced emissions as a funding stream. If, however, it results in an increase in emissions, additional roadblocks will likely be encountered.
The key GHGs of concern in this analysis are CO2 and methane. CO2 is generated when fossil fuels are combusted. Within the context of this project, CO2 is relevant regarding the emissions generated by the facility itself (for example, to provide heat to the transform the feedstock to the end product or to generate electricity to run the equipment that prepares the feedstock for use). CO2 is also generated by trucks that currently haul MSW to the landfill; these emissions will be avoided if the MSW is used locally at an RDF or syngas plant.
Methane is generated at the landfill as MSW decomposes. Methane emissions will also be avoided if the MSW is used locally at an RDF or syngas plant.
The following categories of emissions are considered in this report:
1. direct emissions in the production of RDF or the syngas and end products in the waste-to-energy
facility, and
2. avoided indirect emissions avoided by diverting MSW from a landfill to a waste-to-energy plant.8
5.1 Direct emissions
RDF and syngas plants use energy and generate emissions. These emissions are an important factor in calculating the GHG implications of a given technology. Many studies provide context regarding GHG and other emissions from syngas facilities (Maize, 2016; Watkins and McKendry, 2015a; Watkins and McKendry, 2015b; California Air Resources Board, 2013; Simpkins et al., 2013; Wilson et al., 2013; Youngs, 2011; Zaman, 2010).
In addition, waste-to-energy vendors make claims regarding GHG emission reductions (Entsorga WV, 2016a; Plasco Energy Group, 2016; Chinook Sciences, 2016c; Bennett, 2016).
Direct GHG emissions have not yet been quantified for the model facilities.
5.2 Avoided indirect emissions
Indirect emissions are those avoided by diverting MSW from a landfill to a waste-to-energy plant. A recent community GHG inventory for the City of Morgantown presented a method for calculating these avoided emissions (Simcoe et al., 2014). GHG emissions generated from MSW include:
1. methane generated at the landfill as the MSW decomposes,
2. CO2 emitted by landfill equipment, and
3. CO2 emitted by the trucks that transport MSW to the landfill.9
8 Opportunities for CO2 sequestration were also considered but were not found to be feasible in the Phase 1 analysis. 9 While the Community Greenhouse Gas Inventory also included emissions from trucks that collect waste from people’s homes, these emissions will be generated whether that waste is sent to a landfill or to a waste-to-energy facility. Therefore, these emissions are omitted in this report.

20 | P a g e
As illustrated in Table 8, the three model facilities result in substantial avoided indirect emissions because they divert between 175 and 200 tons per day of MSW. For comparison, this table also shows that a plant utilizing 100% waste tires or 100% coal would not generate the same avoided GHG emissions.
Table 8: Avoided indirect emissions from model facilities and other facilities (MT CO2e per year)
Category Syngas Model
Facility 1 Syngas Model
Facility 2 RDF Model
Facility 100% waste
tire 100% coal MSW transport 807 698 807 0 0 Landfill equipment 1,197 1,036 1,197 0 0 Waste decomposition 20,696 17,902 20,696 0 0 Total 22,700 19,636 22,700 0 0

21 | P a g e
6. CONCLUSIONS
Based on the technology descriptions and case studies presented in Chapter 3, the analysis of feedstocks in Section 4.1, the analysis of end products in Section 4.2, and the assessment of GHG emissions in Chapter 5, we draw the several conclusions.
6.1 Technology choice
The syngas technology that best matches the MCSWA’s needs is conventional gasification. There are three general categories of syngas plants: conventional, pyrolysis, and plasma arc. Proprietary technologies offered by vendors sometimes appear not to fit neatly within one of these technologies; however, conventional systems, in general, are best suited to the requirements of MCSWA.
Modular technologies make it is possible to mix MSW, coal, and waste tires in a single facility to produce syngas. Mixing feedstocks would allow the system to start with one feedstock and transition to another. It would also allow feedstocks to change if the economics of different feedstocks change over time.
6.2 Feedstocks
Monongalia County alone generates sufficient MSW to fuel a roughly 200 ton-per-day RDF or syngas facility. Additional MSW from nearby counties would make even more MSW available. While large quantities of MSW are generated, significant regulatory and contractual issues would need to be addressed in order to divert the MSW from landfills to a waste-to-energy plant.
The number of waste tires sent to the Nicholas County monofill from Monongalia County each year would be sufficient to provide approximately 2 tons per day to a syngas facility. Additional waste tires could potentially be diverted from nearby counties or from other areas that currently ship these tires to the monofill. While a significant number of waste tires are generated, regulatory issues would need to be addressed in order to divert the tires from entering the monofill or to remove previously monofilled tires for use in a waste-to-energy plant.
Sufficient coal can be mined locally to fuel a syngas facility. The amount of coal historically mined in Monongalia County each year is significantly greater than the amount that would be used in a syngas facility. With coal production declining in West Virginia, any new demand for coal would likely be easily met. No significant regulatory issues are envisioned with respect to the mining of coal for use at a syngas facility. Regulatory hurdles may be encountered, however, with regard to GHG emissions.
6.3 End products
Because RDF is not widely known or used, it will be important to negotiate an agreement with a buyer before deciding to build an RDF plant. While more local research is needed, options include local facilities that now utilize coal, including, for example, certain power plants or cement plants. Even after finding a local facility, the price of the RDF would have to be competitive with the price of coal.
There is sufficient local demand to purchase the diesel produced by a syngas facility; however, the market price of diesel would need to be high enough in order for diesel from a syngas facility to compete with diesel produced elsewhere. The model syngas facilities considered in this report would produce 2-3 million gallons of diesel fuel per year, which is approximately 1% of the total amount of diesel sold in West Virginia.
Because hydrogen is not widely used, it will be important to negotiate an agreement with a buyer before deciding to build a syngas plant that generates hydrogen as an end product. Most hydrogen is produced

22 | P a g e
close to where it is ultimately consumed, and hydrogen consumption is concentrated far from Monongalia County. Barriers in Monongalia County present challenges for securing a local market.
While there is an ongoing, high demand for ammonia, the market price of ammonia would need to be high enough in order for ammonia from a syngas facility to compete with ammonia produced elsewhere. Millions of tons of ammonia-based fertilizer products, which are worth billions of dollars, are imported into the United States each year, and ammonia is also used in non-agricultural sectors. Still, in order to profitably sell the ammonia produced by a syngas facility, it would need to compete based on price. With natural gas prices low today, it is unlikely that ammonia produced from syngas could be competitive.
6.4 Greenhouse gas emissions
A full GHG accounting can only be completed with more details on a selected technology. Avoided indirect GHG emissions are significant for a plant that utilizes MSW; however, direct emissions can only be calculated with more details on a selected technology.
6.5 Feasibility determination
Of the modern technologies for the post-collection utilization of MSW, syngas is the least common and most risky. Other waste-to-energy options include, for example, enhanced combined heat and power incineration, RDF, thermal conversion, and waste-to-fuel facilities. Non-energy post-collection options include material recycling facilities and other new technologies that allow for the separation of valuable recyclables.
No confirmed commercially viable MSW syngas facilities are in operation in the United States. Some demonstration projects are in operation or have operated in the past, but data are not available for these facilities to confirm whether they are commercially viable.
To be viable in the long term, a syngas facility would need to produce end products that can compete in the marketplace; however, current conditions are challenging. Natural gas is a primary feedstock for the production of ammonia, and the price of natural gas is now very low. Diesel fuel is another potential end use, and the price of diesel fuel is also now very low. The third end use considered, hydrogen, does not have a mature market.
Tipping fees would likely need to be high. Anecdotal evidence suggests that tipping fees charged to waste haulers are a “make or break” element of any gasification project’s economic viability.
A syngas facility is not feasible today, given the economics of the technology and the likely markets for end products. End products need to competitive in the marketplace, and tipping fees need to be high enough, for a syngas facility to turn a profit. With low natural gas and diesel prices and an uncertain market for hydrogen, syngas is not feasible under today’s market conditions.
Syngas technology should be monitored over the next months and years to determine whether the conditions are shifting toward feasibility. Markets change over time, and technology evolves. If large natural gas pipelines are built that allow natural gas produced in West Virginia and Pennsylvania to reach distant markets, the price of natural gas would likely increase. This would tend to make end products from a syngas facility more cost-competitive. It is also possible that the price of diesel will also increase in the future. In addition to tracking these trends, it will be important to track the success of domestic commercial syngas facilities. In particular, the MSW syngas plant planned for St. Lucie County, Florida may prove that the technology can commercially viable in the United States. Also, the coal-to-liquids syngas plant planned for Mingo County, West Virginia, while not an MSW facility, can still be instructive if it succeeds in West Virginia.

23 | P a g e
The RDF technology may be feasible, given the right end user, but it should be monitored before making a final determination. Entsorga WV is currently constructing such a facility in Berkeley County, West Virginia. The RDF will be sold to the nearby Essorc Cement Company. The Berkeley County facility should be carefully monitored before making a final feasibility determination. If it proves to be commercially viable, then an RDF facility should be investigated further for Monongalia County. Careful consideration should also be given to the handling of electronic waste.

24 | P a g e
7. PROPOSED PLAN FOR PHASE 2
According to the scope of work for this report, if one or more of the reviewed technologies was found to be feasible, then a proposed plan for conducting a more detailed Phase 2 analysis and report was to be included. It was envisioned that this plan would include:
an outline of the document;
a description of which technology(ies) will be assessed in Phase 2;
a detailed description of each type of analysis to be conducted;
a detailed list of partners to involve in the analysis;
a detailed list of stakeholders;
an estimated budget range;
suggested funding sources; and
a suggested timeline.
It was further envisioned that the analyses that may be included in the full Phase 2 report might include, but would not be limited to:
a detailed pro forma financial analyses of the chosen technologies;
more detailed GHG analyses of the chosen technologies;
mapping and siting analyses, which utilize geographic information systems to investigate potential locations based on multiple factors; and
a policy analysis, including how such a plant can fit within the evolving GHG regulatory structure
Given the conclusions presented above, however, the contents of Phase 2 that were originally envisioned are premature. Instead, we recommend a more modest Phase 2, in order to carefully monitor market conditions and certain key facilities that are currently proposed or under construction. Monitoring these market conditions and facilities would give additional important information regarding the potential commercial feasibility of an MSW RDF or syngas facility—information that would be important before engaging in the detailed analyses originally envisioned for Phase 2.
7.1 Tasks
In Phase 2, we suggest monitoring the following market conditions:
the price of natural gas, along with factors that influence that price (including, for example, permitting and construction of natural gas pipelines from West Virginia and Pennsylvania, shale gas drilling and production levels, and the construction of local facilities such as power plants that will consume large amounts of natural gas);
the price of diesel fuel;
potential local users of RDF;
potential local users of hydrogen; and
potential local users of ammonia.
We suggest monitoring the following facilities:
Entsorga WV’s RDF facility in Berkeley County, West Virginia;
Chinook’s demonstration facility in Hollidaysburg, Pennsylvaina;
the proposed MSW syngas facility in St. Lucie County, Florida;
the proposed Sierra Biofuels plant in Nevada that will convert MSW into aviation fuel; and
the proposed CTL facility in Mingo County, West Virginia.

25 | P a g e
In addition, we suggest continued discussions with representatives from Plasco Energy Group in Ontario, Canada. Although Plasco’s facility is no longer operational, it ran for seven years, and discussions in the preparation of this report were very helpful.
7.2 Timeline
A one-year timeline would allow sufficient time for market conditions to change and for additional lessons to be drawn from the facilities being tracked. For example, the Entsorga WV facility should be operational within that time period. Further, if facilities currently in the planning stage do not move significantly forward in another year, this would provide additional support for a cautious approach toward moving forward in Monongalia County
7.3 Budget
An estimated Phase 2 budget includes approximately 20 hours per month to monitor each of the market factors and facilities. This totals approximately 240 hours of labor over one year.
Much more can be learned by actually visiting a facility than via phone calls or internet research. For this reason, the estimated Phase 2 budget includes site visits to three of the facilities listed. These site visits, on average per visit, include 40 hours of labor to prepare, travel, conduct the visit, and write up the results. The budget also includes $1,000 in travel expenses for each site visit.
The estimated Phase 2 budget includes another 50 hours of labor to write and present the final report.
In total, the budget includes 410 hours of labor and $3,000 in travel expenses. At an estimated average charge rate of $80, the estimated budget totals $35,800.

26 | P a g e
REFERENCES
America.Pink. 2016. Chinook Sciences: Patents. http://america.pink/chinook-sciences_963820.html
Apodaca, Lori E. 2011. Nitrogen (Fixed) – Ammonia. U.S. Geological Survey, Mineral Commodity Summaries. January. http://minerals.usgs.gov/minerals/pubs/commodity/nitrogen/mcs-2011-nitro.pdf
Baumgarten, M. 2016. Second Trash Removal Company Operating In Monongalia County: Is it Legal?. http://www.wdtv.com/wdtv.cfm?func=view§ion=5-News&item=Second-Trash-Removal-Company-Operating-in-Monongalia-County-Is-it-Legal-27980
Bennett, Randy. 2016. Senior Advisor, Plasco Energy Group. Personal communication with author J. James & E. Fedorko. April 21.
Brown, Trevor. 2013. Ammonia plants in North America. https://www.google.com/fusiontables/data?docid=1vXUF9q5X0vbWID_JAzpxaByp28lwlr3gs0y2zg8#map:id=3
California Air Resources Board. 2013. Municipal Solid Waste Thermal Technologies. September. http://www.arb.ca.gov/cc/waste/mswthermaltech.pdf
Center for Sustainable Systems, University of Michigan. 2015. “Municipal Solid Waste Factsheet.” Pub. No. CSS04-15. October. http://css.snre.umich.edu/css_doc/CSS04-15.pdf.
Chandak, Surya P. 2010. Trends in Solid Waste Management: Issues, Challenges and Opportunities. Presentation, International Consultative Meeting on Expanding Waste Management Services in Developing Countries, March 18-19, 2010. http://81.47.175.201/flagship/attachments/UNEP_Waste.pdf.
Chinook Sciences. 2016a. THE PROCESS. http://www.chinooksciences.com/the-process/#.V5JFW7grKM8
________________. 2016b. The RODECS SYSTEM. http://www.chinooksciences.com/the-rodecs-system/#.V5JFD7grKM8
________________. 2016c. NET REDUCTION IN GREENHOUSE GASES. http://www.chinooksciences.com/reduction-in-greenhouse-gases/#.V5YgMrgrKUk
Clark, Jim. 2014. “Case Study: The Haber Process.” May 19. http://chemwiki.ucdavis.edu/Core/Physical_Chemistry/Equilibria/Case_Studies/Haber_Process
CTL Fuels. 2016. CTL Fuels, Inc. – Using Coal to Move the World. http://www.ctlfuels.com/the-ctl-process.html
Davis, William. 2016. Director, National Alternative Fuels Training Center. Personal communication with author J. James. June 20.
Deaton, Jamie P. 2016. “What’s the difference between a fuel cell vehicle and a hydrogen-on-demand vehicle?” http://auto.howstuffworks.com/fuel-efficiency/alternative-fuels/fuel-cell-difference.htm
Department for Environment Food & Rural Affairs. 2013. Mechanical Biological Treatment of Municipal Solid Waste. February. https://www.gov.uk/government/uploads/system/uploads/attachment_data/file/221039/pb13890-treatment-solid-waste.pdf.
Douglas, J. 2016. Environmental Manager, Longview Power. Personal communication with author J. James. March 31.

27 | P a g e
EasyChem. 2016. Industrial uses of ammonia. http://www.easychem.com.au/monitoring-and-management/maximising-production/industrial-uses-of-ammonia
Entsorga WV. 2016a. Frequently Asked Questions. http://entsorgawv.com/faq.
________________. 2016b. Groundbreaking Held on January 6, 2016 in Martinsburg, West Virginia, Entsorga West Virginia Announces U.S.’s First Resource Recovery Facility to Utilize Mechanical Biological Treatment. January 6. http://www.entsorgawv.com/news/2016-06-08-20-42-31
Farrell, N. 2016. Morgantown Disposal to Expand Operations in Monongalia County. http://www.wvalways.com/story/31380352/morgantown-disposal-to-expand-operations-in-monongalia-county
Fulcrum Bioenergy. 2016. Sierra Biofuels Plant. http://fulcrum-bioenergy.com/facilities/.
Grand View Research. 2015. “Waste To Energy (WTE) Market Will Be Worth $37.64 Billion By 2020.” February. https://globenewswire.com/news-release/2015/02/02/701987/10118057/en/Waste-To-Energy-WTE-Market-Will-Be-Worth-37-64-Billion-By-2020-New-Report-By-Grand-View-Research-Inc.html.
Herald Scotland Staff. 2015. “New £111m recycling and power plant to be built in South Lanarkshite.” Herald Scotland: Mar 22. http://www.heraldscotland.com/news/13206929.New___111m_recycling_and_power_plant_to_be_built_in_South_Lanarkshire/.
Lane, Jim. 2015. United Airlines invests $30M in Fulcrum BioEnergy; inks $1.5B in aviation biofuels contracts. Biofuels Digest, June 30. http://www.biofuelsdigest.com/bdigest/2015/06/30/united-airlines-invests-30m-in-fulcrum-bioenergy-inks-1-5b-in-aviation-biofuels-contracts/.
Lawrence, M. and Woods, E. 2014. Advanced Collection, Processing, Energy Recovery, and Disposal Technologies for the Municipal Solid Waste Value Chain: Global Market Analysis and Forecasts. Second Quarter, 2014.
Lipman, T., Ph.D. 2011. An overview of hydrogen production and storage systems with renewable hydrogen case studies. May. http://www.cesa.org/assets/2011-Files/Hydrogen-and-Fuel-Cells/CESA-Lipman-H2-prod-storage-050311.pdf
Maclennan, Barb. 2016. Ph.D. candidate, West Virginia University. Personal communication with author E. Fedorko. May 5.
Maize, Kennedy. 2016. Energy from Waste: Greenhouse Gas Winner or Pollution Loser? POWER. July 1. http://www.powermag.com/energy-waste-greenhouse-gas-winner-pollution-loser/
Messenger, Ben. 2016. “Air Products to Ditch Plasma Gasification Waste to Energy Plants in Teeside.” Waste Management World: April 5. https://waste-management-world.com/a/air-products-to-ditch-plasma-gasification-waste-to-energy-plants-in-teesside.
Michaels, T. and Shiang, I. 2016. Energy Recovery Council 2016 Directory of Waste-to-Energy Facilities. http://energyrecoverycouncil.org/wp-content/uploads/2016/05/ERC-2016-directory.pdf
National Energy Technology Laboratory. 2016a. Gasification Plant Databases, June 2016. https://www.netl.doe.gov/research/coal/energy-systems/gasification/gasification-plant-databases
________________. 2016b. Gasifipedia. Accessed July 24. http://www.netl.doe.gov//File%20Library/Research/Coal/energy%20systems/gasification/gasifipedia/index.html
28 | P a g e
Navigant Research. 2012. “Global Waste-to-Energy Markey to Reach $29.2 Billion by 2022.” March. http://www.navigantresearch.com/newsroom/global-waste-to-energy-market-to-reach-29-2-billion-by-2022.
OTT USA. 2016. Energy and Products from Waste. Accessed July 24. http://www.ottusa.com/synthetic_fuel/synthetic_fuel.htm
Plasco Energy Group. 2016. Superior Environmental Performance. http://www.plascoenergygroup.com/our-performance/environmental-performance
Renewable Energy From Waste Staff. 2015. “Green3Power awarded $175 million for Florida waste-to-fuels facility.” July. http://www.rewmag.com/article/green3power-155-million-waste-to-fuels-facility/.
Republic Services. 2015. 2015 Annual Operations Report.
Royal Society of Chemistry. 2016. “Hydrogen.” http://www.rsc.org/periodic-table/element/1/hydrogen/.
Rubber Manufacturers Association. 2009. Scrap Tire Markets in the United States. May. http://www.genan.eu/Files/Filer/pdf/Scrap_Tire_Markets_In_The_Unites_States.pdf
Simcoe, J., B. Gilmer, E. Hansen. 2014. Community Greenhouse Gas Inventory for Morgantown, West Virginia. Downstream Strategies. http://downstreamstrategies.com/documents/reports_publication/community-greenhouse-gas-inventory-morgantown-wv_final.pdf
Simpkins, Travis, Jana Milford, and Kip Funk. 2013. Waste Not, Want Not: Analyzing the Economic and Environmental Viability of Waste-to-Energy (WTE) Technology for Site-Specific Optimization of Renewable Energy Options. The Joint Institute for Strategic Energy Analysis. Technical Report NREL/TP-6A50-52829. February.
Stantec. 2011. Waste To Energy: A Technical Review of Municipal Solid Waste Thermal Treatment Practices. March. http://www.incinerateur.qc.ca/documents/bcmoe-wte-emmissions-rev-mar2011.pdf.
Sun, Qingyun. 2016. Associate Director, US-China Energy Center, WVU.Personal communication with author E. Fedorko. February 5.
Syngaschem. 2014. “Synthesis Gas Chemistry and Synthetic Fuels.” http://www.syngaschem.com/syngaschem/.
TCG Global. 2011. TCG Global Gasification System. http://www.tcgenergy.com/media/whitepaper_2011.pdf
Terajewics, P. 2016. Plasco Energy Group’s advanced technologies turn waste into an opportunity. http://www.theneweconomy.com/technology/plasco-energy-groups-advanced-technologies-turn-waste-into-an-opportunity
The State Journal. 2012. “TransGas coal-to-liquids plant construction expected Q1 2013.” http://www.statejournal.com/story/18768936/transgas-coal-to-liquids-plant-construction-expected-q1-2013/.
TransGas Development. 2012. “Adams Fork Energy.” http://www.transgasdevelopment.com/projects/#adams.
United States Department of Agriculture. 2016. Fertilizer Imports/Exports. http://www.ers.usda.gov/data-products/fertilizer-importsexports/custom-queries.aspx
United States Department of Energy. 2016a. Alternative Fueling Station Counts By State. July 21. http://www.afdc.energy.gov/fuels/stations_counts.html

29 | P a g e
________________. 2016b. “Hydrogen Production and Distribution.” http://www.afdc.energy.gov/fuels/hydrogen_production.html
________________. 2016c. Fischer-Tropsch Synthesis. https://www.netl.doe.gov/research/coal/energy-systems/gasification/gasifipedia/ftsynthesis
United States Department of Health and Human Services. 2004. Toxicological Profile for Ammonia. http://www.atsdr.cdc.gov/toxprofiles/tp126.pdf
United States Energy Information Administration. 2016a. Natural Gas Citygate Price in West Virginia. http://tonto.eia.gov/dnav/ng/hist/n3050wv3a.htm
________________. 2016b. U.S. No 2 Diesel Retail Prices (Dollars per Gallon). Release date July 18. http://tonto.eia.gov/dnav/pet/hist/LeafHandler.ashx?n=PET&s=EMD_EPD2D_PTE_NUS_DPG&f=M
________________. 2016c. Prime Supplier Sales Volumes for West Virginia. http://www.eia.gov/dnav/pet/pet_cons_prim_dcu_swv_a.htm.
United States Environmental Protection Agency. 2009. Opportunities to Reduce Greenhouse Gas Emissions through Materials and Land Management Practices. September. https://www3.epa.gov/region9/climatechange/pdfs/ghg-land-materials-management.pdf.
________________. 2015. Advancing Sustainable Materials Management: 2013 Fact Sheet. June. https://www.epa.gov/sites/production/files/2015-09/documents/2013_advncng_smm_fs.pdf.
United States Mine Safety and Health Administration. 2016. Employment/Production Data Set (Yearly). http://arlweb.msha.gov/OpenGovernmentData/OGIMSHA.asp
University of California Riverside. 2006. Technology Evaluation and Economic Analysis of Waste Tire Pyrolysis, Gasification, and Liquefaction. March. http://www.calrecycle.ca.gov/publications/Documents/Tires%5C62006004.pdf
Velis, C.A., P.J. Longhurst, G.H. Drew, R. Smith, S.J.T. Pollard. 2010. Production and quality assurance of solid recovered fuels using mechanical-biological treatment (MBT) of waste: a comprehensive assessment. Critical Reviews in Environmental Science and Technology. 40(12):979-1105. https://core.ac.uk/download/files/23/141146.pdf.
Voegele, Erin. 2014. USDA awards loan guarantee to Fulcrum Sierra Biofuels. Biomass Magazine, September 4. http://biomassmagazine.com/articles/10889/usda-awards-loan-guarantee-to-fulcrum-sierra-biofuels.
Waste Management World Staff. 2015. “40,000 TPA Waste to Energy Project in Scotland to Use Gasification/RDF.” Waste Management World: March 23. https://waste-management-world.com/a/40-000-tpa-waste-to-energy-project-in-scotland-to-use-gasificationrdf.
Watkins, Pete and Peter McKendry. 2015a. Assessment of waste derived gases as a renewable energy source – Part 1. Sustainable Energy Technologies and Assessments. Retrieved February 23, in press, final publication date not known.
________________. 2015b. Assessment of waste derived gases as a renewable energy source – Part 2. Sustainable Energy Technologies and Assessments 10:114–124
West Virginia Office of Miners’ Health Safety and Training. 2016. West Virginia Mining Statistics 1996-2012. Last updated: April 14. http://www.wvminesafety.org/STATS.HTM
West Virginia Solid Waste Management Board. 2015. West Virginia Solid Waste Management Plan, 2015. http://www.state.wv.us/swmb/RMDP/2015-SWMP.pdf
West Virginia Tire Disposal, Inc. 2016a. http://www.wvtiredisposal.com/index.html

30 | P a g e
________________. 2016b. Personal communication with author J. James. March 29.
Wikipedia. 2016. “Plasma gasification commercialization.” https://en.wikipedia.org/wiki/Plasma_gasification_commercialization.
Wiley, Mark. 2016. Managing Member, TCG Global. Personal communication with authors E. Hansen, J. James, & E. Fedorko. April 25.
Willis, Ken P. and Osada, Shinichi. 2010. Plasma Gasification: Lessons Learned at Ecovalley WTE Facility. From the Proceedings of the 18th Annual North American Waste-To-Energy Conference. May 11-13. http://www.seas.columbia.edu/earth/wtert/sofos/nawtec/nawtec18/nawtec18-3515.pdf.
Wilson, B., N. Williams, B. Liss, B. Wilson. 2013. A Comparative Assessment of Commercial Technologies for Conversion of Solid Waste to Energy. October. https://www.researchgate.net/profile/Brandon_Wilson/publication/280080635_A_Comparative_Assessment_of_Commercial_Technologies_for_Conversion_of_Solid_Waste_to_Energy/links/55a6ca1708ae51639c5746e5.pdf.
Woodards, S. 2016. Annapolis firm spreading manure as energy solution. Capital Gazette. June. http://www.capitalgazette.com/cg2-arc-2cad8f58-dc39-5d87-a1b5-1cf9f6acd018-20131023-story.html
World Energy Council. 2013. Chapter 7b, Waste to Energy. World Energy Resources: 2013 Survey. https://www.worldenergy.org/publications/2013/world-energy-resources-2013-survey/
Youngs, Heather. 2011. Waste-to-Energy in California: Technology, Issues and Context. Do waste-to-energy technologies have a role in California’s path to a cleaner environment? Energy Biosciences Institute, University of California, Berkeley. A report to the California Council on Science and Technology. October.
Zaman, A. U. 2010. Comparative study of municipal solid waste treatment technologies using life cycle assessment method. Int. J. Environ. Sci. Tech., 7 (2), 225-234.