final report lca of management options for mixed waste plastics of management options for... · lca...
TRANSCRIPT

Final Report
LCA of Management Options for Mixed Waste Plastics
Project code: MDP017 ISBN: 1-84405-397-0 Research date: September 2007 – April 2008 Date: June 2008

WRAP helps individuals, businesses and local authorities to reduce waste and recycle more, making better use of resources and helping to tackle climate change.
Written by: Dr Peter Shonfield
Front cover photography: Mixed Plastics in a materials recycling facility © WRAP WRAP and Scott Wilson Ltd believe the content of this report to be correct as at the date of writing. However, factors such as prices, levels of recycled content and regulatory requirements are subject to change and users of the report should check with their suppliers to confirm the current situation. In addition, care should be taken in using any of the cost information provided as it is based upon numerous project-specific assumptions (such as scale, location, tender context, etc.). The report does not claim to be exhaustive, nor does it claim to cover all relevant products and specifications available on the market. While steps have been taken to ensure accuracy, WRAP cannot accept responsibility or be held liable to any person for any loss or damage arising out of or in connection with this information being inaccurate, incomplete or misleading. It is the responsibility of the potential user of a material or product to consult with the supplier or manufacturer and ascertain whether a particular product will satisfy their specific requirements. The listing or featuring of a particular product or company does not constitute an endorsement by WRAP and WRAP cannot guarantee the performance of individual products or materials. This material is copyrighted. It may be reproduced free of charge subject to the material being accurate and not used in a misleading context. The source of the material must be identified and the copyright status acknowledged. This material must not be used to endorse or used to suggest WRAP’s endorsement of a commercial product or service. For more detail, please refer to WRAP’s Terms & Conditions on its web site: www.wrap.org.uk
LCA of Management Options for Mixed Waste Plastics i
Executive summary Introduction This report details an environmental life cycle assessment (LCA) study of a range of recycling technologies and includes comparison with a selection of alternative disposal options for domestic mixed waste plastic. The study has been commissioned by WRAP to identify whether waste plastic recycling has the potential to deliver significant environmental benefits over existing waste management options. The work will inform WRAP’s strategic planning process and determine whether this should be a priority area for further work. It is expected that recyclers and other stakeholders will also find this study useful in shaping their decisions regarding technology options for managing domestic mixed plastic waste. Trials of mixed plastic waste recycling technologies from a wide range of organisations have been carried out as described in detail in the main report. Several alternative disposal/recovery technologies have also been assessed based on data obtained from published literature and life cycle inventory databases. To enable comparisons to be made between the various technologies a series of scenarios have been developed to build up complete supply chains for the recycling process—each accepting the same mix of input materials. Where necessary, several technologies have been combined to produce a complete supply chain. These are described in the table below. Functional Unit The basis for comparison between the various recycling technologies and alternative disposal routes is the recycling, reprocessing or disposal of 1 tonne of mixed plastic (and other residual materials) arising as waste from a typical UK materials recycling facility (MRF). Study boundaries This life cycle assessment relates only to waste management options for mixed plastics. An assessment of the potential effect of managing mixed plastics as part of a mixed municipal waste stream was outside of the scope of this study. For each recycling scenario the boundaries of the LCA study range from the point at which this mixed plastic waste leaves the MRF through to the production of granulate material ready to be made into “new” products. Non-recycled fractions are modelled up to the point at which the material is considered to be disposed of (e.g. in landfill) or to the point where it can substitute for a primary material (e.g. after the agglomeration process for producing a redox agent for blast furnace injection). In the case of recycled/recovered products the assessment also includes the avoided production of material or energy from primary sources. It should be noted that the chosen study boundaries mean that the process of collecting the mixed plastic waste is not included in the assessment. The technologies included in this study are either already in use in sorting facilities or have been proven in principle in pilot plants and could be scaled up and deployed in the near future. As such the study represents the current situation or that which could exist within the next few years. Geographically, the work aims to reflect the situation in the UK. Impact assessment categories and relevant metrics The following impact categories have been assessed:
Global warming potential (GWP)
Photochemical ozone creation potential (POCP)
Eutrophication potential (EP)
Acidification potential (AP)
Human toxicity potentials (HTP)
Ozone layer depletion potential (OLDP)
Abiotic depletion potential (ADP)
Further metrics reported in the impact assessment include primary energy consumption and landfilled solid waste. The priority issues for WRAP are global warming potential and solid waste arising.

LCA of Management Options for Mixed Waste Plastics ii
Allocation procedures A system expansion approach has been used to calculate the overall environmental performance of each scenario as follows: “Process impacts” relate to the environmental impacts from operating each waste management option. The “avoided impacts of primary production” are the environmental benefit derived by replacing the need to produce functionally equivalent products from primary materials.
Table 1 Key processes included in the modelled scenarios Scenario Key processes A Landfill (all materials) B Municipal incineration with energy recovery (all materials) C Near infra-red (NIR) sorting (Titech)
Conversion to solid recovered fuel (SRF) for cement kilns (non-PVC fraction) Mechanical recycling of PVC fraction
D Film removal (Stadler) NIR sorting of rigids (Titech) Pyrolysis of PP and PE fractions (BP polymer cracking process) Mechanical recycling of PVC and PET fractions
E Film removal (Stadler) NIR sorting of rigids (Titech) Pyrolysis of PP, PE and PS fractions (Ozmotech process) Mechanical recycling of PVC and PET fractions
F Film removal (Stadler) NIR sorting of rigids (Titech) Conversion of PE and PP fractions for use as redox agent in blast furnace Mechanical recycling of PVC and PET fractions
G Film removal (Stadler) NIR sorting of rigids (Titech) Mechanical recycling of PE, PP, PET and PVC fractions
H Film removal (Stadler) NIR sorting of rigids (Pellenc) Mechanical recycling of PE, PP, PET and PVC fractions
I Film removal (Stadler) NIR sorting of rigids (Qinetiq) Mechanical recycling of PE, PP, PET and PVC fractions
J Film removal (Stadler) NIR sorting of rigids (Sims) Mechanical recycling of PE, PP, PET and PVC fractions
K Film removal (KME) NIR sorting of rigids (Titech) Mechanical recycling of PE, PP, PET and PVC fractions
L Film removal (Stadler) Density separation (TLT) Mechanical recycling of PE and PP fractions
M Sorting and cleaning PE and PP fractions (Swiss Polymera) Mechanical recycling of PE and PP fractions (Swiss Polymera)
N Sorting and cleaning PE and PP fractions (B+B) Mechanical recycling of PE and PP fractions
O Film removal (Stadler) Density separation (Herbold) Mechanical recycling of PE and PP fractions
P Film removal (Flottweg) Density separation (TLT) Mechanical recycling of PE and PP fractions
Environmental Performance
Process Impacts
Avoided Impacts of Primary Production
= -

LCA of Management Options for Mixed Waste Plastics iii
Results The summary table below gives the overall ranking of the scenarios in each impact category. The priority given to each impact category is based on an assessment of WRAP’s own organisational targets and on the results of a normalisation exercise (nevertheless it should be recognised that all rankings of this type are based on subjective judgement rather than objective analysis).
Table 5.2 Summary of results showing relative ranking of the scenarios against each impact category (rank 1 = best, rank 16 = worst), green = top 25%, red = bottom 25%
High priority Low priority
Scenario Glo
bal W
arm
ing
Pot
enti
al
Solid
Was
te
Ener
gy
Hum
an T
oxic
ity
Pot
enti
al
EUtr
ophi
cati
on
Pot
enti
al
Pho
toch
emic
al
Ozo
ne C
reat
ion
Pot
enti
al
Aci
difi
cati
on
Pot
enti
al
Abi
otic
D
eple
tion
P
oten
tial
O
zon
e La
yer
Dep
leti
on
Pot
enti
al
A (Landfill) 15 16 16 16 16 16 16 16 16 B (Incineration) 16 1 8 15 10 15 15 15 2 C (SRF) 11 2 1 14 2 12 11 1 10 D (BP pyrolysis) 14 12 4 2 8 13 13 14 3 E (Ozmotech pyrolysis) 13 15 3 3 1 11 12 13 1 F (Redox agent) 12 4 2 4 13 14 14 5 9 G (Stadler & Titech) 1 5 5 5 3 6 4 3 6 H (Stadler & Pellenc) 4 7 7 11 5 8 8 7 4 I (Stadler & Qinetiq) 7 14 10 13 7 10 10 12 5 J (Stadler & Sims) 2 6 6 6 4 7 5 4 7 K (KME & Titech) 5 8 9 12 6 9 9 9 8 L (Stadler & TLT) 6 10 12 8 11 3 2 6 11 M (Swiss Polymera) 3 3 11 1 9 1 1 2 13 N (B+B) 9 13 14 10 14 5 6 10 14 O (Stadler & Herbold) 10 11 15 9 15 4 7 11 15 P (Stadler & Flottweg) 8 9 13 7 12 2 3 8 12 From this table it is clear that scenario A (landfill) is the option with the least favourable environmental performance followed by B (incineration) – although interestingly incineration has the best performance for solid waste arising, the second ranked impact category. The recycling scenarios (G – P) tend to have the best environmental performance if all impact categories are taken into account, but if the “WRAP priority impact categories” are studied then C (SRF) ranks in the middle of the recycling options. Charts showing more detailed results for global warming potential and landfill (WRAP’s priority impact categories) are given below. When reading the charts, positive values signify negative environmental impacts arising from the recycling/reprocessing supply chain. Negative values signify an environmental benefit and are due to avoided processes (e.g. avoiding the need to produce primary plastic).

LCA of Management Options for Mixed Waste Plastics iv
Chart 5.3.1 Net global warming potential
-1000
-500
0
500
1000
1500
2000
A -
Land
fill
B -
Inci
nera
tion
C - S
RF
D - B
Ppy
roly
sis
E -
Ozm
otec
hF
- Red
oxag
ent
G -
Stad
ler
& Ti
tech
H - S
tadl
er &
Pelle
ncI -
Sta
dler
&Q
inet
iqJ
- Sta
dler
&Si
ms
K -
KM
E &
Tite
chL
- Sta
dler
&TL
TM
- Sw
iss
Poly
mer
a
N - B
+B
O -
Herb
old
P -
Flot
twegkg
eq.
car
bon
diox
ide/
tonn
e
Chart 5.3.2 Contribution to global warming potential by process stage
-3000
-2000
-1000
0
1000
2000
3000
A - L
andf
ill
B - I
ncin
erat
ion
C - S
RF
D -
BP
pyro
lysi
s
E -
Ozm
otec
hpy
roly
sis
F - R
edox
age
nt
G -
Stad
ler &
Tite
ch
H - S
tadl
er &
Pelle
nc
I - S
tadl
er &
Qin
etiq
J - S
tadl
er &
Sim
s
K -
KM
E &
Tite
ch
L - S
tadl
er &
TLT
M -
Swis
sPo
lym
era
N - B
+B
O -
Herb
old
P - F
lottw
eg
kg e
q. c
arbo
n di
oxid
e/to
nne
Mechanical Recycling Incineration Landfill Redox Agent Pyrolysis Transport Avoided Impacts
The results in most impact categories are dominated by the avoided emissions from substituted processes, as can be seen in the chart above showing the contribution to overall global warming potential from each process stage. This means that even quite large differences in process impacts are often obscured by the even larger benefits from avoiding the use of primary materials. The chart showing solid waste arising is given below. Landfill, obviously, has the highest impacts in this category while the incineration scenarios (B and C) have the lowest impacts – plastic does not leave much residue when burnt. It is notable that all the other scenarios (D – P) result in broadly similar quantities of solid waste despite the diversity of technologies involved.
The results of this LCA relate only to mixed plastics and not general municipal waste

LCA of Management Options for Mixed Waste Plastics v
Chart 5.4.1 Solid waste arising
0100200300400500600700800900
1000
A - L
andf
ill
B -
Inci
nera
tion
C -
SRF
D -
BP
pyro
lysi
sE
-O
zmot
ech
F - R
edox
agen
tG
- St
adle
r&
Tite
chH
- Sta
dler
&P
elle
ncI -
Sta
dler
&Q
inet
iqJ
- Sta
dler
&S
ims
K - K
ME
&Ti
tech
L - S
tadl
er &
TLT
M -
Swis
sP
olym
era
N -
B+B
O -
Herb
old
P - F
lottw
eg
kg/to
nne
Assumptions and uncertainties A series of sensitivity analyses have been carried out to test the importance of some of the main assumptions on the results. Aspects that have been looked at include:
feedstock composition (low polyolefin, default and high polyolefin mixes)
thermal conversion efficiency of municipal incinerators
choice of substituted power from municipal incineration
choice of substituted material from recycling plastic
The sensitivity analyses show that all of these aspects do affect the environmental performance of the various scenarios assessed in this study. However, the most important issue is shown to be the choice of substituted material from recycling plastic. The default assumption in the study is that recycled plastic will substitute directly for virgin plastic on a 1:1 basis. This implies that high quality recyclates are obtained every time. The chart below plots the effects on global warming potential when increasing quantities of lower quality plastic is produced that can only substitute for wood or concrete rather than virgin plastic. Once the amount of virgin plastic substitution drops below about 70% scenario C (the SRF scenario) becomes favoured over scenario G (a recycling scenario based in NIR-sorting). A cross-over in the preferred scenario also occurs for acidification potential (once the degree of virgin plastic substitution drops to below about 55%) and photochemical ozone creation potential impact categories (once the degree of virgin plastic substitution drops to below about 45%). Scenario G also shows large negative changes all in other impact categories other than human toxicity potential (which is more or less unchanged). Due to the inherent uncertainties in LCA the “absolute” values presented here should be treated with some caution and there is likely to be considerable variation around the 70% figure due to the specific assumptions and datasets in this study. Nevertheless, despite this uncertainty the general principle holds that the quality of the recyclates is a very important aspect affecting the environmental performance of the recycling scenarios and that the best environmental performance is achieved when high quality recyclate is generated. If only lower quality recyclates are obtained then alternative disposal options may offer a better environmental solution.

LCA of Management Options for Mixed Waste Plastics vi
Figure 6.4.2 Sensitivity of substitution options for recycled plastic on global warming potential (comparison of scenarios C and G for varying degrees of substitution). Bands placed around each line to emphasise uncertainties in the data although these have not been quantified
-800
-600
-400
-200
0
200
400
600
800
100% 80% 60% 40% 20% 0%
Degree of virgin plastic substitution
kg e
q. c
arbo
n di
oxid
e/to
nne
Scenario C (SRF) Scenario G (Stadler & Titech)
This clearly is a critical issue for understanding the environmental performance of the recycling technologies – if a large proportion of the input material cannot be recycled to sufficient purity to replace virgin plastic then the contribution to total global warming potential of the recycling process is likely to become greater than that of alternative reprocessing/disposal options.
Figure 6.5 Range of results for global warming potential when combining uncertainties associated with incinerator efficiency and for substitution options for power generation and recycling plastic.
-1000
-500
0
500
1000
1500
2000
A la
ndfil
l
B: I
ncin
erat
ion
(low
)
B: I
ncin
erat
ion
(hig
h)
C: S
RF
(low
)
C: S
RF
(hig
h)
E: O
zmot
ech
pyro
lysi
s(lo
w)
E: O
zmot
ech
pyro
lysi
s(h
igh)
G: S
tadl
er &
Tite
ch(lo
w)
G: S
tadl
er &
Tite
ch(h
igh)
L: S
tadl
er &
TLT
(low
)
L: S
tadl
er &
TLT
(hig
h)
kg e
q. c
arbo
n di
oxid
e/to
nne
The low impact (best case) is for 30% incineration efficiency substituting for coal and 100% virgin plastic substitution. The high impact (worse case) is for 23% incineration efficiency substituting for gas and with 40% wood, 40% concrete and 20% virgin plastic substitution.

LCA of Management Options for Mixed Waste Plastics vii
These results have clear implications for the development of plastics recycling processes in the UK and shows that no single scenario is likely to provide a complete solution. Rather, waste plastics recycling plants should be designed to produce high quality recycled material. Lower quality recycled applications should not be considered – instead it is likely to be preferable for lower quality fractions to be sent for alternative reprocessing options such as SRF or use as a redox agent in blast furnaces. The figure above shows the results of combining uncertainties associated with incinerator efficiency and for substitution options for plastic recyclate and incinerator power generation. The effects of the different feedstock scenarios (high and low polyolefin content) have not been included in this assessment as they do not represent extremes but simply different material compositions (all of which are fairly likely and could represent typical output from the MRF). Given the number of components in the feedstock it is difficult to decide which “extreme” scenario (e.g. 100% PET output from the MRF) should be used and would end up modelling scenarios that are extremely unlikely to ever occur in practise. The majority of the variation for scenarios E, G and L is due to substitution options for plastic recycling (ranging from 100% virgin plastic substitution through to 20% virgin plastic: 40% wood: 40% concrete). While for scenario B the key factor relates to substitution options for power generation at municipal incinerators (natural gas power vs. coal power). Scenario C (SRF) is largely insensitive to the aspects being considered in this assessment. The results show that there are possible scenarios where incineration becomes preferable to recycling – when incineration substitutes for coal power and recycling does not produce high quality plastic recyclate. However if it can be ensured that recycled plastic is of high quality then the recycling scenarios always have superior environmental performance to incineration for the global warming potential. Discussion and conclusions This life cycle assessment relates only to waste management options for mixed plastics. An assessment of the potential effect of managing mixed plastics as part of a mixed municipal waste stream was outside of the scope of this study. The results only refer to the specific case where mixed plastic waste is sourced as output from a MRF and collection processes for the mixed waste plastic are not included within the study boundaries. For most of the impact categories studied, landfill is less favourable than incineration of mixed plastics. However for global warming potential this study has found that incineration (with or without energy recovery) is the least favourable waste management option of those studied for domestic mixed plastics. On the basis of these results we can conclude that it is environmentally beneficial to remove mixed plastic from the waste stream prior to either landfilling or incineration. The diverted mixed plastics stream should be managed through a combination of mechanical recycling and SRF type processes. Overall, the results of this LCA indicate that recycling scenarios are generally the environmentally preferable options for all impact categories considered in this study and with the assumptions made. However if one attempts to prioritise these impact categories and give more weight to the particular issues driving WRAP – global warming potential and solid waste – the results become more nuanced. The recycling options are favoured when considering global warming, but the Energy from Waste options (incineration and SRF) produce the least amount of solid waste. This disparity is emphasised further by the high sensitivity of the results to the quality of the recycled plastic produced. The environmental performance of the recycling scenarios rapidly deteriorates as quality declines. Once the proportion of high quality recyclate (that can substitute directly for virgin plastic) falls below a certain level it is likely that alternative waste management technologies will become the more favourable option. This assessment estimates the crossover point for global warming potential to occur once recycled plastic can only substitute for about 70% virgin plastic or less, but there is a large degree of uncertainty around this exact figure and the results differ for different impact categories. The best environmental option will be to focus on developing facilities capable of delivering high quality recycled plastics that can substitute for virgin plastics. Where this quality cannot be achieved the material should be sent for use in alternative processing options such as SRF or for use as a redox agent in blast furnaces. Another notable outcome of this assessment is that there is generally little to choose between the two main classes of recycling technologies – NIR sorting and density separation. NIR technologies can sort a wider variety of plastics, but density separation processes, while less flexible, tend to recover a higher proportion of their

LCA of Management Options for Mixed Waste Plastics viii
selected plastics from the waste stream. Which technology is actually preferable from an environmental point of view may come down to whether markets can be found for the products from these recycling processes (this study assumes that such markets exist in all cases). Further discussion on the relative merits of the NIR sorting vs. density separation can be found in the main report, which includes assessment of the economic aspects of the various technologies. The results relating to solid waste arisings are also interesting because they show that, for the individual recycling scenarios modelled, it is not possible to divert more than 60% of the material stream away from landfill. The same is true for the alternative reprocessing technologies, the exceptions being incineration and SRF to cement kilns (although the capacity of this latter option is limited in the UK). However it should be noted that by combining recycling technologies to give a full process a higher proportion can be recycled. This can be seen in the results for Process Design B (described in the main report) where a 67% recycling rate is achieved. This happens for several reasons, a key one being the prevalence of landfill as the “default” disposal option for wastes that are difficult to recycle. For plastics-rich waste streams an increase in the use of incineration would help to reduce the quantities going to landfill. However a better approach would be to consider how to increase the amounts of recyclable wastes in the material stream. Understanding the strengths and weaknesses of the different recycling technologies can to lead to the development of more sustainably designed plastic products. For example, NIR-sorting technologies have difficulty sorting black plastics and can also get confused when packaging and their labels are made from different plastics (the sensor may “see” the label and so miss-sort the pack – a particular problem for shrink wrap labels that cover the whole bottle). Fairly simple design changes can overcome these problems. For density separation technologies the main problems occur when the density ranges of different polymers overlap resulting in some inevitable mixing of polymer types in the overlapping region. This diversity in range is largely due to the use of additives and fillers to modify the properties of the polymers. Further considerations No account is taken here of possible future changes in waste arisings (aside from noting in general terms the likely short-term trends in use of polymer types and consumption in Section 3.10), UK energy markets, technological advances and so on. To do so would require the development of a series of future scenarios subject to their own uncertainties. Purely in the interests of transparency, therefore, the analysis is based around current conditions. However, it is still informative to consider how things may change in the future, as it reflects on the long-term robustness of the results. To illustrate:
Waste arisings: o The amount of plastic entering the waste stream will change o The variety of plastics in the waste stream may reduce in response to the desire for
recyclability o Sorting speed and efficiency of technologies is likely to improve as they are utilised more widely o The costs of these technologies will fall, again as experience with them increases
Energy technologies: o The marginal technology for power generation (currently gas-fired CCGT) may change, possibly
to less carbon intensive fuel cycles such as nuclear or renewables o The efficiency of generation may improve o In the medium to long term the fossil fuel cycles as developed in the UK may adopt carbon
capture and storage, significantly reducing their greenhouse gas burdens Incineration:
o There may be an increase in the efficiency of incineration processes, particularly if the
utilisation of waste heat becomes more widespread o The demand for plastic materials in incinerator feedstock may change in response to changes in
the residual waste stream due to higher levels of recycling Availability of alternative processes for handling plastic wastes:

LCA of Management Options for Mixed Waste Plastics ix
o Cement kilns and blast furnaces may not have the capacity to take a significant fraction of
plastic waste. WRAP could consider undertaking further work to assess which wastes are best
disposed of through cement kilns and blast furnaces Environmental technologies:
o Revision of the Large Combustion Plant and IPPC Directives may cause a reduction in emissions
from various of the technologies considered in this report
More issues could be added, but the length of the list demonstrates that it is not possible to develop a clear idea of changes into the future. It is therefore recommended that WRAP keep the conclusions of this study (and others like it) under review as the waste management and other relevant sectors develop in the years to come.

LCA of Management Options for Mixed Waste Plastics x
Contents Acknowledgements ............................................................................................................................ xii 1.0 Introduction ............................................................................................................................. 1 2.0 Goal .......................................................................................................................................... 1 3.0 Scope........................................................................................................................................ 1
3.1 Product Systems....................................................................................................................1 3.2 Scenarios ..............................................................................................................................1
3.2.1 Recycling technologies ..............................................................................................2 3.2.2 Alternative reprocessing/disposal options ...................................................................2
3.3 Functional Unit ......................................................................................................................2 3.4 Study boundaries...................................................................................................................2 3.5 Data requirements.................................................................................................................4
3.5.1 Technology...............................................................................................................4 3.5.2 Timescales and data sources .....................................................................................4 3.5.3 Geography................................................................................................................5
3.6 Key assumptions ...................................................................................................................5 3.6.1 Approach to modelling the scenarios ..........................................................................5 3.6.2 Feedstock composition ..............................................................................................5 3.6.3 Municipal waste disposal ...........................................................................................6 3.6.4 Transport .................................................................................................................6 3.6.5 Electricity consumption and generation ......................................................................7 3.6.6 Mechanical recycling .................................................................................................7
3.7 Inventory analysis .................................................................................................................7 3.8 Impact assessment categories and relevant metrics.................................................................8 3.9 Allocation procedures.............................................................................................................9 3.10 Uncertainty and sensitivity analyses......................................................................................11
4.0 Descriptions of Scenarios and Key Results ............................................................................ 12 4.1 Scenario A – Landfill ............................................................................................................12 4.2 Scenario B – Incineration with Energy Recovery ....................................................................14 4.3 Scenario C – Solid recovered fuel (SRF) used in cement kiln...................................................16 4.4 Scenario D – Stadler, Titech & Pyrolysis (BP Polymer Cracking Process) ..................................19 4.5 Scenario E – Stadler, Titech & Pyrolysis (Ozmotech) ..............................................................21 4.6 Scenario F – Redox Agent in Blast Furnace............................................................................23 4.7 Scenario G – Stadler & Titech...............................................................................................25 4.8 Scenario H – Stadler & Pellenc .............................................................................................27 4.9 Scenario I – Stadler & QinetiQ..............................................................................................29 4.10 Scenario J – Stadler & Sims..................................................................................................31 4.11 Scenario K - KME & Titech....................................................................................................33 4.12 Scenario L – Stadler & TLT...................................................................................................35 4.13 Scenario M - Swiss Polymera ................................................................................................37 4.14 Scenario N – B+B ................................................................................................................39 4.15 Scenario O - Herbold ...........................................................................................................41 4.16 Scenario P - Flottweg...........................................................................................................43
5.0 Scenario comparisons and discussion.................................................................................... 45 5.1 Normalisation ......................................................................................................................45 5.2 Summary of results .............................................................................................................46 5.3 Global Warming Potential.....................................................................................................48 5.4 Solid waste .........................................................................................................................50 5.5 Primary Energy....................................................................................................................51 5.6 Human Toxicity Potential .....................................................................................................53 5.7 Eutrophication Potential .......................................................................................................55 5.8 Photochemical Ozone Creation Potential ...............................................................................57 5.9 Acidification Potential...........................................................................................................59 5.10 Abiotic depletion potential ....................................................................................................61 5.11 Ozone Layer Depletion Potential ...........................................................................................63
6.0 Sensitivity analyses................................................................................................................ 65 6.1 Feedstock composition.........................................................................................................65

LCA of Management Options for Mixed Waste Plastics xi
6.2 Incinerator efficiency ...........................................................................................................66 6.3 Substituted power from municipal incineration ......................................................................68 6.4 Substituted material from recycling plastic ............................................................................70 6.5 Effects of combining uncertainties ........................................................................................72
7.0 Summary & conclusions ......................................................................................................... 74 7.1 Landfill................................................................................................................................75 7.2 Incineration.........................................................................................................................75 7.3 SRF to cement kilns .............................................................................................................75 7.4 Pyrolysis .............................................................................................................................75 7.5 Redox agent........................................................................................................................76 7.6 Near infra-red sorting ..........................................................................................................76 7.7 Density separation...............................................................................................................76 7.8 Film/rigid separation ............................................................................................................76
8.0 Further considerations ........................................................................................................... 76 9.0 References ............................................................................................................................. 78 Appendix 1 Primary Data ................................................................................................................... 80 Appendix 2 Secondary Data ............................................................................................................... 84 Appendix 3 Life Cycle Inventories...................................................................................................... 87 Appendix 4 Assumptions & Uncertainty........................................................................................... 100 Appendix 5 Peer Review .................................................................................................................. 102

LCA of Management Options for Mixed Waste Plastics xii
Acknowledgements Carrying out LCA studies is a notoriously data intensive activity and this study could not have been completed without the assistance of a large number of project partners and data providers who have kindly contributed their time and expertise to help make the results of this assessment as robust and reliable as possible. Organisation Contact Contribution
WRAP
Gareth Boyles Paul Davidson Keith James
Project sponsor Steering group Data provision
Recoup
Stuart Foster John Simmons Ben Layton
Project management Steering group Data provision
Bowman Process Technologies Nick Takel
Steering group Data provision for alternative waste management options
PPS Darren Furse, Steve Farnell
Steering group Data provision
Plastics Europe Jan-Erik Johansson
Steering Group European Perspective LCA review
Scott Wilson David Smith Steering group Data provision
Tecpol Hermann Krähling Ulrich Schlotter
Data provision LCA review
Axion Keith Freegard Data provision
Nextek Ed Kosior Rob Dvorak Data provision
Corus Group Trevor Fray Kevin Linsley Data provision
Ineos Technologies Graham Rice Data provision
EMRC (on behalf of AEA Energy and Environment)" Mike Holland Peer review
Boustead Consulting Ian Boustead Peer review
ERM Bernie Thomas Peer review
Many thanks go to those organisations and persons outlined above and to all the technology providers that took part in this study and agreed to share their information:

LCA of Management Options for Mixed Waste Plastics 1
1.0 Introduction Recent growth in local authority collection activity for a wider range of plastics packaging has highlighted the need for more sustainable waste management options to be developed for the non-bottle, mixed plastic packaging fraction. Currently this material is normally landfilled or incinerated. WRAP has commissioned a project to assess the effectiveness of potential solutions to this problem. Plant trials of a range of sorting and recycling technologies for recycling domestic mixed waste plastic have been carried out using representative samples of mixed waste plastic arising from UK MRFs as described in detail in the main report. These trials have been supplemented with environmental and economic analyses. This report comprises the environmental life cycle assessment (LCA) study of the chosen technologies including comparison with a range of alternative disposal options for domestic mixed waste plastic. 2.0 Goal This study aims to inform the debate on which technologies offer the most environmentally friendly and cost effective solutions for dealing with domestic mixed plastics waste. A selection of leading plastics recycling technologies have been assessed along with a range of alternative disposal/recovery options. The study considers both the impacts from the recycling process (or alternative disposal route) and the benefits from producing the recycled materials and other recovered products. In conjunction with a parallel economic assessment the results of the LCA study will be published and made publicly available. The work has been commissioned by WRAP to identify whether waste plastic recycling has the potential to deliver significant environmental benefits over existing waste management options. The results will inform WRAP’s strategic planning process and determine whether this should be a priority area for further work. It is expected that recyclers and other stakeholders will also find this study useful in shaping their decisions regarding technology options for managing domestic mixed plastic waste. The study complies with the ISO 14040 series of standards governing the use of LCA 1,2, and has been critically reviewed (see Appendix 5). 3.0 Scope 3.1 Product Systems Trials of a wide range of technologies suitable for recycling mixed plastic waste have been undertaken as described in detail in the main report. Several alternative disposal/recovery technologies have also been assessed based on data obtained from the published literature and life cycle inventory databases (no trials were run on these processes). The options considered include:
landfill
incineration with energy recovery (energy from waste)
use as solid recovered fuel (SRF) in cement kilns
pyrolysis technologies (feedstock recycling; conversion to diesel)
redox agent for blast furnace injection (coke substitute)
A number of previously published reports 3-12 have looked at some or several of these technologies and have been drawn upon to assist with this assessment. 3.2 Scenarios A key challenge in this study is to ensure that the technologies are compared on a fair basis. This is complicated by the varying capabilities of the chosen technologies. Some offer comprehensive solutions

LCA of Management Options for Mixed Waste Plastics 2
taking the mixed plastic waste and converting it to recycled material, others can deal with only part of the recycling process or require specific input materials (e.g. separating film from rigid, or sorting plastics from a rigid waste stream). To enable a comparison to be made between the technologies a series of scenarios have been developed to build up complete supply chains for the recycling process—each accepting the same mix of input materials. Where necessary, several technologies have been combined to produce a complete supply chain. The scenarios are described in detail in Sections 4 and 5 and were selected in discussion with Scott Wilson, RECOUP and Bowman Process Technology. They were developed with the aims of:
allowing a fair comparison between technologies by ensuring the study boundaries are consistently
applied for all the options
enabling a clear comparison to be made between different technologies
examining a broad range of management options for treating mixed plastic
3.2.1 Recycling technologies The recycling scenarios are intended to model the situation where the major polymer types in the waste stream are separated and mechanically recycled. These scenarios are also modelled in the parallel economic assessment and some consideration has been taken of the commercial viability of the recycling options (e.g. most scenarios assume that polystyrene is not recovered as it is present in only small quantities in the waste stream). The non-recycled materials – non-sorted plastics, fibres and labels, cans and other residues – are assumed to be disposed of using the UK average mix of landfill and incineration with energy recovery. 3.2.2 Alternative reprocessing/disposal options A series of alternative options have also been included in this study to provide comparison with the recycling technologies. These include landfill, incineration with energy recovery and conversion to solid recovered fuel (SRF) all of which are established routes for dealing with mixed plastic wastes. Landfill and incineration are modelled very simply with no pre-processing or sorting required. Conversion to SRF requires a low chlorine content feedstock so this scenario assumes a NIR sorter is used to separate the PVC from the rest of the waste material. Two less mature options for the UK market have also been assessed – pyrolysis (two versions: feedstock recycling and conversion to diesel) and use of plastic as a redox agent in the steelmaking process. These applications are restricted in the range of materials they can take – polyolefins only for feedstock recycling and redox agent applications, and polyolefins plus polystyrene for conversion to diesel – so pre-sorting of the plastic waste is required in each case. The other sorted plastic fractions (PVC, PET, etc.) are assumed to be sent for recycling. 3.3 Functional Unit The basis for comparison between the various recycling technologies and alternative disposal routes is the recycling, reprocessing or disposal of 1 tonne of mixed plastic (and other residual materials) arising as waste from a materials recycling facility. 3.4 Study boundaries The technologies included in this study are either already in use in sorting facilities or have been proven in principle in pilot plants and could scaled up and deployed in the near future. As such the study represents the current situation or that which could exist within the next few years.

LCA of Management Options for Mixed Waste Plastics 3
Geographically, the study aims to reflect the situation in the UK – using UK-specific power generation mix, transport distances, municipal disposal options, etc. It is assumed that domestic waste is collected and processed through materials recycling facilities (MRFs). During this process most of the easily recycled/high value materials are removed leaving a remainder consisting mainly of mixed plastics with some other residual materials as described in Table 3.2. It should be noted that collection processes for the mixed waste plastic lie outside the study boundaries and so have not been is not included in this assessment. The results only refer to the specific case where mixed plastic waste is sourced as output from a MRF and so may not applicable to other sources of mixed plastic waste. However, with pressure in the UK to increase recycling and with more material passing through MRFs it seems inevitable that these will represent an increasingly important source of mixed waste plastics in future.
Figure 3.4 Example process diagram showing the system boundaries*
For each scenario the boundaries of the LCA study range from the point at which this mixed plastic waste leaves the MRF through to the production of granulate material ready to be made into “new” products. Non-recycled fractions are modelled up to the point at which the material is considered to be disposed of (e.g. in landfill) or to the point where it can substitute for a primary material (e.g. after the agglomeration process
Avoided production processes
Labels, fibres, residue and unsorted plastic
Virgin plastic
production
Plastic A
Gas-fired power plant
Mixed plastic input from MRF
Transport
Material Sorting
Transport
Transport Plastic B
Plastic C
Plastic D
Transport
Transport
Mechanical recycling: shred, clean & extrude
Mechanical recycling: shred, clean & extrude
Mechanical recycling: shred, clean & extrude
Mechanical recycling: shred, clean & extrude
Incinerate
Landfill
Transport
Losses from recycling
* For clarity, provision of utilities (power, water, etc) are omitted from this diagram but would be included in the assessment.

LCA of Management Options for Mixed Waste Plastics 4
for use as a redox agent for blast furnace injection). It should be noted that the chosen study boundaries mean that the process of collecting the mixed plastic waste is not included in the assessment. In the case of recycled/recovered products the assessment also includes the avoided production of material or energy from primary sources (see Figure 3.4). This follows system expansion methodology commonly applied in LCA studies, which, in this case, is used to account for the benefits of the recycling/recovery processes (see Section 3.10 on allocation methods for more information on this approach). In general, the following processes are included within the study boundaries for the scenarios:
Transport
o from MRF to recycling facility
o between sub-processes during recycling/reprocessing
o to final disposal options for waste produced during the recycling process
Production of ancillary inputs (e.g. sodium hydroxide for caustic wash processes)
Production of electricity and other fuels
Supply of water
Shredding, cleaning and granulating processes required to produce granulate ready for extrusion into a
“new” product
Activities specific to alternative disposal processes (e.g. agglomeration for producing a redox agent for
blast furnace injection)
Production of displaced virgin material or energy from primary sources
Disposal of waste products
The following processes are considered to lie outside the study boundaries and have not been included in the assessment:
Production and maintenance of capital equipment (unless maintenance issues turn out to be potentially
significant – e.g. requiring replacement parts on a weekly basis). It is expected that these impacts will
be negligible compared to the impacts associated with running the equipment over its operational
lifetime.
Activities not specific to the plastics recycling process – e.g. building heating and water supply, impacts
related to labour required to operate equipment. Impacts from these activities would be shared with
other operations and would vary considerably depending on the size and complexity of the site.
Including these aspects is not considered necessary with regards to the goal of this study.
3.5 Data requirements 3.5.1 Technology Recycling technology is continually developing. This LCA study compares a range of leading technologies for recycling mixed plastic waste. In several cases the trials are taking place on pilot plants rather than full scale facilities. This leads to complications interpreting the data as full scale operations are likely to be optimised for efficiency relative to demonstration plants. Where possible the LCA study has developed results based on expected utilities requirements for running a full scale facility, but using the sorting/recycling performance data collected in the pilot plant trials. 3.5.2 Timescales and data sources Trial data have been collected for the recycling processes modelled in this study and, as such, represent the most up to date data available. Data on alternative disposal options are taken from a variety of sources including published literature and life cycle inventory databases such as the Ecoinvent database 13. In the

LCA of Management Options for Mixed Waste Plastics 5
interests of transparency the analysis is based on current conditions with respect to waste arisings, technologies, etc. This issue is discussed further in Section 7. Consideration of timescales also affects some aspects of the impact assessment. The relative contribution of greenhouse gases to the total global warming potential is assessed over a 100 year timescale. The Ecoinvent data on landfill used in the models assess leaching over a very long term (60,000 year) time horizon and, as such, represent a worst case scenario that is particularly noticeable when assessing eutrophication potential. The data assume that landfilled plastic will entirely decompose and that the landfill lining will be breached so nitrogen containing chemicals in the plastics can leach out into the environment. Over a shorter time horizon (say, 100 years), very little plastic will have decomposed and the landfill lining would be expected to remain in place meaning that actual eutrophication over this period would probably be near zero. 3.5.3 Geography The focus of this LCA study is to assess options for the UK situation. Where UK specific data are not available data representative of the situation in Western Europe have been used. Several of the recycling trial sites are located in other European countries (Germany, Switzerland & France). It is expected that the direct performance of the processes (energy consumption, recycling efficiency, etc) would not be affected by location and that the results of the recycling trials are directly applicable to the UK situation. 3.6 Key assumptions 3.6.1 Approach to modelling the scenarios The large number of different materials in the waste stream and the potential for cross-contamination of a recycled stream with other materials makes these scenarios very complex to model. As such, a number of assumptions have been made to simplify the assessment. The approach taken bases the LCA modelling on the recycling efficiency of the sorting process (i.e. how much of each material type is extracted from the waste stream for recycling). The modelling also takes account of the purity of the sorted fractions as it is assumed that mis-sorted materials are, in fact, left as residue from the sorting process and disposed of to landfill and incineration with energy recovery. This is a conservative assumption, assigning impacts to the mis-sorted product and ensuring that the benefits of recycling a plastic – the avoided impacts of virgin production – are not attributed to impurities in the recyclates. 3.6.2 Feedstock composition Trial samples were secured from Valpak Recycling’s MRF in Preston. To put the results of this LCA study in context is it important to understand how representative these MRFs are of the typical situation in the UK, the types of feedstock they accept, and what proportion of the total plastic waste arising might be expected to be obtained from these types of operation. These issues are discussed in detail in the main report. Due to the nature of the MRF process the composition of this material is not consistent but can vary widely from batch to batch. NIR spectroscopic analysis of the feedstock at some of the trials showed that there is large variation even between bags of material collected at the same time. This variation in feedstock clearly has implications for dealing with the data collected at the trials – as each will have been run using different mixes of material. To ensure consistency the following approach has been adopted:
trial data are used to determine the recycling efficiency of each material stream (the proportion of that
material extracted from the input feedstock)
these efficiencies are then applied to a standardised “default input mix” that is applied to all the
scenarios

LCA of Management Options for Mixed Waste Plastics 6
A typical mix of materials leaving the MRF is given in Table 3.6.2 and labelled the Default Composition (again, based on NIR spectroscopic analysis from the trials). To examine the effect of variation in this composition two alternative material mixes have also been assessed. The first is a high polyolefin mix – with an increased proportion of PE and PP, and the second a low polyolefin mix – with higher proportions of PS, PVC and PET. The non-plastic components of the waste stream are unchanged in each case. It is further assumed that 10% of the plastic is black (e.g. food trays). Due to its low reflectivity, black polymer is not well sorted by NIR technologies. The actual sort efficiency of each NIR technology with regard to black plastic was not assessed during the trials but is estimated at 50% in all cases for the purpose of this study. Based on an assessment of the black plastic by Axion following the trials at Titech, it is assumed that its composition of this material is 20% PS, 25% PE, 25% PP and 30% PET.
Table 3.6.2 Composition of input material to recycling processes by material type Material type Default
Composition, % High Polyolefin Alternative, %
Low Polyolefin Alternative, %
Aluminium 1 1 1 Carton Board 1 1 1 Steel 1 1 1 Paper 3 3 3 Polyethylene (PE) – Film 5 6 0 Polyethylene (PE) – Rigid 10 20 5 Polyethylene terephthalate (PET) – Film 2 0 2 Polyethylene terephthalate (PET) – Rigid 15 5 35 Polylactic acid (PLA) - Rigid 3 3 3 Polypropylene (PP) - Rigid 40 50 10 Polystyrene (PS) – Film 1 0 2 Polystyrene (PS) – Rigid 5 3 10 Polyvinyl chloride (PVC) – Film 1 0 2 Polyvinyl chloride (PVC) – Rigid 10 5 23 Residue 2 2 2 3.6.3 Municipal waste disposal Statistics from Defra 14 on management of municipal waste for 2006/7 show that of those waste streams that are not currently composted or recycled, 84% go to landfill and 16% to incineration. Energy is recovered from 99.8% of the incineration processes – in the LCA models it is assumed 100% of incineration processes are equipped for energy recovery. 3.6.4 Transport A number of assumptions have been made regarding the structure of the supply chain, modes of transport and the distances traveled. For the recycling scenarios it is assumed that all required sorting and cleaning processes are co-located so no transport (other than e.g. conveyor belts) is needed to move material between process stages, Transport in all cases is assumed to be by 32 tonne (gross weight) lorries with a full outward load and an empty return trip. It is assumed that these lorries comply with Euro IV emissions standards. Transport distances used in the model are given in Table 3.6.4. It is not possible to determine the degree to which these assumptions are representative of actual waste movements. They represent a ‘best guess’ of the distances over which materials would be transported. The only UK blast furnaces are run by Corus Group plc and are located at Port Talbot, Scunthorpe and Teesside. It may be the case that, in practice, steel works would only source plastic from areas local to the

LCA of Management Options for Mixed Waste Plastics 7
blast furnaces. However, to maintain a fair comparison with other scenarios (which do not make allowance for location) a high transport distance has been assumed used for this scenario.
Table 3.6.4 Transport distances used in the LCA models Route Distance, km From MRF to polymer sorting facility 50 Typical distance to landfill site 20 Typical distance to incinerator (energy recovery facility) 50 Typical distance to mechanical recycler of plastic 50 Typical distance to blast furnace for redox agent injection 200 Typical distance to pyrolysis facility (diesel production) 50 Typical distance to pyrolysis facility (BP process) 100 Typical distance to cement kiln 100 3.6.5 Electricity consumption and generation All electricity use is assumed to lead to emissions based upon UK average electricity generation. All electricity generation (from incineration with energy recovery) is assumed to displace gas-fired generation in a combined cycle plant – as this is the expected marginal electricity source. This approach is follows UK Government guidelines on evaluation and appraisals of greenhouse gas policy 15 and has been applied elsewhere 16, 17. However it may also be argued that power generation from municipal incinerators should displace the use of UK grid electricity, produced from the mix of UK power sources. A sensitivity analysis of this option has been undertaken and is discussed in Section 6.4. 3.6.6 Mechanical recycling The mechanical recycling process requires the waste plastic to be shredded and extruded to form recycled granulate ready for use in “new” products. Shredding processes designed to give a product less than 80 mm in diameter typically have a power requirement in the range 16 – 32 kWh/tonne 18, and an average of 24 kWh/tonne has been used in the LCA models. Extruders are considerably more energy intensive and typically require 240 – 300 kWh/tonne 19, an average of 270 kWh/tonne is assumed in this assessment. Based on data from the Swiss Polymera trial it further is assumed that there is 2% material loss during this process. Possible emissions (e.g. of VOCs) resulting from the extrusion process have not been assessed due to lack of data. These would mainly be of relevance to the Photochemical Ozone Creation Potential impact category, which is not considered a priority category by WRAP. Agglomorators required to process plastic in preparation for injection into a blast furnace are estimated to require 100 – 250 kWh/tonne 20, an average value of 175 kWh/tonne has been used in this assessment. A further important assumption in this study is that markets exist for the recycled plastics that are produced – PP, PE, PET, PVC and mixed PP/PE blend depending on the scenario. If markets are not available for some of these recycled plastics it have a large impact on the results as the credits received for substituting primary plastics will be reduced (see Section 3.9). 3.7 Inventory analysis The life cycle inventories generated for each scenario are built up from the inputs and outputs of the component processes as described in Section 4. All energy and material flows crossing the system boundaries are quantities of environmental relevance (energy and material resources and wastes and emissions). These flows are recorded for each unit process and summarised across the entire system to

LCA of Management Options for Mixed Waste Plastics 8
form the life cycle inventory. Some specific inventory items (e.g. solid wastes, energy consumption) are used directly as relevant metrics for assessing the scenarios (see Section 3.8). GaBi 4 Professional LCA software 21 has been used to model the scenarios and generate the life cycle inventories and impact assessments on which the study conclusions are based. This software is a state-of-the-art tool for carrying out LCAs. The user can generate “processes” in the software to model the data collected from the plant trials. Where required, secondary datasets can be added to account for background processes such as power production, landfill, transport, etc. Many of these datasets including Ecoinvent v1.3 are fully integrated into the software. The models developed in this way are easy to visualise using graphical user interface and can be parameterised to assist with scenario modelling and sensitivity analyses. GaBi 4 Professional also incorporates a range of options for impact assessment (including the CML 2 Baseline Methods described below), normalisation and weighting. 3.8 Impact assessment categories and relevant metrics The CML 2 Baseline Method characterisation factors 22, 23 have been applied in this study. The following impact categories have been assessed:
Global warming potential (GWP)
Photochemical ozone creation potential (POCP)
Eutrophication potential (EP)
Acidification potential (AP)
Human toxicity potentials (HTP)
Ozone layer depletion potential (OLDP)
Abiotic depletion potential (ADP)
The CML impact indicators focus on the so-called midpoints of the cause-effect chain. This means that they aggregate data on emissions (the starting points in the cause-effect chain) to potential impacts in various categories (e.g. global warming, acidification, etc.), but do not go as far as to assess the endpoints, such as loss of biodiversity, damage to human health, etc. caused by these impacts. Further metrics reported in the impact assessment include primary energy consumption (measured as gross calorific value) and landfilled solid waste. The solid waste metric accounts for:
all non-recycled/reprocessed fractions of the waste stream (i.e. impurities and non-recycled plastics) that
go direct to landfill
landfilled residues from incineration
landfilled residues from reprocessing operations
The total solid waste will be influenced by the composition of the feedstock and by the effectiveness of the recycling processes. The CML defined impact categories occur on different scales ranging from global (GWP, OLDP and ADP), regional (AP) and local (POCP, EP and HTP), and the relevance of the point of emission becomes more important as more local impacts are considered. A kg of carbon dioxide emitted anywhere in the UK will give the same contribution to global warming as a kg of carbon dioxide emitted in Australia, whereas for more regionally confined impact categories only emissions that occur nearby will have a real impact. This issue is a general weakness of the LCA technique and so the results generating from using these impact categories should be considered to be worst-case potential impacts rather than actual impacts on the environment. However, WRAP has identified global warming potential as its priority issue, followed by solid waste arising, both of which can both be considered “global” in scale.

LCA of Management Options for Mixed Waste Plastics 9
3.9 Allocation procedures A common problem in LCA studies is how to allocate impacts from processes that produce multiple products. This allocation issue does not arise in this study as the functional unit is based on material input to the process rather than to a specific output. Thus, all impacts from the subsequent recycling, recovery and disposal processes are assigned to the input material. However, there is a need for allocation to account for the benefits of recycling, reprocessing and energy recovery processes modelled in this study. Waste management technologies produce different types and quantities of recycled/reprocessed products—energy, fuel, secondary raw materials, etc. Therefore, a fair comparison of these technologies must account for both the impacts of the process and the benefits of the products. This LCA study uses a system expansion approach to calculate the overall environmental performance of each scenario as follows: “Process impacts” will be assessed using standard LCA methodology to account for material and energy flows to get an understanding of the environmental impacts from operating each waste management option.
Table 3.9.1 Impacts associated with primary production of 1 tonne of selected plastics (for calculating avoided impacts only the process energy required to produce the virgin material is considered as the energy of the feedstock is not depleted) Impact Category Units PET HDPE PP PS PVC Process energy (ex. feedstock energy) MJ 43336 26399 24396 43587 38841 Abiotic Depletion Potential kg eq. Sb 33 33 33 38 18 Acidification Potential kg eq. SO2 12 21 20 17 10 Eutrophication Potential kg eq. PO4
+ 3 1 1 2 1 Human Toxicity Potential kg eq. DCB 735 67 50 55 151 Ozone Layer Depletion Potential kg eq. R11 0 0 0 0 0 Photochemical Ozone Creation Potential kg eq. C2H4 2 3 2 2 1 Global Warming Potential kg eq. CO2 2468 1891 1999 2776 1336 The “avoided impacts of primary production” are the environmental benefits derived by replacing the need to produce functionally equivalent products from primary materials, e.g. production of 1 kWh of electricity from incinerating plastic will avoid emissions associated with producing 1 kWh of electricity from alternative sources. The impacts associated with producing virgin plastics are given in Table 3.9.1, recycling plastics will avoid these impacts. These figures are derived from datasets provided by Plastics Europe representing European average production. The full choice of “avoided processes” modelled in this study is given in Table 3.9.2. It is recognised that plastics will undergo some degradation with each thermal recycling process and that impurities in the recyclate may become concentrated after subsequent recycling steps. This needs to be taken in to consideration when closed loop recycling is undertaken and multiple recycling loops are possible. However the mixed plastics plants envisaged in this work will not recycle plastics packaging back into packaging and so it is considered highly unlikely to result in multiple recycling loops. In addition the plant will divert a significant proportion of the input material in to energy recovery rather than recycling, further reducing the significance of dealing with multiple recycling loops. The output material from the technologies assessed in the trials (for a single recycling loop) was considered to be of high quality and suitable to substitute for virgin material (this is discussed in more detail in the main report).
Environmental Performance
Process Impacts
Avoided Impacts of Primary Production
= -

LCA of Management Options for Mixed Waste Plastics 10
Table 3.9.2 Avoided impacts from recycling, reprocessing and energy recovery Resource Avoided Process Basis for Substitution Recycled plastic granulate Production of virgin plastic
powder or pellet Recyclate performs the same function as virgin plastic –1 kg recyclate substitutes for 1 kg virgin plastic
Power (from incineration with energy recovery)
Production of power using average UK electricity mix
Direct equivalence – 1 kWh power from incineration replaces 1 kWh power from a combined cycle gas power plant
Redox agent for blast furnace injection
Production of coal Polyolefin fraction replaces coal based on reducing potential – 1 kg plastic replaces 1.58 kg coal (see explanation above)
Diesel oil replacement (Ozmotech pyrolysis process)
Production of diesel from crude oil
Direct equivalence – 1 kg pyrolysis-derived oil replaces 1 kg diesel from crude oil
Gas fraction (BP polymer cracking process)
Production of refinery gas from crude oil processing
Direct equivalence – 1 kg gas replaces 1 kg refinery gas from crude oil
Light fraction oil (BP polymer cracking process)
Production of naphtha from crude oil processing
Direct equivalence – 1 kg light fraction oil replaces 1 kg naphtha from crude oil
Heavy fraction oil (BP polymer cracking process)
Production of paraffin from crude oil processing
Direct equivalence – 1 kg heavy fraction oil replaces 1 kg paraffin from crude oil
Solid recovered fuel Production and combustion of coal
Plastic replaces coal based on calorific value – 1 MJ from plastic replaces 1 MJ from coal
In the scenario where plastic (polyolefin) is used as reducing agent in a blast furnace it is assumed that the most likely situation for the UK situation would be for it to replace pulverised coal 24, 25. In current practise the coal is injected into the bottom of the blast furnace via copper tuyeres and plastic would be added in the same way – correct material preparation is essential to avoid the material adhering to, or damaging, the tuyeres. The substitution in this scenario is based on the relative reducing potential of coal and polyolefin. The chemistry of a blast furnace is very complicated so a simplified approach has been taken using the following assumptions:
Each carbon atom reacts with oxygen in the air to form carbon monoxide. Each molecule of carbon
monoxide then reacts with an atom of oxygen in the iron ore to form carbon dioxide – reducing the ore.
Two atoms of hydrogen are required to react with each atom of oxygen in the ore, forming water.
Direct reduction of iron ore with carbon has been ignored. This will have little effect on the results as
both polyolefin and coal have very similar carbon content.
Side reactions (e.g. where water formed from the reduction reaction donates oxygen to carbon to
produce hydrogen and carbon monoxide that are then available for further reduction) also been ignored
With coal typically containing 84% carbon and 4% hydrogen (the remainder being coal ash) 26 this implies that 1 kg coal contains 70 moles of carbon and 40 moles of hydrogen – potentially reacting with 90 moles oxygen in the iron ore.
LCA of Management Options for Mixed Waste Plastics 11
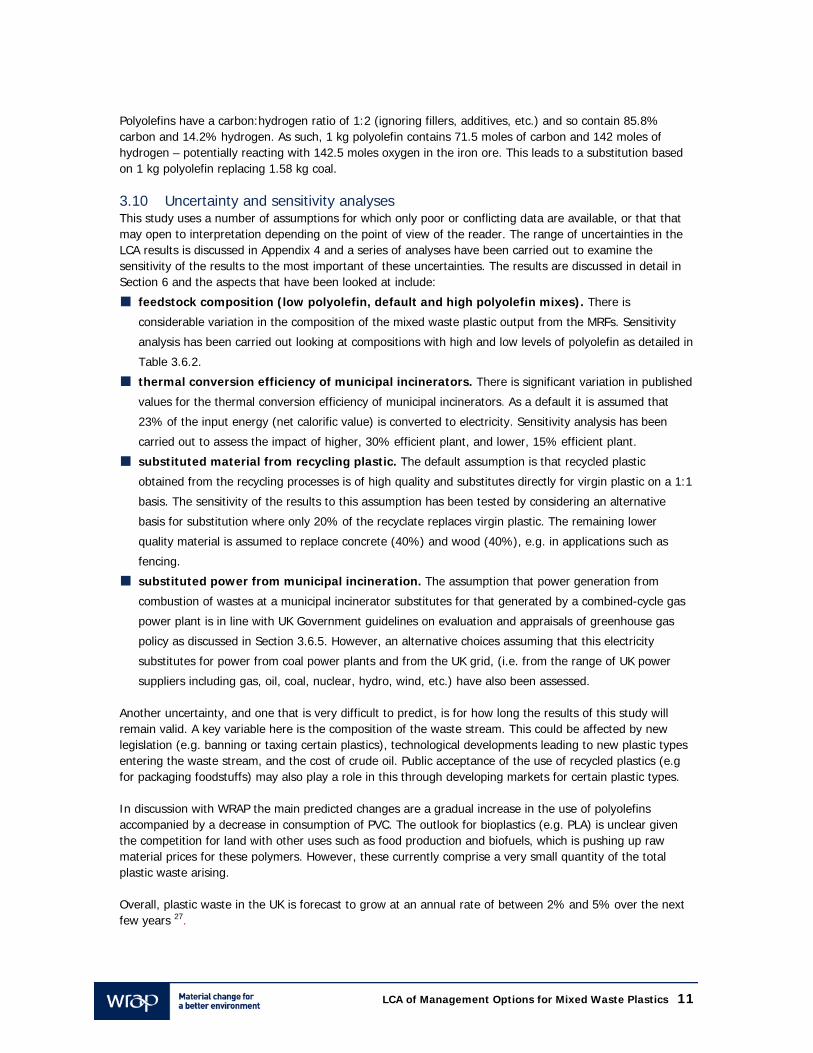
Polyolefins have a carbon:hydrogen ratio of 1:2 (ignoring fillers, additives, etc.) and so contain 85.8% carbon and 14.2% hydrogen. As such, 1 kg polyolefin contains 71.5 moles of carbon and 142 moles of hydrogen – potentially reacting with 142.5 moles oxygen in the iron ore. This leads to a substitution based on 1 kg polyolefin replacing 1.58 kg coal. 3.10 Uncertainty and sensitivity analyses This study uses a number of assumptions for which only poor or conflicting data are available, or that that may open to interpretation depending on the point of view of the reader. The range of uncertainties in the LCA results is discussed in Appendix 4 and a series of analyses have been carried out to examine the sensitivity of the results to the most important of these uncertainties. The results are discussed in detail in Section 6 and the aspects that have been looked at include:
feedstock composition (low polyolefin, default and high polyolefin mixes). There is
considerable variation in the composition of the mixed waste plastic output from the MRFs. Sensitivity
analysis has been carried out looking at compositions with high and low levels of polyolefin as detailed in
Table 3.6.2.
thermal conversion efficiency of municipal incinerators. There is significant variation in published
values for the thermal conversion efficiency of municipal incinerators. As a default it is assumed that
23% of the input energy (net calorific value) is converted to electricity. Sensitivity analysis has been
carried out to assess the impact of higher, 30% efficient plant, and lower, 15% efficient plant.
substituted material from recycling plastic. The default assumption is that recycled plastic
obtained from the recycling processes is of high quality and substitutes directly for virgin plastic on a 1:1
basis. The sensitivity of the results to this assumption has been tested by considering an alternative
basis for substitution where only 20% of the recyclate replaces virgin plastic. The remaining lower
quality material is assumed to replace concrete (40%) and wood (40%), e.g. in applications such as
fencing.
substituted power from municipal incineration. The assumption that power generation from
combustion of wastes at a municipal incinerator substitutes for that generated by a combined-cycle gas
power plant is in line with UK Government guidelines on evaluation and appraisals of greenhouse gas
policy as discussed in Section 3.6.5. However, an alternative choices assuming that this electricity
substitutes for power from coal power plants and from the UK grid, (i.e. from the range of UK power
suppliers including gas, oil, coal, nuclear, hydro, wind, etc.) have also been assessed.
Another uncertainty, and one that is very difficult to predict, is for how long the results of this study will remain valid. A key variable here is the composition of the waste stream. This could be affected by new legislation (e.g. banning or taxing certain plastics), technological developments leading to new plastic types entering the waste stream, and the cost of crude oil. Public acceptance of the use of recycled plastics (e.g for packaging foodstuffs) may also play a role in this through developing markets for certain plastic types. In discussion with WRAP the main predicted changes are a gradual increase in the use of polyolefins accompanied by a decrease in consumption of PVC. The outlook for bioplastics (e.g. PLA) is unclear given the competition for land with other uses such as food production and biofuels, which is pushing up raw material prices for these polymers. However, these currently comprise a very small quantity of the total plastic waste arising. Overall, plastic waste in the UK is forecast to grow at an annual rate of between 2% and 5% over the next few years 27.

LCA of Management Options for Mixed Waste Plastics 12
4.0 Descriptions of Scenarios and Key Results 4.1 Scenario A – Landfill Figure 4.1 Process diagram for scenario A
The landfill scenario assesses impacts from transporting the mixed plastic waste to the landfill site, and impacts from the landfill itself. Life cycle inventory data used are representative of the situation in Switzerland in 2000 for a municipal sanitary landfill facility taking biogenic or untreated municipal waste. The landfill model includes a base seal, landfill gas and leachate collection systems and treatment of leachate in a municipal wastewater treatment plant. The data account for:
Waste-specific short-term emissions (over 100 year time horizon) to air via landfill gas incineration and
landfill leachate. No energy recovery is assumed to result from the landfill gas.
Burdens from treatment of short-term leachate (over 100 year time horizon) in a wastewater treatment
plant (including WWTP sludge disposal in municipal incinerator).
Long-term emissions from landfill to groundwater after base lining failure (up to 60,000 year time
horizon).
The characteristics of the input material are taken from various literature sources as listed in the Ecoinvent reference documentation 28 and account for chemical elements in additives used to condition the plastics as well as the pure plastics themselves. Nitrogen containing additives explain the relatively high eutrophication potential for landfill as, over the long term, these result in the emission of ammonia, organically bound nitrogen compounds and other species that contribute to this impact category. Waste PET has particularly large quantities of nitrogen containing additives and contributes the majority of these impacts.
Table 4.1.1 Scenario A impact assessment results for different feedstock compositions Impact Category Unit Low Polyolefin Default High Polyolefin Energy MJ 440 458 464 ADP kg eq. Sb 0.179 0.187 0.189 AP kg eq. SO2 0.263 0.240 0.231 EP kg eq. PO4
+ 1.487 1.053 0.792 HTP kg eq. DCB 1134.31 1665.73 1931.83 OLDP kg eq. R11 4.0E-06 4.1E-06 4.2E-06 POCP kg eq. C2H4 0.044 0.048 0.049 GWP kg eq. CO2 147 159 166 Solid Waste kg 1000 1000 1000
1000 kg
1000 kg
Landfill
Mixed plastic input from MRF
Transport

LCA of Management Options for Mixed Waste Plastics 13
Table 4.1.2 Scenario A impact assessment results showing contribution from different process stages (default feedstock) Impact Category Unit Landfill Transport Total Energy MJ 381 77 458 ADP kg eq. Sb 0.153 0.034 0.187 AP kg eq. SO2 0.215 0.025 0.240 EP kg eq. PO4
+ 1.048 0.006 1.053 HTP kg eq. DCB 1665.44 0.29 1665.73 OLDP kg eq. R11 3.5E-06 6.6E-07 4.1E-06 POCP kg eq. C2H4 0.045 0.003 0.048 GWP kg eq. CO2 154 5 159

LCA of Management Options for Mixed Waste Plastics 14
4.2 Scenario B – Incineration with Energy Recovery
Figure 4.2 Process diagram for scenario B
For incineration with energy recovery the mixed plastic waste is not sorted but is assumed to be sent straight to the incineration plant after leaving the MRF. It is then burnt and the energy released used to produce electricity. To maximise the benefits from incineration the heat produced would be recovered in a CHP plant – however this is not the typical situation in the UK where incinerators tend to be located away from population centres where the heat could usefully be used. As such, heat recovery has not been modelled in this study. It should be noted that the calorific value of the mixed plastic (and other materials) from the MRF is much higher than normal feedstock accepted for municipal incineration. It is possible that this may require incinerator operators to alter their process or to blend the mixed plastic waste with other material prior to being fed into the incinerator (although this is debated). This extra processing may affect whether this disposal option is economical compared to other options. The study boundary is from the point at which the mixed plastic waste leaves the MRF to the point at which it is incinerated, so the results do not account for the energy and resources used to manufacture the materials in the waste stream. The benefits accrued from incineration are based on the avoided requirement to obtain electricity from other sources. The incinerator efficiency is assumed to be 23% (discussed in more detail in Section 6.2) and the energy that can be recovered from the waste stream is based on the following net calorific values sourced from the incineration datasets in Ecoinvent 13:
PE 42.47 MJ/kg
PP 30.78 MJ/kg
PET 22.95 MJ/kg
PS 38.67 MJ/kg
PVC 21.51 MJ/kg
PLA 30.79 MJ/kg (based on Ecoinvent dataset for “mixed plastic” incineration – no specific
data available on PLA)
Paper 14.12 MJ/kg
Aluminium, steel and other residuals are assumed to have no calorific value in the incineration process
-6619 MJ
1000 kg
1000 kg
Incinerate
Avoided production processes
Gas-fired power plant
Mixed plastic input from MRF
Transport

LCA of Management Options for Mixed Waste Plastics 15
Net calorific value rather than gross calorific value is used for this calculation as this represents the available energy derived from combustion that can be used to generate electricity (assumes that steam produced from water content in feedstock is lost to atmosphere so this energy is not recovered). As well as being a disposal scenario in its own right incineration also plays a part in many of the other scenarios as a disposal option along with landfill for the material that is not recovered/recycled. The Ecoinvent life cycle inventories for waste incineration include emissions from both the incinerator and from the landfills for the non-combusted material and are based on average Swiss technology. It is expected that this would be comparable to incineration facilities in the UK. Further details can be found in the Ecoinvent reference documentation 28. As with the landfill datasets, the incineration datasets accounts for the present of additives used to condition the plastics as well as the pure plastics themselves. The calculation of solid waste arising is based on residual materials remaining after incineration (e.g. boiler ash, precipitator ash, scrubber sludge and bottom-ash) and also includes solidifying cement used to stabilise these materials for landfill.
Table 4.2.1 Scenario B impact assessment results for different feedstock compositions Impact Category Unit Low Polyolefin Default High Polyolefin Energy MJ -8443 -12083 -14142 ADP kg eq. Sb -4.228 -5.485 -6.240 AP kg eq. SO2 0.548 0.055 -0.185 EP kg eq. PO4
+ 0.099 0.045 0.017 HTP kg eq. DCB 1230.45 1350.05 1399.60 OLDP kg eq. R11 -7.0E-05 -8.7E-05 -9.8E-05 POCP kg eq. C2H4 -0.012 -0.060 -0.087 GWP kg eq. CO2 1629 1829 1919 Solid Waste kg 53 49 48 Table 4.2.2 Scenario B impact assessment results showing contribution from different process stages (default feedstock)
Impact Category Unit Incineration Transport
Avoided Impacts Total
Energy MJ 1788 192 -14063 -12083 ADP kg eq. Sb 0.509 0.085 -6.079 -5.485 AP kg eq. SO2 0.681 0.062 -0.687 0.055 EP kg eq. PO4
+ 0.113 0.014 -0.083 0.045 HTP kg eq. DCB 1357.19 0.73 -7.87 1350.05 OLDP kg eq. R11 6.3E-06 1.6E-06 -9.5E-05 -8.7E-05 POCP kg eq. C2H4 0.076 0.007 -0.143 -0.060 GWP kg eq. CO2 2593 13 -777 1829

LCA of Management Options for Mixed Waste Plastics 16
4.3 Scenario C – Solid recovered fuel (SRF) used in cement kiln Figure 4.3 Process diagram for scenario C
A higher value energy recovery option (compared to burning in a municipal incinerator) is to convert the remaining mixed plastic waste into solid recovered fuel (SRF) – this could either then be burnt in a dedicated SRF power plant or used as fuel for a cement kiln. As with the municipal incineration scenario, the composition of the mixed waste plastic stream in this study is unlike most normal SRF feedstock and in reality may have to be blended with other materials to give a suitable product. As such, this scenario should be viewed as a somewhat artificial construction developed for the purpose of comparing against the other technologies in this assessment. Before conversion to SRF the PVC component of the waste stream must be reduced to below ~1%. This scenario assumes this is achieved using a NIR sorter – the separated PVC is assumed to be recycled. In this scenario it is assumed that the SRF replaces use of primary fuel (as pulverised coal) in the cement kiln. In this case the energy that can be recovered from the waste stream is based on the following gross calorific values sourced from the incineration datasets in Ecoinvent 13:
PE 42.82 MJ/kg
PP 36.16 MJ/kg
904 kg
1000 kg
10 kg
2 kg
-24568 MJ
-9 MJ
1000 kg
904 kg
Titech NIR Sorter
Avoided production processes
PVC
Gas-fired power plant
Transport
Transport
Transport
Shredding
Mechanical recycling: shred, clean & extrude
Cement Kiln
Incinerate
Landfill
Transport
Burning coal
Losses from recycling 11 kg
-85 kg
Mixed plastic input from MRF
Virgin plastic production
* For clarity, provision of utilities have been omitted from this diagram but are included in the assessment.
96 kg
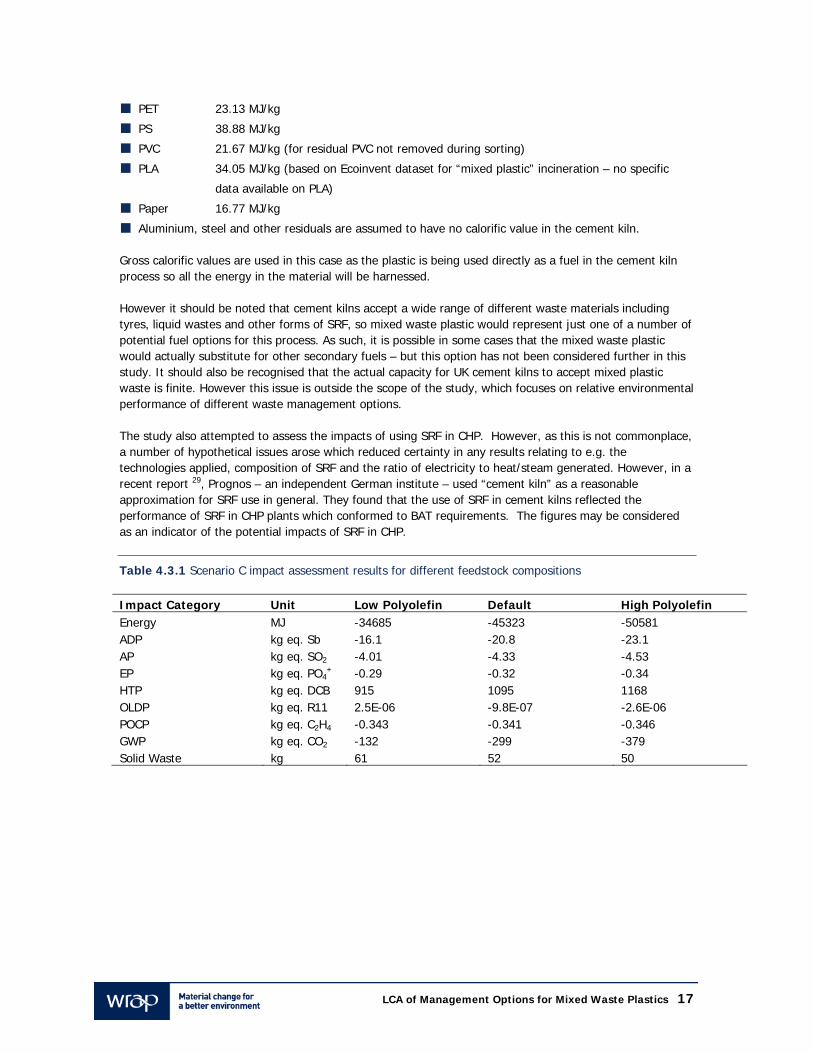
LCA of Management Options for Mixed Waste Plastics 17
PET 23.13 MJ/kg
PS 38.88 MJ/kg
PVC 21.67 MJ/kg (for residual PVC not removed during sorting)
PLA 34.05 MJ/kg (based on Ecoinvent dataset for “mixed plastic” incineration – no specific
data available on PLA)
Paper 16.77 MJ/kg
Aluminium, steel and other residuals are assumed to have no calorific value in the cement kiln.
Gross calorific values are used in this case as the plastic is being used directly as a fuel in the cement kiln process so all the energy in the material will be harnessed. However it should be noted that cement kilns accept a wide range of different waste materials including tyres, liquid wastes and other forms of SRF, so mixed waste plastic would represent just one of a number of potential fuel options for this process. As such, it is possible in some cases that the mixed waste plastic would actually substitute for other secondary fuels – but this option has not been considered further in this study. It should also be recognised that the actual capacity for UK cement kilns to accept mixed plastic waste is finite. However this issue is outside the scope of the study, which focuses on relative environmental performance of different waste management options. The study also attempted to assess the impacts of using SRF in CHP. However, as this is not commonplace, a number of hypothetical issues arose which reduced certainty in any results relating to e.g. the technologies applied, composition of SRF and the ratio of electricity to heat/steam generated. However, in a recent report 29, Prognos – an independent German institute – used “cement kiln” as a reasonable approximation for SRF use in general. They found that the use of SRF in cement kilns reflected the performance of SRF in CHP plants which conformed to BAT requirements. The figures may be considered as an indicator of the potential impacts of SRF in CHP. Table 4.3.1 Scenario C impact assessment results for different feedstock compositions Impact Category Unit Low Polyolefin Default High Polyolefin Energy MJ -34685 -45323 -50581 ADP kg eq. Sb -16.1 -20.8 -23.1 AP kg eq. SO2 -4.01 -4.33 -4.53 EP kg eq. PO4
+ -0.29 -0.32 -0.34 HTP kg eq. DCB 915 1095 1168 OLDP kg eq. R11 2.5E-06 -9.8E-07 -2.6E-06 POCP kg eq. C2H4 -0.343 -0.341 -0.346 GWP kg eq. CO2 -132 -299 -379 Solid Waste kg 61 52 50

LCA of Management Options for Mixed Waste Plastics 18
Table 4.3.2 Scenario C impact assessment results showing contribution from different process stages (default feedstock)
Impact Category Unit Mec
hani
cal
Rec
yclin
g
Inci
ner
atio
n
Land
fill
Tran
spor
t
Avo
ided
Im
pact
s
Tota
l
Energy MJ 866 482 3 561 -47234 -45323 ADP kg eq. Sb 0.280 0.159 0.001 0.248 -21.510 -20.822 AP kg eq. SO2 0.136 0.384 0.004 0.180 -5.030 -4.326 EP kg eq. PO4
+ 0.011 0.082 0.004 0.042 -0.461 -0.322 HTP kg eq. DCB 3.78 1271.71 5.55 2.14 -188.36 1094.82 OLDP kg eq. R11 8.5E-07 2.3E-06 3.0E-08 4.8E-06 -8.9E-06 -9.8E-07 POCP kg eq. C2H4 0.009 0.050 0.000 0.020 -0.420 -0.341 GWP kg eq. CO2 39 2384 1 38 -2760 -299

LCA of Management Options for Mixed Waste Plastics 19
4.4 Scenario D – Stadler, Titech & Pyrolysis (BP Polymer Cracking Process)
Figure 4.4 Process diagram for scenario D
Data on the BP polymer cracking process have been obtained from a previous LCA study 30, based on published information on the process. It should be noted that the process has been further developed with significant efficiency gains since these data were made available 31 but is no longer current and will not be resurrected. As such, the results from the LCA model should be viewed with caution and not taken to represent the best performance available from modern pyrolysis plants.
-16 kg
-88 kg
-151 kg
-91 kg
-68 kg
191 kg
337 kg
1000 kg
246 kg
-293 MJ
-226 MJ
160 kg
31 kg809 kg
257 kg
41 kg
1000 kg
Titech NIR Sorter
Film and mis-sorted rigid plastic
Incinerate
Avoided production processes
Labels, fibres, residue and unsorted plastic
Virgin plastic production
103 kg
Gas-fired power plant
Transport
Stadler Film/Rigid Separator
Landfill
Transport
Transport
Transport
Transport
Pretreatment: shred & clean
Mechanical recycling: shred, clean & extrude
Pyrolysis: Gas fraction Light fraction Heavy fraction
Incinerate
Landfill
Transport
Naphtha production
Char and other solid waste, 60 kg
Refinery gas production
Paraffin production
Titech NIR Sorter
Titech NIR Sorter
Mechanical recycling: shred, clean & extrude
Losses from recycling, 66 kg
* For clarity, provision of utilities have been omitted from this diagram but are included in the assessment.
77 kg
383 kg
PET
PVC
PE/PP
Mixed plastic input from MRF

LCA of Management Options for Mixed Waste Plastics 20
The BP process produced three main products, a light fraction that can substitute for naphtha, a heavy waxy fraction that can substitute for paraffin, and a gaseous fraction that can substitute for refinery gas generated during conventional oil processing. In this scenario it is assumed that most of the gas produced (0.1 kg gas per kg polyolefin feedstock) is consumed as a fuel for heating the pyrolysis process itself. This pyrolysis technology is only suited for processing polyolefins. As such, film separation and NIR sorting processes have been used to model the upstream material preparation stages based on data from the trials of Stadler and Titech equipment. However the material could equally be prepared using plant supplied by other technology providers included in this study, so this choice should not be viewed as specifically favouring these particular technology providers. In this scenario it is assumed that the PET and PVC fractions, which are not suitable for use in the pyrolysis process, are mechanically recycled. This involves shredding the plastics, followed by mechanical cleaning (using Pla.to equipment) and extrusion to give a recycled pellet product. The PS fraction is not sorted and recycled as it is not present in sufficient quantities in the waste stream for this to be economical. Along with the other non-recycled fractions this is sent to landfill and incineration according to the average UK mix of these disposal options. Table 4.4.1 Scenario D impact assessment results for different feedstock compositions Impact Category Unit Low Polyolefin Default High Polyolefin Energy MJ -17182 -18374 -19752 ADP kg eq. Sb -11.021 -9.802 -9.547 AP kg eq. SO2 -3.625 -1.680 -0.817 EP kg eq. PO4
+ -0.234 -0.067 -0.048 HTP kg eq. DCB 332.90 573.09 656.86 OLDP kg eq. R11 -3.8E-05 -6.3E-05 -7.8E-05 POCP kg eq. C2H4 -0.492 -0.300 -0.219 GWP kg eq. CO2 -374 30 215 Solid Waste kg 471 489 482 Table 4.4.2 Scenario D impact assessment results showing contribution from different process stages (default feedstock)
Impact Category Unit M
echa
nica
l R
ecyc
ling
Pyr
olys
is
Inci
nera
tion
Land
fill
Tran
spor
t
Avo
ided
Im
pact
s
Tota
l
Energy MJ 1073 1722 116 163 547 -21995 -18374 ADP kg eq. Sb 0.347 0.562 0.034 0.064 0.242 -11.050 -9.802 AP kg eq. SO2 0.168 1.016 0.049 0.101 0.176 -3.189 -1.680 EP kg eq. PO4
+ 0.014 0.036 0.009 0.482 0.041 -0.649 -0.067 HTP kg eq. DCB 4.69 7.53 96.07 595.21 2.09 -132.50 573.09 OLDP kg eq. R11 1.1E-06 2.7E-06 4.2E-07 1.5E-06 4.7E-06 -7.4E-05 -6.3E-05 POCP kg eq. C2H4 0.011 0.057 0.006 0.024 0.019 -0.417 -0.300 GWP kg eq. CO2 48 204 198 89 37 -547 30

LCA of Management Options for Mixed Waste Plastics 21
4.5 Scenario E – Stadler, Titech & Pyrolysis (Ozmotech) Figure 4.5 Process diagram for scenario E
Compared to the BP polymer cracking process, the pyrolysis technology developed by Ozmatech operates on a smaller scale and is suitable for converting PE, PP and PS polymers into a liquid product that can substitute directly for diesel from conventional oil processing. Information on the Ozmatech process has been taken from published sources 32-34 but detailed information is not available so data gaps relating to power, water, nitrogen requirements, etc. have been filled based on discussions with Bowman Process Technologies 34-36 using reasonable assumptions based on these sources.
191 kg
103 kg
361 kg
-338 MJ
-249 MJ
-91 kg
-68 kg
-285 kg
1000 kg
77 kg
1000 kg
809 kg
410 kg
220 kg
234 kg
44 kg
41 kg
219 kg
Titech NIR Sorter
Avoided production processes
Labels, fibres, residue and unsorted plastic
Virgin plastic production
PP/PE/ PS
Gas-fired power plant
Mixed plastic input from MRF
Transport
Stadler Film/Rigid Separator
Transport
Incinerate
Landfill
Transport
Char & other solid waste, 58 kg
Titech NIR Sorter
Titech NIR Sorter
Diesel oil production
Film and mis-sorted rigid plastic
Incinerate
PET
PVC
Landfill
Transport
Transport
Transport
Mechanical recycling: shred, clean & extrude
Mechanical recycling: shred, clean & extrude
Losses from recycling, 69 kg
* For clarity, provision of utilities have been omitted from this diagram but are included in the assessment.
Pretreatment: shred & clean
Pyrolysis: Oil fraction Gas fraction

LCA of Management Options for Mixed Waste Plastics 22
As well as diesel substitute, the process also produces a gas fraction and a solid char fraction. It is assumed that all the pyrolysis gas is fed back in to heat the process chamber. The char is disposed of to landfill and incineration and is assumed to have the same calorific value as hard coal. It is assumed that upstream material processing to separate these from the other materials in the feedstock is carried out using film separation and NIR sorting processes. The separated PET and PVC fractions that cannot be used for pyrolysis are assumed to be mechanically recycled. The non-recycled fraction is sent to landfill and incineration according to the average UK mix of these disposal options. Table 4.5.1 Scenario E impact assessment results for different feedstock compositions Impact Category Unit Low Polyolefin Default High Polyolefin Energy MJ -18857 -18999 -19918 ADP kg eq. Sb -11.818 -10.162 -9.720 AP kg eq. SO2 -4.066 -2.577 -1.976 EP kg eq. PO4
+ -0.412 -0.359 -0.408 HTP kg eq. DCB 307.90 577.54 675.23 OLDP kg eq. R11 -7.6E-05 -1.4E-04 -1.8E-04 POCP kg eq. C2H4 -0.547 -0.391 -0.332 GWP kg eq. CO2 -431 -61 104 Solid Waste kg 408 501 522 Table 4.5.2 Scenario E impact assessment results showing contribution from different process stages (default feedstock)
Impact Category Unit M
echa
nica
l R
ecyc
ling
Pyr
olys
is
Inci
nera
tion
Land
fill
Tran
spor
t
Avo
ided
Im
pact
s
Tota
l
Energy MJ 1169 2290 129 156 358 -23101 -18999 ADP kg eq. Sb 0.378 0.739 0.039 0.061 0.158 -11.538 -10.162 AP kg eq. SO2 0.183 0.359 0.055 0.097 0.115 -3.386 -2.577 EP kg eq. PO4
+ 0.015 0.030 0.009 0.465 0.027 -0.904 -0.359 HTP kg eq. DCB 5.11 10.02 93.81 584.49 1.37 -117.25 577.54 OLDP kg eq. R11 1.2E-06 2.3E-06 4.2E-07 1.4E-06 3.1E-06 -1.5E-04 -1.4E-04 POCP kg eq. C2H4 0.012 0.023 0.006 0.023 0.013 -0.468 -0.391 GWP kg eq. CO2 52 102 187 87 24 -514 -61

LCA of Management Options for Mixed Waste Plastics 23
4.6 Scenario F – Redox Agent in Blast Furnace
Figure 4.6 Process diagram for scenario F
An alternative option for managing waste polyolefins is in steel production, by injecting them into blast furnaces to reduce iron ore. This is not current practice at Corus steelworks in the UK but is carried out successfully elsewhere and would be an option in future if sufficient quantity and quality of material supply could be assured. Based on discussions with Corus experts it is expected that polyolefins would displace the use of pulverised coal injected into the blast furnace 24. Blast furnace chemistry is very complicated and no account has been made in this assessment for changes that might occur in the emissions profile from the blast furnace caused by ‘waste’ contamination in the product, residual non-polyolefin contamination or chemical differences between polyolefin waste plastics and coal. As with scenarios C and D it is assumed that upstream material processing to separate these from the other materials in the feedstock is carried out using film separation and NIR sorting processes. The polyolefin fraction is shredded, mechanically cleaned and then agglomerated to produce a suitably sized feedstock for
344 kg
1000 kg
1000 kg
246 kg
191 kg
103 kg
77 kg
383 kg
809 kg
-91 kg
-68 kg
207 kg
39 kg
160 kg
31 kg
-293 MJ
-226 MJ
-544 kg
Titech NIR Sorter
Avoided production processes
Labels, fibres, residue and unsorted plastic
Virgin plastic production
PP/PE
Gas-fired power plant
Mixed plastic input from MRF
Transport
Stadler Film/Rigid Separator
Transport
Incinerate
Landfill
Transport
Titech NIR Sorter
Titech NIR Sorter
Coal production
Film and mis-sorted rigid plastic
Incinerate
PET
PVC
Landfill
Transport
Transport
Transport
Mechanical recycling: shred, clean & extrude
Mechanical recycling: shred, clean & extrude
Losses from recycling, 66 kg
Agglomorate
* For clarity, provision of utilities have been omitted from this diagram but are included in the assessment.
Pretreatment: shred & clean

LCA of Management Options for Mixed Waste Plastics 24
injection. The separated PET and PVC fractions that are not suitable redox agents are assumed to be mechanically recycled. The PS fraction is not recycled as it is not present in the feedstock stream in sufficient quantity for this to be economically viable. Along with the other non-recycled fractions this is sent to landfill and incineration according to the average UK mix of these disposal options. It should also be recognised that the actual capacity for UK blast furnaces to accept mixed plastic waste is limited. However this issue is outside the scope of the study, which focuses on relative environmental performance of different waste management options. Table 4.6.1 Scenario F impact assessment results for different feedstock compositions Impact Category Unit Low Polyolefin Default High Polyolefin Energy MJ -19840 -28286 -33643 ADP kg eq. Sb -12.275 -14.451 -16.058 AP kg eq. SO2 -3.409 -1.243 -0.259 EP kg eq. PO4
+ -0.141 0.179 0.283 HTP kg eq. DCB 343.44 605.24 700.87 OLDP kg eq. R11 -1.9E-05 -6.8E-06 -4.2E-07 POCP kg eq. C2H4 -0.455 -0.208 -0.096 GWP kg eq. CO2 -401 -124 -8 Solid Waste kg 451 423 390 Table 4.6.2 Scenario F impact assessment results showing contribution from different process stages (default feedstock)
Impact Category Unit M
echa
nica
l R
ecyc
ling
Red
ox A
gent
Inci
nera
tion
Land
fill
Tran
spor
t
Avo
ided
Im
pact
s
Tota
l
Energy MJ 1073 964 116 161 931 -31529 -28286 ADP kg eq. Sb 0.343 0.311 0.034 0.063 0.411 -15.617 -14.454 AP kg eq. SO2 0.168 0.151 0.048 0.100 0.300 -2.010 -1.243 EP kg eq. PO4
+ 0.014 0.013 0.009 0.478 0.069 -0.404 0.179 HTP kg eq. DCB 4.69 4.21 94.32 581.72 3.55 -83.26 605.24 OLDP kg eq. R11 1.1E-06 9.5E-07 4.2E-07 1.4E-06 7.9E-06 -1.9E-05 -6.8E-06 POCP kg eq. C2H4 0.011 0.010 0.006 0.024 0.033 -0.291 -0.208 GWP kg eq. CO2 48 43 195 89 63 -561 -124

LCA of Management Options for Mixed Waste Plastics 25
4.7 Scenario G – Stadler & Titech
Figure 4.7 Process diagram for scenario G
Titech use NIR sorting technology to separate out the different plastic fractions. This scenario assumes that there is an upstream film separation step using Stadler equipment leaving the Titech equipment to treat the remaining rigid fraction. Each Titech machine can positively sort a single material type – so four are required to separate out the four major polymers (PE, PP, PET and PVC). Following the sorting stage it is assumed that each material stream is shredded, mechanically cleaned and extruded to form recycled pellets. The non-recycled fraction is sent to landfill and incineration according to the average UK mix of these disposal options.
-226 MJ
1000 kg
1000 kg
809 kg
191 kg
70 kg
313 kg
103 kg
77 kg
246 kg
216 kg
41 kg
207 kg
39 kg
-293 MJ
-61 kg
-276 kg
-91 kg
-68 kg
Film and mis-sorted rigid plastic
Avoided production processes
Labels, fibres, residue and unsorted plastic
Virgin plastic production
Gas-fired power plant
Mixed plastic input from MRF
Transport
Stadler Film/Rigid Separator
PE
PP
Transport
Transport
Mechanical recycling: shred, clean & extrude
Mechanical recycling: shred, clean & extrude
PET
PVC
Transport
Transport
Mechanical recycling: shred, clean & extrude
Mechanical recycling: shred, clean & extrude
Incinerate
Landfill
Transport
Losses from recycling, 66 kg
Incinerate
Landfill
Transport
Titech NIR Sorter
Titech NIR Sorter
Titech NIR Sorter
Titech NIR Sorter
* For clarity, provision of utilities have been omitted from this diagram but are included in the assessment.

LCA of Management Options for Mixed Waste Plastics 26
Table 4.7.1 Scenario G impact assessment results for different feedstock compositions Impact Category Unit Low Polyolefin Default High Polyolefin Energy MJ -15646 -12897 -12147 ADP kg eq. Sb -12.508 -14.667 -16.291 AP kg eq. SO2 -5.504 -7.875 -9.427 EP kg eq. PO4
+ -0.307 -0.281 -0.340 HTP kg eq. DCB 342.78 608.17 705.03 OLDP kg eq. R11 -2.4E-05 -1.0E-05 -3.6E-06 POCP kg eq. C2H4 -0.677 -0.855 -1.038 GWP kg eq. CO2 -571 -620 -678 Solid Waste kg 453 429 398
Table 4.7.2 Scenario G impact assessment results showing contribution from different process stages (default feedstock)
Impact Category Unit Mec
hani
cal
Rec
yclin
g
Inci
nera
tion
Land
fill
Tran
spor
t
Avo
ided
Im
pact
s
Tota
l
Energy MJ 2524 116 163 355 -16056 -12897 ADP kg eq. Sb 0.816 0.034 0.064 0.157 -15.737 -14.667 AP kg eq. SO2 0.396 0.049 0.101 0.114 -8.535 -7.875 EP kg eq. PO4
+ 0.033 0.009 0.482 0.026 -0.831 -0.281 HTP kg eq. DCB 11.03 96.07 595.21 1.36 -95.50 608.17 OLDP kg eq. R11 2.5E-06 4.2E-07 1.5E-06 3.0E-06 -1.8E-05 -1.0E-05 POCP kg eq. C2H4 0.026 0.006 0.024 0.013 -0.923 -0.855 GWP kg eq. CO2 113 198 89 24 -1044 -620

LCA of Management Options for Mixed Waste Plastics 27
4.8 Scenario H – Stadler & Pellenc
Figure 4.8 Process diagram for scenario H
Pellenc use near infrared (NIR) sorting technology to separate out the different plastic fractions. This scenario assumes that there is an upstream film separation step so the Pellenc equipment treats the remaining rigid fraction. Pellenc sorting machines can operate in binary (one positive sort) or ternary (two positive sorts) modes. To separate out the four major polymers (PE, PP, PET and PVC) two machines are required – both operating in ternary mode. Following the sorting stage it is assumed that each material stream is shredded, mechanically cleaned and extruded form recycled pellets. The non-recycled fraction is sent to landfill and incineration according to the average UK mix of these disposal options.
1000 kg
1000 kg
809 kg
191 kg
60 kg
285 kg
102 kg
72 kg
290 kg
213 kg
40 kg
243 kg
46 kg
-287 MJ
-278 MJ
-53 kg
-252 kg
-90 kg
-64 kg
Pellenc NIR Sorter
Film and mis-sorted rigid plastic
Avoided production processes
Labels, fibres, residue and unsorted plastic
Virgin plastic production
Gas-fired power
Mixed plastic input from MRF
Transport
Pellenc NIR Sorter
Stadler Film/Rigid Separator
PE
PP
Transport
Transport
Mechanical recycling: shred, clean & extrude
Mechanical recycling: shred, clean & extrude
PET
PVC
Transport
Transport
Mechanical recycling: shred, clean & extrude
Mechanical recycling: shred, clean & extrude
Incinerate
Landfill
Transport
Losses from recycling, 62 kg
Incinerate
Landfill
Transport
* For clarity, provision of utilities have been omitted from this diagram but are included in the assessment.

LCA of Management Options for Mixed Waste Plastics 28
Table 4.8.1 Scenario H impact assessment results for different feedstock compositions Impact Category Unit Low Polyolefin Default High Polyolefin Energy MJ -15449 -12441 -11553 ADP kg eq. Sb -12.120 -13.698 -14.921 AP kg eq. SO2 -5.243 -7.243 -8.532 EP kg eq. PO4
+ -0.276 -0.221 -0.259 HTP kg eq. DCB 374.11 685.12 813.13 OLDP kg eq. R11 -2.4E-05 -1.2E-05 -5.0E-06 POCP kg eq. C2H4 -0.645 -0.784 -0.931 GWP kg eq. CO2 -549 -556 -586 Solid Waste kg 471 461 439 Table 4.8.2 Scenario H impact assessment results showing contribution from different process stages (default feedstock)
Impact Category Unit Mec
hani
cal
Rec
yclin
g
Inci
nera
tion
Land
fill
Tran
spor
t
Avo
ided
Im
pact
s
Tota
l
Energy MJ 1992 128 175 350 -15087 -12441 ADP kg eq. Sb 0.644 0.037 0.069 0.155 -14.603 -13.698 AP kg eq. SO2 0.312 0.053 0.107 0.113 -7.828 -7.243 EP kg eq. PO4
+ 0.026 0.009 0.500 0.026 -0.782 -0.221 HTP kg eq. DCB 8.71 105.26 662.68 1.34 -92.86 685.12 OLDP kg eq. R11 2.0E-06 4.7E-07 1.6E-06 3.0E-06 -1.9E-05 -1.2E-05 POCP kg eq. C2H4 0.020 0.006 0.025 0.012 -0.848 -0.784 GWP kg eq. CO2 89 216 92 24 -977 -556

LCA of Management Options for Mixed Waste Plastics 29
4.9 Scenario I – Stadler & QinetiQ Figure 4.9 Process diagram for scenario I
The Qinetiq system uses NIR sorting technology to separate out the different plastic fractions. It is assumed that the film fraction is first separated from the waste stream leaving the Qinetiq sorter to separate the remaining rigid fraction. The Qinetiq sorter capable of sorting multiple materials from a mixed input stream in a single pass. It is assumed that the PE, PP, PVC and PET streams are sorted before being shredded, mechanically cleaned and extruded form recycled pellets. The non-recycled fraction is sent to landfill and incineration according to the average UK mix of these disposal options.
-331 MJ
1000 kg
1000 kg
809 kg
191 kg
62 kg
249 kg
93 kg
62 kg
343 kg
207 kg
39 kg
288 kg
55 kg
-281 MJ
-55 kg
-219 kg
-82 kg
-55 kg
Film and mis-sorted rigid plastic
Avoided production processes
Labels, fibres, residue and unsorted plastic
Virgin plastic production
Gas-fired power plant
Mixed plastic input from MRF
Transport
Stadler Film/Rigid Separator
PE
PP
Transport
Transport
Mechanical recycling: shred, clean & extrude
Mechanical recycling: shred, clean & extrude
PET
PVC
Transport
Transport
Mechanical recycling: shred, clean & extrude
Mechanical recycling: shred, clean & extrude
Incinerate
Landfill
Transport
Losses from recycling, 55 kg
Incinerate
Landfill
Transport
Qinetiq NIR Sorter
* For clarity, provision of utilities have been omitted from this diagram but are included in the assessment.

LCA of Management Options for Mixed Waste Plastics 30
Table 4.9.1 Scenario I impact assessment results for different feedstock compositions Impact Category Unit Low Polyolefin Default High Polyolefin Energy MJ -13977 -11403 -10740 ADP kg eq. Sb -11.008 -12.411 -13.694 AP kg eq. SO2 -4.699 -6.499 -7.782 EP kg eq. PO4
+ -0.130 -0.111 -0.176 HTP kg eq. DCB 446.63 777.13 903.37 OLDP kg eq. R11 -2.3E-05 -1.1E-05 -5.5E-06 POCP kg eq. C2H4 -0.583 -0.712 -0.864 GWP kg eq. CO2 -459 -458 -495 Solid Waste kg 510 501 477 Table 4.9.2 Scenario I impact assessment results showing contribution from different process stages (default feedstock)
Impact Category Unit Mec
hani
cal
Rec
yclin
g
Inci
nera
tion
Land
fill
Tran
spor
t
Avo
ided
Im
pact
s
Tota
l
Energy MJ 1717 149 191 343 -13803 -11403 ADP kg eq. Sb 0.555 0.043 0.075 0.152 -13.236 -12.411 AP kg eq. SO2 0.269 0.060 0.115 0.111 -7.054 -6.499 EP kg eq. PO4
+ 0.023 0.010 0.537 0.026 -0.707 -0.111 HTP kg eq. DCB 7.50 116.49 735.98 1.31 -84.15 777.13 OLDP kg eq. R11 1.7E-06 5.4E-07 1.7E-06 2.9E-06 -1.8E-05 -1.1E-05 POCP kg eq. C2H4 0.018 0.007 0.026 0.012 -0.774 -0.712 GWP kg eq. CO2 77 236 96 23 -890 -458

LCA of Management Options for Mixed Waste Plastics 31
4.10 Scenario J – Stadler & Sims
Figure 4.10 Process diagram for scenario J
Sims use NIR sorting technology to separate out the different plastic fractions. This scenario assumes that there is an upstream film separation step using Stadler equipment leaving the Sims equipment to treat the remaining rigid fraction. Each Sims machine can positively sort a single material type – so four are required to separate out the four major polymers (PE, PP, PET and PVC). Following the sorting stage it is assumed that each material stream is shredded, mechanically cleaned and extruded form recycled pellets. The non-recycled fraction is sent to landfill and incineration according to the average UK mix of these disposal options.
-226 MJ
1000 kg
1000 kg
809 kg
191 kg
70 kg
313 kg
103 kg
77 kg
246 kg
216 kg
41 kg
207 kg
39 kg
-293 MJ
-61 kg
-276 kg
-91 kg
-68 kg
Film and mis-sorted rigid plastic
Avoided production processes
Labels, fibres, residue and unsorted plastic
Virgin plastic production
Gas-fired power plant
Mixed plastic input from MRF
Transport
Stadler Film/Rigid Separator
PE
PP
Transport
Transport
Mechanical recycling: shred, clean & extrude
Mechanical recycling: shred, clean & extrude
PET
PVC
Transport
Transport
Mechanical recycling: shred, clean & extrude
Mechanical recycling: shred, clean & extrude
Incinerate
Landfill
Transport
Losses from recycling, 66 kg
Incinerate
Landfill
Transport
Sims NIR Sorter
Sims NIR Sorter
Sims NIR Sorter
Sims NIR Sorter
* For clarity, provision of utilities have been omitted from this diagram but are included in the assessment.

LCA of Management Options for Mixed Waste Plastics 32
Table 4.10.1 Scenario J impact assessment results for different feedstock compositions Impact Category Unit Low Polyolefin Default High Polyolefin Energy MJ -15646 -12897 -12147 ADP kg eq. Sb -12.508 -14.667 -16.291 AP kg eq. SO2 -5.504 -7.875 -9.427 EP kg eq. PO4
+ -0.307 -0.281 -0.340 HTP kg eq. DCB 342.78 608.17 705.03 OLDP kg eq. R11 -2.4E-05 -1.0E-05 -3.6E-06 POCP kg eq. C2H4 -0.677 -0.855 -1.038 GWP kg eq. CO2 -571 -620 -678 Solid Waste kg 453 429 398
Table 4.10.2 Scenario J impact assessment results showing contribution from different process stages (default feedstock)
Impact Category Unit Mec
hani
cal
Rec
yclin
g
Inci
nera
tion
Land
fill
Tran
spor
t
Avo
ided
Im
pact
s
Tota
l
Energy MJ 2524 116 163 355 -16056 -12897 ADP kg eq. Sb 0.816 0.034 0.064 0.157 -15.737 -14.667 AP kg eq. SO2 0.396 0.049 0.101 0.114 -8.535 -7.875 EP kg eq. PO4
+ 0.033 0.009 0.482 0.026 -0.831 -0.281 HTP kg eq. DCB 11.03 96.07 595.21 1.36 -95.50 608.17 OLDP kg eq. R11 2.5E-06 4.2E-07 1.5E-06 3.0E-06 -1.8E-05 -1.0E-05 POCP kg eq. C2H4 0.026 0.006 0.024 0.013 -0.923 -0.855 GWP kg eq. CO2 113 198 89 24 -1044 -620

LCA of Management Options for Mixed Waste Plastics 33
4.11 Scenario K - KME & Titech Figure 4.11 Process diagram for scenario K
This scenario is the same as scenario K but uses the KME process rather than Stadler equipment to remove the film fraction from the infeed material prior to processing in the NIR sorters.
-202 MJ
1000 kg
1000 kg
717 kg
283 kg
62 kg
277 kg
91 kg
68 kg
220 kg
287 kg
55 kg
184 kg
35 kg
-380 MJ
-54 kg
-244 kg
-80 kg
-60 kg
Film and mis-sorted rigid plastic
Avoided production processes
Labels, fibres, residue and unsorted plastic
Virgin plastic production
Gas-fired power plant
Mixed plastic input from MRF
Transport
KME 2D/3D Separator
PE
PP
Transport
Transport
Mechanical recycling: shred, clean & extrude
Mechanical recycling: shred, clean & extrude
PET
PVC
Transport
Transport
Mechanical recycling: shred, clean & extrude
Mechanical recycling: shred, clean & extrude
Incinerate
Landfill
Transport
Losses from recycling, 59 kg
Incinerate
Landfill
Transport
Titech NIR Sorter
Titech NIR Sorter
Titech NIR Sorter
Titech NIR Sorter
* For clarity, provision of utilities have been omitted from this diagram but are included in the assessment.

LCA of Management Options for Mixed Waste Plastics 34
Table 4.11.1 Scenario K impact assessment results for different feedstock compositions Impact Category Unit Low Polyolefin Default High Polyolefin Energy MJ -13820 -11472 -10799 ADP kg eq. Sb -11.076 -13.006 -14.456 AP kg eq. SO2 -4.807 -6.914 -8.291 EP kg eq. PO4
+ -0.121 -0.142 -0.220 HTP kg eq. DCB 436.90 725.51 837.97 OLDP kg eq. R11 -2.2E-05 -1.0E-05 -4.3E-06 POCP kg eq. C2H4 -0.593 -0.751 -0.912 GWP kg eq. CO2 -455 -492 -541 Solid Waste kg 498.62 477.32 450.41 Table 4.11.2 Scenario K impact assessment results showing contribution from different process stages (default feedstock)
Impact Category Unit Mec
hani
cal
Rec
yclin
g
Inci
nera
tion
Land
fill
Tran
spor
t
Avo
ided
Im
pact
s
Tota
l
Energy MJ 2333 136 181 347 -14470 -11472 ADP kg eq. Sb 0.754 0.039 0.072 0.153 -14.025 -13.006 AP kg eq. SO2 0.366 0.056 0.110 0.112 -7.558 -6.914 EP kg eq. PO4
+ 0.031 0.010 0.528 0.026 -0.736 -0.142 HTP kg eq. DCB 10.20 110.12 688.44 1.33 -84.57 725.51 OLDP kg eq. R11 2.3E-06 4.9E-07 1.6E-06 3.0E-06 -1.8E-05 -1.0E-05 POCP kg eq. C2H4 0.024 0.006 0.025 0.012 -0.819 -0.751 GWP kg eq. CO2 104 223 94 24 -937 -492

LCA of Management Options for Mixed Waste Plastics 35
4.12 Scenario L – Stadler & TLT Figure 4.12 Process diagram for scenario L
This scenario assumes that the film fraction is removed first, and the remaining rigid fraction is then shredded prior to processing. TLT’s technology uses a float/sink density separation processes to separate out the various polymer streams. In principle a cascade of these processes could be used with float media of varying densities (which TLT have developed) to separate out all the polymer types. However in this scenario only a single separation step has been modelled to produce a float fraction comprised of mixed polyolefin (PE and PP) that is sent for mechanical recycling with no further attempt to separate these polymers. The sink fraction is comprised of the non-polyolefin plastics and other residual materials and is assumed to be sent to landfill or incineration with energy recovery.
-306 MJ
-426 kg
1000 kg
-232 MJ
1000 kg
191 kg
809 kg
Film and mis-sorted rigid plastic
Incinerate
Avoided production processes
Extrusion
Virgin plastic
production
PP/PE
PS/PET/PVC/Residue
Transport
Stadler Film/Rigid Separator
Landfill
Transport
Shredding
TLT
Density Separation
Transport
Gas-fired power plant
Losses from recycling, 9 kg
374 kg
Incinerate
Landfill
Transport
435 kg
Mixed plastic input from MRF
* For clarity, provision of utilities and material drying have been omitted from this diagram but are included in the assessment.

LCA of Management Options for Mixed Waste Plastics 36
Table 4.12.1 Scenario L impact assessment results for different feedstock compositions Impact Category Unit Low Polyolefin Default High Polyolefin Energy MJ -2984 -9753 -13505 ADP kg eq. Sb -4 -13.735 -19 AP kg eq. SO2 -2 -8.271 -12 EP kg eq. PO4
+ 1 0.152 0 HTP kg eq. DCB 863 652.02 497 OLDP kg eq. R11 0 -6.1E-07 0 POCP kg eq. C2H4 0 -1.291 -2 GWP kg eq. CO2 140 -464 -809 Solid Waste kg 741 488 344 Table 4.12.2 Scenario L impact assessment results showing contribution from different process stages (default feedstock)
Impact Category Unit Mec
hani
cal
Rec
yclin
g
Inci
nera
tion
Land
fill
Tran
spor
t
Avo
ided
Im
pact
s
Tota
l
Energy MJ 1886 271 180 332 -12421 -9753 ADP kg eq. Sb 0.609 0.075 0.071 0.147 -14.637 -13.735 AP kg eq. SO2 0.296 0.085 0.120 0.107 -8.879 -8.271 EP kg eq. PO4
+ 0.025 0.013 0.674 0.025 -0.584 0.152 HTP kg eq. DCB 8.24 108.09 563.81 1.27 -29.39 652.02 OLDP kg eq. R11 1.9E-06 9.0E-07 1.6E-06 2.8E-06 -7.8E-06 -6.1E-07 POCP kg eq. C2H4 0.019 0.009 0.025 0.012 -1.356 -1.291 GWP kg eq. CO2 84 208 90 22 -869 -464

LCA of Management Options for Mixed Waste Plastics 37
4.13 Scenario M - Swiss Polymera Figure 4.13 Process diagram for scenario M
The Swiss Polymera pre-treatment process separates film and rigid plastics into polyolefin and non-polyolefin fractions using density separation so no additional upstream treatment processes are required. The pre-treatment comprise several steps as including:
Shredding
Eddy current metal removal (metals recovered are still assumed to be landfilled in this assessment,
though in practise these may well be recycled. The low content of metals in the waste stream means
that this assumption should not significantly affect the results)
Zig-zag air separator to remove films
Density separation for both film and rigid fractions
Washing
Densification of PO films prior to extrusion
The polyolefin fraction is extruded to form a mixed recycled granulate, which is assumed to replace virgin polyethylene production. The non-polyolefin fraction is sent to landfill and incineration according to the average UK mix of these disposal options.
1000 kg
1000 kg
534 kg
467 kg
392 kg
75 kg
-392 MJ
-523 kg
Swiss Polymera Extrusion
Non-polyolefin fraction (e.g. paper, PET)
Incinerate
Avoided production processes
Virgin plastic production
Polyolefin fraction
Gas-fired power plant
Mixed plastic input from MRF
Transport
Swiss Polymera Pre-treatment: Shred Eddy current metal removal Air-separate Density separate
Landfill
Transport
* For clarity, provision of utilities have been omitted from this diagram but are included in the assessment.
Losses from recycling, 9 kg

LCA of Management Options for Mixed Waste Plastics 38
Table 4.13.1 Scenario M impact assessment results for different feedstock compositions Impact Category Unit Low Polyolefin Default High Polyolefin Energy MJ -2607 -10758 -15039 ADP kg eq. Sb -4.514 -16.429 -22.679 AP kg eq. SO2 -2.341 -10.087 -14.145 EP kg eq. PO4
+ 1.038 -0.013 -0.593 HTP kg eq. DCB 832.56 438.57 218.86 OLDP kg eq. R11 -2.6E-06 1.5E-06 3.8E-06 POCP kg eq. C2H4 -0.392 -1.585 -2.211 GWP kg eq. CO2 137 -631 -1034 Solid Waste kg 728 407 238 Table 4.13.2 Scenario M impact assessment results showing contribution from different process stages (default feedstock)
Impact Category Unit Mec
hani
cal
Rec
yclin
g
Inci
nera
tion
Land
fill
Tran
spor
t
Avo
ided
Im
pact
s
Tota
l
Energy MJ 3243 264 150 239 -14654 -10758 ADP kg eq. Sb 1.047 0.073 0.059 0.106 -17.713 -16.429 AP kg eq. SO2 0.510 0.079 0.107 0.077 -10.860 -10.087 EP kg eq. PO4
+ 0.043 0.012 0.627 0.018 -0.713 -0.013 HTP kg eq. DCB 14.30 84.09 375.00 0.91 -35.73 438.57 OLDP kg eq. R11 3.2E-06 8.6E-07 1.3E-06 2.0E-06 -5.9E-06 1.5E-06 POCP kg eq. C2H4 0.033 0.008 0.022 0.009 -1.657 -1.585 GWP kg eq. CO2 145 163 82 16 -1036 -631

LCA of Management Options for Mixed Waste Plastics 39
4.14 Scenario N – B+B
Figure 4.14 Process diagram for scenario N
The B+B recycling process consists of a number of steps as follows:
Shredding incoming feedstock
Mechanically “dry” cleaning
Zig-zag air filter to remove film
Pre-wash and hot wash
Centrifuge
Friction wash
Density separation
Mechanical Dryer
As with the other flake separation scenarios it is assumed that the rigid polyolefin fraction is mechanically recycled, while the remaining material (non-PO polymers, films and residue) is disposed of to landfill or incineration with energy recovery.
-466 kg
1000 kg
1000 kg
475 kg
525 kg
441 kg
84 kg
-478 MJ
Extrusion
Non-polyolefin fraction and film (e.g. paper, PET)
Incinerate
Avoided production processes
Virgin plastic production
Polyolefin fraction
Gas-fired power plant
Mixed plastic input from MRF
Transport
B+B Process: Shred Dry clean Air-separate Wash Density separate Mechanical dryer
Landfill
Transport
* For clarity, provision of utilities have been omitted from this diagram but are included in the assessment.
Losses from recycling, 10 kg

LCA of Management Options for Mixed Waste Plastics 40
Table 4.14.1 Scenario N impact assessment results for different feedstock compositions Impact Category Unit Low Polyolefin Default High Polyolefin Energy MJ -897 -7782 -11702 ADP kg eq. Sb -3.694 -13.460 -19.027 AP kg eq. SO2 -1.888 -8.213 -11.816 EP kg eq. PO4
+ 1.078 0.156 -0.381 HTP kg eq. DCB 863.81 627.51 457.27 OLDP kg eq. R11 -1.2E-06 1.9E-06 3.9E-06 POCP kg eq. C2H4 -0.344 -1.314 -1.867 GWP kg eq. CO2 232 -397 -758 Solid Waste kg 737 476 327 Table 4.14.2 Scenario N impact assessment results showing contribution from different process stages (default feedstock)
Impact Category Unit Mec
hani
cal
Rec
yclin
g
Inci
nera
tion
Land
fill
Tran
spor
t
Avo
ided
Im
pact
s
Tota
l
Energy MJ 4170 279 175 333 -12739 -7782 ADP kg eq. Sb 1.347 0.077 0.069 0.147 -15.101 -13.460 AP kg eq. SO2 0.654 0.086 0.118 0.107 -9.178 -8.213 EP kg eq. PO4
+ 0.055 0.013 0.667 0.025 -0.603 0.156 HTP kg eq. DCB 18.22 103.11 535.25 1.27 -30.34 627.51 OLDP kg eq. R11 4.1E-06 9.2E-07 1.6E-06 2.8E-06 -7.5E-06 1.9E-06 POCP kg eq. C2H4 0.043 0.009 0.024 0.012 -1.401 -1.314 GWP kg eq. CO2 186 199 89 23 -895 -397
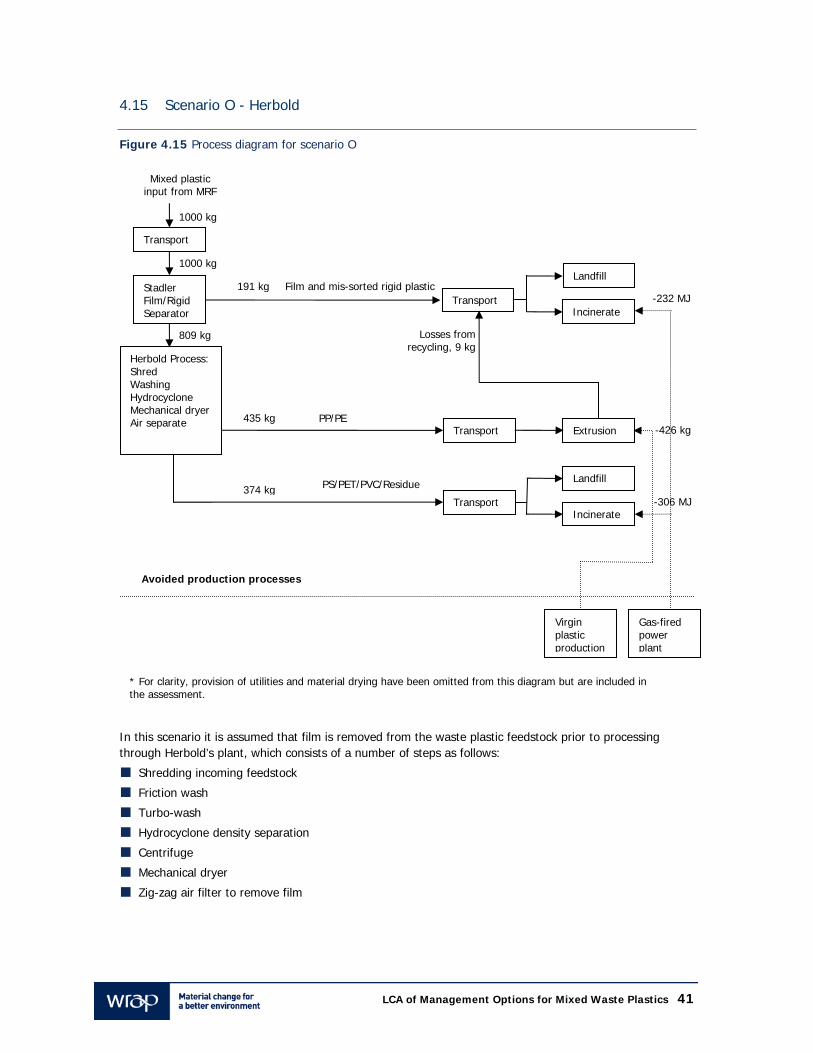
LCA of Management Options for Mixed Waste Plastics 41
4.15 Scenario O - Herbold
Figure 4.15 Process diagram for scenario O
In this scenario it is assumed that film is removed from the waste plastic feedstock prior to processing through Herbold’s plant, which consists of a number of steps as follows:
Shredding incoming feedstock
Friction wash
Turbo-wash
Hydrocyclone density separation
Centrifuge
Mechanical dryer
Zig-zag air filter to remove film
435 kg -426 kg
-306 MJ
1000 kg
-232 MJ
1000 kg
191 kg
809 kg
Film and mis-sorted rigid plastic
Incinerate
Avoided production processes
Extrusion
Virgin plastic production
PP/PE
PS/PET/PVC/Residue
Transport
Stadler Film/Rigid Separator
Landfill
Transport
Transport
* For clarity, provision of utilities and material drying have been omitted from this diagram but are included in the assessment.
Gas-fired power plant
Losses from recycling, 9 kg
374 kg
Incinerate
Landfill
Transport
Herbold Process: Shred Washing Hydrocyclone Mechanical dryer Air separate
Mixed plastic input from MRF

LCA of Management Options for Mixed Waste Plastics 42
As with the other flake separation scenarios it is assumed that the rigid polyolefin fraction is mechanically recycled, while the remaining material (non-PO polymers, films and residue) is disposed of to landfill or incineration with energy recovery. Table 4.15.1 Scenario O impact assessment results for different feedstock compositions Impact Category Unit Low Polyolefin Default High Polyolefin Energy MJ 812 -6076 -9709 ADP kg eq. Sb -3.042 -12.547 -17.894 AP kg eq. SO2 -1.549 -7.694 -11.159 EP kg eq. PO4
+ 1.107 0.201 -0.325 HTP kg eq. DCB 879.41 668.16 513.71 OLDP kg eq. R11 4.0E-07 3.0E-06 5.0E-06 POCP kg eq. C2H4 -0.314 -1.253 -1.787 GWP kg eq. CO2 310 -300 -640 Solid Waste kg 741 488 344 Table 4.15.2 Scenario O impact assessment results showing contribution from different process stages (default feedstock)
Impact Category Unit Mec
hani
cal
Rec
yclin
g
Inci
nera
tion
Land
fill
Tran
spor
t
Avo
ided
Im
pact
s
Tota
l
Energy MJ 5562 271 180 332 -12421 -6076 ADP kg eq. Sb 1.797 0.075 0.071 0.147 -14.637 -12.547 AP kg eq. SO2 0.873 0.085 0.120 0.107 -8.879 -7.694 EP kg eq. PO4
+ 0.073 0.013 0.674 0.025 -0.584 0.201 HTP kg eq. DCB 24.38 108.09 563.81 1.27 -29.39 668.16 OLDP kg eq. R11 5.5E-06 9.0E-07 1.6E-06 2.8E-06 -7.8E-06 3.0E-06 POCP kg eq. C2H4 0.057 0.009 0.025 0.012 -1.356 -1.253 GWP kg eq. CO2 248 208 90 22 -869 -300

LCA of Management Options for Mixed Waste Plastics 43
4.16 Scenario P - Flottweg
Figure 4.16 Process diagram for scenario P
In this scenario it is assumed that film is removed from the waste plastic feedstock prior to processing through Flottweg’s sorticanter equipment, which cleans, separates and mechanically dries the mixed plastic flakes in one step. As with the other flake separation scenarios it is assumed that the rigid polyolefin fraction is mechanically recycled, while the remaining material (non-PO polymers, films and residue) is disposed of to landfill or incineration with energy recovery.
-433 kg
-299 MJ
1000 kg
-232 MJ
1000 kg
191 kg
809 kg
Film and mis-sorted rigid plastic
Incinerate
Avoided production processes
Extrusion
Virgin plastic production
PP/PE
PS/PET/PVC/Residue
Transport
Stadler Film/Rigid Separator
Landfill
Transport
Shredding
Flottweg Process Transport
* For clarity, provision of utilities and material drying have been omitted from this diagram but are included in the assessment.
Gas-fired power plant
Losses from recycling, 9 kg
367 kg
Incinerate
Landfill
Transport
442 kg
Mixed plastic input from MRF

LCA of Management Options for Mixed Waste Plastics 44
Table 4.16.1 Scenario P impact assessment results for different feedstock compositions Impact Category Unit Low Polyolefin Default High Polyolefin Energy MJ -1996 -8897 -12663 ADP kg eq. Sb -3.999 -13.630 -19.091 AP kg eq. SO2 -2.024 -8.254 -11.789 EP kg eq. PO4
+ 1.067 0.153 -0.378 HTP kg eq. DCB 862.67 641.18 480.42 OLDP kg eq. R11 -2.3E-06 5.0E-07 2.4E-06 POCP kg eq. C2H4 -0.349 -1.302 -1.846 GWP kg eq. CO2 182 -434 -783 Solid Waste kg 739 482 336 Table 4.16.2 Scenario P impact assessment results showing contribution from different process stages (default feedstock)
Impact Category Unit Mec
hani
cal
Rec
yclin
g
Inci
nera
tion
Land
fill
Tran
spor
t
Avo
ided
Im
pact
s
Tota
l
Energy MJ 2914 268 178 332 -12588 -8897 ADP kg eq. Sb 0.940 0.074 0.070 0.147 -14.861 -13.630 AP kg eq. SO2 0.458 0.084 0.119 0.107 -9.022 -8.254 EP kg eq. PO4
+ 0.038 0.013 0.670 0.025 -0.593 0.153 HTP kg eq. DCB 12.85 106.74 550.17 1.27 -29.85 641.18 OLDP kg eq. R11 2.9E-06 8.9E-07 1.6E-06 2.8E-06 -7.7E-06 5.0E-07 POCP kg eq. C2H4 0.030 0.009 0.025 0.012 -1.377 -1.302 GWP kg eq. CO2 130 206 90 23 -882 -434

LCA of Management Options for Mixed Waste Plastics 45
5.0 Scenario comparisons and discussion 5.1 Normalisation To get an indication of the relative importance of each impact category a normalisation exercise has been conducted. Although WRAP has organisational goals that prioritise global warming and solid waste as key issues this LCA study also considers other impact categories and normalisation can be used to help understand their relative importance. Due to the time and budget restraints on the project this normalisation exercise is somewhat crude and is based on data provided in the CML 2001 Normalisation Factors for Western Europe 37 (relevant UK data were not available for the range of impact categories assessed in this study). It is acknowledged that these data are in need of updating to properly reflect the current situation but it is felt that their use is valid in this instance to give a general impression of the relative scale of the different impact categories. It is also noted that several alternative approaches to normalisation are possible (such as basing the assessment on the distance to achieving a legislated target). Each of these has strengths and weaknesses but will not be considered further in this report. Four scenarios representative of the range of different management options assessed in this study have been normalised against the reference of total annual contributions to each impact category from Western Europe. The impact categories have been ranked as shown in Table 5.1 – with the ranking ranging from 1 (most significant contribution) through to 7 (least significant contribution) relative to the reference data. Information for energy consumption and solid waste arising are not included in the CML 2001 Normalisation Factors and have been omitted from this exercise.
Table 5.1 Relative ranking of the normalised impact categories for selected scenarios
Scenario ADP AP EP HTP OLDP POCP GWP
A (Landfill) 4 5 2 1 7 6 3
C (SRF) 7 6 3 1 2 4 5
G (Stadler & Titech) 7 6 3 1 2 4 5
L (Stadler & TLT) 7 6 2 1 3 5 4
Total “Score” 25 23 10 4 14 19 17 It is clear that the ranking based on normalisation varies according to the particular impacts associated with each scenario. Nevertheless, some trends are evident with scenarios C, G and F broadly agreeing the relative ranking of the categories, while scenario A (the landfill option) differs significantly in places. To aggregate these differences a total “score” summing the results for all the scenarios is given at the bottom of the table, the lower the number, the higher the ranking and the greater the relative importance of the impact category. This normalisation exercise gives the following ranking in order of importance:
Human toxicity potential (HTP)
Eutrophication potential (EP)
Ozone layer depletion potential (OLDP)
Global warming potential (GWP)
Photochemical ozone creation potential (POCP)
Acidification potential (AP)
Abiotic depletion potential (ADP)

LCA of Management Options for Mixed Waste Plastics 46
It is important to interpret these results carefully. For example it may be decided that even though OLDP ranks highly in normalised terms the emissions are still very small in absolute terms due to existing control measures and so this would not be considered a priority impact category for WRAP. Equally, the high ranking given to EP will be in part due to the use of Ecoinvent datasets for landfill which assume a worst-case scenario for leaching as described in Section 4.1. Nevertheless, this quick top-level assessment indicates that impacts relating to human toxicity are important aspects associated with management processes for waste plastic, while impacts relating to acidification and abiotic depletion are of less concern. 5.2 Summary of results The overall results are summarised in Table 5.2, which gives the relative ranking of each scenario for the impact categories assessed in this study. The results of the normalisation have been used to help rank the impact categories in order of importance (taking into account the broader issues discussed above for specific impact categories).
Table 5.2 Summary of results showing relative ranking of the scenarios against each impact category (rank 1 = best, rank 16 = worst), green = top 25%, red = bottom 25%
High priority Low priority
Scenario GW
P
Solid
W
aste
Ener
gy
HTP
EP
PO
CP
AP
AD
P
OLD
P
A (Landfill) 15 16 16 16 16 16 16 16 16 B (Incineration) 16 1 8 15 10 15 15 15 2 C (SRF) 11 2 1 14 2 12 11 1 10 D (BP pyrolysis) 14 12 4 2 8 13 13 14 3 E (Ozmotech pyrolysis) 13 15 3 3 1 11 12 13 1 F (Redox agent) 12 4 2 4 13 14 14 5 9 G (Stadler & Titech) 1 5 5 5 3 6 4 3 6 H (Stadler & Pellenc) 4 7 7 11 5 8 8 7 4 I (Stadler & Qinetiq) 7 14 10 13 7 10 10 12 5 J (Stadler & Sims) 2 6 6 6 4 7 5 4 7 K (KME & Titech) 5 8 9 12 6 9 9 9 8 L (Stadler & TLT) 6 10 12 8 11 3 2 6 11 M (Swiss Polymera) 3 3 11 1 9 1 1 2 13 N (B+B) 9 13 14 10 14 5 6 10 14 O (Stadler & Herbold) 10 11 15 9 15 4 7 11 15 P (Stadler & Flottweg) 8 9 13 7 12 2 3 8 12 Each impact category is discussed in more detail below. To facilitate comparison and discussion of the various scenarios modelled in this study two sets of charts are presented for each impact category, based on the results provided in Section 4.
The first chart gives the net impact (accounting for avoided impacts from recycling, etc.) of each
scenario. The purple bars indicate scenarios incorporating recycling processes with data obtained from
plant trials, the yellow bars indicate scenarios looking at alternative management options based on
available published data.
The second chart shows the contribution to the overall result from the various sub-processes in each
scenario (e.g. transport, mechanical recycling, landfill, etc.).

LCA of Management Options for Mixed Waste Plastics 47
Results on both charts relate to the default feedstock composition and default assumptions. Sensitivity analyses around key assumptions are considered in Section 6. When reading the charts, positive values signify negative environmental impacts arising from the recycling/reprocessing supply chain. Negative values signify an environmental benefit and are due to avoided processes (e.g. avoiding the need to produce primary plastic). Some caution should be exercised when making direct comparisons between scenarios when the differences between them are small. As well as the uncertainties inherent in LCA studies further differences may arise due to the way the trials were organised. For example, data on the Titech process were collected with the sorter operating at a lower speed that for the Pellenc process and this may explain the slightly higher apparent recycling efficiency of the Titech equipment.

LCA of Management Options for Mixed Waste Plastics 48
5.3 Global Warming Potential
Chart 5.3.1 Net global warming potential
-1000
-500
0
500
1000
1500
2000
A -
Land
fill
B -
Inci
nera
tion
C - S
RF
D - B
Ppy
roly
sis
E -
Ozm
otec
hF
- Red
oxag
ent
G -
Stad
ler
& Ti
tech
H - S
tadl
er &
Pelle
ncI -
Sta
dler
&Q
inet
iqJ
- Sta
dler
&Si
ms
K -
KM
E &
Tite
chL
- Sta
dler
&TL
TM
- Sw
iss
Poly
mer
a
N - B
+B
O -
Herb
old
P -
Flot
twegkg
eq.
car
bon
diox
ide/
tonn
e
Chart 5.3.2 Contribution to global warming potential by process stage
-3000
-2000
-1000
0
1000
2000
3000
A -
Land
fill
B -
Inci
nera
tion
C - S
RF
D -
BP p
yrol
ysis
E -
Ozm
otec
hpy
roly
sis
F - R
edox
age
nt
G -
Stad
ler
&Ti
tech
H -
Stad
ler
&Pe
llenc
I - S
tadl
er &
Qin
etiq
J - S
tadl
er &
Sim
s
K - K
ME
& T
itech
L - S
tadl
er &
TLT
M -
Swis
sP
olym
era
N - B
+B
O -
Her
bold
P - F
lottw
eg
kg e
q. c
arbo
n di
oxid
e/to
nne
Mechanical Recycling Incineration Landfill Redox Agent Pyrolysis Transport Avoided Impacts
Emissions contributing to global warming have a global effect on the environment wherever they are released and continuing work by the Intergovernmental Panel on Climate Change (IPCC) means that the cause-effect relationship between emission of greenhouses gases and climate change are fairly well understood. A 100 year time horizon has been used for considering global warming impacts. In almost all
The results of this LCA relate only to mixed plastics and not general municipal waste

LCA of Management Options for Mixed Waste Plastics 49
cases carbon dioxide is by far the most important greenhouse gas, followed by methane, while contributions to the impact category from other greenhouse gases are negligible. The exception is scenario A (landfill), where emissions of methane have the biggest contribution. The overall picture for GWP tends to be dominated by the avoided emissions from substituted processes associated with each scenario although with some important exceptions. The two energy recovery scenarios (B & C) both produce large emissions of greenhouse gases as a result of the plastic being burnt. In scenario B (municipal incineration) this is not fully compensated for by the avoided production of electricity from natural gas, resulting in this scenario having the greatest net GWP of the scenarios assessed. In contrast, the carbon dioxide emissions from burning plastic in scenario C (SRF to cement kilns) are largely cancelled out by the displaced carbon dioxide emissions from avoiding burning coal. Interestingly this means that the avoided methane emissions associated with coal production play an important role and are the biggest contributors to the resulting negative GWP in this scenario. The pyrolysis and redox agent scenarios (D, E & F) all have near zero net GWP as the benefits of the avoided processes are largely balanced by greenhouse gas emissions from processing the material. Compared against the recycling scenarios (G – P) it can be seen that they all have similar process emissions, but that the recycling routes receive a greater credit for avoided processes – and so are preferred over pyrolysis and redox routes for this impact category. Most of the recycling scenarios have similar net global warming potential and are all preferred over the alternative management options.

LCA of Management Options for Mixed Waste Plastics 50
5.4 Solid waste Chart 5.4.1 Solid waste arising
0100200300400500600700800900
1000
A - L
andf
ill
B -
Inci
nera
tion
C - S
RF
D - B
Ppy
roly
sis
E -
Ozm
otec
hF
- Red
oxag
ent
G -
Stad
ler
& Ti
tech
H - S
tadl
er &
Pelle
ncI -
Sta
dler
&Q
inet
iqJ
- Sta
dler
&Si
ms
K - K
ME
&Ti
tech
L - S
tadl
er &
TLT
M -
Sw
iss
Poly
mer
a
N - B
+B
O -
Herb
old
P - F
lottw
eg
kg/to
nne
This metric assesses the portion of landfilled material from the input feedstock (i.e. that fraction that is not recycled or recovered in each scenario), but does not include solid waste arising from other processes along the supply chain. Scenario A (landfill), clearly, has the most adverse performance – with all the input material being landfilled. Scenario B (incineration) and scenario C (SRF) have the best performance as combustion residues from burning plastic are very small compared to the mass of input material. Most of the remaining scenarios result in similar quantities of solid waste arising – between 400 – 500 kg/tonne, depending upon the process. The current UK mix of disposal options for mixed waste plastic – landfill (84%) and incineration (16%) – results in around 838 kg solid waste/tonne. Therefore these results show that all the alternative recycling/recovery scenarios give clear benefits compared to the current situation.

LCA of Management Options for Mixed Waste Plastics 51
5.5 Primary Energy
Chart 5.5.1 Net primary energy requirement
-50000
-40000
-30000
-20000
-10000
0
10000
A - L
andf
ill
B -
Inci
nera
tion
C - S
RF
D - B
Ppy
roly
sis
E -
Ozm
otec
hF
- Red
oxag
ent
G -
Stad
ler
& T
itech
H -
Stad
ler &
Pel
lenc
I - S
tadl
er &
Qin
etiq
J - S
tadl
er &
Sim
sK
- K
ME
&Ti
tech
L - S
tadl
er &
TLT
M -
Sw
iss
Pol
ymer
a
N - B
+B
O -
Herb
old
P - F
lottw
eg
MJ/
tonn
e
Chart 5.5.2 Contribution to primary energy requirement by process stage
-50000
-40000
-30000
-20000
-10000
0
10000
A -
Land
fill
B -
Inci
nera
tion
C -
SR
F
D -
BP
pyr
olys
is
E -
Ozm
otec
hpy
roly
sis
F - R
edox
age
nt
G -
Sta
dler
&Ti
tech
H -
Sta
dler
&P
elle
nc
I - S
tadl
er &
Qin
etiq
J - S
tadl
er &
Sim
s
K -
KM
E &
Tite
ch
L - S
tadl
er &
TLT
M -
Sw
iss
Pol
ymer
a
N -
B+B
O -
Her
bold
P -
Flot
tweg
MJ/
tonn
e
Mechanical Recycling Incineration Landfill Redox Agent Pyrolysis Transport Avoided Impacts
There are large differences between the process energy demands of each scenario, but the overall picture is dominated by the avoided impacts associated with displacing production of virgin plastics, electricity, etc. Scenario A (landfill) has the lowest process energy requirements but as it receives no credits for avoided impacts it has the greatest net energy demand among the scenarios assessed in this study.

LCA of Management Options for Mixed Waste Plastics 52
Scenario B (incineration) receives credit for avoiding power production from natural gas and so has a better performance than landfill. However, the thermal conversion efficiency of incinerators is relatively poor, as is highlighted through comparison with scenario C (SRF to cement kilns) a higher value energy recovery option. SRF substitutes directly for coal and this gives scenario C a very large primary energy credit – consequently, this scenario has clearly the best performance in this impact category. Scenarios D and E, the two pyrolysis options have very similar performance better than landfill and incineration, and also better than the recycling scenarios but still worse than the SRF scenario. Scenario F – the redox agent substitute scenario gives the second best performance in this category. All the recycling scenarios (G – P) are clustered around a fairly small range of values and are broadly comparable to scenario C (incineration). These scenarios all receive credits from avoiding the energy required to process virgin plastic.

LCA of Management Options for Mixed Waste Plastics 53
5.6 Human Toxicity Potential
Chart 5.6.1 Net human toxicity potential
0
200
400
600
800
1000
1200
1400
1600
1800A
- La
ndfil
l
B -
Inci
nera
tion
C -
SRF
D - B
Ppy
roly
sis
E -
Ozm
otec
hF
- Red
oxag
ent
G -
Stad
ler
& T
itech
H -
Stad
ler &
Pel
lenc
I - S
tadl
er &
Qin
etiq
J - S
tadl
er &
Sim
sK
- KM
E &
Tite
chL
- Sta
dler
&TL
TM
- Sw
iss
Pol
ymer
a
N - B
+B
O -
Herb
old
P - F
lottw
eg
kg e
q. d
ichl
orom
etha
ne/to
nne
Chart 5.6.2 Contribution to human toxicity potential by process stage
-500
0
500
1000
1500
2000
A -
Land
fill
B - I
ncin
erat
ion
C - S
RF
D - B
P py
roly
sis
E - O
zmot
ech
pyro
lysi
s
F - R
edox
age
nt
G -
Sta
dler
&Ti
tech
H - S
tadl
er &
Pel
lenc
I - S
tadl
er &
Qin
etiq
J - S
tadl
er &
Sim
s
K - K
ME
& T
itech
L - S
tadl
er &
TLT
M -
Swis
sPo
lym
era
N - B
+B
O -
Herb
old
P -
Flot
tweg
kg e
q. d
ichl
orob
enze
ne/to
nne
Mechanical Recycling Incineration Landfill Redox Agent Pyrolysis Transport Avoided Impacts
Calculating human toxicity potential in LCA is extremely difficult for several reasons:
Different people respond to chemicals in different ways
Cause and effect relationships can be very complicated and poorly understood
Small quantities of some chemicals can be very toxic, but these may be omitted from life cycle
inventories (e.g. if the cut-off point for data collection is based on mass)

LCA of Management Options for Mixed Waste Plastics 54
Impacts will be dependent upon the location of the release and lifetime of the chemical in the
environment
Lack of relevant toxicity data on many chemicals will mean that the impact category will be incomplete
As such, these results can be considered to be a guide to relative human toxicity potential between scenarios but the absolute values should not be relied upon. All the scenarios assessed result in a net adverse impact for the human toxicity potential category. This is due to the large contributions from both landfill and incineration, which easily outweigh any benefits deriving from recycling or reprocessing. As for the EP impact category the majority of the emissions contributing to HTP are due to long-term leaching from landfill (over 60,000 years). Because of this, the results tend to vary according to the quantity of solid waste produced by each scenario (see Section 5.9). However, incineration processes also show large contributions to this impact category because it is assumed that the incineration residues are landfilled and so will eventually also leach into the environment. As such, it can be seen that scenario A (landfill) and scenario’s B and C (incineration and SRF) have the most adverse performance in this impact category. It should be remembered that HTP is a measure of potential toxicity impacts, but that toxic emissions occurring over a period of 60,000 years may well have only minimal actual impact. Vanadium is the key toxic component contributing to this impact category and vanadium compounds are often used to provide smoke redartant properties to plastics. Smaller contributions resulting from release of barium, thalium and selenium are also often seen.

LCA of Management Options for Mixed Waste Plastics 55
5.7 Eutrophication Potential
Chart 5.7.1 Net eutrophication potential
-0.6
-0.4
-0.2
0
0.2
0.4
0.6
0.8
1
1.2A
- Lan
dfill
B -
Inci
nera
tion
C - S
RF
D - B
Ppy
roly
sis
E -
Ozm
otec
hF
- Red
oxag
ent
G -
Stad
ler
& T
itech
H -
Sta
dler
&Pe
llenc
I - S
tadl
er &
Qin
etiq
J - S
tadl
er &
Sim
sK
- K
ME
&Ti
tech
L - S
tadl
er &
TLT
M -
Sw
iss
Pol
ymer
a
N - B
+B
O -
Herb
old
P -
Flot
tweg
kg e
q. p
hosp
hate
/tonn
e
Chart 5.7.2 Contribution to eutrophication potential by process stage
-1.5
-1
-0.5
0
0.5
1
1.5
A - L
andf
ill
B -
Inci
nera
tion
C -
SRF
D -
BP
pyro
lysi
s
E -
Ozm
otec
hpy
roly
sis
F - R
edox
age
nt
G -
Sta
dler
&Ti
tech
H - S
tadl
er &
Pelle
nc
I - S
tadl
er &
Qin
etiq
J - S
tadl
er &
Sim
s
K - K
ME
& Ti
tech
L - S
tadl
er &
TLT
M -
Swis
sPo
lym
era
N -
B+B
O -
Herb
old
P - F
lottw
eg
kg e
q. p
hosp
hate
/tonn
e
Mechanical Recycling Incineration Landfill Redox Agent Pyrolysis Transport Avoided Impacts
In spatial terms eutrophication is largely confined locally to the site of emission. Is primarily caused by waterborne emissions so there does not tend to be the same long range transport that can occur for atmospheric pollutants (although there is some contribution from gasesous emissions that are subsequently washed out in rain or through “dry deposition”). The CML impact assessment approach aggregates all

LCA of Management Options for Mixed Waste Plastics 56
nutrifying emissions regardless of location so the results presented here represent worst-case potential impacts rather then the actual impacts that would occur at a given location. What is most immediately noticeable about the results in this impact category is the very large contribution from landfill operations. This is largely a consequence of the approach taken by Ecoinvent to model the datasets for landfill processes. These take a worst-case position, considering total impacts over very long timescales (60,000 years), during which time it is assumed that the landfill lining would be breached. Nitrogen-containing additives are found in waste plastics and over these very long timescales these are assumed to degrade to result in emissions of ammonia, organically bound nitrogen compounds and other species that will leach into the wider environment and contribute to this impact category (the Ecoinvent data indicate that waste PET has particularly large quantities of nitrogen containing additives and contributes the majority of these emissions). However, considering eutrophication impacts over shorter timescales, e.g. 100 years, it is likely that very little of the landfilled plastic will have degraded and the landfill lining would be expected to remain an effective barrier to leaching. As such, actual eutrophication from landfills over these timescales would be probably be very low. The pros and cons of taking different timescales into account are discussed in detail in the Ecoinvent database documentation 26. A point to note here is that if only short timescale impacts are considered (e.g. over 100 years) then all the scenarios apart from B (incineration) and C (SRF) would show a considerable improvement in their net performance for this impact category. Leaving aside this issue and accepting the Ecoinvent approach, it is clear that scenario A (landfill) has by far the most adverse performance of any scenario considered in this study. The two scenarios with the best performance are C (SRF) and E (Ozmotech pyrolysis) because the substituted products (coal and petrochemical diesel) both lead to large avoided emissions in this category. Again, there is a difference in performance between the NIR-based recycling scenarios (G – K) and the density separation-based recycling scenarios (L – P). In this case, however, the NIR-based scenarios have the better net performance. This is because these scenarios sort most of the PET from the feedstock whereas the density separation-based scenarios focus solely on recovering polyolefins, leaving the other polymers – including PET - to be disposed of to landfill and incineration.

LCA of Management Options for Mixed Waste Plastics 57
5.8 Photochemical Ozone Creation Potential
Chart 5.8.1 Net photochemical ozone creation potential
-1.6
-1.4
-1.2
-1
-0.8
-0.6
-0.4
-0.2
0
0.2
A - L
andf
ill
B -
Inci
nera
tion
C - S
RF
D - B
Ppy
roly
sis
E -
Ozm
otec
hF
- Red
oxag
ent
G -
Stad
ler
& Ti
tech
H - S
tadl
er &
Pelle
ncI -
Sta
dler
&Q
inet
iqJ
- Sta
dler
&S
ims
K - K
ME
&Ti
tech
L - S
tadl
er &
TLT
M -
Swis
sPo
lym
era
N - B
+B
O -
Her
bold
P - F
lottw
eg
kg e
q. e
thyl
ene/
tonn
e
Chart 5.8.2 Contribution to photochemical ozone creation potential by process stage
-1.8
-1.6
-1.4
-1.2
-1
-0.8
-0.6
-0.4
-0.2
0
0.2
A - L
andf
ill
B -
Inci
nera
tion
C - S
RF
D - B
P py
roly
sis
E - O
zmot
ech
pyro
lysi
s
F - R
edox
age
nt
G -
Stad
ler &
Tite
ch
H -
Stad
ler &
Pel
lenc
I - S
tadl
er &
Qin
etiq
J - S
tadl
er &
Sim
s
K -
KME
& T
itech
L - S
tadl
er &
TLT
M -
Swis
sPo
lym
era
N - B
+B
O -
Herb
old
P - F
lottw
eg
kg e
q. e
thyl
ene/
tonn
e
Mechanical Recycling Incineration Landfill Redox Agent Pyrolysis Transport Avoided Impacts
Photochemical ozone creation and the subsequent “photochemical smog” that often results relies on chemical reactions between volatile organic compounds (VOCs) and nitrogen oxides catalysed by ultraviolet light from the sun. As for eutrophication, POCP impacts are largely confined to the locality where the emissions occur. The actual degree of photochemical ozone creation that occurs depends on how all these factors interrelate – the amount of VOCs emitted, the background level of nitrogen oxides and the amount of sunshine received. Because of this complexity the results of this impact category may not necessarily be accurate in absolute terms, but the relative ranking of the scenarios can be considered to be more robust.

LCA of Management Options for Mixed Waste Plastics 58
Overall the results for this impact category are somewhat similar to those for acidification potential, being dominated by credits from avoided emissions of substituted processes and with the recycling scenarios having a better environmental performance than the alternative waste management scenarios. To a large extent this similarity is explained because the same species - sulphur dioxide and nitrogen oxides – are significant contributors to both impact categories. For POCP there are also large contributions from emissions of non-methane VOCs such as produced during virgin plastic production. This provides additional benefits to the plastics recycling scenarios in this category. A noticeable further trend is that the density separation-based recycling scenarios (L – P) have a better environmental performance than the NIR-based recycling scenarios (G – K) in this category. This is mainly due to large avoided emissions of non-methane VOCs from virgin PE production. The density separation scenarios are focused on PE and PP recycling and tend to recycle a larger proportion of PE than the NIR-based scenarios and this leads to greater overall reductions in POCP.

LCA of Management Options for Mixed Waste Plastics 59
5.9 Acidification Potential
Chart 5.9.1 Net acidification potential
-12
-10
-8
-6
-4
-2
0
2A
- Lan
dfill
B -
Inci
nera
tion
C -
SRF
D -
BPpy
roly
sis
E -
Ozm
otec
hF
- Red
oxag
ent
G -
Sta
dler
& Ti
tech
H - S
tadl
er &
Pelle
ncI -
Sta
dler
&Q
inet
iqJ
- Sta
dler
&Si
ms
K - K
ME
&Ti
tech
L - S
tadl
er &
TLT
M -
Swis
sPo
lym
era
N -
B+B
O -
Her
bold
P - F
lottw
eg
kg e
q. s
ulph
ur d
ioxi
de/to
nne
Chart 5.9.2 Contribution to acidification potential by process stage
-12
-10
-8
-6
-4
-2
0
2
A -
Land
fill
B -
Inci
nera
tion
C -
SRF
D -
BP
pyro
lysi
s
E - O
zmot
ech
pyro
lysi
s
F - R
edox
age
nt
G -
Stad
ler &
Tite
ch
H -
Stad
ler &
Pelle
nc
I - S
tadl
er &
Qin
etiq
J - S
tadl
er &
Sim
s
K -
KM
E &
Tite
ch
L - S
tadl
er &
TLT
M -
Swis
sPo
lym
era
N -
B+B
O -
Her
bold
P - F
lott
weg
kg e
q. s
ulph
ur d
ioxi
de/to
nne
Mechanical Recycling Incineration Landfill Redox Agent Pyrolysis Transport Avoided Impacts
Acidification is a environmental problem that can affect quite a large region distant from the point of release of acidifying gases, but is not considered a global issue in the same way as global warming or ozone depletion. As such, acidifying emissions from the UK may affect forests in Norway but will not damage rainforests in the Amazon. Public awareness of acidification (as “acid rain”) grew in Europe during the 1970-80s in response to highly publicised damage occurring to European forests. Subsequent legislation such as the Convention on Long-Range Transboundary Air Pollution and the Sulphur Emissions Reduction Protocol have led to mitigation measures such as requirements for power stations to fit flue-gas desulphurisation

LCA of Management Options for Mixed Waste Plastics 60
technology. These have meant that problems due to acidification are currently well managed in Europe (although problems may still exist elsewhere – particularly in rapidly developing countries such as China). Dealing with acidification in LCA is further complicated as acid damage only occurs after a threshold limit is exceeded – and this limit varies depending on location. The CML impact assessment approach aggregates all nutrifying emissions regardless of location so the results presented here represent worst-case potential impacts rather then the actual impacts that would occur at a given location. It is immediately apparent that there are large differences between the recycling scenarios and the alternative waste management options in this impact category. This is primarily because, although there this some variation in the process impacts, the results in this impact category are dominated by credits received from avoided emissions from substituted processes – to a similar extent as seen in the primary energy profiles. Because virgin plastic production results in larger emissions of acidifying gases than the other substituted processes the credits received in the recycling scenarios are also greater. Scenarios A (landfill) and B (incineration) have the worst performance with net positive acidifying emissions. Scenarios D, E and F result in small net negative emissions. Scenario C (SRF) has an intermediate performance that is better than other alternative waste management scenarios but falls behind the recycling scenarios. The most important contributors to the AP impact category are emissions of nitrogen oxides and sulphur dioxide, with smaller contributions from other species such as ammonia, hydrogen sulphide and hydrogen chloride. The category is dominated by the avoided emissions resulting from substituted processes. This is particularly true for the plastics recycling scenarios and explains why they outperform the alternative waste management options.

LCA of Management Options for Mixed Waste Plastics 61
5.10 Abiotic depletion potential
Chart 5.10.1 Net abiotic depletion potential
-25
-20
-15
-10
-5
0
5A
- Lan
dfill
B -
Inci
nera
tion
C - S
RF
D - B
Ppy
roly
sis
E -
Ozm
otec
hF
- Red
oxag
ent
G -
Stad
ler
& Ti
tech
H - S
tadl
er &
Pelle
ncI -
Sta
dler
&Q
inet
iqJ
- Sta
dler
&Si
ms
K - K
ME
&Ti
tech
L - S
tadl
er &
TLT
M -
Sw
iss
Poly
mer
a
N - B
+B
O -
Herb
old
P - F
lottw
eg
kg e
q. a
ntim
ony/
tonn
e
Chart 5.10.2 Contribution to abiotic depletion potential by process stage
-25
-20
-15
-10
-5
0
5
A -
Land
fill
B - I
ncin
erat
ion
C - S
RF
D - B
P py
roly
sis
E - O
zmot
ech
pyro
lysi
s
F - R
edox
age
nt
G -
Stad
ler
&Ti
tech
H - S
tadl
er &
Pel
lenc
I - S
tadl
er &
Qin
etiq
J - S
tadl
er &
Sim
s
K - K
ME
& T
itech
L - S
tadl
er &
TLT
M -
Swis
sPo
lym
era
N - B
+B
O -
Her
bold
P -
Flot
tweg
kg e
q. a
ntim
ony/
tonn
e
Mechanical Recycling Incineration Landfill Redox Agent Pyrolysis Transport Avoided Impacts
Abiotic depletion – the consumption of non-renewable resources – is a global issue (globalisation means that resources can easily be shipped around the world according to demand). As with several other impact categories considered in this assessment, the results for ADP are dominated by credits received through avoiding emissions from substituted processes associated with each scenario.

LCA of Management Options for Mixed Waste Plastics 62
The main contributors to this impact category are consumption of fossil fuels (hence the close similarities with the results for primary energy consumption) and as such, the total quantity of plastic recycled explains the variations between the recycling scenarios (G – M). Scenario C (SRF to cement kilns) receives a large credit by avoiding the use of coal. The lesser credits assigned to scenario B (incineration) and scenarios D and E (pyrolysis) are due to the lower efficiency of these processes. Incineration has relatively low thermal conversion efficiency and the pyrolysis options require a significant proportion of their output to be fed back to the reactor fuel the process.

LCA of Management Options for Mixed Waste Plastics 63
5.11 Ozone Layer Depletion Potential
Chart 5.11.1 Net ozone layer depletion potential
-0.00016
-0.00014
-0.00012
-0.0001
-0.00008
-0.00006
-0.00004
-0.00002
0
0.00002A
- Lan
dfill
B -
Inci
nera
tion
C - S
RF
D - B
Ppy
roly
sis
E -
Ozm
otec
hF
- Red
oxag
ent
G -
Stad
ler
& T
itech
H - S
tadl
er &
Pelle
ncI -
Sta
dler
&Q
inet
iqJ
- Sta
dler
&S
ims
K - K
ME
&Ti
tech
L - S
tadl
er &
TLT
M -
Swis
sPo
lym
era
N - B
+B
O -
Herb
old
P - F
lottw
eg
kg e
q. R
11/to
nne
Chart 5.11.2 Contribution to ozone layer depletion potential by process stage
-0.00016
-0.00014
-0.00012
-0.0001
-0.00008
-0.00006
-0.00004
-0.00002
0
0.00002
A - L
andf
ill
B -
Inci
nera
tion
C - S
RF
D - B
P p
yrol
ysis
E - O
zmot
ech
pyro
lysi
s
F - R
edox
age
nt
G -
Sta
dler
&Ti
tech
H - S
tadl
er &
Pelle
nc
I - S
tadl
er &
Qin
etiq
J - S
tadl
er &
Sim
s
K -
KME
& Ti
tech
L - S
tadl
er &
TLT
M -
Swis
sPo
lym
era
N - B
+B
O -
Herb
old
P - F
lottw
eg
kg e
q. R
11/to
nne
Mechanical Recycling Incineration Landfill Redox Agent Pyrolysis Transport Avoided Impacts
Ozone layer depletion is a global environmental issue in the same manner as global warming. Due to extremely long lifetimes in the atmosphere, an emission of CFC (or other ozone depleting chemicals) anywhere in the world will contribute to ozone depletion globally.

LCA of Management Options for Mixed Waste Plastics 64
In relative terms there is significant variation in performance among the various scenarios for this impact category. Scenarios B (incineration), D (BP pyrolysis) and E (Oxmotech pyrolysis) stand out as having much greater net negative contributions than the other scenarios. The main contributors to this impact category are emissions from energy production processes – in particular of Halon 1211 (bromochlorodifluoromethane) from production of natural gas and Halon 1301 (bromotrifluoromethane) from production of diesel and naphtha. These explain the large avoided impacts seen in these scenarios. However, it is important when discussing the ODLP impact category to note that none of the options assessed has a significant contribution, either positive or negative, in absolute terms. It may be concluded that this impact category is not an issue of concern for any of the scenarios assessed in this study as production and emissions of ozone depleting chemicals are restricted through existing legislation such as the Montreal Protocol.

LCA of Management Options for Mixed Waste Plastics 65
6.0 Sensitivity analyses The results of sensitivity analyses relating to variations in feedstock composition are presented with the main results for each scenario in Section 4, above, but are discussed in more detail here. Further sensitivity analyses are presented here looking at:
Incinerator efficiency
The basis for substitution of plastic recyclate
Using UK grid electricity production as the substituted power source for electricity generated from
municipal incinerators
In each case the effect of the sensitivity analysis on the global warming potential impact category is shown, as this is the priority issue for WRAP. A selection of representative scenarios for various technologies is included in each comparison (where scenarios are very similar e.g. there are several scenarios modelling NIR sorting technology only one has been included in these comparisons. This choice should not be considered to favour one technology over another but is solely to aid clarity in interpreting the sensitivity analyses by reducing the options to a manageable number). The scenarios modelled are as follows:
Scenario A – Landfill
Scenario B – Incineration with energy recovery
Scenario C – SRF used in cement kilns
Scenario E – Pyrolysis (plastic to diesel)
Scenario G – Mechanical recycling based on NIR sorting technology
Scenario L – Mechanical recycling based on density separation technology
6.1 Feedstock composition
Figure 6.1 Sensitivity of feedstock composition on GWP
-1000
-500
0
500
1000
1500
2000
(low
PO
)
A -
Land
fill (
defa
ult)
(hig
h PO
)
(low
PO
)
B -
Inci
nera
tion
(def
ault)
(hig
h PO
)
(low
PO
)
C -
SRF
(def
ault)
(hig
h PO
)
(low
PO
)
- Ozm
otec
h py
roly
sis
(def
ault)
(hig
h PO
)
(low
PO
)
G -
Stad
ler &
Tite
ch (d
efau
lt)
(hig
h PO
)
(low
PO
)
L - S
tadl
er &
TLT
(def
ault)
(hig
h PO
)
kg e
q. c
arbo
n di
oxid
e/to
nne

LCA of Management Options for Mixed Waste Plastics 66
Composition of the input material to the recycling/reprocessing routes can vary considerably as discussed in Section 3.6.2. Analysis has been carried out to examine the sensitivity of the results to different input materials by considering a low polyolefin mix and a high polyolefin mix as well as the default mix. The compositions of these different input feedstocks are provided in Table 3.6.2. Results for the full range of impact categories are provided with the scenario descriptions in Section 4. It should be noted that the three scenarios for feedstock composition do not represent “extremes” but are all quite likely to occur given the variation from the MRF. Figure 6.1 shows the effects of varying feedstock composition on the global warming potential impact category. In general it can be seen that although variation in the polyolefin content of the feedstock does affect the GWP results, this is not usually to an extent where the relative rankings of the scenarios change. The exception is scenario E (plastic-to-diesel pyrolysis) where the trend is for greater adverse impacts as polyolefin content increases – to the extent that for the high polyolefin composition there is a net increase in GWP. High polyolefin content means more material from the waste stream is sent to pyrolysis rather than recycling so these results indicate that the pyrolysis option is generally less favourable than mechanical recycling in terms of GWP. 6.2 Incinerator efficiency The efficiency with which the incinerator converts energy in the mixed plastic waste into electricity is an important factor affecting the results of this study as it determines to what degree the impacts of the incineration process are offset by avoided the need to produce electricity from primary fuels. Published studies give a wide range of values for the efficiency of power generation from municipal waste incinerators. This variation arises due to a number of factors including:
Type and nature of the waste feedstock
Output options – potential to use electricity, water, steam produced
Technology applied
Whether internal energy consumption of the process is accounted for
Whether gross calorific values (GCV) or net calorific values (NCV) are used in the calculations (in some
reports it is not clear which is used).
Examples of values quoted in recent studies are given below:
A 2006 study by the USEPA 38 gives an efficiency of 17.8% for electricity generated from mass burn
incineration (not clear whether these figures are based on NCV or GCV).
A 2001 report for the European Commission 39 indicates that efficiencies for power generation range
from 15–22% in thermal treatment plants based on NCV.
The 2006 BAT standard for incineration 40 quotes efficiencies ranging from 15-30% for thermal plants
producing electricity only (not clear whether these figures are based on NCV or GCV).
A 2003 Biffaward study carried out by C-Tech Innovation 41 reports a figure of 25.4% based on NCV.
Fichtner, in a 2004 report 42 for ESTET, state that “For a modern plant based combustion technology,
the net electrical efficiency is in the range 19 to 27%” based on NCV.
A 2003 good-practice guide produced by CIWM 43 reports efficiency of generation of 22%-25% (not
clear whether these figures are based on NCV or GCV).
Given this wide range, two different conversion efficiency scenarios have been considered for incineration with energy recovery:
A baseline scenario with a conversion efficiency (NCV) of 23%, which is midway between the extremes
reported in the literature and thus expected to be typical for modern incinerators

LCA of Management Options for Mixed Waste Plastics 67
A high efficiency scenario with a conversion efficiency (NCV) of 30%, at the top end of the efficiencies
reported in the literature
Benefits from producing heat from waste - as hot water or steam - as well as power has not been included in this assessment as heat energy is not typically recovered by UK incinerators. The impact assessment results are given in Table 6.2 and the effects of differing incinerator efficiencies on the GWP impact category are shown in Figure 6.2.
Table 6.2 Scenario B impact assessment results showing the effect of different thermal conversion efficiencies (based on net calorific values and using default feedstock)
Impact Category Unit 23% Efficiency 30% Efficiency Energy MJ -12083 -16363 ADP kg eq. Sb -5.485 -7.335 AP kg eq. SO2 0.055 -0.154 EP kg eq. PO4
+ 0.045 0.019 HTP kg eq. DCB 1350.05 1347.66 OLDP kg eq. R11 -8.7E-05 -1.2E-04 POCP kg eq. C2H4 -0.060 -0.104 GWP kg eq. CO2 1829 1592 Solid Waste kg 49 49
Figure 6.2 Sensitivity of municipal incinerator thermal conversion efficiency on GWP
-1000
-500
0
500
1000
1500
2000
A -
Land
fill
B -
Inci
nera
tion
[23%
]
B -
Inci
nera
tion
[30%
]
C -
SRF
E - O
zmot
ech
pyro
lysi
s
G -
Stad
ler &
Tite
ch
L - S
tadl
er &
TLT
kg e
q. c
arbo
n di
oxid
e/to
nne
The results show that although the efficiency of the municipal incinerator does have a considerable impact on the absolute GWP from incineration it is not sufficient to alter its ranking relative to the other scenarios. Variation in this factor is not expected to significantly affect the conclusions of this study.

LCA of Management Options for Mixed Waste Plastics 68
6.3 Substituted power from municipal incineration The results presented in Section 4 assume that power generation from combustion of wastes at a municipal incinerator substitutes for that generated by a combined-cycle gas power plant (in line with UK Government recommendatios for this type of analysis). However there are numerous other potential sources of power generation (nuclear, coal, oil, wind, hydro, etc.) that power produced at municipal incinerators could substitute for. It is clearly impractical to assess all of these options in this study and there are large uncertainties in how the UK power supply market will develop due to unresolved issues relating to climate change, energy security, planning restrictions and development of new technologies. In this sensitivity analysis only two alternative scenarios are considered. The first option assumes that power generated in municipal incinerator facilities substitutes for power from the UK grid (i.e. from the range of UK power suppliers including gas, oil, coal, nuclear, hydro, wind, etc.). Data on the UK electricity mix were taken from the Ecoinvent database based on the supply situation in 2004, which is as follows:
Coal – 32.6%
Oil – 1.1 %
Natural gas – 39.9%
Industrial gas – 1.0%
Hydropower – 2.0%
Nuclear – 19.1%
Wind – 0.5%
Biomass – 1.0%
Import from France – 2.5%
The second option considers that power generated at municipal incinerators substitutes for that supplied by coal-fired power stations. The impact assessment results are given in Tables 6.3.1 and 6.3.2 and the effects of these alternatives on the GWP impact category are shown in Figure 6.3. These results show that for global warming potential the study is not particularly sensitive to a switch of substitution from gas to UK average grid mix. Considering the make up of the UK electricity mix this is perhaps not surprising as fuels such as coal that emit higher levels of carbon dioxide than natural gas are largely offset by power production from nuclear sources which have near zero emissions of greenhouse gases. For scenario B (incineration) larger improvements can be seen in other impact categories such as primary energy, acidification potential and eutrophication potential, but these are still not sufficient for it to change the overall ranking compared to the recycling technologies. As a further comparison results are also presented for the scenario where power generation substitutes for electricity produced from a coal-fired power plant, as shown in Table 6.3.2. Burning coal results in greater emissions of carbon dioxide (contributing to global warming) and of SOx and NOx gases (leading to higher acidification) than burning natural gas and this leads to some significant differences between these scenarios. As a consequence, substituting for power from coal leads to improvements in environmental performance and this is particularly noticeable for scenario B (incineration) as is illustrated in Figure 6.3.

LCA of Management Options for Mixed Waste Plastics 69
Table 6.3.1 Impact assessment results for when power production from municipal incineration substitutes for average production from the UK grid
Impact Category
Unit
Scen
ario
B
(Inc
iner
atio
n)
Scen
ario
C
(SR
F)
Scen
ario
E
(Ozm
otec
h P
yrol
ysis
)
Scen
ario
G
(Sta
dler
&
Tite
ch)
Scen
ario
L
(Sta
dler
& T
LT)
Energy MJ -21144 -47312 -19748 -23561 -10489 ADP kg eq. Sb -6.878 -20.824 -10.277 -14.776 -13.848 AP kg eq. SO2 -2.882 -4.330 -2.820 -8.106 -8.510 EP kg eq. PO4
+ -0.177 -0.322 -0.377 -0.298 0.134 HTP kg eq. DCB 1256.86 1094.70 569.83 600.85 644.45 OLDP kg eq. R11 -1.5E-05 -8.8E-07 -1.3E-04 -4.8E-06 5.3E-06 POCP kg eq. C2H4 -0.154 -0.342 -0.399 -0.863 -1.299 GWP kg eq. CO2 1573 -300 -82 -640 -485 Solid Waste kg 49 52 501 429 488
Table 6.3.2 Impact assessment results for when power production from municipal incineration substitutes for production from a coal-fired power plant
Impact Category
Unit
Scen
ario
B
(Inc
iner
atio
n)
Scen
ario
C
(SR
F)
Scen
ario
E
(Ozm
otec
h P
yrol
ysis
)
Scen
ario
G
(Sta
dler
&
Tite
ch)
Scen
ario
L
(Sta
dler
& T
LT)
Energy MJ -29900 -47323 -20472 -24248 -11484 ADP kg eq. Sb -13.877 -20.834 -10.856 -15.326 -14.545 AP kg eq. SO2 -8.364 -4.337 -3.273 -8.536 -9.017 EP kg eq. PO4
+ -0.472 -0.322 -0.401 -0.321 0.105 HTP kg eq. DCB 1118.90 1094.51 558.42 590.02 631.51 OLDP kg eq. R11 -2.1E-06 -8.6E-07 -1.3E-04 -3.8E-06 5.9E-06 POCP kg eq. C2H4 -0.445 -0.342 -0.423 -0.886 -1.326 GWP kg eq. CO2 646 -301 -159 -712 -578 Solid Waste kg 49 52 501 429 260

LCA of Management Options for Mixed Waste Plastics 70
Figure 6.3 Sensitivity of substitution options for power generation from municipal incinerators on global warming potential
-1000
-500
0
500
1000
1500
2000
A: L
andf
ill
(gas
)
B: I
ncin
erat
ion
(coa
l)
(UK
grid
)
(gas
)
C: S
RF
(coa
l)
(UK
grid
)
(gas
)
E: O
zmot
ech
pyro
lysi
s (c
oal)
(UK
grid
)
(gas
)
G: S
tadl
er &
Tite
ch (c
oal)
(UK
grid
)
(gas
)
L: S
tadl
er &
TLT
(coa
l)
(UK
grid
)kg e
q. c
arbo
n di
oxid
e/to
nne
6.4 Substituted material from recycling plastic The default assumption in this study is that recycled plastic obtained from the recycling processes is of high quality and substitutes directly for virgin plastic on a 1:1 basis. This sensitivity analysis considers the effect on the results if the quality of the recyclate is not consistent and that only 20% of the recyclate replaces virgin plastic, the remainder is assumed to go into lower value applications that substitute for wood (40%) and concrete (40%). The impact assessment results are given in Table 6.3 and the effects of this change on the global warming potential impact category are shown in Figure 6.3.1. Table 6.4 Impact assessment results for when recycled plastic substitutes for 20% virgin plastic, 40% concrete and 40% wood
Impact Category Unit Scenario C (SRF)
Scenario E (Diesel Pyrolysis)
Scenario G (Stadler & Titech)
Scenario L (Stadler & TLT)
Energy MJ -43714 -14901 -7363 -1457 ADP kg eq. Sb -19.617 -6.797 -2.547 -2.496 AP kg eq. SO2 -3.640 -1.177 -1.177 -1.287 EP kg eq. PO4
+ -0.259 -0.059 0.363 0.601 HTP kg eq. DCB 1104.49 638.04 680.99 672.37 OLDP kg eq. R11 -1.2E-06 -1.3E-04 -3.5E-06 -1.7E-06 POCP kg eq. C2H4 -0.275 -0.221 -0.147 -0.234 GWP kg eq. CO2 -163 278 439 415 Solid Waste kg 52 501 429 488

LCA of Management Options for Mixed Waste Plastics 71
Figure 6.4.1 Sensitivity of substitution options for recycled plastic on global warming potential (100% displaced virgin plastic vs. 20% displaced virgin plastic, 40% concrete, 40% wood)
-1000
-500
0
500
1000
1500
2000
A -
Land
fill
B -
Inci
nera
tion
C - S
RF
[100
%]
[40%
:40%
:20%
]
E - O
zmot
ech
pyro
lysi
s[4
0%:4
0%:2
0%]
G -
Stad
ler &
Tite
ch [1
00%
][4
0%:4
0%:2
0%]
L -S
tadl
er &
TLT
[100
%]
[40%
:40%
:20%
]
kg e
q. c
arbo
n di
oxid
e/to
nne
The effect on the results of changing the basis of substitution of recycled plastic from 100% virgin to a mix of virgin, concrete and wood is dramatic. This can be seen for the global warming potential impact category where the recycling processes switch from causing a net reduction in global warming to contributing to a net increase as emissions from the displaced materials fail to offset the impacts of the recycling processes. Figure 6.4.2 shows the cross-over point for scenarios C (SRF to cement kilns) and G (Stadler & Titech) as the degree of virgin plastic displaced by recycled plastic is reduced from 100% to 0% (the remainder being evenly split between substituting for concrete and wood). These two scenarios have been selected as scenario G represents a typical recycling option while scenario C represents the best performing alternative technology. It should be noted that the results would change if different scenarios were compared. For global warming potential, scenario C becomes favoured over scenario G once the degree of virgin plastic substitution drops below about 70%. A cross-over in the preferred scenario also occurs for acidification potential (once the degree of virgin plastic substitution drops to below about 55%) and photochemical ozone creation potential impact categories (once the degree of virgin plastic substitution drops to below about 45%). Scenario G also shows large negative changes all in other impact categories other than human toxicity potential (which is more or less unchanged). Due to the inherent uncertainties in LCA the “absolute” values presented here should be treated with some caution and there is likely to be considerable variation around the 70% figure due to the specific assumptions and datasets in this study. Nevertheless, despite this uncertainty the general principle holds that the quality of the recyclates is a very important aspect affecting the environmental performance of the recycling scenarios and that the best environmental performance is achieved when high quality recyclate is generated. If only lower quality recyclates are obtained then alternative disposal options may offer a better environmental solution.

LCA of Management Options for Mixed Waste Plastics 72
Figure 6.4.2 Sensitivity of substitution options for recycled plastic on global warming potential (comparison of scenarios C and G for varying degrees of substitution). Bands placed around each line to emphasise uncertainties in the data although these have not been quantified
-800
-600
-400
-200
0
200
400
600
800
100% 80% 60% 40% 20% 0%
Degree of virgin plastic substitution
kg e
q. c
arbo
n di
oxid
e/to
nne
Scenario C (SRF) Scenario G (Stadler & Titech)
This clearly is a critical issue for understanding the environmental performance of the recycling technologies – if a large proportion of the input material cannot be recycled to sufficient purity to replace virgin plastic then the contribution to total global warming potential of the recycling process is likely to become greater than that of alternative reprocessing/disposal options. These results have clear implications for the development of plastics recycling processes in the UK and shows that no single scenario is likely to provide a complete solution. Rather, waste plastics recycling plants should be designed to produce high quality recycled material. Lower quality recycled applications should not be considered – instead it is likely to be preferable for lower quality fractions to be sent for alternative reprocessing options such as SRF or use as a redox agent in blast furnaces. It should be emphasised that the goal of this project is not to specify a particular technology as superior to others but to understand the trade-offs that arise depending on the circumstances. Understanding these issues better is an area that would benefit from further work. 6.5 Effects of combining uncertainties Figure 6.5 shows the results of combining uncertainties associated with incinerator efficiency and for substitution options for plastic recyclate and incinerator power generation as discussed in Sections 6.2 – 6.4 above. The effects of the different feedstock scenarios (high and low polyolefin content) have not been included in this assessment as they do not represent extremes but simply different material compositions (all of which are fairly likely and could represent typical output from the MRF). Given the number of components in the feedstock it is difficult to decide which “extreme” scenario (e.g. 100% PET output from the MRF) should be used and would end up modelling scenarios that are extremely unlikely to ever occur in practise.

LCA of Management Options for Mixed Waste Plastics 73
Figure 6.5 Range of results for global warming potential when combining uncertainties associated with incinerator efficiency and for substitution options for power generation and recycling plastic (light orange = lowest impact; dark orange = highest impact).
-1000
-500
0
500
1000
1500
2000
A la
ndfil
l
B: I
ncin
erat
ion
(low
)
B: I
ncin
erat
ion
(hig
h)
C: S
RF
(low
)
C: S
RF
(hig
h)
E: O
zmot
ech
pyro
lysi
s(lo
w)
E: O
zmot
ech
pyro
lysi
s(h
igh)
G: S
tadl
er &
Tite
ch(lo
w)
G: S
tadl
er &
Tite
ch(h
igh)
L: S
tadl
er &
TLT
(low
)
L: S
tadl
er &
TLT
(hig
h)
kg e
q. c
arbo
n di
oxid
e/to
nne
The majority of the variation for scenarios E, G and L is due to substitution options for plastic recycling (ranging from 100% virgin plastic substitution through to 20% virgin plastic: 40% wood: 40% concrete). While for scenario B the key factor relates to substitution options for power generation at municipal incinerators (natural gas power vs. coal power). Scenario C (SRF) is largely insensitive to the aspects being considered in this assessment. The results show that there are possible scenarios where incineration becomes preferable to recycling – when incineration substitutes for coal power and recycling does not produce high quality plastic recyclate. However if it can be ensured that recycled plastic is of high quality then the recycling scenarios always have superior environmental performance to incineration regarding global warming potential.
The low impact (best case) is for 30% incineration efficiency substituting for coal and 100% virgin plastic substitution. The high impact (worse case) is for 23% incineration efficiency substituting for gas and with 40% wood, 40% concrete and 20% virgin plastic substitution.

LCA of Management Options for Mixed Waste Plastics 74
7.0 Summary & conclusions This life cycle assessment relates only to waste management options for mixed plastics. An assessment of the potential effect of managing mixed plastics as part of a mixed municipal waste stream was outside of the scope of this study. The results only refer to the specific case where mixed plastic waste is sourced as output from a MRF and collection processes for the mixed waste plastic are not included within the study boundaries. For most of the impact categories studied, landfill is less favourable than incineration of mixed plastics. However for global warming potential this study has found that incineration (with or without energy recovery) is the least favourable waste management option of those studied for domestic mixed plastics. On the basis of these results we can conclude that it is environmentally beneficial to remove mixed plastic from the waste stream prior to either landfilling or incineration. The diverted mixed plastics stream should be managed through a combination of mechanical recycling and SRF type processes. Overall, the results of this LCA indicate that recycling scenarios are generally the environmentally preferable options for all impact categories considered in this study and with the assumptions made. However if one attempts to prioritise these impact categories and give more weight to the particular issues driving WRAP – global warming potential and solid waste – the results become more nuanced. The recycling options are favoured when considering global warming, but the Energy from Waste options (incineration and SRF) produce the least amount of solid waste. This disparity is emphasised further by the high sensitivity of the results to the quality of the recycled plastic produced. The environmental performance of the recycling scenarios rapidly deteriorates as quality declines. Once the proportion of high quality recyclate (that can substitute directly for virgin plastic) falls below a certain level it is likely that alternative waste management technologies will become the more favourable option. This assessment estimates the crossover point for global warming potential to occur once recycled plastic can only substitute for about 70% virgin plastic or less, but there is a large degree of uncertainty around this exact figure and the results differ for different impact categories. The best environmental option will be to focus on developing facilities capable of delivering high quality recycled plastics that can substitute for virgin plastics. Where this quality cannot be achieved the material should be sent for use in alternative processing options such as SRF or for use as a redox agent in blast furnaces. Another notable outcome of this assessment is that there is generally little to choose between the two main classes of recycling technologies – NIR sorting and density separation. NIR technologies can sort a wider variety of plastics, but density separation processes, while less flexible, tend to recover a higher proportion of their selected plastics from the waste stream. Which technology is actually preferable from an environmental point of view may come down to whether markets can be found for the products from these recycling processes (this study assumes that such markets exist in all cases). Further discussion on the relative merits of the NIR sorting vs. density separation can be found in the main report, which includes assessment of the economic aspects of the various technologies. The results relating to solid waste arisings are also interesting because they show that, for the individual recycling scenarios modelled, it is not possible to divert more than 60% of the material stream away from landfill. The same is true for the alternative reprocessing technologies, the exceptions being incineration and SRF to cement kilns (although the capacity of this latter option is limited in the UK). However it should be noted that by combining recycling technologies to give a full process a higher proportion can be recycled. This can be seen in the results for Process Design B (described in the main report) where a 67% recycling rate is achieved. This happens for several reasons, a key one being the prevalence of landfill as the “default” disposal option for wastes that are difficult to recycle. For plastics-rich waste streams an increase in the use of incineration

LCA of Management Options for Mixed Waste Plastics 75
would help to reduce the quantities going to landfill. However a better approach would be to consider how to increase the amounts of recyclable wastes in the material stream. Understanding the strengths and weaknesses of the different recycling technologies can to lead to the development of more sustainably designed plastic products. For example, NIR-sorting technologies have difficulty sorting black plastics and can also get confused when packaging and their labels are made from different plastics (the sensor may “see” the label and so miss-sort the pack – a particular problem for shrink wrap labels that cover the whole bottle). Fairly simple design changes can overcome these problems. For density separation technologies the main problems occur when the density ranges of different polymers overlap resulting in some inevitable mixing of polymer types in the overlapping region. This diversity in range is largely due to the use of additives and fillers to modify the properties of the polymers. 7.1 Landfill Landfill is currently the most common option for managing mixed waste plastic in the UK. In terms of process impacts it performs well compared to other options as energy inputs associated with managing a landfill are low. However, the landfill option does not benefit from avoiding the requirement for other processes. This means that overall it is usually less favoured than other management options. Landfill gas is assumed to be burnt but without energy recovery – combustible gaseous emissions from plastic waste would be very low in any case. 7.2 Incineration Incineration is another currently available option for managing mixed plastic waste. As energy is recovered from this process (albeit with relatively low efficiency) it generally has better environmental performance than landfill. When considering WRAP’s priority issues of global warming potential and solid waste, the incineration option has contrasting outcomes. It has the most adverse global warming impact of any scenario considered, but, in contrast, it also results in the lowest solid waste. It should be noted that this report only considers a particular high plastic content waste stream and does not make any general statements about the relative merits of using incineration as waste management option for other waste streams. 7.3 SRF to cement kilns Municipal incinerators are not a very efficient way of recovering energy from mixed plastic waste. A higher value energy recovery option is to convert the waste plastic to SRF and use this in a dedicated SRF power plant or as a fuel for cement kilns. The cement kiln option has been modelled in this assessment and generally has a much improved environmental performance compared to municipal incineration. For impact categories including primary energy consumption, ozone layer depletion potential, abiotic resource depletion potential and solid waste it also outperforms many of the recycling scenarios considered in this study. 7.4 Pyrolysis Pyrolysis covers a wide variety of different processes. Because of this, and due to the relatively poor data available on pyrolysis processes in the literature, this study does not claim to draw general conclusions about this whole class of processes. However, the two pyrolysis scenarios that were assessed in this study had broadly similar environmental performance in most impact categories and generally performed better than landfill and incineration but worse than the recycling options.
LCA of Management Options for Mixed Waste Plastics 76
7.5 Redox agent The use of the polyolefin fraction of the mixed waste to substitute for other reducing agents in blast furnaces is not current practise in the UK but regularly occurs elsewhere in Europe and Japan. The results show that this option is often quite favourable and compares well against the recycling options. Depending on the exact quality requirements for this process, it could be a useful route for disposing of lower quality polyolefin fractions not suitable for substituting for virgin polymers. 7.6 Near infra-red sorting It is difficult to directly compare the different NIR processes due to variations in results during trials (e.g. data on the Titech sorter was collected using a lower operating speed than for the Pellenc process which will affect the relative performance of these machines). There are some fairly large differences in equipment design and power requirements but the environmental performance is usually dominated by the recycling efficiency (the quantity of plastic in the feedstock that is correctly identified and sorted) and this is broadly similar in all cases. As such, the NIR technologies all have broadly similar environmental performances and compare well against alternative waste management options. 7.7 Density separation Various density separation processes have been included in this study ranging from simple tanks of water, through to more sophisticated tanks (such as used by TLT) and onto processes including hydrocyclones and sorticanters. The strength of sorting processes based on density separation is that they can often achieve a higher sorting efficiency (i.e. remove more of a target material from the waste stream) than NIR sorting. However they also tend to be a less flexible option and sometimes have high energy requirements. The scenarios modelled in this assessment only separated the polyolefin fraction from the feedstock and assumed that markets exist for the resulting mixed flake material. If this assumption is accepted, the results of this study indicate that the density separation technologies usually have similar performance to the NIR sorters for the waste streams considered in this assessment. 7.8 Film/rigid separation In the scenarios modelled in this study the Stadler equipment has better environmental performance than the KME equipment. This difference is primarily due to the different design objectives of each process. The Stadler ballistic separator is designed to separate out films from rigid objects, whereas the KME process is primarily designed to separate 2-dimensional objects from 3-dimensional objects. The feedstock used in the trials included a reasonable number of rigid plastic objects, such as crushed food trays, that the KME equipment identified – correctly – as 2-dimensional and removed with the film fraction, meaning that less rigid material was available for mechanical recycling. So for this feedstock the Stadler equipment gave the best environmental performance. 8.0 Further considerations No account is taken here of possible future changes in waste arisings (aside from noting in general terms the likely short-term trends in use of polymer types and consumption in Section 3.10), UK energy markets, technological advances and so on. To do so would require the development of a series of future scenarios subject to their own uncertainties. Purely in the interests of transparency, therefore, the analysis is based around current conditions. However, it is still informative to consider how things may change in the future, as it reflects on the long-term robustness of the results. To illustrate:
Waste arisings: o The amount of plastic entering the waste stream will change o The variety of plastics in the waste stream may reduce in response to the desire for
recyclability

LCA of Management Options for Mixed Waste Plastics 77
o Sorting speed and efficiency of technologies is likely to improve as they are utilised more
widely o The costs of these technologies will fall, again as experience with them increases
Energy technologies: o The marginal technology for power generation (currently gas-fired CCGT) may change,
possibly to less carbon intensive fuel cycles such as nuclear or renewables o The efficiency of generation may improve o In the medium to long term the fossil fuel cycles as developed in the UK may adopt
carbon capture and storage, significantly reducing their greenhouse gas burdens Incineration:
o There may be an increase in the efficiency of incineration processes, particularly if the
utilisation of waste heat becomes more widespread o The demand for plastic materials in incinerator feedstock may change in response to
changes in the residual waste stream due to higher levels of recycling Availability of alternative processes for handling plastic wastes:
o Cement kilns and blast furnaces may not have the capacity to take a significant fraction of
plastic waste. WRAP could consider undertaking further work to assess which wastes are
best disposed of through cement kilns and blast furnaces Environmental technologies:
o Revision of the Large Combustion Plant and IPPC Directives may cause a reduction in
emissions from various of the technologies considered in this report
More issues could be added, but the length of the list demonstrates that it is not possible to develop a clear idea of changes into the future. It is therefore recommended that WRAP keep the conclusions of this study (and others like it) under review as the waste management and other relevant sectors develop in the years to come.

LCA of Management Options for Mixed Waste Plastics 78
9.0 References 1 BS EN ISO 14040: 2006 Incorporating corrigendum No.1. Environmental management – Life cycle assessment – Principles and framework 2 BS EN ISO 14044: 2006 Incorporating corrigendum No.1. Environmental management – Life cycle assessment – Requirements and guidance 3 Heyde, M. & Kremer, M. (1999) Recycling and Recovery of Plastics from Packagings in Domestic Waste: LCA-type Analysis of Different Strategies, Fraunhofer Institut Verfahrenstechnik und Verpackung 4 Jenseit, W., Stahl, H., Wollny, V., Wittlinger, R. (2003) Recovery Options for Plastic Parts from End of Life Vehicles: an Eco-efficiency Assessment, Oko-Institut e.V. 5 Wollny, V., Dehoust, G., Fritsche, U., Weinem, P. (2001) Comparison of Plastic Packaging Waste Management Options – Feedstock Recycling versus Energy Recovery in Germany, Journal of Industrial Ecology 5(3) 6 Baitz, M., et al. (2004) Life Cycle Assessment of PVC and of principal competing materials, Commissioned by the European Commission 7 Tukker, A. (2002) Plastics Waste - Feedstock Recycling, Chemical Recycling and Incineration, TNO - Rapra Review Report 148, 13(4) 8 Craighill, A., Powell, J. (1996) Life cycle assessment and economic evaluation of recycling: a case study, Resources, Conservation and Recycling Vol 17 9 Kreissig, J. et al., (2003) PVC Recovery Options - Environmental and Economic System Analysis, PE Europe GmbH 10 Finnveden, G., Johansson, J., Lind, P. and Moberg, A. (2000) Life Cycle Assessments of Energy from Solid Waste, Miljostrategiska Studier, FMS 137 11 Lee, P. et al., (2005) The Quantification of Potential Energy from Residuals (EfR) in the UK, Oakdene Hollins Ltd 12 Bowman Process Technology & Valpak (2007) Pyrolysis of Agricultural Solid Waste, Agricultural Waste Plastics Collection and Recovery Programme Available at: www.agwasteplastics.org.uk/media_files/Programme_docs/trial_4-5_abbreviated_report_for_web.pdf 13 The Ecoinvent Centre Available at: http://www.ecoinvent.ch/ 14 Department for Environment, Food and Rural Affairs, Statistics and Research Available at: http://www.defra.gov.uk/environment/waste/statistics/index.htm 15 DEFRA (2006) Greenhouse Gas Policy Evaluation and Appraisal in Government Departments Available at: http://www.defra.gov.uk/environment/climatechange/uk/ukccp/pdf/greengas-policyevaluation.pdf 16 ERM (2006) Carbon balances and energy impacts of the management of UK wastes, Defra R&D project WRT 237 17 Eunomia (2006) A changing climate for energy from waste? Final report to Friends of the Earth 18 Dr Nick Takel, Bowman Process Technologies, personal communication (23 November 2007) 19 Dr Nick Takel, Bowman Process Technologies, personal communication (23 November 2007) 20 Dr Nick Takel, Bowman Process Technologies, personal communication (23 November 2007) 21 Developed by PE International, http://www.gabi-software.com/ 22 Guinée et al (2001) LCA - An operational guide to the ISO-standards, Final report Available at: http://www.leidenuniv.nl/cml/ssp/projects/lca2/lca2.html 23 CML2001 characterisation factors available at: http://www.leidenuniv.nl/cml/ssp/projects/lca2/lca2.html#charact 24 Trevor Fray, Corus Group plc (personal communication, 8 February 2008) 25 Dr Nick Takel, Bowman Process Technology [Regarding discussions with Kevin Linsley, Corus Group plc] (personal communication, 3 March 2008) 26 Dr Nick Takel, Bowman Process Technologies, personal communication (4 March 2008) 27 WRAP (2006) UK Plastics Waste – A review of supplies for recycling, global market demand, future trends and associated risks 28 Doka G. (2007) Life Cycle Inventories of Waste Treatment Services. Ecoinvent report No. 13, Swiss Centre for Life Cycle Inventories 29 Prognos, INFU and IFEU (2008) Resource savings and CO2 reduction potentials in waste management in Europe and the possible contribution to the CO2 reduction target in 2020 Prognos, Berlin 30 F. Perugini, M. Mastellone, U. Arena (2005) A life cycle assessment of mechanical and feedstock recycling options for management of plastic packaging wastes, Environmental Progress 24(2)

LCA of Management Options for Mixed Waste Plastics 79
31 Graham Rice, BP, personal communication (28 February 2008) 32 Ozmoenergy Ltd Available at: www.ozmoenergy.com/technology, 33 Ozmotech Pty Ltd (2004)Thermofuel Master Overview – Waste plastics to diesel fuel Available at: http://221.114.113.155/samoa/SWMW/swm-workshop/2007-08-PNG/IWM_Report-SPREP-Basel_Convention/Appendix_4-1_IWP_Report.pdf 34 Dr Nick Takel, Bowman Process Technologies, personal communication (28 November 2007) 35 Dr Nick Takel, Bowman Process Technologies, personal communication (14 February 2008) 36 Dr Nick Takel, Bowman Process Technologies, personal communication (15 February 2008) 37 Huijbregts M.A.J., Van Oers L., De Koning A., Huppes G., Suh S. & Breedveld L. (2001) Normalisation figures for environmental life cycle asssessment: The Netherlands (1997/1998), Western Europe (1995) and the world (1990 and 1995), Journal of Cleaner Production, 11, 737-748 38 USEPA (2006) Solid Waste Management and Greenhouse Gases – A Life-cycle Assessment of Emissions and Sinks, 3rd Edition 39 Smith, A. et al. (2001) Waste Management Options and Climate Change, Final Report to the European Commission 40 European Integrated Pollution Prevention and Control Bureau (2006) Integrated Pollution Prevention and Control Reference Document on the Best Available Techniques for Waste Incineration 41 C-Tech Innovation for Biffaward (2003) Thermal Methods of Municipal Waste Treatment 42 Fichtner Consulting Engineers Limited (2004) The Viability Of Advanced Thermal Treatment Of MSW In The UK, ESTET 43 CIWM (2003) Energy from Waste: A Good Practice Guide, Northampton: IWM Business Services Group

LCA of Management Options for Mixed Waste Plastics 80
Appendix 1 Primary Data Stadler Description Unit Value Comment Throughput t/h 3.77 Based on run #2 Power consumption (per unit) kW 4.55 Based on 9.1 kW max rating operating at 50% loading Separation efficiency Film removal % 98.7 Calculated as removal from the "rigids" stream
Mis-sorted rigids % 11.2 Assuming that 4 kg of the total 5.4 kg in bottom deck mixed fraction is rigids and that this would not be sent for mechanical recycling due to being intermixed with film.
KME Description Unit Value Comment Throughput t/h 2.54 Based on run #3 Power consumption (per unit) kW 26 Based on 2 machines at 13 kW each Separation efficiency Film removal % 97 Based on runs #1 and #2 Mis-sorted rigids % 21.5 "Flat-rigids" in the film fraction are calculated as mis-sort Pla.To Description Unit Value Comment Throughput (rigids) t/h 4 Throughput (films) t/h 1 Max power rating kW 100 Range = 90 - 110 kW Loading during use % 75 Range = 70 - 80% Material loss (as plastic in the residue fraction) % 10 Based on 8% loss in 2 mm screen and 2% loss in separator

LCA of Management Options for Mixed Waste Plastics 81
Titech (four positive sorts) Description Unit Value Comment Throughput t/h 0.861 Based on run 1
Power consumption (per unit) - 1000 mm kW 1.6 Suggested set-up uses 2 x 1000 mm sorters and 2 x 700 mm sorters - maximum capacity for this set-up is 2 t/h
Power consumption (per unit) - 700 mm kW 1.3 Suggested set-up uses 2 x 1000 mm sorters and 2 x 700 mm sorters - maximum capacity for this set-up is 2 t/h
Acceleration belt kW 2.2 Requires 1 per sort unit Conveyor kW 1.5 Requires 2 per sort unit (one infeed and one outfeed conveyor) Compressed air kW 15 Centralised compressor serving all sorters Separation efficiency PP % 88.1 PE % 78.5 PET % 77.1 PS % 60.7 Not sorted in modelled scenario PVC % 87.2 Pellenc (four positive sorts) Description Unit Value Comment Throughput t/h 3 Pellenc trial report for 3rd and 4th Big Bag Power consumption (per unit) kW 6 Pellenc trial report for 3rd and 4th Big Bag – includes conveyors Compressed air (binary mode - 1 sort) kW 5 Compressed air (ternary mode - 2 sorts) kW 11 Four positive sorts requires 2 Pellenc machines operating in ternary mode Separation Efficiency PP % 80.3 PE % 67.4 PET % 76.9 PS % 64.7 Not sorted in modelled scenario PVC % 81.2

LCA of Management Options for Mixed Waste Plastics 82
Qinetiq (four positive sorts) Description Unit Value Comment Throughput t/h 5 Power consumption (per unit) kW 15.5 Includes compressed air Separation Efficiency PP % 70.0 Based on results from trial on mixed waste form Milton Keynes PE % 70.0 Based on results from trial on mixed waste form Milton Keynes PET % 70.0 Based on results from trial on mixed waste form Milton Keynes PS % 70.0 Not sorted in modelled scenario. Based on results from trial on mixed waste form Milton Keynes PVC % 70.0 Based on results from trial on mixed waste form Milton Keynes Swiss Polymera Description Unit Value Comment Pretreatment Throughput t/h 2 Max power rating kW 630 Loading during use % 70 Pre-treatment water consumption litres/h 5500 Based on expected performance of planned process Extrusion Throughput t/h 0.25 Max power rating kW 120 Range = 115 - 120 kW Loading during use % 100 Pre-treatment water consumption litres/h 0.1 Material Loss % 2 Due to losses on filters, start up and blockages TLT Description Unit Value Comment Throughput t/h 4 Power consumption (per unit) kW 28 2 x pumps @ 3 kW and 2 x vibration sieves @ 11 kW Drying (per unit) kW 32.5 Based on 4 t/h throughput with drying requiring 85 KW/t plus 15 kW per additional tonne Float media loss (w/w of plastic) % 3 Polyolefin separation efficiency % 98
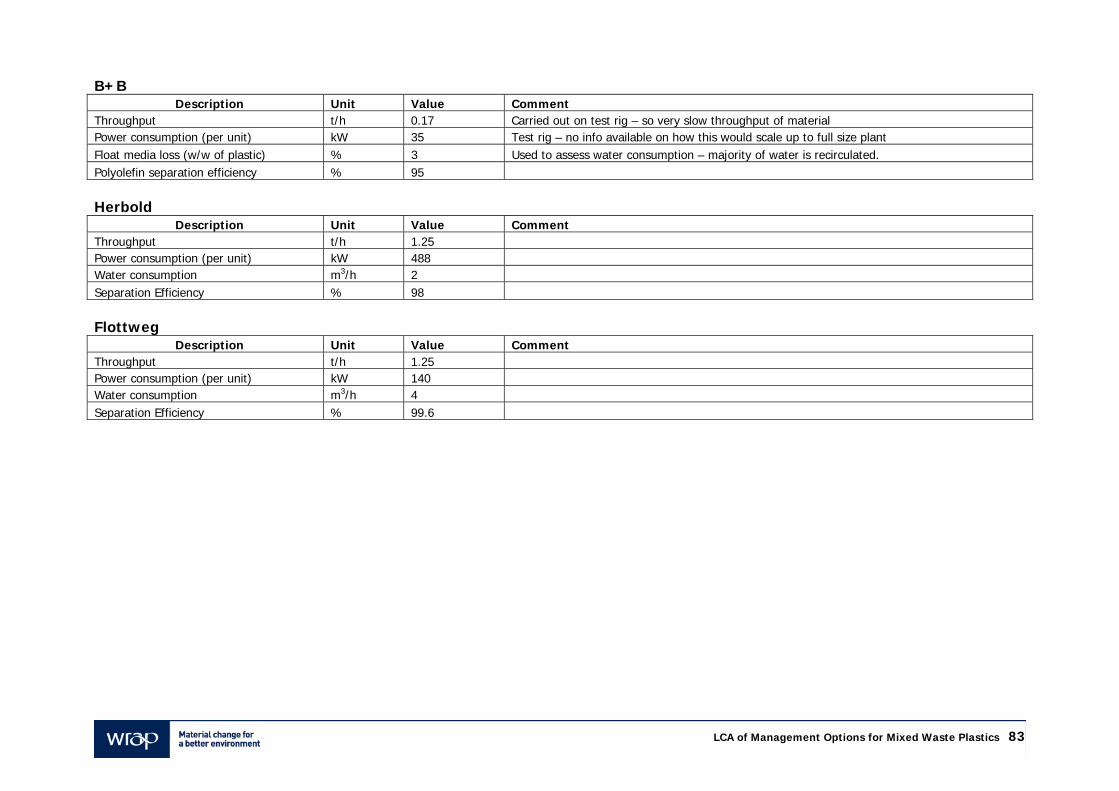
LCA of Management Options for Mixed Waste Plastics 83
B+B Description Unit Value Comment Throughput t/h 0.17 Carried out on test rig – so very slow throughput of material Power consumption (per unit) kW 35 Test rig – no info available on how this would scale up to full size plant Float media loss (w/w of plastic) % 3 Used to assess water consumption – majority of water is recirculated. Polyolefin separation efficiency % 95 Herbold Description Unit Value Comment Throughput t/h 1.25 Power consumption (per unit) kW 488 Water consumption m3/h 2 Separation Efficiency % 98 Flottweg Description Unit Value Comment Throughput t/h 1.25 Power consumption (per unit) kW 140 Water consumption m3/h 4 Separation Efficiency % 99.6

LCA of Management Options for Mixed Waste Plastics 84
Appendix 2 Secondary Data Landfill Process/product Source Geographic Coverage Year Comment Polypropylene, 15.9% water, to sanitary landfill
Ecoinvent v1.3 Switzerland 2000 Expected that landfill in Switzerland are managed similarly to landfill in UK
Polyethylene terephtalate, 0.2% water, to sanitary landfill
Ecoinvent v1.3 Switzerland 2000 Expected that landfill in Switzerland are managed similarly to landfill in UK
Polystyrene, 0.2% water, to sanitary landfill Ecoinvent v1.3 Switzerland 2000 Expected that landfill in Switzerland are managed similarly to landfill in UK
Polyvinylchloride, 0.2% water, to sanitary landfill
Ecoinvent v1.3 Switzerland 2000 Expected that landfill in Switzerland are managed similarly to landfill in UK
Polyethylene, 0.4% water, to sanitary landfill Ecoinvent v1.3 Switzerland 2000 Expected that landfill in Switzerland are managed similarly to landfill in UK
Plastics, mixture, 15.3% water, to sanitary landfill
Ecoinvent v1.3 Switzerland 2000 Used to model PLA in landfill. Expected that landfill in Switzerland are managed similarly to landfill in UK
Aluminium, 0% water, to sanitary landfill Ecoinvent v1.3 Switzerland 2000 Expected that landfill in Switzerland are managed similarly to landfill in UK
Tin sheet, 0% water, to sanitary landfill Ecoinvent v1.3 Switzerland 2000 Expected that landfill in Switzerland are managed similarly to landfill in UK
Packaging paper, 13.7% water, to sanitary landfill
Ecoinvent v1.3 Switzerland 2000 Used to model paper and card. Expected that landfill in Switzerland are managed similarly to landfill in UK
Inert material, 0% water, to sanitary landfill Ecoinvent v1.3 Switzerland 2000 Used to model PLA in landfill. Expected that landfill in Switzerland are managed similarly to landfill in UK
Incineration Process/product Source Geographic Coverage Year Comment Polypropylene, 15.9% water, to municipal incineration
Ecoinvent v1.3 Switzerland 2000 Expected that incineration facilities in Switzerland are managed similarly to landfill in UK
Polyethylene terephtalate, 0.2% water, to municipal incineration
Ecoinvent v1.3 Switzerland 2000 Expected that incineration facilities in Switzerland are managed similarly to landfill in UK
Polystyrene, 0.2% water, to municipal incineration
Ecoinvent v1.3 Switzerland 2000 Expected that incineration facilities in Switzerland are managed similarly to landfill in UK
Polyvinylchloride, 0.2% water, to municipal incineration
Ecoinvent v1.3 Switzerland 2000 Expected that incineration facilities in Switzerland are managed similarly to landfill in UK
Polyethylene, 0.4% water, to municipal incineration
Ecoinvent v1.3 Switzerland 2000 Expected that incineration facilities in Switzerland are managed similarly to landfill in UK

LCA of Management Options for Mixed Waste Plastics 85
Plastics, mixture, 15.3% water, to municipal incineration
Ecoinvent v1.3 Switzerland 2000 Used to model PLA in landfill. Expected that incineration facilities in Switzerland are managed similarly to landfill in UK
Aluminium, 0% water, to municipal incineration
Ecoinvent v1.3 Switzerland 2000 Expected that incineration facilities in Switzerland are managed similarly to landfill in UK
Tin sheet, 0% water, to municipal incineration Ecoinvent v1.3 Switzerland 2000 Expected that incineration facilities in Switzerland are managed similarly to landfill in UK
Packaging cardboard, 19.6% water, to municipal incineration
Ecoinvent v1.3 Switzerland 2000 Used to model paper and card. Expected that incineration facilities in Switzerland are managed similarly to landfill in UK
Electricity production Process/product Source Geographic Coverage Year Comment Wood chip burned in Cogen ORC 1400kWth
Ecoinvent v1.3 Switzerland 2001 Allocation based on exergy
Oil power plant
Ecoinvent v1.3 UK 2000
Hard coal power plant
Ecoinvent v1.3 UCTE 2000 UCTE (Union for the coordination of transmission of electricity) links the majority of mainland European electricity grids
Industrial gas power plant
Ecoinvent v1.3 UCTE 2000 UCTE (Union for the coordination of transmission of electricity) links the majority of mainland European electricity grids
Nuclear power plant
Ecoinvent v1.3 UCTE 1999 UCTE (Union for the coordination of transmission of electricity) links the majority of mainland European electricity grids
Natural gas power plant
Ecoinvent v1.3 UK 2000
Hydropower at power plant
Ecoinvent v1.3 UK 2000
Hydropower at pumped storage power plant
Ecoinvent v1.3 UK 1970 Based on Swiss data modified for UK situation
Wind power plant
Ecoinvent v1.3 European Average 2002
France electricity production mix
Ecoinvent v1.3 France 2000

LCA of Management Options for Mixed Waste Plastics 86
Primary material production Process/product Source Geographic Coverage Year Comment High Density Polyethylene granulate (HDPE) Ecoinvent v1.3 European Average 1993 Data are from the Eco-profiles of the European plastics
industry (APME) Polyethylene Terephthalate (PET) granulate (amorphous)
Ecoinvent v1.3 European Average 2000 Data are from the Eco-profiles of the European plastics industry (APME)
Polyvinylchloride resin (B-PVC); Bulk Polymerisation
Ecoinvent v1.3 European Average 1998 Data are from the Eco-profiles of the European plastics industry (APME)
Polystyrene (General Purpose) granulate (GPPS)
Ecoinvent v1.3 European Average 1994 Data are from the Eco-profiles of the European plastics industry (APME)
Polypropylene granulate (PP) Ecoinvent v1.3 European Average 1993 Data are from the Eco-profiles of the European plastics industry (APME)
Concrete Ecoinvent v1.3 Switzerland 2001 Expected that concrete production in Switzerland would perform similarly to that in UK
Softwood logs Ecoinvent v1.3 European Average 1996 Transport Process/product Source Geographic Coverage Year Comment 28-32t Capacity Lorry (22 t maximum payload) Euro IV
PE-International European Average 2005
Other Process/product Source Geographic Coverage Year Comment Coal burned in power plant Ecoinvent v1.3 Germany 2000 Assumed that coal power plant emissions in Germany are
similar to those from coal burned in cement kiln in UK Natural gas in combined cycle plant Ecoinvent v1.3 European Average 2002 Used as substituted process to account for savings from
electricity from incineration

LCA of Management Options for Mixed Waste Plastics 87
Appendix 3 Life Cycle Inventories Material emissions, output to atmosphere, kg/tonne waste
A -
Lan
dfill
B -
In
cine
rati
on
C -
SR
F
D -
BP
py
roly
sis
E -
Ozm
otec
h py
roly
sis
F -
Red
ox
agen
t
G -
Sta
dler
&
Tite
ch
H -
Sta
dler
&
Pel
lenc
I -
Stad
ler
&
Qin
etiq
J -
Stad
ler
&
Sim
s
K -
KM
E &
Ti
tech
L -
Stad
ler
&
TLT
M -
Sw
iss
Pol
ymer
a
N -
B+
B
O -
Her
bold
P -
Flo
ttw
eg
Heavy Metals Antimony 1.3E-07 8.0E-07 -3.1E-06 -3.5E-06 -2.2E-06 -2.4E-06 -2.0E-06 -2.1E-06 -1.9E-06 -2.0E-06 -1.8E-06 4.1E-07 5.5E-07 6.4E-07 7.8E-07 5.2E-07
Arsenic 9.1E-07 6.2E-06 -4.3E-05 -3.7E-05 -2.5E-05 -2.2E-05 -1.9E-05 -2.0E-05 -1.8E-05 -1.9E-05 -1.6E-05 4.2E-06 6.0E-06 7.3E-06 9.1E-06 5.6E-06
Cadmium 9.6E-07 3.5E-06 -3.1E-06 -2.7E-05 -2.3E-05 -1.1E-05 -1.1E-05 -1.1E-05 -9.7E-06 -1.1E-05 -9.3E-06 1.7E-06 1.9E-06 2.3E-06 2.6E-06 1.9E-06
Chromium (unspecified) 1.8E-05 7.3E-05 -3.4E-05 -4.5E-04 -2.8E-04 -2.7E-04 -2.6E-04 -2.6E-04 -2.4E-04 -2.6E-04 -2.3E-04 3.0E-05 3.5E-05 4.0E-05 4.5E-05 3.4E-05
Chromium +VI 4.4E-07 1.9E-06 -2.6E-06 -1.1E-05 -6.8E-06 -7.0E-06 -6.6E-06 -6.6E-06 -5.9E-06 -6.6E-06 -5.7E-06 8.2E-07 9.9E-07 1.2E-06 1.4E-06 9.7E-07
Cobalt 5.4E-07 4.6E-06 -1.1E-05 -2.6E-05 -2.2E-05 -1.1E-05 -9.3E-06 -1.0E-05 -9.1E-06 -9.3E-06 -7.9E-06 4.1E-06 6.0E-06 7.6E-06 9.7E-06 5.7E-06
Copper 7.6E-06 3.1E-05 -8.3E-05 -1.7E-04 -1.3E-04 -1.0E-04 -9.8E-05 -9.9E-05 -8.9E-05 -9.8E-05 -8.5E-05 1.4E-05 1.7E-05 2.0E-05 2.3E-05 1.7E-05
Iron 2.5E-05 9.3E-05 -5.2E-04 -6.3E-04 -3.9E-04 -6.8E-04 -3.5E-04 -3.5E-04 -3.1E-04 -3.5E-04 -3.0E-04 4.4E-05 5.1E-05 5.9E-05 6.9E-05 5.1E-05
Lead 5.8E-06 2.4E-05 -1.7E-04 -1.8E-04 -1.4E-04 -1.2E-04 -1.0E-04 -1.1E-04 -9.6E-05 -1.0E-04 -9.1E-05 1.5E-05 2.1E-05 2.6E-05 3.2E-05 2.0E-05
Manganese 1.1E-06 5.1E-06 -3.6E-05 -1.0E-05 -1.5E-06 -7.4E-06 -2.2E-06 -4.5E-06 -4.4E-06 -2.2E-06 -1.2E-06 1.0E-05 1.7E-05 2.1E-05 2.8E-05 1.5E-05
Mercury 7.9E-07 3.1E-05 -1.1E-04 -4.4E-05 -4.5E-05 -4.2E-05 -1.7E-04 -1.6E-04 -1.4E-04 -1.7E-04 -1.5E-04 -1.4E-04 -1.7E-04 -1.4E-04 -1.3E-04 -1.4E-04
Molybdenum 1.2E-07 1.5E-06 -9.7E-06 -1.0E-05 -9.1E-06 -3.8E-06 -3.2E-06 -3.4E-06 -3.1E-06 -3.2E-06 -2.7E-06 1.2E-06 1.7E-06 2.1E-06 2.7E-06 1.6E-06
Nickel 5.9E-06 4.2E-05 -2.5E-04 -4.3E-04 -3.4E-04 -1.7E-04 -1.6E-04 -1.6E-04 -1.5E-04 -1.6E-04 -1.3E-04 3.3E-05 4.7E-05 5.9E-05 7.4E-05 4.5E-05
Platinum 6.4E-13 1.1E-12 -6.5E-13 -1.7E-12 -1.4E-12 -1.3E-12 -1.0E-12 -1.0E-12 -8.5E-13 -1.0E-12 -8.3E-13 5.3E-13 5.2E-13 5.7E-13 6.0E-13 5.6E-13
Selenium 2.5E-07 3.8E-06 -1.4E-04 -9.5E-06 -7.2E-06 -4.8E-06 -2.3E-06 -3.4E-06 -3.2E-06 -2.3E-06 -1.7E-06 4.9E-06 7.7E-06 9.7E-06 1.3E-05 7.0E-06
Silver 1.7E-12 3.8E-11 -2.7E-09 -2.2E-09 -2.1E-09 -2.2E-09 -2.1E-09 -2.0E-09 -1.7E-09 -2.1E-09 -1.9E-09 1.5E-11 2.8E-11 4.4E-11 6.2E-11 2.8E-11
Thallium 8.1E-09 4.9E-07 1.9E-07 -1.7E-07 -8.7E-08 -2.2E-07 -9.4E-08 -9.1E-08 -7.5E-08 -9.4E-08 -7.3E-08 4.6E-08 4.1E-08 5.1E-08 5.7E-08 5.0E-08
Tin 3.5E-07 9.0E-05 3.9E-05 1.4E-06 3.8E-06 4.1E-06 4.3E-06 4.7E-06 5.9E-06 4.3E-06 5.5E-06 1.4E-05 1.4E-05 1.5E-05 1.5E-05 1.4E-05
Titanium 8.0E-07 9.1E-04 7.7E-04 2.2E-05 4.0E-05 1.0E-05 4.0E-05 4.6E-05 5.6E-05 4.0E-05 5.3E-05 8.2E-05 6.7E-05 8.0E-05 8.3E-05 8.1E-05
Vanadium 8.0E-06 2.5E-04 3.1E-05 -1.4E-03 -8.3E-04 -5.5E-04 -5.1E-04 -5.2E-04 -4.7E-04 -5.1E-04 -4.5E-04 7.0E-05 9.0E-05 1.1E-04 1.4E-04 8.9E-05
Zinc 1.6E-05 6.9E-05 -1.5E-04 -3.2E-04 -2.2E-04 -1.9E-04 -1.7E-04 -1.8E-04 -1.6E-04 -1.7E-04 -1.5E-04 4.5E-05 6.3E-05 7.6E-05 9.5E-05 6.0E-05

LCA of Management Options for Mixed Waste Plastics 88
A B C D E F G H I J K L M N O P Inorganic Emissions Ammonia 5.5E-04 1.3E-02 -4.9E-02 -4.4E-04 4.5E-04 -4.0E-03 1.1E-03 7.0E-04 8.0E-04 1.1E-03 1.4E-03 3.7E-03 4.8E-03 6.0E-03 7.4E-03 4.7E-03
Barium 4.6E-06 1.9E-04 1.1E-05 8.5E-06 1.8E-05 1.2E-06 1.5E-05 1.4E-05 1.5E-05 1.5E-05 1.8E-05 2.7E-05 3.0E-05 3.8E-05 4.7E-05 3.2E-05
Beryllium 3.8E-09 5.3E-07 2.9E-07 -1.3E-07 -5.8E-08 -1.6E-07 -6.3E-08 -6.1E-08 -4.7E-08 -6.3E-08 -4.5E-08 5.6E-08 5.2E-08 6.2E-08 6.7E-08 5.9E-08
Boron 4.0E-05 8.3E-05 2.1E-05 -1.2E-05 1.5E-05 -2.5E-05 1.0E-05 1.0E-05 1.3E-05 1.0E-05 1.4E-05 4.6E-05 4.6E-05 4.8E-05 4.8E-05 4.7E-05
Boron compounds
(unspecified) 1.1E-05 5.4E-04 -3.3E-03 -4.9E-04 -4.8E-04 -5.2E-04 -3.4E-04 -3.8E-04 -3.4E-04 -3.4E-04 -2.8E-04 2.4E-04 3.5E-04 4.3E-04 5.3E-04 3.3E-04
Bromine 2.9E-05 2.8E-04 -1.3E-03 1.0E-04 1.1E-04 8.1E-05 1.1E-04 9.0E-05 8.5E-05 1.1E-04 1.1E-04 1.3E-04 1.8E-04 2.2E-04 2.7E-04 1.7E-04
Carbon dioxide 5.0E+01 1.9E+03 -1.4E+01 -1.1E+01 -9.7E+01 7.3E-01 -6.2E+02 -5.6E+02 -4.7E+02 -6.2E+02 -5.0E+02 -4.8E+02 -6.3E+02 -4.1E+02 -3.2E+02 -4.5E+02
Carbon disulphide 2.8E-05 1.6E-04 -2.7E-04 -9.4E-04 -6.0E-04 -5.7E-04 -5.3E-04 -5.3E-04 -4.7E-04 -5.3E-04 -4.6E-04 5.6E-05 6.5E-05 7.2E-05 8.1E-05 6.4E-05
Carbon monoxide 4.3E-02 2.0E-01 -2.1E-01 -1.9E-01 -3.2E-01 -1.4E-01 -4.0E-01 -3.7E-01 -3.3E-01 -4.0E-01 -3.4E-01 -2.7E-01 -3.4E-01 -2.5E-01 -2.2E-01 -2.6E-01
Chlorine 3.8E-06 8.4E-04 -7.7E-05 -2.1E-04 -2.4E-04 -1.6E-04 -2.7E-04 -2.5E-04 -2.0E-04 -2.7E-04 -2.3E-04 -5.7E-05 -1.0E-04 -4.9E-05 -4.1E-05 -5.7E-05
Cyanide (unspecified) 5.2E-06 2.2E-03 2.1E-03 1.6E-04 1.6E-04 1.6E-04 1.6E-04 1.7E-04 1.9E-04 1.6E-04 1.8E-04 2.7E-04 2.5E-04 2.8E-04 2.7E-04 2.7E-04
Fluorine 3.7E-07 1.2E-06 -2.0E-06 -3.1E-05 -2.8E-05 -2.9E-05 -6.6E-05 -6.2E-05 -5.9E-05 -6.6E-05 -5.8E-05 -2.1E-04 -2.6E-04 -2.2E-04 -2.1E-04 -2.2E-04
Helium 4.4E-05 3.0E-05 3.3E-07 -2.6E-04 -7.4E-04 3.6E-05 1.2E-05 1.2E-05 1.6E-05 1.2E-05 1.7E-05 4.3E-05 3.9E-05 4.9E-05 5.4E-05 4.6E-05
Hydrogen 5.6E-05 1.4E-02 -3.2E-02 -3.1E-02 -3.1E-02 -3.1E-02 -5.8E-02 -5.4E-02 -4.7E-02 -5.8E-02 -5.1E-02 -4.0E-02 -5.0E-02 -4.2E-02 -4.0E-02 -4.1E-02
Hydrogen chloride 2.2E-02 3.5E-03 -6.1E-02 -2.3E-03 9.2E-04 -3.6E-03 -1.1E-02 -9.7E-03 -6.6E-03 -1.1E-02 -7.5E-03 1.6E-03 -9.1E-04 4.5E-03 7.4E-03 2.9E-03
Hydrogen fluoride 1.5E-04 6.3E-04 -3.2E-02 2.9E-04 7.6E-04 -6.2E-06 -2.0E-05 -2.5E-04 -2.5E-04 -2.0E-05 6.8E-05 3.1E-04 8.5E-04 1.6E-03 2.4E-03 8.8E-04
Hydrogen sulphide 1.3E-05 -8.5E-03 -2.6E-04 -1.8E-03 -1.5E-03 -1.4E-03 -1.9E-03 -1.9E-03 -1.9E-03 -1.9E-03 -1.9E-03 -1.5E-03 -1.5E-03 -1.5E-03 -1.5E-03 -1.5E-03
Iodine 3.9E-07 1.8E-05 -5.8E-04 1.7E-05 2.7E-05 6.6E-06 2.0E-05 1.2E-05 9.6E-06 2.0E-05 1.9E-05 3.2E-05 5.3E-05 6.7E-05 8.9E-05 4.8E-05
Nitrate 7.0E-09 8.1E-08 -4.4E-06 5.7E-08 1.4E-07 -4.8E-07 9.4E-08 4.8E-08 3.7E-08 9.4E-08 9.5E-08 1.8E-07 3.0E-07 3.9E-07 5.1E-07 2.7E-07
Nitrogen oxides 1.4E-01 9.0E-02 -2.3E+00 -1.1E+00 -1.1E+00 -5.9E-01 -3.9E+00 -3.6E+00 -3.2E+00 -3.9E+00 -3.4E+00 -3.9E+00 -4.8E+00 -3.9E+00 -3.6E+00 -3.9E+00
Nitrous oxide 8.8E-04 -5.1E-05 -9.1E-02 -1.0E-03 -5.4E-04 -2.6E-04 7.5E-04 1.5E-04 1.1E-04 7.5E-04 8.8E-04 3.2E-03 4.7E-03 5.8E-03 7.3E-03 4.3E-03
Ozone 2.5E-05 4.7E-04 -3.1E-04 -5.9E-04 -6.3E-04 -5.9E-04 -4.6E-04 -4.6E-04 -4.0E-04 -4.6E-04 -3.9E-04 1.1E-04 1.5E-04 1.4E-04 1.6E-04 1.4E-04
Phosphorus 1.7E-07 7.0E-06 -9.0E-07 1.7E-06 1.0E-05 -2.1E-06 4.8E-06 2.2E-06 1.7E-06 4.8E-06 4.9E-06 9.4E-06 1.6E-05 2.1E-05 2.8E-05 1.5E-05
Scandium 1.1E-09 8.8E-09 -1.6E-07 -1.5E-07 -8.4E-08 -1.9E-07 -9.2E-08 -9.3E-08 -8.4E-08 -9.2E-08 -8.1E-08 4.3E-09 6.1E-09 7.7E-09 9.8E-09 5.8E-09
Silicium tetrafluoride 5.4E-10 1.5E-08 3.0E-09 -2.4E-08 -3.3E-08 -6.8E-09 -7.4E-09 -7.4E-09 -6.4E-09 -7.4E-09 -6.1E-09 4.2E-09 4.5E-09 5.0E-09 5.3E-09 4.5E-09
Steam 2.4E-04 2.8E-03 -1.5E-01 1.9E-03 4.7E-03 -1.6E-02 3.2E-03 1.7E-03 1.3E-03 3.2E-03 3.3E-03 6.2E-03 1.0E-02 1.3E-02 1.7E-02 9.4E-03
Strontium 2.4E-07 1.5E-05 -3.2E-05 -1.3E-05 5.4E-07 -2.3E-05 -4.2E-06 -7.1E-06 -6.7E-06 -4.2E-06 -2.8E-06 1.3E-05 2.0E-05 2.6E-05 3.4E-05 1.9E-05
Sulphur dioxide 3.3E-02 -2.4E-02 -2.6E+00 -9.7E-01 -1.9E+00 -8.6E-01 -5.2E+00 -4.8E+00 -4.3E+00 -5.2E+00 -4.6E+00 -5.6E+00 -6.8E+00 -5.6E+00 -5.2E+00 -5.6E+00
Sulphur hexafluoride 3.0E-07 7.8E-06 -1.9E-06 -1.0E-05 -1.1E-05 -8.2E-06 -7.7E-06 -7.7E-06 -6.8E-06 -7.7E-06 -6.6E-06 1.6E-06 1.8E-06 1.8E-06 1.9E-06 1.8E-06

LCA of Management Options for Mixed Waste Plastics 89
A B C D E F G H I J K L M N O P Organic Emissions Polycyclic aromatic
hydrocarbons (PAH) 5.7E-06 -8.8E-05 -4.6E-05 -2.0E-05 -1.5E-05 -1.2E-05 -8.3E-06 -1.1E-05 -1.1E-05 -8.3E-06 -8.0E-06 3.8E-06 1.1E-05 1.3E-05 1.9E-05 8.1E-06
Halogenated organic
emissions to air 1.1E-05 -5.5E-05 -2.2E-02 -1.8E-02 -1.8E-02 -1.8E-02 -1.8E-02 -1.6E-02 -1.4E-02 -1.8E-02 -1.5E-02 -3.0E-05 -3.5E-05 -2.7E-05 -2.3E-05 -2.9E-05
Acentaphthene 2.3E-12 -9.0E-09 1.0E-10 -2.9E-10 -1.8E-10 -4.1E-10 -2.9E-10 -4.7E-10 -5.8E-10 -2.9E-10 -4.0E-10 -3.2E-10 1.5E-10 2.0E-10 4.6E-10 -9.3E-11
Acetaldehyde 5.6E-07 9.4E-06 -9.4E-06 -1.3E-04 -8.4E-05 -8.4E-05 -7.6E-05 -7.8E-05 -7.2E-05 -7.6E-05 -6.6E-05 1.4E-05 2.2E-05 2.7E-05 3.5E-05 2.0E-05
Acetic acid 8.7E-06 -1.3E-03 2.2E-05 -2.0E-02 -2.0E-02 -2.0E-02 -2.0E-02 -2.0E-02 -1.8E-02 -2.0E-02 -1.8E-02 1.0E-05 1.1E-04 1.3E-04 2.0E-04 6.5E-05
Acetone 8.1E-07 2.5E-05 -1.1E-05 -8.2E-05 -3.9E-05 -4.1E-05 -3.1E-05 -3.5E-05 -3.2E-05 -3.1E-05 -2.6E-05 2.0E-05 3.2E-05 4.0E-05 5.1E-05 2.9E-05
Acrolein 3.1E-08 1.1E-08 -1.4E-08 6.5E-09 -3.5E-09 1.1E-08 1.6E-08 1.4E-08 1.5E-08 1.6E-08 1.8E-08 2.7E-08 3.1E-08 3.8E-08 4.6E-08 3.2E-08
Aldehyde (unspecified) 9.9E-08 8.5E-07 1.3E-07 -2.8E-05 -2.8E-05 -2.7E-05 -2.8E-05 -2.8E-05 -2.5E-05 -2.8E-05 -2.5E-05 -7.0E-07 -5.7E-07 9.0E-08 6.5E-07 -3.5E-07
Alkane (unspecified) 6.2E-05 -3.2E-03 -5.8E-03 -1.6E-03 -1.5E-03 -9.1E-04 -8.1E-04 -8.7E-04 -8.4E-04 -8.1E-04 -7.6E-04 -6.3E-05 1.2E-04 1.8E-04 3.1E-04 4.6E-05
Alkene (unspecified) 2.8E-06 9.2E-05 -5.3E-03 9.3E-05 2.1E-04 2.4E-05 1.4E-04 8.0E-05 6.5E-05 1.4E-04 1.3E-04 2.2E-04 3.7E-04 4.7E-04 6.2E-04 3.3E-04
Aromatic hydrocarbons
(unspecified) 5.0E-05 6.9E-06 -4.8E-04 -3.3E-02 -3.3E-02 -3.3E-02 -4.2E-02 -4.1E-02 -3.8E-02 -4.2E-02 -3.7E-02 -6.1E-02 -7.5E-02 -6.3E-02 -6.1E-02 -6.2E-02
Benzaldehyde 1.6E-08 1.3E-09 -6.7E-09 2.5E-09 -4.1E-09 6.3E-09 6.5E-09 6.8E-09 7.5E-09 6.5E-09 7.3E-09 8.6E-09 7.6E-09 8.9E-09 9.4E-09 8.7E-09
Benzene 1.6E-04 9.8E-04 -5.2E-03 -1.0E-03 -1.8E-03 1.7E-04 6.4E-05 -2.6E-05 -2.6E-06 6.4E-05 1.2E-04 7.0E-04 8.8E-04 1.1E-03 1.4E-03 8.9E-04
Butadiene 1.0E-12 1.6E-12 -2.3E-13 -4.4E-10 -6.9E-11 2.2E-12 4.2E-14 -8.3E-14 8.3E-14 4.2E-14 2.9E-13 2.4E-12 2.3E-12 3.0E-12 3.4E-12 2.7E-12
Butane 4.6E-04 -1.3E-02 -3.7E-04 -8.3E-03 -1.9E-02 -5.0E-04 -9.2E-04 -1.2E-03 -1.2E-03 -9.2E-04 -9.5E-04 1.9E-04 7.9E-04 1.0E-03 1.5E-03 5.6E-04
Butene 1.0E-05 1.2E-05 -1.4E-06 -1.6E-04 -4.2E-04 1.4E-05 6.4E-07 3.2E-07 1.7E-06 6.4E-07 2.5E-06 1.6E-05 1.4E-05 1.8E-05 2.0E-05 1.7E-05
Cumene 2.3E-06 1.9E-05 1.2E-05 -4.6E-05 -5.0E-05 -2.0E-05 -2.1E-05 -2.1E-05 -1.8E-05 -2.1E-05 -1.8E-05 4.0E-06 3.8E-06 4.6E-06 5.1E-06 4.3E-06
Cycloalkanes (unspec.) 1.9E-08 5.3E-08 1.1E-09 -2.6E-05 -2.6E-05 -2.6E-05 -2.6E-05 -2.6E-05 -2.4E-05 -2.6E-05 -2.3E-05 2.6E-08 3.4E-08 3.8E-08 4.7E-08 3.3E-08
Ethane 1.7E-04 -7.2E-02 -9.1E-04 -1.2E-02 -1.3E-02 -7.4E-03 -6.9E-03 -7.9E-03 -8.3E-03 -6.9E-03 -7.3E-03 -3.7E-03 -8.2E-04 -1.1E-03 8.3E-05 -2.5E-03
Ethanol 1.0E-06 3.7E-05 -2.1E-05 -1.7E-04 -8.5E-05 -8.2E-05 -6.7E-05 -7.1E-05 -6.5E-05 -6.7E-05 -5.7E-05 2.5E-05 3.7E-05 4.6E-05 5.9E-05 3.4E-05
Ethene 2.9E-05 4.7E-05 -4.0E-04 -5.9E-03 -6.3E-03 -5.7E-03 -5.5E-03 -5.5E-03 -5.0E-03 -5.5E-03 -4.8E-03 4.3E-05 7.2E-05 5.9E-05 8.4E-05 7.5E-05
Ethine 4.6E-07 3.6E-06 -6.2E-05 -6.0E-05 -3.3E-05 -7.5E-05 -3.7E-05 -3.7E-05 -3.4E-05 -3.7E-05 -3.2E-05 1.8E-06 2.5E-06 3.1E-06 4.0E-06 2.4E-06
Ethyl benzene 1.0E-05 1.2E-05 -1.2E-06 -1.6E-04 -4.2E-04 1.5E-05 1.6E-06 1.0E-06 2.3E-06 1.6E-06 3.4E-06 1.7E-05 1.6E-05 2.0E-05 2.2E-05 1.8E-05
Ethylene oxide 2.2E-08 1.2E-07 1.5E-07 -4.4E-04 -4.4E-04 -4.4E-04 -4.4E-04 -4.4E-04 -4.0E-04 -4.4E-04 -3.9E-04 2.7E-08 2.4E-08 3.3E-08 3.8E-08 3.0E-08
Ethylenediamine 2.0E-11 4.0E-11 -4.6E-10 -1.1E-10 -4.2E-11 -1.1E-10 -4.5E-11 -4.9E-11 -4.3E-11 -4.5E-11 -3.6E-11 3.4E-11 4.6E-11 5.7E-11 7.1E-11 4.4E-11
Formaldehyde 4.3E-06 -2.5E-04 -1.5E-03 -5.9E-04 -3.2E-04 -3.5E-04 -3.0E-04 -3.2E-04 -3.0E-04 -3.0E-04 -2.7E-04 6.9E-05 1.3E-04 1.6E-04 2.2E-04 1.1E-04
Heptane (isomers) 1.0E-04 1.2E-04 -1.3E-05 -1.6E-03 -4.2E-03 1.4E-04 6.4E-06 3.2E-06 1.7E-05 6.4E-06 2.5E-05 1.6E-04 1.4E-04 1.8E-04 2.0E-04 1.7E-04
Hexane (isomers) 2.2E-04 -8.8E-03 6.4E-05 -3.6E-03 -9.1E-03 -1.2E-04 -2.7E-04 -4.6E-04 -5.4E-04 -2.7E-04 -3.5E-04 3.4E-05 4.7E-04 6.2E-04 9.3E-04 2.9E-04
Hydrocarbons, aromatic 1.4E-05 -1.8E-03 -9.1E-05 -4.3E-04 -4.0E-04 -3.0E-04 -2.8E-04 -2.9E-04 -2.9E-04 -2.8E-04 -2.8E-04 -1.3E-04 -8.4E-05 -1.1E-04 -1.1E-04 -1.2E-04
Methanol 5.3E-06 1.1E-04 -6.7E-05 -1.1E-02 -1.1E-02 -1.1E-02 -1.1E-02 -1.1E-02 -1.0E-02 -1.1E-02 -9.9E-03 3.8E-05 5.1E-05 6.3E-05 7.9E-05 4.9E-05

LCA of Management Options for Mixed Waste Plastics 90
A B C D E F G H I J K L M N O P Methyl tert-butylether 1.6E-08 5.3E-08 -3.3E-07 -2.3E-07 -1.3E-07 -3.3E-07 -1.3E-07 -1.3E-07 -1.2E-07 -1.3E-07 -1.1E-07 2.3E-08 3.0E-08 3.9E-08 4.9E-08 3.0E-08
Monoethanolamine 5.3E-08 1.1E-06 -1.7E-07 -6.2E-06 -3.7E-06 -3.7E-06 -3.6E-06 -3.6E-06 -3.3E-06 -3.6E-06 -3.2E-06 3.3E-07 4.2E-07 4.9E-07 5.7E-07 4.0E-07
NMVOC (unspecified) 3.2E-02 -8.3E-02 -1.2E-01 -5.6E-01 -6.3E-01 -2.8E-01 -1.3E+00 -1.2E+00 -1.1E+00 -1.3E+00 -1.2E+00 -2.5E+00 -3.1E+00 -2.6E+00 -2.5E+00 -2.5E+00
Pentane 5.8E-04 -1.2E-02 -3.5E-03 -1.0E-02 -2.3E-02 -4.9E-04 -1.0E-03 -1.3E-03 -1.3E-03 -1.0E-03 -9.8E-04 4.9E-04 1.1E-03 1.5E-03 2.0E-03 9.1E-04
Phenol 9.2E-07 1.3E-05 -1.0E-06 -7.1E-05 -4.2E-05 -4.2E-05 -4.2E-05 -4.2E-05 -3.8E-05 -4.2E-05 -3.7E-05 2.8E-06 2.9E-06 3.1E-06 3.2E-06 2.9E-06
Propane 4.6E-04 -2.4E-02 -9.2E-04 -1.0E-02 -2.1E-02 -2.0E-03 -2.3E-03 -2.7E-03 -2.8E-03 -2.3E-03 -2.4E-03 -6.5E-04 2.4E-04 3.2E-04 7.9E-04 -2.3E-04
Propene 2.3E-05 3.9E-05 -4.5E-04 -3.9E-04 -8.8E-04 -5.3E-05 -3.9E-05 -4.2E-05 -3.5E-05 -3.9E-05 -2.9E-05 4.3E-05 4.6E-05 5.9E-05 6.8E-05 5.0E-05
Propionaldehyde 1.6E-08 1.3E-09 -6.7E-09 2.5E-09 -4.1E-09 6.3E-09 6.5E-09 6.8E-09 7.5E-09 6.5E-09 7.3E-09 8.6E-09 7.6E-09 8.9E-09 9.4E-09 8.7E-09
Propionic acid 1.1E-07 -1.8E-04 2.5E-06 -2.4E-05 -1.3E-05 -1.8E-05 -1.5E-05 -1.9E-05 -2.0E-05 -1.5E-05 -1.7E-05 -6.2E-06 3.2E-06 4.3E-06 9.7E-06 -1.6E-06
Propylene oxide 4.3E-07 4.3E-07 5.9E-08 -4.3E-06 -9.4E-07 -2.2E-07 -2.1E-07 -2.0E-07 -1.4E-07 -2.1E-07 -1.4E-07 2.8E-07 2.5E-07 2.9E-07 3.1E-07 2.9E-07
Styrene 1.9E-10 7.2E-09 -1.1E-09 1.4E-09 3.7E-09 -1.0E-09 2.8E-09 7.9E-10 4.9E-10 2.8E-09 3.0E-09 8.7E-09 1.4E-08 1.8E-08 2.3E-08 1.3E-08
Toluene 1.0E-04 1.1E-03 -2.0E-03 -1.1E-03 -2.6E-03 1.1E-04 1.8E-05 3.2E-06 2.8E-05 1.8E-05 5.6E-05 3.0E-04 3.2E-04 4.0E-04 4.7E-04 3.5E-04
Xylene 9.4E-05 4.0E-04 -2.3E-02 -3.6E-04 -1.2E-03 3.4E-04 3.6E-04 2.4E-04 2.1E-04 3.6E-04 3.7E-04 6.5E-04 9.3E-04 1.2E-03 1.5E-03 8.9E-04
meta-Xylene 2.2E-08 8.4E-07 1.3E-06 4.1E-06 5.8E-06 3.0E-06 4.1E-06 3.1E-06 2.6E-06 4.1E-06 3.9E-06 4.0E-06 6.7E-06 8.6E-06 1.1E-05 6.0E-06
Methane 4.7E+00 -1.7E+00 -1.1E+01 1.8E+00 1.6E+00 -5.4E+00 7.3E-02 3.3E-01 6.7E-01 7.3E-02 5.0E-01 4.5E-01 -2.1E-01 5.3E-01 7.7E-01 4.8E-01
Particulate Emissions Aluminum 6.0E-04 2.8E-03 -9.8E-02 4.9E-04 2.9E-03 -1.2E-02 1.8E-03 7.9E-04 6.2E-04 1.8E-03 1.9E-03 4.6E-03 7.2E-03 9.2E-03 1.2E-02 6.6E-03
Dust (> PM10) 5.8E-03 5.8E-02 -2.6E+00 -6.0E-02 -2.6E-02 -6.6E-01 -2.1E-01 -2.1E-01 -1.9E-01 -2.1E-01 -1.8E-01 -3.2E-01 -3.7E-01 -2.6E-01 -2.0E-01 -2.9E-01
Dust (PM2,5 - PM10) 2.8E-03 1.0E-02 -1.2E-01 -1.1E-01 -9.7E-02 -9.2E-02 -3.4E-01 -3.1E-01 -2.8E-01 -3.4E-01 -3.0E-01 -5.2E-01 -6.4E-01 -5.4E-01 -5.2E-01 -5.3E-01
Dust (PM2.5) 1.0E-02 1.2E-02 -1.7E-01 -9.0E-02 -8.5E-02 -5.4E-02 -1.9E-01 -1.8E-01 -1.6E-01 -1.9E-01 -1.7E-01 -2.9E-01 -3.5E-01 -2.8E-01 -2.6E-01 -2.8E-01

LCA of Management Options for Mixed Waste Plastics 91
Material emissions, discharged to waste effluent, kg/tonne waste
A -
Lan
dfill
B -
In
cine
rati
on
C -
SR
F
D -
BP
py
roly
sis
E -
Ozm
otec
h py
roly
sis
F -
Red
ox
agen
t
G -
Sta
dler
&
Tite
ch
H -
Sta
dler
&
Pel
lenc
I -
Stad
ler
&
Qin
etiq
J -
Stad
ler
&
Sim
s
K -
KM
E &
Ti
tech
L -
Stad
ler
&
TLT
M -
Sw
iss
Pol
ymer
a
N -
B+
B
O -
Her
bold
P -
Flo
ttw
eg
Heavy Metals Antimony 3.2E-05 1.4E-02 1.2E-02 4.4E-04 4.1E-04 4.6E-04 -1.2E-04 5.3E-06 2.4E-04 -1.2E-04 1.7E-04 1.1E-03 8.4E-04 1.2E-03 1.1E-03 3.4E-05
Arsenic 1.2E-05 8.8E-04 3.4E-04 -6.8E-05 -7.0E-05 -5.9E-05 -7.3E-05 -6.6E-05 -4.5E-05 -7.3E-05 -4.6E-05 4.2E-05 2.7E-05 6.1E-05 8.0E-05 9.7E-07
Cadmium 4.0E-05 8.6E-06 -8.9E-06 2.2E-06 -3.3E-06 1.3E-05 1.3E-05 1.4E-05 1.6E-05 1.3E-05 1.6E-05 2.2E-05 1.9E-05 2.3E-05 2.4E-05 5.7E-06
Cesium 4.1E-07 4.9E-07 -7.2E-08 -7.6E-06 -2.0E-05 6.4E-07 -7.0E-09 -2.6E-08 3.4E-08 -7.0E-09 7.7E-08 7.1E-07 6.3E-07 8.2E-07 8.9E-07 1.7E-05
Chromium +VI 2.1E-05 6.2E-04 5.8E-05 -4.6E-04 -4.7E-04 -3.2E-04 -5.2E-04 -4.8E-04 -4.2E-04 -5.2E-04 -4.4E-04 -2.7E-04 -3.5E-04 -2.7E-04 -2.4E-04 5.1E-05
Cobalt 2.3E-05 1.8E-06 1.8E-06 8.7E-06 5.9E-06 1.1E-05 1.1E-05 1.1E-05 1.2E-05 1.1E-05 1.2E-05 1.9E-05 1.8E-05 1.9E-05 1.9E-05 2.0E-05
Copper 1.6E-05 -6.0E-06 -1.3E-04 -1.6E-04 -1.7E-04 -1.0E-04 -1.2E-04 -1.2E-04 -1.0E-04 -1.2E-04 -1.0E-04 -2.8E-05 -3.4E-05 -2.2E-05 -1.5E-05 1.5E-05
Iron 3.6E-02 2.8E-02 -1.9E-02 -6.6E-03 -1.0E-02 -5.8E-03 2.5E-03 2.6E-03 5.5E-03 2.5E-03 6.3E-03 3.4E-02 3.5E-02 3.5E-02 3.6E-02 -1.4E-04
Lead 9.8E-06 1.7E-05 -4.0E-05 -9.6E-05 -1.4E-04 -4.8E-05 -4.9E-05 -5.2E-05 -4.7E-05 -4.9E-05 -4.1E-05 1.7E-05 2.6E-05 3.7E-05 4.9E-05 1.6E-06
Manganese 6.7E-04 7.4E-05 -1.5E-03 1.5E-04 -3.6E-04 -1.6E-04 5.0E-04 4.9E-04 4.9E-04 5.0E-04 5.1E-04 5.9E-04 6.2E-04 6.8E-04 7.4E-04 4.5E-05
Mercury 4.5E-07 6.6E-06 -4.6E-06 -2.8E-05 -2.9E-05 -2.7E-05 -4.9E-05 -4.6E-05 -4.3E-05 -4.9E-05 -4.3E-05 -1.0E-04 -1.3E-04 -1.1E-04 -1.0E-04 5.6E-13
Molybdenum 4.2E-06 7.3E-05 -2.8E-04 -6.2E-05 -5.8E-05 -6.7E-05 -7.8E-05 -7.9E-05 -7.0E-05 -7.8E-05 -6.7E-05 -1.7E-05 -1.5E-05 4.0E-06 2.0E-05 7.0E-06
Nickel 2.0E-05 -3.8E-07 -2.3E-04 -2.1E-04 -1.7E-04 -1.6E-04 -1.2E-04 -1.2E-04 -1.1E-04 -1.2E-04 -1.0E-04 -2.1E-05 -2.5E-05 -1.2E-05 -4.2E-06 2.8E-11
Selenium 4.5E-06 6.7E-04 5.6E-04 4.1E-05 3.7E-05 4.0E-05 3.5E-05 4.0E-05 4.7E-05 3.5E-05 4.4E-05 5.3E-05 4.2E-05 5.5E-05 5.9E-05 5.0E-08
Silver 3.9E-07 4.8E-07 -5.5E-08 -6.3E-06 -1.6E-05 4.1E-07 -1.1E-07 -1.2E-07 -6.0E-08 -1.1E-07 -2.2E-08 6.1E-07 5.5E-07 7.2E-07 7.8E-07 1.4E-05
Strontium 2.5E-03 3.0E-03 -5.5E-03 -4.6E-02 -1.2E-01 1.2E-03 7.2E-05 -7.0E-05 2.8E-04 7.2E-05 5.7E-04 4.4E-03 4.0E-03 5.2E-03 5.7E-03 8.1E-05
Thallium 6.4E-07 5.0E-07 1.3E-07 3.7E-07 3.9E-07 3.3E-07 4.3E-07 4.0E-07 4.2E-07 4.3E-07 4.6E-07 6.8E-07 7.6E-07 8.3E-07 9.2E-07 8.9E-05
Tin 4.9E-05 3.3E-06 -4.4E-05 4.2E-05 4.2E-05 4.1E-05 4.1E-05 4.1E-05 4.1E-05 4.1E-05 4.2E-05 4.2E-05 4.3E-05 4.3E-05 4.3E-05 6.0E-05
Titanium 4.4E-07 7.5E-06 -2.0E-06 -7.8E-07 8.5E-07 -2.7E-06 9.7E-07 -7.4E-07 -8.2E-07 9.7E-07 1.4E-06 7.9E-06 1.2E-05 1.6E-05 2.0E-05 -4.8E+02
Tungsten 9.4E-08 4.0E-06 -3.7E-05 -2.1E-06 -1.1E-06 -3.1E-06 -9.0E-07 -1.6E-06 -1.5E-06 -9.0E-07 -5.7E-07 3.4E-06 5.2E-06 6.6E-06 8.5E-06 4.7E-03
Vanadium 8.0E-04 1.0E-03 9.4E-04 3.4E-04 3.3E-04 3.3E-04 3.4E-04 3.8E-04 4.3E-04 3.4E-04 4.0E-04 3.2E-04 2.1E-04 3.1E-04 3.4E-04 3.2E-05
Zinc 2.4E-04 -2.4E-03 -3.0E-04 -2.3E-03 -5.1E-03 -6.7E-05 -1.6E-04 -2.7E-04 -2.7E-04 -1.6E-04 -1.3E-04 3.6E-04 6.5E-04 8.7E-04 1.2E-03 5.9E-08
Inorganic Emissions Acid (calculated as H+) 1.7E-05 9.7E-07 -3.4E-03 -5.5E-03 -5.5E-03 -5.5E-03 -2.4E-02 -2.2E-02 -1.9E-02 -2.4E-02 -2.1E-02 -2.0E-02 -2.5E-02 -2.1E-02 -2.0E-02 3.3E-04
Aluminum 1.5E-02 -4.9E-04 -1.9E-03 1.3E-02 1.1E-02 1.2E-02 7.6E-03 7.9E-03 8.5E-03 7.6E-03 8.2E-03 1.3E-02 1.7E-02 1.4E-02 1.6E-02 1.7E-04

LCA of Management Options for Mixed Waste Plastics 92
A B C D E F G H I J K L M N O P Ammonium / ammonia 8.7E-02 2.0E-03 -1.6E-03 6.0E-02 5.9E-02 6.1E-02 5.8E-02 5.9E-02 6.0E-02 5.8E-02 6.0E-02 6.3E-02 6.1E-02 6.3E-02 6.3E-02 -4.7E+02
Barium 5.8E-04 4.6E-04 -4.2E-05 -6.5E-03 -1.7E-02 6.9E-04 1.3E-04 1.1E-04 1.7E-04 1.3E-04 2.1E-04 7.6E-04 6.9E-04 8.7E-04 9.4E-04 6.4E-05
Beryllium 5.7E-07 3.3E-07 2.3E-07 4.4E-07 4.4E-07 4.3E-07 4.4E-07 4.4E-07 4.5E-07 4.4E-07 4.5E-07 4.7E-07 4.7E-07 4.9E-07 5.0E-07 -2.6E-01
Boron 3.9E-04 1.3E-04 -4.9E-03 3.4E-04 2.8E-04 3.7E-04 3.8E-04 3.7E-04 3.6E-04 3.8E-04 3.8E-04 4.1E-04 4.5E-04 4.9E-04 5.3E-04 -5.7E-05
Bromate 9.1E-07 6.8E-03 1.1E-03 3.9E-04 3.9E-04 4.0E-04 4.0E-04 4.5E-04 5.4E-04 4.0E-04 4.8E-04 1.1E-03 1.1E-03 1.1E-03 1.1E-03 2.7E-04
Bromine 2.3E-03 6.7E-02 5.9E-02 3.3E-03 -8.6E-03 9.1E-03 7.5E-03 7.8E-03 8.3E-03 7.5E-03 8.1E-03 1.0E-02 9.6E-03 1.1E-02 1.1E-02 -2.2E-04
Calcium 1.9E-02 9.3E-02 -9.4E-01 -3.9E-01 -7.7E-01 -1.3E-01 -1.5E-01 -1.4E-01 -1.2E-01 -1.5E-01 -1.3E-01 3.9E-02 4.1E-02 5.4E-02 6.4E-02 4.6E-05
Carbonate 1.7E-05 9.4E-05 -4.2E-01 -3.5E-01 -3.5E-01 -3.5E-01 -3.6E-01 -3.3E-01 -2.9E-01 -3.6E-01 -3.2E-01 -1.1E-02 -1.3E-02 -1.1E-02 -1.1E-02 -4.1E-02
Chlorate 4.5E-02 1.2E-01 -1.8E-01 -1.4E+00 -3.5E+00 -4.0E-02 -1.5E-01 -1.4E-01 -1.2E-01 -1.5E-01 -1.2E-01 1.2E-01 1.0E-01 1.3E-01 1.5E-01 2.9E-03
Chloride 1.8E+00 5.3E+01 -1.3E+01 -2.7E+00 -7.5E+00 -8.4E+00 1.8E-01 7.6E-01 2.0E+00 1.8E-01 1.3E+00 1.0E+01 1.0E+01 1.1E+01 1.1E+01 8.8E-04
Chlorine (dissolved) 1.8E-06 7.1E-06 -6.3E-05 1.2E-05 -5.3E-05 -8.4E-05 -5.3E-05 -5.4E-05 -4.9E-05 -5.3E-05 -4.7E-05 1.1E-05 3.0E-04 2.0E-05 1.8E-04 -1.5E-03
Cyanide 2.7E-05 -1.8E-05 -1.6E-04 -2.7E-04 -3.1E-04 -1.5E-04 -2.2E-04 -2.1E-04 -1.9E-04 -2.2E-04 -1.9E-04 -8.1E-05 -9.9E-05 -7.3E-05 -6.1E-05 4.8E-05
Fluoride 6.4E-05 1.2E-03 -4.6E-03 -8.0E-04 -1.5E-03 -1.7E-03 -1.6E-03 -1.4E-03 -1.4E-03 -1.6E-03 -1.4E-03 -7.7E-03 -9.5E-03 -7.9E-03 -7.5E-03 2.7E-07
Hydrogen sulphide 3.2E-07 2.2E-07 -1.9E-06 -2.6E-06 -2.7E-06 -1.5E-06 -1.3E-06 -1.4E-06 -1.3E-06 -1.3E-06 -1.1E-06 5.7E-07 9.4E-07 1.3E-06 1.8E-06 -3.9E+00
Hydroxide 6.5E-08 1.2E-06 -7.4E-07 -1.4E-06 -1.6E-06 -1.4E-06 -1.1E-06 -1.1E-06 -9.8E-07 -1.1E-06 -9.5E-07 2.6E-07 2.8E-07 3.0E-07 3.2E-07 4.3E-03
Hypochlorite 8.7E-07 4.7E-05 -1.9E-05 -2.8E-05 -2.4E-05 -3.5E-05 -1.7E-05 -2.3E-05 -2.1E-05 -1.7E-05 -1.3E-05 3.1E-05 4.7E-05 5.9E-05 7.5E-05 1.4E-04
Iodide 4.1E-05 5.1E-05 -2.4E-05 -7.7E-04 -2.0E-03 6.1E-05 -2.0E-06 -4.2E-06 1.9E-06 -2.0E-06 6.7E-06 7.2E-05 6.5E-05 8.5E-05 9.3E-05 1.5E-05
Magnesium 2.8E-02 3.9E-03 -1.6E-01 -4.0E-02 -4.4E-02 2.5E-02 2.3E-02 2.2E-02 2.2E-02 2.3E-02 2.4E-02 2.6E-02 2.7E-02 2.9E-02 2.9E-02 5.8E-09
Metal ions (unspecific) 2.8E-04 7.1E-06 -1.9E-05 1.3E-04 1.2E-04 1.2E-04 1.3E-04 1.4E-04 1.4E-04 1.3E-04 1.4E-04 1.5E-04 1.3E-04 1.5E-04 1.5E-04 4.5E-09
Nitrate 3.2E-01 4.1E-02 -4.8E-02 2.3E-01 2.2E-01 2.3E-01 2.2E-01 2.2E-01 2.3E-01 2.2E-01 2.3E-01 2.5E-01 2.4E-01 2.5E-01 2.5E-01 9.4E-03
Nitrite 1.8E-03 1.1E-04 3.0E-06 1.3E-03 1.3E-03 1.3E-03 1.3E-03 1.3E-03 1.3E-03 1.3E-03 1.3E-03 1.4E-03 1.4E-03 1.4E-03 1.4E-03 1.9E-05
Nitrogen 2.4E-03 8.3E-04 -5.2E-04 4.8E-04 -4.7E-05 7.8E-04 -7.6E-04 -6.3E-04 -3.9E-04 -7.6E-04 -4.1E-04 -9.6E-04 -1.5E-03 -7.2E-04 -4.0E-04 -5.6E+00
Nitrogen organic bounded 3.7E-05 1.0E-04 -1.4E-04 -1.8E-03 -1.5E-03 -1.7E-04 -1.9E-04 -1.9E-04 -1.7E-04 -1.9E-04 -1.6E-04 7.6E-05 8.0E-05 1.0E-04 1.1E-04 1.8E-06
Phosphate 7.6E-05 5.7E-04 1.2E-05 -3.4E-04 -1.6E-04 2.0E-05 4.5E-06 9.1E-06 2.5E-05 4.5E-06 2.3E-05 1.4E-04 1.4E-04 1.5E-04 1.5E-04 -3.9E+00
Phosphorus 2.8E-06 3.4E-05 -4.8E-04 -4.8E-04 -5.4E-04 -4.3E-04 -8.8E-04 -8.1E-04 -7.1E-04 -8.8E-04 -7.7E-04 -1.9E-04 -2.3E-04 -1.9E-04 -1.8E-04 -2.6E+00
Potassium 8.5E-03 1.1E-02 -6.5E-02 -7.4E-02 -1.3E-01 -3.9E-02 -6.3E-02 -5.9E-02 -5.1E-02 -6.3E-02 -5.4E-02 -2.7E-02 -3.5E-02 -2.5E-02 -2.2E-02 8.1E-06
Rubidium 4.1E-06 5.0E-06 -7.6E-07 -7.6E-05 -2.0E-04 6.4E-06 -2.5E-08 -2.5E-07 3.4E-07 -2.5E-08 8.2E-07 7.2E-06 6.6E-06 8.6E-06 9.4E-06 -2.9E-05
Scandium 4.4E-08 1.9E-06 -3.3E-05 -3.5E-07 7.8E-07 -1.3E-06 3.8E-07 -2.0E-07 -2.5E-07 3.8E-07 4.9E-07 2.5E-06 4.0E-06 5.0E-06 6.6E-06 -9.3E-11
Sodium 2.2E-01 4.7E-01 -2.5E+00 -4.5E+00 -8.2E+00 -1.9E+00 -2.2E+00 -2.1E+00 -1.8E+00 -2.2E+00 -1.9E+00 1.2E-01 4.3E-02 1.5E-01 1.8E-01 2.0E-05
Sulphate 3.5E-02 6.6E-01 -6.8E-01 -2.2E-01 -2.4E-01 -4.8E-01 -1.8E-01 -1.7E-01 -1.4E-01 -1.8E-01 -1.4E-01 1.1E-01 1.2E-01 1.6E-01 1.9E-01 6.5E-05
Sulphide 2.1E-06 4.3E-06 -2.9E-05 -8.5E-05 -8.6E-05 -6.5E-05 -5.5E-04 -4.9E-04 -4.7E-04 -5.5E-04 -4.8E-04 -1.9E-03 -2.4E-03 -2.0E-03 -1.9E-03 2.9E-05
Sulphite 2.3E-06 1.2E-04 -1.6E-03 -4.9E-05 -3.0E-05 -7.2E-05 -2.0E-05 -4.0E-05 -3.8E-05 -2.0E-05 -1.1E-05 9.8E-05 1.5E-04 1.9E-04 2.5E-04 3.2E-08
Sulphur 5.1E-05 -1.9E-05 -9.1E-06 -1.4E-03 -3.7E-03 1.1E-04 -5.2E-07 -1.0E-05 -3.2E-06 -5.2E-07 1.1E-05 1.3E-04 1.3E-04 1.7E-04 1.9E-04 -3.5E-07

LCA of Management Options for Mixed Waste Plastics 93
A B C D E F G H I J K L M N O P Organic Emissions
Chlorous dissolvent 9.5E-08 1.6E-05 -6.5E-05 -8.5E-05 -8.3E-05 -8.3E-05 -8.3E-05 -7.9E-05 -6.9E-05 -8.3E-05 -7.3E-05 2.5E-06 2.4E-06 2.6E-06 2.5E-06 -6.2E-02
Dichloroethane 1.2E-08 2.0E-07 -8.5E-06 -3.3E-05 -3.3E-05 -3.3E-05 -3.3E-05 -3.3E-05 -2.9E-05 -3.3E-05 -2.9E-05 1.2E-07 1.8E-07 2.2E-07 2.8E-07 8.7E-09
Dichloromethane 4.0E-06 -3.5E-05 -1.2E-06 -9.7E-05 -2.4E-04 1.7E-06 -5.9E-06 -6.4E-06 -5.8E-06 -5.9E-06 -5.1E-06 4.7E-06 4.7E-06 6.2E-06 6.9E-06 8.9E-04
Trichloromethane 7.4E-15 2.8E-14 -1.8E-13 1.6E-13 -9.2E-14 -1.9E-13 -8.1E-14 -8.1E-14 -7.3E-14 -8.1E-14 -7.0E-14 2.1E-14 1.1E-12 2.7E-14 6.2E-13 2.7E-12
Vinyl chloride 7.2E-09 6.9E-08 -2.5E-04 -2.3E-04 -2.3E-04 -2.3E-04 -2.3E-04 -2.1E-04 -1.9E-04 -2.3E-04 -2.0E-04 1.5E-08 1.5E-08 1.6E-08 1.7E-08 5.6E-04
Acenaphthene 2.5E-09 3.0E-09 -4.5E-10 -4.7E-08 -1.2E-07 4.0E-09 -4.3E-11 -1.6E-10 2.1E-10 -4.3E-11 4.8E-10 4.4E-09 3.9E-09 5.1E-09 5.5E-09 4.3E-06
Acenaphthylene 1.6E-10 1.9E-10 -2.8E-11 -3.0E-09 -7.8E-09 2.5E-10 -2.7E-12 -1.0E-11 1.3E-11 -2.7E-12 3.0E-11 2.8E-10 2.4E-10 3.2E-10 3.5E-10 3.3E-08
Acetic acid 4.2E-07 3.7E-06 1.7E-06 -4.4E-06 -8.0E-06 -1.7E-06 -1.5E-06 -1.5E-06 -1.2E-06 -1.5E-06 -1.2E-06 8.1E-07 8.1E-07 9.7E-07 1.1E-06 -2.5E-03
Alkane (unspecified) 5.3E-05 6.3E-05 -9.4E-06 -9.9E-04 -2.6E-03 8.4E-05 -9.1E-07 -3.4E-06 4.4E-06 -9.1E-07 1.0E-05 9.2E-05 8.2E-05 1.1E-04 1.2E-04 3.4E-05
Alkene (unspecified) 4.9E-06 5.8E-06 -8.7E-07 -9.2E-05 -2.4E-04 7.7E-06 -8.4E-08 -3.1E-07 4.1E-07 -8.4E-08 9.2E-07 8.5E-06 7.6E-06 9.8E-06 1.1E-05 7.5E-05
Aromatic hydrocarbons
(unspecified) 2.2E-04 1.8E-04 -3.4E-05 -4.1E-03 -1.1E-02 3.4E-04 4.0E-07 -1.3E-05 1.7E-05 4.0E-07 4.4E-05 3.8E-04 3.5E-04 4.6E-04 5.0E-04 2.4E-06
Benzene 3.2E-05 7.1E-05 2.3E-05 -6.0E-04 -1.5E-03 1.1E-05 -3.5E-05 -3.6E-05 -2.8E-05 -3.5E-05 -2.4E-05 5.6E-05 5.0E-05 6.5E-05 7.0E-05 1.8E-05
Butene 1.2E-10 9.1E-09 -1.1E-08 -2.0E-09 -1.9E-09 -2.7E-09 -1.0E-09 -1.5E-09 -1.3E-09 -1.0E-09 -6.2E-10 3.1E-09 5.3E-09 5.4E-09 7.3E-09 3.0E-08
Ethene 3.8E-06 1.5E-05 1.1E-05 -7.5E-05 -1.9E-04 4.7E-06 -1.2E-06 -1.4E-06 -6.0E-07 -1.2E-06 -9.5E-08 7.6E-06 6.9E-06 9.1E-06 1.0E-05 4.4E-11
Ethyl benzene 7.7E-06 8.2E-06 -1.1E-06 -1.2E-04 -3.2E-04 1.1E-05 2.9E-07 2.9E-08 1.0E-06 2.9E-07 1.7E-06 1.2E-05 1.1E-05 1.4E-05 1.5E-05 1.1E-04
Ethylene oxide 5.1E-04 1.7E-04 -1.2E-04 -1.5E-02 -3.8E-02 1.1E-03 -8.5E-05 -1.6E-04 -7.1E-05 -8.5E-05 4.7E-05 1.2E-03 1.2E-03 1.5E-03 1.7E-03 1.7E-04
Fatty acids (calculated as
total carbon) 1.2E-03 1.3E-03 -1.6E-04 -1.9E-02 -4.9E-02 1.6E-03 4.5E-05 4.2E-06 1.6E-04 4.5E-05 2.6E-04 1.8E-03 1.6E-03 2.1E-03 2.3E-03 2.9E-04
Formaldehyde 3.1E-07 2.1E-06 1.3E-06 -2.1E-04 -2.1E-04 -2.0E-04 -2.0E-04 -2.0E-04 -1.8E-04 -2.0E-04 -1.8E-04 4.9E-07 4.9E-07 6.1E-07 6.9E-07 -1.2E-04
Glutaraldehyde 1.2E-07 -6.3E-06 3.6E-07 -3.2E-06 -8.2E-06 4.0E-07 3.7E-07 4.7E-08 -8.2E-08 3.7E-07 2.9E-07 7.1E-07 1.5E-06 1.9E-06 -3.4E-02 4.9E-05
Hydrocarbons
(unspecified) 5.0E-05 -9.3E-04 -3.5E-03 -5.5E-02 -5.5E-02 -5.4E-02 -9.1E-02 -8.7E-02 -7.9E-02 -9.1E-02 -8.1E-02 -3.4E-02 -4.1E-02 -3.5E-02 4.0E-04 3.0E-08
Methanol 2.0E-07 -2.4E-04 -1.5E-06 -1.0E-04 -9.7E-05 -9.4E-05 -9.3E-05 -9.5E-05 -9.0E-05 -9.3E-05 -8.7E-05 -1.9E-05 -1.4E-05 -1.8E-05 -1.8E-05 4.0E-07
Methyl tert-butylether 5.9E-07 9.3E-07 -2.2E-07 -1.7E-05 -4.4E-05 1.3E-06 -1.3E-07 -1.8E-07 -6.4E-08 -1.3E-07 3.8E-08 1.4E-06 1.2E-06 1.6E-06 1.8E-02 -2.5E+00
Oil (unspecified) 2.0E-02 2.1E-02 -9.2E-03 -5.2E-01 -1.4E+00 3.8E-02 -2.7E-02 -2.8E-02 -2.3E-02 -2.7E-02 -1.9E-02 2.1E-02 1.4E-02 3.5E-02 2.6E-02 9.1E-04
Phenol 3.9E-05 4.6E-05 -1.3E-04 -1.0E-03 -2.2E-03 -1.9E-04 -1.5E-03 -1.4E-03 -1.3E-03 -1.5E-03 -1.4E-03 -1.6E-03 -1.9E-03 -1.6E-03 3.8E-05 2.9E-06
Polycyclic aromatic
hydrocarbons (unspec.) 2.6E-06 4.3E-06 -1.1E-06 -5.4E-05 -1.2E-04 -2.2E-06 -5.7E-06 -5.8E-06 -4.9E-06 -5.7E-06 -4.5E-06 4.7E-06 4.3E-06 5.5E-06 7.3E-06 -2.3E-04
Propene 2.8E-06 1.8E-05 1.0E-05 -4.9E-05 -4.6E-05 -1.8E-05 -1.9E-05 -1.9E-05 -1.7E-05 -1.9E-05 -1.6E-05 4.1E-06 3.9E-06 4.7E-06 7.4E-07 5.0E-05
Propylene oxide 1.0E-06 1.0E-06 1.4E-07 -1.0E-05 -2.3E-06 -5.3E-07 -5.1E-07 -4.8E-07 -3.3E-07 -5.1E-07 -3.3E-07 6.8E-07 6.1E-07 7.1E-07 3.7E-08 8.7E-09
Sodium formate 5.5E-10 2.1E-07 8.9E-09 -1.0E-08 -1.1E-09 -3.6E-09 -2.2E-10 9.2E-10 4.7E-09 -2.2E-10 3.7E-09 3.4E-08 3.5E-08 3.7E-08 7.1E-05 -1.6E-06
Toluene 5.1E-05 6.0E-05 -7.3E-06 -9.7E-04 -2.5E-03 8.3E-05 3.4E-07 -2.0E-06 5.4E-06 3.4E-07 1.1E-05 8.9E-05 7.9E-05 1.0E-04 9.9E-05 2.9E-07

LCA of Management Options for Mixed Waste Plastics 94
A B C D E F G H I J K L M N O P Triethylene glycol 1.1E-07 -2.0E-04 -1.5E-06 -3.6E-05 -2.9E-05 -2.8E-05 -2.7E-05 -2.8E-05 -2.9E-05 -2.7E-05 -2.8E-05 -1.6E-05 -1.1E-05 -1.5E-05 -3.0E-06 1.3E-08
Xylene 4.1E-05 4.8E-05 -7.5E-06 -7.8E-04 -2.1E-03 6.5E-05 -1.2E-06 -3.2E-06 2.9E-06 -1.2E-06 7.3E-06 7.2E-05 6.4E-05 8.3E-05 3.2E-05 3.5E-04
Cumene 5.6E-06 4.6E-05 2.8E-05 -1.1E-04 -1.2E-04 -4.9E-05 -5.0E-05 -5.0E-05 -4.4E-05 -5.0E-05 -4.3E-05 9.7E-06 9.2E-06 1.1E-05 2.5E-04 8.9E-04
Ethylenediamine 4.9E-11 9.7E-11 -1.1E-09 -2.7E-10 -1.0E-10 -2.6E-10 -1.1E-10 -1.2E-10 -1.0E-10 -1.1E-10 -8.7E-11 8.2E-11 1.1E-10 1.4E-10 0.0E+00 6.0E-06
VOC 1.4E-04 1.8E-04 -2.7E-05 -2.7E-03 -7.0E-03 2.2E-04 5.2E-07 -8.7E-06 1.2E-05 5.2E-07 3.0E-05 2.6E-04 2.4E-04 3.1E-04 9.6E-05 -1.3E+00
Analytical Measures Adsorbable organic
halogen compounds 3.1E-07 8.6E-07 -1.6E-04 -1.4E-04 -1.5E-04 -1.3E-04 -1.3E-04 -1.2E-04 -1.1E-04 -1.3E-04 -1.2E-04 1.0E-06 1.3E-06 1.6E-06 2.0E-06 -2.8E-01
Biological oxygen demand 1.4E-01 9.2E-02 -1.3E-02 -1.7E+00 -4.4E+00 4.0E-02 -1.1E-01 -1.2E-01 -9.4E-02 -1.1E-01 -7.6E-02 1.4E-01 1.2E-01 1.8E-01 2.2E-01 1.8E+00
Chemical oxygen demand 2.9E-01 1.2E-01 -2.2E-02 -1.1E+01 -1.3E+01 -8.9E+00 -9.1E+00 -9.1E+00 -8.3E+00 -9.1E+00 -8.0E+00 2.1E-01 1.8E-01 2.6E-01 2.9E-01 -4.8E+02
Solids (dissolved) 4.1E-03 1.3E-01 -6.0E-01 -3.8E-01 -3.6E-01 -4.3E-01 -3.9E-01 -3.7E-01 -3.2E-01 -3.9E-01 -3.4E-01 -1.2E-01 -1.5E-01 -1.1E-01 -1.0E-01 3.1E-04
Solids (suspended) 5.6E-03 -1.8E-01 -1.0E-01 -2.3E-01 -3.8E-01 -1.1E-01 -3.3E-01 -3.1E-01 -2.9E-01 -3.3E-01 -3.0E-01 -8.6E-01 -1.0E+00 -8.5E-01 7.5E-02 0.0E+00
Total dissolved organic
bounded carbon 7.6E-02 4.0E-02 5.5E-03 -5.0E-01 -1.3E+00 3.9E-02 -1.1E-03 -2.8E-03 4.9E-03 -1.1E-03 9.7E-03 8.1E-02 7.8E-02 9.6E-02 1.1E-01 5.2E-07
Total organic bounded
carbon 7.8E-02 4.0E-02 4.9E-03 -5.0E-01 -1.3E+00 4.0E-02 -1.9E-04 -1.8E-03 6.0E-03 -1.9E-04 1.1E-02 8.3E-02 7.9E-02 9.7E-02 1.1E-01 5.6E-06

LCA of Management Options for Mixed Waste Plastics 95
Material emissions, discharged as solid, kg/tonne waste
A
- L
andf
ill
B -
In
cine
rati
on
C -
SR
F
D -
BP
py
roly
sis
E -
Ozm
otec
h py
roly
sis
F -
Red
ox
agen
t
G -
Sta
dler
&
Tite
ch
H -
Sta
dler
&
Pel
lenc
I -
Stad
ler
&
Qin
etiq
J -
Stad
ler
&
Sim
s
K -
KM
E &
Ti
tech
L -
Stad
ler
&
TLT
M -
Sw
iss
Pol
ymer
a
N -
B+
B
O -
Her
bold
P -
Flo
ttw
eg
Heavy Metals Antimony 2.0E-10 3.5E-11 -2.2E-13 -6.8E-11 -1.1E-11 -8.7E-12 -6.3E-12 5.1E-13 1.8E-11 -6.3E-12 1.5E-11 1.0E-10 9.0E-11 1.0E-10 1.1E-10 1.0E-10
Arsenic 6.3E-08 -5.2E-07 -4.9E-09 -1.5E-06 -3.8E-06 5.0E-08 -6.1E-08 -7.7E-08 -7.1E-08 -6.1E-08 -5.0E-08 1.1E-07 1.3E-07 1.7E-07 2.0E-07 1.3E-07
Cadmium 4.2E-08 1.0E-07 2.7E-08 -2.4E-07 -3.4E-08 -7.5E-08 -5.3E-08 -6.7E-08 -5.9E-08 -5.3E-08 -3.7E-08 9.5E-08 1.3E-07 1.7E-07 2.1E-07 1.3E-07
Chromium (unspecified) 1.2E-06 -3.5E-06 3.8E-07 -3.1E-05 -5.3E-05 -5.8E-06 -7.0E-06 -7.3E-06 -6.6E-06 -7.0E-06 -6.0E-06 2.5E-06 3.0E-06 3.8E-06 4.6E-06 3.1E-06
Chromium +VI 2.8E-06 1.8E-05 -2.7E-06 -2.5E-05 -2.8E-05 -1.8E-05 -1.8E-05 -1.7E-05 -1.5E-05 -1.8E-05 -1.5E-05 5.2E-06 5.5E-06 5.7E-06 5.9E-06 5.7E-06
Cobalt 4.9E-10 1.1E-07 4.1E-08 8.7E-08 1.2E-07 6.5E-08 8.8E-08 6.8E-08 6.0E-08 8.8E-08 8.4E-08 9.4E-08 1.5E-07 1.9E-07 2.4E-07 2.4E-06
Copper 2.5E-06 2.0E-05 -2.4E-07 -4.0E-05 -3.1E-05 -2.5E-05 -2.4E-05 -2.4E-05 -2.1E-05 -2.4E-05 -2.1E-05 5.7E-06 6.3E-06 6.9E-06 7.6E-06 4.1E-04
Iron 4.4E-04 5.9E-03 -2.5E-02 -1.4E-02 -2.6E-02 -1.1E-02 -6.7E-03 -6.9E-03 -6.1E-03 -6.7E-03 -5.7E-03 2.5E-03 2.9E-03 3.5E-03 4.0E-03 2.5E-03
Lead 2.2E-07 1.7E-06 3.2E-07 -3.2E-06 -1.4E-06 -1.6E-06 -1.5E-06 -1.5E-06 -1.3E-06 -1.5E-06 -1.2E-06 6.6E-07 8.3E-07 1.0E-06 1.2E-06 1.3E-04
Manganese 6.8E-06 -3.6E-05 2.8E-05 -6.3E-05 -2.5E-04 6.9E-05 8.3E-05 5.8E-05 4.9E-05 8.3E-05 7.8E-05 9.5E-05 1.5E-04 2.0E-04 2.6E-04 8.5E-06
Mercury 4.0E-11 1.7E-08 1.6E-09 1.1E-09 1.4E-09 8.6E-10 1.3E-09 1.2E-09 1.4E-09 1.3E-09 1.5E-09 3.1E-09 3.4E-09 3.8E-09 4.1E-09 3.4E-08
Molybdenum 1.3E-10 6.0E-08 1.4E-08 2.0E-08 2.7E-08 1.6E-08 2.0E-08 1.6E-08 1.5E-08 2.0E-08 2.0E-08 2.5E-08 3.6E-08 4.5E-08 5.6E-08 6.7E-07
Nickel 3.6E-07 2.1E-06 3.5E-07 -8.4E-06 -4.4E-06 -4.5E-06 -4.4E-06 -4.4E-06 -4.0E-06 -4.4E-06 -3.8E-06 7.5E-07 8.9E-07 1.0E-06 1.2E-06 2.1E-07
Silver 1.1E-09 4.6E-08 5.5E-09 -2.4E-07 -1.4E-07 -1.4E-07 -1.4E-07 -1.4E-07 -1.3E-07 -1.4E-07 -1.2E-07 7.8E-09 7.7E-09 8.2E-09 8.1E-09 1.1E-08
Strontium 1.6E-06 -1.4E-05 -4.8E-07 -3.9E-05 -9.6E-05 6.4E-07 -2.3E-06 -2.6E-06 -2.3E-06 -2.3E-06 -2.0E-06 1.9E-06 1.9E-06 2.5E-06 2.7E-06 2.2E-06
Tin 5.9E-10 2.4E-07 3.6E-08 1.3E-08 1.3E-08 1.4E-08 1.4E-08 1.6E-08 1.9E-08 1.4E-08 1.7E-08 3.9E-08 3.9E-08 4.1E-08 4.0E-08 9.1E-06
Titanium 3.2E-08 1.1E-06 2.0E-06 6.3E-06 8.8E-06 4.6E-06 6.3E-06 4.7E-06 4.0E-06 6.3E-06 5.9E-06 6.0E-06 1.0E-05 1.3E-05 1.7E-05 2.6E-07
Vanadium 9.2E-10 3.1E-08 5.8E-08 1.8E-07 2.5E-07 1.3E-07 1.8E-07 1.3E-07 1.1E-07 1.8E-07 1.7E-07 1.7E-07 2.9E-07 3.7E-07 5.0E-07 1.3E-05
Zinc 3.5E-05 2.6E-05 5.8E-06 -1.7E-04 -1.6E-04 -2.1E-05 -2.1E-05 -2.2E-05 -1.7E-05 -2.1E-05 -1.4E-05 3.3E-05 3.6E-05 4.3E-05 5.0E-05 3.7E-04
Antimony 2.0E-10 3.5E-11 -2.2E-13 -6.8E-11 -1.1E-11 -8.7E-12 -6.3E-12 5.1E-13 1.8E-11 -6.3E-12 1.5E-11 1.0E-10 9.0E-11 1.0E-10 1.1E-10 1.0E-10
Arsenic 6.3E-08 -5.2E-07 -4.9E-09 -1.5E-06 -3.8E-06 5.0E-08 -6.1E-08 -7.7E-08 -7.1E-08 -6.1E-08 -5.0E-08 1.1E-07 1.3E-07 1.7E-07 2.0E-07 1.3E-07
Cadmium 4.2E-08 1.0E-07 2.7E-08 -2.4E-07 -3.4E-08 -7.5E-08 -5.3E-08 -6.7E-08 -5.9E-08 -5.3E-08 -3.7E-08 9.5E-08 1.3E-07 1.7E-07 2.1E-07 1.3E-07
Chromium (unspecified) 1.2E-06 -3.5E-06 3.8E-07 -3.1E-05 -5.3E-05 -5.8E-06 -7.0E-06 -7.3E-06 -6.6E-06 -7.0E-06 -6.0E-06 2.5E-06 3.0E-06 3.8E-06 4.6E-06 3.1E-06
Chromium +VI 2.8E-06 1.8E-05 -2.7E-06 -2.5E-05 -2.8E-05 -1.8E-05 -1.8E-05 -1.7E-05 -1.5E-05 -1.8E-05 -1.5E-05 5.2E-06 5.5E-06 5.7E-06 5.9E-06 5.7E-06
Cobalt 4.9E-10 1.1E-07 4.1E-08 8.7E-08 1.2E-07 6.5E-08 8.8E-08 6.8E-08 6.0E-08 8.8E-08 8.4E-08 9.4E-08 1.5E-07 1.9E-07 2.4E-07 2.4E-06
Copper 2.5E-06 2.0E-05 -2.4E-07 -4.0E-05 -3.1E-05 -2.5E-05 -2.4E-05 -2.4E-05 -2.1E-05 -2.4E-05 -2.1E-05 5.7E-06 6.3E-06 6.9E-06 7.6E-06 4.1E-04

LCA of Management Options for Mixed Waste Plastics 96
A B C D E F G H I J K L M N O P Iron 4.4E-04 5.9E-03 -2.5E-02 -1.4E-02 -2.6E-02 -1.1E-02 -6.7E-03 -6.9E-03 -6.1E-03 -6.7E-03 -5.7E-03 2.5E-03 2.9E-03 3.5E-03 4.0E-03 2.5E-03
Lead 2.2E-07 1.7E-06 3.2E-07 -3.2E-06 -1.4E-06 -1.6E-06 -1.5E-06 -1.5E-06 -1.3E-06 -1.5E-06 -1.2E-06 6.6E-07 8.3E-07 1.0E-06 1.2E-06 1.3E-04
Manganese 6.8E-06 -3.6E-05 2.8E-05 -6.3E-05 -2.5E-04 6.9E-05 8.3E-05 5.8E-05 4.9E-05 8.3E-05 7.8E-05 9.5E-05 1.5E-04 2.0E-04 2.6E-04 8.5E-06
Mercury 4.0E-11 1.7E-08 1.6E-09 1.1E-09 1.4E-09 8.6E-10 1.3E-09 1.2E-09 1.4E-09 1.3E-09 1.5E-09 3.1E-09 3.4E-09 3.8E-09 4.1E-09 3.4E-08
Molybdenum 1.3E-10 6.0E-08 1.4E-08 2.0E-08 2.7E-08 1.6E-08 2.0E-08 1.6E-08 1.5E-08 2.0E-08 2.0E-08 2.5E-08 3.6E-08 4.5E-08 5.6E-08 6.7E-07
Inorganic Emissions
Aluminum 1.6E-04 -1.2E-03 1.2E-05 -3.7E-03 -9.4E-03 1.4E-04 -1.3E-04 -1.7E-04 -1.6E-04 -1.3E-04 -9.8E-05 3.1E-04 3.7E-04 4.7E-04 5.6E-04 2.1E-04
Barium 7.9E-05 -6.9E-04 -2.3E-05 -1.9E-03 -4.8E-03 3.3E-05 -1.2E-04 -1.3E-04 -1.2E-04 -1.2E-04 -1.0E-04 9.3E-05 9.2E-05 1.2E-04 1.4E-04 1.3E-04
Chlorine 8.2E-03 2.6E-03 1.0E-03 -3.2E-02 -3.7E-02 -2.7E-03 -3.2E-03 -3.0E-03 -2.0E-03 -3.2E-03 -1.9E-03 5.4E-03 4.9E-03 5.8E-03 6.1E-03 5.6E-03
Fluoride 9.7E-06 -5.6E-05 -4.1E-06 -2.1E-04 -5.0E-04 -9.1E-06 -2.4E-05 -2.4E-05 -2.2E-05 -2.4E-05 -2.0E-05 1.3E-05 1.3E-05 1.6E-05 1.4E-04 1.1E-04
Phosphorus 8.1E-06 -6.1E-05 1.2E-05 -1.5E-04 -4.2E-04 3.6E-05 3.3E-05 2.1E-05 1.7E-05 3.3E-05 3.2E-05 5.2E-05 8.1E-05 1.0E-04 1.6E-04 5.0E-02
Sulphur 9.5E-05 -6.3E-04 1.4E-05 -2.3E-03 -5.7E-03 8.1E-05 -8.7E-05 -1.1E-04 -9.7E-05 -8.7E-05 -6.8E-05 1.8E-04 2.1E-04 2.7E-04 5.9E-02 5.5E-04
Organic Emissions
Carbon (unspecified) 4.7E-04 -2.0E-03 1.9E-04 -1.1E-02 -2.9E-02 3.4E-04 -5.3E-04 -6.0E-04 -5.0E-04 -5.3E-04 -4.1E-04 9.5E-04 9.8E-04 1.2E-03 8.2E-04 5.0E-02
Metaldehyde 9.5E-11 4.1E-10 -3.9E-09 -1.1E-09 -5.7E-10 -1.9E-09 -9.4E-10 -9.3E-10 -8.3E-10 -9.4E-10 -8.0E-10 -1.3E-10 -1.3E-10 2.0E-11 5.9E-02 3.2E-03
Oil (unspecified) 1.9E-02 3.1E-02 -6.5E-03 -5.6E-01 -1.5E+00 4.2E-02 -4.3E-03 -6.0E-03 -2.2E-03 -4.3E-03 1.2E-03 4.6E-02 4.1E-02 5.4E-02 6.1E-03 2.2E-04
Other Emissions
Pesticides to agricultural
soil 5.0E-07 5.0E-06 -2.6E-05 -6.3E-06 -4.7E-06 -1.0E-05 -5.2E-06 -5.3E-06 -4.7E-06 -5.2E-06 -4.4E-06 1.0E-06 1.4E-06 2.0E-06 5.9E-03 1.1E-06
Other pollutants 1.2E-03 -8.5E-03 4.9E-04 -2.6E-02 -6.6E-02 2.0E-03 4.5E-04 -2.3E-04 -2.8E-04 4.5E-04 5.7E-04 3.5E-03 4.9E-03 6.3E-03 2.0E-03 1.6E-03
Solid Waste 1.0E+03 4.9E+01 5.2E+01 4.9E+02 4.6E+02 4.2E+02 4.3E+02 4.6E+02 5.0E+02 4.3E+02 4.8E+02 4.9E+02 4.1E+02 4.8E+02 4.9E+02 4.8E+02

LCA of Management Options for Mixed Waste Plastics 97
Resource consumption, material resources, kg/tonne waste
A
- L
andf
ill
B -
In
cine
rati
on
C -
SR
F
D -
BP
py
roly
sis
E -
Ozm
otec
h py
roly
sis
F -
Red
ox
agen
t
G -
Sta
dler
&
Tite
ch
H -
Sta
dler
&
Pel
lenc
I -
Stad
ler
&
Qin
etiq
J -
Stad
ler
&
Sim
s
K -
KM
E &
Ti
tech
L -
Stad
ler
&
TLT
M -
Sw
iss
Pol
ymer
a
N -
B+
B
O -
Her
bold
P -
Flo
ttw
eg
Non-renewable Elements
Aluminum 6.5E-03 1.8E-02 -7.4E-02 -1.1E-01 -7.4E-02 -8.0E-02 -7.6E-01 -6.7E-01 -6.6E-01 -7.6E-01 -6.7E-01 -3.7E+00 -4.5E+00 -3.8E+00 -3.7E+00 -3.7E+00
Chromium 5.2E-03 2.2E-02 -3.3E-03 -1.3E-01 -8.1E-02 -8.0E-02 -7.8E-02 -7.8E-02 -7.0E-02 -7.8E-02 -6.8E-02 8.2E-03 9.2E-03 1.0E-02 1.2E-02 9.2E-03
Cobalt 1.2E-07 -2.4E-05 1.7E-07 -1.8E-06 -1.0E-05 -1.4E-06 -1.7E-06 -1.9E-06 -2.1E-06 -1.7E-06 -1.9E-06 -1.7E-06 -1.3E-06 -1.6E-06 -1.7E-06 -1.7E-06
Copper 1.9E-03 1.4E-02 -2.0E-02 -9.5E-02 -6.1E-02 -5.9E-02 -5.7E-02 -5.7E-02 -5.1E-02 -5.7E-02 -5.0E-02 5.1E-03 6.0E-03 6.5E-03 7.3E-03 5.8E-03
Fluorine 2.6E-05 7.2E-04 1.4E-04 -1.1E-03 -1.6E-03 -3.3E-04 -3.5E-04 -3.6E-04 -3.1E-04 -3.5E-04 -2.9E-04 2.0E-04 2.1E-04 2.4E-04 2.5E-04 2.1E-04
Iron 3.5E-01 -3.6E-01 -2.1E+00 -2.7E+00 -3.2E+00 -1.5E+00 -1.6E+00 -1.5E+00 -1.4E+00 -1.6E+00 -1.3E+00 -1.1E-01 -1.1E-01 3.3E-02 1.6E-01 -2.3E-02
Lead 5.8E-03 5.7E-03 1.2E-04 -2.0E-02 -1.3E-02 -6.8E-03 -6.4E-03 -6.2E-03 -5.1E-03 -6.4E-03 -5.0E-03 4.1E-03 3.9E-03 4.4E-03 4.7E-03 4.3E-03
Magnesium 1.2E-08 3.1E-07 -2.1E-06 -1.0E-06 -6.0E-07 -1.9E-06 -6.2E-07 -6.4E-07 -5.8E-07 -6.2E-07 -5.4E-07 1.0E-07 1.5E-07 2.0E-07 2.6E-07 1.5E-07
Manganese 7.0E-04 3.4E-03 -8.5E-03 -1.3E-02 -9.9E-03 -9.7E-03 -7.9E-03 -7.9E-03 -7.1E-03 -7.9E-03 -6.9E-03 1.2E-03 1.3E-03 1.5E-03 1.8E-03 1.3E-03
Molybdenum 7.6E-04 3.7E-03 -9.3E-03 -1.5E-02 -1.1E-02 -1.1E-02 -9.1E-03 -9.1E-03 -8.2E-03 -9.1E-03 -7.9E-03 1.4E-03 1.5E-03 1.8E-03 2.0E-03 1.6E-03
Nickel 1.5E-02 4.7E-02 -3.8E-02 -3.3E-01 -2.2E-01 -2.0E-01 -1.9E-01 -1.9E-01 -1.7E-01 -1.9E-01 -1.7E-01 1.9E-02 2.1E-02 2.5E-02 2.9E-02 2.2E-02
Palladium 2.0E-08 2.9E-08 -5.5E-09 -8.4E-06 -1.3E-06 4.1E-08 -2.4E-09 -3.8E-09 -3.2E-10 -2.4E-09 2.6E-09 4.3E-08 3.8E-08 5.0E-08 5.4E-08 4.6E-08
Phosphorus 1.1E-04 2.9E-03 5.1E-04 -4.5E-03 -6.3E-03 -1.3E-03 -1.5E-03 -1.5E-03 -1.3E-03 -1.5E-03 -1.2E-03 7.2E-04 9.3E-04 8.8E-04 1.0E-03 9.3E-04
Platinum 6.9E-10 1.4E-09 4.1E-10 -2.6E-07 -3.9E-08 2.4E-09 1.7E-09 1.1E-09 1.1E-09 1.7E-09 1.8E-09 3.3E-09 4.5E-09 5.8E-09 7.4E-09 4.5E-09
Rhenium 2.4E-10 2.9E-10 -1.2E-11 -1.9E-08 -1.3E-08 4.4E-10 4.6E-11 3.7E-11 6.8E-11 4.6E-11 9.1E-11 4.2E-10 3.7E-10 4.8E-10 5.2E-10 4.5E-10
Rhodium 5.4E-10 8.1E-10 -1.5E-10 -2.3E-07 -3.7E-08 1.1E-09 -6.4E-11 -1.0E-10 -7.0E-12 -6.4E-11 7.4E-11 1.2E-09 1.0E-09 1.4E-09 1.5E-09 1.3E-09
Silver 5.8E-09 7.0E-08 -4.5E-08 -8.5E-08 -9.1E-08 -8.4E-08 -6.5E-08 -6.4E-08 -5.7E-08 -6.5E-08 -5.5E-08 1.6E-08 1.8E-08 1.9E-08 2.0E-08 1.8E-08
Sulphur 1.3E-04 9.1E-05 -1.4E-01 -1.1E-01 -1.1E-01 -1.1E-01 -1.5E-01 -1.4E-01 -1.2E-01 -1.5E-01 -1.3E-01 -1.4E-01 -1.7E-01 -1.4E-01 -1.4E-01 -1.4E-01
Tin 6.7E-06 5.6E-05 -7.3E-06 -2.7E-04 -1.6E-04 -1.6E-04 -1.6E-04 -1.6E-04 -1.4E-04 -1.6E-04 -1.4E-04 1.4E-05 1.5E-05 1.7E-05 1.9E-05 1.5E-05
Zinc 1.3E-03 1.4E-02 -8.8E-04 -7.4E-02 -4.5E-02 -4.4E-02 -4.3E-02 -4.3E-02 -3.9E-02 -4.3E-02 -3.8E-02 3.1E-03 3.3E-03 3.4E-03 3.6E-03 3.4E-03

LCA of Management Options for Mixed Waste Plastics 98
A B C D E F G H I J K L M N O P Non-renewable Resources
Antimonite 3.2E-10 8.8E-10 5.7E-11 -2.6E-09 -1.2E-09 -1.3E-09 -1.2E-09 -1.2E-09 -1.1E-09 -1.2E-09 -1.0E-09 4.8E-10 5.9E-10 7.1E-10 8.6E-10 5.8E-10
Barium sulphate 2.6E-02 -2.1E-01 1.9E-02 -6.4E-01 -1.6E+00 2.4E-02 -2.2E-02 -3.1E-02 -2.8E-02 -2.2E-02 -1.8E-02 6.0E-02 7.4E-02 9.2E-02 1.1E-01 7.4E-02
Basalt 2.3E-03 5.5E-02 -5.5E-03 -3.4E-01 -2.1E-01 -2.0E-01 -2.0E-01 -2.0E-01 -1.8E-01 -2.0E-01 -1.8E-01 1.2E-02 1.2E-02 1.3E-02 1.3E-02 1.2E-02
Bentonite 5.9E-03 -1.9E-02 -3.0E-02 -8.3E-02 -1.4E-01 -3.2E-02 -4.1E-02 -4.1E-02 -3.7E-02 -4.1E-02 -3.6E-02 -4.4E-03 -3.2E-03 3.2E-03 8.6E-03 -7.5E-04
Borax 3.1E-07 9.7E-06 -9.6E-07 -5.2E-05 -3.1E-05 -3.1E-05 -3.1E-05 -3.0E-05 -2.8E-05 -3.1E-05 -2.7E-05 2.1E-06 2.3E-06 2.5E-06 2.8E-06 2.3E-06
Chrysotile 1.7E-07 1.3E-03 2.1E-04 7.4E-05 7.4E-05 7.7E-05 7.7E-05 8.5E-05 1.0E-04 7.7E-05 9.2E-05 2.1E-04 2.0E-04 2.1E-04 2.1E-04 2.1E-04
Cinnabar 1.6E-08 1.2E-04 2.0E-05 6.9E-06 6.8E-06 7.1E-06 7.1E-06 7.9E-06 9.4E-06 7.1E-06 8.5E-06 1.9E-05 1.9E-05 2.0E-05 1.9E-05 1.9E-05
Clay 2.5E-01 2.9E+00 -3.2E-02 -7.5E+00 -4.9E+00 -4.7E+00 -4.7E+00 -4.6E+00 -4.2E+00 -4.7E+00 -4.1E+00 1.0E-01 6.4E-02 1.5E-01 2.4E-01 1.8E-01
Colemanite ore 5.5E-04 5.2E-05 -1.2E-05 1.7E-04 1.7E-04 1.8E-04 1.9E-04 2.1E-04 2.3E-04 1.9E-04 2.2E-04 2.7E-04 2.5E-04 2.8E-04 3.0E-04 2.8E-04
Diatomite 3.1E-09 8.4E-09 5.5E-10 -2.5E-08 -1.2E-08 -1.3E-08 -1.2E-08 -1.2E-08 -1.1E-08 -1.2E-08 -9.7E-09 4.6E-09 5.7E-09 6.9E-09 8.3E-09 5.6E-09
Dolomite 7.3E-04 -8.7E-04 -5.0E-03 -7.1E-03 -8.3E-03 -4.2E-03 -4.7E-03 -4.6E-03 -4.1E-03 -4.7E-03 -4.1E-03 -7.8E-04 -9.3E-04 -4.6E-04 -1.7E-04 -6.2E-04
Feldspar 1.1E-09 2.8E-09 -2.1E-08 -2.6E-05 -2.6E-05 -2.6E-05 -2.6E-05 -2.6E-05 -2.4E-05 -2.6E-05 -2.3E-05 2.4E-09 1.5E-07 3.2E-09 8.3E-08 1.3E-07
Fluorspar 7.1E-04 1.4E-02 2.0E-03 -2.0E-02 -2.8E-02 -6.1E-03 -5.5E-02 -4.8E-02 -4.8E-02 -5.5E-02 -4.8E-02 -2.7E-01 -3.3E-01 -2.8E-01 -2.7E-01 -2.7E-01
Granite 2.1E-04 1.1E-05 1.5E-06 1.5E-05 3.6E-05 3.9E-05 -4.5E-02 -3.9E-02 -4.0E-02 -4.5E-02 -4.0E-02 -2.6E-01 -3.2E-01 -2.7E-01 -2.6E-01 -2.7E-01
Gypsum 7.1E-06 1.0E-04 -5.3E-04 -2.1E-03 -1.9E-03 -1.9E-03 -6.7E-03 -6.2E-03 -5.6E-03 -6.7E-03 -5.9E-03 -4.7E-03 -5.8E-03 -4.9E-03 -4.7E-03 -4.8E-03
Kaolinite 6.0E-05 2.8E-04 -5.0E-03 -6.3E-04 -2.2E-04 -9.4E-04 -2.6E-04 -3.2E-04 -2.9E-04 -2.6E-04 -2.1E-04 3.0E-04 4.6E-04 5.7E-04 7.4E-04 4.2E-04
Kieserite 1.2E-06 2.3E-06 -1.2E-05 -5.3E-06 -2.0E-06 -4.0E-06 -2.2E-06 -2.4E-06 -2.0E-06 -2.2E-06 -1.7E-06 1.8E-06 2.4E-06 3.0E-06 3.7E-06 2.4E-06
Limestone 6.7E-01 2.3E+01 -2.3E+01 2.4E+01 -2.4E+00 -1.8E+00 -1.8E+00 -1.6E+00 -9.9E-01 -1.8E+00 -1.1E+00 2.7E+00 2.7E+00 3.3E+00 3.7E+00 3.0E+00
Magnesium carbonate 4.9E-03 -2.7E-03 -2.9E-02 -3.8E-02 -4.3E-02 -2.2E-02 -1.6E-02 -1.6E-02 -1.4E-02 -1.6E-02 -1.3E-02 4.7E-03 6.4E-03 6.9E-03 8.6E-03 6.3E-03
Natural Aggregate 1.9E+02 2.6E+01 -2.5E+01 5.1E+01 5.4E+01 5.2E+01 6.4E+01 7.0E+01 7.9E+01 6.4E+01 7.5E+01 9.2E+01 7.9E+01 9.2E+01 9.7E+01 9.3E+01
Olivine 4.7E-07 3.8E-07 -1.3E-04 -4.6E-04 -4.6E-04 -4.6E-04 -8.3E-04 -7.8E-04 -7.1E-04 -8.3E-04 -7.3E-04 -5.2E-04 -6.3E-04 -5.3E-04 -5.2E-04 -5.2E-04
Peat 1.1E-04 -3.1E-04 -1.6E-02 -1.5E-02 -1.4E-02 -1.4E-02 -7.4E-01 -6.7E-01 -5.9E-01 -7.4E-01 -6.5E-01 -1.1E-01 -1.4E-01 -1.2E-01 -1.1E-01 -1.2E-01
Rutile 3.4E-10 2.6E-09 1.5E-09 -2.6E-05 -2.6E-05 -2.6E-05 -2.6E-05 -2.6E-05 -2.4E-05 -2.6E-05 -2.3E-05 4.0E-10 3.5E-10 5.2E-10 6.1E-10 4.6E-10
Sand 5.6E-05 7.5E-05 -8.6E-02 -7.5E-02 -7.5E-02 -7.5E-02 -1.2E-01 -1.1E-01 -9.7E-02 -1.2E-01 -1.1E-01 -6.4E-02 -7.9E-02 -6.6E-02 -6.4E-02 -6.5E-02
Slate 2.8E-06 3.0E-06 -9.1E-04 -4.1E-03 -4.1E-03 -4.1E-03 -6.6E-03 -6.3E-03 -5.7E-03 -6.6E-03 -5.8E-03 -3.0E-03 -3.7E-03 -3.1E-03 -3.0E-03 -3.1E-03
Sodium chloride 3.4E-02 4.5E+01 -5.4E+01 -4.7E+01 -4.7E+01 -4.7E+01 -5.0E+01 -4.6E+01 -3.9E+01 -5.0E+01 -4.3E+01 -7.0E+00 -1.0E+01 -7.2E+00 -6.9E+00 -7.3E+00
Sodium sulphate 1.4E-04 4.2E-03 8.9E-04 -6.5E-03 -9.1E-03 -1.8E-03 -2.0E-03 -2.0E-03 -1.7E-03 -2.0E-03 -1.7E-03 1.1E-03 1.2E-03 1.3E-03 1.4E-03 1.2E-03
Sylvite 7.5E-05 6.7E-04 -7.6E-01 -6.2E-01 -6.2E-01 -6.2E-01 -6.2E-01 -5.7E-01 -4.9E-01 -6.2E-01 -5.4E-01 -3.0E-04 -3.9E-04 -2.9E-04 -2.6E-04 -2.9E-04
Talc 2.1E-06 1.7E-04 -5.1E-04 -3.7E-05 -1.1E-05 -8.7E-05 -1.5E-05 -1.9E-05 -1.5E-05 -1.5E-05 -8.4E-06 4.8E-05 8.8E-05 7.4E-05 1.0E-04 8.2E-05
Titanium dioxide 6.2E-04 3.1E-02 -1.5E-01 -1.1E-02 -1.4E-02 -2.1E-03 -2.7E-03 -3.0E-03 -2.3E-03 -2.7E-03 -1.6E-03 5.6E-03 6.7E-03 8.7E-03 1.1E-02 6.9E-03
Ulexite 1.4E-07 6.0E-06 -2.5E-06 -3.7E-06 -3.2E-06 -4.6E-06 -2.2E-06 -3.0E-06 -2.7E-06 -2.2E-06 -1.7E-06 3.9E-06 5.9E-06 7.3E-06 9.4E-06 5.4E-06
Vermiculite 2.8E-06 1.0E-06 -8.8E-05 1.0E-04 -3.0E-05 -8.2E-05 -2.9E-05 -3.0E-05 -2.7E-05 -2.9E-05 -2.6E-05 7.6E-06 5.7E-04 1.1E-05 3.2E-04 5.1E-04

LCA of Management Options for Mixed Waste Plastics 99
A B C D E F G H I J K L M N O P Renewable Resources
Water 4.3E+02 1.2E+03 -9.5E+04 -1.4E+04 -1.1E+04 -1.2E+04 -2.9E+04 -2.8E+04 -2.5E+04 -2.9E+04 -2.6E+04 -2.0E+04 -1.9E+04 -1.7E+04 -1.2E+04 -1.5E+04
Resource consumption, energy resources, kg/tonne waste
A -
Lan
dfill
B -
In
cin
erat
ion
C -
SR
F
D -
BP
py
roly
sis
E -
Ozm
otec
h py
roly
sis
F -
Red
ox
agen
t
G -
Sta
dler
&
Tite
ch
H -
Sta
dler
&
Pel
lenc
I -
Stad
ler
&
Qin
etiq
J -
Stad
ler
&
Sim
s
K -
KM
E &
Ti
tech
L -
Stad
ler
&
TLT
M -
Sw
iss
Pol
ymer
a
N -
B+
B
O -
Her
bold
P -
Flo
ttw
eg
Non-renewable Energy Resources
Crude oil 7.9E+00 8.6E+00 -3.2E+01 -3.5E+02 -3.8E+02 -5.7E+01 -3.9E+02 -3.6E+02 -3.2E+02 -3.9E+02 -3.5E+02 -4.6E+02 -5.6E+02 -4.7E+02 -4.5E+02 -4.6E+02
Hard coal 5.8E-01 9.7E+00 -1.5E+03 1.2E+01 2.4E+01 -8.3E+02 -7.4E+00 -1.2E+01 -1.2E+01 -7.4E+00 -4.8E+00 -7.8E+00 3.6E+00 2.5E+01 4.7E+01 6.7E+00
Lignite 4.0E-01 1.7E+01 -1.4E+01 -2.4E+01 -2.5E+01 -2.4E+01 -2.0E+01 -2.0E+01 -1.8E+01 -2.0E+01 -1.8E+01 5.2E-01 2.5E-01 9.8E-01 1.4E+00 8.4E-01
Natural gas 7.5E-01 -2.8E+02 -5.0E+01 -1.3E+02 -1.2E+02 -1.3E+02 -3.0E+02 -2.9E+02 -2.6E+02 -3.0E+02 -2.7E+02 -2.0E+02 -2.3E+02 -2.0E+02 -1.8E+02 -2.0E+02
Uranium 5.7E-05 8.9E-04 -3.2E-03 -2.4E-03 -2.1E-03 -2.7E-03 -4.2E-03 -4.1E-03 -3.7E-03 -4.2E-03 -3.7E-03 -2.9E-03 -3.2E-03 -2.0E-03 -1.3E-03 -2.5E-03
Renewable Energy Resources
Wood 2.8E-06 1.7E-05 -1.9E-03 -1.7E-03 -1.7E-03 -1.7E-03 -2.3E-03 -2.1E-03 -1.9E-03 -2.3E-03 -2.0E-03 -9.7E-04 -1.2E-03 -1.0E-03 -9.7E-04 -9.9E-04

LCA of Management Options for Mixed Waste Plastics 100
Appendix 4 Assumptions & Uncertainty The main assumptions made in the study and their likely effect on uncertainty in the results are described below
Feedstock composition
As discussed in detail in Section 3.6.2, there is a very wide variation in the composition of the feedstock
material leaving the MRF. As different technologies recover polymer types from the waste stream with varying
efficiency this will potentially have a large effect on the overall results. Because of the importance of the
feedstock compostion it has been assessed in more detail in the sensitivity analyses in Section 6.1.
Quantities of black plastic
As discussed in Section3.6.2, NIR technologies often have difficulty detecting black plastic and it is assumed
that this is correctly sorted only 50% of the time. Typically, black plastic accounts for about 10% of the total
but may vary significantly as for the feedstock composition in general. This will add some uncertainty to the
results for scenarios using NIR technology. If the quantity of black plastic doubles from the default 10% to
20%, it is likely that there will be an accompanying reduction in recycling efficiency of 5%. As such, given
likely variations in black plastic composition, the results are not considered to be particularly sensitive to this
assumption.
Incinerator efficiency
The efficiency of electricity recovery at municipal incinerators can vary. The published literature gives a range
of between 15 – 30%, with 23% being a typical value for a modern incinerator. This is potentially quite
significant for the incineration scenario and so has been included in the sensitivity analyses in Section 6.2.
Basis for substitution of electricity production from incineration
In line with UK Government best practise guidelines the default assumption is that electricity generated at
municipal incineration facilities displace that produced by a combined cycle gas turbine power plant. However,
this is a relatively clean technology and so incineration will appear less favourable than if a dirtier technology
is assumed to be displaced. The effects of this assumption have been assessed in the sensitivity analysis in
Section 6.4, by comparing against coal power electricity generation and electricity sourced from the UK grid.
Basis for substitution of recycled plastic/effect of impurities on recyclate quality
The effect of impurities affecting the quality of the recyclate has not been considered in detail. The default
assumption in this study is that recycled plastic obtained from the recycling processes is of high quality and
substitutes directly for virgin plastic on a 1:1 basis. If a lower quality recyclate is produced it is likely that this
will have a large effect on the results by significantly reducing the benefits accrued from recycling. The effects
of this assumption have been assessed in more detail in the sensitivity analysis in Section 6.3.
Basis for substitution of redox agent in the blast furnace
Blast furnace chemistry is extremely complicated and so the basis for the determining the amount of
alternative redox agent includes a number of assumptions and simplifications as described in Section 3.9.
However this figure was developed after consulting with Corus experts and it is felt that it represents a good
estimate for the situation in UK blast furnaces.
Power supplied using average UK average electricity mix
In all cases this is the most likely source of power for running the processes.

LCA of Management Options for Mixed Waste Plastics 101
Maturity of technology – use of pilot plants and test rigs
Several of the technologies assessed in this study are currently only operating at pilot plant scale, or as test
rigs for demonstrating the technology. It is expected that full size plants will more efficient due to benefits of
scale and process optimisation and that these differences could be quite significant depending on the maturity
of the technology. The technology providers were asked to estimate the performance (energy consumption,
etc.) of a full-size plant but in many cases this information was not available.
Quality of data on pyrolysis technologies
Available data on pyrolysis in the published literature is poor. The BP process has been further developed with
significant efficiency gains since the available data were published but this process is no longer current and
will not be resurrected. As such, the results from the LCA model cannot be taken to represent the best
performance available from modern pyrolysis plants. Likewise only basic data on the Ozmotech process are
available and the details have been based on discussions with Bowman Process Technologies. The
uncertainties associated with both these processes are considered to be quite large.
Secondary (background) data
The secondary data used in this study and its relevance to the UK situation is described in Appendix 2. In
most cases European average data have been used. In some cases, such as for landfill and incineration, data
for the Swiss situation have been used – in these cases it is expected that practices in the UK would be similar
to those in Switzerland. Data sourced from the Ecoinvent database often includes impacts associated with
infrastructure (buildings, capital equipment, etc.) which are considered outside the scope of this assessment.
This will lead to some overestimation of impacts from these process (or benefits if they are “avoided”
processes) but for the processes used in this study this is invariably very small compared to impacts of the
main process because the throughput is so great over the lifetime of the infrastructure.
Transport modes and distances
Transport distances for different scenarios are discussed in Section 3.6.4. These are assumptions of typical
transport distances in the UK. However, for any particular location in the UK the actual distances could vary
significantly. It is also assumed that all transport in the scenarios uses 32 tonne (gross weight) lorries with a
full outward load and an empty return trip. Clearly these assumptions could also vary significantly in practise.
However, in the context of the overall results, impacts from transport are generally small and it is not
expected that this would affect the overall results.
Disposal options for non-recycled stream are either landfill or incineration
It is assumed that all waste that is not recycled is sent for landfill or incineration (according to the UK mix for
these options). As this waste has no value and would not be sent for recycling elsewhere it is expected that
this assumption is closely representative of the actual UK situation.
Incineration all has electricity recovery and no heat recovery
This assumption is discussed in Section 3.6.3, and is broadly correct for the UK situation.

LCA of Management Options for Mixed Waste Plastics 102
Appendix 5 Peer Review
FINAL Peer review of the report:
LCA of Management Options for Mixed Waste Plastics, Final Draft Report, dated April 2008 For WRAP
Mike Holland, EMRC Ian Boustead, Boustead Consulting Bernie Thomas, ERM

LCA of Management Options for Mixed Waste Plastics 103
Introduction The study concerning LCA of mixed waste plastics has been commissioned by WRAP to identify whether waste plastic recycling has the potential to deliver significant environmental benefits over existing waste management options. The authors of the report state that the work will inform WRAP’s strategic planning process and determine whether this should be a priority area for further work. It is expected that recyclers and other stakeholders will also find the study useful in shaping their decisions regarding technology options for managing domestic mixed plastic waste. This paper brings together the comments of the peer reviewers, the peer review team being made up of the following (in alphabetical order):
Ian Boustead, Boustead Consulting.
Mike Holland, EMRC.
Bernie Thomas, ERM.
These comments relate to the report 'LCA of Management Options for Mixed Waste Plastics', Final Draft dated April 2008. They do not relate to any subsequent version of the report. Selective quotations from the peer review should be avoided. WRAP may require that the reports issued under the study are revised to reflect the comments made here. Should this be done it is suggested that an additional appendix is provided to show how the authors have responded to the peer review. Comments have been given unique numbers in the summary (a to n) and then running through the series of reviews (1 to 54) to facilitate this.

LCA of Management Options for Mixed Waste Plastics 104
Summary statement on the peer review of the study: LCA of Management Options for Mixed Waste Plastics Final Draft Report, April 2008 Produced by Scott Wilson for WRAP This is an agreed summary by a panel of three independent experts, performed on the draft final LCA report, dated April 2008. Full reviews by each peer reviewer have also been submitted to WRAP. The scope of the overall project, involving trials of various near-infra red and density separation technologies for plastics separation to generate good quality recyclate is to be commended, and the work commissioned by WRAP has the potential to make a significant contribution to knowledge in this field. The three peer reviewers identified a number of areas where the LCA report should be improved. Whilst some of these improvements were relatively minor others were not and require a significant level of action or reworking to ensure that the project fulfils its potential. It should be noted that further peer review of the final version of the report has not been performed, and so the review team cannot take a position on the extent to which subsequent changes resolve the issues raised in their review of the earlier draft report. Overview of comments on methodology a) There is a need for a systematic presentation of input data. As part of this there needs to be discussion of
how the results of the trials performed in the broader study have been factored into the analysis. This should say how the differing levels of maturity for the different technologies has been addressed. Similarly, there is a need for more information on the GABI software used. There then needs to be consideration of the relevance of the input data to plastics recycling in the UK. Lack of information in these areas in the draft report prevents the peer review reaching a conclusion on the validity of the analysis.
b) Clarity is needed on the treatment of energy through the analysis. In particular, it is not clear whether there is consistent and correct use of gross and net calorific values, and whether process and feedstock energy are treated appropriately.
c) Some of the assumptions on the efficiency of incineration with energy recovery are pessimistic – particularly the lower end of the efficiency range (15%) and the fact that no account is taken of heat recovery.
d) There is a need for a comprehensive presentation of assumptions with a similarly comprehensive review of uncertainties. At the end of the analysis this would permit a much more detailed discussion of the robustness of the results than is currently the case.
e) A commentary is needed on system boundary limitations.
Overview of comments on results f) There is a tendency to present results without referring to their uncertainty. The clearest example is the
graph that appears to show that once virgin polymer substitution falls below 70% other waste management options become preferable. The reviewers agree that this is an important part of the analysis as it shows the trade-offs that exist between options. However, as presented it implies that the 70% figure is something of a golden rule. It is recommended to either put confidence bands around the lines or to provide a detailed discussion of the robustness of these results. Also, to make clear that (as presented) they refer to a specific comparison of one recycling scenario with the use of waste plastics as fuel at cement kilns (see also comment (i)).
g) Consideration should be given to the effect of uncertainties in combination. The draft final report only considers a selection of sensitivity cases in isolation of each other. Whilst we acknowledge that there is tendency for uncertainties to cancel each other out, there is also potential for some of the key sensitivities identified in the report to operate additively.

LCA of Management Options for Mixed Waste Plastics 105
Overview of comments on discussion h) There is only limited information given on the meaning of the impact indicators assessed in the report. More
information is needed particularly where the potential impact described by the indicators may be exaggerated as a result of legislation to limit damage or site specific factors.
i) The report gives the impression that UK cement kilns and blast furnaces would be able to take large volumes of plastic waste. However, these facilities have finite capacity and are already burning very significant quantities of waste (shredded tyres, secondary liquid fuels, etc.). It may therefore be the case that they are unable to take any significant fraction of mixed plastic waste. This should be acknowledged. WRAP could consider undertaking further work to assess which wastes are best disposed of through cement kilns and blast furnaces.
j) A major factor in assessing the benefits of plastic recycling (as indeed shown by the report) concerns the quality of recyclate. An issue that needs discussion in the report concerns whether increased recycling rates would lead to increased contamination, and over time a reduction in the capacity of recyclate to substitute for virgin polymer.
k) Technologies, plastics arisings, etc. will evolve over time. This should be acknowledged in the discussion to provide WRAP with a view on the types of change that could affect the robustness of the conclusions of the report.
l) Consideration needs to be given to the comparability of results for different technologies at different levels of maturity. Also, whether lessons been learned about the pros and cons of the technologies considered, and the relative merits of NIR- and density-separation methods, that could provide useful input for future development and refinement.
m) Results need to be discussed against the broader context set by the wider literature on plastics recycling.
n) Finally, there needs to be discussion of the robustness of the results. Do any of the recycling scenarios appear significantly better or worse than an average for the recycling scenarios? How robust are the apparent advantages of recycling relative to incineration and landfill?
The full text of the peer review provides a great deal more detail on these comments. Revision of the report by its authors should consider the additional information presented there also. Mike Holland, EMRC Ian Boustead, Boustead Consulting Bernie Thomas, ERM May 2008

LCA of Management Options for Mixed Waste Plastics 106
Response to peer review comments Overview of comments on methodology a) Input data from each technology trial is now presented in Appendix 1 and background data is presented in
Appendix 2. Uncertainties associated with issues such as maturity of the technology are discussed with other uncertainties and assumptions in Appendix 4. Further information on GaBi Software is provided in Section 3.7. The relevance of the input data to plastics recycling in the UK is discussed in more detail in the main report.
b) Energy is reported as the gross calorific value, this has now been made explicit in the report. Net calorific values have only been used to assess energy recovery from incinerators where energy from steam derived from water in the fuel is not recovered. The treatment of process and feedstock energy has also been clarified.
c) The range of incinerator efficiencies was derived from a review of the literature. However it is recognised that the lower end of the range this is not representative of current technology but relates to older plants. The sensitivity analysis of this aspect has been adjusted accordingly.
d) Assumptions and uncertainties are discussed in Appendix 4.
e) Section 3.4 has been revised to emphasise that the study boundaries do not include the mixed waste plastic collection stage and that the results are only relevant to material sourced from MRFs.
Overview of comments on results f) More comment has been added on uncertainties in the impact assessment categories and with relation to
charts including Figure 6.4.2, on sensitivity of the results to the degree of virgin polymer substitution. The chart itself has been modified to emphasise the uncertainty in this assessment. Additional explanation has also been added to explain that this result only considers 2 scenarios and that comparing other scenarios would lead to different results.
g) Assessment of uncertainties in combination has been added in Section 6.5
Overview of comments on discussion h) Further discussion is provided on the impact indicators and their relevance and robustness.
i) The finite capacity of UK kilns and cement plants to accept waste plastics is now noted explicitly in the text. The author agrees with the reviewers comments that WRAP could consider undertaking further work to assess which wastes are best disposed of through cement kilns and blast furnaces
j) A discussion on the effects of impurities and degradation of the quality of the recyclate over many recycling steps is included in Section 3.9
k) Consideration of future changes to recycling technologies, plastics arisings, etc. is now included in the discussion.
l) More consideration has also been given in the discussion on the relative merits of NIR- and density-separation methods. Appendix 4 discussed the relevance of comparing technologies at different levels of maturity and their effect on the robustness of the results.
m) The main report has more discussion on the results of the project in the context set by the wider literature on plastics recycling.
n) The robustness of the results are considered in detail in Appendix 4 and in sensitivity analyses in Section 6. The discussion on combined uncertainties highlights those factors that are most important when considering whether recycling scenarios have better environmental performance than incineration and landfill.

www.wrap.org.uk