an entropy-based investigation of underpinnings and impact...
TRANSCRIPT

An entropy-based investigation
of underpinnings and impact of
oscillations in a model of PD
Ana V. Cruz
Doctoral thesis
Institute of Neurology,
University College London
September 2011

I, Ana Vieira Cruz confirm that the work presented in this thesis is my own. Where information
has been derived from other sources, I confirm that this has been indicated in the thesis.
_______________________________
(Ana Cruz, 15th
September 2011)

Science does not know its debt to imagination.
Ralph Waldo Emerson

This research was conducted under the mentorship of
Dr. Bruno Averbeck and Professor Peter Brown. The data
analysed in these studies was collected by our collaborators
Dr. Peter Magill and Dr. Nicolas Mallet.
The project was developed as part of a PhD doctoral
program (Programa de Doutoramento em Biologia
Computacional – PDBC) at the Instituto Gulbenkian de
Ciência (Oeiras, Portugal) coordinated by Dr. Jorge Carneiro
and Dr. Marie-France Sagot.
I performed the first part of my research project at
the Sobell Department of Motor Neuroscience and Movement
Disorders, Institute of Neurology, UCL (London, UK). After
two years, I followed the Averbeck lab to the Laboratory of
Neuropsychology, National Institute of Mental Health, NIH
(Bethesda, USA).
Financial support throughout this research was
provided by the Fundação para a Ciência e a Tecnologia,
Portugal (Grant Reference No. SFRH/BD/333201/2007).

i
ABSTRACT
The involvement of the basal ganglia in motor control has been highlighted in studies of Parkinson’s
disease (PD) and other movement disorders. The loss of dopaminergic neurons in the substantia nigra pars
compacta and subsequent decrease of the dopamine level in the basal ganglia is recognized as the hallmark of
PD. The classical view of the architecture of the dopamine depleted basal ganglia-thalamo-cortical circuit
identifies changes in firing rates as the probable cause for the motor impairments in PD. Yet, more recent
findings have shown that disturbances in other intrinsic dynamical properties of these networks may also
contribute to motor deficits. Electrophysiological recordings in the basal ganglia of deep brain stimulation
(DBS) patients (when OFF stimulation) have found pathological oscillations at beta frequency (13-30 Hz). This
abnormal oscillatory activity has also been found in basal ganglia nuclei of animal models of PD. Additionally,
the beta frequency oscillations were found to decrease when the patients are on dopamine replacement therapies
and as they initiate movement. Beta frequency oscillations have been identified in the firing of single neurons
and in the coupling of discharges between neurons.
Within the framework of information theory, we proposed a time series model to analyse and relate the
effects of changes in the dynamics of individual factors – such as alterations in firing rates, oscillations and
synchrony (or auto and cross-correlations) caused by dopamine depletion – on the coding capacity (i.e., entropy)
of a network. We estimated the entropy of a neural network based on the probabilities of current spiking
conditioned on the observation of firing rate and spiking history of the current neuron and of neighbouring
neurons. Moreover, we could estimate entropies for each of these factors separately, in healthy and dopamine
depleted conditions, and assess their relative contribution to the decrease of coding capacity in disease.
Furthermore, the causal characteristics of the model made it possible to compare the synaptic connectivity of
neuronal populations in health with that in disease, by measuring the amount of directed information transferred
between populations.
We employed the model to study the external globus pallidus (GPe) network in control and
6-hydroxydopamine (6-OHDA) lesioned rats – a model for PD. We found a significant decrease in the coding
capacity in lesioned animals, compared to controls, and that this decrease was predominantly on account of a
reduction in the GPe firing rates. Although to a lesser extent, the amplification of the oscillatory activity (mainly

ii
in the beta frequency range) observed in the lesioned animals had also a significant impact on the reduction of
their coding capacity. The higher synchrony found in the 6-OHDA rats had the least effect. We also found that
the levels of coding capacity in the GPe were restored to levels close to control when the lesioned animals were
treated with the dopamine agonist apomorphine. In addition, we detected a stronger coupling between the
subthalamic nucleus (STN) and the GPe in the dopamine depleted rats, pointing to an abnormally exaggerated
transfer of information within this network.
We have shown that the GPe and the STN-GPe networks in the dopamine depleted rat exhibit
information processing irregularities. We believe these deficits in processing and relaying information may also
be present in other structures of the basal ganglia-thalamo-cortical circuit and that they may underlie the motor
impairment in PD.

iii
TABLE OF CONTENTS
Abstract ................................................................................................................................................................ i
Table of Contents................................................................................................................................................. iii
List of Figures ..................................................................................................................................................... vii
List of Tables ..................................................................................................................................................... xiii
Acknowledgments ............................................................................................................................................. xiv
1 Introduction .............................................................................................................................................. 17
1.1 The Basal Ganglia ............................................................................................................................... 17
1.2 Parkinson’s Disease ............................................................................................................................ 22
1.3 Dopamine replacement therapies ........................................................................................................ 26
1.4 Deep brain stimulation ........................................................................................................................ 27
1.5 Basal ganglia-thalamo-cortical circuit in Parkinson’s disease ............................................................ 28
1.6 Oscillatory activity in the basal ganglia .............................................................................................. 29
1.7 6-hydroxydopamine animal model ...................................................................................................... 31
1.8 Information theoretic models applied to neural coding ....................................................................... 33
1.9 Our information theoretic approach .................................................................................................... 38
2 The model .................................................................................................................................................. 39
2.1 Abstract ............................................................................................................................................... 39
2.2 Introduction ......................................................................................................................................... 40
2.3 Materials and Methods ........................................................................................................................ 41
2.3.1 Data collection ................................................................................................................................ 41
2.3.2 6-hydroxydopamine lesions of dopamine neurons ......................................................................... 42
2.3.3 Electrophysiological recordings ...................................................................................................... 42
2.4 Model .................................................................................................................................................. 45
2.4.1 Parameter estimation....................................................................................................................... 54
2.4.2 Model selection ............................................................................................................................... 57
2.4.3 Entropy ........................................................................................................................................... 58
2.4.4 Frequency domain analysis ............................................................................................................. 59

iv
2.5 Results ................................................................................................................................................. 59
2.5.1 parameter estimation: IRLS versus ES ........................................................................................... 60
2.5.2 Model selection: AIC versus BIC ................................................................................................... 62
2.6 Discussion ........................................................................................................................................... 65
2.7 Conclusions ......................................................................................................................................... 67
3 The effects of dopamine depletion on network entropy in the external globus pallidus .................... 68
3.1 Abstract ............................................................................................................................................... 68
3.2 Introduction ......................................................................................................................................... 69
3.3 Methods ............................................................................................................................................... 70
3.3.1 Data Collection ............................................................................................................................... 70
3.3.2 Model .............................................................................................................................................. 70
3.3.3 Parameter estimation....................................................................................................................... 72
3.3.4 Model selection ............................................................................................................................... 73
3.3.5 Entropy ........................................................................................................................................... 74
3.3.6 Higher-order terms .......................................................................................................................... 74
3.3.7 Population model ............................................................................................................................ 75
3.3.8 Mixed model analysis ..................................................................................................................... 75
3.4 Results ................................................................................................................................................. 76
3.4.1 Effects of rates, autocorrelations and pair-wise cross-correlations on entropy ............................... 78
3.4.2 Ensemble entropy ........................................................................................................................... 81
3.4.3 Higher-order effects ........................................................................................................................ 82
3.4.4 Modeling effects at the population level ......................................................................................... 82
3.5 Discussion ........................................................................................................................................... 84
3.6 Conclusions ......................................................................................................................................... 87
4 Effects of dopamine depletion on information flow between the subthalamic nucleus and external
globus pallidus .................................................................................................................................................. 88
4.1 Abstract ............................................................................................................................................... 88
4.2 Introduction ......................................................................................................................................... 89
4.3 Methods ............................................................................................................................................... 90
4.3.1 Data collection ................................................................................................................................ 90

v
4.3.2 Model .............................................................................................................................................. 90
4.3.3 Directed information flow .............................................................................................................. 93
4.3.4 Damped sinusoids ........................................................................................................................... 94
4.4 Results ................................................................................................................................................. 94
4.4.1 Comparison of STN-GPe network dynamics in control rats and Parkinsonian rats ....................... 94
4.4.2 Parameter estimation for non-linear models of spiking activity in STN-GPe network................... 97
4.4.3 Directed information flow in the STN-GPe network in control rats and Parkinsonian rats ............ 99
4.4.4 Temporal profiles of directed information flow in the STN-GPe network ................................... 102
4.4.5 Directed information flow and temporal interactions between different types of GPe neuron ..... 104
4.5 Discussion ......................................................................................................................................... 106
4.5.1 Limitations .................................................................................................................................... 106
4.5.2 Novel insights ............................................................................................................................... 107
4.5.3 Wider implications ........................................................................................................................ 108
4.6 Conclusions ....................................................................................................................................... 109
5 Apomorphine improves coding capacity in the basal ganglia network in 6-OHDA-lesioned rats .. 110
5.1 Abstract ............................................................................................................................................. 110
5.2 Introduction ....................................................................................................................................... 111
5.3 Methods ............................................................................................................................................. 113
5.3.1 Data collection .............................................................................................................................. 113
5.4 Results ............................................................................................................................................... 113
5.4.1 Network dynamics ........................................................................................................................ 114
5.4.2 Optimal number of lags ................................................................................................................ 115
5.4.3 Entropy ......................................................................................................................................... 117
5.4.4 Individual effects on entropy change ............................................................................................ 118
5.4.5 Directed information flow ............................................................................................................ 120
5.4.6 Temporal profile of interactions ................................................................................................... 121
5.5 Discussion ......................................................................................................................................... 122
5.6 Conclusions ....................................................................................................................................... 125
6 Discussion ................................................................................................................................................ 127
7 Conclusion ............................................................................................................................................... 137

vi
Appendix ......................................................................................................................................................... 138
Appendix A .................................................................................................................................................... 138
Appendix B ..................................................................................................................................................... 139
Appendix C .................................................................................................................................................... 143
Appendix D .................................................................................................................................................... 144
Appendix E ..................................................................................................................................................... 147
References ....................................................................................................................................................... 150

vii
LIST OF FIGURES
Figure 1-1. The basal ganglia. A. Coronal section through the mid-thalamus at the level of mamillary bodies
(taken from Fix, 2005). B. Parasagittal section through the caudate nucleus and the substantia nigra (taken from
Woolsey et al., 2003). ........................................................................................................................................... 18
Figure 1-2. Schematic representation of the basal ganglia-thalamo-cortical circuit. STN: subthalamic nucleus,
GPe: external globus pallidus, SNc: substantia nigra pars compacta, SNr: substantia nigra pars reticulata, GPi:
internal globus pallidus, PPN: pedunculopontine nucleus. ................................................................................... 19
Figure 1-3. Schematic representation of the basal ganglia-thalamo-cortical circuitry in Parkinson’s disease. The
variation in the width of the connecting arrows relative to those in Figure 1-2 correlates with the change in
neural activity after dopaminergic cell loss in the SNc and consequent dopamine depletion in the basal ganglia
circuits. Same abbreviations as in Figure 1-2. ...................................................................................................... 25
Figure 2-1. Relation between the entropy and the probability of occurrence of a “successful” event. The entropy
is higher when the uncertainty is also higher. ....................................................................................................... 40
Figure 2-2. Experimental setup. A. Cortical activity (ECoG) and single cell activity were simultaneously
recorded in the GPe and STN, using silicon probes. Recordings from STN will be analyzed in chapter 4. B.
Scheme of a 32-contact silicon probe including size and distances between contact electrodes. ......................... 44
Figure 2-3. Representation of a population of simultaneously recorded neurons, where the spike trains were
divided in 5 ms bins. The prediction of a spike occurring in neuron i at instant t, si,t = 1, was calculated
conditioned on the firing rate of neuron i; or, in addition to the firing rate, the temporal patterns of the past bins
from neuron i, and/or from one or more neurons jn, n=1,...,N-1. .......................................................................... 49
Figure 2-4. Examples of selected number of lagged terms that best fit each model’s prediction if a spike will
occur at zero lag bin of neuron i, based on pairs of neurons. A. For the ‘Rate’ model, only the a0 coefficient is
considered. B. The ‘Auto’ model uses the rate effect plus the past events of neuron i. C. The ‘Cross’ model takes
in account the rate effect (neuron i) and the lagged bins of neuron j1. D. All the rate, auto and cross effects are
considered in the ‘Full’ model. ............................................................................................................................. 52

viii
Figure 2-5. Comparison between the entropy calculated using the ES and the IRLS algorithms in pairs of
neurons for which this last converged. This analysis was done under the four different models that characterize
the effect of the different factors on the entropy in control and lesioned animals. A. Firing rates. B.
Autocorrelations. C. Cross-correlations. D. Autocorrelations and cross-correlations (‘Full’ model). .................. 60
Figure 2-6. Distribution of the difference on the entropy estimated by means of the ES and the IRLS algorithms
for each model. A. ‘Rate’ model. B. ‘Auto’ model. C. ‘Cross’ model. D. ‘Full’ model. ..................................... 61
Figure 2-7. Example of AIC (dashed) and BIC (solid) curves calculated for a pair of neurons from a lesioned
animal, under the ‘Auto’ and ‘Cross’ models. A. Autocorrelations. B. Cross-correlations. The ‘♦’ signals the
maximum of the function, indicating the selected optimal number of lags. Note the BIC axis on the left and the
AIC axis on the right side of the panels. ............................................................................................................... 62
Figure 2-8. Distributions of the optimal number of lags, selected with AIC and BIC, for healthy and lesioned
populations. A. Effects of autocorrelations. B. Effects of cross-correlations. C. Both auto and cross-correlations
effects. .................................................................................................................................................................. 63
Figure 2-9. Scatter plots of the entropy in pairs of control and lesioned neurons, calculated using the optimal
number of parameters selected under the AIC and BIC on the four models. A. Firing rate model. B. Auto model.
C. ‘Cross’ model. D. ‘Full’ model. ....................................................................................................................... 64
Figure 3-1. Comparison of GPe network dynamics in 6-OHDA-lesioned and control rats. A. Mean ± SE firing
rates of all neurons. Difference significant at p-value <0.01. B. Mean coherence for all pairs of neurons. C.
Mean autocorrelation for all neurons. D. Mean cross-correlation for all neurons. ............................................... 77
Figure 3-2. Optimal number of lags for auto (K1) and cross (K2) correlations. A. Optimal number of lagged time
bins (5 ms each), selected with BIC for autocorrelations in lesioned and control ensembles. B. Same for cross-
correlations. C. Total of auto and cross-correlations. ........................................................................................... 78
Figure 3-3. Comparison of GPe network entropy in lesioned and control rats under each of the four models. A.
Entropy (H) when considering only firing rates. B. Entropy when autocorrelations are added to the rate model.
C. Entropy when cross-correlations are added to the rate model. D. Entropy in the ‘Full’ model, which takes into
account firing rates, autocorrelations and cross-correlations. ............................................................................... 79
Figure 3-4. Decreases in entropy (or delta entropy, ΔH) when additional parameter sets (‘factors’) are included
in the models. All changes are with respect to model which includes only rates. A. Delta entropy for

ix
autocorrelations. B. Delta entropy for cross-correlations. C. Delta entropy for ‘Full’ model with auto and cross-
correlations. .......................................................................................................................................................... 80
Figure 3-5. Entropy per spike of ‘Full’ model. Data for all GPe neurons is shown but entropy rate (entropy per
spike) for each neuron was divided by the average firing rate of that neuron. ..................................................... 81
Figure 3-6. Comparison of ensemble and pair-wise entropy. A. Scatter plot of entropy in pairs (Hpairs) and
entropy in corresponding ensemble (Hens). Each ensemble is plotted against all of the pairs into which it can be
broken down. Points on the diagonal show no additional effect of additional neurons in the ensemble. B.
Distribution of differences between entropy in pairs and entropy in corresponding ensemble. ........................... 82
Figure 3-7. Decrease in entropy (delta entropy, ΔH) as function of ensemble size and model prediction. A.
Average delta entropy in 400 random ensembles of simultaneously recorded neurons of each size (thin lines;
error bars are ±1 SEM) and model predictions (thick lines). B. Predicted delta entropy as a function of ensemble
size for large populations. ..................................................................................................................................... 83
Figure 4-1. Comparison of GPe, GP-TI, GP-TA and STN network dynamics and interactions in dopamine-
intact control rats and 6-OHDA-lesioned Parkinsonian rats. A. Mean firing rates of all STN and GPe neurons in
control and lesioned animals. B. Mean auto-spectra for all GPe neurons in control and lesioned animals. C.
Mean auto-spectra for STN neurons in control and lesioned animals. D. Mean cross-spectra between pairs of
GPe and STN neurons. E. Mean firing rates of GP-TI neurons and GP-TA neurons in lesioned rats. F. Mean
auto-spectra for GP-TI and GP-TA neurons in lesioned rats. G. Mean cross-spectra between GP-TI pairs,
between GP-TA pairs and between GP-TI/GP-TA pairs of neurons in lesioned rats. H. Mean cross-spectra
between STN/GP-TI pairs and between STN/GP-TA pairs of neurons in lesioned rats. Asterisks in (A) and E
indicate significant differences. a.u. = arbitrary units. .......................................................................................... 95
Figure 4-2. Optimal numbers of lags for autocorrelations and cross-correlations. A, B. Autocorrelations for all
STN neurons and all GPe neurons, respectively, in control and lesioned rats. C. Autocorrelations for distinct cell
types, GP-TI and GP-TA neurons, in lesioned animals. D, E. Cross-correlations for transfer in direction from
GPe to STN (D) and from STN to GPe (E) in control and lesioned rats. F. Cross-correlations between GP-
TI/GP-TI pairs and GP-TA/GP-TA pairs in lesioned rats. G, H. Cross-correlations for transfer in direction from
GP-TA or GP-TI to STN (G) and from STN to GP-TI or GP-TA (H) in lesioned rats. I. Cross-correlations for
GP-TI to GP-TA transfer and for GP-TA to GP-TI transfer in lesioned animals. In all cases, optimal numbers of

x
5 ms time bins (K1 or K2) were selected with Bayesian Information Criteria. Note that lags of zero indicate no
significant interactions. ......................................................................................................................................... 97
Figure 4-3. Information transfer across the STN-GPe network. Top plot in each panel of this and subsequent
figures shows untransformed probabilities; bottom is same data re-plotted with log-transform to emphasize the
smaller proportions. A. Information transfer from STN to GPe in control and lesioned rats. B. Information
transfer from STN to GP-TI or GP-TA in lesioned rats. C. Information transfer from GPe to STN in control and
lesioned rats. D. Information transfer from GP-TI or GP-TA to STN in lesioned rats. GPe neurons were not
divided and grouped according to cell type in A and C. ....................................................................................... 99
Figure 4-4. Relationship between information transfer and the presence of significant STN/GPe interactions for
control (blue) and lesioned (red) animals. The optimal number of lagged bins in cross-correlations selected
through the BIC is denoted as K2 (Equation 1). The plots on the right in both panels show the number of pairs of
neurons where STN to GPe (A) and GPe to STN (B) significant interactions were detected (K2 > 1), and the
number of pairs without significant interactions (K2=1). The histograms on the left show the distribution of
information transfer (as in Figure 4-3A, C) for pairs with and without significant interactions. ....................... 101
Figure 4-5. Transfer functions between STN and GPe neurons derived from the ‘Full’ model (which includes
both auto and cross terms) in control rats and lesioned Parkinsonian rats. A. Model parameters for STN neurons
and all GPe neurons in control rats, where there is little temporal structure to the transfer functions and thus,
minimal interactions between nuclei. B. Model parameters for STN neurons and all GPe neurons in lesioned
rats. Note that short-latency interactions are out of phase. C. Model parameters for STN neurons and only GP-
TA neurons in lesioned animals. Note that STN to GP-TA and GP-TA to STN transfer functions are ‘in phase’
at short latencies. D. Model parameters for STN neurons and only GP-TI neurons in lesioned rats. Note that the
transfer functions are not in phase at short latencies. Dotted lines in each plot are the fits of damped sinusoids to
the transfer functions. Positive and negative bk parameters indicate ‘excitatory’ and ‘inhibitory’ transfer,
respectively. ........................................................................................................................................................ 102
Figure 4-6. Information transfer within the GPe. A. Information transfer between all GPe neurons in control and
lesioned rats, irrespective of cell type. B. Information transfer between only GP-TI neurons and between only
GP-TA neurons in lesioned rats. C. Information transfer from GP-TI to GP-TA and from GP-TA to GP-TI
neurons in lesioned rats. ..................................................................................................................................... 104

xi
Figure 4-7. Transfer functions between different types of GPe neuron derived from the ‘Full’ model (which
includes both auto and cross terms) in lesioned Parkinsonian rats. A. Model parameters for pairs of GP-TI
neurons. B. Model parameters for pairs of GP-TA neurons. C. Model parameters for GP-TI to GP-TA transfer.
D. Model parameters for GP-TA to GP-TA transfer. Dotted lines in each plot are the fits of damped sinusoids to
the transfer functions. ......................................................................................................................................... 105
Figure 5-1. The network dynamical properties and interactions in the GPe of dopamine-intact control animals
and 6-OHDA lesioned animals, before and after apomorphine treatment. A. Mean firing rates of the GPe
neurons (mean ± SEM). Differences were significant at p< 0.05 (1-way anova). B, C. Neural activity in the
frequency domain: mean auto-spectra (B) and mean cross-spectra (C) for pairs of GPe neurons...................... 114
Figure 5-2. The distributions from the optimized number of parameters used in each model used to predict the
response of the current neuron in each time bin. The number of parameters expresses the number of lagged time
bins that carry relevant information for the prediction. The models were applied to control (blue) and lesioned
animals before and after apomorphine challenge (red and green, respectively). A. ‘Auto’ model. K1 represents
the optimized number of significant lagged time bins of the current neuron (autocorrelations). B. ‘Cross’ model.
K2 represents the optimized number of significant lagged time bins of a second neuron on the response of the
current neuron (cross-correlations). C. ‘Full’ model. Note that higher proportion of zero parameters means a
higher fraction of neurons, or pairs of neurons, with no significant interactions. The values on the panels
represent the (mean ± SEM) of the distributions. ............................................................................................... 115
Figure 5-3. Comparison of the entropy under the three conditions (control, lesion OFF apomorphine and
lesioned ON apomorphine) estimated with four different models: A. the ’Rate’ model, which included only the
firing rates; B. the ’Auto’ model that accounted for the firing rates and autocorrelations; C. the ’Cross’ model
that included the firing rates and cross-correlations D. and the ’Full’ model which combined all these terms. The
values on the panels are the (mean ± SEM) of the distributions. ........................................................................ 117
Figure 5-4. Delta entropy (ΔH) measures the decrease in entropy when additional sets of parameters are
inserted in the model. A. Effect of autocorrelations. B. Effect of cross-correlations. C. Effect of combined auto
and cross-correlations. On the right, in each panel, are the (mean±SEM) of the distributions. .......................... 118
Figure 5-5. Individual effect on the GPe network entropy changes of the dynamical alterations observed on the
firing rates, oscillations and synchrony after 6-OHDA lesioning (in red) and after apomorphine challenge (in

xii
green). The negative values indicate an effect on the decrease of the entropy, and positive values on the increase
of the entropy. ..................................................................................................................................................... 119
Figure 5-6. Distributions of the information transfer between GPe neurons for control and lesioned animals
before and after apomorphine injection. On the right, the (mean ± SEM) values of each distribution. ............. 120
Figure 5-7. Transfer functions calculated with the ‘Full’ model, describing the temporal structure of the
interactions between GPe neurons in control and in 6-OHDA lesioned animals, before and after apomorphine
(APO) challenge. ................................................................................................................................................ 121
Figure C-1. Analysis flow chart. A. Data binning and conversion to a binary signal. B. Selection of optimal
number of lags using the Bayesian Information Criterion. C. Mutual Information estimation. D. Analysis of the
temporal profile of interactions between nuclei. ................................................................................................. 143
Figure E-1. Characterization of the firing rate properties of the spike trains recorded in the GPe neurons. A, B.
Analysis of the differences between the mean firing rate in each segment S ¯i,t+h
and the mean firing rate of the
whole spike train i, denoted as Δsi,t+h in Equation 5 (chapter 2; section 2.4). The results are shown as the average
± SD of Δsi,t+h for all T-h segments with fixed width h ‒ with T as the total number of bins of each spike train ‒,
and across all control (A) and lesioned (B) cells for diferent values of h. C, D. Average ± SD of the
autocovariance of the mean firing rates across spike trains of control (C) and lesioned (D) animals, as a function
of the time shift h. ............................................................................................................................................... 147
Figure E-2. Characterization of the firing rate dynamics along the spike trains of STN neurons in control and
lesioned animals. Results presented as in Figure E-1. ........................................................................................ 148
Figure E-3. Analysis of the variance in the frequency domain in (and between pairs of) GPe and STN neurons
during the course of the recordings. In the upper four panels, the spike trains were partitioned in segments of 20
seconds, in which the auto spectrum was computed. The ΔPow was calculated as the difference between the
frequency spectrum from each segment and the mean spectrum of all 5 segments of each spike train. The results
are presented as the average ± SD of all ΔPow across all GPe neurons in control (A) and lesioned (B) animals,
and across all STN neurons in control (C) and lesioned (D) animals. In the lower panels is shown the analysis of
the interactions between pairs of STN/GPe neurons in the same way as explained above, although cross spectra
were computed in segments from both spike trains. ........................................................................................... 149

xiii
LIST OF TABLES
Table 2-1. Parameters included in the calculus of the conditional probability from Equation 14 for the ‘Rate’,
‘Auto’, ‘Cross’ and ‘Full’ models......................................................................................................................... 51
Table 4-1. Parameters of damped sinusoids that best fit the transfer functions between STN and GPe neurons. ,
maximum amplitude; β, damping rate; Θ, phase of the cosine function; f, frequency characteristics. Note GP-TA
and GP-TI neurons were only defined as such in lesioned animals. ................................................................... 103
Table 4-2. Parameters of damped sinusoids that best fit the transfer functions within GPe. See Table 4-1 for
abbreviations. ...................................................................................................................................................... 105
Table 5-1. Parameters that describe the damped sinusoid functions that better fit the temporal profiles of the
cross terms of the ‘Full’ model: , maximum amplitude; β, damping rate; Θ, phase of the cosine function; f,
frequency characteristics. ................................................................................................................................... 122
Table A-1. Summary of the dataset used in the studies, referenced to each chapter. Single cell activity was
simultaneously recorded from GPe and STN neurons, from control and 6-OHDA lesioned animals.
Additionally, the GPe data set was split in two sub-populations: GP-TI and GP-TA (see chapter 4). In the last
two rows is the dataset used in the chapter 5 study, where neurons from the GPe of 6-OHDA lesioned rats were
recorded before (GPe OFF APO) and after (GPe ON APO) treatment with apomorphine (APO). ................... 138

xiv
ACKNOWLEDGMENTS
I finish this laborious but very fulfilling experience that was my PhD studies allowing myself a bit of
“lamechice”, as we say in Portugal. Also because such a journey spent between London, Washington DC and
Lisbon means a lot of people to whom I am grateful for numerous reasons.
My biggest debt of gratitude is to my supervisors Bruno Averbeck and Peter Brown, whose knowledge,
experience and generosity were more than I dared to wish from my mentors. Their inspiration has encouraged
me to pursue my career in science, furthermore to continue in the field of basal ganglia research. They taught me
how to think critically and to appreciate good scientific research and all of these skills will surely shape my
future work.
Also I am especially grateful to the Oxford gang: to Peter Magill for being my third mentor and sharing
his enthusiasm and thorough ways; to Nicolas Mallet for his amazing and hard work in collecting the data that
contributed to these studies, as well for his contagious energy; and to Andy Sharott for his friendship and for
providing my first glance at the secrets of electrophysiology in the rat basal ganglia. I have great memories from
our joint meetings.
I am grateful as well to Jorge Carneiro and Marie-France Sagot for organizing the Programa de
Doutoramento em Biologia Computacional (PDBC). To Jorge I thank for his enormous continuous support and
mainly for his immense understanding in my toughest times. My program mates – I should call them friends – I
thank you for being part of an intellectual and fun environment that we built despite a hectic year. In particular, I
want to thank the psychologist Daniel Ferreira, whom I will always remember and admire for daring to pursue
his belated passion for mathematics in neuroscience.
Also I would like to acknowledge Judith Walters, my current postdoctoral mentor, for the support and
freedom I enjoyed in this last period of putting this thesis together.
My dear companions of the PhD journey, Moonsang Seo and Simon Evans, I thank for the fun times we
had in London and Washington, and I wish them all the luck in the post-Averbeck lab life. Also I acknowledge
Eunjeong Lee, who joined us in London, for her enthusiasm and all I learned about Korean gastronomy. I would
like also to thank Shannon Gallager for all she thought me during my brief adventure in the monkey lab. I also
am very grateful to the Brown lab for all I have learned with them and for their always warm welcome.

xv
My association with three institutes plus a government funding institution and a lot of moving made of
these years the most bureaucratic of my life (and hopefully my future). I am deeply grateful to Manuela
Cordeiro, Kully Sunner, Debbie Hadley, Daniela Warr, Michelle Cook, Maya Joseph, Dionne Stephen and
Christine Dice (in the order I met them) and the dozens of other people who shared with me the burden of my
administrative duties.
In Washington, I have to thank Leonora Wilkinson for her companionship (and valuable advice as a
senior researcher) since the time we were discovering how it was to live in America. Also I would like to thank
my good friends Inês Ferreira and Nicholas Furl, as well to various other friends, for their crucial social support
and good times spent in this city.
In London I am especially grateful to my UK adoptive family, also flatmates, João Metelo, Alex Abreu,
Nuno Teles, Rita Maia and João Mouro, for their companionship and with whom I learned so much during the
late night debates about politics, economics and science. Also Justin Chumbley, André Marreiros, Nacho Obeso,
Pedro Pereira, Roman Gonitel and my dear little Jonathan – that by now I cannot deny anymore that he is taller
than I – and numerous other friends, I thank them for the many memorable moments we shared.
In Lisbon my special gratitude goes for my sweet parents, Susana, Rui Jorge, Vincent and Lena for all
the support and understanding I could wish for, as well for enduring my absence for long periods. To my sister
Rita and my brother Diniz, that I miss so much, I thank for their delightful visits to London and their endless
patience. I would like also to thank my aunt Mané and my charming cousin Miguel for their help and
encouragement during my first year in the program. To all my friends, impossible to name all here, I thank for
making me feel like if I had been always there when I visit Lisbon. I am also especially grateful to my ever
friend Ana Faro, who was the first to open my eyes to the world of research. To my bright little Lucas, I am
grateful for the inspirational drawings he sent me, his tenderness and joy.
Last but not least, I am immensely grateful to Andreas Klaus who kept me going during the last year of
the PhD with his intellectual challenges and great enthusiasm for neuroscience (and many other things), his
kindness, and his self made bread.
I also acknowledge Fundação para a Ciência e a Tecnologia for the financial support.
Uff! Time to dry the tears… Now comes the cool stuff.

xvi
TO ZULUCAS

17
1 INTRODUCTION
1.1 THE BASAL GANGLIA
The basal ganglia, as one of the most enigmatic structures in the brain, have been extensively studied
over the last few decades. Due to the intrinsic complexity of these subcortical structures it is still not clear what
their exact function is. The similarity of the neurotransmitter systems and anatomical connections of the basal
ganglia among vertebrates indicates that the evolution of these structures has been very conservative (Medina
and Reiner, 1995). This piece of the puzzle makes us think that the functions in which the primate basal ganglia
are involved are probably as important as in lower vertebrates. It has been shown that the basal ganglia play an
important role in movement control (Delong et al., 1985; Alexander et al., 1990; Brown, 2006). Furthermore,
several studies present evidence of their involvement in a wide range of other functions including cognition,
association, action selection and emotion (Alexander and Crutcher, 1990; Graybiel, 1995; Mink, 1996;
Redgrave et al., 1999).
The basal ganglia are a collection of nuclei densely connected to the cerebral cortex and thalamus, but
also to other brain centres. Established on both sides of the thalamus (Figure 1-1A), they form a fundamental
component of the vertebrate forebrain (telencephalon). Four major nuclei are conventionally considered to
characterize the basal ganglia: the striatum, the globus pallidus (GP), which in primates is considered to be
divided into external (GPe) and internal (GPi) segments; the subthalamic nucleus (STN) and the substantia nigra
(SN), a midbrain structure divided into two segments: the substantia nigra pars compacta (SNc) and the pars
reticulata (SNr) (Figure 1-1B and Figure 1-2). Using stereological counting methods and systematic random
sampling techniques, Oorschot (1996) quantified the number of neurons in several nuclei of the rat basal
ganglia, like the striatum (2.79 ×10⁶), the GPe (45.96 ×10
3), the STN (13.56 ×10
3), the SNc (7.20 ×10
3) and the
SNr (26.32 ×10³), estimating a total number of 2.883 ×10
6 cells.
The information processing in the basal-ganglia-thalamo-cortical circuit is strongly directional, receiving
its input from particular cortical and thalamic areas which exert excitatory input on the striatum, the primary

18
afferent structure of the basal ganglia. The GPi and the SNr give rise to the primary output of the basal ganglia,
which sends GABAergic inhibitory projections into the thalamus and brainstem. GABA, which is the major
inhibitory neurotransmitter in the mammalian central nervous system, dominates the signal flow in the basal
ganglia.
Alexander, DeLong, Strick and Crutcher suggested that the circuits that link cortex, basal ganglia and
thalamus were structurally and functionally segregated, and that a parallel functional architecture of the basal
Figure 1-1. The basal ganglia. A. Coronal section through the mid-thalamus at the level of mamillary bodies (taken from Fix, 2005).
B. Parasagittal section through the caudate nucleus and the substantia nigra (taken from Woolsey et al., 2003).

19
ganglia-thalamo-cortical circuitry was involved in the regulation of motor, oculomotor and cognitive behaviour
(Alexander et al., 1986; Alexander and Crutcher, 1990; Alexander et al., 1990). They proposed a model of the
basal ganglia-thalamo-cortical circuitry, the so called rate model, which has been expanded by other groups
(Crossman, 1989; Gerfen, 1992; Chesselet and Delfs, 1996; Smith et al., 1998), emphasizing the functional
relation between the striatum and the motor thalamus as determined by two different parallel pathways from the
striatum to the basal ganglia output nuclei: the direct pathway which connected the striatum straight to the
GPi/SNr neurons, and the indirect pathway that linked to the same output nuclei via relays in the GPe and STN
(Figure 1-2). Later, further evidence of direct projections from the cortex, in particular from the frontal lobe, to
the STN (Hartmann-von Monakow et al., 1978; Kitai and Deniau, 1981; Nambu et al., 1996; Joel and Weiner,
1997; Nambu et al., 1997; Mink, 2003) have led to the proposal of a third pathway connecting the cortex
directly to STN and then to GPi/SNr: the hyperdirect pathway (Gerfen, 2000; Nambu et al., 2002). Although the
rate model has been largely consensual, there has been some debate, in particular about the role of the indirect
pathway, but also about some fundamental
issues which will be addressed on the final
discussion (Kincaid et al., 1991; Marsden and
Obeso, 1994; Parent and Hazrati, 1995;
Stefani et al., 2002).
The striatum, the largest nucleus of the
basal ganglia, is regarded in rodents as a
single nucleus and in higher vertebrates as
being ventrally divided by the fibres of the
internal capsule into two regions similar in
structure: the caudate nucleus and the
putamen. The striatum receives its largest
inputs from virtually all neocortical areas and
thalamus via glutamate, an excitatory amino
acid. The primary motor cortex, the premotor
cortex, the supplementary motor area (SMA),
and the somatosensory cortex project to the
putamen (Kunzle, 1975; Flaherty and
Figure 1-2. Schematic representation of the basal ganglia-thalamo-cortical
circuit. STN: subthalamic nucleus, GPe: external globus pallidus, SNc:
substantia nigra pars compacta, SNr: substantia nigra pars reticulata, GPi:
internal globus pallidus, PPN: pedunculopontine nucleus.

20
Graybiel, 1991) and the associative cortical areas to the caudate nucleus and the putamen (Goldman and Nauta,
1977; Parent and Hazrati, 1995). Three main types of cells have been identified in the striatum: the GABAergic
medium aspiny interneurons (Kawaguchi et al., 1995), the giant aspiny cells – also called cholinergic
interneurons – and medium spiny neurons that make up around 95% of this forebrain structure in rodents and
75-80% in primates (Wilson, 1984; Tepper and Bolam, 2004). GABAergic medium-sized spiny neurons are
densely covered with dendritic spines and innervate the GPi/e and the SNr/c. Albin et al. in 1989 and Gerfen in
1990 proposed a division of these striatal neurons into two different populations based on the idea that dopamine
had different effects on them. This division was based on the neuroactive peptides that they co-express with
GABA (substance P and dynorphine or enkephalin) and according to the relative proportions of their D1 (D1
and D5) and D2-like (D2, D3 and D4) family of dopamine receptors. The D1-like receptor family when
activated by dopamine increases the formation of the second messenger cyclic adenosine monophosphate
(cAMP). On the other hand, when D2-type receptors are activated, cAMP production is inhibited (Civelli et al.,
1993). The medium-sized spiny neurons that carry dopamine D1-type receptors and express substance P give
rise to the monosynaptic direct pathway, projecting directly to the basal ganglia output. Conversely, the
polysynaptic indirect pathway originating in the D2-type/enkephalin medium spiny neurons, projects directly to
the GPe.
The GPe can be considered a central structure of the basal ganglia, since it projects to all its nuclei and
does not receive direct input from peripheral structures (Figure 1-2). Part of the conventional indirect pathway,
the GPe is known to receive major GABAergic inputs from the striatum and excitatory glutamatergic inputs
from the STN, and sends GABAergic projections to the STN and GPi/SNr. GPe has long been considered an
homogeneous GABAergic neural population (Oertel and Mugnaini, 1984), but recent studies have been showing
evidence that this nucleus is not the simple structure that it was thought to be. Based on anatomical,
electrophysiological and morphological properties, several in vitro and in vivo studies have suggested that GPe
can be divided into different subpopulations, but no consensus has yet been reached (Kita and Kitai, 1994;
Kelland et al., 1995; Cooper and Stanford, 2002; Mallet et al., 2008a; Bugaysen et al., 2010). GABAergic GPe
neurons have intrinsic oscillatory properties and the larger fraction were described as having elevated tonic
activity levels which were interrupted by pauses, whereas a minority as firing at low frequency with short
periods of bursting (Delong, 1971; Georgopoulos et al., 1983; Filion et al., 1991).
The STN is a gray-matter, small size nucleus which lies along the internal capsule. It is the only structure
in the basal ganglia that releases glutamate neurotransmitters and has been shown to have an heterogeneous

21
functional organization (Wichmann et al., 1994b). It receives its main inputs directly from striatum, cerebral
cortex, for the most part from the motor and pre-motor cortical areas, and GPe. The STN is regarded as having
the main role of stimulating the GPi/SNr output.
The SNc is composed of glutamatergic and dopaminergic neurons. The latter are another major input to
the striatum (nigrostriatal tract). In addition, the dendrites of the dopaminergic neurons of this midbrain structure
also expand into its neighbour, the SNr. The SNc is thought to regulate, by afferent dopaminergic signals, the
balance between the direct and indirect pathways by acting on differentially distributed D1 and D2-type
receptors.
It has been shown that the GPi/SNr nuclei have major GABAergic topological projections to the
thalamus (mostly the ventral thalamus), which are then relayed back to the cortex, as well as to the brainstem
(Mengual et al., 1999; Mana and Chevalier, 2001). Moreover, the basal ganglia outflow extends to the superior
colliculus (SC), the reticular formation (RF), the pedunculopontine nucleus (PPN) and the lateral habenula
(HBN). Specific motor tasks activate movement-related neurons in the GPi/SNr, inducing either phasic
increases or phasic decreases in their average rates of spontaneous discharge, which are very high
(Georgopoulos et al., 1983; Mitchell et al., 1987). It is this ability to generate repetitive discharges that allow the
basal ganglia output to control the information transmission to motor and cognitive areas of the brain, therefore
acting as a behaviour selector (Redgrave et al., 1999; Gurney et al., 2001). The GPi is less developed in rodents
than in primates and therefore in these species it is mainly the SNr through which the basal ganglia output. The
SNr projects its inhibitory connections to the thalamic nucleus, which subsequently drives the motor cortex
(Beckstead et al., 1979; Deniau and Chevalier, 1992; Tsumori et al., 2003).
According to the classical (and simplified) view of the direct/indirect pathways, the basal ganglia output
is activated by functionally opposite effects by both pathways in a balanced manner. Once excited by the cortex,
the striatum directly inhibits the GPi/SNr, causing a lower inhibition (or disinhibition) of its targets.
Additionally, the striatum transmits inhibitory signals to GPe neurons, decreasing its tonic activity and
subsequently its inhibitory action on STN. Therefore, STN will excite the GPi/SNr complex, contributing to the
thalamus inhibition. Such a detour in the indirect pathway is based on the assumption that the GPe regulates the
STN activity through inhibitory control, a view that has been supported by many studies (Fujimoto and Kita,
1993; Plenz and Kitai, 1999). During the 90’s, anatomical studies brought stronger evidence that GPe sent
GABAergic projections to the GPi/SNr (Hazrati et al., 1990; Kincaid et al., 1991; Bolam and Smith, 1992; Kita
and Kitai, 1994). Additionally, Shink et al. (1996) traced the interconnections between GPe, STN and GPi of six

22
squirrel monkeys using biotinylated dextran amine (BDA) injections, showing that STN and GPe were tightly
connected and innervated common regions of GPi. They hypothesized that STN cells that establish excitatory
projections on to GPi neurons also inhibit the same neurons via a GPe relay. Moreover, our understanding of the
information transmitted to the output aggregate via the STN is not yet clear. Whether it is from the cortex to
STN through the striatum-GPe double inhibitory pathway (the indirect pathway) or by the excitatory cortical
direct projection to STN (the hyperdirect pathway) is still under discussion. Several studies in rats and monkeys,
where single cell recordings from the GPe and STN were conducted while stimulating the cortex, have shown
that there is an excitatory response in both GPe and STN following such a stimulus, yet the latency is longer in
GPe (Ryan and Clark, 1991; Nambu et al., 2000). These results suggest that there is an excitatory domination of
STN over GPe. According to Nambu et al., the signal transmission in the direct and indirect pathways is slower
than in the cortico-subthalamo-GPi (hyperdirect) pathway. These authors suggest that the latter is the pathway
activated when the cortex is triggered due to prior movement initiation, resulting in strong excitation of the
GPi/SNr and further inhibition of their targets engaged in the selected motor program (Nambu et al., 2000).
Although different views about the functioning of the excitatory-inhibitory closed loop formed by GPe and STN
have arisen, it is agreed that they have an essential role in basal ganglia information transmission (Shink et al.,
1996; Smith et al., 1998; Plenz and Kitai, 1999). This intrinsic STN-GPe loop, which was described by Plenz
and Kitai (1999) as a central pacemaker regulated by the striatum, is likely to be involved in the mechanisms
that underlie the hypokinetic and hyperkinetic movement disorders like Parkinson’s disease, dystonia,
Huntington’s disease or Tourette’s disorder. These anomalous mechanisms are probably a consequence of
altered firing rates in the GPi/SNr which presumably are due to a disturbed balance between the pathways that
project to the basal ganglia output complex. It is then important to fully comprehend the dynamics of the basal
ganglia-thalamo-cortical circuits in order to recognize and treat these motor pathophysiologies.
1.2 PARKINSON’S DISEASE
It was in 1817 that James Parkinson, in his classic “An essay on the shaking palsy” (Parkinson, 1817),
thoroughly described the disease which bears his name. In his essay, Parkinson emphasized that at that time

23
“this disease does not accord with any which are marked in the systematic arrangements of the nosologists”, as a
consequence of the complexity and large variety of symptoms that portray each stage of the disorder.
Parkinson’s disease (PD) affects tens of millions of people around the world and approximately 120,000 people
in the UK, which is around 0. 2% of the general population, and about 1% of the population above 55 years old,
with higher incidence in men than in women.
It is well accepted that PD is a progressive neurodegenerative disorder associated with the selective
degeneration of dopaminergic neurons mainly in the SNc which project through the nigrostriatal pathway to the
striatum (Bernheim et al., 1973; Kish et al., 1988; German et al., 1989; Goto et al., 1989; Rinne et al., 1989;
Fearnley and Lees, 1991). The striatum, the main BG entrance gate, receives inputs from these structures, but
also from cerebral cortex and thalamus and projects to the pallidonigral formation. Therefore, damage of the
midbrain dopamine system results in dopaminergic denervation of the striatum, progressing from the rostral-
dorsal striatum to the anterior putamen and caudate nucleus and propagating perturbations throughout the entire
cortico-striatal network. The deterioration of the nigrostriatal system is thought to be the factor that contributes
most to the motor impairments seen in PD (Kish et al., 1988; Goto et al., 1989). Although the loss of pigmented
neurons in the SNc is massive, the degeneration of dopaminergic cells in the midbrain of PD patients is not
homogeneous; cell loss has been detected in other areas like the ventral tegmental area (VTA) and the SNr
(Hirsch et al., 1988; German et al., 1989).
In addition to the degeneration of the dopaminergic cells, other neurotransmitter systems are altered in
PD. The neuropathological signature of PD is the widespread presence of Lewy bodies (eosinophilic
cytoplasmic inclusions) in subcortical nuclei (Lewy, 1912; Lewy, 1913; Jellinger, 1990; Charlton and Crowell,
1995). Lewy bodies are anomalous deposits of a protein made of abnormal filamentous material containing α-
synuclein that form inside the brain’s nerve cells and are thought to account for the degradation of cognitive
functioning in PD, as well as in other disorders such as Alzheimer's disease and Lewy Body Dementia (Gibb,
1986; Forno, 1996). Post-mortem neuropathological studies (Candy et al., 1983; Whitehouse et al., 1983) and
later also imaging studies (Kuhl et al., 1996; Shinotoh, 1999; Bohnen et al., 2003) on PD patients have reported
significant cholinergic forebrain neuronal losses in the nucleus basalis of Meynert, above the amygdala and just
beneath the globus pallidus. The cholinergic (acetylcholine-producing) system is involved in the regulation
of memory and learning and the decrease of the neurotransmitter acetylcholine (ACh) is associated with the
memory deficits seen in Alzheimer’s disease. Furthermore, it has been observed that there is loss of
norepinephrine (NE) in the locus coeruleus – a dense cluster of neurons in the dorsorostral pons with projections

24
throughout the central nervous system (CNS) – and serotonin (5-hydroxytryptamine; 5-HT) in the dorsal raphe
in Parkinsonian patients (Scatton et al., 1983; Gaspar and Gray, 1984; Chanpalay and Asan, 1989; German et
al., 1992). These pathologies may be involved in the motor dysfunction, but also contribute to cognitive and
affective changes in PD. The wide variation of symptoms manifested across subjects, are thought to be due to
different pathophysiological mechanisms, even though these are still poorly understood.
The major motor impairments characterizing PD are resting tremor, the inability to initiate movement
(akinesia), slowness in the execution of voluntary movement (bradykinesia) and muscle rigidity. Two main
subgroups of idiopathic PD have been identified based on clinical manifestations. The most severe variety is
dominated by akinesia/bradykinesia and rigidity (type-AR), where postural instability, gait disturbances and
deterioration of cognitive functions are more pronounced. Less common is when tremor is the most prominent
feature (type-T), with greater preservation of mental status (Hoehn and Yahr, 1967; Zetusky et al., 1985; Paulus
and Jellinger, 1991).
Slow tremor, typically in one hand but sometimes in several limbs, is commonly the first symptom to be
detected. Two different types of tremor with different physiological mechanisms were described by De Jong
(1926) and later by Lance (1963): rest tremor and the action tremor. The former is an involuntary rhythmic
tremor at around 3-6 Hz present when the patient is at rest, but it is suppressed or diminished with movement,
although it reappears seconds later. The action tremor is characterized by a higher frequency (7-10Hz) and
appears during muscle contraction. A relationship between cortical oscillations and muscular activity in tremor
had long been discussed before it was shown in 1996 (Volkmann et al., 1996; Brown et al., 1997; Hellwig et al.,
2000). The involvement of basal ganglia pathology in the development of Parkinsonian tremor is still not clear,
but the correlation observed between rest tremor and GPi activity (Hurtado et al., 1999) suggests that it may
have a considerable role as a consequence of dopamine depletion. Also posteroventral pallidotomy (Svennilson
et al., 1960; Laitinen et al., 1992) and stereotactic lesions to the ventralis intermedius thalamic nucleus (VIM, a
cerebellar receiving area) (Narabayashi, 1989; Hayase et al., 1998) have been used for the surgical treatment of
PD, providing long-lasting effective alleviation of tremor. Bergman et al. (1990) showed that ibotenic acid
lesions of STN in Parkinsonian monkeys decreased tremor, as well as major motor irregularities. Therefore, it is
possible that Parkinsonian tremor is mainly driven by pathways which involve the STN, GPi, and thalamus,
rather than pathways which project directly to the brain stem or pathways through the PPN. This idea is
supported by the results of PPN lesions which do not give rise to tremor (Kojima et al., 1997; Aziz et al., 1998;
Nandi et al., 2002) but instead induce akinesia and rigidity. Therefore, as prominent akinesia is not induced by

25
stereotactic thalamotomy involving pallidal
receiving areas (Marsden and Obeso, 1994;
Burchiel, 1995) but is alleviated with pallidotomy
(Lozano et al., 1995; Baron et al., 2000) and STN
lesions (Bergman et al., 1990; Aziz et al., 1991),
akinesia is likely associated with the downward
projections of the basal ganglia to the PPN and the
silencing of neurons from this brainstem structure.
PPN neurons have been shown to project to the
thalamus and to form a caudally-directed pathway
which is involved in the control, initiation and
termination of automatic motor tasks such as gait,
and in postural stability and sleep disorders (Masdeu
et al., 1994; Lee et al., 2000; Pahapill and Lozano,
2000). Additionally, PPN receives inhibitory
projections from the SNr and GPi nuclei (Nauta and
Mehler, 1966; Noda and Oka, 1986; Granata and
Kitai, 1991) and excitatory descending input from
STN (Hammond et al., 1983; Kita and Kitai, 1987; Granata and Kitai, 1989). It has been shown that STN has
abnormally high firing rates in rodent (Hassani et al., 1996; Mallet et al., 2008b; chapter 4, Cruz et al., 2011)
and primate models of PD (Bergman et al., 1994) as well as in human Parkinsonism. This excessive STN
activity results in excessive inhibitory output from the SNr and GPi projections to PPN. So, blocking the
excessive descending inhibition from the BG output with lesions of STN or GPi may alleviate akinesia by
reversing the suppression of PPN activity, and therefore averting changes in thalamic activity which have been
implicated in akinesia (Figure 1-3) (Albin et al., 1989; Delong, 1990; Graybiel, 1990).
Like akinesia, rigidity – an increase in muscle tone which causes resistance to passive movement – is a
motor coordination anomaly rather than a behaviour selection irregularity. Rigidity is also decreased with STN
ibotenic acid lesions in Parkinsonian monkeys (Bergman et al., 1990; Wichmann et al., 1994a). In the same
context, it has been shown that muscle tone is increased by blocking dopamine receptors in the STN and
therefore augmenting activity in this nucleus (Hemsley et al., 2002). These results suggest that the STN
Figure 1-3. Schematic representation of the basal ganglia-thalamo-
cortical circuitry in Parkinson’s disease. The variation in the width of
the connecting arrows relative to those in Figure 1-2 correlates with
the change in neural activity after dopaminergic cell loss in the SNc
and consequent dopamine depletion in the basal ganglia circuits.
Same abbreviations as in Figure 1-2.

26
influences the dynamic mechanisms of rigidity. What is not known is if the lesion of the STN has an effect on
rigidity by following a subcortical pathway throughout the PPN or via thalamo-cortical pathways.
1.3 DOPAMINE REPLACEMENT THERAPIES
Over the past centuries, a variety of attempts have been made to find a treatment for idiopathic PD.
Drugs like anticholinergics — agents which block, in the central and the peripheral nervous system,
the neurotransmitter acetylcholine, which contributes to regulation of muscle movement – were shown not to be
of great assistance. Also stereotaxic ablative surgery in the basal ganglia, which was described as early as 1940
(Meyers, 1940, 1942), proved to provide little improvement for the most disabling symptoms of PD. In early
studies, stereotactic lesions in the globus pallidus appeared to improve rigidity, but inconsistent results were
reported for the relief of tremor and bradykinesia (Cooper and Bravo, 1958b; Svennilson et al., 1960). Levodopa
therapy was established in the late 1960’s as the first efficient treatment for PD (Cotzias et al., 1969; Marsden
and Parkes, 1977). Levodopa is a precursor to the neurotransmitter dopamine. It enhances synthesis, storage and
release of dopamine; so high doses of the drug control the disabling symptoms of PD including akinesia and
bradykinesia, even in patients with severe Parkinsonism. Although levodopa therapy has many beneficial
effects, it also results in many side effects such as dyskinesia – involuntary movement –, nausea and vomiting,
as well as cognitive dysfunction. It has been shown that PD patients taking levodopa or other dopamine agonists
are more risk prone than healthy controls and often develop gambling addictions and other impulsive or
compulsive behaviours (Djamshidian et al., 2010).
For patients in whom levodopa medication is no longer effective often apomorphine is prescribed. This
drug, sometimes used as a complement to levodopa, is a potent dopamine agonist that acts directly on D1 and D2
striatal dopamine receptors and therefore has different pharmacokinetic mechanisms to levodopa. Apomorphine
is administered subcutaneously by injection or via an infusion pump that often results in the development of skin
nodules which can cause discomfort. The response of apomorphine is of shorter duration than that to levodopa

27
and both drugs present similar side effects, although the occurrence of nausea and hallucinations are more
frequent with apomorphine.
1.4 DEEP BRAIN STIMULATION
Dopamine replacement therapy has proved to be an important and long-term way to control the motor
symptoms in PD in many patients. However, the complications that arise and tend to intensify as the disease
progresses and the intensification of ON-OFF fluctuations make it a suboptimal treatment. In the beginning of
the 90’s, Deep Brain Stimulation (DBS) took its first steps as a proficient treatment for PD and other motor
disorders. It was Benabid et al. that in 1987, while performing a thalamotomy of the VIM, discovered that
stimulating this structure at high-frequency (around 100 Hz) would suppress tremor. Over the following years,
this group from Grenoble refined the DBS of VIM which, as the thalamotomy, suppressed tremor but did not
improve akinesia or rigidity. Furthermore, experimental work on monkeys rendered Parkinsonian by
1-methyl-4-phenyl-1,2,3,6-tetrahydropyridine (MPTP), a neurotoxin that permanently destroys dopaminergic
neurons in the SNc, allowed a better understanding of the basal ganglia and showed that intranuclear lesion of
the STN was associated with a substantial decrease of tremor, akinesia, rigidity and bradykinesia (Bergman et
al., 1990; Aziz et al., 1991; Benazzouz et al., 1993). Following these successful findings, the bilateral high-
frequency DBS of the STN was introduced in 1993 for the treatment of severe Parkinsonism (Pollak et al.,
1993b; Benabid et al., 1994; Limousin et al., 1995). The following year, Siegfried and Lippitz carried out DBS
of GPi for the treatment of advanced PD (Siegfried and Lippitz, 1994). DBS does not prevent the progression of
the disease, but in the patients that are eligible for the surgery it can – although it not always does – significantly
improve the motor symptoms and quality of life (Deuschl et al., 2006; Weaver et al., 2009). Nevertheless,
adverse motor and cognitive effects can develop with DBS, like dyskinesia, speech and cognitive dysfunction.
Although DBS of GPi has proven to have a lower incidence of surgical complications and cognitive secondary
effects than DBS of STN, its motor effects are arguably less marked. DBS of STN improves all Parkinsonian
symptoms, except gait, speech and dyskinesia, whereas the DBS of GPi has a good effect on bradykinesia and
rigidity and a moderate effect on tremor and dyskinesia (Okun et al., 2009; Follett et al., 2010). Also STN DBS

28
allows a reduction of dopamine replacement medication (Follett et al., 2010). Currently, the STN is still the
most selected functional basal ganglia target for DBS in PD.
DBS surgery for PD involves the stereotactic implantation of an electrode with four contacts which is
connected to an implantable pulse generator that might reside in the anterior chest wall, below the clavicle, or
the abdomen. This programmable battery-powered device stimulates the selected brain target, driving its neural
activity at very high frequencies, generally around 150 Hz (Hemm and Wårdell, 2010). DBS techniques have
improved during the last decade and nowadays they are used worldwide with over 40,000 implant procedures
already performed in PD patients (Benabid et al., 2009). However, although there have been a few studies that
tried to explain the fundamental mechanisms underlying the therapeutic effects and the adverse side effects of
DBS, these remain largely unclear (Dostrovsky and Lozano, 2002; McIntyre et al., 2004; Dorval et al., 2008;
Liu et al., 2008; Gradinaru et al., 2009).
1.5 BASAL GANGLIA-THALAMO-CORTICAL CIRCUIT IN PARKINSON’S
DISEASE
Over the years, excessive excitation of the STN has been increasingly identified as one of the
pathophysiological mechanism of PD, contributing to the selection of this nucleus as the preferred target in the
surgical treatment of the disease. Through the current understanding of the functional alterations of the basal
ganglia-thalamo-cortical circuitry in Parkinsonism (Figure 1-3), scientists have generally accepted an hypothesis
that explains such behaviour of the STN (Obeso et al., 1997). The decrease of the dopaminergic nigrostriatal
input to the striatum is believed to increase the striatal inhibition of GPi/SNr (direct pathway). On the other
hand, it leads to an increased inhibition of the GPe and subsequent reduction of the inhibitory effect of the GPe
on the STN, resulting in hyperactivity of the STN and exaggerated excitation of the GPi and SNr by the STN
(indirect pathway). Therefore, dopamine depletion leads to unbalanced regulation of the basal ganglia output. It
is thought that the weakened inhibition of GPi/SNr by the striatum via the direct pathway is compounded by the
increased excitation of STN upon GPi/SNr, leading to increased inhibition of the brainstem and thalamus and

29
consequent reduction of thalamo-cortical activation. Although STN may be the preferred target for DBS, it is
still not fully clear which is the structure (or structures) responsible for Parkinsonian symptoms.
1.6 OSCILLATORY ACTIVITY IN THE BASAL GANGLIA
Along with the exaggerated tonic output, other major physiological irregularities in the Parkinsonian
basal ganglia have been shown: phasic oscillations and excessive synchrony is considered to be characteristic of
PD. Hurtado et al. in 1999, by studying the tremor-related neural activity in the GPi of one awake patient during
a stereotaxic pallidotomy surgery, introduced the concept that the basal ganglia may be composed of several
independent oscillating circuits (Hurtado et al., 1999). Since then, the development of functional neurosurgery,
in particular DBS, has allowed several teams to record directly from the human basal ganglia. These data
provided a better understanding of the network dynamics and the real impact of dopamine depletion in the basal
ganglia-thalamo-cortical circuitry. Recordings can be made intraoperatively, where microelectrodes are used to
record from single cells and local field potentials (LFP) in the selected target, or postoperatively, where LFPs
can be recorded from the implanted DBS electrodes while their leads are externalized. Around 7 days after the
surgery, these DBS macroelectrodes are connected to the subcutaneous stimulator (Brown and Williams, 2005).
Brown et al. (2001) recorded LFPs from macroelectrodes in GPi and STN of 4 PD patients without
tremor, at rest and while performing isometric contraction of the wrist extensors. The patients performed the
task while OFF and ON levodopa. They showed that, without dopamine replacement medication, the power
within GPi and STN and the coherence between these nuclei was increased at frequencies lower than 30 Hz.
After the administration of levodopa, these patients presented a reduction of the low-frequency activity in these
nuclei and an increase of higher frequency oscillations at around 70 Hz. In other studies, the same group
confirmed these results and, by calculating the coherence and phase between LFPs recorded in STN and GPi
and cortical EEGs of Parkinsonian patients, showed that the cerebral cortex drives the basal ganglia at
frequencies <30 Hz (Marsden et al., 2001) and that in the presence of dopaminergic activity over the higher
frequencies, STN drives the cortex, in particular the SMA (Williams et al., 2002). The recordings were

30
conducted while patients were OFF and ON the dopamine precursor levodopa, at rest and/or while performing a
tonic extension of the wrist contralateral to the implanted DBS macroelectrode. Levy et al. (2002) also observed
beta frequency (13-30 Hz) oscillations in LFPs of 14 pairs of STN cells of 8 PD patients, as well as its reduction
by dopaminergic medication treatment. Additionally, they showed that these beta oscillations decreased during a
‘chest-to-target’ reaching movement. Levy et al. further suggested that the firing of STN neurons can be
synchronized by 15-30 Hz cortical beta frequency oscillatory activity, and that this synchronization contributes
to the pathology seen in PD patients. Based on these findings showing coupling between basal ganglia and
cortical activity, Brown (2003) classified low frequency oscillations (3-10 Hz), predominately seen at
Parkinsonian rest and action tremor, and beta frequency oscillations as antikinetic whereas oscillations >60 Hz
as prokinetic.
The beta frequency oscillations seen in the LFPs in the STN of Parkinsonian patients during rest were
also seen by Amirnovin et al. in the activity of single cells, as well as its significant decrease during movement.
They performed STN microelectrode recordings of 184 cells, including 47 pairs simultaneously recorded, from
11 PD patients OFF medication while carrying out visually guided movements –patients were required to direct
a cursor to one of four targets on a monitor with the help of a joystick – during DBS surgery. Additionally, they
observed a large increase in the firing rates of STN (Amirnovin et al., 2004). Alonso-Frech et al. (2006) studied
STN LFPs from 14 PD patients and detected high correlation between low-frequency oscillations and symptoms
of dyskinesia. In addition to the characteristic oscillations seen in PD while OFF and ON medication as
described in previous studies, they found an increment of 72.6% in the oscillations in the 4-10 Hz band in the 11
PD patients who presented dyskinesias while ON levodopa. More recently, a study analysed the background
oscillations and spike trains of microelectrode recordings from 39 PD patients at rest while OFF
antiparkinsonian medication (Moran et al., 2008). They noted that the 231 STN cells oscillated mainly in two
bands: the tremor frequency band that they defined as 3-10 Hz, and what they called the high frequency band (8-
20 Hz). They found that the neurons that fired at the latter frequencies tended to oscillate for longer periods and
always coherently with their background. On the other hand, neurons firing at the tremor frequencies oscillated
more episodically and only half were coherent with their background. Moran et al. suggested that the two
neuronal populations were the outcome of different oscillatory drives deriving from different local functional
neuronal organizations.
The beta frequency oscillations seen in the basal ganglia of PD patients OFF medication, as well as their
suppression as the patient prepares or initiates voluntary movement and when under antiparkinsonian

31
medication, are very consistent findings in numerous studies (Brown et al., 2001; Marsden et al., 2001; Levy et
al., 2002; Williams et al., 2002; Williams et al., 2003; Amirnovin et al., 2004; Kuhn et al., 2004b; Williams et
al., 2005; Alonso-Frech et al., 2006; Moran et al., 2008). Nevertheless, it is still poorly understood which
physiological and dynamical mechanisms are behind these abnormal oscillatory activities and network
differences in PD. Also the question of whether these oscillations are directly responsible for the anomalous
motor response in patients is still under discussion. In the absence of recordings in the healthy human basal
ganglia at rest and during voluntary movement, the use of animal PD models has been of high importance.
Besides the MPTP model, used mainly in monkeys, the toxin-induced 6-hydroxydopamine (6-OHDA) PD
model usually applied to rats has been an important tool to study the basal ganglia-thalamo-cortical network
(Pan and Walters, 1988; Burbaud et al., 1995; Magill et al., 2001; Sharott et al., 2005b; Mallet et al., 2008a;
Mallet et al., 2008b; Avila et al., 2010).
1.7 6-HYDROXYDOPAMINE ANIMAL MODEL
Urban Ungerstedt in the late sixties observed that unilaterally injecting 6-OHDA into the dopamine cell
bodies of the substantia nigra, and the subsequent depletion of the nigro-striatal dopamine system, produced a
marked motor asymmetry in rats (Ungerstedt, 1968). This unilateral-lesion technique has since been the most
commonly used animal model of hemi-Parkinsonism, being highly selective and reproducible (Ungerstedt and
Arbuthnott, 1970). At rest, rats with a unilateral 6-OHDA lesion, exhibited postural asymmetry and when under
direct or indirect dopamine agonists revealed a turning behaviour (Ungerstedt, 1976). Therefore, the most
commonly used assessment of the success and extent of the lesioning is the drug-induced rotation test: if the
unilaterally 6-OHDA lesioned rat is challenged with indirect dopamine receptors agonists, that produce
dopamine release from intact nigrostriatal terminals, the animal will rotate ipsilaterally (away from the intact
side of the brain); on the other hand, if a direct dopamine receptor agonist is administered, the lesioned rat will
rotate towards the intact side of the brain. Studies have shown a positive correlation between rotational rates and
the extent of depletion of dopaminergic cells in the SNc or depletion of striatal dopamine (Schmidt et al., 1982;
Carman et al., 1991; Hudson et al., 1993; Schwarting and Huston, 1996b; Mallet et al., 2008b). When the 6-

32
OHDA neurotoxin is injected at the origin of the nigrostriatal dopamine bundle (medial forebrain bundle), it
leads to an extensive dopamine depletion (>97%), modelling a very advanced stage of PD. In contrast, injecting
the neurotoxin in the terminal field of the nigrostriatal pathway generates a partial lesion with a slower
progression. This latter model of PD is appropriate to study the effects of neuronal protective interventions
(Sauer and Oertel, 1994; Kirik et al., 1998).
Like in human and non-human primate studies, several firing rate and activity pattern irregularities have
been found in the basal ganglia of 6-OHDA-lesioned rats (Pan and Walters, 1988; Hollerman and Grace, 1992;
Kreiss et al., 1997; Vila et al., 2000). Interestingly, Burbaud et al. (1995) observed, in dopamine-depleted rats
under urethane anaesthesia, a substantial increase in the firing rate and burst pattern of unit cell activity in the
SNr, which was corrected by an STN lesion. Additionally, they showed that the STN lesion decreased
apomorphine-induced rotational behaviour in the lesioned animals. Other studies have also found excessive beta
frequency oscillations in rats treated with 6-OHDA. Sharott et al. (2005b) investigated the LFP activity in the
frontal cortex and STN of awake rats and showed a significant increase of the beta frequency oscillatory activity
in both structures in the animals with lesions of midbrain dopamine neurons, in comparison with the healthy
rats. As observed in PD patients (Brown et al., 2001), these exaggerated beta frequency oscillations were
suppressed when the lesioned animals were challenged with the dopamine agonist apomorphine, increasing the
coherence between STN and cortex at gamma frequencies. Mallet et al. (2008a; 2008b) observed that chronic
disruption of dopamine transmission is responsible for abnormal beta frequency oscillations in the GPe, STN
and motor cortex of urethane-anesthetized rats. More recently, Avila et al. (2010) recorded unit and LFP activity
in the SNr and EMG activity from the scapularis muscle while rats walked on a rotary treadmill. They observed
that in the SNr of rats with unilateral lesion of the medial forebrain bundle, low beta frequency (12-25 Hz)
oscillations decreased during locomotion (in comparison to inattentive rest), while high beta frequency (25-40
Hz) oscillations increased.
In addition to the beta and gamma band oscillations, slow-wave activity (~1 Hz) was shown to be present
in anaesthetised 6-OHDA-lesioned rats. A few studies have pointed out the relevance of cortical input to the
basal ganglia in lesioned animals, and showed how the synchronous slow-wave activities seen in STN and GPe
or in SNr are intimately coupled to the rhythmical cortical activity (Magill et al., 2000, 2001; Belluscio et al.,
2003). Magill et al. observed significant changes in the dynamics of the STN-GPe network in 6-OHDA
midbrain lesioned rodents (under isoflurane/urethane anaesthesia) and the suppression of their low-frequency
oscillations after ipsilateral cortical ablation. In light of these results, the authors suggested that the abnormal

33
rate and pattern of activity in the STN-GPe network is related to the state of activation of the cortex (Magill et
al., 2000, 2001). Gradinaru et al. (2009) also showed the importance of cortical input to STN. In a breakthrough
optogenetics study, they optically stimulated selective M1 layer V neurons with projections to the STN and
observed large improvements in the Parkinsonian symptoms of the 6-OHDA rats. Moreover, ultra-slow rhythms
(<0.5 Hz) were observed in several basal ganglia nuclei of awake rats and were not altered after 6-OHDA lesion
(Ruskin et al., 1999b; Ruskin et al., 1999a; Allers et al., 2000). How these rhythms relate to motor control in
healthy or PD pathophysiology is still poorly understood.
Although there are significant differences between human Parkinsonian patients and unilateral 6-OHDA
lesioned rodents, this animal model of PD has been shown to replicate many of the typical network dynamics
seen in the basal ganglia-thalamo-cortical circuits of primates. Even though intuitively the MPTP lesioning of
non-human primates would be expected to be a better model of human PD, the frequency of synchronization of
the excessive oscillatory activity is higher in the 6-OHDA model than in the MPTP model, and closer to the
frequency observed in PD patients (Hammond et al., 2007).
1.8 INFORMATION THEORETIC MODELS APPLIED TO NEURAL CODING
Notwithstanding the contribution to our understanding of the basal ganglia network from numerous
clinical and experimental studies made during the past century, it is important to point out the continuous
development of computational modelling approaches to investigate the behaviour of such circuits in the last few
decades. Although information theoretic methods have been often used to study a variety of brain areas (Bialek
et al., 1991; Theunissen and Miller, 1991; Berry et al., 1997; Reich et al., 2001; Averbeck and Lee, 2006;
Montani et al., 2007; Shew et al., 2011), only a few studies of neural coding in the basal ganglia by means of
these techniques have emerged (Darbin et al., 2006; Dorval et al., 2008; chapter 3, Cruz et al., 2009; Lafreniere-
Roula et al., 2010; Lim et al., 2010; chapter 4, Cruz et al., 2011).
Information theory was developed in the 1940’s by Claude E. Shannon as a mathematical framework for
quantifying information transmission in communication systems and to find fundamental limits on signal

34
processing operations (Shannon, 1948). Information theoretic models allow us to quantify the maximum
potential information content carried by the neural response and thereby characterize the coding performance of
a system. Entropy is the measure of the transmitted information or variability. The entropy of spike trains sets an
upper limit of how much information they could offer about sensory and other inputs (measured in bits/s) or
gives a measure of how optimally the system codes these (measured in bits/spike) (Rieke et al., 1997).
Mackay and McCulloch in 1952 published the first work using information theory to study neural
coding. They presented a theoretical model that estimated the entropy of spike trains and the limits on
information transmission of spiking neurons. The spike trains were divided into discrete bins and mapped into a
digit binary number: if in a given time bin a spike occurred, it was represented as a ‘1’, if no spike occurred, as a
‘0’. Since then, many studies have applied similar frameworks to study neural coding using data from single cell
recordings, mainly from the visual, sensory and auditory systems. These areas have been preferentially chosen
since they allow the quantification of the information transmission in small networks in response to a stimulus in
more controlled environments. Bialek et al. (1991) characterized the neural code of one movement-sensitive
neuron in the fly visual system, showing that it approaches optimal real-time computation. Also Theunissen and
Miller (1991) studied 6 wind-sensitive primary interneurons of the cricket cercal sensory system, showing that
these were able to encode information about wind direction which corresponded to an average directional
accuracy of between 4.7 and 7.7 degrees. In the visual system of tiger salamanders and rabbits, it was shown
that firing events enclosing single spikes or bursts of spikes in the retinal ganglion cells happened precisely
enough to transmit distinct packets of visual information, suggesting that they may compose the fundamental
symbols in the neural code of the retina (Berry et al., 1997). Reich et al. (2001) estimated the information rates
in groups of V1 cells of anesthetized monkeys. They found that contrast-specific information varies across
neurons but has low correlation with the stimulus type, and that spatiotemporal pattern-specific information
rates strongly depend on the type of stimulus and neuron – that is simple or complex cells. However, an
important question for the understanding of neuronal processing is to which extent correlations reflect
redundancy (e.g., in input or overlap of tuning curves) or synergistic interactions. In a more recent study,
Montani et al. (2007) were able to answer this question for pairs of neurons in the primary visual cortex of
monkeys by means of an information component analysis. They studied the effect of stimulus-dependent
synchrony on neural coding of direction and contrast. They found that for direction coding the extra information
that resulted from the high synergy provided by visual stimulus-dependent synchrony counterbalanced the
redundancy. Yet, for contrast coding the redundancy was predominant.

35
The majority of studies using information theory methods have looked at the neural response to a
stimulus. However, it has been shown, based on data recorded from motion sensitive neurons of the fly visual
system, that the information conveyed in neural spiking events can be measured independently of assumptions
about the structure of the neural code (Strong et al., 1998; Brenner et al., 2000). Other key studies have
compared the structure of correlated activity within pairs and larger populations of neurons. Due to limitations
on collecting large amounts of data when performing in vivo single cell recordings, pair-wise correlations have
been often used in an attempt to characterize the interactions within entire networks. Schneidman et al., based
on the Ising model (Glauber, 1963), calculated the maximum entropy for cross-correlations up to 10
simultaneously recorded retinal ganglian cells from tiger salamanders and guinea pigs. They showed that the
weak pair-wise correlations found in the data presented “strikingly accurate but non-trivial prediction of the
collective effects”, explaining near 90% of the network interactions (Schneidman et al., 2006). Another study
using a maximum entropy model, this time in the primate retina, showed similar results: approximately 98-99%
of the multi-neuron synchrony in the network was predictable by pair-wise correlations (Shlens et al., 2006). It
also has been shown that correlations may increase or decrease the amount of information encoded by neural
populations (Averbeck et al., 2006). Although correlations are often present in neural activity and therefore have
been extensively studied, their role is not yet fully understood.
In more recent decades, new contributions to Shannon's information theory allowed the development of
techniques that have helped shed light on the functioning of biological systems such as neural networks. Hans
Marko, a telecommunications engineer from Germany, applied Shannon's mutual information to random objects
with causal structures and generalized the standard information theory to a bidirectional communication theory
(Marko, 1966). This communication theory was first applied to study the behaviour of monkeys. Marko and
colleagues showed that, based on the information flow between the animals, it was possible to distinguish a
dominant from a subordinate monkey (Marko, 1973). This notion of directed information, where the source is
dependent on the feedback information it receives, was later expanded by Massey and others (Massey, 1990;
Schreiber, 2000; Tatikonda and Mitter, 2009). Schreiber (2000) reformalized the concept of directed
information flow from one system evolving in time to another by introducing a measure of information he called
transfer entropy. Unlike the standard Shannon’s mutual information, the transfer entropy identifies asymmetrical
interactions and differentiates between emitting and receiving channels (see Appendix D for details). Barnett et
al. (2009) have shown that, under Gaussian assumptions, transfer entropy as defined by Schreiber is equivalent
to Granger causality. Recent studies investigating neural systems, mainly cortical networks, have applied the

36
transfer entropy tool to a large variety of data, such as recordings from single and multi-unit neural activity
(Gourevitch and Eggermont, 2007; Garofalo et al., 2009; Besserve et al., 2010; Buehlmann and Deco, 2010),
electroencephalogram (EEG) (Chavez et al., 2003; Sabesan et al., 2009) or magnetic resonance imaging
(Hinrichs et al., 2006; Lizier et al., 2011).
Only recently information theory was used to investigate neural pattern structures in the basal ganglia.
Darbin and colleagues have investigated the temporal organization of several basal ganglia nuclei, not using
Shannon's entropy, but a different entropy estimation tool called approximate entropy (ApEn) (Pincus, 1995).
This ApEn model quantifies complexity and irregularity in temporal structures (in arbitrary units) by looking at
the pattern of interspike intervals (ISI). Darbin et al. (2006) recorded the activity of single cells in the STN, GPe
and GPi of two awake Rhesus monkeys and compared the ApEn values calculated from the original 124 spike
trains against the ApEn obtained after shuffling the dataset. The authors identified an increase of ApEn – or
irregularity – after shuffling the data, what led them to conclude that the spiking activity in the STN, GPe and
GPi had a temporal organization which was broken down by the randomization. More recently, the same
analysis was done on intra-operatively recorded single cells from the GPe, GPi and STN nuclei of PD patients
undergoing DBS surgery (Lim et al., 2010). After the randomization of the 15 spike trains from each nucleus
(45 cells in total), the ApEn values also increased in 80% of the data, compared to the ApEn of the original data,
confirming the existence of non-linear temporal organizations in the GPe, GPi and STN of PD patients.
Moreover, the authors could not find a significant difference between the ApEn values in the three nuclei,
contrary to what had been found in the previous study (Darbin et al., 2006). In another study (Lafreniere-Roula
et al., 2010), the same measure of statistical irregularity (ApEn) was calculated based on the activity of 8 STN
cells recorded from 7 PD patients while undergoing DBS surgery. The recordings were done with the patient at
rest, before and after subcutaneous administration of apomorphine. Although there were no significant
differences in the firing rates of both populations, they reported a decrease of the entropy after apomorphine
treatment associated, in some of the neurons, with a more bursty activity. The authors claim their results support
the hypothesis that antiparkinsonian therapies operate by reducing the complexity of neural activity in the basal
ganglia. Interestingly, the results in this study (chapter 5) argue the opposite. It is shown that the administration
of apomorphine in dopamine depleted rats under anaesthesia increases the entropy in the GPe, restoring it to
levels similar to those estimated in control animals.
The ApEn has been a popular metric in biomedical and clinical studies, due to its ease of use, but also
due to its low requirements regarding the quality of the data. The method has been shown to be applicable on

37
small data sets with relatively low signal to noise ratio and to be robust to outliers (Pincus, 1991; Pincus, 1995).
It has been shown, however, that the application of ApEn statistics has important limitations which should be
taken in account when applied. First, as Pincus and others have pointed out (Goldberger et al., 1994; Pincus and
Goldberger, 1994; Pincus, 1995; Richman and Moorman, 2000), the ApEn introduces a bias towards higher
similarity in the time series. To measure the complexity of the data, the ApEn method compares patterns within
the time-series; it calculates the natural logarithm of the likelihood that the similarity between two patterns is
above a certain threshold (r) for a determined length (m) of the sequences being compared. A higher likelihood
that sequences of m data samples that are considered similar remain similar when the segment length increases
to m+1 observations, means a higher degree of regularity or predictability in the time series, and therefore the
ApEn will present lower values. To make sure that the individual probabilities for each pattern are defined, that
is to avoid the occurrence of log(0), the ApEn algorithm matches each pattern with itself. This procedure, when
applied to finite datasets, introduces a bias in the ApEn estimations toward lower values. A second central
limitation of ApEn is the sensitivity of the model to the necessary a priori specification of the parameters m and
r. Pincus (1991), based on the analysis of slow dynamic signals such as heart rate, recommended r to be in the
range of 0.1-0.2 times the standard deviation of the signal and suggested m = 2 to ensure reasonable estimates of
ApEn. These values have been widely used in studies applying ApEn in ECG, EEG or endocrine variability
analysis (Hartman et al., 1994; Bruhn et al., 2000; Burioka et al., 2005; Hu et al., 2008). It has been shown,
however, that for the analysis of faster dynamic signals, such as neuronal activity, the recommend values can
lead to incorrect conclusions (Castiglioni and Di Rienzo, 2008; Lu et al., 2008). The study by Lafreniere-Roula
et al (2010) applied the ApEn metrics using values in the range suggested by Pincus (m = 2 and r = 0.15 of the
standard deviation of the ISI distribution) to assess the effect of apomorphine in the statistical irregularity of
STN single cell activity in PD patients. The fact that the authors did not consider any of the limitations outlined
above intrinsic to the ApEn model, may contribute to the contrast between their conclusions and what we
observed in this study.
Dorval et al. (2008) analysed the firing pattern entropy in the activity of single neurons in the GPe, GPi
and motor thalamus of two MPTP treated monkeys while under STN DBS. Looking at the probability
distribution of ISIs to estimate the entropy (measured in bits/spike), they found that at low frequency stimulation
(2 Hz), the entropy decreased while at high frequency stimulation (around 136 Hz), the entropy increased in all
three structures. The authors suggested that clinically efficient high frequency stimulation of STN improves
motor impairments in PD by regularizing the pattern of activity throughout the basal ganglia-thalamic pathways.

38
1.9 OUR INFORMATION THEORETIC APPROACH
Despite the major advances in our understanding of PD, and in the techniques used to further investigate
the many features of the disease, the origins of the pathological patterns of neural activity seen throughout the
basal ganglia-thalamo-cortical circuitry are still uncertain. For the improvement and optimization of the existing
therapies to treat PD (or even the development of new ones), it is essential to acquire a deep understanding of
these abnormal network behaviours and their causes. In the present study we proposed innovative logistic
regression models (chapter 2) to estimate the network entropy of neural activity in the GPe of rats before and
after treatment with 6-OHDA, and quantified the upper bound of information coding capacity in this nucleus.
We examined the individual contributions of dynamical features (firing rates, oscillations, and synchrony) to the
changes in network entropy after dopamine depletion (chapter 3, Cruz et al., 2009). Additionally, we
investigated the impact of dopamine depletion on the functional connectivity between the STN and GPe (and
also between two sub-populations of GPe neurons) by estimating the bidirectional information transmission
between both nuclei (chapter 4, Cruz et al., 2011). We also looked at the effects of apomorphine on the coding
capacity in the GPe of dopamine depleted rats (chapter 5).
The main hypotheses tested in this study were:
The motor impairment in PD results from poor information processing in the basal ganglia.
Therefore, we predicted that GPe networks would have lower coding capacities in the Parkinsonian
animals than in control.
We expected that the excessive beta frequency oscillations, known to be present in the GPe of the
6-OHDA lesioned rats like in patients (Brown et al., 2001; Magill et al., 2006a; Mallet et al., 2008a),
would have a strong impact on the decrease of the coding capacity due to the correlation found
between the desynchronization of this abnormal activity and movement execution (Levy et al., 2002;
Amirnovin et al., 2004; Kuhn et al., 2004b).
Since the clinical features of PD tend to improve when treated with dopamine replacement therapies,
based on our previous hypothesis, we were expecting to find an increase in the coding capacity
of the GPe when the 6-OHDA rats were challenged with apomorphine.
In the following chapters we take you through our analysis and discuss such hypotheses.

39
2 THE MODEL
2.1 ABSTRACT
Spike trains tend to behave as point processes, i.e. a collection of points, where each point is associated
with a random variable. Thus we developed a point process model, based on the spike times of single neurons,
to study the coding capacity (i.e. entropy) in the external globus pallidus (GPe) network. Within a probabilistic
framework, we estimated the impact of spiking history in one or more neurons on current spiking probability.
This study of the temporal dependence allowed us to assess the levels of randomness of the neural activity, and
therefore to measure its entropy. Within this framework we were then able to study the relative impact of
different dynamical components (such as rates, auto and cross-correlations) known to deviate in the
Parkinsonian basal ganglia.
In this chapter we present the methods used in the studies in chapters 3, 4 and 5. We describe and derive
in detail the logistic regression model adopted to calculate the conditional probabilities in order to estimate the
entropy of the neural networks. Additionally, we present a study on different optimization algorithms and model
selection methods that allowed us to determine the most appropriate methods to process our dataset. We have
found that the cross-validated early stopping method performed better when fitting our data in contrast to the
iteratively reweighted least squares algorithm. Also, we used the Bayesian information criterion, as opposed to
the Akaike information criterion, for model selection.

40
Figure 2-1. Relation between the entropy and the
probability of occurrence of a “successful” event. The
entropy is higher when the uncertainty is also higher.
0 0.5 10
0.5
1
P(r = 1)
H(r
)
2.2 INTRODUCTION
Neurons have the essential function of transmitting information through the brain. It is reasonable to
assume that evolution has made this task efficient, temporally precise, and low noise. How the nervous system
transmits information has been extensively debated over the last decades. Information theory, as an effective
means of quantifying the uncertainty of stimulus-response functions in neural coding, was proposed several
decades ago. MacKay and McCulloch (1952) were the first to apply the principles of information theory laid
down by Shannon (1948) – which allowed the understanding and
quantification of information transmission in communication
systems – to a nerve cell. They have shown that in theory, neurons
were able to transmit vast quantities of information and have
proposed limits for the maximum volume of information that can
be relayed by a nerve cell. Since then, this mathematical
framework has been widely applied to investigate the neural
response functions throughout several different regions of the
brain (Bialek et al., 1991; Theunissen and Miller, 1991; Berry et
al., 1997; Reich et al., 2001; Averbeck and Lee, 2006; Montani et
al., 2007; Shew et al., 2011). However, only a few studies have used Shannon information theory to explore the
representation and transmission of information in the basal ganglia (Dorval et al., 2008; chapter 3, Cruz et al.,
2009; chapter 4, Cruz et al., 2011), and still much research is needed to fully understand its mechanisms in
health and disease.
To analyse the changes in the dynamics of the basal ganglia-cortical circuit that result from dopamine
depletion in Parkinson’s disease (PD), we estimated and compared the information capacity of the globus
pallidus external segment (GPe) and the connectivity between the GPe and subthalamic nucleus (STN) in
control and Parkinsonian animals. To delimit how much information can be transmitted between neurons, we
used a probabilistic model to estimate the entropy in the network. The entropy places an upper bound on the
information contained in a network, based on the uncertainty in a random variable. As shown in Figure 2-1, if
the probability of the occurrence of an event r is 0 or 1, there is no uncertainty in the prediction of its response,
and therefore the entropy related to that event is zero. If in the extreme case of P(r = 1) = 0.5, the uncertainty is

41
maximum and the entropy will take the highest value of 1 bit. The entropy (H) is a measure of coding capacity
and when associated with a discrete response r is defined as
.PlogP)1( 2 rrrHr
In a neural network, if several neurons are coding the same information, for example if they are firing
synchronously, or with the same pattern in time, there will be redundancy in the information processed.
Additionally, it will be possible to an extent, to predict their activity based on their past events or the activity of
other neurons. Thus, the higher the predictability of the activity of the neurons (e.g. based on consistent spike
timing, patterns of activity, clustering, etc.), the lower is the entropy (i.e. the coding capacity) in the network. A
network has maximum entropy when the activity of all neurons is unrelated, meaning that no redundant
information is being coded. The entropy can express the upper limit of the amount of information that can be
coded (or transmitted) when measured in bits/second. Alternatively, when measured in bits/spike, entropy
represents how optimal is the processing of the information (Rieke et al., 1997). Our analysis focused on the
former approach.
Next, we describe the mathematical grounds of the methods we used to calculate the entropy in the
neural network. We also present a comparison between the performances of some techniques which we
extensively tested.
2.3 MATERIALS AND METHODS
2.3.1 DATA COLLECTION
Experimental procedures were carried out on adult, male Sprague-Dawley rats (Charles River, Margate,
UK), and were conducted in accordance with the Animals (Scientific Procedures) Act, 1986 (UK). The
experimental proceedings were conducted by our collaborators Drs. Nicolas Mallet and Peter Magill at the MRC
Anatomical Neuropharmacology Unit, University of Oxford. The electrophysiological dataset on which this
study was based has been published previously (Mallet et al., 2008a).

42
2.3.2 6-HYDROXYDOPAMINE LESIONS OF DOPAMINE NEURONS
Unilateral 6-OHDA lesions were carried out as described previously (Mallet et al., 2008a; Mallet et al.,
2008b). Selective loss of dopaminergic neurons was attained by injecting 6-OHDA stereotactically into the
region adjacent to the medial substancia nigra (Perese et al., 1989; Przedborski et al., 1995). Twenty five
minutes before the injection of 6-OHDA, all animals received a bolus of desipramine (25 mg/kg, i.p.; Sigma) to
minimize the uptake of 6-OHDA by noradrenergic neurons (Schwarting and Huston, 1996b). Anaesthesia was
induced and maintained with isoflurane. The neurotoxin 6-OHDA (hydrochloride salt; Sigma) was dissolved
immediately before use in ice-cold 0.9% w/v NaCl solution containing 0.02% w/v ascorbate to a final
concentration of 4 mg/ml. Then 3 μl of 6-OHDA solution was injected adjacent to the medial substantia nigra
(4.5 mm posterior and 1.2 mm lateral of bregma, and 7.9 mm ventral to the dura (Paxinos and Watson, 1986).
The extent of the dopamine lesion was assessed 14 or 15 days after 6-OHDA injection by challenge with
apomorphine (0.05 mg/kg, s.c.; Sigma; Schwarting and Huston, 1996a). The lesion was considered successful in
those animals that made ≥80 net contraversive rotations in 20 min. Note that the emergence of exaggerated beta
oscillations after 6-OHDA lesions is not dependent on apomorphine (Sharott et al., 2005b). Electrophysiological
recordings were carried out ipsilateral to 6-OHDA lesions in anesthetized rats 21-45 days after surgery, when
pathophysiological changes in the basal ganglia are likely to have levelled out near their maxima (Vila et al.,
2000).
2.3.3 ELECTROPHYSIOLOGICAL RECORDINGS
Electrophysiological recordings were made in the GPe and STN of 16 dopamine-intact control rats (288-
412 g) and 23 Parkinsonian rats (6-hydroxydopamine-lesioned, 285-470 g at the time of recording). See Table
A-1 in the Appendix for a summary of the dataset. Anaesthesia was induced with 4% v/v isoflurane (Isoflo™,
Schering- Plough Ltd., Welwyn Garden City, UK) in O2, and maintained with urethane (1.3 g/kg, i.p.; ethyl
carbamate, Sigma, Poole, UK), and supplemental doses of ketamine (30 mg/kg, i.p.; Ketaset™, Willows
Francis, Crawley, UK) and xylazine (3 mg/kg, i.p.; Rompun™, Bayer, Germany). All wound margins were
infiltrated with the local anesthetic, bupivacaine (0.75% w/v; Astra). Animals were then placed in a stereotaxic
frame (Kopf). Body temperature was maintained at 37 ± 0.5°C using a homeothermic heating device (Harvard
Apparatus). Electrocorticograms (ECoGs), electrocardiographic activity and respiration rate were monitored

43
constantly to ensure the animals’ well being (Magill et al., 2006b). The ECoG was recorded via a 1 mm
diameter steel screw juxtaposed to the dura mater above the right frontal (somatic sensory-motor) cortex [4.5
mm anterior and 2.0 mm lateral of bregma (Paxinos and Watson, 1986)], and was referenced against another
screw implanted in the skull above the ipsilateral cerebellar hemisphere. Raw ECoG was bandpass filtered
(0.3-1500 Hz, -3 dB limits) and amplified (2000×; DPA-2FS filter/amplifier; Scientifica) before acquisition.
Extracellular recordings of unit activity and local field potentials (LFPs) in the GPe were simultaneously made
using “silicon probes” (NeuroNexus Technologies). Each probe had two vertical arrays of 16 recording contacts
(Figure 2-2). The arrays were separated by 500 µm, and, along each array, the recording contacts were separated
by 100 µm. Each contact had an impedance of 0.9–1.3 MΩ (measured at 1000 Hz) and an area of ~400 µm2.
The same probe was used throughout these experiments, but it was cleaned after each experiment in a
proteolytic enzyme solution (Magill et al., 2006b). This was sufficient to ensure that contact impedances and
recording performance were not altered by probe use and reuse. Monopolar probe signals were recorded using
high impedance unity-gain operational amplifiers (Advanced LinCMOS; Texas Instruments) and were
referenced against a screw implanted above the contralateral cerebellar hemisphere. Probes were advanced into
the brain under stereotaxic control (Paxinos and Watson, 1986), at an angle of 15° to the vertical to maximize
the spread of recording contacts across the GPe. After initial amplification, extracellular signals were further
amplified (1000×) and low-pass filtered (0–6000 Hz) using programmable differential amplifiers (Lynx-8;
Neuralynx). The ECoG and probe signals were each sampled at 17.9 kHz using a Power1401 Analog-Digital
converter and a PC running Spike2 acquisition and analysis software (Cambridge Electronic Design).
The GPe was easily distinguished from the striatum in which characteristically low levels of unit
activity were observed (Mallet et al., 2005; Mallet et al., 2006). Recording locations were additionally verified
after the experiments using standard histological procedures (Magill et al., 2006b). In some experiments, we
simultaneously recorded activity in STN and GPe. Unit activity and LFPs were recorded in the STN using
silicon probes (as above), or more commonly, using glass electrodes. In the latter case, extracellular recordings
of action potentials of STN neurons were made using 15–25 MΩ glass electrodes (tip diameter ~1.5 µm), which
contained saline solution (0.5 M NaCl) and Neurobiotin (1.5% w/v, Vector Laboratories). Electrode signals
were amplified (10×) through the active bridge circuitry of an Axoprobe-1A amplifier (Molecular Devices),
ACcoupled, amplified a further 100× and bandpass filtered at 300–5000 Hz (DPA-2FS; Scientifica), and finally,
sampled as for probe signals (see above). The STN was initially identified by comparison of recorded unit
activity with the known characteristic discharges of STN neurons in urethane anesthesia (Magill et al., 2001).

44
Moreover, the recording of activity evoked by bipolar electrical stimulation of the ipsilateral frontal cortex
allowed unequivocal targeting of the STN during experiments (Magill et al., 2004).
Cortical activation was defined according to ECoG recorded simultaneously with unit activity (Mallet
et al., 2008a). Activity was recorded, first, during slow-wave activity (SWA), which accompanies deep
anesthesia and is similar to activity observed during natural sleep, and second, during episodes of spontaneous
“cortical activation,” which contain patterns of activity that are more analogous to those observed during the
awake, behaving state (Steriade, 2000). Cortical activation was occasionally elicited by pinching the hindpaw
for 15 s with serrated forceps that were driven by a standard pneumatic pressure, as described previously
(Magill et al., 2006b). Note that we did not analyze neuronal activity recorded concurrently with the sensory
stimuli. Because the analyzed activity was recorded at least several minutes after the cessation of the brief pinch
stimulus, it was also considered as spontaneous. The animals did not exhibit either a marked change in the
electrocardiogram or respiration rate, and did not exhibit a hindpaw withdrawal reflex, in response to the pinch.
Moreover, withdrawal reflexes were not present during episodes of prolonged cortical activation, thus indicating
anesthesia was adequate throughout recordings. The data analysed in this study consisted of recordings of 100
seconds of the activity of unit cells during episodes of this spontaneous activated cortical state, which under
anaesthesia has been associated with the promotion of coherent beta rhythms in the basal ganglia-thalamo-
cortical circuit (Magill et al., 2000). Yet, it is essential to keep in mind that, due to the differences between its
physiological properties, the activity patterns of the anesthetized and unanaesthetized animals can only be
Figure 2-2. Experimental setup. A. Cortical activity (ECoG) and single cell activity were simultaneously recorded in the GPe and STN,
using silicon probes. Recordings from STN will be analyzed in chapter 4. B. Scheme of a 32-contact silicon probe including size and
distances between contact electrodes.
17
18
19
20
21
22
23
24
25
26
27
28
29
30
31
32
1
2
3
4
5
6
7
8
9
10
11
12
13
14
15
16
Contact #
100 mm
500 mm
413 mm2
32-contact silicon probe
Shank 1 Shank 2
Same Shank (1 vs. 1 or 2 vs. 2)
different Shank (1 vs. 2)
A B

45
compared at a qualitative level. Nevertheless, the urethane-anesthetized animal still serves as a useful model for
assessing ensemble dynamics within the basal ganglia (Magill et al., 2006b). In 6-hydroxydopamine (6-OHDA)-
lesioned animals, exaggerated beta oscillations emerge in cortico-basal ganglia circuits during activated brain
states (Mallet et al., 2008a; Mallet et al., 2008b). As we will discuss in detail in the next chapter, this beta
frequency oscillatory mimicked important activity patterns observed in the basal ganglia structures of
unmedicated, awake PD patients (Brown et al., 2001).
2.4 MODEL
According to the classical rate model of the basal ganglia organization, the abnormal firing rates detected
in several basal ganglia nuclei of PD patients and Parkinsonian animals were believed to be responsible for the
motor symptoms in PD (Albin et al., 1989; Alexander and Crutcher, 1990; Chevalier and Deniau, 1990;
DeLong, 1990; Gerfen et al., 1990; Parent, 1990). More recently, other dynamical factors in the basal ganglia,
such as excessive beta frequency oscillation and synchrony, have been shown to have implications in the motor
complications of the disease (Brown et al., 2001; Goldberg et al., 2004; Moran et al., 2008; Kuhn et al., 2009).
In order to investigate the individual effect of these features on the differences of the coding capacity between
the control and lesioned rats, we estimated the entropy of different characteristics of the spike trains in the GPe
network. All algorithms and tools used in this study were implemented in Matlab (The MathWorks, Natick,
MA).
The entropy rate of a spike train, a stochastic process we denote as {si}, is defined by
),...,,(1
lim)()2( ,2,1, tiiit
irate sssHt
sH
when the limit exists. For strongly stationary processes, the entropy rate can also be defined as
),...,|(lim)(')3( 1,1,, ititit
irate sssHsH
.

46
While the definition in Equation 2 provides the average entropy per symbol, Equation 3 defines the entropy of
the random variable si,t conditioned on the past variables si,1,..., si,t-1; they represent different concepts of entropy
rate. For a stationary process, both limits Hrate(si ) and H’rate(si ) exist and coincide. Cover and Thomas (1991)
proved it by first showing that H’rate(si ) < ∞. Considering that conditioning decreases entropy
),...,|(),...,|()4( 2,,1,1,,1, ititiititi sssHsssH ,
and that for a stationary stochastic process {si} the conditional probability is unchanged for any time shift
),...,|(),...,|()5( 1,1,,2,,1, ititiititi sssHsssH ,
the H(si,t | si,t-1, ..., si,1) is a non-negative decreasing time series and therefore the limit of the conditional entropy
H’rate(si ) exists. Then the authors make use of the simple theorem Cesàro Mean, which states that if a sequence
of numbers an converges to a value (an → a), the sequence bn, with
,)6(1
n
i
in ab
converges to the same value (bn → a). By way of the chain rule of entropy, we have
n
l
ititin sssH
nn
sssH
1
1,1,,21 ),...,|(
1),...,,()7(
.
Therefore, from Cesàro's theorem, where H(si,t | si,t-1, ..., si,1) corresponds to the series an and the right hand-side
of Equation 7 corresponds to bn, both entropy rate definitions from Equations 2 and 3 converge to a common
limit, that is Hrate(si ) = H’rate(si ).
A stochastic process X(t) is said to be strictly stationary if X(t) and X(t+h) have the same statistics for
any h; that is, the statistical characteristics of the process are invariant to a shift in the origin. Biological data is
characteristically not strictly stationary. Nevertheless, under certain conditions, the statistical properties of
biological time series (e.g., spike trains) can exhibit very slow or small-scale variations requiring other forms of
stationarity to be assumed. Less stringently, a sequence of random variables X(t) is called covariance stationary
or wide-sense stationary if its mean and variance are time-invariant and the autocovariance between a term Xt
and another term Xt+h depends only on the time difference (h) and not on their individual locations. While a
strictly stationary process imposes restrictions on the whole distribution, the covariance stationarity imposes
restrictions on the first and second moments.

47
The data analysed in the current study was recorded from brain areas of rats during urethane anaesthesia.
This reduced the effects of cognitive and motor stimuli. However it may introduce variation in the neural
activity. In a point process like spike data, second order stationarity implies that the mean and variance of firing
rates are independent of time and that the autocovariance is shift invariant. To investigate the level of
stationarity of our spike data, first we calculated, for each spike train si binned into T bins of 5 ms, the mean
firing rates vector { hti,s } given by
ht
tj
jihti hTtsh
s ,,1,1
)8( ,,
where h is number of bins of the sliding window with origin in t. Next, we obtained the centred processes
{Δsi,t+h}, given by the difference
ihtihti sss ,,)9(
with S ¯i denoting the mean firing rate of spike train si. To minimize the effect of arbitrarily choosing the width h,
we repeated the analysis for different lag sizes (h taking the values 1, 3, 5, 10, 15, 20, 25, 30, 40 and 50 ms, for
spike trains with 100 ms duration). To verify if the expected value E[Δsi,t+h] is equal to zero, we calculated each
centred process Δsi,t+h. We observed that for all spike trains recorded in the GPe, the data in the Δsi,t+h
distributions were fluctuating around zero with mean ± SD of (0.08 ± 6.80)×10-3 Hz in controls and (0.03 ±
6.41)×10-3 Hz in lesioned animals. Therefore, the spike trains presented a strong first order stationarity. Similar
results were obtained in STN cells, with (-0.70 ± 0.83)×10-3 Hz in controls and (-0.22 ± 9.05)×10-3 Hz in
lesioned animals. In Figures E-1A,B and E-2A,B (Appendix E) we show that the mean of Δsi,t+h for different
lags h was steadily close to zero, but the standard deviations decreased for larger lags.
Second, we estimated the second central moment of our individual time series by calculating the
autocovariance given by
hTtsssshT
ssautoCov hihti
hT
tt
itihtiti
,,1,)()(1
],[)10( 0,,,,
0
.
So, by taking the mean product of the firing rates of the time process and its duplicate shifted by a lag h, for
different initial positions t0, we could characterize the time interdependency of our spike trains. A covariant
stationary possess is dependent on the length of the lag h, but should not vary with the origin t0. To test the
stationarity of our data, we calculated the variance of the distributions of the autocovariance computed for each

48
t0 (with fixed h) and then averaged it across spike trains (Figures E-1C,D and E-2C,D, Appendix E). We
observed that the autocovariance tended to fluctuate around zero, with mean ± SD − averaged through all cells
and all lags h − of (0.03 ± 4.94)×10-4 Hz in control and (0.07 ± 2.19)×10-4 Hz in lesioned animals for GPe
cells, and (0.03 ± 0.20)×10-3 Hz in control and (-0.04 ± 0.42)×10-3 Hz in lesioned for STN cells. The results,
therefore, suggest a robust covariance stationarity of the spike train data used in this study, for both GPe and
STN networks. Note that, time invariant autocovariances implies that all the random variables in the sequence
have the same variance defined by
T
t
ititi ssT
sVar1
0
2
,, )(1
][)11( .
After analysing the stationarity of the firing rates in each spike train, we tested if the observed power
spectrum would persist sufficiently constant throughout the spike train (auto spectrum) and the correlated
activity between pairs of neurons (cross spectrum). Therefore, we partitioned the spike trains (or pair of spike
trains) into K segments of length ∆t. For each segment the auto and cross spectra were computed and compared
to the power in the whole signal again using the central process
)()()()12( ), . . ,1(,,, Kkk tititisowPsPowsPow
,
that is the difference between the power spectrum in each section k (k = 1,...,K) and the mean power spectrum of
the K sections, with ∆t = 20s and K = 5. Figure E-3 (Appendix E) shows the average central auto power
spectrum ΔPow(si, Δtk), normalized to the difference between maximum and minimum power values of each
section ∆tk, across all GPe and STN spike trains. In all cases, the difference in the spectral power fluctuated
around zero, indicative of a stationary process, although with higher variation (standard deviations 2 to 3 fold
larger) in the auto spectra than the cross spectra. Given the wide-sense stationarity of our data, we used for our
estimations the definition of entropy as in Equation 3.
The first step was to discretize the data: the 100 second spike trains from each individual neuron were
binned with a bin width of 5 milliseconds. The robustness of the selected bin length relative to double spiking
occurrences was tested. In Figure 2-3 is shown an example of a given population set, where si,1:t refers to the
activity of neuron i during the interval 1 to t bins, and N is the number of simultaneously recorded cells.
We then estimated the entropy of the activity of individual neurons based on its past temporal patterns.
Furthermore, we studied the joint entropy of pairs and ensembles of neurons. Similarly, if we disregard the

49
temporal factor in Equation 3 and consider s as a vector over an ensemble of neurons, the joint entropy of an
ensemble of N simultaneously recorded cells is given by
),...,|(),...,()13( 11
1
1 sssHssH ii
N
i
N
.
Therefore, in order to obtain the joint entropy of the ensemble, we have to estimate the entropy of each neuron
conditioned on all the other neurons of the population as well as the past activity of the same neuron. In this
study we first analyzed the entropy of pairs of neurons and then of ensembles with different sizes.
Besides the matter concerning the interpretation of entropy and information transfer or their analytical
computation, there are other complex statistical challenges that must be addressed in order to estimate such
measures from restricted data sets. A classical and widely used methodology for estimation of information in
spike trains ‒ known as the "direct method" ‒ was introduced by de Ruyter van Steveninck, Strong, Bialek and
colleagues (de Ruyter van Steveninck et al., 1997; Strong et al., 1998). It uses a relatively assumption free
approach whose implementation is conceptually close to Shannon's theory. To calculate entropy as defined in
Equation 1 using the "direct method" one divides the discretized spike trains (with bin width ΔT) into segments
or words of constant length L for which the probability distributions are estimated based on the number of
Figure 2-3. Representation of a population of simultaneously recorded neurons, where the spike trains were divided in 5 ms bins. The
prediction of a spike occurring in neuron i at instant t, si,t = 1, was calculated conditioned on the firing rate of neuron i; or, in addition to the
firing rate, the temporal patterns of the past bins from neuron i, and/or from one or more neurons jn, n=1,...,N-1.

50
observations of each word in the experimental data. The method then estimates the information from the
difference between the marginal and conditional entropies of the response. In theory, the direct approach yields
a very accurate measurement of information, provided that an adequate amount of data is accessible, given that
it does not make prior assumptions about the nature of the stimulus or the distribution of the spike patterns.
However, the space of all possible spike patterns can often be sampled only partially due to electrophysiological
and experimental considerations. For a true and accurate estimate of information, 2L/ΔT
possible patterns have to
be sampled enough times. The effects of undersampling due to limited sample sizes introduces considerable
variance and bias dependent on the number of occurrence probabilities that should be determined and the total
number of observations. Although debiasing techniques are applicable, they are often powerless if many pattern
sequences are never sampled, leading to unreliable entropy estimates. The "direct method" can be suitable,
however, to study very constrained environments, such as the visual system or insect neural systems, where the
stimulus responses are highly reproducible. That is not the case in the neural activity of basal ganglia networks.
To overcome sampling and bias limitations due to finite set of observations, we proposed a more sophisticated
estimator ‒ a logistic regression approach ‒ which, although it is not exempt from a priori assumptions (see
below), uses model selection methods to detect optimal order of parameters to compute conditional probabilities
for entropy estimations.
The logistic regression method is used for prediction of the probability of occurrence of an event.
Belonging to a class of models known as Generalized Linear Models, it describes the relationship between
explanatory variables and a discrete response output, modelling how the probability of an event may be affected
by one or more of these variables. The logistic regression approach makes very few assumptions about the data
(Christensen, 1997) and it is related to the "direct" and "maximum entropy" methods (Christensen, 1997; Strong
et al., 1998; Averbeck and Lee, 2006; Schneidman et al., 2006).
The logistic regression model predicted the posterior probability that a spike occurred at instant t,
conditioned on the past history of spiking of the cell under consideration, as well as the history of other
simultaneously recorded cells. The model can be formalized in the following way
1
1
,
0
,,
1
0:1,:1,:1,, 2
,2
2
21
1
1
11),...,,|()14(
N
j
ktj
K
k
kjkti
K
k
ktjtjtiti sbsaagssssPj
N.
P(si,t| si,1:t, sj1,1:t, ... , sjN-1,1:t) specifies the posterior probability of occurrence of a spike si,t=1, in neuron i at instant
t, given the responses in previous time bins of cell i, and/or other cells j (Figure 2-3). The logistic regression

51
coefficient ak1 represents the effects of a spike from neuron i fired in bin t-k1 on the probability of the same
neuron i to fire at bin t. Analogously, bj, j=1,…,N-1, characterize the effects of spikes from other neurons j on
the probability of neuron i to spike at time t (Figure 2-3). K1 and K2,j variables represent the optimal number of
time lags used in the prediction condition which are dynamically estimated (see below). The link function g is
the logistic transform
eg
1
1)()15(
The model applied the logistic function to a linear combination of the observed ensemble neural activity, S, in
order to calculate the entropy in the prediction of spike si,t. Four versions of the model from Equation 14 were fit
(Table 2-1). Each version was based on different components of the activity of that same neuron i, and/or from
other cells in the population set, jk. Therefore, the four models examined the effects of different factors of the
ensemble response on the entropy.
The ‘Rate’ model incorporated only the firing rate effect, thus in Equation 14 only the a0 term was
considered. The second model, which we named ‘Auto’, in addition to the a0 term, included the effect of the
autocorrelations on the entropy. The autocorrelations consider the lagged bins from the same neuron i. The
‘Cross’ model characterized, besides the rate, the effect of cross-correlations on the entropy by taking into
account the lagged and zero lag bins of one or more neighbouring neurons. In Equation 14, it included the terms
a0 and bj,, j=1,..., N-1. The last model – the ‘Full’ model – combined all the effects, including all a and b terms
(Figure 2-4).
Dealing with a binary classification problem (either a spike or not a spike), we assumed our random
variables followed a Bernoulli distribution (Truccolo et al., 2005); therefore, we regarded our output variable
si,t{0,1} as a Bernoulli random variable with parameter θ. Next we will show that the logistic function is the
Model Conditional probability Coefficients
‘Rate’ )( ,tisP 0a
‘Auto’ )|( :1,, titi ssP 11 ,...,0
1Kkak
‘Cross’ ),...,|( :1,:1,, 11 tjtjti NsssP
220 ,...,0
2Kkba k
‘Full’ ),...,,|( :1,:1,:1,, 11 tjtjtiti NssssP
2,12,1 ,...,0
21Kkba kk
Table 2-1. Parameters included in the calculus of the conditional probability from Equation 14 for the ‘Rate’, ‘Auto’, ‘Cross’ and ‘Full’
models

52
canonical link for the Bernoulli distribution. This fact explains our choice of the logistic regression to predict the
probability of the output variable si,t taking the value of 1 for each input S, where S = { si,1:t, sj1,1:t, ... , sjN-1,1:t} is
the spike train dataset. Having in mind that the binary classification has a conditional expectation μ(S, θ)
equivalent to the posterior probability P(si,t =1 | S, θ),
m
,|1P
,|1P.1,|0P.0
,|P,|),()16(
,
,,
1
0
,,
S
SS
SSS
ti
titi
p
titi
s
ss
pspsE
,
we can write the Bernoulli distribution for an univariate binary random variable with mean μ in the following
way
ti,ti, s1s),(1),()P()17(
mm SSti,s .
A general representation of an exponential family is given by the following probability density function
( ) ( ) { ( )- ( )},
where h(x) is called the base density, η is the natural parameter, T(x) is a sufficient statistic and A(η) a
Figure 2-4. Examples of selected number of lagged terms that best fit each model’s prediction if a spike will occur at zero lag bin of neuron i,
based on pairs of neurons. A. For the ‘Rate’ model, only the a0 coefficient is considered. B. The ‘Auto’ model uses the rate effect plus the past
events of neuron i. C. The ‘Cross’ model takes in account the rate effect (neuron i) and the lagged bins of neuron j1. D. All the rate, auto and
cross effects are considered in the ‘Full’ model.

53
normalization factor. The choice of T(x) and h(x) determines the member of the exponential family. If we take
the exponential of the logarithm of the original distribution from Equation 18, the Bernoulli distribution can be
rewritten in the exponential family form
mm
m
mmm
mm
mm
1log1
logexp
1log1loglogexp
1logexp
1)P()19(
,
,,
s-1s
s1s
ti,ti,
ti,ti,
ti
titi
ti,
s
ss
s
.
Thus, from Equation 19, we can depict the Bernoulli distribution as an exponential family distribution with
m
m
1log)20(
ti,ti, ss )T()21(
m eA 1log1log)()22(
1)h()23( ti,s
From Equation 20 we infer that μ and η are alternative parameterizations to the Bernoulli distribution, where the
conditional expectation μ(S, θ) depends on S via the inner product η(S, θ)
1
1
,
0
,,
1
0 2
,2
2
21
1
1
1,)24(
N
j
ktj
K
k
kjkti
K
k
k
T sbsaaj
SS .
By inverting Equation 20 we obtain the logistic function
),(1
1),()25(
m
SS
e.
Therefore, we have shown that the log-odds and logistic function are, respectively, the natural parameter and
canonical link function of the Bernoulli distribution expressed as a member of the exponential family.
Equation 24 represents the set of parameters selected as being a compromise between the optimal
description of the information contained in the spike trains and the model complexity. This parameter system is
linear and represents the correlations within the neural data. The autocorrelations are associated with
coefficients ak and the cross-correlations with the coefficients bk, from Equations 14 and 24. These correlations

54
are the input of the link function g(η) (Equation 14). It is this logistic function which introduces a nonlinearity in
our model.
2.4.1 PARAMETER ESTIMATION
To find the parameter vectors that best fit our data we maximized the log-likelihood of the data given the
parameters. This vector takes the form θ = {a0, a1,..., aK1, b0, b1,..., bK2} for the ‘Full’ model and combines
subsets of those parameters for the reduced models (see Table 2-1). The training set for the estimation is the
spike train sequence S = { si,1:t, sj1,1:t, ... , sjN-1,1:t} used above.
The likelihood, which indicates how probable the training dataset is for various settings of vector θ, can
be written as a product of T probability density functions fθ(S)
T
t
f1
)()()26( SL
if we assume the data is independent and identically distributed. The variable T indicates the size of the dataset.
In our model, the likelihood can be formulated by the product of the T Bernoulli probabilities given by
T
t
ss
tititis
1
1
,,, ),(1),(),|(P)27( mm SSS .
As we have shown in Equation 16, the conditional expectation μ(S,θ) is equivalent to the posterior probability
P(si,t=1 | S, θ) (for ease of notation, we will simply refer to the probability of success P(si,t=1 | S, θ) as
P(si,t | S,θ)). Having that in mind and applying the logarithm to the previous equation, we get the desired log-
likelihood measure in the following form
T
t
titititi
T
t
ttitti
ssss
sso
1
,,,,
1
,,
),|(P1log)1(),|(Plog
1log)1(log)|( gl)28(
mm
SS
SL.
The maximum of this expression can be found numerically using various optimization algorithms. We
implemented and compared the performance of two of these possible algorithms: the iteratively reweighted least
squares algorithm (IRLS) and the cross-validated early stopping algorithm (ES).

55
The IRLS is an iterative nonlinear method which solves a weighted least-squares problem at each
regression step; the regression coefficients are estimated and the observations are re-weighted, being the new
weights calculated based on the predictions of the variable of interest. The fitting procedure is repeated until
convergence. The function we want to optimize is the log-likelihood of our model given in Equation 28.
Considering that
mm
m 1)29(
d
d
T
d
dS
)30( ,
which are derivatives of Equations 20 and 25, respectively, we can calculate the gradient of the log-likelihood
function. The vector of its partial derivatives with respect to its parameters, is given by
m
m
mmmm
m
m
mm
mm
m
mm
ti
T
T
t
ti
T
t
ti
T
t
titi
T
t
titi
s
s
s
d
dss
d
dsso
,
1
,
1
,
1
,,
1
,,
)1()1(
)1(
)1()1(
1
1 gl)31(
S
S
S
S
L
.
Taking another derivative, we obtain the Hessian matrix HlogL
SS W
SS
SSd
d
Ssd
dH
T
T
tttt
T
t
T
t
T
tt
t
t
t
T
t
ttio
)1(
)32(
1
1
1
, gl
mm
m
m
L
,
where the weight matrix W is a diagonal matrix of the variances of the Bernoulli random variables si,t, that is
W = diag{ μ1(1- μ1), μ2(1- μ2) ,…, μT(1- μT) }.

56
The IRLS performs a Newton-Raphson optimization in each iteration. The Newton-Raphson algorithm is
a numerical method which computes iteratively the Jacobian linearization of the function around an initial guess
point. It uses this linearization to move closer to the nearest zero and therefore seeks the roots of the function. It
takes the form
L gl)33(1
gl
1 oH o
mm
L
Substituting the results from Equations 31 and 32 in the Newton-Raphson algorithm from Equation 29 we
obtain the function
),|(P
)34(
)(
,,
1
,
11
m
titi
TmT
m
ti
TmTm
ssW
sW
m
SSSS
SSS
.
We defined the convergence termination criteria for this algorithm as |θ(m+1)
- θ(m)
| < ε, where ε = 10-10
.
The second algorithm we tested was a version of the IRLS algorithm, similar to the adaptive filter or least
mean-squares algorithm used for fitting linear regression. Additionally, we used the cross-validation and early
stopping rule to fit the model. This optimization method estimates updated values for the parameter vector θ
through the solution of the regression given by
),|(P)35( )(
,
)(
,
)(1 m
ti
m
ti
mm ss SS ,
where the learning rate parameter ρ was calculated as the ratio
9.0)36(
with λ as the maximum eigenvalue of the product of the training data matrices ST
S.
Cross-validated early stopping can be used to prevent overtraining during the estimation of the prediction
error, and to find an estimator with optimal generalization performance. Cross-validation divides the sample
data into two sub-samples: the training set and the validation set. The training set is used for learning; it fits the
model by updating the regression weights. During this calibration, the generalization error of the network is
estimated by a prediction error which is the average error on the validation sample. This sample is used to
estimate the expected discrepancy for the fitted model, monitoring the generalization error during training.
It has been shown that the ratio of cross-validation singled out as the training set has no significant
impact on the prediction error (Wang et al., 2005). We used 2-fold cross-validation, partitioning the original 100

57
second spike trains in two sub-samples of 50 seconds each. Equation 34 was iterated on the training set and the
log-likelihood (Equation 28) was estimated on the validation set. The training was stopped at the minimum of
the validation set error, which is when the change in the log-likelihood was below a criterion given by
5
)1(
)()1(
10)37(
m
mm
ll
llll.
In general, this early stopping rule is used to avoid over-fitting. In our case, since the size of our data was
overwhelmingly greater than the number of parameters of our model, there was no need to control over-fitting
and therefore, we could apply the early stopping rule to obtain convergence.
2.4.2 MODEL SELECTION
An increase in model complexity implies a higher adaption to more intricate data structures. However,
we may observe an overfitting, meaning that the ability of the model to generalize beyond the fitting data is
lower. In contrast, decreasing the number of parameters may result in underfitting, where the model does not
follow the right trend in the data. Several selection methods can be used to try to find a compromise between
these two situations and decide which model better captures the true data distribution.
We estimated the optimal number of lagged terms for either the auto or cross correlations, K1 and K2j
(Equation 14), respectively for each neuron or pair/ensemble of neurons. This was done by first calculating the
log-likelihood of 30 different models with K lagged terms, where K=1, K=2, ..., K=30; and second applying a
selection method to choose the optimal number of lags. We compared the performance of two selection
methods: Akaike’s Information Criterion (AIC) and the Bayesian Information Criterion (BIC). Both methods
carry out the fitting by maximization of a log-likelihood function.
Kullback and Leibler developed an information measure based on Shannon’s definition of information
(Kullback and Leibler, 1951). Later, Akaike defined a relationship between the Kullback-Leibler information
and the maximum likelihood estimation method (Akaike, 1973). The AIC selects the model which minimizes
the loss of information by choosing the one with maximum AIC value. It is defined as
kllkAIC )()38( ,

58
where k is the number of parameters included in the model. It minimizes the Kullback-Leibler divergence
between the analysed model and the real distribution.
The BIC is an extension of the Bayesian method proposed by Schwarz (1978) and although it is very
similar to AIC, it is derived from a different perspective. It is intended to select a model that maximizes the
posterior probability. The BIC measure is computed as
)log(2)()39( TkllkBIC ,
where T is the number of data points available for estimating the model. Again, the optimal number of lags was
determined by maximizing this function.
2.4.3 ENTROPY
Further, we used information theory tools to pursue our quest for the probability of neuron i to spike at
time t, conditioned on our data S and parameters vector θ. After fitting the model, we could calculate the
uncertainty associated with the discrete response si,t. That uncertainty is a measure of entropy (H). Because of
our Bernoulli distribution, one can use a binary function to calculate H
T
t s
tititi ssT
sH1
1
0
,2,, |Plog|P1
...|)40( .
The entropy was calculated for each of the pairs and ensemble of neurons using the four models from Table 2-1,
for healthy and lesioned subjects. Since there was a large disparity between the number of parameters in our
model (< 30) and the quantity of data available (~ 20,000 bins), we did not have to perform a bias correction on
our entropy estimates (see Table A-1 in the Appendix).
To study the effects of individual factors on the entropy change, which we called delta entropy (ΔH), we
used the following formula
0,
1010,0,
|
,...,,,,...,,||)41( 21
asH
bbbaaasHasHH
ti
KKtiti .
This equation defines delta entropy for the ‘Full’ model. Introducing only the auto terms or cross terms, we were
able to describe the effect on the entropy of these terms, separately. Essentially, the delta entropy eliminates the

59
effect of the firing rate in each of the ‘Cross’, ‘Auto’ and ‘Full’ models. In a broader perspective, we can say
that delta entropy is a normalized mutual information measure.
2.4.4 FREQUENCY DOMAIN ANALYSIS
The auto-spectra and cross-spectra were calculated through a Fast Fourier Transform on non-overlapping
blocks with 500 points length. The power spectrum was determined as an average between all the segments
from each cell over the interval [0,100] Hz.
2.5 RESULTS
To test our model, we used a data from recordings in the GPe of 16 intact and 23 6-hydroxidopamine (6-
OHDA) unilaterally lesioned animals (Table A-1 in the Appendix). The dataset consisted of 27 ensembles of
simultaneously recorded neurons for control animals and 56 for lesioned animals. With a mean of 5.4 cells per
ensemble for controls and 8.2 cells for lesioned, the total number of cells recorded amounted to 143 in control
and 459 in lesioned. The number of pairs simultaneously recorded in control animals was 507 and in lesioned
animals was 2086 (Table A-1).
The spike trains from each single cell recording were binned in 5 ms bins, a trade-off between temporal
precision and computational efficiency. To guarantee that no information was being lost, we checked for the
occurrence of double spikes. Multiple spikes were found in less than 0.4% of the bins in control and less than
0.2% of the bins in lesioned animals. Also, we tested the effect of a smaller bin size. We found that the
estimated entropy distributions for normal and lesioned animals were very similar using 5 ms or 2 ms bin sizes.

60
2.5.1 PARAMETER ESTIMATION: IRLS VERSUS ES
We estimated the model parameters using the IRLS and the ES optimization methods that maximized the
log-likelihood of our data, using fixed initial conditions, and compared their performances. Unfortunately, the
IRLS algorithm applied to our model did not consistently converge. The percentage of IRLS convergent cases
was 68.3% (99 of 145 neurons) for the control and 57.7% (265 of 459 neurons) for lesioned data. The algorithm
failed to converge due to ill-conditioning of the covariance matrix of lagged spikes, that is, it was not possible to
invert the matrix STWS (see Equation 34) in at least one of the iterations. To overcome this problem we tried a
different version of the IRLS method: an on-line learning algorithm, related to the least mean squares algorithm,
which uses cross-validation and early stopping methods (ES). The parameter updates were given by Equation
35. The training was stopped at the maximum of validation set error calculated according to Equation 37. The
Figure 2-5. Comparison between the entropy calculated using the ES and the IRLS algorithms in pairs of neurons for which this last
converged. This analysis was done under the four different models that characterize the effect of the different factors on the entropy in
control and lesioned animals. A. Firing rates. B. Autocorrelations. C. Cross-correlations. D. Autocorrelations and cross-correlations (‘Full’
model).
0 0.5 1 1.5 20
0.5
1
1.5
2
0 0.5 1 1.5 2
0.5
1
1.5
2
0 0.5 1 1.5 2 2.50
0.5
1
1.5
2
2.5
0 0.5 1 1.5 2 2.50
0.5
1
1.5
2
2.5
‘Rate’ ‘Auto’
‘Cross’
Entropy (ES) [bits/bin]
‘Full’
Control
Lesioned
x 10-3
x 10-3
0
x 10-2
x 10-2
x 10-2
En
tro
py (
IRL
S)
[b
its/b
in]
Entropy (ES) [bits/bin] x 10-2
En
tro
py (
IRL
S)
[b
its/b
in]
Entropy (ES) [bits/bin] x 10-2
En
tro
py (
IRL
S)
[b
its/b
in]
Entropy (ES) [bits/bin] x 10-2
En
tro
py (
IRL
S)
[b
its/b
in]
A
C D
B

61
learning process was stopped before it reached the optimal solution on the training set, avoiding over fitting.
This algorithm always converged for our neural data.
Figure 2-5 and Figure 2-6 show a comparison between the entropy estimates for pairs of neurons, using
both IRLS and ES iterative algorithms. For this analysis we used only the data for which the IRLS algorithm
converged. The scatter plots in Figure 2-5 show that the values of entropy estimates were very similar when
calculated with both methods.
Comparing the control and lesioned
entropies, both figures show that the
entropy was lower for lesioned than
for control animals. Also, the
entropy values estimated with the
parameters calculated using the ES
algorithm were typically larger than
the ones calculated with the IRLS
algorithm. This effect was larger in
the ‘Auto’ and ‘Full’ models for the
lesioned data. Since for the ‘Rate’
and ‘Cross’ models the effect was
smaller, the auto terms may be
reinforcing this result. As it will be
shown below, on average, the
number of parameters (K) used in
the ‘Auto’ and ‘Full’ models was
generally higher than in the ‘Rate’
and ‘Cross’ models. This difference
in behaviours between the IRLS and
ES algorithms in respect to the
number of parameters of the model
is explained by the fact that the ES
algorithm was cross validated. By
Figure 2-6. Distribution of the difference on the entropy estimated by means of the
ES and the IRLS algorithms for each model. A. ‘Rate’ model. B. ‘Auto’ model. C.
‘Cross’ model. D. ‘Full’ model.
0
0.2
0.4
0.6
0.8
1
0
0.2
0.4
0.6
0.8
1
0
0.2
0.4
0.6
0.8
1
0 2 4 6 8 10
x 10-5
0
0.2
0.4
0.6
0.8
1
Control
Lesioned
‘Rate’
‘Auto’
‘Cross’
‘Full’
0 2 4 6 8 10
x 10-4
0 2 4 6 8 10
x 10-4
0 2 4 6 8 10
x 10-5
Pro
port
ion
Pro
port
ion
Pro
port
ion
Pro
port
ion
Entropy (ES) - Entropy (IRLS)
Entropy (ES) - Entropy (IRLS)
Entropy (ES) - Entropy (IRLS)
Entropy (ES) - Entropy (IRLS)
A
B
C
D

62
means of the ES algorithm, the difference in entropy between control and lesioned animals was smaller than
with the IRLS method. Thus, the ES algorithm provides a more conservative estimate of the entropy differences
which will be used in our analysis.
The IRLS algorithm converged quickly, reaching an appropriate solution with a well-suited number of
iterations which translated in a good temporal performance. Yet, as we discussed previously, due to ill-
conditioning, it converged for only about half of the cases. On the contrary, the ES algorithm always converged,
but it required a high number of iterations to converge what results in very long processing time.
Therefore, due to the poor convergence of the IRLS algorithm and the more conservative characteristics
of the ES method in face of our dataset, we elected the ES algorithm to further analyse our data. The results
presented in the rest of the document were obtained using the ES algorithm.
2.5.2 MODEL SELECTION: AIC VERSUS BIC
In order to estimate the time interval over which a spike train is correlated with itself or between pairs of
Figure 2-7. Example of AIC (dashed) and BIC (solid) curves calculated for a pair of neurons from a lesioned animal, under the ‘Auto’
and ‘Cross’ models. A. Autocorrelations. B. Cross-correlations. The ‘♦’ signals the maximum of the function, indicating the selected
optimal number of lags. Note the BIC axis on the left and the AIC axis on the right side of the panels.
0 5 10 15 20 25 30-1.11
-1.10
-1.09
-1.08x 10
4
B IC AIC
5 10 15 20 25-5.60
-5.50
-5.40
-5.30
‘Auto’
0 5 10 15 20 25 30-1.14
-1.13
-1.12
-1.11
-1.10
0 5 10 15 20 25-5.60
-5.58
-5.56
-5.54
-5.52
Nr of parameters
‘Cross’
Lo
g-l
ike
liho
od
(B
IC)
Lo
g-l
ike
liho
od
(A
IC)
x 103
x 103
x 104
Lo
g-l
ike
liho
od
(B
IC)
Lo
g-l
ike
liho
od
(A
IC)
Nr of parameters
A
B

63
neurons, we determined the optimized number of lagged terms for auto or cross correlations (K1 and K2
variables in Equation 14). To investigate the model selection technique that better performed on our data, we
compared the results obtained with the AIC and the BIC. Considering a collection of 30 models, varying the
number of parameters from one to thirty, we calculated both AIC and BIC measures of the goodness of fit of
each estimated statistical model.
Figure 2-7 shows a typical example of an AIC and BIC curves calculated for the ‘Auto’ and ‘Cross’
(pair-wise correlation) models for GPe neurons from a lesioned animal. In the upper panel, where the selection
methods were applied to the ‘Auto’ model, the maximum value of both AIC and BIC curves were at K1 = 8 and
K1 = 7, respectively. Although the selected optimal number of parameters did not significantly differ in this
case, we can see that the AIC curve flattened after reaching its maximum and the BIC line showed a more
prominent peak. Therefore, the shape of the AIC curve, in comparison with the BIC curve, indicated less
precision in the determination of the optimal number of lagged time bins. In the lower panel of Figure 2-7,
Figure 2-8. Distributions of the optimal number of lags, selected with AIC and BIC, for healthy and lesioned populations. A. Effects of
autocorrelations. B. Effects of cross-correlations. C. Both auto and cross-correlations effects.
0
0.2
0.4
0.6
0.8
1
BIC
AIC
0
0.2
0.4
0.6
0.8
1
0 5 10 15 20 25 300
0.2
0.4
0.6
0.8
1
0 5 10 15 20 25 30
0 5 10 15 20 25 30
LESIONED
‘Auto’
Pro
po
rtio
n
Nr of parameters (K )1
‘Cross’
Pro
po
rtio
n
Nr of parameters (K )2
‘Full’
Pro
po
rtio
n
Nr of parameters (K + K )1 2
0
0.2
0.4
0.6
0.8
1
BIC
AIC
0
0.2
0.4
0.6
0.8
1
0
0.2
0.4
0.6
0.8
1
0 5 10 15 20 25 30
0 5 10 15 20 25 30
0 5 10 15 20 25 30
CONTROL
‘Auto’
Pro
po
rtio
n
Nr of parameters (K )1
‘Full’
Pro
po
rtio
n
Nr of parameters (K + K )1
‘Cross’
Pro
po
rtio
n
Nr of parameters (K )2
2
A
B
C

64
where is shown the results for the ‘Cross’ model, both curves presented a clear maximum for K2 = 6 and K2 = 3,
respectively. In both ‘Auto’ and ‘Cross’ cases, BIC was more conservative in the selection of the number of
parameters. This was true in the particular case from Figure 2-7, but also for most of the dataset, both in control
and lesioned animals. We compared the number of time lags selected by AIC and BIC for all neurons (and pairs
of neurons) from control and lesioned animals for the ‘Auto’, ‘Cross’ and ‘Full’ models (‘the ‘Rate’ model is
not history-dependent) (Figure 2-8).
We observed that the estimated number of parameters for the autocorrelations (Figure 2-8A) and cross-
correlations (Figure 2-8B) was overall higher with the AIC, in comparison to the BIC, for either the control or
the lesioned animals. The combination of both auto and cross-correlation effects, within the ‘Full’ model (Figure
2-8C), showed also that the BIC was more conservative.
Figure 2-9. Scatter plots of the entropy in pairs of control and lesioned neurons, calculated using the optimal number of parameters selected
under the AIC and BIC on the four models. A. Firing rate model. B. Auto model. C. ‘Cross’ model. D. ‘Full’ model.
0 0.5 1 1.5 20
0.5
1
1.5
2
0 0.5 1 1.5 2
0.5
1
1.5
2
0 0.5 1 1.5 2 2.50
0.5
1
1.5
2
0 0.5 1 1.5 2 2.50
0.5
1
1.5
2
‘Rate’ ‘Auto’
‘Cross’
Entropy (BIC) [bits/bin]
‘Full’
Control
Lesioned
x 10-3
x 10-3
0
x 10-2
x 10-2
x 10-2
En
tro
py (
AIC
)
[bits/b
in]
Entropy (BIC) [bits/bin] x 10-2
En
tro
py (
AIC
)
[bits/b
in]
Entropy (BIC) [bits/bin] x 10-2
En
tro
py (
AIC
)
[bits/b
in]
Entropy (BIC) [bits/bin] x 10-2
En
tro
py (
AIC
)
[bits/b
in]
A
C D
B

65
Next, we directly examined the effect of either the AIC or BIC on the entropy estimation. We calculated
the entropy with each of the four models – ‘Rate’, ‘Auto’, ‘Cross’ and ‘Full’ – using the number of lagged time
bins selected by the AIC or the BIC methods (Figure 2-9). Comparing the entropy values for pairs of neurons
obtained with both AIC and BIC methods, we found no substantial difference for any of the four models, either
for control or lesioned animals. Therefore, the choice between the two methods in order to determine the
number of lagged time bins that were necessary in the model did not have much impact on our entropy
estimates.
2.6 DISCUSSION
In order to investigate the effects that changes in network dynamics, caused by dopamine depletion, had
on the entropy of the GPe and STN-GPe networks of intact and 6-OHDA lesioned rats, we used a logistic
regression model. This model allowed us to evaluate the relative impact of the changes in network dynamics on
the entropy, by applying four different models which gave us estimates of the effect of rate, auto and cross-
correlations on the entropy of the spike trains for the control and lesioned groups.
To fit the parameters from the different models, we maximized the log-likelihood of the data. In the quest
to find the most suitable iterative method to dynamically estimate the number of parameters of our model, we
tested two different algorithms. The main advantage of the IRLS method is that, being based on the Newton-
Raphson algorithm, it is second-order and therefore requires a low number of iterations to reach a solution of
suitable precision -- meaning a fast convergence. Thus, the processing time for IRLS was very satisfactory. On
the other hand, the IRLS algorithm converged for slightly over half of the pairs of neurons, both for lesioned and
control animals. This nonsystematic convergence of the IRLS algorithm was a consequence of ill-conditioning
of the covariance matrix. To bypass this difficulty, we repeated the maximization of the log-likelihood of the
data by means of an on-line version of the IRLS algorithm: the ES algorithm. This method converged in all
cases, but at the cost of a high total number of iterations. Therefore, the algorithm exhibited a very poor
temporal performance.

66
Our analysis of the network entropy in the basal ganglia was based on a comparison between the network
entropies of intact and lesioned animals. We have shown that the estimated entropy for lesioned animals is
lower than for control animals. In addition, the entropy estimated values through the IRLS algorithm were lower
than by means of the ES algorithm. Therefore, by estimating the model parameters applying the ES algorithm,
the difference between the entropy estimates in control and lesioned animals was lower than when calculated
with the IRLS method. This fact assured us that the ES algorithm was more conservative and therefore would
not introduce a bias on our comparison.
Comparing the overall performance between both algorithms, the ES has shown to have better global
convergence for our data and similar, but slightly more conservative, values for the entropy estimation than the
IRLS. Despite these advantages over the IRLS algorithm, the ES had a much lower performance in terms of
computation time. Weighting the pros and cons of each method, it was clear that the ES algorithm was more
favourable for our purpose.
Additionally, to investigate which model selection method best explained our data, we tested and
compared two criterions: AIC and BIC. We have shown that the entropy measures did not significantly differ
when estimated using one or the other method. This was true for all the different models we studied (‘Rate’,
‘Auto’, ‘Cross’ and ‘Full’ models), as well for control and lesioned animals. To elect the criterion that would
provide more accurate results and better adapt to our model, we looked into their behaviours and properties. The
AIC and BIC functions provide an estimate of the test error curve as the number of parameters increases. We
analyzed their typical curve shapes and found that the BIC curves presented a more reliable selection of the
optimized number of parameters.
Some studies have shown that the AIC has a tendency to lean towards models with higher number of
parameters than the true model (Harvey, 1993; Kass and Raftery, 1995). It is also known that, although both
AIC and BIC penalize complexity, tending to select simple models with good fitting and a minimum number of
parameters, in general that effect is stronger in BIC when a large number of trials are available. Although the
optimal number of lagged time bins selected using either method was similar, the results revealed that also in
this case AIC typically opted for models with slightly higher number of parameters in comparison with the
models selected using BIC. Therefore, the extension in time of the auto and cross-correlations were on average
higher for AIC, for control and lesioned animals. The Bayesian criterion was more conservative than the AIC,
thus selecting slightly less complex models. Looking at the AIC and BIC penalty terms (Equations 37 and 38),
we can see that when log(T) is greater than 2, where T is the number of bins that are available for estimating the

67
model, BIC will penalize more the model complexity. Therefore, the more conservative behaviour of the BIC
compared with the AIC is explained by the fact that T in this study is higher than e2.
For modest models, with small datasets, the AIC is usually recommended over the BIC as a selection
criterion. The reason is that, in those conditions, BIC typically leads to underfitting due to its tendency to
suggest excessively parsimonious models. For larger datasets it was demonstrated that the probability of the
AIC erroneously selecting an over parameterized model does not tend to zero and therefore the AIC is
“dimensionally inconsistent” (Kashyap, 1980). On the other hand, the BIC is “dimensionally consistent”: given
a family of models, the probability of selecting the true model is one as the dataset increases in size. Its
penalizing term (Equation 39) is more severe on over parameterized models than the one from AIC, and
subsequently tends to select the best fitting model, for large datasets. Since AIC naturally tends to be more
liberal on favouring extra parameters than the BIC, it can be beneficial in cases where it is preferred an upper
limit of the number of parameters and high certainty that the true model is included. Yet, the over generosity of
the AIC towards spare parameters can be a source of errors. Due to a higher consistency property of BIC,
Nychka et al. (1992) suggested that one should opt for the BIC as an alternative to the AIC, what is in agreement
with our results.
2.7 CONCLUSIONS
In this chapter we describe our information theory approach to be used in the study of GPe and STN-GPe
networks in healthy and 6-OHDA lesioned rats. We detailed, as well as compared, several of the methods used
to calculate the uncertainty of the systems. We have shown that the ES algorithm was preferable to the IRLS
algorithm; it presented full convergence for our dataset, in contrast with the IRLS algorithm which converged
for just over half the cases; additionally, the ES algorithm presented more conservative values on the entropy
estimation. We also showed that the BIC was a better solution to our model selection problem since it presented
higher accuracy and was more conservative than the AIC, which tends to select over parameterized models
when faced with large datasets. Nevertheless, the entropy estimates were similar using either method.

68
3 THE EFFECTS OF DOPAMINE DEPLETION ON NETWORK ENTROPY IN
THE EXTERNAL GLOBUS PALLIDUS
3.1 ABSTRACT
Dopamine depletion in cortical-basal ganglia circuits in Parkinson’s disease (PD) grossly disturbs
movement and cognition. Classic models relate Parkinsonian dysfunction to changes in firing rates of basal
ganglia neurons. However, disturbances in other dynamics of neural activity are also common. Taking both
inappropriate firing rates and other dynamics into account, and determining how changes in the properties of
these neural circuits that occur during PD impact on information coding, is thus imperative. Here, we examined
in vivo network dynamics in the external globus pallidus (GPe) of rats before and after chronic dopamine
depletion. Dopamine depletion led to decreases in the firing rates of GPe neurons and increases in synchronized
network oscillations in the beta frequency (13-30 Hz) band.
Using logistic regression models we determined the combined and separate impacts of these factors on
network entropy, a measure of the upper bound of information coding capacity. Importantly, changes in these
features in dopamine-depleted rats led to a significant decrease in GPe network entropy. Changes in firing rates
had the largest impact on entropy, with changes in synchrony also decreasing entropy at the network level.
Changes in autocorrelations tended to off-set these effects as autocorrelations decreased entropy more in the
control animals. Thus, it is possible that reduced information coding capacity within basal ganglia networks may
contribute to the behavioural deficits accompanying PD.

69
3.2 INTRODUCTION
How does dopamine depletion in cortico-basal ganglia circuits in Parkinson’s disease (PD) induce gross
dysfunction in motor control and cognition? An early and influential model, which we will refer to as the ‘Rate’
model, of the neural basis of the behavioural deficits seen in PD, proposed that dopamine has opposing effects
on direct and indirect pathways through the basal ganglia (Albin et al., 1989; DeLong, 1990). This model
suggested that differential rate changes in these two pathways in PD ultimately leads to an over inhibition of
basal ganglia targets, resulting in decreased cortical activity and movements. However, there are several
findings which are inconsistent with the rate model.
For example, the direct/indirect distinction on which the model is based is no longer clearly defined as
additional pathways linking the BG nuclei have been discovered (Parent and De Bellefeuille, 1983; Kincaid et
al., 1991; Parent and Hazrati, 1995) and there is less segregation between D1 and D2 receptors in the pathways
than was first thought (Surmeier et al., 1996; Aizman et al., 2000). Furthermore, electrophysiological recordings
in cortico-basal ganglia circuits in PD and its animal models have shown that chronic dopamine depletion is
commonly associated with alterations in the firing patterns of neurons, which may occur in the absence of, or in
tandem with, changes in firing rates. Notably, recordings from electrodes implanted in unmedicated patients
with PD have identified beta-frequency oscillations (13-30 Hz) in several basal ganglia nuclei (Brown et al.,
2001; Levy et al., 2002; Williams et al., 2002; Brown, 2003) and similar oscillations have also been seen in
primates treated with MPTP (Nini et al., 1995; Raz et al., 1996; Bergman et al., 1998; Raz et al., 2000; Raz et
al., 2001; Goldberg et al., 2004) and rats treated with 6-hydroxydopamine (6-OHDA) (Sharott et al., 2005b;
Mallet et al., 2008a; Mallet et al., 2008b; Degos et al., 2009), both of which are important models of PD. These
oscillations are stronger when patients are OFF their dopamine replacement medication and are reduced when
patients prepare movements (Brown et al., 2001; Levy et al., 2002; Williams et al., 2002; Williams et al., 2003;
Kuhn et al., 2004b; Brown and Williams, 2005; Williams et al., 2005). These data suggest that beta-frequency
oscillations may detrimentally affect information coding in the basal ganglia. Thus, disturbances in firing rates,
oscillations and synchronization may be detrimental to information processing in the basal ganglia and underlie
the behavioural deficits seen in PD. To investigate this hypothesis further we estimated the entropy in the GPe
of control (dopamine intact) and Parkinsonian (6-OHDA lesioned) rats. Chronic dopamine depletion in this
model of PD caused changes in firing rates, autocorrelations (oscillations) and cross-correlations (synchrony).

70
Using logistic regression models to define the network entropy of the spike trains we determined the collective
impact of these three features as well as the relative impact of each feature when considered separately.
3.3 METHODS
3.3.1 DATA COLLECTION
Experimental procedures were carried out on adult, male Sprague-Dawley rats (Charles River, Margate,
UK), and were conducted in accordance with the Animals (Scientific Procedures) Act, 1986 (UK). The dataset
described in this paper has been published previously (Mallet et al., 2008a; Mallet et al., 2008b) and the 6-
OHDA lesioning and electrophysiological recording procedures have been described in chapter 2 (section 2.3.2
and 0, respectively). Electrophysiological recordings were made in 16 dopamine-intact control rats and 23 6-
OHDA-lesioned rats. See Table A-1 in the Appendix for a summary of the dataset used in this study.
3.3.2 MODEL
Scripts to carry out the analyses are available from the authors on request. We wanted to estimate the
entropy in the network neural responses, as reflected by single-unit activity recorded across ensembles. The
entropy provides an upper bound on the amount of information that can be carried by a population of neurons,
and we assume that the relative amount of information in the basal ganglia is related to how well these nuclei (or
a single nucleus therein) can represent movements or cognition. To estimate the entropy, we first have to
estimate the probability distribution of spiking for neurons in the network. If we analyze neural responses using
small time bins, the spikes can be treated as all or none events. In this case we can represent them as categorical
0’s and 1’s and build a classification model which attempts to predict whether a neuron will (1) or will not (0)
fire a spike in each time bin as a function of its past firing and the firing of other neurons. If we can effectively
predict whether or not a neuron will or will not fire a spike in the next time bin, the actual response in that time
provides us with relatively little information. Although there are a number of ways to approach this estimation

71
problem, the one that makes the least assumptions is the logistic regression model (Christensen, 1997). This
approach is related to the direct and maximum entropy approaches which are known as multinomial or loglinear
models in statistics (Christensen, 1997; Strong et al., 1998; Averbeck and Lee, 2006; Schneidman et al., 2006).
Once this model has been estimated on the data, it can be used to directly estimate the entropy of the spike train,
using the approach outlined below.
We estimated the entropy rate of the spike trains in the GPe network for both the control and the lesioned
rats. The entropy rate, H, of a stationary stochastic process, S, is given by
(1) ),...,|(lim)( 1,1,, ititit
i sssHsH
.
Having shown the stationary properties of the data, we estimated the entropy of the spike trains
conditioned on their past. Additionally, we were interested in the joint entropy of the population of neurons.
Thus, s in Equation 1 is a vector over an ensemble of neurons. Ignoring the temporal component to simplify
notation, the joint entropy of an ensemble of N simultaneously recorded neurons can be factored as
(2)
N
i
iiN sssHssH1
111 ),...,|(),...,(
To begin the analysis we discretised the spike trains at a bin width of 5 ms, which represented a trade-off
between temporal resolution and computational efficiency. Each bin was a Bernoulli random variable with a
value of 0 or 1, and if more than one spike occurred, it was only counted as a single spike. At this bin width
<0.4% of the bins in the control animals and <0.2% of the bins in the lesioned animals contained two spikes. We
also analyzed a subset of our data (~100 GPe neuron pairs from lesioned and control animals) with a bin width
of 2 ms and found results which were consistent with what was found at 5 ms (data not shown).
After the spike trains were discretised we fit logistic regression models to estimate the conditional
probabilities of a spike in each bin. This model is given as
(3)
1
1
,
0
,,
1
0:1,:1,:1,, 2
,2
2
21
1
1
111),...,,|(P
N
j
ktj
K
k
kjkti
K
k
ktjtjtiti sbsaagssssj
N
.
P(si,t| si,1:t, sj1,1:t, ... , sjN-1,1:t) specifies the posterior probability of occurrence of a spike si,t=1, in neuron i at time t,
given the response of neuron i in previous time bins, and/or other neurons j in previous time bins. The variables
a and bj, j=1,…, N-1, are coefficients which are estimated as described below. K1 and K2,j, represent the number

72
of time lags used. For the analyses reported in Figure 2-3, Figure 2-4 and Figure 2-5, N=1, i.e. we carried out
the analyses while conditioning on only one other neuron. We refer to these as pair-wise analyses. For the
subsequent plots we included all neurons simultaneously recorded, and thus N equalled the number of neurons
in the ensemble. The model parameters were optimized for each neuron as described below. The link function g
was the logistic transform
(4)
e
g1
1)(
.
Four versions of the model from Equation 3 were fit which allowed us to examine the effects of different
features of the ensemble response on the network entropy. The first model (the ‘Rate’ model) included only the
a0 term and characterized only the effect of the firing rate on the entropy. All subsequent models included the a0
term as well as additional terms. The second model (‘Auto’) included the lagged bins from the same neuron and
estimated the effect of autocorrelations, that is, oscillations at the single-cell level, on the entropy. The third
model (‘Cross’) included the lagged and zero lag bins from one or more additional neurons, but not the lagged
bins from the same neuron and estimated the effect of cross-correlations, that is, synchrony between pairs of
neurons, on the entropy. The final model (‘Full’) included all of three terms (rate, autocorrelation, and cross-
correlation).
3.3.3 PARAMETER ESTIMATION
Model parameters were fit by maximizing the likelihood of the data given the model parameters. The
log-likelihood (ll) for our model was given by
(5)
T
t
mtitimtiti ssssssll1
,,,, })){,|(P1log()1(}){,|(Plog
where θ is the parameter vector, which for the ‘Full’ model and pairs of neurons was θ = {a0, a1, . . ., aK, b0, . . .,
bK}. For the reduced models only subsets of these parameters and variables were included. We use {sm} as
shorthand to indicate the set of lagged variables appropriate to the corresponding model. So, for example, for the
‘Auto’ model, sm = {si,t-1, . . ., si,t−K1}, for the ‘Cross’ model sm = {sj,t, . . ., sj,t − K2}, the ‘Full’ model would be the
union of these, etc.

73
This equation can be maximized using the iteratively re-weighted least squares algorithm (IRLS, Hastie
et al., 2001). However, we found that this algorithm did not always converge, because of ill-conditioning of the
covariance matrix of lagged spikes (chapter 2). To alleviate this problem, we used an on-line version of the
IRLS algorithm, similar to the adaptive filter or least-mean-squares algorithm used for fitting linear regression
(Ljung, 1999). The parameter updates at iteration l for this algorithm are given by
(6) })]{,|([ ,,
1
m
l
ti
l
tim
ll sspss
In this case sm is the vector of spikes being used for prediction at the corresponding time step for the
model, containing either auto or cross terms. We fit this model using the early stopping rule. To do this the
dataset was split in half, and Equation 6 was iterated on one half of the data and the log-likelihood (Equation 5)
was estimated on the other half of the data. Iteration was stopped when the change in the log-likelihood was
below a criterion value given by
(7) 5
)1(
)()1(
10
l
ll
ll
llll
Normally the early stopping rule is used to control for over-fitting and in this case one looks for a minima
of the log likelihood. However, because we had far more data than parameters in our model the log likelihood
reached a plateau and we used a small change in this plateau as our estimate of convergence.
3.3.4 MODEL SELECTION
The number of lagged terms for either the auto or cross-correlation, K1 and K2,j, had to be estimated. To
do this we estimated models with 1 to 30 lagged terms (i.e. K=1, K=2, . . ., K=30), and used model selection
techniques to determine the optimal number of lags (also see Figure 2-3). We found that our entropy estimates
were not strongly dependent on the number of lags used, as long as we used enough lags. The number of
relevant lags is an interesting quantity by itself, however, as it provides information about the time scale of the
correlations in the data. Thus, if correlations extend over a longer period of time, more lags will be necessary to
capture them. To estimate the optimal number of lags we used the Bayesian Information Criteria (BIC). This is
given by
(8) )ln(2)( TkllkBIC

74
where k is the number of parameters in the model, and T is the amount of data available for estimating the
model. The optimal number of lags was determined by maximizing the BIC function. We also examined entropy
estimates using Akaike’s Information Criterion (AIC). Although the number of lagged terms was always larger,
because AIC penalizes with -2k instead of –kln(T), the actual entropy estimates were statistically
indistinguishable.
3.3.5 ENTROPY
Once the model was optimized and fit, the entropy of the spike train was estimated by calculating
(9)
T
t s
mtimtimi ssssT
ssH1
1
0
,2, }){,|(Plog}){,|(P1
}){|(
Because our models had very few parameters (on average <15) compared with the quantity of data
available (~20,000 bins), and because we were using a cross-validated estimator, we did not have to correct for
bias in our entropy estimate. More specifically, because our model uses cross validation it generates an upper
bound on the entropy and therefore we would not under-estimate the entropy (Efron and Tibshirani, 1998).
We also compared entropy estimates with and without cross-validation and found that they were highly
similar. We also estimated the change (decrease) in entropy, or H, when we included additional sets of
parameters in the model. For the ‘Full’ model this was defined as
(10)
0,
1010,0,
|
,...,,,,...,,||21
asH
bbbaaasHasHH
ti
KKtiti .
By including only the auto or cross terms, we can estimate the separate effects of these factors on the
entropy.
3.3.6 HIGHER-ORDER TERMS
To investigate the presence of higher-order effects on the prediction of the spikes, second order terms
were added to the model from Equation 3

75
(11)
1
1
,,
1
,
1
1
,
0
,,
1
0:1,:1,:1,, 2
,2
2
21
1
1
111).,..,,|(P
N
j
titj
N
ji
ij
N
j
ktj
K
k
kjkti
K
k
ktjtjtiti sscsbsaagssssj
N
The ‘Auto’, ‘Cross’ and ‘Full’ models were recomputed using the estimated parameters from the first
order model from Equation 3 for the ensemble of neurons. For each ensemble of neurons, we compared the
maximum BIC value (BICm) for the ensemble of neurons (BICens) and the BIC obtained with the additional
higher-order terms (BIChot)
(12) )()( mhotmensm kBICkBICBIC .
3.3.7 POPULATION MODEL
We also developed a model which estimated the impact of pair-wise correlations on the entropy at the
population level (see Appendix B for details). The effects at the population level cannot be measured directly, as
hundreds of neurons would have to be recorded simultaneously. This would also require prohibitively large
datasets to get accurate entropy estimates. Estimates can be made, however, by making various assumptions.
The model uses boot-strap estimates of population covariance matrices in conjunction with a linear-nonlinear
estimator (consistent with our logistic regression model) to estimate the entropy in an arbitrarily large
population.
3.3.8 MIXED MODEL ANALYSIS
We also used a linear mixed model (also known as a random effects model) to assess effects of dopamine
lesion on our various entropy parameters. This model was fit using the Mixed function in SPSS (v. 14) with a
fixed effect of lesion and a random effect of subject. We also carried out a related analysis, by first calculating
the average value of each entropy statistic (i.e. entropy based on ‘Rate’, ‘Auto’, ‘Cross’ or ‘Full’ models) for
each animal and then doing t-tests between the distributions of these average statistics for lesioned and control
animals. Results were similar to the random effects models. We report results only for the random effects model
(referred to simply as ANOVA in the text).

76
3.4 RESULTS
The reported results were derived from ensembles of GPe neurons simultaneously recorded in either
dopamine-intact control rats or 6-OHDA-lesioned rats. In the control rats we recorded 27 ensembles which had
a total of 143 single units and 507 pairs of neurons. In the lesioned rats we recorded 56 ensembles which had a
total of 459 single units and 2086 pairs of neurons. Ensembles were defined as a given set of simultaneously
recorded GPe neurons. The ensembles analyzed here contained up to 19 neurons. The average ensemble size for
the control rats was 5.4 neurons and for lesioned rats it was 8.2.
Chronic dopamine depletion caused by 6-OHDA lesions of midbrain dopamine neurons was associated
with substantial changes in the dynamics of neural activity within the GPe network. Specifically, the mean firing
rate of GPe neurons was significantly reduced in the lesioned animals (Figure 3-1A), there was a small relative
increase in the single-neuron oscillations (i.e., autocorrelations) at ~20 Hz (Figure 3-1C), and a larger increase
in the relative synchrony of GPe neuron pairs (i.e., cross-correlations) at ~20 Hz (Figure 3-1D). These latter
changes also led to a large increase in the coherence between neuron pairs, with a peak in coherence at ~20 Hz
(Figure 3-1B). Thus multiple features of the GPe neuron activity were affected in the Parkinsonian animals.
While it is clear that oscillations are present, and oscillations (correlations) can only decrease entropy, it is not
clear how large the effect will be, especially relative to the change in rates and the change in autocorrelations.
Therefore we will compare the size of the effects.
Because these changes in network dynamics have been reported in detail previously (Mallet et al.,
2008a), our primary goal here was to examine the effect of these changes on the entropy in the GPe network. To
calculate the entropy we fit a logistic regression model. By incorporating different sets of parameters in the
model, we examined the separate effects of firing rates, oscillations (autocorrelations) and synchrony (cross-
correlations) on the entropy and determined which of these three features of the network response to dopamine
depletion most impacted on entropy.
We began by determining the number of lagged time bins that were necessary in the model. This is an
estimate of the time interval over which a spike train is correlated with itself (oscillations) or between pairs of
neurons (synchrony), and time bins that were not necessary are bins which had a statistically negligible
contribution. We found that the effect of the autocorrelations rarely extended beyond ~15 bins (75 ms) for either

77
the control or the lesioned animals (Figure 3-2A). The effect of the cross-correlations, however, rarely went
beyond about 6 bins (30 ms) for the lesioned animals, and never went beyond 1 bin (0 time lag, synchronous
spikes) for the normal animals (Figure 3-2B). In fact, for the control animals 99.3% of the pairs did not have a
significant synchronous term and for the lesioned animals > 80% did not (Figure 3-2B). Therefore, the
correlation time was much shorter between neurons than within the spike trains of a single neuron, and this
effect was more dramatic for the control animals than it was for the lesioned animals. The number of parameters
for the ‘Full’ model was then the sum of the number for the ‘Auto’ and cross models (Figure 3-2C).
Figure 3-1. Comparison of GPe network dynamics in 6-OHDA-lesioned and control rats. A. Mean ± SE firing rates of all neurons. Difference
significant at p-value <0.01. B. Mean coherence for all pairs of neurons. C. Mean autocorrelation for all neurons. D. Mean cross-correlation for
all neurons.
0 20 40 60 80 100400
500
600
700
800
Frequency [Hz]
Spectr
al P
ow
er
[a.u
.]
Control
Lesioned
0 20 40 60 80 1000
100
200
300
400
500
Frequency [Hz]
C D
‘Auto’ ‘Cross’
Spectr
al P
ow
er
[a
.u.]
0 20 40 60 80 1000.1
0.15
0.2
0.25
0.3
Cohere
nce
Frequency [Hz]
B
0
10
20
30
40
Me
an
fir
ing
ra
te
[Hz]
Control Lesioned
* *
A

78
3.4.1 EFFECTS OF RATES, AUTOCORRELATIONS AND PAIR-WISE CROSS-
CORRELATIONS ON ENTROPY
Next, we examined the difference in entropy between control and lesioned animals generating four
versions of our logistic regression model that took into account the following features of neuronal activity: (1)
only the firing rates; (2) the firing rates and the autocorrelations; (3) the firing rates and the cross-correlations
(note for all entropy estimates we included at least 1 bin of cross-correlation); or (4) all three features (i.e. the
rates, autocorrelations and the cross-correlations). The fourth ‘Full’ model gives an estimate of the entropy in
the network as it accounts for all factors that can reduce the entropy in spike trains. (Note that we use the term
‘factor’ here and henceforth to refer to the entire set of parameters that represent either the auto or cross effects.)
Importantly, however, in the first analyses we only estimated entropy while conditioning on one other neuron,
i.e. we considered pair-wise and not ensemble
entropy. Below we will present results from an
expanded model which takes into account all
simultaneously recorded neurons (referred to as
the ensemble), and ultimately an entire population
of neurons.
We found that the GPe network entropy
was lower in the lesioned animals as compared to
control animals for all four models (Figure 3-3A-
D). Furthermore, in all four cases, the distributions
were significantly different between control and
lesioned rats (2-way ANOVA with lesion as a
fixed effect and subject as a random effect, p<0.05
on fixed effect). Firing rate differences, without
considering any temporal dynamics, had a large
effect on the difference in entropy (Figure 3-3A).
This is to be expected when using a bin size of 5
ms to analyze neurons firing at <100 Hz, as was
the case here. If only firing rates are considered,
Figure 3-2. Optimal number of lags for auto (K1) and cross (K2)
correlations. A. Optimal number of lagged time bins (5 ms each),
selected with BIC for autocorrelations in lesioned and control
ensembles. B. Same for cross-correlations. C. Total of auto and
cross-correlations.
0 5 10 15 200
0.2
0.4
0.6
0.8
1
Pro
po
rtio
n
Nr of parameters
Control
Lesioned
0 5 10 15 200
0.2
0.4
0.6
0.8
1
Pro
po
rtio
n
Nr of parameters
0 5 10 15 200
0.2
0.4
0.6
0.8
1
Pro
po
rtio
n
Nr of parameters>
>
>
A
B
C
‘Auto’
‘Cross’
‘Full’

79
then a firing rate of 100 Hz results in a spike in half the bins, i.e. the probability of a spike in each bin is 0.5.
When only two outcomes are possible (0 or 1 spike per bin), the entropy is maximal when the probability of the
outcome is 0.5 and thus, the entropy in our case is maximal at 100 Hz and falls off monotonically as the firing
rate decreases below this. Therefore, significantly decreasing firing rates across a population of GPe cells will
necessarily decrease the network entropy, given the firing rate distribution. Adding the autocorrelations to the
‘Rate’ model, however, decreased the difference in entropy between the lesioned and control animals (Figure
3-3B), and as such, the autocorrelations
seemed to reduce the entropy more in the
control animals, a point which we will return
to below. Next we examined the effect of
cross-correlations, that is, synchrony at the
level of pairs of neurons. The cross-
correlations appeared to have a minimal
effect, as the entropy distributions for the
model with this factor were similar to the
distributions for the model with only the rate
factor (Figure 3-3C). Finally, the ‘Full’
model, which took into account all three
factors, was similar to the autocorrelation
model, which also showed that the synchrony
factor had a minimal effect for pairs of
neurons (Figure 3-3D).
To directly determine the effect of
either the autocorrelation or cross-correlation
factor on the entropy, we next examined how
much the entropy was decreased (delta
entropy, ΔH) when either of these factors was
added to the ‘Rate’ model. These effects are
implicit in the results shown in Figure 3-3.
Consistent with those results, delta entropy
Figure 3-3. Comparison of GPe network entropy in lesioned and control
rats under each of the four models. A. Entropy (H) when considering
only firing rates. B. Entropy when autocorrelations are added to the rate
model. C. Entropy when cross-correlations are added to the rate model.
D. Entropy in the ‘Full’ model, which takes into account firing rates,
autocorrelations and cross-correlations.
0 0.2 0.4 0.6 0.8 10
0.1
0.2
0.3
Pro
po
rtio
n
Control
Lesioned
0 0.2 0.4 0.6 0.8 10
0.1
0.2
0.3
Pro
po
rtio
n
0 0.2 0.4 0.6 0.8 10
0.1
0.2
0.3
Pro
po
rtio
n
0 0.2 0.4 0.6 0.8 10
0.1
0.2
0.3
Pro
po
rtio
n
A
B
C
D
‘Auto’
‘Cross’
‘Full’
‘Rate’
Fig. 3
Entropy [bits/bin]
Entropy [bits/bin]
Entropy [bits/bin]
Entropy [bits/bin]

80
was larger for the control animals than for
the lesioned animals when the
autocorrelation factor was considered
(Figure 3-4A). In contrast, when the cross-
correlation factor was considered, delta
entropy values were small for both the
control and the lesioned animals, and as
such, synchrony between pairs of neurons
contributed minimally to reducing the
overall network entropy (Figure 3-4B).
Finally, the ‘Full’ model was similar to the
‘Auto’ model, because most of the change
in entropy came from the auto factor in the
‘Full’ model (Figure 3-4C).
Entropy rate, i.e. entropy per second,
as we calculated here, gives an estimate of
the information capacity of the network and
bounds how well the network can represent
time-varying behaviours, for example movements. Entropy per spike is a less direct measure of how well the
network can code dynamic behaviours because it has to be multiplied by the spike rate to get an estimate of the
information capacity per unit time. However, although entropy per spike is ultimately not the more relevant
metric for understanding the coding capacity of the network, it is interesting from a theoretical, efficiency point
of view (Rieke et al., 1995), particularly because the spike rates were lower in the lesioned animals, and the
effects of the autocorrelations were larger in the control animals. We thus tested whether the entropy per spike
(rather than per bin or per second) was similar in the two GPe networks. We found that the entropy per spike
was actually lower in the controls as compared to lesioned animals.
As such, each individual spike of each GPe neuron carried more information in the lesioned animals
(Figure 3-5). Based on these analyses we can now ask -- which of these changes in network dynamics
contributed most to the decreased entropy observed in the GPe in lesioned animals? For this we calculated the
proportional effects of each of the three factors; changes in rates, changes in autocorrelations and changes in
Figure 3-4. Decreases in entropy (or delta entropy, ΔH) when additional
parameter sets (‘factors’) are included in the models. All changes are with
respect to model which includes only rates. A. Delta entropy for
autocorrelations. B. Delta entropy for cross-correlations. C. Delta entropy for
‘Full’ model with auto and cross-correlations.
-0.1 0 0.1 0.2 0.3 0.4 0.50
0.2
0.4
0.6
0.8
Pro
po
rtio
n
Entropy
Control
Lesioned
-0.1 0 0.1 0.2 0.3 0.4 0.50
0.2
0.4
0.6
0.8
Pro
po
rtio
n
Entropy
-0.1 0 0.1 0.2 0.3 0.4 0.50
0.2
0.4
0.6
0.8
Pro
po
rtio
n
Entropy
A
B
C
‘Auto’
‘Cross’
‘Full’

81
cross-correlations. We found that the effects were 1.84, −0.88 and 0.04, for rates, autocorrelations and cross-
correlations, respectively. In other words, the changes in firing rates had the largest effect (decreased entropy),
the changes in autocorrelations actually made the entropy of the control and lesioned networks more similar (but
affected entropy to a lesser degree than rate), and the changes in cross-correlations had the smallest effect (but
also decreased entropy). Up until now we have only considered the effects of synchronous activity at the level of
pairs of neurons. Below we extend these analyses to larger ensembles of simultaneously recorded neurons, as
well as to the whole population of GPe neurons.
3.4.2 ENSEMBLE ENTROPY
The previous analyses examined the effects of cross-correlations and thus, only considered the effects
between pairs of neurons. It is possible that these effects on network entropy may become larger if the entire
ensemble of simultaneously recorded neurons is considered. To address this, we compared the entropy when the
effects of only one other neuron were being considered (pairs) to the entropy when the entire ensemble of
simultaneously recorded neurons were being considered, where an ensemble is the set of simultaneously
recorded neurons. We found that, in general, including all of the neurons in an ensemble had a minimal
additional effect on reducing the entropy (Figure 3-6A,B). The effect was slightly larger in the lesioned animals
than it was in the control animals (Figure 3-6B), consistent with the fact that the (pair-wise) cross-correlation
effect was slightly larger in lesioned animals as well (Figure 3-4B) and the fact that very few neuron pairs in
controls had a significant synchronous term.
0 1 2 3 4 5 6 7 8 9
x 10-3
0
0.1
0.2
0.3
Pro
po
rtio
n
Entropy per Spike [bits/spike]
Control
Lesioned
‘Full’
Figure 3-5. Entropy per spike of ‘Full’ model. Data
for all GPe neurons is shown but entropy rate (entropy
per spike) for each neuron was divided by the average
firing rate of that neuron.

82
3.4.3 HIGHER-ORDER EFFECTS
Another important way that our model can be extended is to consider higher-order effects. Specifically,
similar to measuring cross-correlations linearly, we have only been considering the effects of a single bin of
neural activity in the model. It is possible that patterns of spikes across two bins, either within the spike trains of
a single neuron, or between pairs of neurons were important. To examine this we estimated models which
included pair-wise interactions either from the lagged time bins of a single neuron, or pair-wise interactions
between neurons in ensembles (see methods). We found that, in all cases, including these terms did not improve
the model fit (BIC > 0). Thus, there was no statistically supportable evidence in our data that quadratic terms
were important.
3.4.4 MODELING EFFECTS AT THE POPULATION LEVEL
In the preceding analyses, we have found only modest effects of cross-correlations between neurons on
the network entropy. To some extent, this is to be expected, as theoretical studies show that the effects of
correlations tend to be small in pairs of neurons, whereas they can be large in networks of neurons (Narayanan
et al., 2005; Averbeck et al., 2006). It is currently not feasible to record from or estimate the entropy in hundreds
Figure 3-6. Comparison of ensemble and pair-wise entropy. A. Scatter plot of entropy in pairs (Hpairs) and entropy in corresponding
ensemble (Hens). Each ensemble is plotted against all of the pairs into which it can be broken down. Points on the diagonal show no
additional effect of additional neurons in the ensemble. B. Distribution of differences between entropy in pairs and entropy in
corresponding ensemble.
0 0.2 0.4 0.6 0.8 10
0.2
0.4
0.6
0.8
1
Entropy
En
tro
py
en
s
0 0.02 0.04 0.06 0.08 0.10
0.2
0.4
0.6
0.8
1
Pro
po
rtio
n
Control
Lesioned
A B
pairs Entropypairs
- Entropyens [bits] [bits]
[bits]
‘Cross’

83
or thousands of neurons. It is possible, however, to estimate the effects of correlations in large populations of
neurons, using estimates of pair-wise correlations across the population and a model of the population which
makes certain assumptions. As such, we can estimate how large the effects of cross-correlations would be at the
level of the entire GPe neuron population.
We carried out this analysis in two steps. First, we showed that our model predicted correlation values in
small ensembles of ≤12 simultaneously recorded neurons (Figure 3-7A). Although we had a few larger
ensembles we were not able to subsample enough different ensembles of >12 neurons to derive reliable
estimates. We randomly selected 400 recorded ensembles of various sizes and calculated the change (decrease)
in entropy (delta entropy) as a function of ensemble size. We then used our model to predict average delta
entropy values using information about pair-wise correlations between recorded neurons. We found a close
correspondence between our model and the data (Figure 3-7A). Thus, for small ensembles, our model closely
predicted delta entropy.
Next, we used the measured values of correlations between pairs of neurons to generate a population
covariance matrix, for populations of various sizes, and examined how delta entropy scaled with the size of the
population. We found that, although delta entropy rises steeply up to a population size of about 100 neurons, it
flattens after that, and saturates at a value of ~0.021 on average for the GPe neuron population in the lesioned
animals and ~0.011 for the control population (Figure 3-7B). Thus, the effects of cross-correlations at the
population level remain somewhat modest when compared to either autocorrelations or firing rates but they are
much larger than they are in pairs.
Figure 3-7. Decrease in entropy (delta entropy, ΔH) as function of ensemble size and model prediction. A. Average delta entropy in 400
random ensembles of simultaneously recorded neurons of each size (thin lines; error bars are ±1 SEM) and model predictions (thick lines).
B. Predicted delta entropy as a function of ensemble size for large populations.

84
Similar to the analysis carried out above for pairs of neurons, we can examine the relative contribution of
each factor to decreasing the entropy using our network estimates. In this case we found that the effects were
1.838, −0.882 and 0.051, for rates, autocorrelations and cross-correlations, respectively. Thus while there is a
large increase in the effect of correlations at the population level, it is still small compared to the other effects.
3.5 DISCUSSION
We examined the effects of changes in activity dynamics brought about by chronic dopamine depletion
on the entropy in the GPe network. Our analyses showed that network entropy and thus, information coding
capacity, was significantly reduced in the lesioned animals as compared to controls. This reduction in entropy
arose chiefly because of decreases in GPe neuron firing rates, although increases in cross-correlations
(synchrony) between neurons also significantly contributed. Interestingly, the autocorrelations in GPe were
more structured in control animals and actually decreased the entropy more in these animals than it did in the
lesioned ones. As with previous studies (Petersen et al., 2001; Averbeck and Lee, 2006) and consistent with
theoretical predictions (Shamir and Sompolinsky, 2004; Averbeck et al., 2006), the effects of cross-correlations
were limited at the level of pairs of neurons. However, the effects of synchronized activities were larger at the
network level (Narayanan et al., 2005; Averbeck et al., 2006).
Classical theories of basal ganglia dysfunction in movement disorders have suggested that decreases in
neural activity in the GPe, which is part of the indirect pathway, would contribute to movement deficits (Albin
et al., 1989; DeLong, 1990). Consistent with this idea we did find that the spike rates of GPe neurons were
decreased. We have, however, taken a different perspective on this decrease in firing rates. We have examined
the effect of this decrease on the entropy in the network, and therefore we have assumed that the decrease in
firing rates changes the ability of the population to code information. An advantage of using information theory
to examine these effects is that it allows us to compare, within a single analytical framework, the effects of
changes in rates to the effects brought about by changes in other activity dynamics, such as cross-correlations
and autocorrelations. The classical theory has no way of accounting for how changes in activity dynamics other

85
than firing rates influence behaviour, because it assumes that the total activity of a nucleus somehow relates to
whether a specific movement will be executed.
Implicit in our approach is the idea that activity patterns within the GPe code information. Thus, we are
assuming that neurons within the basal ganglia have tuning functions (Boussaoud and Kermadi, 1997), similar
to cortical and thalamic neurons (Georgopoulos et al., 1982), such that the activity of single neurons varies in a
continuous way with some underlying task variable, such as force or direction (Pasquereau et al., 2007). Thus,
the activity of an individual neuron would not accurately code information about movements. Rather, the
activity across a population of neurons would code that information. Simply increasing or decreasing firing rates
in the population would not necessarily affect the movement being encoded. From this point of view, the
entropy of the network constrains how well the network can code information, and it is these coding constraints
that might lead to movement difficulties.
The exaggerated beta frequency synchronization seen in the cross-correlations in the GPe in our animal
model is similar to that which has been recorded in the STN, which is reciprocally connected with GPe, in
patients with PD (Levy et al., 2002; Williams et al., 2002; Brown, 2003). These studies have shown that beta
activity was stronger when the patients were OFF dopamine replacement medication (Brown et al., 2001;
Williams et al., 2002), that the oscillatory activity decreased during movements or movement preparation (Levy
et al., 2002; Kuhn et al., 2004b; Brown and Williams, 2005; Williams et al., 2005), and that this decrease was
facilitated if patients were on dopamine medication (Doyle et al., 2005). Taken together, this work suggests that
dopamine desynchronizes beta activity in basal ganglia networks, and this desynchronization may be important
for action initiation. From the point of view of information coding, the beta-frequency synchronization might
constrain the ability of the network to represent or encode movements. Thus our finding is consistent with
recordings in PD patients with movement difficulties. That said, the excessive synchronization in GPe is
concomitant with decreased firing rates therein and so, most probably, changes in both these features of activity
are important.
A key consideration of our study is that we analyzed GPe activity recorded in anesthetized animals. We
assume that the entropy changes occurring under anaesthesia are also relevant for the GPe in the awake,
behaving animal. There is good evidence to support the extrapolation of our findings to the unanaesthetized
state. First, the beta synchronization we have analyzed occurs in both anesthetized and awake 6-OHDA-lesioned
rats (Sharott et al., 2005b; Mallet et al., 2008a; Mallet et al., 2008b; Degos et al., 2009). Moreover, we restricted
our analysis to the GPe activity present during a spontaneous activated brain state, which mimics that

86
accompanying the alert behaviours in which beta oscillations are most prominent in PD patients and lesioned
rats (Sharott et al., 2005b; Mallet et al., 2008a; Urrestarazu et al., 2009). In addition, other studies have shown
that network dynamics in the undriven state are similar to those in the driven state. For example, studies of
primary visual cortices in anesthetized animals have shown that V1 neurons dynamically drift through states that
are similar to those seen when the system is driven (Kenet et al., 2003), and neural activity patterns are largely
due to intrinsic dynamics as opposed to sensory inputs (Fiser et al., 2004). Thus, the entropy in the GPe network
during behaviour may be similar to the entropy during rest. Second, the network dynamics we define here are
probably the result of plasticity in the network as they only appear several days after dopamine neurons are
lesioned (Degos et al., 2009). Thus, disturbed activities in the anesthetized state are likely due to underlying
changes in the microcircuit, and therefore may still be present in the awake state and the entropy reductions we
have shown will likely pertain to behaving animals. However, because synchronized beta oscillations are
dynamic phenomena, which fluctuate in time as a function of dopamine and behaviour (Kuhn et al., 2004a;
Doyle et al., 2005), it would still be of interest to test in the future whether and how network entropy changes
during specific phases of a movement.
The results of functional surgical procedures for PD also have bearing on our coding hypothesis. Focal
lesions of the STN or internal pallidus have positive therapeutic effects on the motor symptoms of PD.
However, the information coding capacity of the lesioned nuclei must decrease because the number of available
neurons is reduced. Moreover, therapeutic high-frequency stimulation (HFS) of the STN also reduces the
entropy per spike of single neurons in pallidus and thalamus in Parkinsonian monkeys (Dorval et al., 2008).
However, although HFS decreased GPe bits per spike, it also increased firing rates (Dorval et al., 2008).
Because of this rate change, and because extrapolating single-neuron entropy calculated in bits/spike to the
network level (calculated here in bits per second) is not straightforward (see Figure 3-5), it is unclear whether or
not the overall GPe network entropy is decreased with HFS. Regardless, one implication of the functional
surgical procedures is that some aspects of synchronisation are not captured by our single-nucleus estimation of
information coding restriction, and demand consideration of the extended cortico- basal ganglia circuit. Indeed,
synchronisation limits the local information coding space but is also influential over subsequent stages of
processing. Moreover, ‘downstream’ responses to the deleterious effects of synchronisation might exhibit
frequency tuning, such that not all frequencies are equivalent across the coding space (Eusebio et al., 2008).
Although we can estimate the upper limit of information coding capacity we do not know what aspects of the
information coding space may be more influential or more deleterious to targets. Nevertheless, the use of

87
information theory provides us with a starting point and an analytical framework with which to evaluate the
separate and combined effects of firing rate, oscillations and synchronization in the basal ganglia. The single-
cell and network mechanisms underlying the emergence of these changes in GPe are largely unknown but
deranged afferent activity is likely to play an important role. Excessively synchronized rhythmic ‘drive’ from
the STN in lesioned animals is a good candidate substrate for the increased synchronization observed in GPe
(Mallet et al., 2008a). However, because STN neurons are hyperactive during Parkinsonian beta oscillations
(Mallet et al., 2008b), the most parsimonious explanation for the depressed firing rates in GPe is that the
network receives an inappropriately strong inhibition from striatum after dopamine loss (Mallet et al., 2006).
Lesion-induced alterations in the intrinsic ‘pacemaking’ properties of GPe neurons (Surmeier et al., 2005) might
well bring about the changes in their firing regularity (autocorrelations). An important issue for future research
is thus to understand which changes in microcircuit properties give rise to the decreased firing rates and
increased synchronization. Microcircuit properties have to change somewhere, to give rise to the changes in
dynamics, as the dynamics are a function of the microcircuit. One powerful way to explore the changes in
microcircuit properties responsible for the changes in dynamics will be to build realistic spiking-neuron network
models of this system, and examine the changes in the model network that could give rise to the changes seen in
the network in vivo. The basal ganglia should be a fruitful place to apply such techniques, because so much is
known about the microcircuitry (Smith et al., 1998).
3.6 CONCLUSIONS
Our analyses have shown that there are changes in firing rates, single-cell oscillations and synchrony in the GPe
when dopamine is chronically depleted, as in PD. We used information theory techniques to show how these
changes in network dynamics lead to changes in the entropy of the system and found that there is significantly
less entropy in the Parkinsonian GPe network. Thus our results are consistent with the general hypothesis that
changes in network dynamics lead to changes in entropy of the GPe network, and it is this impaired ability of
the network to code information that may contribute to motor and cognitive deficits in disorders like PD.

88
4 EFFECTS OF DOPAMINE DEPLETION ON INFORMATION FLOW
BETWEEN THE SUBTHALAMIC NUCLEUS AND EXTERNAL GLOBUS
PALLIDUS
4.1 ABSTRACT
Abnormal oscillatory synchrony is increasingly acknowledged as a pathophysiological hallmark of
Parkinson’s disease, but what promotes such activity remains unclear. We used novel, nonlinear time series
analyses and information theory to capture the effects of dopamine depletion on directed information flow
within and between the subthalamic nucleus (STN) and external globus pallidus (GPe). We compared neuronal
activity recorded simultaneously from these nuclei in 6-hydroxydopamine-lesioned Parkinsonian rats with that
in dopamine-intact control rats. After lesioning, both nuclei displayed pronounced augmentations of beta-
frequency (~20 Hz) oscillations and, critically, information transfer between STN and GPe neurons was
increased. Furthermore, temporal profiles of the directed information transfer agreed with the neurochemistry of
these nuclei, being ‘excitatory’ from STN to GPe and ‘inhibitory’ from GPe to STN. Separation of the GPe
population in lesioned animals into ‘Type-Inactive’ (GP-TI) and ‘Type-Active’ (GP-TA) neurons, according to
definitive firing preferences, revealed distinct temporal profiles of interaction with STN and each other. The
profile of GP-TI neurons suggested their output is of greater causal significance than that of GP-TA neurons for
the reduced activity that periodically punctuates the spiking of STN neurons during beta oscillations. Moreover,
STN was identified as a key candidate driver for recruiting ensembles of GP-TI neurons but not GP-TA
neurons. Short-latency interactions between GP-TI and GP-TA neurons suggested mutual inhibition, which
could rhythmically dampen activity and promote anti-phase firing across the two subpopulations. Results thus
indicate that information flow around the STN-GPe circuit is exaggerated in Parkinsonism, and further define
the temporal interactions underpinning this.

89
4.2 INTRODUCTION
It is unclear how loss of midbrain dopamine neurons in Parkinson’s disease (PD) disturbs the activities
of their targets in cortico-basal ganglia circuits, which must ultimately support the observed behavioural deficits.
Studies in unmedicated patients with PD have shown that beta oscillations (13-30 Hz) often prevail in the cortex
and basal ganglia (Brown et al., 2001; Levy et al., 2002; Williams et al., 2002; Brown, 2003; Amirnovin et al.,
2004; Alonso-Frech et al., 2006; Moran et al., 2008). These beta oscillations decrease when patients are on
dopamine replacement medication or when they initiate movements, hinting at their functional significance
(Brown et al., 2001; Levy et al., 2002; Williams et al., 2002; Williams et al., 2003; Amirnovin et al., 2004;
Kuhn et al., 2004b; Brown and Williams, 2005). Excessively synchronized beta oscillations also arise in these
circuits after chronic dopamine depletion in the 6-hydroxydopamine-lesioned rat model of PD (Sharott et al.,
2005b; Mallet et al., 2008a; Mallet et al., 2008b; Degos et al., 2009). Whether these oscillations have a direct
negative effect on neural representations and the information coding capacity of these circuits (chapter 3, Cruz
et al., 2009) or only indirectly reflect changes in the underlying computations therein is not clear, and neither are
the precise changes in microcircuit properties that support them. It is known, however, that excessive beta
oscillations in this animal model develop over a period of days/weeks following lesions of dopamine neurons
(Mallet et al., 2008b; Degos et al., 2009), and that they arise in key circuit nodes, such as the subthalamic
nucleus (STN) and external globus pallidus (GPe).
The reciprocally-connected network formed by the glutamatergic neurons of the STN and the
GABAergic neurons of GPe might be particularly important for generating synchronized oscillations in the
basal ganglia in PD (Bevan et al., 2002). Indeed, the incidence of oscillatory synchronization between the
STN/GPe, as measured by standard (linear) cross-correlations between neuron pairs, greatly increases after
dopamine depletion in animals (Mallet et al., 2008b). However, changes in cross-correlations do not necessarily
reflect changes in the interactions between these two nuclei. For example, if the autocorrelations (including
those arising from oscillatory activity) in the GPe changed, the measured cross-correlation would also change,
even when the influence of the GPe on the STN had not. This is because the cross-correlation is the convolution
of the autocorrelation function and the transfer function of the system (Papoulis, 1991). Stated another way,
linear cross-correlations reflect both the changes within each nucleus and the interaction between the nuclei.
Therefore, cross-correlations do not necessarily best represent the effect of a spike in one nucleus on the

90
probability of a spike in the other nucleus, which is the quantity of interest. Analytical models that are based on
logistic regression (Truccolo et al., 2005) and mutual information (chapter 3, Cruz et al., 2009) offer some
advantages in that they can account for the effects of the changes within each nucleus when they assess the
interactions between nuclei, although they do not unambiguously distinguish between direct (monosynaptic)
effects and indirect network effects. We have applied these modelling approaches to examine how the
interactions or ‘directed information flow’ within the STN/GPe network are changed following chronic
dopamine depletion.
4.3 METHODS
4.3.1 DATA COLLECTION
Experimental procedures were carried out on adult, male Sprague-Dawley rats (Charles River, Margate,
UK), and were conducted in accordance with the Animals (Scientific Procedures) Act, 1986 (UK). The dataset
described in this paper has been published previously (Mallet et al., 2008a; Mallet et al., 2008b) and the 6-
OHDA lesioning and electrophysiological recording procedures have been described in chapter 2 (sections 2.3.2
and 2.3.3, respectively). Electrophysiological recordings were made in 10 dopamine-intact control rats and 18
Parkinsonian rats (6-hydroxydopamine-lesioned) (Table A-1 in the Appendix).
4.3.2 MODEL
We have previously developed an analytical approach based on log-linear models (Truccolo et al.,
2005; chapters 2 and 3, Cruz et al., 2009) that allows us to characterize the impact of various features of neural
activity on network entropy, a measure of the upper bound of information coding capacity of a given neural
population. This modelling approach can be readily extended to describe the directed information flow between
pairs of neurons in two distinct populations, e.g. STN and GPe. Directed mutual information in this case affords
an estimate of how well the ‘response’ (i.e. spiking activity) of a neuron in one nucleus can be predicted from

91
the response of a neuron in another nucleus. In effect then, it can give insights into what information can
potentially be transferred between the two nuclei. Our modelling approach is an example of nonlinear time
series analysis (Kantz and Schreiber, 2004), and it relates and we do it within the framework of Granger
Causality (Bollimunta et al., 2009). More specifically, when we estimated the interactions between STN and
GPe neurons (or between different types of GPe neuron), we used only (Granger) causal activity, which is to say
that we considered only those effects with non-negative time delays between nuclei. Moreover, when we
examined the directed information flow between nuclei, we measured the amount of additional information
about the activity of neuron i at the current time point that can be obtained from neuron j recorded in the other
nucleus, but only after first accounting for all of the information that can be extracted from the past activity of
neuron i itself. For example, if neuron i were an intrinsic oscillator, its activity could be accurately predicted
from its own firing history and thus, the activity of other neurons (j etc.) would not be additionally useful. Thus,
if we first modelled the effects of neuron i on itself, and then checked how much better we could do by
including neuron j in the model, we would not find an improvement. However, it should be noted that the model
affords a conservative estimate of the effects of neuron j on neuron i. It is conservative because the prior history
of neuron i may have been affected by the history of neuron j, and yet this will also be taken out. But why
should there be any interaction remaining between neuron j and neuron i after the past activities of both neurons
are taken into account? In a perfectly-regular system of coupled oscillators, removing the effects of the
autocorrelation of each oscillator would entirely suppress their cross-correlation. However, if the oscillations
present in two spike trains are not perfectly regular, the presence of ‘phase slips’ over time will mean that some
cross-correlation features survive after the autocorrelations have been accounted for. Previous studies have
confirmed the presence of numerous phase slips in the oscillations within spike trains of basal ganglia neurons
(Hurtado et al., 2004; Hurtado et al., 2005; Park et al., 2010). Hence, the firing history of either neuron may not
fully predict their interactions, and this is likely the case for the networks of STN and GPe neurons considered
here (see below). In short then, with our conservative approach, any effects of neuron j on i do not include past
influences. Nevertheless, the fact that many of the constituent neurons of the STN-GPe network are intrinsic
pacemakers (Surmeier et al., 2005) makes this conservative approach important as it discounts the past history
of a neuron. Our analytical approach thus has advantages over computing standard linear cross-correlations (also
see section 4.2). However, this approach does make assumptions, despite the fact that it has often been called
‘direct’ or ‘model free’ (Strong et al., 1998). More specifically, the temporal resolution of the spiking activity

92
(or the bin width for analyses) must be pre-selected, and, the level of interaction between spikes at different
times must also be selected. The validity of both selections can be tested, to some extent (see chapter 2).
An analysis flow chart is presented in Figure C-1 in the Appendix. Model fitting began with binning the
spike time data (point process) at 5 ms, where a bin received a 1 if there were one or more spikes in it or a 0 if
there were no spikes in it. At this bin size, <0.01% of the bins from STN and GPe neurons had two spikes in
them. Thus, pairs of spikes in a single bin were very rare. Furthermore, this bin size preserves temporal structure
up to the 100 Hz Nyquist frequency and therefore it preserves much of the relevant temporal structure of the
spike trains recorded in the STN and GPe. To assess the validity of this temporal resolution, we carried out pilot
analyses using smaller bin sizes, and found that results were consistent with those reported here using the 5 ms
bin size. We also assessed whether including higher-order interactions between spikes at different times
improved the model, as we did in our previous study (chapter 3, Cruz et al., 2009). We found that these higher-
order interactions did not enhance the model fits. To some extent, however, finding effects of higher-order
interactions is limited by the amount of data available for fitting the model. So, one can never be sure that
effects would not be found if more data were available.
Following binning of the spike trains, we fit the following model to pairs of spike trains (e.g. one from
STN, one from GPe):
(1) )(),|(P2
2
22
1
1
11
0
,
1
,0:1,1:1,,
K
k
ktjk
K
k
ktiktjtiti sbsaagsss .
The left hand side, P(si,t|…) is the probability of a spike (s) fired by neuron i in time bin t conditioned on
the other variables under consideration, which depend on the model used (see below). The variable i represents
the neuron whose response is being predicted, j represents another neuron (e.g. from the other nucleus), t
indicates the current time bin, K1 indicates the number of lagged time bins from neuron i that are being used (as
an ‘auto predictor’) and K2 indicates the number of lagged time bins from neuron j that are being used to predict
the activity of neuron i (a ‘cross predictor’). The terms ak will be referred to as auto terms, as they model
nonlinear autocorrelations, and the terms bk will be referred to as cross terms, as they model nonlinear cross-
correlations. The latter are the parameters plotted in Figure 4-5 and Figure 4-7. The values of K1 and K2 were
optimized individually for each neuron pair using the model selection procedure described below. The sum over
k2 terms starts at zero, which is to say that we used synchronous spikes for prediction. We have carried out all
analyses with and without this term, and the results are equivalent. However, we chose to include this term

93
because the propagation time of activity between the STN and GPe can be less than 5 ms (i.e., bin size used
here) in the adult rat in vivo (Kita et al., 1983; Kita and Kitai, 1991). The function g captures the nonlinearity
that constrains the prediction of a spike in each bin to be between 0 and 1, i.e. it constrains it to be a probability.
It is given by the logistic function:
(2)
e
g1
1)( .
The logistic transform makes Equation 1 nonlinear. However, it is a static nonlinearity, as opposed to a
dynamic nonlinearity that would be a function of time, or time lags. Because Equation 1 is nonlinear, it differs
from the linear interactions that are captured by cross-correlations, coherence and other standard time- and
frequency-domain analyses.
The parameters of the model were fit by maximizing the likelihood of correctly predicting whether a
spike did or did not occur in each bin. This parameter estimation method was characterized in chapter 2, section
2.4.1 and summarized in chapter 3, section 3.3.3. To estimate the optimal number of lags for each model, we
used the Bayesian Information Criteria (BIC) (chapter 2, section 2.4.2 and chapter 3, section 3.3.4).
4.3.3 DIRECTED INFORMATION FLOW
After the models were optimized for each pair of STN/GPe neurons (or GPe/GPe neurons), we used
them to estimate the causal mutual information (the directed information flow) between the same pairs. This
directed information flow, Icausal, is given by:
(7) 211
,...,,,,...,,|,...,,| 101010 KKKcausal bbbaaasHaaasHI ,
where H(x) is the entropy of the spike train under the corresponding model calculated with the standard equation
(Cover and Thomas, 1991):
(8)
T
t s
mtimtimi sspsspT
ssH1
1
0
,2, }){,|(log}){,|(1
}){,|( .
In Appendix D, we show how our approach to determine directed information flow closely relates to the
Transfer Entropy measure proposed by Schreiber (2000) (see chapter 1, section 1.8).

94
4.3.4 DAMPED SINUSOIDS
The temporal structures of interactions (lagged parameters for bk) between STN and GPe, and within GPe
itself, were found to resemble damped beta-frequency profiles (see Figure 4-5). To characterize this more
specifically, we fit damped sinusoids to the average interaction terms. They were fit by minimizing the squared
error between the measured parameters and the damped sinusoid, which was given by:
(9) )2cos()( / ftetr t
.
The parameters are the maximum amplitude, β the damping rate (in seconds) and θ the phase of the cosine
function (in radians). We report these parameters and the frequency characteristics (f) in Table 4-1 and Table
4-2. Minimization was done using fminsearch in Matlab.
4.4 RESULTS
4.4.1 COMPARISON OF STN-GPE NETWORK DYNAMICS IN CONTROL RATS
AND PARKINSONIAN RATS
Extracellular unit activity was recorded simultaneously from neurons in the STN and GPe in dopamine-
intact control rats and 6-OHDA-lesioned Parkinsonian rats. The dataset was composed of 49 pairs of STN/GPe
neurons in control animals (10 single neurons in the STN and 49 in the GPe) and 184 pairs of STN/GPe neurons
in lesioned animals (26 single neurons in the STN and 133 in the GPe). The GPe neurons analyzed in this study
comprise a subset of the GPe neurons considered in our previous study (chapter 3, Cruz et al., 2009), as here we
only included those GPe neurons that were simultaneously recorded with at least one STN neuron. In a first set
of analyses, we considered GPe neurons in control animals as a single population and all GPe neurons in
lesioned animals as separate population. In a second set of analyses, we split the single GPe population recorded
in lesioned animals and grouped the neurons according to previously identified cell types (Mallet et al., 2008a).

95
Figure 4-1. Comparison of GPe, GP-TI, GP-TA and STN network dynamics and interactions in dopamine-intact control rats and 6-OHDA-
lesioned Parkinsonian rats. A. Mean firing rates of all STN and GPe neurons in control and lesioned animals. B. Mean auto-spectra for all GPe
neurons in control and lesioned animals. C. Mean auto-spectra for STN neurons in control and lesioned animals. D. Mean cross-spectra between
pairs of GPe and STN neurons. E. Mean firing rates of GP-TI neurons and GP-TA neurons in lesioned rats. F. Mean auto-spectra for GP-TI and
GP-TA neurons in lesioned rats. G. Mean cross-spectra between GP-TI pairs, between GP-TA pairs and between GP-TI/GP-TA pairs of neurons
in lesioned rats. H. Mean cross-spectra between STN/GP-TI pairs and between STN/GP-TA pairs of neurons in lesioned rats. Asterisks in (A)
and E indicate significant differences. a.u. = arbitrary units.

96
Specifically, two main types of GPe neuron can be identified in lesioned animals using their distinct firing
patterns (Mallet et al., 2008a). Type-A GPe neurons (GP-TA neurons, n = 26 STN/GP-TA cell pairs)
preferentially discharge during the ‘active components’ of cortical slow (~1 Hz) oscillations, whereas Type-I
GPe neurons (GP-TI neurons, n = 105 STN/GP-TI cell pairs) preferentially discharge during ‘inactive
components’. This functional dichotomy is preserved, that is GP-TA and GP-TI neurons tend to still fire in
‘anti-phase’, during the excessive beta oscillations that arise in lesioned animals during activated cortical states
(Mallet et al., 2008a), as were studied here. Given this functional dichotomy in GPe during excessive beta
oscillations, it was important to examine whether GP-TA and GP-TI neurons interact differently with STN
neurons, among themselves or with each other. As reported previously (Mallet et al., 2008a), most GPe cells
could be considered as GP-TA or GP-TI neurons but, for these secondary analyses, 58 pairs of STN/GPe
neurons were not included as the GPe cell could not be unambiguously identified as either type. Also, we did
not similarly split the population of GPe neurons recorded in control rats because, when dopamine is intact,
most of these cells fire independently of the cortical slow oscillation (Mallet et al., 2008a). See Table A-1 in the
Appendix for a summary of the dataset used in this study.
Mean firing rates of STN neurons recorded during activated brain states in control and lesioned animals
were 13.5 Hz and 30.9 Hz, respectively, whereas the mean firing rates of the whole populations of GPe neurons
were 32.0 Hz and 17.4 Hz, respectively (Figure 4-1A). Thus, chronic loss of dopamine is associated with a
significant increase of STN activity (t-test, p<0.001), and a decrease in GPe firing (t-test, p<0.001). When GPe
neurons recorded in lesioned animals were grouped according to cell type, the mean firing rates of GP-TI
neurons and GP-TA neurons were 14.5 Hz and 19.7 Hz, respectively (Figure 4-1E, t-test, p<0.001). Dopamine
depletion also led to increased prevalence of ~20 Hz (beta-frequency) oscillations in the spike trains of single
neurons in the GPe (Figure 4-1B) and STN (Figure 4-1C) as well as the emergence of a well-defined peak at
beta frequencies in the average cross-spectra between STN and GPe (Figure 4-1D). The mean auto-spectra of
GP-TI neurons but not that of GP-TA neurons showed clear beta oscillations (Figure 4-1F). Furthermore, beta
peaks were seen in the cross-spectra between different cell types in GPe (Figure 4-1G), as well as between STN
and GP-TI neurons and between STN and GP-TA neurons (Figure 4-1H).

97
4.4.2 PARAMETER ESTIMATION FOR NON-LINEAR MODELS OF SPIKING
ACTIVITY IN STN-GPE NETWORK
The primary goal of this study was to compare directed information flow or transfer between the STN
and GPe in control and Parkinsonian animals. To this end, we fitted two models to the response of each STN or
GPe neuron that had been recorded simultaneously with a neuron in the other nucleus. First, we fitted a model
(‘Auto’) that had only autocorrelation terms. This allowed us to examine how well the response of an individual
neuron could be estimated from its own spiking history. This model was fit by optimizing (adding) lagged time
bins until no additional information could be extracted from the response history to predict activity in the current
time bin. Lags of zero indicate no significant interactions. If correlations extend over a longer period of time,
more lagged time bins are necessary to capture them. Therefore, the optimal number of lagged time bins that
provide information about the current activity of a neuron is an estimate of the dependence of current activity on
past activity, or the correlation length of the spike train. We found that for most STN neurons, in either controls
or lesioned animals, the number of significant lagged bins was between 5 and 20 (Figure 4-2A). As each bin was
Figure 4-2. Optimal numbers of lags for autocorrelations and cross-correlations. A, B. Autocorrelations for all STN neurons and all GPe
neurons, respectively, in control and lesioned rats. C. Autocorrelations for distinct cell types, GP-TI and GP-TA neurons, in lesioned animals.
D, E. Cross-correlations for transfer in direction from GPe to STN (D) and from STN to GPe (E) in control and lesioned rats. F. Cross-
correlations between GP-TI/GP-TI pairs and GP-TA/GP-TA pairs in lesioned rats. G, H. Cross-correlations for transfer in direction from GP-
TA or GP-TI to STN (G) and from STN to GP-TI or GP-TA (H) in lesioned rats. I. Cross-correlations for GP-TI to GP-TA transfer and for GP-
TA to GP-TI transfer in lesioned animals. In all cases, optimal numbers of 5 ms time bins (K1 or K2) were selected with Bayesian Information
Criteria. Note that lags of zero indicate no significant interactions.

98
5 ms, this meant that the previous 25-100 ms history of a STN neuron’s activity contained information about
whether the same neuron would fire a spike in the current bin. However, the distributions of lagged bins differed
significantly for STN neurons in control and lesioned animals (KS-test, p<0.001). Indeed, STN neurons in
controls had fewer significant interactions than those in lesioned animals, as indicated by a larger proportion of
lagged bins at zero and thus, fewer lags above zero (Figure 4-2A). The spiking of GPe neurons could be
accounted for by 5-12 lagged bins in both control and lesioned animals (Figure 4-2B). These distributions of
lagged bins did not differ between control and lesioned rats (KS-test, p = 0.759). When the single GPe
population data from lesioned animals was split into GP-TI and GP-TA neurons (Figure 4-2C), it could be seen
that the number of lagged time bins was similar between these two groups (KS-test, p = 0.184).
Following the estimation of the ‘Auto’ model we estimated the ‘Cross’ model, which included the cross
terms, to account for interactions between STN and GPe, or interactions between pairs of neurons within GPe.
The first step, similar to the procedure with the ‘Auto’ model, was to estimate the number of significant lagged
time bins. In all cases, fewer terms were necessary to account for interactions between neurons than were
necessary to model the autocorrelations for single neurons. When considering interactions between nuclei in
control animals, there were only two significant interactions (out of a total of 49 pairs) from the GPe to the STN
(see large proportion of zero lags in Figure 4-2D), and there were no significant interactions from the STN to the
GPe (Figure 4-2E). In the lesioned animals, however, we found that in about 35% of the STN/GPe pairs, there
was a significant interaction of at least one bin from both the GPe to the STN (Figure 4-2D) and from the STN
to the GPe (Figure 4-2E), and the interactions extended to 50-75 ms. Thus, when GPe neurons were not grouped
according to cell type, interactions between the nuclei were substantially increased (almost ten-fold) after
dopamine depletion (GPe to STN, KS-test, p<0.001; STN to GPe, KS-test, p<0.001). Within and between GP-TI
and GP-TA neurons, there were no significant interactions in about 80% of the pairs considered (Figure 4-2F, I).
In the pairs that had significant interactions, between 2 and 10 lagged bins were significant, showing
interactions over 10-50 ms. Finally, when STN interactions with either GPe cell type were considered, there
were no differences in the interactions from GP-TI or GP-TA to the STN (Figure 4-2G, KS-test, p = 0.999) or
from the STN to either GP-TI or GP-TA (Figure 4-2H, KS-test, p = 0.936).

99
4.4.3 DIRECTED INFORMATION FLOW IN THE STN-GPE NETWORK IN
CONTROL RATS AND PARKINSONIAN RATS
Having examined the time-scales of the interactions, we went on to calculate the directed information
flow between pairs of simultaneously recorded STN/GPe neurons. We did this by computing the difference in
entropy, a measure of information coding capacity, between the ‘Auto’ and ‘Full’ models, where the nonlinear
Figure 4-3. Information transfer across the STN-GPe network. Top plot in each panel of this and subsequent figures shows untransformed
probabilities; bottom is same data re-plotted with log-transform to emphasize the smaller proportions. A. Information transfer from STN to
GPe in control and lesioned rats. B. Information transfer from STN to GP-TI or GP-TA in lesioned rats. C. Information transfer from GPe to
STN in control and lesioned rats. D. Information transfer from GP-TI or GP-TA to STN in lesioned rats. GPe neurons were not divided and
grouped according to cell type in A and C.

100
‘Full’ model contains both the auto- and cross-correlation terms. Thus, this analysis quantifies the additional
information (reflected as a reduction in entropy) that can be obtained about the responses of a given STN neuron
(or GPe neuron) using the activity of a paired GPe (STN) neuron, after first taking into account the information
about the responses of the first STN (GPe) neuron contained in its own spiking history. Critically, this analysis
is directional, so the information flow can be assessed from the STN to the GPe, as well as from the GPe to the
STN. Qualitatively, this analysis is similar to examining the amount of extra variance (or increase in R2) that one
would obtain in linear regression, when the cross-terms were included in the model. Thus, it is an estimate of
how much better spikes in one nucleus can be predicted by spikes in another nucleus.
We found that there was significantly more directed information flow between nuclei in the lesioned
animals (Figure 4-3A, C) than in the control animals (STN to GPe, KS-test, p<0.001; GPe to STN, KS-test,
p = 0.002). Thus, after chronic dopamine depletion, the spike trains of STN neurons could be better predicted
using the spike trains of GPe neurons, and vice versa. When we split the GPe cell population in lesioned
animals, we found that 30-40% of STN/GP-TI and STN/GP-TA pairs had significant interactions, but the
amount of information flow between the STN and GP-TI neurons was similar to that between STN and GP-TA
neurons, considered in either direction (Figure 4-3B, KS-test, p = 0.504; and Figure 4-3D, KS-test, p = 0.411).
We carried out hypothesis testing on the likelihood function, not the information flow. The null
distribution for information flow is not easy to calculate. One could use bootstrap or permutation methods to
define significance with mutual information, but these were computationally infeasible on our full dataset.
Significance testing on the likelihood is, however, straightforward. We further found that the directed
information flow results were largely consistent with the analysis examining the number of significant lagged
bins in cross-correlations between STN and GPe neurons (see Figure 4-2D, E) computed using the BIC. The
BIC approach calculates whether adding a specific parameter to the model, in our case the information
contained in a subsequent bin of the spike train, will decrease the prediction error significantly. Specifically it
examines whether such decreases in prediction error would occur by chance (or by definition, whether they are
statistically significant). Also, the BIC method finds the model with the optimal number of bins by weighting
the increase of predictability versus the cost of extra parameters. Figure 4-4 shows that, in general, the pairs of
STN and GPe neurons where significant interactions were detected, were the ones that showed non-zero
information transference in Figure 4-3A, C. Considering significant interactions when the number of BIC
parameters (K2 in Equation 1) is larger than one (note that K2 = 1, ..., 30), we identified the pairs of neurons
without significant bins (i.e., K2 = 1) as approximately the ones with near zero estimated directed information

101
flow for STN to GPe (Figure 4-4 A) and GPe to STN (Figure 4-4,B) interactions, in both control and lesioned
animals. Note also that the first bin in the histograms in Figure 4-4 captures the directed information in the
lower range of [0, 0.0015] bits/bin, therefore capturing a few pairs of neurons with significant interactions but
low information transmission.
In chapter 2, section 2.5.2, we compared the performance between BIC and another parametric model
selection information-based criterion ‒ the AIC ‒ and concluded that the BIC better described our data. Other
significance testing methods could have been employed for model selection, in particular non-parametric
Figure 4-4. Relationship between information transfer and the presence of significant STN/GPe interactions for control (blue) and
lesioned (red) animals. The optimal number of lagged bins in cross-correlations selected through the BIC is denoted as K2 (Equation 1).
The plots on the right in both panels show the number of pairs of neurons where STN to GPe (A) and GPe to STN (B) significant
interactions were detected (K2 > 1), and the number of pairs without significant interactions (K2=1). The histograms on the left show the
distribution of information transfer (as in Figure 4-3A, C) for pairs with and without significant interactions.

102
procedures such as permutation testing, which have the advantage of not making inferences about the
probability distribution of the data. As a trade-off, however, they present lower power than the parametric tests.
Therefore, provided that the assumptions about the parameters of the distribution assumed by the parametric
methods are accurate, these can provide more rigorous estimates.
4.4.4 TEMPORAL PROFILES OF DIRECTED INFORMATION FLOW IN THE
STN-GPE NETWORK
We next examined the temporal profiles of the interactions between nuclei. The temporal structure can
be characterized by examining the average value of the lagged parameters for the cross terms (bk) in the model
Figure 4-5. Transfer functions between STN and GPe neurons derived from the ‘Full’ model (which includes both auto and cross terms)
in control rats and lesioned Parkinsonian rats. A. Model parameters for STN neurons and all GPe neurons in control rats, where there is
little temporal structure to the transfer functions and thus, minimal interactions between nuclei. B. Model parameters for STN neurons and
all GPe neurons in lesioned rats. Note that short-latency interactions are out of phase. C. Model parameters for STN neurons and only GP-
TA neurons in lesioned animals. Note that STN to GP-TA and GP-TA to STN transfer functions are ‘in phase’ at short latencies. D. Model
parameters for STN neurons and only GP-TI neurons in lesioned rats. Note that the transfer functions are not in phase at short latencies.
Dotted lines in each plot are the fits of damped sinusoids to the transfer functions. Positive and negative bk parameters indicate ‘excitatory’
and ‘inhibitory’ transfer, respectively.

103
(see Equation1 in the methods). These terms characterize the sign (i.e. positive or negative) and amplitude of the
effect of a spike in one nucleus on the probability of a spike in the other nucleus at the indicated time lag. We
found that the parameters in the lesioned animals, but not in the control animals, resembled damped beta-
frequency profiles, with ~50 ms cycle periods and thus, were centred at ~20 Hz (Figure 4-5). Taking into
account conduction delays of at least a few ms between nuclei and the rise times of post-synaptic potentials
(Kita et al., 1983; Kita and Kitai, 1991), interactions at short latencies (5-10 ms) are most informative when
studying the monosynaptic influences of neurons in the STN-GPe network. Importantly then, at similar short
latencies, the interactions from the STN to the GPe and from the GPe to the STN in lesioned animals were
clearly out of phase (Figure 4-5B), being ‘excitatory’ (positive bk parameters in Figure 4-5) from the STN to the
GPe, and ‘inhibitory’ (negative bk parameters) from the GPe to the STN. Thus, considering delays arising from
propagation and integration, and all recorded neuronal pairs, the parameters that account for interactions
between nuclei are consistent with the neurochemistry of this reciprocally-connected network. However, when
GPe neurons were divided according to cell type, we found that the temporal profiles of the GP-TA neurons did
not reflect the known microcircuitry and neurochemistry in a direct manner, i.e. the interactions from STN to
GP-TA and from GP-TA to STN were in phase, both being excitatory at short latencies (Figure 4-5C). In
contrast, the temporal profile of the more numerous GP-TI neurons was similar to the average profile for all GPe
neurons, i.e. the interactions from STN to GP-TI and from GP-TI to STN were markedly out of phase, being
excitatory and inhibitory, respectively, at short latencies (Figure 4-5D). Interactions had a similar time scale for
both the GP-TI and GP-TA cell groups, and in both directions. Thus, bidirectional information transfer between
STN/GPe was significantly increased by dopamine depletion, and it was primarily the phase that differentiated
Interacting pairs R2 α β
(s)
f
(Hz) Θ (radians)
STN to GPe (controls) 0.99 0.07 0.006 14.2 5.20
GPe to STN (controls) 0.99 0.11 0.002 187.3 2.37
STN to GPe (lesioned) 0.98 0.10 0.032 20.2 4.20
GPe to STN (lesioned) 0.94 0.05 0.048 19.4 2.46
STN to GP-TA 0.98 0.32 0.023 21.4 -0.41
STN to GP-TI 0.95 0.18 0.031 20.7 0.63
GP-TA to STN 0.96 0.26 0.019 16.1 2.28
GP-TI to STN 0.94 0.16 0.023 21.9 1.88
Table 4-1. Parameters of damped sinusoids that best fit the transfer functions between STN and GPe neurons. , maximum amplitude; β,
damping rate; Θ, phase of the cosine function; f, frequency characteristics. Note GP-TA and GP-TI neurons were only defined as such in
lesioned animals.

104
STN interactions with these two types of GPe neuron.
The temporal profiles of the interaction parameters in the STN-GPe network of lesioned animals
resembled damped beta-frequency oscillations. To investigate this issue further, we fitted a damped oscillator
function (sinusoid) to each set of interaction parameters (Equation 9). A damped sinusoid fit the coefficient data
in this study well (Table 4-1), at least for data recorded in the lesioned Parkinsonian rats (Figure 4-5B-D, dashed
lines).
4.4.5 DIRECTED INFORMATION FLOW AND TEMPORAL INTERACTIONS
BETWEEN DIFFERENT TYPES OF GPE NEURON
In the final analyses we considered the directed information flow between GP-TI and GP-TA neurons.
This analysis is complimentary to previous analyses we have carried out, in which we estimated the entropy of
the entire GPe population irrespective of cell type (chapter 3, Cruz et al., 2009). When all recorded neuronal
pairs were considered, we found significantly more directed information flow between GPe neurons in the
lesioned rats than in the control rats (Figure 4-6A, KS-test, p<0.001). Interestingly, when GPe neurons in
lesioned animals were divided according to cell type, there was more information between GP-TI neurons than
there was between GP-TA neurons (Figure 4-6B, KS-test, p<0.001). However, there were no differences in
directed information flow between pairs of GP-TI/GP-TA neurons when considering them from both directions
(Figure 4-6C, KS-test, p = 0.881). The temporal profile of the GP-TI/GP-TI interactions was initially excitatory,
Figure 4-6. Information transfer within the GPe. A. Information transfer between all GPe neurons in control and lesioned rats, irrespective of
cell type. B. Information transfer between only GP-TI neurons and between only GP-TA neurons in lesioned rats. C. Information transfer from
GP-TI to GP-TA and from GP-TA to GP-TI neurons in lesioned rats.

105
and oscillated at beta frequencies (Figure 4-7A). Interactions between only GP-TA neurons were also initially
excitatory, but they did not oscillate as strongly at beta frequencies (Figure 4-7B), consistent with the
corresponding cross-correlations. Interactions between GP-TI and GP-TA neurons were both inhibitory at short
latencies, but the GP-TI to GP-TA interaction remained inhibitory over the first 20 ms, whereas the GP-TA to
GP-TI interaction went immediately to excitatory at a lag of 5 ms (Figure 4-7C, D). Thus, there were differences
in their temporal profiles, which were reflected in the phase of their interactions. Again, damped oscillator
functions could be fitted to the temporal profiles of interaction parameters (Table 4-2). Thus, although
bidirectional information transfer between GPe neurons was significantly increased by dopamine depletion, the
amount and temporal profile of information transfer depended on the type(s) of GPe neuron.
Figure 4-7. Transfer functions between different types of GPe neuron derived from the ‘Full’ model (which includes both auto and cross
terms) in lesioned Parkinsonian rats. A. Model parameters for pairs of GP-TI neurons. B. Model parameters for pairs of GP-TA neurons.
C. Model parameters for GP-TI to GP-TA transfer. D. Model parameters for GP-TA to GP-TA transfer. Dotted lines in each plot are the fits
of damped sinusoids to the transfer functions.
Interacting pairs R2 α β
(s)
f
(Hz) Θ (radians)
GP-TI to GP-TI 0.94 0.16 0.010 25.0 4.89
GP-TA to GP-TA 0.98 0.12 0.020 22.4 6.04
GP-TI to GP-TA 0.99 0.16 0.017 15.0 2.24
GP-TA to GP-TI 0.99 0.44 0.007 12.2 4.33
Table 4-2. Parameters of damped sinusoids that best fit the transfer functions within GPe. See Table 4-1 for abbreviations.

106
4.5 DISCUSSION
Chronic loss of dopamine from cortico-basal ganglia circuits profoundly alters neuronal activity therein
and often leads to the emergence of excessively synchronized oscillations, as documented in patients with PD
(Brown et al., 2001; Levy et al., 2002; Williams et al., 2002; Brown, 2003; Amirnovin et al., 2004; Moran et al.,
2008) and Parkinsonian animals (Nini et al., 1995; Raz et al., 1996; Bergman et al., 1998; Raz et al., 2000; Raz
et al., 2001; Goldberg et al., 2004; Sharott et al., 2005b; Mallet et al., 2008a; Mallet et al., 2008b; Degos et al.,
2009). The changes in microcircuit properties that give rise to these changes remain to be elucidated, but it is
possible that altered interactions in the reciprocally-connected network of glutamatergic STN neurons and
GABAergic GPe neurons contribute to these oscillations. Here we used nonlinear time series analysis and
information theory techniques to quantitatively assess the interactions between STN and GPe neurons in 6-
OHDA-lesioned Parkinsonian rats and dopamine-intact control rats. This approach allowed us to directly
estimate changes in the transfer of information from one nucleus (or neuron type) to the other, while controlling
for potentially confounding changes in activity within an individual nucleus (or neuron), therefore overcoming
some of the limitations of linear cross-correlations. Our key finding is that bidirectional information transfer
between STN/GPe, and between different types of GPe neuron, was significantly increased by chronic
dopamine depletion. Importantly, these augmented causal interactions in the Parkinsonian state reflected an
underlying network oscillation in the beta-frequency band.
4.5.1 LIMITATIONS
Our analytical approach is innovative and, as such, it was important to explore its utility in a well-
characterized dataset (Mallet et al., 2008a; chapter 3, Cruz et al., 2009), seeking corroboration of previous
findings (so-called ‘face validity’). Thus, in our first set of analyses, we did not distinguish between types of
GPe neuron but we could still define internuclear interactions that were independent of activity within nuclei.
When GPe neurons were considered as a single population, we were able to confirm that model parameters
correctly reflected the known neurochemistry and microcircuitry of the STN/GPe network. Accordingly,
‘excitatory’ interactions, presumably mediated by glutamate, dominated information transfer from STN to GPe,

107
and ‘inhibitory’ interactions, presumably mediated by GABA, dominated information transfer from GPe to
STN.
One key issue with our approach is the meaning of ‘information transfer’ between nuclei. We define this
in the information theoretic (statistical) sense, and consider information transfer to occur when a spike in the
GPe alters the probability of a spike in the STN, and vice versa. The course of this statistical interaction affords
what we term ‘directionality’, and can be underpinned by both direct and indirect synaptic connections,
including common inputs (Sharott et al., 2005a). Information transfer, defined as above, will then encompass
whatever aspects of internuclear interaction represent the physiological means of communication. However, the
two are not synonymous, and there are features of the dependent activity in one nucleus that may be irrelevant
for the ‘real’ neural code (whatever this may be).
4.5.2 NOVEL INSIGHTS
The major novel findings were made when we split the population of recorded GPe neurons into two
different, physiologically-defined subpopulations, namely GP-TI and GP-TA neurons (Mallet et al., 2008a).
Importantly, we found that only the more numerous GP-TI neurons showed interactions consistent with
monosynaptic reciprocal connections with STN. Indeed, causal information transfer from GP-TA neurons to
STN neurons was initially excitatory. This finding is surprising because, although the neurochemistry and
connections of GP-TA (and GP-TI) neurons have yet to be elucidated, the vast majority of GPe neurons are
thought to be GABAergic and project to STN (Bevan et al., 1998; Smith et al., 1998). Our results suggest that
the activity of GP-TI neurons is of greater causal significance than that of GP-TA neurons for the periods of
reduced activity or quiescence that punctuate the spiking of STN neurons during Parkinsonian beta oscillations
(Levy et al., 2002; Kuhn et al., 2005; Mallet et al., 2008a; Mallet et al., 2008b). However, precisely-timed inputs
from GP-TA neurons could still serve to sculpt the intermittent periods of increased activity and bursting
exhibited by STN neurons. The STN to GP-TA connection was excitatory at very short lags (0-5 ms), which is
remarkable because the spiking response of GPe neurons to STN neuron discharge should take, on average, 10
ms to develop (Kita and Kitai, 1991). However, in light of the predicted time course, our analyses also imply
that STN input to GP-TI neurons is of causal importance for their recruitment into the excessively-synchronized
GPe ensembles that emerge during beta oscillations. It is unclear why STN and GP-TA neurons should fire so
close in time but a common extrinsic input, perhaps arising from frontal cortex and/or intralaminar thalamus

108
(Kita, 2007), and/or inhibitory inputs from GP-TI neurons, might underlie this tight temporal coupling.
Common input, either excitatory or inhibitory, might also explain why causal information transfer between pairs
of GP-TI neurons or pairs of GP-TA neurons was initially excitatory. For GP-TI neurons, a common driving
input is likely STN. On the other hand, the short-latency inhibitory interactions between GP-TI/GP-TA pairs
suggests these cell types inhibit each other, periodically dampening activity and promoting anti-phase firing
across the two subpopulations.
4.5.3 WIDER IMPLICATIONS
Considerable theoretical work on networks of neurons generating oscillations suggests that, generally
speaking, oscillations require some sort of excitatory/inhibitory neuronal interaction (see for example, (Cohen et
al., 1992; Brunel, 2000; Ermentrout and Chow, 2002; Terman et al., 2002)). This can occur within a single
neuron, between neurons in a network (de Solages et al., 2008) or some combination of these. All of these
conditions are satisfied in the STN-GPe network. Specifically, most STN and GPe neurons function as
autonomous pacemakers (Surmeier et al., 2005). Moreover, the dominant STN→GPe/GPe→STN interaction is
excitatory/inhibitory, providing a possible substrate for oscillatory interactions at the network level. Under
normal circumstances, some features of the STN-GPe network make synchronized oscillations unlikely. Indeed,
network-level oscillations can occur in the so-called ‘balanced regime’ (Renart et al., 2004), and the STN-GPe
network in the dopamine-intact animal is probably not in this regime. A feature of the balanced regime is that
neurons receive a large amount of balanced excitatory and inhibitory input. Thus, if inhibitory input is strongly
decreased, the activity in excitatory neurons will become epileptic (Renart et al., 2004). This is not the case in
the normal STN-GPe circuit though because destruction of GPe leads to only a small increase in STN activity
(Ryan and Clark, 1992). However, here we show that Parkinsonism is associated with a ten-fold increase in
causal information transfer in the STN-GPe circuit, arguably bringing it into a balanced state in which
oscillations may be generated (Holgado et al., 2010). Both increases in the strength of functional coupling
between nuclei, and decreases in the difference in the intrinsic oscillation frequency between nuclei, can lead to
phase-locked oscillations in neural responses (Strogatz, 1994; Ermentrout and Chow, 2002). Both effects are
suggested by our results, in so far that internuclear coupling increased and oscillations of single neurons in STN
and GPe became matched, with a frequency of ~20 Hz. The resulting tendency to phase-locked oscillations in
STN-GPe could contribute to resonance phenomena seen in Parkinsonism. Indeed, our model parameters were

109
well fit by damped oscillators with resonance frequencies of ~20 Hz. Similar patterns of resonance have been
reported between the STN and cerebral cortex in PD patients (Eusebio et al., 2009). Thus, excessive beta
oscillations in PD might arise from changes in STN-GPe interactions, without ruling out the possibility that they
instead may arise elsewhere (outside the STN-GPe circuit), and are then perhaps amplified by the resonance
properties of the STN-GPe circuit. Overall, these observations suggest that, at the systems level in rodents and
humans, elements of the cortico-basal ganglia circuit are well described as damped oscillators with beta-band
resonance in the Parkinsonian state, and that this is true despite the differences between activity conduction
times in rodents and humans. Our current analysis adds to this by also indicating that such resonance is not
merely a consequence of the autocorrelation function of individual neurons in Parkinsonism. Beta-band
resonance is thus a highly-conserved feature of (dys)function in these networks after dopamine loss.
4.6 CONCLUSIONS
We have used nonlinear time series analysis to quantify the interactions between the STN and GPe in
control and Parkinsonian rats. Chronic dopamine depletion changed firing rates and led to strong beta-frequency
oscillations in the STN-GPe network. This was accompanied by a pronounced increase in bidirectional
interactions between these nuclei, measured with causal mutual information. This increased strength of
reciprocal effective coupling may not only contribute to excessive beta synchrony in Parkinsonism but also
impede information flow and representation within the STN-GPe network and the rest of the basal ganglia.

110
5 APOMORPHINE IMPROVES CODING CAPACITY IN THE BASAL GANGLIA
NETWORK IN 6-OHDA-LESIONED RATS
5.1 ABSTRACT
Chronic dopamine loss in cortical-basal ganglia circuits in Parkinson’s disease (PD) is believed to induce
disorders of movement and cognition. Apomorphine is indicated in PD, in combination with or as a replacement
for levodopa, when responses to the latter start inducing dyskinesias and ON-OFF fluctuations. Apomorphine
therapy in PD stimulates dopamine receptors, and the motor response to apomorphine is indistinguishable from
that to levodopa. Recordings from deep brain stimulation electrodes in PD patients have shown that dopamine
depletion in the cortical-basal ganglia circuitry is linked to an increase in beta frequency (13-30 Hz) oscillations
at the single-cell and neuronal population levels. Previously, we have investigated how the excessive beta
oscillations, which may contribute to the behavioural deficits seen in PD, decrease information processing in
these circuits. In the present study we analysed the effects of apomorphine on the network entropy in the
external globus pallidus (GPe) of dopamine-depleted rats.
We recorded single-neuron activity from multiple sites in the GPe of control and 6-OHDA-lesioned rats,
a PD model that shows exaggerated beta oscillations after chronic dopamine loss. Next, apomorphine was
administered to the lesioned animals. We used a logistic regression model to compare entropy in neural
ensemble activity between control and lesioned animals both OFF and ON apomorphine. The analysis
demonstrated that apomorphine induces a substantive increase in the firing rates, and a decrease in oscillations
and synchrony in unilateral dopamine-depleted animals relative to lesioned animals OFF apomorphine.
Following apomorphine treatment, the lesioned rats showed an increase in basal ganglia network entropy,
although still lower than in control animals. Additionally, the amount of information transferred between pairs
of GPe neurons, which increased after lesioning, decrease after the apomorphine challenge. These findings
suggest that treatment with apomorphine in PD increases potential coding capacity, which may be related with
the observed improvement in motor impairment.

111
5.2 INTRODUCTION
It is widely acknowledged that Parkinson’s disease (PD) results from progressive degeneration of
dopaminergic neurons in the substantia nigra pars compacta (SNc), leading to low levels of dopamine
throughout the basal ganglia (Bernheim et al., 1973; Kish et al., 1988; German et al., 1989; Goto et al., 1989;
Schwarting and Huston, 1996b). Apomorphine has a long history as a therapeutic drug and it was the first
dopamine agonist used in the treatment of Parkinson’s disease (PD). In 1951, Schwab et al. documented for the
first time the clinical advantages of apomorphine in the control of PD, but when levodopa was discovered to be
an efficient dopamine replacement therapy for Parkinsonism (Cotzias et al., 1969; Marsden and Parkes, 1977),
the previous enthusiasm for apomorphine faded. Although levodopa therapy is currently the most widely used
method to treat Parkinson’s disease, the majority of patients following long-term levodopa treatment exhibit
complications including the wearing off phenomenon, ON-OFF fluctuations and levodopa induced dyskinesias
(Marsden and Parkes, 1976; Obeso et al., 2000; Rascol et al., 2000). To overcome some of these adverse side
effects there has been a renewed interest in the antiparkinsonian properties of apomorphine, along with other
dopamine agonists like ropinirole, bromocriptine or cabergoline (Pietz et al., 1998; Rascol et al., 2000; Manson
et al., 2001). The subcutaneous challenges of apomorphine, as a monotherapy or in combination with levodopa,
have been shown to ameliorate the motor impairments characteristic of the late stages of Parkinson’s disease
like the motor fluctuations and levodopa-induced dyskinesias (Stibe et al., 1988; Frankel et al., 1990; Colzi et
al., 1998; Pietz et al., 1998; Ruiz et al., 2008). The subcutaneous injections of apomorphine induce quick relief
from OFF periods and its effects are potent but short-lived. Continuous pumping of the drug may be an option
(Cotzias et al., 1970; Colzi et al., 1998; Manson et al., 2001), although reports of extensive skin nodule
formations at the needle sites often occur. Other adverse secondary effects such as nausea, vomiting, dizziness,
sleepiness, postural hypertension and neuropsychiatric complications may arise (Cotzias et al., 1970; Colzi et
al., 1998; Pietz et al., 1998; Ruiz et al., 2008).
Although remarkable advances have been made in the treatment of PD, how dopamine-depletion affects
the basal ganglia-thalamo-cortical circuitry is still poorly understood. Changes in the dynamics of these
networks have been observed in intra- and post-operative recordings of neural activity in the basal ganglia of PD
patients who underwent deep brain stimulation (DBS) surgery, in particular excessive beta frequency (13-30 Hz)

112
oscillations (Brown et al., 2001; Marsden et al., 2001; Levy et al., 2002; Williams et al., 2002; Williams et al.,
2003; Amirnovin et al., 2004; Kuhn et al., 2004b; Williams et al., 2005; Alonso-Frech et al., 2006; Moran et al.,
2008). These abnormal oscillations tended to disappear when patients were under dopamine replacement
therapy (Brown et al., 2001; Levy et al., 2002; Alonso-Frech et al., 2006; Moran et al., 2008) or as they initiated
a motor task (Levy et al., 2002; Amirnovin et al., 2004). Additionally, changes in fire rates have been observed
in several basal ganglia structures of PD patients (Hutchison et al., 1997; Hutchison et al., 1998; Merello et al.,
1999; Amirnovin et al., 2004), of monkeys with 1-methyl-4-phenyl-1,2,3,6-tetrahydropyridine (MPTP) lesions
(Filion and Tremblay, 1991; Bergman et al., 1994) and rats with 6-hydroxydopamine (6-OHDA) lesions (Pan
and Walters, 1988; Hollerman and Grace, 1992; Burbaud et al., 1995; Hassani et al., 1996; Kreiss et al., 1997;
Vila et al., 2000; Sharott et al., 2005b), where the two latter are animal models of PD.
We have shown that these dynamical changes impact information capacity in the external globus pallidus
(GPe) of 6-OHDA lesioned rats, decreasing the network entropy (and therefore the coding capacity) within the
nucleus in comparison to control animals (chapter 3, Cruz et al., 2009). We found that both the decreased firing
rates and increased pair-wise synchrony contributed to the decreased network entropy in the lesioned animals,
although the firing rates had a much stronger impact than the synchrony. The excessive beta frequency
oscillations were also observed in the GPe, but had a positive effect on the network entropy. We have also
shown that the GPe and the STN-GPe network in dopamine depleted rats, which also revealed changes in firing
rates, synchrony and strong beta frequency oscillations, manifested a rise of bidirectional information transfer in
comparison with controls (chapter 4, Cruz et al., 2011). This increase of interactions might impair the normal
representation and information flow within and between GPe and STN, and possibly other nuclei of the basal
ganglia, and this may underlie the motor impairments endured by PD patients. To better understand these
phenomena, we used a time-series logistic regression model and information theory to study the network
entropy within the GPe neurons in 6-OHDA lesioned rats under the effect of the non-selective dopamine agonist
apomorphine, which directly stimulates D1 and D2 receptors and has shown to temporarily restore motor
function in PD patients (Schwab et al., 1951; Cotzias et al., 1970; Hutchison et al., 1997; Pietz et al., 1998) and
in Parkinsonian animals (Pollak et al., 1993a; Sharott et al., 2005b). Following evidence from our previous
results, changes in dopamine levels in the basal ganglia result in variation in network entropy within its nuclei
which we believe to underlie alterations in motor performance. Therefore, consistent with our expectations, we
observed an increase of the coding capacity in the GPe and a decrease in the information transfer between its
neurons in the lesioned animals ON apomorphine in comparison with the lesioned animals in the OFF state.
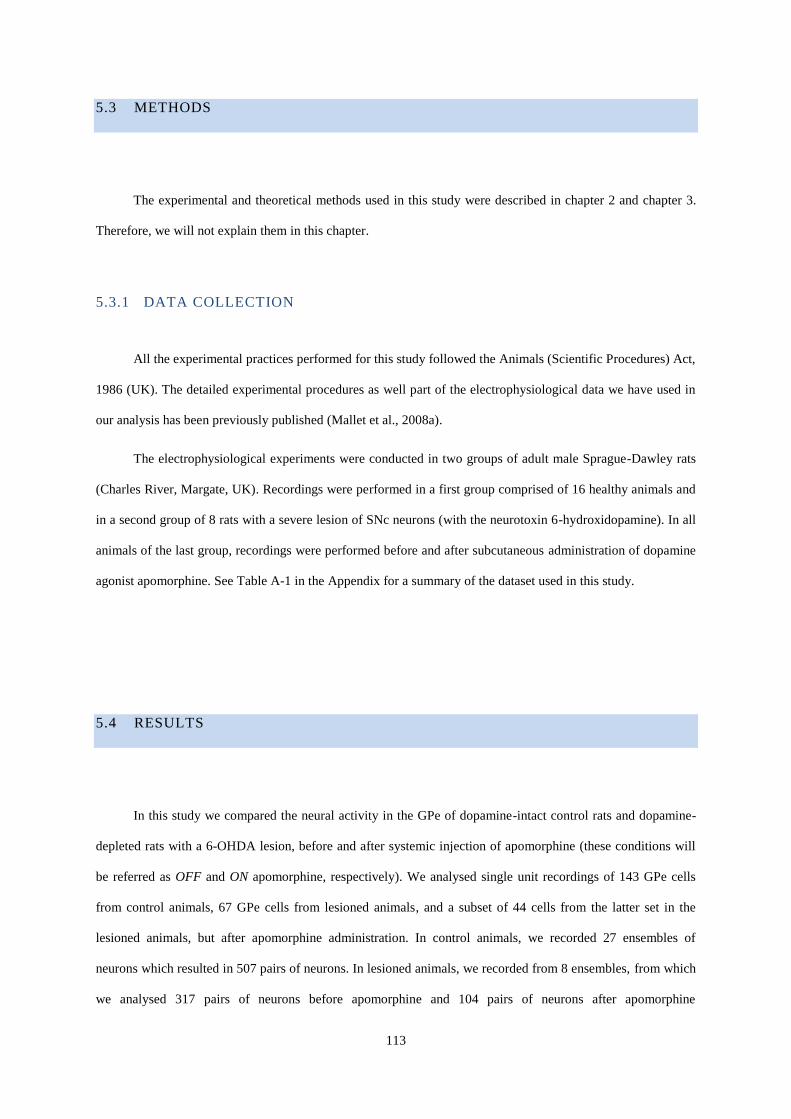
113
5.3 METHODS
The experimental and theoretical methods used in this study were described in chapter 2 and chapter 3.
Therefore, we will not explain them in this chapter.
5.3.1 DATA COLLECTION
All the experimental practices performed for this study followed the Animals (Scientific Procedures) Act,
1986 (UK). The detailed experimental procedures as well part of the electrophysiological data we have used in
our analysis has been previously published (Mallet et al., 2008a).
The electrophysiological experiments were conducted in two groups of adult male Sprague-Dawley rats
(Charles River, Margate, UK). Recordings were performed in a first group comprised of 16 healthy animals and
in a second group of 8 rats with a severe lesion of SNc neurons (with the neurotoxin 6-hydroxidopamine). In all
animals of the last group, recordings were performed before and after subcutaneous administration of dopamine
agonist apomorphine. See Table A-1 in the Appendix for a summary of the dataset used in this study.
5.4 RESULTS
In this study we compared the neural activity in the GPe of dopamine-intact control rats and dopamine-
depleted rats with a 6-OHDA lesion, before and after systemic injection of apomorphine (these conditions will
be referred as OFF and ON apomorphine, respectively). We analysed single unit recordings of 143 GPe cells
from control animals, 67 GPe cells from lesioned animals, and a subset of 44 cells from the latter set in the
lesioned animals, but after apomorphine administration. In control animals, we recorded 27 ensembles of
neurons which resulted in 507 pairs of neurons. In lesioned animals, we recorded from 8 ensembles, from which
we analysed 317 pairs of neurons before apomorphine and 104 pairs of neurons after apomorphine

114
administration. The ensembles in control animals had an average of 5.4 neurons simultaneously recorded, in the
lesioned animals OFF apomorphine an average of 8.37 neurons and ON apomorphine an average of 5.5 neurons.
The largest ensemble included 18 neurons. Part of the dataset used in this study has been considered in a
previous study (chapter 3, Cruz et al., 2009).
5.4.1 NETWORK DYNAMICS
We have shown that dopamine depletion in the
basal ganglia of rats was accompanied by substantial
changes in the network dynamics of the GPe (chapter 3,
Cruz et al., 2009). In this dataset we again observed a
substantial decrease of the GPe mean firing rates after
lesion compared with control, from 33.63 ± 1.33Hz (mean
± SEM) in controls to 15.54 ± 1.10Hz in lesioned animals
(Figure 5-1A). After subcutaneous apomorphine injection,
the mean firing rate in the GPe increased considerably to
29.43 ± 2.82 Hz, a value more similar to control. Although
the mean firing rate in lesioned animals before
apomorphine was significantly different from control (1-
way anova, p<0.05), when under apomorphine, the
difference to control was not significant (1-way anova, p >
0.05). In the frequency domain, lesioned animals had an
increase in oscillatory activity at beta frequency which is
shown in the auto-spectra of Figure 5-1B. This increase
around 20Hz in the lesioned animals before apomorphine
compared with control is even more pronounced in the
pair-wise cross entropy (Figure 5-1C). Yet, the oscillations
and synchrony at beta frequency disappeared when the
lesioned animal was challenged with apomorphine (Figure
5-1B, C). Hence, the changes in the dynamics of the GPe
Figure 5-1. The network dynamical properties and
interactions in the GPe of dopamine-intact control
animals and 6-OHDA lesioned animals, before and after
apomorphine treatment. A. Mean firing rates of the GPe
neurons (mean ± SEM). Differences were significant at
p< 0.05 (1-way anova). B, C. Neural activity in the
frequency domain: mean auto-spectra (B) and mean
cross-spectra (C) for pairs of GPe neurons.

115
neural activity characteristic of Parkinsonism in the dopamine depleted rats tend to recede following acute
challenge with apomorphine, when we observe a dynamical behaviour closer to healthy animals. We have
shown how each of these dynamical changes impacted the information transfer and reduced the coding capacity
in the GPe network after 6-OHDA lesions, which may underlie the motor impairments seen in PD patients
(chapter 3, Cruz et al., 2009). To further investigate the effects that different levels of dopamine in the basal
ganglia have on its coding capacity, we compared the entropy and directed information flow in the GPe network
in the same three conditions: healthy animals and Parkinsonian animals untreated and treated with the dopamine
agonist apomorphine. We used logistic regression and information theory to calculate the entropy and
information transfer between pairs of GPe neurons.
5.4.2 OPTIMAL NUMBER OF LAGS
The four models used in this study estimate the entropy of a network by assessing the effect of firing rate
and spiking history on current spiking probability. The first step of the analysis was binning the spike trains
from all neurons into 5 ms bins. We then analysed the activity of each individual neuron, which we will refer as
Figure 5-2. The distributions from the optimized number
of parameters used in each model used to predict the
response of the current neuron in each time bin. The
number of parameters expresses the number of lagged
time bins that carry relevant information for the
prediction. The models were applied to control (blue)
and lesioned animals before and after apomorphine
challenge (red and green, respectively). A. ‘Auto’ model.
K1 represents the optimized number of significant lagged
time bins of the current neuron (autocorrelations). B.
‘Cross’ model. K2 represents the optimized number of
significant lagged time bins of a second neuron on the
response of the current neuron (cross-correlations). C.
‘Full’ model. Note that higher proportion of zero
parameters means a higher fraction of neurons, or pairs
of neurons, with no significant interactions. The values
on the panels represent the (mean ± SEM) of the
distributions.

116
the current neuron, conditioned on itself or on a second neuron. For each bin, we calculated the probability that
a spike would be fired in that bin conditioned solely on the firing rate of the current neuron (‘Rate’ model) or in
conjunction with the past firing history of that same neuron (‘Auto’ model) or of a nearby neuron (‘Cross’
model). In the last model – the ‘Full’ model – the posterior probability given by Equation 14 (chapter 2, section
2.4) was obtained by considering the combination of the information contained in all these terms. The different
time series models were tools to explore the effects of the individual dynamical factors on the entropy of the
network. The ‘Auto’ model, which included the firing rate term and autocorrelation terms, allowed us to
investigate the extent of the effects of the spiking history of a neuron on itself. Analogously, the ‘Cross’ model,
where along with the firing rate the cross-correlations were considered, allowed us to estimate the influence of a
second simultaneously recorded neuron on the activity of the current neuron. The ‘Full’ model, by incorporating
firing rate, auto and cross terms, fully accounted for the past firing pattern of both the current and a
neighbouring neuron to estimate the response of the former.
In the ‘Auto’, ‘Cross’ and ‘Full’ models, only the number of time lags (or spike history) which contained
relevant information to predict more accurately if a spike would occur in the current bin were taken in account.
In Equation 14 (chapter 2, section 2.4), the number of relevant lags are denoted as K1 for the auto terms and K2
for the cross terms. They were estimated by means of the BIC and express information about the time scale of
the correlations in the data. Therefore, if the correlations extend for a large period of time, more lags will be
necessary to capture the interactions. Otherwise, if there are no interactions between the response of the current
neuron and the spike history of itself or another neuron, the number of relevant lags will be zero. The histograms
in Figure 5-2A show the distributions of the selected number of lagged time bins we fit using the ‘Auto’ model
for each GPe neuron for control, lesioned OFF and lesioned ON apomorphine. We observed that the
autocorrelation length for control and lesioned OFF apomorphine was concentrated mainly between 4 and 12
time bins. Each bin had duration of 5 ms, so the relevant interactions extended most frequently 20 to 60 ms into
the past. Although these distributions did not significantly differ among one another, they both significantly
differed from the distribution of relevant autocorrelations seen in the lesioned animals under apomorphine (1-
way anova, p<0.05), that mainly extended between 0 and 6 time lags (0-30ms) (Figure 5-2A). Therefore, the
autocorrelations for the lesioned animals under apomorphine were confined to shorter periods.
From our estimation of the ‘Cross’ model, we were able to examine the duration of the interactions
between GPe neurons (Figure 5-2B). Control animals showed almost no significant interactions between GPe
neurons (99.3% of the data presented no relevant lagged time bins). However, in the lesioned animals OFF

117
apomorphine, 19.4% of pairs had relevant interactions which extended up to 90 ms into the past. The lesioned
animals ON apomorphine showed only a few interactions between the cells (2.3%) and therefore we found no
statistical differences to controls (KS-test, p > 0.05). The interactions between GPe neurons that emerged in the
Parkinsonian state seemed to cease after the animals were challenged with the dopamine agonist. For the ‘Full’
model, first the optimized time intervals for the autocorrelations were estimated (K1), then cross lags were added
and the optimization was done over the sum K1+ K2. Therefore, Figure 5-2C shows a conjugation between the
‘Auto’ and ‘Cross’ distributions, but not their linear sum. Since there were few cross-interactions, the
distributions from the ‘Full’ model resembled those from the ‘Auto’ model.
5.4.3 ENTROPY
The entropy is the quantification of the
uncertainty involved in the prediction of an
event and is a measure of coding capacity. Based
on the conditional probabilities calculated with
our four models, we estimated the entropy of the
GPe network for our three groups. The ‘Rate’
model was conditioned only on the firing rate (in
Equation 14 (chapter 2, section 2.4) represented
as the term a0) of the current neuron, therefore
not accounting for the temporal dynamics in the
network. On the other end, the ‘Full’ model uses
all dynamical factors of the network which may
decrease its entropy. Therefore, it gives an
overall estimation of the entropy in the network.
We have shown in Cruz et al. (2009) (chapter 3),
that GPe network entropy estimation in the
lesioned animals OFF apomorphine is lower
than in the control animals in the context of all
four models (1-way anova, p<0.05). In all the
Figure 5-3. Comparison of the entropy under the three conditions (control,
lesion OFF apomorphine and lesioned ON apomorphine) estimated with
four different models: A. the ’Rate’ model, which included only the firing
rates; B. the ’Auto’ model that accounted for the firing rates and
autocorrelations; C. the ’Cross’ model that included the firing rates and
cross-correlations D. and the ’Full’ model which combined all these terms.
The values on the panels are the (mean ± SEM) of the distributions.

118
panels of Figure 5-3 we can also observe that in the lesioned animals after they received an apomorphine
injection, the entropy increases to values closer to control. For ‘Rate’, ‘Auto’ and ‘Full’ models, the lesioned
animals ON apomorphine have entropy distributions that were significantly different from the lesioned OFF
apomorphine (1-way anova, p<0.05), but not from the control (all p>0.05). For the ‘Cross’ model (Figure
5-3C), all entropy distributions were statistically different from each other (1-way anova, p<0.05). The overall
values of entropy in the network seem to recover in the GPe to healthy levels when apomorphine is used to
stimulate D1 and D2 receptor sites, although the increase of dopamine levels appear to have higher influence in
restoring the firing rates and normal patterns of oscillations than cancelling the abnormal synchrony
characteristic of the Parkinsonian brain.
Adding the autocorrelations to the ‘Rate’ model (Figure 5-3A,B) decreased the contrast between the
entropy distributions from the control and
lesioned OFF apomorphine and between the
lesioned animals under the two conditions. Thus,
the autocorrelations have a different effect on the
entropy than the firing rates. Additionally, the fact
that the entropy distributions from the ‘Rate’
model and from the ‘Cross’ model look similar
gives us a first hint that the effect of the cross-
correlations on the network entropy is weak
(Figure 5-3A,C). Later in the text we will consider
further evidence of these findings.
5.4.4 INDIVIDUAL EFFECTS ON
ENTROPY CHANGE
We estimated the change in the entropy,
which we denominated delta entropy (ΔH), when
we included additional terms in the model. This
measure removes the effects of the firing rate
Figure 5-4. Delta entropy (ΔH) measures the decrease in entropy when
additional sets of parameters are inserted in the model. A. Effect of
autocorrelations. B. Effect of cross-correlations. C. Effect of combined
auto and cross-correlations. On the right, in each panel, are the
(mean±SEM) of the distributions.

119
which were considered in the ‘Auto’, ‘Cross’ and ‘Full’ models and allows the identification of the individual
effects of adding the autocorrelations and/or pair-wise cross-correlations on the entropy. In other words, it
shows how much uncertainty you can reduce in the prediction of the response of the current cell by considering
only the spike history of the same cell or from a nearby cell. Larger values of delta entropy indicate that the
additional terms incorporated in the model (the autocorrelations and/or cross-correlations) have a higher effect
on (i.e. reduce more) the entropy of the network. Control animals show a higher effect of the autocorrelations
than for lesioned OFF and ON apomorphine (Figure 5-4A), but a smaller effect for the cross-correlations (Fig.
4B). Large proportions at lag zero, in particular from control animals, show the small influence of the cross-
correlations between neurons in the overall changes of the network entropy, which is emphasized by the
similarities between the delta entropy distributions for the ‘Auto’ and ‘Full’ models. The 6-OHDA lesioned
animals before the treatment presented a significantly higher number of pair-wise interactions than control (KS-
test, p<0.001). After apomorphine injection, they experienced a significant decrease of these interactions to
values much closer to control, but still statistically different (KS-test, p=0.023) (Figure 5-4B).
We have shown that rate decreased, and abnormal oscillations and synchrony increased in the GPe
network after 6-OHDA animal lesioning, leading to entropy (or coding capacity) decreases. Thereafter, when
the dopamine depleted animals were challenged with apomorphine, these dynamical factors were restored to
levels closer to healthy animals and the network entropy increased. To understand the nature of the network
entropy changes, we quantified the extent of the impact of each individual dynamical factor (Figure 5-5). We
had shown in our previous study (chapter 3, Cruz et al., 2009) that the decrease of the firing rates had a strong
effect and the increase in synchrony a weak effect on the decrease of the entropy in the GPe of Parkinsonian
Figure 5-5. Individual effect on the GPe
network entropy changes of the dynamical
alterations observed on the firing rates,
oscillations and synchrony after 6-OHDA
lesioning (in red) and after apomorphine
challenge (in green). The negative values
indicate an effect on the decrease of the entropy,
and positive values on the increase of the
entropy.

120
rats, while the abnormal oscillations, mainly at beta frequency, contributed to an increase of the entropy (170%,
12% and 82%, respectively, in Figure 5-5). In the lesioned rats under apomorphine, the raise of the firing rates
boosted an increase of the network entropy relative to non-treated rats. The reduction of synchrony in the
animals ON apomorphine seen in Figure 5-3C had little effect on the increase of the entropy. The oscillations
had again the contrary effect of decreasing the entropy in the network. The lesioned animals under the effect of
apomorphine showed less pronounced deviations between the contributions of each factor on the entropy change
(118% for rate, 27% for oscillations and 9% for synchrony) than the 6-OHDA lesion.
5.4.5 DIRECTED INFORMATION FLOW
We next analysed the directed information flow between pairs of GPe neurons. To calculate the directed
information flow we subtracted the entropy under the 'Full' model from the entropy under the 'Auto' model. The
'Full' model predicts the response of the current neuron accounting first for the firing history of that same neuron
and second for the firing history of the second neuron. Thus, the directed information flow quantifies the pair-
wise interactions that provide new information in addition to the information given by the past events of the
current neuron. Although both directed information flow and the entropy calculated with the 'Cross' model
(Figure 5-3C) consider only cross-correlations, they differ because the 'Cross' model does not look at the
information contained in the autocorrelations when selecting the cross terms. Thus, the 'Full' model (and
therefore the directed information flow) in comparison with the 'Cross' model will consider less (or the same)
pair-wise interactions to be relevant for the prediction of the response of the current neuron. This is the case
because the information given by the cross-correlations may already be contained in the autocorrelations. This is
Figure 5-6. Distributions of the information transfer between GPe neurons for control and lesioned animals before and after
apomorphine injection. On the right, the (mean ± SEM) values of each distribution.

121
reflected in the lower estimates of the directed information flow in comparison with the estimates of the ‘Cross’
model (note the difference in the scales between Figure 5-6 and Figure 5-3C). This analysis is directional, since
we can predict the response of one GPe neuron conditioned one another neuron and also the response of that
other neuron conditioned on the first.
We found in the lesioned animals OFF apomorphine meaningful transference of information in 55% of
GPe pairs of neurons, while in the control animals in only 16% and in the lesioned ON apomorphine 40%. The
lesioned animals OFF apomorphine showed significantly more directed information flow than the control and
the lesioned animals ON apomorphine (KS-test, p <0.001). The lesioned animals after the apomorphine
challenge experienced a decrease of the directed information flow to levels closer, but significantly different
from control (KS-test, p <0.001).
5.4.6 TEMPORAL PROFILE OF INTERACTIONS
The whole interactions (ak and bk terms in Equation 14 (chapter 2, section 2.4)) captured by the 'Full'
model represent a non-linear time-domain transfer function of the system. The last step of our analysis was to
study the temporal structure of the pair-wise interactions (bk parameters) estimated with this model. The average
value of the bk parameters characterizes the temporal profile, thus the amplitude and sign, of these interactions.
We observed that the cross interactions in the lesioned animals OFF apomorphine extended for longer
periods than control. Additionally, it clearly presented an oscillatory structure at beta frequency, which was not
present in the control animals, and 'excitatory' interactions (positive sign) at shorter latencies (around 0-10ms).
Figure 5-7. Transfer functions calculated with the ‘Full’ model, describing the temporal structure of the interactions between GPe
neurons in control and in 6-OHDA lesioned animals, before and after apomorphine (APO) challenge.

122
After apomorphine administration, beta frequency oscillatory activity was not present anymore, as in control.
In order to investigate the resonance phenomena, which has been observed in the basal ganglia-cortical
circuits of PD patients (Eusebio et al., 2009) and of 6-OHDA lesioned rats (chapter 4, Cruz et al., 2011), we
fitted damped sinusoids to the temporal profiles of interactions between pairs of GPe neurons to all our curves.
The parameters of the fitted curves (dashed lines in Figure 5-7) are described in Table 5-1. A beta frequency
damped oscillator function fitted the transfer function from the dopamine-depleted animals, with a natural
frequency in the beta range (around 16 Hz).
5.5 DISCUSSION
A pertinent issue in the study of PD is to determine the factors that affect and how they affect the
atypical neural activity of the basal ganglia-thalamo-cortical circuitry in this disorder. To address this question
we used a non-linear logistic regression model and information theory techniques to analyse the coding capacity
of the GPe network of healthy and hemiparkinsonian rats before and after challenge with non-selective
dopamine agonist apomorphine.
We had found in a previous study that the estimated entropy in the GPe network significantly decreased
after 6-OHDA lesion (chapter 3, Cruz et al., 2009). Following apomorphine administration, the network entropy
in the lesioned animals increased to levels almost as high as in control animals. This re-establishment of the
coding capacity in the GPe network of Parkinsonian animals under the dopamine agonist, known to alleviate PD
R2 α
β [s]
f [Hz]
Θ [radians]
Control 0.98 0.124 0.008 3.8 10.88
Lesioned OFF APO 0. 95 0.054 0.043 16.5 6.65
Lesioned ON APO 0. 97 0.028 0.003 2.8 8.93
Table 5-1. Parameters that describe the damped sinusoid functions that better fit the temporal profiles of the cross terms of the ‘Full’
model: , maximum amplitude; β, damping rate; Θ, phase of the cosine function; f, frequency characteristics.

123
motor symptoms, supports the idea that the information carrying capacity of the neural code in the basal ganglia
might be correlated with the clinical symptoms of the disorder. Apomorphine, like other dopamine agonists used
in the treatment of PD, is known to reverse motor deficits in the patients. In several studies, apomorphine has
been shown to increase the abnormally low firing rates in the Parkinsonian GPe (Filion et al., 1991; Hutchison
et al., 1997; Boraud et al., 2001). Consistent with these findings, our data shows an increase of the firing rates in
the lesioned animals after treatment with apomorphine to values similar to healthy controls. Additionally,
apomorphine has been shown to decrease beta oscillatory activity in cerebral cortex and STN in Parkinsonian
rats (Sharott et al., 2005b). Our results show that the exaggerated beta oscillatory activity in the Parkinsonian
basal ganglia is also suppressed in the GPe when challenged with apomorphine.
Various studies have postulated that the disturbance of the indirect pathway and dynamics in the GPe by
changes in dopamine levels may be responsible for the motor deficits that accompany PD (Albin et al., 1989;
DeLong, 1990; Rajput et al., 2008). A comparison between the motor impairment of MTPT treated monkeys
before and after ablation of GPe has revealed that the disruption of this nucleus aggravated the Parkinsonian
symptoms (Zhang et al., 2006). The authors also found that the lesion led to a reduction of the therapeutic
effects of apomorphine and alterations in the neural activity of single GPi cells, suggesting a strong involvement
of GPe in the pathology and in the restoration of motor performance after dopamine restoration in the brain.
To examine how dynamics alter in the GPe, with changes in the level of dopamine we have taken a
different approach. Assuming that PD symptoms are related to interference in information flow within the basal
ganglia, we investigated the partial contributions of the observed changes in the neural dynamics (like firing
rates, autocorrelations and cross-correlations) to the GPe network entropy. We found that, like for the decrease
in the GPe network entropy observed after 6-OHDA lesioning, the change in firing rates was also the factor that
most contributed to the increase in entropy after the administration of apomorphine. This large influence of the
firing rate change has been observed in different structures in the Parkinsonian basal ganglia and is in
accordance with the current model of basal ganglia function (Albin et al., 1989; DeLong, 1990). According to
this model, the decrease in GPe discharge rates, a consequence of the increased activation of the GABA
projection from the striatum, disinhibits the subthalamic nucleus (STN). The disinhibition of the STN results in
an increase in its excitatory drive on the internal globus pallidus (GPi) and a subsequent increase in the firing
rates in the latter output nucleus. The authors describe these higher discharge rates in the basal ganglia output as
possibly responsible for the motor deficits of PD, since they result in tonic excessive inhibition of the
thalamo-cortical projection neurons interfering with their role in motor control. Other studies where GPe and

124
GPi neuron activity were recorded from PD patients or MPTP monkeys treated with apomorphine, have shown a
clinical improvement highly correlated with the increase and decrease of the frequency rates in GPe and GPi,
respectively, also in agreement with the current ‘Rate’ model (Hutchison et al., 1997; Boraud et al., 2001).
Although the involvement of abnormal firing rates in Parkinsonism has been well studied, it is still not
clear what the role of the excessive beta synchrony in the basal ganglia in Parkinsonian patients and animals, is
in the motor dysfunction of the disease (Eusebio and Brown, 2009; Kuhn et al., 2009). Our results show that the
effect of increased synchrony on the decreased coding capacity in the animals rendered Parkinsonian is more
than 14 fold less than the effect of the decrease of firing rates in the GPe. Likewise, the decrease of the pair-wise
synchrony had an impact roughly of the same order in the restoration of the coding capacity induced by the
apomorphine. These results make us believe that, in PD, the excessive synchronization in the basal ganglia
activity has much lower influence on the disruption of the information flow in the motor circuit than the
abnormal firing rates. Theoretical analyses on the validity of pair-wise cross-correlations as a tool for describing
the synchrony at the network level have shown that weak correlations between pairs of neurons may imply
higher synchrony at the population level (Shamir and Sompolinsky, 2004; Averbeck et al., 2006). These
predictions have been corroborated by experimental studies where the effects of noise correlations were slightly
higher for ensembles of 3 to 8 cells than for pairs of neurons in the supplementary motor area of rhesus monkeys
(Averbeck and Lee, 2006) and for 10 and more cells from the retinae of larval tiger salamanders and guinea
pigs, recorded during visual stimulation (Schneidman et al., 2006). Similarly, in a previous study of the GPe
neural coding in Parkinsonian rats (chapter 3, Cruz et al., 2009), we have calculated the change in entropy as a
function of ensemble sizes for groups of 3 to 12 simultaneously recorded neurons. We found a slight increase in
the effect of cross-correlations for larger ensembles. Based on these results, we then extrapolated this relation to
larger populations up to 500 neurons. Our predictions have shown that there is an increase in the effect of cross-
correlations for ensembles of around 100 neurons in the lesioned animals, which flattens for larger ensemble
sizes. According to these findings, the effect of the cross-correlation for ensembles of more than 100 neurons in
the decrease of the GPe entropy in the lesioned rats, although it was higher than for pairs of neurons, was still
substantially lower than the effect of the firing rates (chapter 3, Cruz et al., 2009).
The origin and function of the exaggerated oscillatory activity in the beta band frequencies that
accompany PD is another factor which is still to be fully understood. We have shown that the difference in the
autocorrelations between control and lesioned animals, which was mostly in the beta frequency band, had the
opposite influence on the network entropy than firing rates and synchrony. This is because the oscillations

125
contributed more to decreasing the GPe network entropy in the control animals than to decreasing it in the
lesioned animals. The restoration (or increasing) of the entropy levels after administration of the apomorphine,
again showed a contrary effect of the autocorrelations compared to firing rates and cross-correlations.
Specifically, the effect of the autocorrelations on entropy was increased in the Parkinsonian rat after
administration of apomorphine. The idea that a regularization of neuronal activity in the basal ganglia alleviates
the manifestations of motor dysfunctions in PD by reducing pathological dynamics in the basal ganglia-thalamo-
cortical circuit is in accordance with the findings by Dorval et al. (2010) that STN DBS at high frequencies
induces a larger relief of bradykinesia in PD patients in comparison with an irregular stimulation at an identical
mean frequency.
We have shown that dopamine depletion decreases the entropy in the network, which again increases to
levels similar to healthy following activation of D1-like and D2-like dopamine receptors by apomorphine.
Interestingly, although the coding capacity is almost fully restored in the GPe network, our results show that the
dopamine agonist seems to eliminate mainly the effects of the decreased firing rate and changes in
autocorrelations and only partially cancels the change in cross-correlations. Since the change in cross-
correlations was the factor that had the lowest contribution to the overall decrease of the network entropy, the
impact of its partial restoration didn’t have a strong effect. Additionally we observed an increase of directed
information transfer between pairs of GPe neurons in the lesioned animals, which was reduced under the
dopamine agonist.
5.6 CONCLUSIONS
Our results confirm that pathophysiological properties characteristic of the disease, such as decreases in
firing rates, abnormal beta frequency oscillations and increased synchrony in the GPe, are depressed by
treatment with apomorphine. Through statistical modelling and information theory techniques we observed a
decrease in the coding capacity in the hemiparkinsonian GPe, and subsequent recovery after apomorphine
challenge to coding capacity levels very close to the non-lesioned brain. We have shown that firing rates are the

126
strongest factor that affects these changes in the network entropy, followed by abnormal beta oscillations. The
increase in synchrony showed a low impact on the coding capacity in the lesioned animals, and was only
partially cancelled by the dopamine agonist. It remains to be proven that the loss of the basal ganglia network’s
ability to adequately code information is related to the motor and cognitive impairment inherent to PD.

127
6 DISCUSSION
Disturbances of neuronal dynamics in the basal ganglia in Parkinson’s disease (PD) have been well
documented in human and animal models. The excessive activity in the beta frequency band (13-30 Hz) has
been consistently found in the cortex and several sites of the basal ganglia of PD patients (Brown et al., 2001;
Marsden et al., 2001; Levy et al., 2002; Williams et al., 2002; Moran et al., 2008) and Parkinsonian animals
(Sharott et al., 2005b; Mallet et al., 2008a; Mallet et al., 2008b). Although the source of these pathological beta
autocorrelations is unknown, it has been shown that they tend to disappear when movement is initiated, hence
suggesting their involvement in the motor complications seen in PD (Levy et al., 2002; Amirnovin et al., 2004;
Kuhn et al., 2004b; Avila et al., 2010). Additionally, other atypical dynamics have been reported in the neural
activity of the Parkinsonian basal ganglia, such as shifted firing rates and increased levels of cross-correlation
(Pan and Walters, 1988; Bergman et al., 1994; Burbaud et al., 1995; Hutchison et al., 1997; Magill et al., 2000;
Raz et al., 2000; Heimer et al., 2002). The study presented in this thesis focuses on understanding how these
changes in the neural activity, probably resulting from dopamine depletion in the basal ganglia, affect the
network entropy of the external segment of the globus pallidus (GPe) and its functional connectivity with the
subthalamic nucleus (STN).
The past decades witnessed a boost in our knowledge of the anatomy and neurophysiology of the basal
ganglia, broadly aided by intensive research on motor and non-motor basal ganglia disorders, and leading to the
emergence of several theories about their architecture and function. Nowadays, the most widely accepted model
of the basal ganglia is known as the rate model and was put forward by several authors in the late 80’s/early
90’s (Albin et al., 1989; Alexander and Crutcher, 1990; Chevalier and Deniau, 1990; DeLong, 1990; Gerfen et
al., 1990; Parent, 1990). It focuses on two pathways with different functions which initiate in distinct
populations of striatal medium spiny neurons (MSNs) and project to the basal ganglia output. The direct
pathway stems from MSNs that express D1-like receptors and comprises the putamen GABAergic relay to the
internal segment of the globus pallidus (GPi) and substantia nigra pars reticulata (SNr). The GPi/SNr make up
the basal ganglia output and when activated disinhibit the thalamic drive to the cortex. The authors suggest that
this circuit facilitates cortically driven movement. On the other hand, the indirect pathway has its origin in the
MSNs expressing D2-like receptors and comprises the putamen-GPe and GPe-STN GABAergic projections, and
the glutamatergic STN-GPi/SNr projection. The activity in this circuit results in inhibition of the motor
thalamus. The indirect pathway, by decreasing the thalamic input into the motor cortex targets, is believed to

128
restrain undesired and conflicting motor actions. The nigrostriatal tract, by regulating the dopaminergic input, is
thought to control and balance the activation of both pathways. Decreased dopamine levels in the striatum are
believed to deactivate MSNs that express D1 receptors, inhibiting the direct pathway and activating the indirect
pathway, resulting in increased inhibitory basal ganglia output. Higher levels of dopamine will act on D2-
expressing MSNs and will generate the opposite effect.
The fact that the GPe connects to all structures in the basal ganglia suggests that this nucleus has a
fundamental role in the information flow in the basal ganglia-thalamo-cortical circuitry. Several studies have
shown that the neural activity in the GPe is strongly associated with levels of motor activity by consistently
observing a decrease in its firing rate in hypokinetic disorders and an increase in hyperkinetic disorders, thus
supporting the basal ganglia classical model from Albin and DeLong (1989). Firing rates in GPe were shown to
decrease in animals after 1-methyl-4-phenyl-1,2,3,6-tetrahydropyridine (MTPT) or 6-hydroxydopamine
(6-OHDA) lesioning (Miller and Delong, 1988; Filion and Tremblay, 1991; Boraud et al., 1998; Aizman et al.,
2000; Mallet et al., 2008a). Parkinson’s disease patients exhibiting Unified Parkinson's Disease Rating Scale
(UPDRS) scores indicating high motor deficits were found to have a high increase of the firing rate in GPe when
challenged with a dopamine replacement treatment (apomorphine) that significantly improved the total motor
scores (Hutchison et al., 1997). Other studies have shown that a microinjection of a GABA antagonist into the
pallidus of the rat induces catalepsy and rigidity (Matsui and Kamioka, 1978; Moroni et al., 1978; Scheel-
Kruger, 1983). Following the rate model from Albin and DeLong (1989), these results were explained by an
increased activity of the indirect pathway: over inhibition of GPe by the striatum, resulting in reduced inhibition
of STN and over excitation of the GPi/SNR. Consequently, the thalamic neurons were inhibited leading to
decreased excitation of cortical neurons, and culminating in increased motor output. Turski et al. (1984) have
shown that, in addition to the injection in the GPe, a simultaneous microinjection of a GABA agonist into the
SNr of the rat suppressed the symptoms of catalepsy, suggesting that activation of the GABAergic neurons of
the basal ganglia output prevented the over inhibition of the motor thalamus. Conversely, microinjections of a
GABA antagonist into GPe generated hyperkinetic movement disorders, such as dyskinesias (Mitchell et al.,
1989). The authors suggest that the blockage of the GABAergic activity in GPe prevented the inhibition of the
basal ganglia output which failed to inhibit the motor thalamus. Studies in PD patients (Hutchison et al., 1997;
Lozano et al., 2000) and MPTP treated monkeys (Boraud et al., 2001; Heimer et al., 2002) have detected
augmented firing rates in the GPe during dopamine replacement treatment, in many cases associated with
dyskinesias induced by the drug.

129
Although the classical view of the basal ganglia organization has been generally accepted, a number of
studies have challenged some basic principles of the rate model (Marsden and Obeso, 1994; Heimer et al., 2002;
Bar-Gad et al., 2003). The classical view of the basal ganglia function suggests that these nuclei play a key role
in motor action preparation and execution, by regulating the activity in the motor thalamus and subsequent relay
to its cortical targets. In PD, the degeneration of dopaminergic cells within the substantia nigra pars compacta
(SNc) and consequent deterioration of the dopaminergic nigra input into the striatum, has been shown to
increase the basal ganglia output. Under the current model, the resulting high inhibition of the thalamus and of
its input into the supplementary motor area (SMA) and other cortical motor areas explains the motor
impairments characteristic of PD, such as akinesia, hypokinesia, bradykinesia, rigidity and tremor. Following
this model, the ablation of structures, such as the GPi/SNr or the thalamus, should lead to further impairment of
the voluntary movement of PD patients due to a substantial decrease or total loss of the thalamic drive to the
cortex. However, clinical evidence from thousands of stereotactic lesions of the GPi and thalamus conducted on
PD patients hint otherwise (Hoehn and Yahr, 1969; Webster, 1969; Hassler et al., 1979; Speelman, 1991).
Pallidotomy was first introduced as an effective treatment for tremor and rigidity in Parkinson’s disease
in the early fifties (Guiot and Brion, 1953; Riechert and Wolf, 1953; Spiegel and Wycis, 1954; Narabayashi et
al., 1956) and thalamotomy a few years later, the latter being identified as more advantageous (Hassler and
Riechert, 1954; Cooper and Bravo, 1958a). Nowadays, these stereotactic lesions have been for the most part
replaced by deep brain stimulation (DBS), a less risky and possibly more beneficial procedure. Marsden and
Obeso (1994) reviewed the account of thousands of such ablative stereotactic surgeries and confirmed that,
although they produced good results in diminishing tremor and rigidity, the partial or full lesioning of GPi or
thalamus did not improve or worsen other symptoms of PD, such as akinesia and bradykinesia. This fact led the
authors to question two main predictions of the rate model. First, that the reduced inhibition of the thalamus
resulting from GPi ablation does not induce dyskinesia, but rather pallidotomies can treat it (Hughes, 1969;
Hassler et al., 1979; Laitinen et al., 1992; Baron et al., 1994). Second, according to the model, the suppression
of the thalamic excitation of the cortex, by elimination of the thalamus, would over facilitate the execution of
cortically initiated movement and disable the capacity of repressing undesired movements. Therefore,
thalamotomies would be expected to compromise the motor performance of PD patients. Clinical studies show
that unilateral and bilateral thalamotomies do not improve akinesia or hypokinesia, nor induce dyskinesia
(Cooper, 1965; Mundinge, 1965; Selby, 1967; Hoehn and Yahr, 1969; Webster, 1969; Hassler et al., 1979;
Speelman, 1991). Thus, these results do not comply with the predictions of the rate model.

130
Given the lack of success in finding possible solutions for such paradoxes, Marsden and Obeso (1994)
argue against the classical view of the basal ganglia as a hierarchical serial processing system, meaning that the
interruption of the circuit by annihilation of one of its elements should disrupt the balance of the system. The
authors further suggest, without expanding into details, that the basal ganglia is likely to process information as
a parallel distributed system, a model of brain computational architecture advocated by McClelland et al (1986)
and Mesulam (1990). Inspired by neural networks, parallel distributed processing models aim to describe the
computational processes and information processing as it occurs in the brain. These models are based on the
assumption that the complexity of the brain and its numerous highly interconnected elements would be
superfluous in a conventional hierarchical sequential framework, but would be fundamental for a parallel
distributed network. Although they assume the existence of serial pathways in addition to the parallel distributed
processing, they state that the information is for the most part not represented locally in dedicated regions, but
distributed through several brain structures organized collectively. Major components involved in a particular
function can communicate directly, but also through the mediation of secondary structures, resulting in several
parallel pathways. In parallel distributed processing, the information processing occurs through interactions and
propagation of activation among a wide collection of elementary processing units, such as neurons, by
exchanging, synchronising or comparing activity patterns between excitatory and inhibitory inputs. Cognitive
processing in the large-scale networks is understood as a competition between different possibilities and
constraints, where each problem is solved by simultaneously and collectively pursuing multiple scenarios until
the lowest conflict state is selected and dominates. A higher number of constraints results in increased
processing speed in parallel distributed processing, but slowed response in serial hierarchical systems.
Therefore, the former models may be more flexible, and could explain the existence of innumerable connections
in the brain and its rapid performance. Specifically, in recent years many new connections between several
structures of the basal ganglia-thalamo-cortical circuit have been discovered, but their role is still obscure.
Additionally, the parallel distributed processing model can help to explain how the lesion of a central structure,
which classically would play a key role in a specific neuronal process, can have a relatively mild or partial effect
on the overall performance, as is the case when GPi or thalamus are damaged and do not result in deficits in the
voluntary movement of the patient. In contrast to the hierarchical serial models, the parallel distributed models
would react to the disruption of an essential pathway in the network as a restriction of the architecture of
information processing and flow, rather than an interruption of a dedicated route towards a planned goal.

131
Our approach in this study is closer to a parallel distributed model, than to the classical theory of basal
ganglia organization. The latter considers individual nuclei in the basal ganglia-thalamo-cortical circuit as
“dimmer switches” by assuming that the whole activity of the nucleus will influence the execution of a specific
movement, modulated by its firing rate. Instead, we assume that patterns of activation of populations of neurons
within each basal ganglia nucleus encode necessary information that will contribute to the task execution. We
believe neurons within nuclei have underlying tuning functions, which combine into populations to encode
specific sensory and behavioural parameters (e.g. motion direction, magnitude, speed or spatial orientation).
Boussaoud and Kermadi (1997) have recorded single cell activity in the striatum in monkeys during a
conditional visuomotor task. The authors report that distinct neural subpopulations were activated by different
visual stimuli and instructed actions, and that a significant number of cells showed combined stimulus and
movement effects. Pasquereau et al. (2007) monitored the activity of single cells in the striatum and GPi of
monkeys during a visually guided motor task, with different reward probabilities associated with each target.
The authors show that ensembles of neurons from both structures dynamically encode motor and cognitive
variables. Preceding or following an instruction to move, neurons have tuning curves that are regulated
simultaneously by direction of movement and reward probability. Georgopolous et al. (1982) studied the
response of single neurons in the motor cortex to different directions of arm movement in monkeys. They
equally found that the same cells were activated when movements followed different trajectories. This
intermingling and intersection in the activity of neural populations seems to suggest that neurons are not
allocated to code specific variables, but rather to work collectively to process information as their tuning curves
overlap. Therefore, an effective evaluation of the performance of such structures in disease is to measure
changes in their coding capacity rather than look independently at the variations of their pattern of activity, such
as firing rates or other dynamical factors.
Thus, to evaluate the extent of the impairment of GPe in processing information in Parkinsonism, we
estimated the difference in network entropies, or coding capacities, of the GPe nucleus in healthy and 6-OHDA
rats, before and after apomorphine injection. In accordance with our predictions, we found that the coding
capacity decreased substantially after dopamine depletion and was restored to levels close to healthy brains
following activation of D1-like and D2-like dopamine receptors by dopamine agonist medication. Therefore,
these results suggest the dopamine in the basal ganglia may act as a modulator or facilitator of information
encoding within the basal ganglia nuclei. The damage of dopaminergic pathways, and consequent decay in the
levels of dopamine, seems to decrease the amount of information that potentially can be processed in the GPe.

132
We believe this contributes to the motor impairment seen in PD. These observations are in agreement with the
theory of neurocognitive parallel distributed processing by Mesulam, which states that neural networks are
composed of “anatomically addressed channels for transferring information content and chemically addressed
pathways for modulating behavioural tone” (Mesulam, 1990).
Within the information theory framework, our model allowed us to decompose the relative impact of
changes in individual dynamical factors – alterations in firing rates, auto or cross-correlations occurring due to
shifted levels of dopamine in the brain – on changes in the coding capacity in the GPe. Our findings have shown
that the decrease of the firing rates in the GPe of Parkinsonian rats was the factor that most contributed to the
observed decrease of the coding capacity of this nucleus. Also, the increase in GPe firing rates in lesioned
animals after apomorphine challenge to values close to control animals, was the component that most assisted
the consequent restoration of the coding capacity. Like in the current rate theory, our results imply that the large
variations in firing rates play a key role in the defective functioning of the basal ganglia-thalamo-cortical
circuitry in Parkinsonism. Yet, within our framework, we also considered the substantial influence of alterations
in the synchrony and oscillatory properties of the neural activity on the ability of GPe to process information.
The autocorrelations in the GPe of Parkinsonian animals, differentiable from control animals mainly in the
predominance of beta frequency rhythms, showed a reasonable effect on the overall entropy in the network
(although in a lesser degree than rate), but decreased the entropy more in control than in lesioned animals. The
synchrony was the factor that had less effect in the decrease of the entropy. Although the coding capacity was
almost fully restored in the GPe network after apomorphine challenge, the dopamine agonist seemed to
eliminate mainly the effects of the decreased firing rate and excessive beta frequency autocorrelations and only
partially cancel the effects of cross-correlations. Since cross-correlation was the factor that had a lower
contribution to the overall decrease of the network entropy, the effect of the incomplete cancelation was not
significant. Our model of the effect of cross-correlations for larger populations of neurons revealed a higher
impact on the decrease of the coding capacity in the lesioned animals, but still much smaller than the effect of
rates and autocorrelations.
We presented evidence that the pathological oscillatory activity (particularly auto-correlation) in the beta
range in PD has a significant effect on the information processing capacity in the GPe network in Parkinsonian
rats. Therefore, we believe that it may underlie the motor impairments intrinsic to the disorder. Nevertheless, the
mechanisms and origin of these beta rhythms are still not fully understood. Brown (2003) suggests that the
oscillations in the beta frequencies in PD impede the neural impulses for movement initiation, which would

133
normally travel through the basal ganglia, because they are not able to override the amplified oscillatory state.
Thus, the reduction of beta rhythms required to initiate voluntary movement is hindered (Kuhn et al., 2004b).
This theory is supported by the fact that treatment of PD with dopaminergic medication has been shown to
reduce the beta rhythms in the basal ganglia, while facilitating voluntary movement (Brown et al., 2001; Levy et
al., 2002; Alonso-Frech et al., 2006).
Less is understood, though, on the subjects of where and why this beta band oscillatory activity emerges
in PD. It is not known if the affected neurons tend to oscillate intrinsically at beta frequencies due to a
combination of external conditions, or if the beta oscillations are a network phenomena, emerging in a particular
structure or set of structures and propagating throughout the basal ganglia-thalamo-cortical circuit. Earlier
studies have hinted that the beta oscillations in PD could emerge in the cortex (Levy et al., 2002). More recently
it has been claimed they could have their origin in the striatum as a product of inhibitory interactions between
medium spiny neurons (McCarthy et al., 2011). Other studies have suggested that the reciprocally connected
STN-GPe network could be the source of the idiopathic oscillations. The high coherence found in the beta range
(Bevan et al., 2002; Mallet et al., 2008a), the fact that the majority of neurons in these nuclei behave as
autonomous pacemakers (Surmeier et al., 2005) and the excitatory/inhibitory properties of the STN-GPe
network, make it a potential generator of oscillatory activity (Cohen et al., 1992; Brunel, 2000; Bevan et al.,
2002; Ermentrout and Chow, 2002; Terman et al., 2002; Mallet et al., 2008a). A study in mature organotypic
cultures of healthy cortex-striatum-STN-GPe, suggested that the STN-GPe network could function as a
pacemaker, spontaneously generating oscillatory bursting synchronized at delta frequencies. It was shown that
the GPe bursting activity hyperpolarized STN neurons to an extent that these were capable of bouncing back,
subsequently driving GPe neural activity and leading to perpetuation of the oscillatory behaviour (Plenz and
Kitai, 1999). A computational model of the pathological basal ganglia, based on the classical rate theory,
presented specific scenarios where the STN-GPe network intrinsically oscillated in the beta band, conditioned
on specific ratios of the connection strengths of the projections (Holgado et al., 2010). However, no clear
experimental evidence has yet been found that the STN-GPe circuit in Parkinsonism has the dynamics required
to underlie the beta rhythmicity at network level. The interplay of many factors, such as the degree and strength
of the connectivity between the excitatory and inhibitory populations, the extent of the interactions with other
nuclei, intrinsic properties of neurons, spike times, synaptic transmission delays, patterns of activity, among
others, make it hard to evaluate if the system follows the ‘balanced regime’ that would allow beta oscillations to
be generated and sustained in the disease state. To stay in this regime, besides the balanced excitation and

134
inhibition interactions, the network nuclei are also required to have a strong coupling between them and
converging oscillatory frequencies (Renart et al., 2004). The ratio between the synaptic time variables of
excitatory and inhibitory currents and the balance between excitation/inhibition will determine the frequency of
the synchronized oscillatory activity (Brunel and Wang, 2003). When under the ‘balance regime’, if the balance
is broken, resulting in a high excitation or inhibition drive, the system will likely become saturated or silent
(Renart et al., 2004).
Ryan and Clark (1992) have recorded extracellular unit activity in the STN of rats, before and after an
excitotoxic lesions of the GPe. They reported an increase of STN drive after the lesion, but neither a silent nor
epileptic response was detected. This result indicates that in healthy brains, the STN-GPe is probably not in the
‘balanced regime’. Our analysis of the functional connectivity between GPe and STN has shown that the
information transfer between these nuclei increases substantially in both directions (around 10 fold) in the 6-
OHDA animals compared to healthy controls. Additionally, we have shown that the temporal profiles of the
interactions between STN and GPe develop oscillatory rhythms around the same frequency in the beta range.
Thus, the stronger coupling and the synchrony of the oscillatory activity observed in the STN-GPe network of
our Parkinsonian animals support the argument that this system might be in a balanced state and may be
responsible for the development of the pathological beta frequency oscillations. Nevertheless, these results do
not exclude other hypothesis such as the beta oscillations are generated elsewhere in the cortical-basal ganglia-
thalamo-cortical circuit and amplified at the level of the STN-GPe network, or are just a product of intrinsic
oscillatory properties of the neurons.
The functional impact of augmented information transfer between the STN and GPe in Parkinsonism is a
key issue, the resolution of which is a challenge since the computational roles of the basal ganglia remain
obscure. There are many theories of basal ganglia function, including dimensionality reduction (Bar-Gad et al.,
2003), reinforcement learning (Graybiel, 1998), sequential motor control (Marsden and Obeso, 1994), action
selection (Mink, 1996; Redgrave et al., 1999; Hazy et al., 2007; Houk et al., 2007), and the related hypothesis
that these circuits are important for automatic execution of well-learned, automated motor plans (Marsden,
1982; Grillner et al., 2005). Many of these theories, as well as the influential direct/indirect pathways model
(DeLong, 1990), focus on the sequential, feed-forward connections of basal ganglia-thalamo-cortical circuits.
As such, they are based on the idea that properly directed information flow through the basal ganglia, and its
effects on the thalamus and other targets, underpins their function. Although information flow, the transmission
of information from one nucleus to the next, can be distinguished from information representation (the amount

135
of information embodied within a single nucleus), these concepts are related. Indeed, hindering information flow
could hinder information representation at the next level in the circuit. In the Parkinsonian state then, the strong
feed-back loop from STN to GPe may impede this information flow. Alternatively, or in addition, this feedback
may impede information representation, which is in agreement with our results that dopamine depletion causes a
substantial decrease in network entropy (i.e. coding capacity) in the GPe.
For a deep understanding of the STN-GPe network, it is also of interest to consider that the GPe
population does not behave uniformly in the lesioned basal ganglia. The GPe cells have been divided in two
subpopulations (the ‘Type-Inactive’ (GP-TI) and the ‘Type-Active’ (GP-TA) that make up around one fifth of
the population). These neuron types are defined by their preferential discharge during the different phases of
cortical slow activation (Mallet et al., 2008a). The GP-TA neurons, contrary to what is believed to be the
tendency in the Parkinsonian basal ganglia, do not tend to oscillate prominently at beta frequencies. Also, lower
information transfer between GP-TA neurons than between GP-TI neurons, and the fact that both types of
neurons tend to fire in anti-phase, indicate that these subpopulations may play different roles within the GPe.
Although no significant difference was found at the level of causal information transfer between either type of
GPe neuron and STN in either direction, we found that the GP-TA/STN projections in both directions were
excitatory at short latencies and revelled a tight temporal coupling, suggesting that GP-TA and STN might share
a common input that GP-TI neurons do not receive. Also it is not clear if the GP-TA neurons yield projections to
STN, or if these are GABAergic, as it is believed to be the case for the majority of GPe (or GP-TI) cells (Bevan
et al., 1998; Smith et al., 1998). Such findings raise some questions that defy the current understanding of the
GPe neural circuits, requiring further research into the neuroanatomy, chemistry, and physiology of these
different subpopulations of GPe neurons.
To reach further understanding of how information processing is hindered in the basal-ganglia-
thalamo-cortical circuit in PD, it would also be of interest, in the future, to expand the present analysis to other
nuclei and functional interactions within the circuit. This would permit comparing levels of impairment in the
coding capacity and information transfer within and between different elements of the circuit. It would allow
one to indentify regions that were more affected by the dopamine depletion characteristic of PD, as well as
investigate their response to treatment with dopamine agonist drugs.
Moreover, it would be interesting to apply the current model to analyse, in healthy and Parkinsonian
awake behaving animals, the response of the basal ganglia network to stimulus and controlled motor tasks. It is
worth noting that the neural activity analyzed in this study was recorded during urethane anaesthesia,

136
administered intraperitoneally. Urethane has been widely used in animal research – in particular in studies
involving electrophysiological recordings in the central nervous system – since it provides extended periods of
anaesthesia and minimal interference in the cardiovascular and respiratory systems (Koblin, 2002). Given in
appropriate doses, urethane induces skeletal muscle relaxation and preserves a number of reflex responses, but
has been shown to alter some physiological parameters (Maggi and Meli, 1986; Hara and Harris, 2002).
Nevertheless, we assumed the extrapolation of our results to the awake state based on several factors we have
discussed in chapter 3 (Cruz et al., 2009). The advantage in the present study in the analysis of
electrophysiological data lies in the large amount of data that can be collected in the anesthetized state, both in
terms of the amount of data recorded for each neuron, and the number of neurons that can be recorded
simultaneously. Currently, the existing techniques to record in awake rats make it difficult to obtain datasets as
large as the one we analysed in this study.
We have shown substantial changes in entropy in the GPe network and in directed information flow in
the STN-GPe interaction after dopamine depletion, which may contribute to the motor deficits inherent in PD.
We hypothesise that variation in the coding capacity along with obstruction in the information transfer is also
present in other structures of the Parkinsonian basal ganglia-thalamo-cortical circuit, which as a whole underlie
the movement difficulties the PD patients endure. Notwithstanding the huge advances and importance of the
existing treatments for PD, such as dopamine replacement drugs or DBS, still large improvements have to be
made in the field, mainly due to strong side effects and temporary effectiveness that underlie these treatments. A
deeper understanding of the specific mechanisms occurring in the basal ganglia under dopamine depletion
would allow a more targeted treatment and hopefully improve its efficacy and therefore increase the quality of
life of PD patients.

137
7 CONCLUSION
By means of information theory methods and nonlinear time series analysis, we investigated the effects
that different levels of dopamine in the basal ganglia have on the entropy of GPe and STN-GPe networks. The
key findings of this study are that chronic dopamine depletion in the basal ganglia led to a substantial decrease
in the coding capacity of the GPe network, which was restored to levels close to control under the effect of the
dopamine agonist apomorphine. Alteration in firing rates was the factor that most impacted the changes in the
GPe network entropy, followed by the presence of excessive oscillations in the beta frequency range and the
cross-correlation, the latter showing a small effect. We also found that the STN-GPe coupling was higher in the
lesioned animals and that temporal structures of interactions between both nuclei in either direction were found
to oscillate at beta frequencies. These results suggest that the disturbances of the dynamical properties at neural
and network levels that occur in the Parkinsonian state are responsible for preventing the natural information
processing within the GPe and information flow between STN and GPe. We believe they contribute to the motor
impairments seen in PD. We also found that the perturbation in the network entropy can be reversed by restoring
appropriate levels of tonic dopamine agonism in the basal ganglia.

138
APPENDIX
APPENDIX A
# of animals # of cells # of pairs # of ensembles
(> 1 cell)
CONTROL
GPe/GPe
(chapters 2, 3, 4 and 5) 16 143 507 27
STN/GPe (chapter 4)
6 STN: 10
49 10
GPe: 49
LESIONED
GPe/GPe (chapters 2, 3 and 5)
23 459 2086 56
STN/GPe (chapter 4)
11 STN: 26
184 18
GPe: 133
GP-TI/GP-TI (chapter 4)
23 271 2394 52
GP-TA/GP-TA (chapter 4)
20 59 562 18
GP-TI/GP-TA (chapter 4)
20
GP-TI: 160
340 29
GP-TA: 60
STN/GP-TI (chapter 4)
11
STN: 24
105 16 GP-TA: 74
STN/GP-TA (chapter 4)
8
STN: 15
22 8
GP-TA: 13
LESIONED (Apomorphine study)
GPe OFF APO (chapter 5)
8 67 634 8
GPe ON APO (chapter 5)
8 44 208 8
Table A-1. Summary of the dataset used in the studies, referenced to each chapter. Single cell activity was simultaneously recorded from
GPe and STN neurons, from control and 6-OHDA lesioned animals. Additionally, the GPe data set was split in two sub-populations: GP-TI
and GP-TA (see chapter 4). In the last two rows is the dataset used in the chapter 5 study, where neurons from the GPe of 6-OHDA lesioned
rats were recorded before (GPe OFF APO) and after (GPe ON APO) treatment with apomorphine (APO).

139
APPENDIX B
Population model
In this appendix we present the mathematical details of our population model. We were interested in the
effects of correlations at the population level. From the data, we directly estimated delta entropy (ΔH) in
ensembles of ≤ 19 simultaneously recorded neurons. However, the effects of correlations (synchronization) will
likely be larger at the population level (Averbeck and Lee, 2006). Because we currently do not have techniques
for either recording from or estimating information in entire populations of neurons, we have to estimate the
impact of correlations at the population level using model extrapolations. To make this estimate we developed a
model that is consistent with the results of the empirical analyses. Specifically, we used only measured pair-wise
covariances to estimate delta entropy at the population level.
Only linear terms were significant in the logistic regression model; adding the higher-order terms did not
improve prediction (see Results in chapter 3, section 3.4). Thus, our model was developed by estimating the
performance of a linear classifier. Derivation of linear classifiers is generally done by making Gaussian
assumptions on the distribution of the variables used for prediction. Although our individual variables are
binomial, for large neuronal populations, linear functions of binomial random variables will converge to
Gaussians, via the central limit theorem (Papoulis, 1991).
Least squares estimators can be used to find optimal linear classifiers (Duda et al., 2001). Thus, our
classifier is given by
(B1) bsT
i .
Here, ηi is an estimate of whether or not a spike occurred (not constrained to lie between 0 and 1 as it is
in the logistic regression model), the vector s represents the spiking in the set of simultaneously recorded
neurons, and the vector b is our decision boundary estimated with least squares. It can be shown that, for a
particular choice of ηi values, the linear decision boundary b will be the same as the Fisher decision boundary
(Duda et al., 2001). Specifically, if we set

140
(B2)
1:/1
0:)1/(1
ii
ii
isr
sr
where ri is the firing rate of neuron i, it can be shown that b is the Fisher discriminant boundary. We can find b
and the residual variance of this estimator using standard linear model results
(B3) i
T sssb 1)(
(B4) 22
)( bsT
ii
If we define the matrices
(B5)
is
T
ss
sC
ssC
We can write the residual variance as
(B6)
ssssiii
sss
T
ii
CCC
CCs
12
212)(
Thus to estimate the residual variance, we have to calculate the matrices sC and .ssC The variance of
the dependent variable is given by
(B7) iiii rr /1)1/(12
Css can be measured directly in the data as this is the covariance matrix between spike trains. Individual
elements of this matrix are given by
(B8) )()(, jjiiji ssssC
The covariance between sj and the ηi is
(B9) 2
,)()( jijjiis CssCji
.
To estimate our classification performance, which can be used to estimate the residual entropy, we have
to know the difference in the means for the estimates of a spike and no spike, and the variance of the
distributions about the means generated by our linear estimator. The means can be calculated from

141
(B10)
N
j
ijj
N
j
ijj
ssPb
ssPb
1
1
1
0
)1|1(
)0|1(
m
m
The conditional probabilities are given by
(B11)
i
ji
i
ij
ijr
m
sP
ssPssP
,
)1(
)1|1()1|1(
where
(B12) jijiji rrCm ,,
is the second, noncentral moment. Correspondingly we can calculate
(B13)
i
jij
i
ij
ijr
mr
sP
ssPssP
1)0(
)0,1()0|1(
,.
Finally, the total variance 2
i can be factored into bias and variance components, which allow us to
calculate the variance around the mean estimates. Specifically
(B14) 2
0
2
1
22)]1/(1[)/1( iiii rr mm .
Our classification accuracy is then given by
(B15)
i
d
mm || 01 .
This can be converted to fraction correct classification performance using the error function (Averbeck
and Lee, 2006)
(B16) dxx
ttPd
2/
22/1 )
2exp()2()1|2ˆ( .
The fraction correct can then be converted to delta entropy.
The model was estimated by sampling covariance matrices randomly from the distribution of
covariance values estimated for all pairs of neurons and then estimating delta entropy for the corresponding

142
population. The average covariance values for the lesioned data were 0.0088, and the average values for the
control data were 0.0068. This was done 5,000 times, and the results were averaged to give the curves shown in
Figure 3-7. Firing rates for all neurons were set to 0.125 spikes/bin in the lesion data and 0.325 spikes/bin in the
control data. Although these rates are slightly higher than the average rates estimated in the data, they give
average entropy values that match those in the data. Because entropy is a nonlinear function of rate, the average
rate does not give the average entropy. Thus we could match the rates or the entropy, so we chose to match the
entropy.

143
APPENDIX C
Dete
rmin
e o
ptim
al
num
ber
of la
gs for
auto
and c
ross term
s
Estim
ate
mutu
al
info
rmation b
etw
een
pair
s o
f S
TN
and G
Pe
neuro
ns
Exam
ine c
oeffic
ients
of m
odel
BC
D
see F
ig. 2
see F
ig. 3
see F
ig. 4
Bin
spik
es w
ith
5 m
s b
inw
idth
s
A
01
02
03
0-1
.12
-1.1
-1.0
8
-1.0
6x 1
04
BIC
Nr
of
pa
ram
ete
rs (
K)
30
00
00
01
10
11
11
Sp
ike
tra
in f
rom
sin
gle
ne
uro
n
Sp
ike
tra
in b
inn
ed
at
5 m
s -
bin
s w
ith
a
sp
ike
ha
ve
a 1
; b
ins w
ith
ou
t a
sp
ike
ha
ve
a 0
.
...
...
Ste
p 1
: E
stim
ate
entr
opy o
f auto
model
.3.5
.3.5
.5.5
.5.3
.3.5
.3.3
.3
Ste
p 2
: E
stim
ate
entr
opy o
f fu
ll m
odel
Ste
p 3
: M
utu
al in
form
atio
n is t
he
diff
ere
nce
be
twe
en
en
tro
py o
f fu
ll a
nd
au
to m
od
els
Ste
p 1
a:
Co
mp
ute
pro
ba
bili
ty o
f a
sp
ike
in
ea
ch
bin
fo
r n
eu
ron
i, u
sin
g a
uto
mo
de
l
Ste
p 1
b:
Co
mp
ute
en
tro
py o
f sp
ike
tra
in (
se
e e
qu
atio
n
8)
usin
g p
rob
ab
ility
estim
ate
s in
ea
ch
bin
fro
m a
uto
mo
de
l
Ste
p 2
a:
Co
mp
ute
pro
ba
bili
ty o
f a
sp
ike
in
ea
ch
bin
fo
r n
eu
ron
i, u
sin
g f
ull
mo
de
l, w
hic
h h
as a
uto
an
d c
ross t
erm
s
.3.7
.1.6
.5.1
.3.0
.1.2
.1.1
.1
Ste
p 2
b:
Co
mp
ute
en
tro
py o
f sp
ike
tra
in u
sin
g
pro
ba
bili
ty e
stim
ate
s in
ea
ch
bin
fro
m f
ull
mo
de
l
Extr
act
pa
ram
ete
rs b
l fro
m f
ull
mo
de
l
(se
e e
qu
atio
n 1
) a
nd
plo
t th
eir a
ve
rag
e
to g
ive
th
e t
em
po
ral p
rofile
of
inte
ractio
ns
be
twe
en
nu
cle
i.
Ste
ps in e
stim
ating m
utu
al in
form
ation
t =
0
1
2
3
5
6
7 8
91
011
12
13
...
t =
0
1
2
3
5
6
7 8
91
011
12
13
...
T.3
T.3
For
exa
mple
, to
est
imate
auto
term
s,equatio
n 1
is fit
with
K =
1, K
= 2
, ... K
= 3
0and B
IC is
eva
luate
d for
each
fit.
Optim
al n
um
ber
of te
rms
is m
ax
of B
IC, at 3 for
this
exa
mple
.
00.0
20.0
4
-0.3
-0.2
-0.10
0.1
0.2
0.3
Tim
e
[s]
bl parameters
Th
is e
xa
mp
le s
ho
ws c
oe
ffic
ien
ts f
or
inte
ractio
n b
etw
ee
n
on
e p
air.T
he
se
wo
uld
be
ave
rag
ed
to
giv
e v
alu
es in
Fig
. 4
.
Po
sitiv
e p
ara
me
ters
in
dic
ate
a s
pik
e in
on
e n
eu
ron
incre
ase
s t
he
pro
ba
bili
ty o
f a
sp
ike
in
th
e o
the
r n
eu
ron
,
an
d n
eg
ative
ind
ica
tes t
ha
t a
sp
ike
de
cre
ase
s t
he
pro
ba
bili
ty.
Fig
ure C
-1.
Anal
ysi
s fl
ow
ch
art.
A.
Dat
a b
innin
g a
nd c
onv
ersi
on t
o a
bin
ary s
ign
al.
B.
Sel
ecti
on o
f o
pti
mal
num
ber
of
lag
s u
sing t
he
Bay
esia
n I
nfo
rmat
ion C
rite
rion
. C
. M
utu
al I
nfo
rmat
ion
est
imat
ion
. D
. A
nal
ysi
s o
f th
e te
mpo
ral
pro
file
of
inte
ract
ion
s b
etw
een
nu
clei
.

144
APPENDIX D
The measure of directed information – both the transfer entropy as defined by Schreiber (2000) and the
directed information flow we propose in this study – quantifies the statistical coherence between two processes,
considering the dynamics of the exchange and differentiating the flow in each direction. In this section we will
compare both approaches.
In Schreiber (2000), the entropy rate is defined as
(D1)
i
k
nn
k
nnI iiPiiPh )|(log),( )(
12
)(
1
,
where in is the state of time series I at time n and the notation in(k)
= (in,…, in-k+1), where k denotes the number of
conditioning states from the same process I. If we rewrite Equation 9 (chapter 3, section 3.3.5), using the above
notation, the entropy rate as we defined is given by
(D2)
.)|(log)|(1 )(
12
)(
1 n i
k
nn
k
nnrate iiPiiPN
H
In Equation D1, the condition entropy for each different pattern that occurs is multiplied by its probability. In
Equation D2, we represent the conditional entropy over all patterns that do occur and multiply it by their
probability. Given the definition of expected value
(D3) ,1
)(][ n
xN
xxPxE
and the Bayes rule,
(D4) )()|(),( )()(
1
)(
1
k
n
k
nn
k
nn iPiiPiiP ,
we can write
(D5) n
k
nn
k
nn iiPN
iiP )|(1
),( )(
1
)(
1.
Thus, one can rewrite Equation D2 as

145
(D6) i
k
nn
k
nnrate iiPiiPH )|(log),( )(
12
)(
1,
showing that both definitions of rate entropy are equivalent.
Moreover, Schreiber quantifies the transfer entropy as a deviation from the generalized Markov property
given by
(D7) ),|()|()()(
1
)(
1
l
n
k
nn
k
nn jiiPiiP ,
where J denotes a second stochastic process with jn(l)
= (jn,…, jn-l+1). That is, if a stochastic process does not
follow the Markov property, then the conditional probability distribution of future states of the process depends
not only upon the present state, but also on previous states. The transfer entropy expresses the invalidation of
the assumption of a Markov process, or the assumption that conditioning on jn(l)
does not alter the transition
probabilities of in+1, defined as:
(D8)
j ik
nn
l
n
k
nnl
n
k
nnIJiiP
jiiPjiiPTE
)|(
),|(log),,(
)(
1
)()(
12
)()(
1
(D9)
j i
k
nn
l
n
k
nn
j i
l
n
k
nn
l
n
k
nn
iiPjiiP
jiiPjiiP
)|(log),,(
),|(log),,(
)(
12
)()(
1
)()(
12
)()(
1
.
Formulating the directed information flow as we define it in Equation 7 (chapter 4, section 4.3.3) ‒ the
difference between what we call the 'Auto' entropy and the 'Full' entropy ‒, using the entropy definition as in
Equation D6,
(D10) fullautoIJ HHDI
(D11)
j i
l
n
k
nn
l
n
k
nn
i
k
nn
k
nn
jiiPjiiP
iiPiiP
),|(log),,(
)|(log),(
)(
1
)(
12
)(
1
)(
1
)(
12
)(
1
.
Considering that we can obtain the joint distribution P(in+1,in(k)
) by marginalizing out the variable jn (l)
of the joint
distribution of in+1, in(k)
, and jn+1(l)
,
(D12) j
l
n
k
nn
k
nn jiiPiiP ),,(),( )()(
1
)(
1,

146
the directed information flow can be defined as
(D13)
j i
k
nn
l
n
k
nn
j i
l
n
k
nn
l
n
k
nnIJ
iiPjiiP
jiiPjiiPDI
)|(log),,(
),|(log),,(
)(
12
)()(
1
)(
1
)(
12
)(
1
)(
1
.
Therefore, Equations D9 and D13 show that transfer entropy as defined by Schreiber and the directed
information flow as defined in this study are formally equivalent, where we use an empirical estimate of
expected value instead of a sum over a probability distribution.
Note, however, a slight distinction between both models; Schreiber considers a delay on the information
transition from process J to I (Equation D8), while we do not. The present study considers the supplementary
synchronous term jn+1 as it has been shown that the propagation time of interactions between GPe neurons and
between GPe and STN neurons in the adult rat in vivo can be faster than 5 ms ‒ the bin size used to discretise
our data (Kita et al., 1983; Kita and Kitai, 1991).
Barnet et al. (2009) analysed the relationship between the transfer entropy (Schreiber, 2000), an
information-theoretic method, and the Wiener-Granger causality, an autoregressive model showing that the two
different approaches for testing causal relationships between time series are equivalent under Gaussian
conditions. Therefore, as we have shown that the directed information flow considered in this study is
equivalent to Schreiber's transfer entropy, one can infer that the former approach is also equivalent to the
Granger causality for Gaussian distributions.

147
APPENDIX E
Figure E-1. Characterization of the firing rate properties of the spike trains recorded in the GPe neurons. A, B. Analysis of
the differences between the mean firing rate in each segment S ¯i,t+h
and the mean firing rate of the whole spike train i,
denoted as Δsi,t+h in Equation 5 (chapter 2; section 2.4). The results are shown as the average ± SD of Δsi,t+h for all T-h
segments with fixed width h ‒ with T as the total number of bins of each spike train ‒, and across all control (A) and
lesioned (B) cells for diferent values of h. C, D. Average ± SD of the autocovariance of the mean firing rates across spike
trains of control (C) and lesioned (D) animals, as a function of the time shift h.

148
Figure E-2. Characterization of the firing rate dynamics along the spike trains of STN neurons in control and lesioned
animals. Results presented as in Figure E-1.
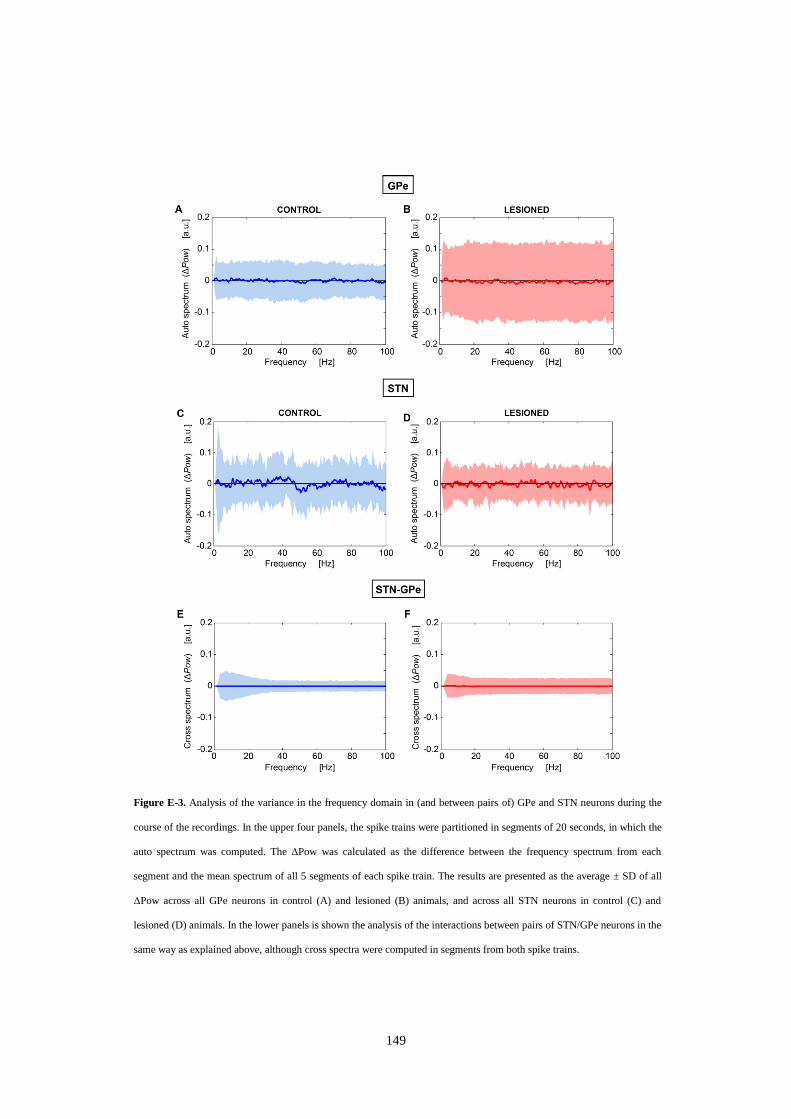
149
Figure E-3. Analysis of the variance in the frequency domain in (and between pairs of) GPe and STN neurons during the
course of the recordings. In the upper four panels, the spike trains were partitioned in segments of 20 seconds, in which the
auto spectrum was computed. The ΔPow was calculated as the difference between the frequency spectrum from each
segment and the mean spectrum of all 5 segments of each spike train. The results are presented as the average ± SD of all
ΔPow across all GPe neurons in control (A) and lesioned (B) animals, and across all STN neurons in control (C) and
lesioned (D) animals. In the lower panels is shown the analysis of the interactions between pairs of STN/GPe neurons in the
same way as explained above, although cross spectra were computed in segments from both spike trains.

150
REFERENCES
Aizman O, Brismar H, Uhlen P, Zettergren E, Levey AI, Forssberg H, Greengard P, Aperia A (2000) Anatomical and physiological evidence for D1 and D2 dopamine receptor colocalization in neostriatal neurons. Nat Neurosci 3:226-230.
Akaike H (1973) Information theory and an extension of the maximum likelihood principle. In: in Second International Symposium on
Information Theory (Cs'aki eVPaF, ed), pp 267-281. Budapest: Akademiai Ki'ado.
Albin RL, Young AB, Penney JB (1989) The functional anatomy of basal ganglia disorders. Trends Neurosci 12:366-375.
Alexander GE, Crutcher MD (1990) Functional architecture of basal ganglia circuits - neural substrates of parallel processing. Trends in
Neurosciences 13:266-271.
Alexander GE, Delong MR, Strick PL (1986) PARALLEL ORGANIZATION OF FUNCTIONALLY SEGREGATED CIRCUITS
LINKING BASAL GANGLIA AND CORTEX. Annual Review of Neuroscience 9:357-381.
Alexander GE, Crutcher MD, Delong MR (1990) BASAL GANGLIA-THALAMOCORTICAL CIRCUITS - PARALLEL SUBSTRATES FOR MOTOR, OCULOMOTOR, PREFRONTAL AND LIMBIC FUNCTIONS. Progress in Brain Research 85:119-146.
Allers KA, Kreiss DS, Walters JR (2000) Multisecond oscillations in the subthalamic nucleus: Effects of apomorphine and dopamine cell
lesion. Synapse 38:38-50.
Alonso-Frech F, Zamarbide I, Alegre M, Rodriguez-Oroz MC, Guridi J, Manrique M, Valencia M, Artieda J, Obeso JA (2006) Slow
oscillatory activity and levodopa-induced dyskinesias in Parkinson's disease. Brain 129:1748-1757.
Amirnovin R, Williams ZM, Cosgrove GR, Eskandar EN (2004) Visually guided movements suppress subthalamic oscillations in Parkinson's disease patients. Journal of Neuroscience 24:11302-11306.
Averbeck BB, Lee D (2006) Effects of noise correlations on information encoding and decoding. Journal of Neurophysiology 95:3633-
3644.
Averbeck BB, Latham PE, Pouget A (2006) Neural correlations, population coding and computation. Nature Reviews Neuroscience 7:358-
366.
Avila I, Parr-Brownlie LC, Brazhnik E, Castaneda E, Bergstrom DA, Walters JR (2010) Beta frequency synchronization in basal ganglia output during rest and walk in a hemiparkinsonian rat. Experimental Neurology 221:307-319.
Aziz TZ, Peggs D, Sambrook MA, Crossman AR (1991) LESION OF THE SUBTHALAMIC NUCLEUS FOR THE ALLEVIATION OF
1-METHYL-4-PHENYL-1,2,3,6-TETRAHYDROPYRIDINE (MPTP)-INDUCED PARKINSONISM IN THE PRIMATE. Movement Disorders 6:288-292.
Aziz TZ, Davies L, Stein J, France S (1998) The role of descending basal ganglia connections to the brain stem in Parkinsonian akinesia.
British Journal of Neurosurgery 12:245-249.
Bar-Gad I, Morris G, Bergman H (2003) Information processing, dimensionality reduction and reinforcement learning in the basal ganglia.
Prog Neurobiol 71:439-473.
Barnett L, Barrett AB, Seth AK (2009) Granger Causality and Transfer Entropy Are Equivalent for Gaussian Variables. Physical Review Letters 103.
Baron M, Turner R, Vitek J, Kaneoke Y, Bakay R, Delong M (1994) Lesions of the internal segment of the globus-pallidus (GPI) in
Parkinsonian-patients improve motor performance bilaterally. Neurology 44:A304-A304.
Baron MS, Vitek JL, Bakay RAE, Green J, McDonald WM, Cole SA, DeLong MR (2000) Treatment of advanced Parkinson's disease by
unilateral posterior GPi pallidotomy: 4-year results of a pilot study. Movement Disorders 15:230-237.
Beckstead RM, Domesick VB, Nauta WJH (1979) EFFERENT CONNECTIONS OF THE SUBSTANTIA NIGRA AND VENTRAL TEGMENTAL AREA IN THE RAT. Brain Research 175:191-217.
Belluscio MA, Kasanetz F, Riquelme LA, Murer MG (2003) Spreading of slow cortical rhythms to the basal ganglia output nuclei in rats
with nigrostriatal lesions. European Journal of Neuroscience 17:1046-1052.
Benabid AL, Chabardes S, Mitrofanis J, Pollak P (2009) Deep brain stimulation of the subthalamic nucleus for the treatment of Parkinson's
disease. Lancet Neurology 8:67-81.

151
Benabid AL, Pollak P, Louveau A, Henry S, Derougemont J (1987) COMBINED (THALAMOTOMY AND STIMULATION)
STEREOTACTIC SURGERY OF THE VIM THALAMIC NUCLEUS FOR BILATERAL PARKINSON DISEASE. Applied
Neurophysiology 50:344-346.
Benabid AL, Pollak P, Gross C, Hoffmann D, Benazzouz A, Gao DM, Laurent A, Gentil M, Perret J (1994) Acute and long-term effects of
subthalamic nucleus stimulation in Parkinson's disease. Stereotactic and Functional Neurosurgery 62:76-84.
Benazzouz A, Gross C, Feger J, Boraud T, Bioulac B (1993) REVERSAL OF RIGIDITY AND IMPROVEMENT IN MOTOR-
PERFORMANCE BY SUBTHALAMIC HIGH-FREQUENCY STIMULATION IN MPTP-TREATED MONKEYS. European
Journal of Neuroscience 5:382-389.
Bergman H, Wichmann T, DeLong MR (1990) Reversal of experimental parkinsonism by lesions of the subthalamic nucleus. Science
249:1436-1438.
Bergman H, Wichmann T, Karmon B, Delong MR (1994) THE PRIMATE SUBTHALAMIC NUCLEUS .2. NEURONAL-ACTIVITY IN THE MPTP MODEL OF PARKINSONISM. Journal of Neurophysiology 72:507-520.
Bergman H, Feingold A, Nini A, Raz A, Slovin H, Abeles M, Vaadia E (1998) Physiological aspects of information processing in the basal
ganglia of normal and parkinsonian primates. Trends Neurosci 21:32-38.
Bernheim H, Birkmaye W, Hornykie O, Jellinge K, Seitelbe F (1973) Brain dopamine and syndromes of Parkinson and Huntington -
clinical, morphological and neurochemical correlations. Journal of the Neurological Sciences 20:415-455.
Berry MJ, Warland DK, Meister M (1997) The structure and precision of retinal spike trains. Proceedings of the National Academy of Sciences of the United States of America 94:5411-5416.
Besserve M, Schoelkopf B, Logothetis NK, Panzeri S (2010) Causal relationships between frequency bands of extracellular signals in visual
cortex revealed by an information theoretic analysis. Journal of Computational Neuroscience 29:547-566.
Bevan MD, Booth PA, Eaton SA, Bolam JP (1998) Selective innervation of neostriatal interneurons by a subclass of neuron in the globus
pallidus of the rat. J Neurosci 18:9438-9452.
Bevan MD, Magill PJ, Terman D, Bolam JP, Wilson CJ (2002) Move to the rhythm: oscillations in the subthalamic nucleus-external globus pallidus network. Trends in Neurosciences 25:525-531.
Bialek W, Rieke F, Vansteveninck RRD, Warland D (1991) READING A NEURAL CODE. Science 252:1854-1857.
Bohnen NI, Kaufer DI, Ivanco LS, Lopresti B, Koeppe RA, Davis JG, Mathis CA, Moore RY, DeKosky ST (2003) Cortical cholinergic function is more severely affected in parkinsonian dementia than in Alzheimer disease - An in vivo positron emission
tomographic study. Archives of Neurology 60:1745-1748.
Bolam JP, Smith Y (1992) THE STRIATUM AND THE GLOBUS-PALLIDUS SEND CONVERGENT SYNAPTIC INPUTS ONTO
SINGLE CELLS IN THE ENTOPEDUNCULAR NUCLEUS OF THE RAT - A DOUBLE ANTEROGRADE LABELING
STUDY COMBINED WITH POSTEMBEDDING IMMUNOCYTOCHEMISTRY FOR GABA. Journal of Comparative Neurology 321:456-476.
Bollimunta A, Chen Y, Schroeder CE, Ding M (2009) Characterizing oscillatory cortical networks with granger causality. In: Coherent
Behavior in Neural Networks (Josic K, Rubin J, Matias MA, Romo R, eds), p 304. New York: Springer.
Boraud T, Bezard E, Bioulac B, Gross CE (2001) Dopamine agonist-induced dyskinesias are correlated to both firing pattern and frequency
alterations of pallidal neurones in the MPTP-treated monkey. Brain 124:546-557.
Boraud T, Bezard E, Guehl D, Bioulac B, Gross C (1998) Effects of L-DOPA on neuronal activity of the globus pallidus externalis (GPe) and globus pallidus internalis (GPi) in the MPTP-treated monkey. Brain Research 787:157-160.
Boussaoud D, Kermadi I (1997) The primate striatum: neuronal activity in relation to spatial attention versus motor preparation. Eur J
Neurosci 9:2152-2168.
Brenner N, Strong SP, Koberle R, Bialek W, van Steveninck RRD (2000) Synergy in a neural code. Neural Computation 12:1531-1552.
Brown P (2003) Oscillatory nature of human basal ganglia activity: Relationship to the pathophysiology of Parkinson's disease. Movement
Disorders 18:357-363.
Brown P (2006) Basal ganglia-cortical systems reinforcing tonic motor activity in health and disease. Neuroscience Research 55:S8-S8.
Brown P, Williams D (2005) Basal ganglia local field potential activity: character and functional significance in the human. Clin
Neurophysiol 116:2510-2519.

152
Brown P, Corcos DM, Rothwell JC (1997) Does parkinsonian action tremor contribute to muscle weakness in Parkinson's disease? Brain
120:401-408.
Brown P, Oliviero A, Mazzone P, Insola A, Tonali P, Di Lazzaro V (2001) Dopamine dependency of oscillations between subthalamic
nucleus and pallidum in Parkinson's disease. Journal of Neuroscience 21:1033-1038.
Bruhn J, Ropcke H, Rehberg B, Bouillon T, Hoeft A (2000) Electroencephalogram approximate entropy correctly classifies the occurrence of burst suppression pattern as increasing anesthetic drug effect. Anesthesiology 93:981-985.
Brunel N (2000) Dynamics of sparsely connected networks of excitatory and inhibitory spiking neurons. J Comput Neurosci 8:183-208.
Brunel N, Wang X (2003) What determines the frequency of fast network oscillations with irregular neural discharges? I. Synaptic dynamics and excitation-inhibition balance. Journal of Neurophysiology 90:415-430.
Buehlmann A, Deco G (2010) Optimal Information Transfer in the Cortex through Synchronization. Plos Computational Biology 6.
Bugaysen J, Bronfeld M, Tischler H, Bar-Gad I, Korngreen A (2010) Electrophysiological characteristics of globus pallidus neurons. PLoS One 5:e12001.
Burbaud P, Gross C, Benazzouz A, Coussemacq M, Bioulac B (1995) REDUCTION OF APOMORPHINE-INDUCED ROTATIONAL
BEHAVIOR BY SUBTHALAMIC LESION IN 6-OHDA LESIONED RATS IS ASSOCIATED WITH A NORMALIZATION OF FIRING RATE AND DISCHARGE PATTERN OF PARS RETICULATA NEURONS. Experimental Brain Research
105:48-58.
Burchiel KJ (1995) THALAMOTOMY FOR MOVEMENT-DISORDERS. Neurosurgery Clinics of North America 6:55-71.
Burioka N, Miyata M, Cornelissen G, Halberg F, Takeshima T, Kaplan DT, Suyama H, Endo M, Maegaki Y, Nomura T, Tomita Y,
Nakashima K, Shimizu E (2005) Approximate entropy in the electroencephalogram during wake and sleep. Clinical Eeg and
Neuroscience 36:21-24.
Candy JM, Perry RH, Perry EK, Irving D, Blessed G, Fairbairn AF, Tomlinson BE (1983) PATHOLOGICAL-CHANGES IN THE
NUCLEUS OF MEYNERT IN ALZHEIMERS AND PARKINSONS DISEASES. Journal of the Neurological Sciences 59:277-
289.
Carman LS, Gage FH, Shults CW (1991) Partial lesion of the substantia-nigra: relation between extent of lesion and rotational behavior.
Brain Research 553:275-283.
Castiglioni P, Di Rienzo M (2008) How the threshold "r" influences approximate entropy analysis of heart-rate variability. Comput Cardiol 35:561-564.
Chanpalay V, Asan E (1989) ALTERATIONS IN CATECHOLAMINE NEURONS OF THE LOCUS COERULEUS IN SENILE DEMENTIA OF THE ALZHEIMER TYPE AND IN PARKINSONS-DISEASE WITH AND WITHOUT DEMENTIA AND
DEPRESSION. J Comp Neurol 287:373-392.
Charlton CG, Crowell B (1995) Striatal dopamine depletion, tremors, and hypokinesia following the intracranial injection of S-adenosylmethionine - A possible role of hypermethylation in parkinsonism. Molecular and Chemical Neuropathology 26:269-
284.
Chavez M, Martinerie J, Le Van Quyen M (2003) Statistical assessment of nonlinear causality: application to epileptic EEG signals. Journal of Neuroscience Methods 124:113-128.
Chesselet MF, Delfs JM (1996) Basal ganglia and movement disorders: An update. Trends in Neurosciences 19:417-422.
Chevalier G, Deniau JM (1990) DISINHIBITION AS A BASIC PROCESS IN THE EXPRESSION OF STRIATAL FUNCTIONS. Trends
in Neurosciences 13:277-280.
Christensen R (1997) Log-linear models and logistic regression. New York: Springer.
Civelli O, Bunzow JR, Grandy DK (1993) MOLECULAR DIVERSITY OF THE DOPAMINE-RECEPTORS. Annual Review of Pharmacology and Toxicology 33:281-307.
Cohen AH, Ermentrout GB, Kiemel T, Kopell N, Sigvardt KA, Williams TL (1992) Modelling of intersegmental coordination in the
lamprey central pattern generator for locomotion. Trends Neurosci 15:434-438.
Colzi A, Turner K, Lees AJ (1998) Continuous subcutaneous waking day apomorphine in the long term treatment of levodopa induced
interdose dyskinesias in Parkinson's disease. Journal of Neurology Neurosurgery and Psychiatry 64:573-576.
Cooper AJ, Stanford IM (2002) Calbindin D-28k positive projection neurones and calretinin positive interneurones of the rat globus pallidus. Brain Research 929:243-251.

153
Cooper I (1965) Surgical treatment of Parkinsonism. Annual Review of Medicine 16:309-&.
Cooper I, Bravo G (1958a) Implications of a 5-year study of 700 basal ganglia operations. Neurology 8:701-707.
Cooper IS, Bravo G (1958b) CHEMOPALLIDECTOMY AND CHEMOTHALAMECTOMY. Journal of Neurosurgery 15:244-250.
Cotzias GC, Papavasi.Ps, Gellene R (1969) MODIFICATION OF PARKINSONISM - CHRONIC TREATMENT WITH L-DOPA. New
England Journal of Medicine 280:337-&.
Cotzias GC, Papavasi.Ps, Fehling C, Kaufman B, Mena I (1970) SIMILARITIES BETWEEN NEUROLOGIC EFFECTS OF L-DOPA
AND OF APOMORPHINE. New England Journal of Medicine 282:31-&.
Cover TM, Thomas JA (1991) Elements of Information Theory. New York: Jon Wiley and Sons, Inc.
Crossman AR (1989) NEURAL MECHANISMS IN DISORDERS OF MOVEMENT. Comparative Biochemistry and Physiology a-
Physiology 93:141-149.
Cruz AV, Mallet N, Magill PJ, Brown P, Averbeck BB (2009) Effects of dopamine depletion on network entropy in the external globus pallidus. J Neurophysiol 102:1092-1102.
Cruz AV, Mallet N, Magill PJ, Brown P, Averbeck BB (2011) Effects of dopamine depletion on information flow between the subthalamic
nucleus and external globus pallidus. Journal of Neurophysiology 106:2012-2023.
Darbin O, Soares J, Wichmann T (2006) Nonlinear analysis of discharge patterns in monkey basal ganglia. Brain Research 1118:84-93.
De Jong H (1926) Action-tremor. Journal of Nervous and Mental Disease 64:1-11.
de Ruyter van Steveninck RR, Lewen GD, Strong SP, Koberle R, Bialek W (1997) Reproducibility and variability in neural spike trains. Science (New York, NY) 275:1805-1808.
de Solages C, Szapiro G, Brunel N, Hakim V, Isope P, Buisseret P, Rousseau C, Barbour B, Lena C (2008) High-frequency organization
and synchrony of activity in the purkinje cell layer of the cerebellum. Neuron 58:775-788.
Degos B, Deniau JM, Chavez M, Maurice N (2009) Chronic but not acute dopaminergic transmission interruption promotes a progressive
increase in cortical beta frequency synchronization: relationships to vigilance state and akinesia. Cereb Cortex 19:1616-1630.
Delong MR (1971) ACTIVITY OF PALLIDAL NEURONS DURING MOVEMENT. Journal of Neurophysiology 34:414-&.
DeLong MR (1990) Primate models of movement disorders of basal ganglia origin. Trends Neurosci 13:281-285.
Delong MR (1990) PRIMATE MODELS OF MOVEMENT-DISORDERS OF BASAL GANGLIA ORIGIN. Trends in Neurosciences
13:281-285.
Delong MR, Crutcher MD, Georgopoulos AP (1985) PRIMATE GLOBUS PALLIDUS AND SUBTHALAMIC NUCLEUS -
FUNCTIONAL-ORGANIZATION. J Neurophysiol 53:530-543.
Deniau JM, Chevalier G (1992) THE LAMELLAR ORGANIZATION OF THE RAT SUBSTANTIA-NIGRA PARS RETICULATA -
DISTRIBUTION OF PROJECTION NEURONS. Neuroscience 46:361-377.
Deuschl G et al. (2006) A randomized trial of deep-brain stimulation for Parkinson's disease. New England Journal of Medicine 355:896-908.
Djamshidian A, Jha A, O'Sullivan SS, Silveira-Moriyama L, Jacobson C, Brown P, Lees A, Averbeck BB (2010) Risk and Learning in
Impulsive and Nonimpulsive Patients With Parkinson's Disease. Movement Disorders 25:2203-2210.
Dorval AD, Kuncel AM, Birdno MJ, Turner DA, Grill WM (2010) Deep Brain Stimulation Alleviates Parkinsonian Bradykinesia by
Regularizing Pallidal Activity. Journal of Neurophysiology 104:911-921.
Dorval AD, Russo GS, Hashimoto T, Xu W, Grill WM, Vitek JL (2008) Deep Brain Stimulation Reduces Neuronal Entropy in the MPTP-Primate Model of Parkinson's Disease. Journal of Neurophysiology 100:2807-2818.
Dostrovsky JO, Lozano AM (2002) Mechanisms of deep brain stimulation. Movement Disorders 17:S63-S68.
Doyle LM, Kuhn AA, Hariz M, Kupsch A, Schneider GH, Brown P (2005) Levodopa-induced modulation of subthalamic beta oscillations during self-paced movements in patients with Parkinson's disease. Eur J Neurosci 21:1403-1412.
Duda RO, Hart PE, Stork DG (2001) Pattern Classification, 2 Edition. New York: John Wiley and Sons.

154
Efron B, Tibshirani R (1998) An introduction to the Bootstrap. New York: Chapman and Hall.
Ermentrout GB, Chow CC (2002) Modeling neural oscillations. Physiol Behav 77:629-633.
Eusebio A, Brown P (2009) Synchronisation in the beta frequency-band - The bad boy of parkinsonism or an innocent bystander?
Experimental Neurology 217:1-3.
Eusebio A, Chen CC, Lu CS, Lee ST, Tsai CH, Limousin P, Hariz M, Brown P (2008) Effects of low-frequency stimulation of the subthalamic nucleus on movement in Parkinson's disease. Exp Neurol 209:125-130.
Eusebio A, Pogosyan A, Wang S, Averbeck B, Gaynor LD, Cantiniaux S, Witjas T, Limousin P, Azulay JP, Brown P (2009) Resonance in
subthalamo-cortical circuits in Parkinson's disease. Brain 132:2139-2150.
Fearnley JM, Lees AJ (1991) AGING AND PARKINSONS-DISEASE - SUBSTANTIA-NIGRA REGIONAL SELECTIVITY. Brain
114:2283-2301.
Filion M, Tremblay L (1991) ABNORMAL SPONTANEOUS ACTIVITY OF GLOBUS-PALLIDUS NEURONS IN MONKEYS WITH MPTP-INDUCED PARKINSONISM. Brain Research 547:142-151.
Filion M, Tremblay L, Bedard PJ (1991) EFFECTS OF DOPAMINE AGONISTS ON THE SPONTANEOUS ACTIVITY OF GLOBUS-
PALLIDUS NEURONS IN MONKEYS WITH MPTP-INDUCED PARKINSONISM. Brain Research 547:152-161.
Fiser J, Chiu C, Weliky M (2004) Small modulation of ongoing cortical dynamics by sensory input during natural vision. Nature 431:573-
578.
Fix JD (2005) High-Yield Neuroanatomy, 3rd Edition. Philadelphia: Lippincott Williams & Wilkins.
Flaherty AW, Graybiel AM (1991) CORTICOSTRIATAL TRANSFORMATIONS IN THE PRIMATE SOMATOSENSORY SYSTEM -
PROJECTIONS FROM PHYSIOLOGICALLY MAPPED BODY-PART REPRESENTATIONS. J Neurophysiol 66:1249-1263.
Follett KA et al. (2010) Pallidal versus Subthalamic Deep-Brain Stimulation for Parkinson's Disease. New England Journal of Medicine 362:2077-2091.
Forno LS (1996) Neuropathology of Parkinson's disease. Journal of Neuropathology and Experimental Neurology 55:259-272.
Frankel JP, Lees AJ, Kempster PA, Stern GM (1990) SUBCUTANEOUS APOMORPHINE IN THE TREATMENT OF PARKINSONS-
DISEASE. Journal of Neurology Neurosurgery and Psychiatry 53:96-101.
Fujimoto K, Kita H (1993) RESPONSE CHARACTERISTICS OF SUBTHALAMIC NEURONS TO THE STIMULATION OF THE
SENSORIMOTOR CORTEX IN THE RAT. Brain Research 609:185-192.
Garofalo M, Nieus T, Massobrio P, Martinoia S (2009) Evaluation of the Performance of Information Theory-Based Methods and Cross-
Correlation to Estimate the Functional Connectivity in Cortical Networks. Plos One 4.
Gaspar P, Gray F (1984) DEMENTIA IN IDIOPATHIC PARKINSONS-DISEASE - A NEUROPATHOLOGICAL STUDY OF 32
CASES. Acta Neuropathologica 64:43-52.
Georgopoulos AP, Delong MR, Crutcher MD (1983) RELATIONS BETWEEN PARAMETERS OF STEP-TRACKING MOVEMENTS AND SINGLE CELL DISCHARGE IN THE GLOBUS PALLIDUS AND SUBTHALAMIC NUCLEUS OF THE BEHAVING
MONKEY. J Neurosci 3:1586-1598.
Georgopoulos AP, Kalaska JF, Caminiti R, Massey JT (1982) On the relations between the direction of two-dimensional arm movements and cell discharge in primate motor cortex. J Neurosci 2:1527-1537.
Gerfen CR (1992) THE NEOSTRIATAL MOSAIC - MULTIPLE LEVELS OF COMPARTMENTAL ORGANIZATION. Trends in
Neurosciences 15:133-139.
Gerfen CR (2000) Molecular effects of dopamine on striatal-projection pathways. Trends in Neurosciences 23:S64-S70.
Gerfen CR, Engber TM, Mahan LC, Susel Z, Chase TN, Monsma FJ, Sibley DR (1990) D1 AND D2 DOPAMINE RECEPTOR
REGULATED GENE-EXPRESSION OF STRIATONIGRAL AND STRIATOPALLIDAL NEURONS. Science 250:1429-1432.
German DC, Manaye K, Smith WK, Woodward DJ, Saper CB (1989) MIDBRAIN DOPAMINERGIC CELL LOSS IN PARKINSONS-
DISEASE - COMPUTER VISUALIZATION. Annals of Neurology 26:507-514.
German DC, Manaye KF, White CL, Woodward DJ, McIntire DD, Smith WK, Kalaria RN, Mann DMA (1992) DISEASE-SPECIFIC
PATTERNS OF LOCUS-CERULEUS CELL LOSS. Annals of Neurology 32:667-676.

155
Gibb WRG (1986) ANNOTATION - IDIOPATHIC PARKINSONS-DISEASE AND THE LEWY BODY DISORDERS. Neuropathology
and Applied Neurobiology 12:223-234.
Glauber RJ (1963) TIME-DEPENDENT STATISTICS OF ISING MODEL. Journal of Mathematical Physics 4:294-&.
Goldberg JA, Rokni U, Boraud T, Vaadia E, Bergman H (2004) Spike synchronization in the cortex/basal-ganglia networks of Parkinsonian
primates reflects global dynamics of the local field potentials. J Neurosci 24:6003-6010.
Goldberger AL, Mietus JE, Rigney DR, Wood ML, Fortney SM (1994) Effects of head-down bed rest on complex heart-rate-variability -
Response to LBNP testing. Journal of Applied Physiology 77:2863-2869.
Goldman PS, Nauta WJH (1977) INTRICATELY PATTERNED PREFRONTO-CAUDATE PROJECTION IN RHESUS-MONKEY. J Comp Neurol 171:369-385.
Goto S, Hirano A, Matsumoto S (1989) SUBDIVISIONAL INVOLVEMENT OF NIGROSTRIATAL LOOP IN IDIOPATHIC
PARKINSONS-DISEASE AND STRIATONIGRAL DEGENERATION. Annals of Neurology 26:766-770.
Gourevitch B, Eggermont JJ (2007) Evaluating information transfer between auditory cortical neurons. Journal of Neurophysiology
97:2533-2543.
Gradinaru V, Mogri M, Thompson KR, Henderson JM, Deisseroth K (2009) Optical Deconstruction of Parkinsonian Neural Circuitry. Science 324:354-359.
Granata AR, Kitai ST (1989) INTRACELLULAR ANALYSIS OF EXCITATORY SUBTHALAMIC INPUTS TO THE
PEDUNCULOPONTINE NEURONS. Brain Research 488:57-72.
Granata AR, Kitai ST (1991) INHIBITORY SUBSTANTIA-NIGRA INPUTS TO THE PEDUNCULOPONTINE NEURONS.
Experimental Brain Research 86:459-466.
Graybiel AM (1990) NEUROTRANSMITTERS AND NEUROMODULATORS IN THE BASAL GANGLIA. Trends in Neurosciences 13:244-254.
Graybiel AM (1995) Building action repertoires: Memory and learning functions of the basal ganglia. Current Opinion in Neurobiology
5:733-741.
Graybiel AM (1998) The basal ganglia and chunking of action repertoires. Neurobiol Learn Mem 70:119-136.
Grillner S, Hellgren J, Menard A, Saitoh K, Wikstrom MA (2005) Mechanisms for selection of basic motor programs--roles for the striatum
and pallidum. Trends Neurosci 28:364-370.
Guiot G, Brion S (1953) Traitement des mouvements anormaux par la coagulation pallidale - Technique et resultats. Revue Neurologique
89:578-580.
Gurney K, Prescott TJ, Redgrave P (2001) A computational model of action selection in the basal ganglia. I. A new functional anatomy.
Biological Cybernetics 84:401-410.
Hammond C, Bergman H, Brown P (2007) Pathological synchronization in Parkinson's disease: networks, models and treatments. Trends in Neurosciences 30:357-364.
Hammond C, Rouzairedubois B, Feger J, Jackson A, Crossman AR (1983) ANATOMICAL AND ELECTRO-PHYSIOLOGICAL
STUDIES ON THE RECIPROCAL PROJECTIONS BETWEEN THE SUBTHALAMIC NUCLEUS AND NUCLEUS TEGMENTI PEDUNCULOPONTINUS IN THE RAT. Neuroscience 9:41-52.
Hara K, Harris RA (2002) The anesthetic mechanism of urethane: The effects on rotransmitter-gated ion channels. Anesthesia and Analgesia
94:313-318.
Hartman ML, Pincus SM, Johnson ML, Matthews DH, Faunt LM, Vance ML, Thorner MO, Veldhuis JD (1994) Enhanced basal and
disorderly growth-hormone secretion distinguish acromegalic from normal to pulsatile growth hormone release. Journal of
Clinical Investigation 94:1277-1288.
Hartmann-von Monakow K, Akert K, Kunzle H (1978) Projections of the precentral motor cortex and other cortical areas of the frontal lobe
to the subthalamic nucleus in the monkey. Exp Brain Res 33:395-403.
Harvey AC (1993) Time Series Models, 2nd edition Edition: The MIT Press.
Hassani OK, Mouroux M, Feger J (1996) Increased subthalamic neuronal activity after nigral dopaminergic lesion independent of
disinhibition via the globus pallidus. Neuroscience 72:105-115.

156
Hassler R, Riechert T (1954) Indikationen und Lokalisationsmethode der gezielten Hirnoperationen. Nervenarzt 25:441-447.
Hassler R, Mundinger F, Riechert T, editors (1979) Stereotaxis in Parkinson Syndrom. In. Berlin: Springer-Verlag.
Hastie T, Tibshirani RJ, Friedman J (2001) The elements of statistical learning. New York: Springer-Verlag.
Hayase N, Miyashita N, Endo K, Narabayashi H (1998) Neuronal activity in GP and Vim of Parkinsonian patients and clinical changes of
tremor through surgical interventions. Stereotactic and Functional Neurosurgery 71:20-28.
Hazrati LN, Parent A, Mitchell S, Haber SN (1990) EVIDENCE FOR INTERCONNECTIONS BETWEEN THE 2 SEGMENTS OF THE
GLOBUS-PALLIDUS IN PRIMATES - A PHA-L ANTEROGRADE TRACING STUDY. Brain Research 533:171-175.
Hazy TE, Frank MJ, O'Reilly R C (2007) Towards an executive without a homunculus: computational models of the prefrontal cortex/basal ganglia system. Philos Trans R Soc Lond B Biol Sci 362:1601-1613.
Heimer G, Bar-Gad I, Goldberg JA, Bergman H (2002) Dopamine replacement therapy reverses abnormal synchronization of pallidal
neurons in the 1-methyl-4-phenyl-1,2,3,6-tetrahydropyridine primate model of parkinsonism. Journal of Neuroscience 22:7850-7855.
Hellwig B, Haussler S, Lauk M, Guschlbauer B, Koster B, Kristeva-Feige R, Timmer J, Lucking CH (2000) Tremor-correlated cortical
activity detected by electroencephalography. Clinical Neurophysiology 111:806-809.
Hemm S, Wårdell K (2010) Stereotactic implantation of deep brain stimulation electrodes:a review of technical systems, methods and
emerging tools. Med Biol Eng Comput 48:611-624.
Hemsley KM, Farrall EJ, Crocker AD (2002) Dopamine receptors in the subthalamic nucleus are involved in the regulation of muscle tone in the rat. Neuroscience Letters 317:123-126.
Hinrichs H, Heinze HJ, Schoenfeld MA (2006) Causal visual interactions as revealed by an information theoretic measure and fMRI.
Neuroimage 31:1051-1060.
Hirsch E, Graybiel AM, Agid YA (1988) Melanized dopaminergic neurons are differentially susceptible to degeneration in Parkinson's
disease. Nature 334:345-348.
Hoehn M, Yahr M (1969) Evaluation of the long term results of surgical therapy. Edinburgh: E.&S. Livingstone.
Hoehn MM, Yahr MD (1967) PARKINSONISM - ONSET PROGRESSION AND MORTALITY. Neurology 17:427-&.
Holgado AJ, Terry JR, Bogacz R (2010) Conditions for the generation of beta oscillations in the subthalamic nucleus-globus pallidus
network. J Neurosci 30:12340-12352.
Hollerman JR, Grace AA (1992) Subthalamic nucleus cell firing in the 6-OHDA-treated rat: basal activity and response to haloperidol.
Brain Research 590:291-299.
Houk JC, Bastianen C, Fansler D, Fishbach A, Fraser D, Reber PJ, Roy SA, Simo LS (2007) Action selection and refinement in subcortical
loops through basal ganglia and cerebellum. Philos Trans R Soc Lond B Biol Sci 362:1573-1583.
Hu X, Miller C, Vespa P, Bergsneider M (2008) Adaptive computation of approximate entropy and its application in integrative analysis of irregularity of heart rate variability and intracranial pressure signals. Medical Engineering & Physics 30:631-639.
Hudson JL, Vanhorne CG, Stromberg I, Brock S, Clayton J, Masserano J, Hoffer BJ, Gerhardt GA (1993) Correlation of apomorphine-
induced and amphetamine-induced turning with nigrostriatal dopamine content in unilateral 6-hydroxydopamine lesioned rats. Brain Research 626:167-174.
Hughes B (1969) Evaluation of the subthalamic lesion in parkinsonism. Edinburgh: E.&S. Livingstone.
Hurtado JM, Rubchinsky LL, Sigvardt KA (2004) Statistical method for detection of phase-locking episodes in neural oscillations. Journal of Neurophysiology 91:1883-1898.
Hurtado JM, Gray CM, Tamas LB, Sigvardt KA (1999) Dynamics of tremor-related oscillations in the human globus pallidus: A single case
study. Proceedings of the National Academy of Sciences of the United States of America 96:1674-1679.
Hurtado JM, Rubchinsky LL, Sigvardt KA, Wheelock VL, Pappas CTE (2005) Temporal evolution of oscillations and synchrony in
GPi/muscle pairs in Parkinson's disease. Journal of Neurophysiology 93:1569-1584.
Hutchison WD, Levy R, Dostrovsky JO, Lozano AM, Lang AE (1997) Effects of apomorphine on globus pallidus neurons in parkinsonian patients. Annals of Neurology 42:767-775.

157
Hutchison WD, Allan RJ, Opitz H, Levy R, Dostrovsky JO, Lang AE, Lozano AM (1998) Neurophysiological identification of the
subthalamic nucleus in surgery for Parkinson's disease. Annals of Neurology 44:622-628.
Jellinger K (1990) NEW DEVELOPMENTS IN THE PATHOLOGY OF PARKINSONS-DISEASE. Parkinsons Disease : Anatomy,
Pathology, and Therapy 53:1-16.
Joel D, Weiner I (1997) The connections of the primate subthalamic nucleus: Indirect pathways and the open-interconnected scheme of basal ganglia-thalamocortical circuitry. Brain Research Reviews 23:62-78.
Kantz H, Schreiber T (2004) Nonlinear Time Series Analysis. Cambridge: Cambridge University Press.
Kashyap R (1980) Inconsistency of the AIC rule for estimating the order of autoregressive models. Ieee Transactions on Automatic Control 25:996-998.
Kass R, Raftery A (1995) Bayes factors. Journal of the American Statistical Association 90:773-795.
Kawaguchi Y, Wilson CJ, Augood SJ, Emson PC (1995) STRIATAL INTERNEURONS - CHEMICAL, PHYSIOLOGICAL AND MORPHOLOGICAL CHARACTERIZATION. Trends in Neurosciences 18:527-535.
Kelland MD, Soltis RP, Anderson LA, Bergstrom DA, Walters JR (1995) IN-VIVO CHARACTERIZATION OF 2 CELL-TYPES IN THE
RAT GLOBUS-PALLIDUS WHICH HAVE OPPOSITE RESPONSES TO DOPAMINE-RECEPTOR STIMULATION - COMPARISON OF ELECTROPHYSIOLOGICAL PROPERTIES AND RESPONSES TO APOMORPHINE, DIZOCILPINE,
AND KETAMINE ANESTHESIA. Synapse 20:338-350.
Kenet T, Bibitchkov D, Tsodyks M, Grinvald A, Arieli A (2003) Spontaneously emerging cortical representations of visual attributes. Nature 425:954-956.
Kincaid AE, Penney JB, Jr., Young AB, Newman SW (1991) Evidence for a projection from the globus pallidus to the entopeduncular
nucleus in the rat. Neurosci Lett 128:121-125.
Kirik D, Rosenblad C, Bjorklund A (1998) Characterization of behavioral and neurodegenerative changes following partial lesions of the
nigrostriatal dopamine system induced by intrastriatal 6-hydroxydopamine in the rat. Experimental Neurology 152:259-277.
Kish SJ, Shannak K, Hornykiewicz O (1988) UNEVEN PATTERN OF DOPAMINE LOSS IN THE STRIATUM OF PATIENTS WITH IDIOPATHIC PARKINSONS-DISEASE - PATHOPHYSIOLOGIC AND CLINICAL IMPLICATIONS. New England Journal
of Medicine 318:876-880.
Kita H (2007) Globus pallidus external segment. In: GABA and the basal ganglia: from molecules to systems (Tepper JM, Abercrombie ED, Bolam JP, eds), pp 111-133. New York: Elsevier.
Kita H, Kitai ST (1987) EFFERENT PROJECTIONS OF THE SUBTHALAMIC NUCLEUS IN THE RAT - LIGHT AND ELECTRON-MICROSCOPIC ANALYSIS WITH THE PHA-L METHOD. J Comp Neurol 260:435-452.
Kita H, Kitai ST (1991) Intracellular study of rat globus pallidus neurons: membrane properties and responses to neostriatal, subthalamic
and nigral stimulation. Brain Res 564:296-305.
Kita H, Kitai ST (1994) THE MORPHOLOGY OF GLOBUS-PALLIDUS PROJECTION NEURONS IN THE RAT - AN
INTRACELLULAR STAINING STUDY. Brain Research 636:308-319.
Kita H, Chang HT, Kitai ST (1983) Pallidal inputs to subthalamus: intracellular analysis. Brain Res 264:255-265.
Kitai ST, Deniau JM (1981) CORTICAL INPUTS TO THE SUBTHALAMUS - INTRACELLULAR ANALYSIS. Brain Research
214:411-415.
Koblin DD (2002) Urethane: Help or hindrance? Anesthesia and Analgesia 94:241-242.
Kojima J, Yamaji Y, Matsumura M, Nambu A, Inase M, Tokuno H, Takada M, Imai H (1997) Excitotoxic lesions of the pedunculopontine
tegmental nucleus produce contralateral hemiparkinsonism in the monkey. Neuroscience Letters 226:111-114.
Kreiss DS, Mastropietro CW, Rawji SS, Walters JR (1997) The response of subthalamic nucleus neurons to dopamine receptor stimulation in a rodent model of Parkinson's disease. Journal of Neuroscience 17:6807-6819.
Kuhl DE, Minoshima S, Fessler JA, Frey KA, Foster NL, Ficaro EP, Wieland DM, Koeppe RA (1996) In vivo mapping of cholinergic
terminals in normal aging, Alzheimer's disease, and Parkinson's disease. Annals of Neurology 40:399-410.
Kuhn AA, Grosse P, Holtz K, Brown P, Meyer BU, Kupsch A (2004a) Patterns of abnormal motor cortex excitability in atypical
parkinsonian syndromes. Clinical Neurophysiology 115:1786-1795.

158
Kuhn AA, Trottenberg T, Kivi A, Kupsch A, Schneider GH, Brown P (2005) The relationship between local field potential and neuronal
discharge in the subthalamic nucleus of patients with Parkinson's disease. Exp Neurol 194:212-220.
Kuhn AA, Williams D, Kupsch A, Limousin P, Hariz M, Schneider GH, Yarrow K, Brown P (2004b) Event-related beta desynchronization
in human subthalamic nucleus correlates with motor performance. Brain 127:735-746.
Kuhn AA, Tsui A, Aziz T, Ray N, Brucke C, Kupsch A, Schneider GH, Brown P (2009) Pathological synchronisation in the subthalamic nucleus of patients with Parkinson's disease relates to both bradykinesia and rigidity. Experimental Neurology 215:380-387.
Kullback S, Leibler R (1951) On information and sufficiency. Annals of Mathematical Statistics 22:79-86.
Kunzle H (1975) BILATERAL PROJECTIONS FROM PRECENTRAL MOTOR CORTEX TO PUTAMEN AND OTHER PARTS OF BASAL GANGLIA - AUTORADIOGRAPHIC STUDY IN MACACA-FASCICULARIS. Brain Research 88:195-209.
Lafreniere-Roula M, Darbin O, Hutchison WD, Wichmann T, Lozano AM, Dostrovsky JO (2010) Apomorphine reduces subthalamic
neuronal entropy in parkinsonian patients. Experimental Neurology 225:455-458.
Laitinen LV, Bergenheim AT, Hariz MI (1992) LEKSELLS POSTEROVENTRAL PALLIDOTOMY IN THE TREATMENT OF
PARKINSONS-DISEASE. Journal of Neurosurgery 76:53-61.
Lance JW, Schwab RS, Peterson EA (1963) ACTION TREMOR AND COGWHEEL PHENOMENON IN PARKINSONS DISEASE. Brain 86:95-&.
Lee MS, Rinne JO, Marsden CD (2000) The pedunculopontine nucleus: Its role in the genesis of movement disorders. Yonsei Medical
Journal 41:167-184.
Levy R, Ashby P, Hutchison WD, Lang AE, Lozano AM, Dostrovsky JO (2002) Dependence of subthalamic nucleus oscillations on
movement and dopamine in Parkinson's disease. Brain 125:1196-1209.
Lewy FH (1912) Paralysis agitans. Part I: Pathologische Anatomie. Berlin: Springer.
Lewy FH (1913) Zur pathologischen Anatomie der Paralysis agitans. Dtsch Z Nervenheilk 50:50-55.
Lim J, Sanghera MK, Darbin O, Stewart RM, Jankovic J, Simpson R (2010) Nonlinear temporal organization of neuronal discharge in the
basal ganglia of Parkinson's disease patients. Experimental Neurology 224:542-544.
Limousin P, Pollak P, Benazzouz A, Hoffmann D, Broussolle E, Perret JE, Benabid AL (1995) Bilateral subthalamic nucleus stimulation for
severe parkinsons-disease. Movement Disorders 10:672-674.
Liu Y, Postupna N, Falkenberg J, Anderson ME (2008) High frequency deep brain stimulation: What are the therapeutic mechanisms? Neuroscience and Biobehavioral Reviews 32:343-351.
Lizier JT, Heinzle J, Horstmann A, Haynes J-D, Prokopenko M (2011) Multivariate information-theoretic measures reveal directed information structure and task relevant changes in fMRI connectivity. Journal of Computational Neuroscience 30:85-107.
Ljung L (1999) System Identification, Theory for the User, 2 Edition. Upper Saddle River, NJ: Prentice Hall.
Lozano AM, Lang AE, Levy R, Hutchison W, Dostrovsky J (2000) Neuronal recordings in Parkinson's disease Patients with dyskinesias induced by apomorphine. Annals of Neurology 47:S141-S146.
Lozano AM, Lang AE, Galvezjimenez N, Miyasaki J, Duff J, Hutchinson WD, Dostrovsky JO (1995) EFFECT OF GPI PALLIDOTOMY
ON MOTOR FUNCTION IN PARKINSONS-DISEASE. Lancet 346:1383-1387.
Lu S, Chen X, Kanters JK, Solomon IC, Chon KH (2008) Automatic selection of the threshold value r for approximate entropy. Ieee
Transactions on Biomedical Engineering 55:1966-1972.
MacKay DM, McCulloch WS (1952) The limiting information capacity of a neuronal link. Bulletin of Mathematical Biophysics 14:127-135.
Maggi CA, Meli A (1986) SUITABILITY OF URETHANE ANESTHESIA FOR PHYSIOPHARMACOLOGICAL INVESTIGATIONS
IN VARIOUS SYSTEMS .1. GENERAL-CONSIDERATIONS. Experientia 42:109-115.
Magill P, Sharott A, Bolam J, Brown P (2006a) Delayed synchronization of activity in cortex and subthalamic nucleus following cortical
stimulation in the rat. Journal of Physiology-London 574:929-946.
Magill PJ, Bolam JP, Bevan MD (2000) Relationship of activity in the subthalamic nucleus-globus pallidus network to cortical electroencephalogram. Journal of Neuroscience 20:820-833.

159
Magill PJ, Bolam JP, Bevan MD (2001) Dopamine regulates the impact of the cerebral cortex on the subthalamic nucleus-globus pallidus
network. Neuroscience 106:313-330.
Magill PJ, Sharott A, Bevan MD, Brown P, Bolam JP (2004) Synchronous unit activity and local field potentials evoked in the subthalamic
nucleus by cortical stimulation. Journal of Neurophysiology 92:700-714.
Magill PJ, Pogosyan A, Sharott A, Csicsvari J, Bolam JP, Brown P (2006b) Changes in functional connectivity within the rat striatopallidal axis during global brain activation in vivo. Journal of Neuroscience 26:6318-6329.
Mallet N, Le Moine C, Charpier S, Gonon F (2005) Feedforward inhibition of projection neurons by fast-spiking GABA Interneurons in the
rat striatum in vivo. Journal of Neuroscience 25:3857-3869.
Mallet N, Ballion B, Le Moine C, Gonon F (2006) Cortical inputs and GABA interneurons imbalance projection neurons in the striatum of
parkinsonian rats. Journal of Neuroscience 26:3875-3884.
Mallet N, Pogosyan A, Marton LF, Bolam JP, Brown P, Magill PJ (2008a) Parkinsonian beta oscillations in the external globus pallidus and their relationship with subthalamic nucleus activity. J Neurosci 28:14245-14258.
Mallet N, Pogosyan A, Sharott A, Csicsvari J, Bolam JP, Brown P, Magill PJ (2008b) Disrupted dopamine transmission and the emergence
of exaggerated beta oscillations in subthalamic nucleus and cerebral cortex. Journal of Neuroscience 28:4795-4806.
Mana S, Chevalier G (2001) The fine organization of nigro-collicular channels with additional observations of their relationships with
acetylcholinesterase in the rat. Neuroscience 106:357-374.
Manson AJ, Hanagasi H, Turner K, Patsalos PN, Carey P, Ratnaraj N, Lees AJ (2001) Intravenous apomorphine therapy in Parkinson's disease - Clinical and pharmacokinetic observations. Brain 124:331-340.
Marko H (1966) Theory of bidirectional communication and its application to the transmitting of information between men (subjective
information). Kybernetik 3:128-128.
Marko H (1973) Bidirectional communication theory - generalization of information-theory. Ieee Transactions on Communications
CO21:1345-1351.
Marsden CD (1982) The mysterious motor function of the basal ganglia: the Robert Wartenberg Lecture. Neurology 32:514-539.
Marsden CD, Parkes JD (1976) ON-OFF EFFECTS IN PATIENTS WITH PARKINSONS-DISEASE ON CHRONIC LEVODOPA
THERAPY. Lancet 1:292-296.
Marsden CD, Parkes JD (1977) SUCCESS AND PROBLEMS OF LONG-TERM LEVODOPA THERAPY IN PARKINSONS-DISEASE. Lancet 1:345-349.
Marsden CD, Obeso JA (1994) The functions of the basal ganglia and the paradox of stereotaxic surgery in Parkinson's disease. Brain 117 ( Pt 4):877-897.
Marsden JF, Limousin-Dowsey P, Ashby P, Pollak P, Brown P (2001) Subthalamic nucleus, sensorimotor cortex and muscle
interrelationships in Parkinson's disease. Brain 124:378-388.
Masdeu JC, Alampur U, Cavaliere R, Tavoulareas G (1994) ASTASIA AND GAIT FAILURE WITH DAMAGE OF THE
PONTOMESENCEPHALIC LOCOMOTOR REGION. Annals of Neurology 35:619-621.
Massey J (1990) Causality, feedback and directed information. In: Proc. intl. symp. on info. theory and its applications, pp 27-30. Waikiki, Hawaii.
Matsui Y, Kamioka T (1978) CATALEPTIC AND ANTI-CATALEPTIC EFFECTS OF MUSCIMOL AND GABACULINE INJECTED
INTO GLOBUS PALLIDUS AND SUBSTANTIA NIGRA, AND INTERACTIONS WITH HALOPERIDOL OR BENZODIAZEPINES. Naunyn-Schmiedebergs Archives of Pharmacology 305:219-225.
McCarthy M, Moore-Kochlacs C, Gu X, Boyden E, Han X, Kopell N (2011) Striatal origin of the pathologic beta oscillations in Parkinson's
disease. Proceedings of the National Academy of Sciences of the United States of America 108:11620-11625.
McIntyre CC, Savasta M, Walter BL, Vitek JL (2004) How does deep brain stimulation work? Present understanding and future questions.
Journal of Clinical Neurophysiology 21:40-50.
Medina L, Reiner A (1995) NEUROTRANSMITTER ORGANIZATION AND CONNECTIVITY OF THE BASAL GANGLIA IN VERTEBRATES - IMPLICATIONS FOR THE EVOLUTION OF BASAL GANGLIA. Brain Behav Evol 46:235-258.
Mengual E, de las Heras S, Erro E, Lanciego JL, Gimenez-Amaya JM (1999) Thalamic interaction between the input and the output systems
of the basal ganglia. J Chem Neuroanat 16:187-200.

160
Merello M, Balej J, Delfino M, Cammarota A, Betti O, Leiguarda R (1999) Apomorphine induces changes in GPi spontaneous outflow in
patients with Parkinson's disease. Movement Disorders 14:45-49.
Mesulam MM (1990) LARGE-SCALE NEUROCOGNITIVE NETWORKS AND DISTRIBUTED-PROCESSING FOR ATTENTION,
LANGUAGE, AND MEMORY. Annals of Neurology 28:597-613.
Meyers R (1940) Surgical procedure for postencephalitic tremor, with notes on the physiology of premotor fibres. Arch Neurol Psychiat (Chic) 44:455–457.
Meyers R (1942) Surgical interruption of the pallidofugal fibres, Its effect on the syndrome of paralysis agitans and technical considerations
in its application. In, pp 317–325: N.Y. St. J. Med.
Miller WC, Delong MR (1988) PARKINSONIAN SYMPTOMATOLOGY - AN ANATOMICAL AND PHYSIOLOGICAL ANALYSIS.
Annals of the New York Academy of Sciences 515:287-302.
Mink JW (1996) The basal ganglia: focused selection and inhibition of competing motor programs. Prog Neurobiol 50:381-425.
Mink JW (2003) The basal ganglia and involuntary movements - Impaired inhibition of competing motor patterns. Archives of Neurology
60:1365-1368.
Mitchell IJ, Jackson A, Sambrook MA, Crossman AR (1989) THE ROLE OF THE SUBTHALAMIC NUCLEUS IN EXPERIMENTAL CHOREA - EVIDENCE FROM 2-DEOXYGLUCOSE METABOLIC MAPPING AND HORSERADISH-PEROXIDASE
TRACING STUDIES. Brain 112:1533-1548.
Mitchell SJ, Richardson RT, Baker FH, Delong MR (1987) THE PRIMATE GLOBUS-PALLIDUS - NEURONAL-ACTIVITY RELATED TO DIRECTION OF MOVEMENT. Experimental Brain Research 68:491-505.
Montani F, Kohn A, Smith MA, Schultz SR (2007) The role of correlations in direction and contrast coding in the primary visual cortex.
Journal of Neuroscience 27:2338-2348.
Moran A, Bergman H, Israel Z, Bar-Gad I (2008) Subthalamic nucleus functional organization revealed by parkinsonian neuronal
oscillations and synchrony. Brain 131:3395-3409.
Moroni F, Cheney DL, Peralta E, Costa E (1978) OPIATE RECEPTOR AGONISTS AS MODULATORS OF GAMMA-AMINOBUTYRIC ACID TURNOVER IN THE NUCLEUS CAUDATUS, GLOBUS PALLIDUS AND SUBSTANTIA
NIGRA OF THE RAT. Journal of Pharmacology and Experimental Therapeutics 207:870-877.
Mundinge F (1965) Stereotaxic interventions on zona incerta area for treatment of extrapyramidal motor disturbances and their results. Confinia Neurologica 26:222-&.
Nambu A, Tokuno H, Takada M (2002) Functional significance of the cortico-subthalamo-pallidal 'hyperdirect' pathway. Neuroscience Research 43:111-117.
Nambu A, Takada M, Inase M, Tokuno H (1996) Dual somatotopical representations in the primate subthalamic nucleus: Evidence for
ordered but reversed body-map transformations from the primary motor cortex and the supplementary motor area. Journal of Neuroscience 16:2671-2683.
Nambu A, Tokuno H, Inase M, Takada M (1997) Corticosubthalamic input zones from forelimb representations of the dorsal and ventral
divisions of the premotor cortex in the macaque monkey: comparison with the input zones from the primary motor cortex and the supplementary motor area. Neuroscience Letters 239:13-16.
Nambu A, Tokuno H, Hamada I, Kita H, Imanishi M, Akazawa T, Ikeuchi Y, Hasegawa N (2000) Excitatory cortical inputs to pallidal
neurons via the subthalamic nucleus in the monkey. Journal of Neurophysiology 84:289-300.
Nandi D, Aziz TZ, Giladi N, Winter J, Stein JF (2002) Reversal of akinesia in experimental parkinsonism by GABA antagonist
microinjections in the pedunculopontine nucleus. Brain 125:2418-2430.
Narabayashi H (1989) STEREOTAXIC VIM THALAMOTOMY FOR TREATMENT OF TREMOR. European Neurology 29:29-32.
Narabayashi H, Okuma T, Shikiba S (1956) Procaine oil blocking of the globus pallidus. Archives of Neurology and Psychiatry 75:36-48.
Narayanan NS, Kimchi EY, Laubach M (2005) Redundancy and synergy of neuronal ensembles in motor cortex. Journal of Neuroscience
25:4207-4216.
Nauta WJH, Mehler WR (1966) Projections of the lentiform nucleus in the monkey. Brain Res 1:3-42.
Nini A, Feingold A, Slovin H, Bergman H (1995) Neurons in the globus pallidus do not show correlated activity in the normal monkey, but
phase-locked oscillations appear in the MPTP model of parkinsonism. J Neurophysiol 74:1800-1805.

161
Noda T, Oka H (1986) DISTRIBUTION AND MORPHOLOGY OF TEGMENTAL NEURONS RECEIVING NIGRAL INHIBITORY
INPUTS IN THE CAT - AN INTRACELLULAR HRP STUDY. J Comp Neurol 244:254-266.
Nychka D, Ellner S, Gallant A, McCaffrey D (1992) Finding chaos in noisy systems. Journal of the Royal Statistical Society Series B-
Methodological 54:399-426.
Obeso JA, Rodriguez MC, DeLong MR (1997) Basal ganglia pathophysiology - A critical review. Advances in Neurology, Volume 74 74:3-18.
Obeso JA, Olanow CW, Nutt JG (2000) Levodopa motor complications in Parkinson's disease. Trends in Neurosciences 23:S2-S7.
Oertel WH, Mugnaini E (1984) IMMUNOCYTOCHEMICAL STUDIES OF GABAERGIC NEURONS IN RAT BASAL GANGLIA AND THEIR RELATIONS TO OTHER NEURONAL SYSTEMS. Neuroscience Letters 47:233-238.
Okun MS, Fernandez HH, Wu SS, Kirsch-Darrow L, Bowers D, Bova F, Suelter M, Jacobson CE, Wang XP, Gordon CW, Zeilman P,
Romrell J, Martin P, Ward H, Rodriguez RL, Foote KD (2009) Cognition and Mood in Parkinson's Disease in Subthalamic Nucleus versus Globus Pallidus Interna Deep Brain Stimulation: The COMPARE Trial. Annals of Neurology 65:586-595.
Oorschot DE (1996) Total number of neurons in the neostriatal, pallidal, subthalamic, and substantia nigral nuclei of the rat basal ganglia: A
stereological study using the cavalieri and optical disector methods. J Comp Neurol 366:580-599.
Pahapill PA, Lozano AM (2000) The pedunculopontine nucleus and Parkinson's disease. Brain 123:1767-1783.
Pan HS, Walters JR (1988) UNILATERAL LESION OF THE NIGROSTRIATAL PATHWAY DECREASES THE FIRING RATE AND
ALTERS THE FIRING PATTERN OF GLOBUS PALLIDUS NEURONS IN THE RAT. Synapse 2:650-656.
Papoulis A (1991) Probability, Random Variables and Stochastic Processes, 3 Edition. New York: McGraw-Hill Higher Education.
Parent A (1990) EXTRINSIC CONNECTIONS OF THE BASAL GANGLIA. Trends in Neurosciences 13:254-258.
Parent A, De Bellefeuille L (1983) The pallidointralaminar and pallidonigral projections in primate as studied by retrograde double-labeling method. Brain Res 278:11-27.
Parent A, Hazrati LN (1995) Functional anatomy of the basal ganglia. II. The place of subthalamic nucleus and external pallidum in basal
ganglia circuitry. Brain Res Brain Res Rev 20:128-154.
Park C, Worth RM, Rubchinsky LL (2010) Fine Temporal Structure of Beta Oscillations Synchronization in Subthalamic Nucleus in
Parkinson's Disease. Journal of Neurophysiology 103:2707-2716.
Parkinson J (1817) An essay in the shaking palsy.: London: Sherwood, Neely, and Jones.
Pasquereau B, Nadjar A, Arkadir D, Bezard E, Goillandeau M, Bioulac B, Gross CE, Boraud T (2007) Shaping of motor responses by
incentive values through the basal ganglia. J Neurosci 27:1176-1183.
Paulus W, Jellinger K (1991) THE NEUROPATHOLOGIC BASIS OF DIFFERENT CLINICAL SUBGROUPS OF PARKINSONS-
DISEASE. Journal of Neuropathology and Experimental Neurology 50:743-755.
Paxinos G, Watson C (1986) The rat brain in stereotaxic coordinates, 2nd Edition. Sydney: Academic Press.
Perese D, Ulman J, Viola J, Ewing S, Bankiewicz K (1989) A 6-hydroxydopamine-induced selective Parkinsonian rat model. Brain
Research 494:285-293.
Petersen RS, Panzeri S, Diamond ME (2001) Population coding of stimulus location in rat somatosensory cortex. Neuron 32:503-514.
Pietz K, Hagell P, Odin P (1998) Subcutaneous apomorphine in late stage Parkinson's disease: a long term follow up. Journal of Neurology
Neurosurgery and Psychiatry 65:709-716.
Pincus S (1995) Approximate entropy (ApEn) as a complexity measure. Chaos 5:110-117.
Pincus SM (1991) Approximate entropy as a measure of system-complexity. Proceedings of the National Academy of Sciences of the
United States of America 88:2297-2301.
Pincus SM, Goldberger AL (1994) Physiological time-series analysis - what does regularity quantify. American Journal of Physiology 266:H1643-H1656.
Plenz D, Kitai ST (1999) A basal ganglia pacemaker formed by the subthalamic nucleus and external globus pallidus. Nature 400:677-682.

162
Pollak P, Benabid AL, Limousin P, Gervason CL, Jeanneau-Nicolle E (1993a) External and implanted pumps for apomorphine infusion in
Parkinsonism. Acta Neurochirurgica Supplement; Advances in stereotactic and functional neurosurgery 10:48-52.
Pollak P, Benabid AL, Gross C, Gao DM, Laurent A, Benazzouz A, Hoffmann D, Gentil M, Perret J (1993b) EFFECTS OF
SUBTHALAMIC NUCLEUS STIMULATION IN PARKINSONS-DISEASE. Revue Neurologique 149:175-176.
Przedborski S, Levivier M, Jiang H, Ferreira M, Jacksonlewis V, Donaldson D, Togasaki D (1995) Dose-dependent lesions of the dopaminergic nigrostriatal pathway induced by intrastriatal injection of 6-hydroxydopamine. Neuroscience 67:631-647.
Rajput AH, Sitte HH, Rajput A, Fenton ME, Pifl C, Hornykiewicz O (2008) Globus pallidus dopamine and Parkinson motor subtypes -
Clinical and brain biochemical correlation. Neurology 70:1403-1410.
Rascol O, Brooks DJ, Korczyn AD, De Deyn PP, Clarke CE, Lang AE, Study G (2000) A five-year study of the incidence of dyskinesia in
patients with early Parkinson's disease who were treated with ropinirole or levodopa. New England Journal of Medicine
342:1484-1491.
Raz A, Vaadia E, Bergman H (2000) Firing patterns and correlations of spontaneous discharge of pallidal neurons in the normal and the
tremulous 1-methyl-4-phenyl-1,2,3,6-tetrahydropyridine vervet model of parkinsonism. J Neurosci 20:8559-8571.
Raz A, Feingold A, Zelanskaya V, Vaadia E, Bergman H (1996) Neuronal synchronization of tonically active neurons in the striatum of normal and parkinsonian primates. J Neurophysiol 76:2083-2088.
Raz A, Frechter-Mazar V, Feingold A, Abeles M, Vaadia E, Bergman H (2001) Activity of pallidal and striatal tonically active neurons is
correlated in mptp-treated monkeys but not in normal monkeys. J Neurosci 21:RC128.
Redgrave P, Prescott TJ, Gurney K (1999) The basal ganglia: a vertebrate solution to the selection problem? Neuroscience 89:1009-1023.
Reich DS, Mechler F, Victor JD (2001) Formal and attribute-specific information in primary visual cortex. Journal of Neurophysiology
85:305-318.
Renart A, Brunel N, Wang X-J (2004) Mean-field theory of irregularly spiking neuronal populations and working memory in recurent
cortical networks. In: Computational Neuroscience. A Comprehensive Approach (Feng J, ed), pp 431-490. London: Chapman &
Hall.
Richman JS, Moorman JR (2000) Physiological time-series analysis using approximate entropy and sample entropy. American Journal of
Physiology-Heart and Circulatory Physiology 278:H2039-H2049.
Riechert T, Wolf M (1953) Die technische Durchfiihrung yon gezielten Hirnoperationen. Archiv für Psychiatrie und Zeitschrift Neurologie:297-316.
Rieke F, Bodnar DA, Bialek W (1995) Naturalistic stimuli increase the rate and efficiency of information transmission by primary auditory afferents. Proc R Soc Lond B Biol Sci 262:259-265.
Rieke F, Warland D, Ruyter van Steveninck Rd, Bialek W (1997) Spikes: Exploring the Neural Code. Cambridge: MIT Press.
Rinne JO, Rummukainen J, Paljarvi L, Rinne UK (1989) DEMENTIA IN PARKINSONS-DISEASE IS RELATED TO NEURONAL LOSS IN THE MEDIAL SUBSTANTIA NIGRA. Annals of Neurology 26:47-50.
Ruiz PJG et al. (2008) Efficacy of long-term continuous subcutaneous apomorphine infusion in advanced Parkinson's disease with motor
fluctuations: A multicenter study. Movement Disorders 23:1130-1136.
Ruskin DN, Bergstrom DA, Walters JR (1999a) Multisecond oscillations in firing rate in the globus pallidus: Synergistic modulation by D1
and D2 dopamine receptors. Journal of Pharmacology and Experimental Therapeutics 290:1493-1501.
Ruskin DN, Bergstrom DA, Mastropietro CW, Twery MJ, Walters JR (1999b) Dopamine agonist-mediated rotation in rats with unilateral nigrostriatal lesions is not dependent on net inhibitions of rate in basal ganglia output nuclei. Neuroscience 91:935-946.
Ryan LJ, Clark KB (1991) THE ROLE OF THE SUBTHALAMIC NUCLEUS IN THE RESPONSE OF GLOBUS-PALLIDUS NEURONS
TO STIMULATION OF THE PRELIMBIC AND AGRANULAR FRONTAL CORTICES IN RATS. Experimental Brain Research 86:641-651.
Ryan LJ, Clark KB (1992) Alteration of neuronal responses in the subthalamic nucleus following globus pallidus and neostriatal lesions in
rats. Brain Res Bull 29:319-327.
Sabesan S, Good LB, Tsakalis KS, Spanias A, Treiman DM, Iasemidis LD (2009) Information Flow and Application to Epileptogenic Focus
Localization From Intracranial EEG. Ieee Transactions on Neural Systems and Rehabilitation Engineering 17:244-253.
Sauer H, Oertel WH (1994) Progressive degeneration of nigrostriatal dopamine neurons following intrastriatal terminal lesions with 6-hydroxydopamine: A combined retrograde tracing and immunocytochemical study in the rat. Neuroscience 59:401-415.

163
Scatton B, Javoyagid F, Rouquier L, Dubois B, Agid Y (1983) REDUCTION OF CORTICAL DOPAMINE, NORADRENALINE,
SEROTONIN AND THEIR METABOLITES IN PARKINSONS-DISEASE. Brain Research 275:321-328.
Scheel-Kruger J (1983) The GABA receptor and animal behavior. In: The GABA Receptors (Enna SL, ed), pp 215-256. Clifton, N
J: Humana Press.
Schmidt RH, Ingvar M, Lindvall O, Stenevi U, Bjorklund A (1982) Functional-activity of substantia nigra grafts reinnervating the striatum - neurotransmitter metabolism and [C-14]2-deoxy-D-glucose autoradiography. Journal of Neurochemistry 38:737-748.
Schneidman E, Berry MJ, 2nd, Segev R, Bialek W (2006) Weak pairwise correlations imply strongly correlated network states in a neural
population. Nature 440:1007-1012.
Schreiber T (2000) Measuring information transfer. Physical Review Letters 85:461-464.
Schwab RS, Amador LV, Lettvin JY (1951) Apomorphine in Parkinson's disease. Trans Am Neurol Assoc 56:251-253.
Schwarting RKW, Huston JP (1996a) Unilateral 6-hydroxydopamine lesions of meso-striatal dopamine neurons and their physiological sequelae. Progress in Neurobiology 49:215-266.
Schwarting RKW, Huston JP (1996b) The unilateral 6-hydroxydopamine lesion model in behavioral brain research. Analysis of functional
deficits, recovery and treatments. Progress in Neurobiology 50:275-331.
Schwarz G (1978) Estimating dimension of a model. Annals of Statistics 6:461-464.
Selby G (1967) Stereotactic surgery for relief of Parkinson's disease. 2. An analysis of results in a series of 303 patients (413 operations).
Journal of the Neurological Sciences 5:343-&.
Shamir M, Sompolinsky H (2004) Nonlinear Population Codes. Neural Comput 16:1105-1136.
Shannon CE (1948) A MATHEMATICAL THEORY OF COMMUNICATION. Bell System Technical Journal 27:379-423.
Sharott A, Magill PJ, Bolam JP, Brown P (2005a) Directional analysis of coherent oscillatory field potentials in the cerebral cortex and basal ganglia of the rat. Journal of Physiology-London 562:951-963.
Sharott A, Magill PJ, Harnack D, Kupsch A, Meissner W, Brown P (2005b) Dopamine depletion increases the power and coherence of beta-
oscillations in the cerebral cortex and subthalamic nucleus of the awake rat. European Journal of Neuroscience 21:1413-1422.
Shew WL, Yang HD, Yu S, Roy R, Plenz D (2011) Information Capacity and Transmission Are Maximized in Balanced Cortical Networks
with Neuronal Avalanches. Journal of Neuroscience 31:55-63.
Shink E, Bevan MD, Bolam JP, Smith Y (1996) The subthalamic nucleus and the external pallidum: Two tightly interconnected structures that control the output of the basal ganglia in the monkey. Neuroscience 73:335-357.
Shinotoh H (1999) PET study of cholinergic system in the brain. Rinsho Shinkeigaku 39:33-35.
Shlens J, Field GD, Gauthier JL, Grivich MI, Petrusca D, Sher A, Litke AM, Chichilnisky EJ (2006) The structure of multi-neuron firing
patterns in primate retina. Journal of Neuroscience 26:8254-8266.
Siegfried J, Lippitz B (1994) BILATERAL CHRONIC ELECTROSTIMULATION OF VENTROPOSTEROLATERAL PALLIDUM - A NEW THERAPEUTIC APPROACH FOR ALLEVIATING ALL PARKINSONIAN SYMPTOMS. Neurosurgery 35:1126-1129.
Smith Y, Bevan MD, Shink E, Bolam JP (1998) Microcircuitry of the direct and indirect pathways of the basal ganglia. Neuroscience
86:353-387.
Speelman J, editor (1991) Parkinson's disease and stereotaxic surgery: Rodopi.
Spiegel E, Wycis H (1954) Ansotomy in paralysis agitans. Ama Archives of Neurology and Psychiatry 71:598-614.
Stefani A, Bassi A, Mazzone P, Pierantozzi M, Gattoni G, Altibrandi MG, Giacomini P, Peppe A, Bernardi G, Stanzione P (2002) Subdyskinetic apomorphine responses in globus pallidus and subthalamus of parkinsonian patients: lack of clear evidence for the
'indirect pathway'. Clinical Neurophysiology 113:91-100.
Steriade M (2000) Corticothalamic resonance, states of vigilance and mentation. Neuroscience 101:243-276.
Stibe CMH, Lees AJ, Kempster PA, Stern GM (1988) SUBCUTANEOUS APOMORPHINE IN PARKINSONIAN ON-OFF
OSCILLATIONS. Lancet 1:403-406.
Strogatz S (1994) Nonlinear Dynamics and Chaos. Cambridge, MA: Westview Press.

164
Strong SP, Koberle R, de Ruyter van Steveninck RR, Bialek W (1998) Entropy and information in neural spike trains. Phys Rev Lett
80:197-200.
Surmeier DJ, Song WJ, Yan Z (1996) Coordinated expression of dopamine receptors in neostriatal medium spiny neurons. J Neurosci
16:6579-6591.
Surmeier DJ, Mercer JN, Chan CS (2005) Autonomous pacemakers in the basal ganglia: who needs excitatory synapses anyway? Curr Opin Neurobiol 15:312-318.
Svennilson E, Torvik A, Lowe R, Leksell L (1960) TREATMENT OF PARKINSONISM BY STEREOTACTIC THERMOLESIONS IN
THE PALLIDAL REGION - A CLINICAL-EVALUATION OF 81 CASES. Acta Psychiatrica Et Neurologica 35:358-377.
Tatikonda S, Mitter S (2009) The Capacity of Channels With Feedback. Ieee Transactions on Information Theory 55:323-349.
Tepper JM, Bolam JP (2004) Functional diversity and specificity of neostriatal interneurons. Curr Opin Neurobiol 14:685-692.
Terman D, Rubin JE, Yew AC, Wilson CJ (2002) Activity patterns in a model for the subthalamopallidal network of the basal ganglia. J Neurosci 22:2963-2976.
Theunissen FE, Miller JP (1991) REPRESENTATION OF SENSORY INFORMATION IN THE CRICKET CERCAL SENSORY
SYSTEM .2. INFORMATION THEORETIC CALCULATION OF SYSTEM ACCURACY AND OPTIMAL TUNING-CURVE WIDTHS OF 4 PRIMARY INTERNEURONS. Journal of Neurophysiology 66:1690-1703.
Truccolo W, Eden UT, Fellows MR, Donoghue JP, Brown EN (2005) A point process framework for relating neural spiking activity to
spiking history, neural ensemble, and extrinsic covariate effects. Journal of Neurophysiology 93:1074-1089.
Tsumori T, Yokota S, Ono K, Yasui Y (2003) Nigrothalamostriatal and nigrothalamocortical pathways via the ventrolateral parafascicular
nucleus. Neuroreport 14:81-86.
Turski L, Havemann U, Kuschinsky K (1984) GABAERGIC MECHANISMS IN MEDIATING MUSCULAR RIGIDITY, CATALEPSY AND POSTURAL ASYMMETRY IN RATS - DIFFERENCES BETWEEN DORSAL AND VENTRAL STRIATUM. Brain
Research 322:49-57.
Ungerstedt U (1968) 6-hydroxydopamine induced degeneration of central monoamine neurons. European Journal of Pharmacology 5:107-&.
Ungerstedt U (1976) 6-HYDROXYDOPAMINE-INDUCED DEGENERATION OF NIGROSTRIATAL DOPAMINE PATHWAY -
TURNING SYNDROME. Pharmacology & Therapeutics Part B-General & Systematic Pharmacology 2:37-40.
Ungerstedt U, Arbuthnott GW (1970) Quantitative recording of rotational behavior in rats after 6-hydroxy-dopamine lesions of the
nigrostriatal dopamine system. Brain Res 24:485-493.
Urrestarazu E, Iriarte J, Alegre M, Clavero P, Rodriguez-Oroz MC, Guridi J, Obeso JA, Artieda J (2009) Beta Activity in the Subthalamic
Nucleus During Sleep in Patients with Parkinson's Disease. Movement Disorders 24:254-260.
Vila M, Perier C, Feger J, Yelnik J, Faucheux B, Ruberg M, Raisman-Vozari R, Agid Y, Hirsch EC (2000) Evolution of changes in neuronal activity in the subthalamic nucleus of rats with unilateral lesion of the substantia nigra assessed by metabolic and
electrophysiological measurements. European Journal of Neuroscience 12:337-344.
Volkmann J, Joliot M, Mogilner A, Ioannides AA, Lado F, Fazzini E, Ribary U, Llinas R (1996) Central motor loop oscillations in parkinsonian resting tremor revealed by magnetoencephalography. Neurology 46:1359-1370.
Wang W, Van Gelder P, Vrijling J (2005) Some issues about the generalization of neural networks for time series prediction. Artificial
Neural Networks: Formal Models and Their Applications - Icann 2005, Pt 2, Proceedings 3697:559-564.
Weaver FM et al. (2009) Bilateral Deep Brain Stimulation vs Best Medical Therapy for Patients With Advanced Parkinson Disease A
Randomized Controlled Trial. Jama-Journal of the American Medical Association 301:63-73.
Webster D (1969) Dynamic evaluation of thalamotomy in Parkinson's disease: analysis of 75 consecutive cases. Edinburgh: E.&S. Livingstone.
Whitehouse PJ, Hedreen JC, White CL, Price DL (1983) BASAL FOREBRAIN NEURONS IN THE DEMENTIA OF PARKINSON
DISEASE. Annals of Neurology 13:243-248.
Wichmann T, Bergman H, Delong MR (1994a) THE PRIMATE SUBTHALAMIC NUCLEUS .3. CHANGES IN MOTOR BEHAVIOR
AND NEURONAL-ACTIVITY IN THE INTERNAL PALLIDUM INDUCED BY SUBTHALAMIC INACTIVATION IN
THE MPTP MODEL OF PARKINSONISM. Journal of Neurophysiology 72:521-530.

165
Wichmann T, Bergman H, Delong MR (1994b) THE PRIMATE SUBTHALAMIC NUCLEUS .1. FUNCTIONAL-PROPERTIES IN
INTACT ANIMALS. Journal of Neurophysiology 72:494-506.
Williams D, Kuhn A, Kupsch A, Tijssen M, van Bruggen G, Speelman H, Hotton G, Yarrow K, Brown P (2003) Behavioural cues are
associated with modulations of synchronous oscillations in the human subthalamic nucleus. Brain 126:1975-1985.
Williams D, Kuhn A, Kupsch A, Tijssen M, van Bruggen G, Speelman H, Hotton G, Loukas C, Brown P (2005) The relationship between oscillatory activity and motor reaction time in the parkinsonian subthalamic nucleus. European Journal of Neuroscience 21:249-
258.
Williams D, Tijssen M, van Bruggen G, Bosch A, Insola A, Di Lazzaro V, Mazzone P, Oliviero A, Quartarone A, Speelman H, Brown P (2002) Dopamine-dependent changes in the functional connectivity between basal ganglia and cerebral cortex in humans. Brain
125:1558-1569.
Wilson CJ (1984) PASSIVE CABLE PROPERTIES OF DENDRITIC SPINES AND SPINY NEURONS. J Neurosci 4:281-297.
Woolsey T, Hanaway J, Gado M (2003) The Brain Atlas: A Visual Guide to the Human Central Nervous System. In, 2nd Edition, p 128.
Hoboken: John Wiley & Sons.
Zetusky WJ, Jankovic J, Pirozzolo FJ (1985) THE HETEROGENEITY OF PARKINSONS-DISEASE - CLINICAL AND PROGNOSTIC IMPLICATIONS. Neurology 35:522-526.
Zhang JY, Russo GS, Mewes K, Rye DB, Vitek JL (2006) Lesions in monkey globus pallidus externus exacerbate parkinsonian symptoms.
Experimental Neurology 199:446-453.