an empirical analysis of the socioeconomic and demographic
TRANSCRIPT

An Empirical Analysis of the Socioeconomic andDemographic characteristics in�uencing BirthCerti�cation in NigeriaUchechi Shirley Anaduaka ( [email protected] )
Research article
Keywords: Birth certi�cation, Early Childhood, Multilevel modeling, DHS, Nigeria
Posted Date: July 30th, 2020
DOI: https://doi.org/10.21203/rs.3.rs-18158/v3
License: This work is licensed under a Creative Commons Attribution 4.0 International License. Read Full License

An Empirical Analysis of the Socioeconomic and Demographic characteristics influencing
Birth Certification in Nigeria
Uchechi Shirley Anaduaka1
Abstract
Background: Promoting birth certification is instrumental to achieving target 16.9 of
the Sustainable Development Goals: legal identity for all by 2030. However, limited
research has investigated the determinants of birth certification of children in the sub-
Saharan African context. This study analyzes the socioeconomic and demographic
factors associated with the birth certification of children under-five years in Nigeria.
Methods: The study employed three rounds of the Nigerian Demographic and Health Survey
involving 79487 children (0-4 years) in Nigeria. Birth certification was defined as whether a
parent/caregiver had a child’s birth certificate at the time of the interview. Ordinary least
squares and multilevel logistic regression models established the relationships between the
socioeconomic and demographic factors and birth certification.
Results: Children under-five years who had a skilled attendant at birth, at least one
vaccination, and maternal access to prenatal visits had about 25.6%, 60.5% and 35.0%
higher odds of having their births certified. Children born to more educated mothers
and fathers had 1.023 and 1.012 times the odds of birth certification. Children from
average and rich households also had 13.2% and 34.2% higher odds of birth
certification, respectively. Conversely, child age, higher birth order, longer birth
intervals, polygyny, having at least two dead siblings, father being employed in a low
skilled job, living far from a registration center and in a poor community are risk
factors for birth certification. Maternal age at birth and paternal has non-linear, albeit
weak effects on birth certification. Being large at birth, bank account ownership were
also significant predictors of birth certification. Mixed effects were noted for religion,
ethnicity and region. Finally, no significant effects were noted for gender, maternal
occupation and rural residence.
Conclusions: The findings identify several socioeconomic and demographic factors
associated with birth certification suggesting possible risks with improving birth
certification in Nigeria. Access to health care and higher socioeconomic backgrounds
are significant protectors of and distance to registration centers as obstacles to birth
certification for children in Nigeria. Public policy strategies should encourage the use
of health care services and also increase the number of registration centers in Nigeria.
Keywords: Birth certification; Socioeconomic and demographic determinants, Early
Childhood; Multilevel modeling; Demographic and health Survey; Nigeria; sub-Saharan
African context
Correspondence: [email protected]; [email protected] 1 Department of Economics, Faculty of Business, Hong Kong Baptist University, The Wing Lung Bank
Building for Business Studies, Shaw Campus, 34 Renfrew Road, Kowloon Tong, Hong Kong.

Background
In the past decade, child protection indicators such as birth registration (BR) have been
incorporated into the development goals agenda [Error! Reference source not found.]. For
instance, target 16.9 of the Sustainable Development Goals (SDG) suggests a legal identity
for all, by 2030. The United Nations Convention on the Rights of the Child (UNCRC) notes
that BR is a child’s ‘first right’ and is critical to improvements in human capital outcomes:
utilization of healthcare services and educational attainment [Error! Reference source not
found.], as it provides the legal ‘membership card’ to participate in the society [Error!
Reference source not found., Error! Reference source not found.]. Without being
registered, a child will be born and die without any trace of their existence documented
officially. This is known as the scandal of invisibility – being unseen, uncountable, and hence
uncounted [5-7]. BR is defined as "the continuous, permanent, and universal recording within
the civil registry, of the occurrence and characteristics of births in accordance with the legal
requirements of a country" [8]. Universal BR is also a public good used to monitor the
progress of development goals and functioning of the rule of law in modern societies [9, 10].
As a proof of BR, registered children are issued a birth certificate, their proof of a legal
identity which ensures that their human rights are not overlooked when violated or abused
[Error! Reference source not found., 11, 12]. This valid proof of age can mitigate long-
term risks, by making it easier to claim rights and/or privileges in the future e.g., formal labor
market participation, civil marriage registration, bank account ownership, owning/inheriting
land and houses, accessing social welfare programs (e.g. scholarships, food-assistance,
insurance and pensions), voting and obtaining a passport for international travel [13-16]. In
some countries, birth certificates are required for enrollment, taking tests and examinations,
scholarship applications as well as graduation for primary and secondary schools [17].
Despite significant improvements in birth registration rates between 2008 and 2018, 57.4% of
Nigerian children under-five years still have their births unregistered and are at risk of

statelessness [18]. Moreover, 53.8% of the registered children lack a birth certificate.2 The
non-documentation rates of births in Nigeria is among highest in the world, and ranks higher
than Sub-Saharan Africa (55%), and West and Central Africa (49%) [19]. To address this
‘scandal of invisibility’, it is important to identify the key drivers of birth registration, and
then implement well-targeted policies. For example, some children may not be registered due
to the low number of BR centers in their community (low supply), while others may be due to
being born into low-income families or poorly educated parents (low demand).
Analyzing which factors drive BR in the developing world is relatively new, as most of the
empirical papers span the past decade, given the poor availability of data before then. With
increased access to data, extant studies have identified some significant socioeconomic and
demographic (SED) characteristics which influence BR rates: gender of the child (Nigeria)
[20]; perinatal health services (Edo, Nigeria; Nusa Tenggara, Indonesia) [21, 22]; mother’s
age at child’s birth (Ghana; Western Australia; Bolivia, Brazil, Colombia, the Dominican
Republic, Peru, and Nicaragua) [23-25]; maternal health-seeking behavior (Bauchi and
Cross-River, Nigeria) [26]; parent’s literacy and education (Lombok, Indonesia; Ghana) [27,
Error! Reference source not found.8]; wealth and parent’s marital status (Indonesia;
Dominican Republic) [5, 29]; and geographical location (Bolivia, the Dominican Republic,
and Peru) [30].
It is important to note that many of the studies exist in a different context, and analyzing
whether these factors play out in Nigeria using a nationally representative dataset makes for
an important contribution. The findings will evidence for policy makers to better understand
2 Birth certification and registration rates may differ for several reasons. First, parents may begin but not
complete the registration process. This may be due to issues with payment of fees. The Nigerian law states that
the birth registration should be free, registration offices can charge penalties for late registration. As no fixed
figures are given by law, the rates could become exorbitant and prevent parents from registration the child.
Another reason is that some mothers may mistake the notification of a live birth, issued at the time of delivery
for the birth certificate. Finally, some parents could have lost or have not picked up the birth certificate and so
could not provide it at the time of the interview. These reasons are currently speculative and would further
research before conclusions are drawn.

the drivers of BR in Nigeria. In addition, none of the studies on Nigeria analyze the SED
characteristics using different waves of the Nigerian Demographic & Health Survey (NDHS)
whilst simultaneously accounting for the hierarchical structure of the data. The present study,
therefore, examined the role of several indicators of socioeconomic and demographic factors
associated with BC for children under-five years using three rounds of the nationally
representative NDHS data. We use BC instead of BR as the outcome variable to reduce the
extent of misreporting and recall bias that is common in survey data.
Study Context
Nigeria is the most populous country south of the Sahara and ranks 7th globally. Presently, it
is divided into six geo-political regions: North-Central (NC), North-East (NE), North-West
(NW), South-East (SE), South-South (SS) and South-West (SW), and 37 administrative
states3. The country is a viable study setting given the low prevalence of BC coupled with
significant variations in SED characteristics.4 Three ethnicities (Hausa/Fulani, Igbo and
Yoruba) dominate the cultural sphere: the Hausa/Fulani people in the north, the Igbo and
Yoruba ethnicities in the SE and SW, respectively. Also, the north and south are divided
across religious lines, with Islam primarily in the north, and Christianity in the south. With
these differences, it is crucial that an effective civil registration and vital statistics system that
provides credible information on vital events from births to deaths (including fetal deaths) is
in place. In Nigeria, this responsibility falls on the National Population Commission (NPC), a
centralized organization established in 1988 and charged with two core responsibilities: to
carry out civil registration and undertake periodic enumeration of the population through
sample surveys and censuses. The legal framework for birth registration is Births, Deaths,
Etc. (Compulsory Registration) Act, No. 69 (14 December 1992).5 Since 2003, following the
3 The 37 administrative states are the 36 states and the Federal Capital Territory (FCT). 4 It also has significant cultural differences with more than 300 ethnic and three main religious groups.
5 See https://data.unicef.org/crvs/nigeria/ for more details on the Compulsory Registration Act.

introduction of the Child Rights Act, parents/guardians were legally obligated to register the
birth of their child within the first 60 days [20].6 Consequently, the NPC set a target of
Universal Birth Registration (100%) by 2015. However as at 2018, this mandate has fallen
below par, as less than 43% of children have their births registered, and only 20.6% have
their births certified [18].
Methods
Sample and Design
This analysis was based on the 2008, 2013 and 2018 rounds of the nationally representative
NDHS data, a repeated cross-sectional standardized survey on demographic and health
characteristics of Nigerian households (HHs).7,8. The eligible HHs are selected using a multi-
stage stratified random cluster sampling technique with considerations for urban and rural
areas. First, clusters are drawn from an official list of enumeration areas (EAs) based on the
2006 census.9 Secondly, HHs are randomly selected from the list of clusters. Finally, every
eligible woman (aged 15-49 years) in the selected HH is interviewed and asked to provide
information on herself, her children and spouse/partner (if available). A total of 80, 899
children had line numbers which allowed for matching to the birth registration information in
the household member recode. The final sample was restricted to children born to mothers
currently or formerly in a union, to allow capture information on mother’s spouse/partner.
Following the sample restrictions, 79,487 children born to 54,446 mothers from 3,171
communities and 37 states during 2008-2018 period were deemed suitable for the analysis.
Measures
Birth certification
7 The data was collected by the Macro International Inc., Calverton, Maryland in cooperation with the U. S.
Agency for International Development (USAID), the NPC, and the Federal Ministry of Health. 8 In the 2018 wave, 40, 427 HHs were successfully interviewed, equivalent to a 99% response rate. The response rates for women was equally high at 99%, as 41,821 women out of 42, 121 who were sampled were successfully interviewed. 9 The household clusters usually correspond to small villages or blocks within larger villages or cities.
Studies have shown that using self-reported variables can introduce bias. For example, [32]
notes that self-reporting bias could underestimate the exact values and thus threaten study
findings. This study, hence, employed BC as a more robust definition of BR. BC was
computed from responses to the following question: ‘Does (NAME) have a birth certificate?’.
The responses were coded as a binary variable categorized as Yes=1 if the child had a birth
certificate and 0, otherwise.
Explanatory variables
The role of 4 categories (child, parent, household and community) of SED characteristics
were considered in the analyses due to their potential effects on BC. The theoretical
framework classifying the SED characteristics are based on the propositions made by [33] to
study child survival. The assumption is that these proximate determinants of child survival
are most likely related to the underlying factors that affect a child’s probability of being
certified.
Child-level characteristics
Seven characteristics were included as measures of the child’s demographic information:
gender (0=female, 1=male), age-in-months, collapsed into five cohorts (1=<12, 2=12-23,
3=24-35, 4=36-47, 5=48-59), birth order (1=1st child, 2=2nd child, 3=3rd child, 4=4th or
higher order birth), size-at-birth (1=small, 2=average, 3=large)10, birth interval (years),
skilled birth attendant (SBA, 0=No, 1=Yes) and vaccination status (0=0, 1=1+).
Parent-level characteristics
At the mother-level, I included her age at birth (collapsed into five cohorts (1=<20 years,
2=20-24, 3=25-29, 4=30-34, 5=35+), prenatal visits (0=0, 1=1+), polygynous (0=No, 1=Yes),
access to mass media (0=No, 1=Yes), whether she is a decision-maker (0=No, 1=Yes)11, and
10The size at birth is a commonly used proxy for the child’s birth weight as the latter is not available for most of the children in the sample. It has been reported as a good measure for the child’s birth weight [34]. 11 This is constructed based on the mother’s self-report that she contributes to decisions made on her health care,
making large HH purchases and visits to family or relatives.

whether she had lost at least two children (0=No, 1=Yes). The current age of the father was
also included in the analysis (collapsed into five cohorts (1=<25 years, 2=25-34, 3=35-44,
4=45-54, 5=55+). In addition to these variables, I included the mother- and father’s education
(years) and occupation (1=low skill, 2=medium skill, 3=high skill, 4=other).12
Household-level characteristics
At the HH level, four variables were employed: Owns a bank account (0=No, 1=Yes), wealth
index (1=poor, 2=average, 3=rich); religion (1=Islam, 2=Christian, 3=other), and ethnicity
(1=Hausa/Fulani13, 2=Igbo, 3=Yoruba, 4=others). Given that NDHS does not collect income
or consumption data, the wealth index is composite measure of the HH’s living standards and
is calculated using data on a HH’s ownership of selected assets [35, 36]. The computed
weights generated using the principal components analysis make more sense as it places HHs
on a continuous relative wealth scale. The HHs are then distributed into one of five quintiles,
ranging from one for the poorest fifth to five for the wealthiest fifth.14
Community and state-level characteristics
The community-level characteristics were measured at the level of the geographic ‘cluster’ of
the HH. At the community (cluster) and state-levels, seven variables were employed: place of
residence (0=urban, 1=rural), distance to registration centers and the nearest major road
(1=<5 kms, 2=5-9.99 kms, 3=10+ kms), altitude (in meters above sea level) (1=low (<316),
2=medium (316-443), 3=high (>443)), mean of female and male education, proportion of
poor HHs, the mean of children who have died in the community, and region of residence
(1=NC, 2=NE, 3=NW, 4=SE, 5=SS, 6=SW). The altitude was categorized as low if the value
was lower than the median, average between the median and the 75th percentile, and high if
12 Collapsing the child’s age, mother’s age at birth and the father’s age into cohorts allows the possibility
of checking the existence of a nonlinear relationship. 13 These ethnicities are grouped on the basis that they speak a common language or dialect, share a
common sense of identity, cohesion and history; or have a single set of customs and behavioral norms e.g. marriage, clothing, diet, and taboos [37].
14 For a detailed discussion on the use of asset indices to capture the wealth status of HHs, see [36]. For a more detailed description on how the wealth index is constructed, see [38].

the value was above the 75th percentile. The distance to the nearest registration center and
road, and the altitude (meters above sea level) are indicators of geographic accessibility.
Methods used for Modelling
First, a univariate analysis using descriptive statistics was employed to describe the
characteristics of sample. Means and standard deviations were used to represent the
categorical and continuous variables, and a two-sample mean-comparison test (ttest) was
used to check the differences between the certified and non-certified groups. Finally, a range
of multivariate analysis using OLS (not reported) and multilevel logistic regression models
(MLRM) were employed to analyze the relationship between the SED characteristics and BC.
The MLRM was employed to account for the binary nature of the outcome variable and the
hierarchical structure of the NDHS data. The children i are clustered within communities j,
and communities within states k. The MLRM also helps prevent misleading conclusions
about the relative importance of the different sampling levels on the child’s BC [39].
Multilevel model Specification
The specific form of the three-level MLRM is presented below: 𝐿𝑜𝑔𝑖𝑡(𝐵𝐶𝑖𝑗𝑘) = log 𝐵𝐶𝑖𝑗𝑘1−𝐵𝐶𝑖𝑗𝑘 = 𝛼𝑗𝑘 + 𝛽𝑋𝑖 + 𝜖𝑖 ; 𝑓𝑜𝑟 𝑖 = 1, … , 𝐼 (4.1) 𝛼𝑗𝑘 = 𝛾0𝑗 + 𝛾𝑘 + 𝜖𝑗 ; 𝑓𝑜𝑟 𝑗 = 1, … , 𝐽, 𝑘 = 1, … , 𝐾 (4.2) 𝛾𝑘 = 𝜆0𝑘 + 𝜆𝑘𝑆𝑘 + 𝜖𝑘 ; 𝑓𝑜𝑟 𝑘 = 1, … , 𝐾 (4.3)
Where BCijk is the probability of BC for child i living in community j within state k, and β is a
vector which contains the estimates for the explanatory variables. 𝛾0𝑗 and 𝛾𝑘 are the
community- and state-level intercepts, each of which is a function of the state-level variable 𝑆𝑘, state-level coefficients 𝜆𝑘, and the state-level intercept 𝜆0𝑘. Finally, i, j and k are the error
terms at the child-, community- and state-levels, respectively. The random intercepts of 𝛾0𝑗
(between communities) and 𝜆0𝑘 (between states) variance is assumed to follow a normal
distribution with mean zero and the covariance matrix for a three-level model. Four models
were fitted: Model 0 (Empty model) was fitted without any explanatory variables to test the
random effects (REs) in the intercept and estimate the intraclass correlation coefficient (ICC)
at the community and state levels. For each additional model, I add a category of indicators
and in Model 4, all the explanatory variables were controlled for. Year-and-month dummies
for the interview and the child’s birth were also included in the additional models, to account
for the differences in lag lengths and potential observed and unobserved heterogeneity in
trends across space and time [40].
The beta (β) estimates are the fixed effects (measures of association) which capture the
overall average relationship between BC and the explanatory variables. They are expressed as
odds ratios (OR) with their 95% credible intervals, and a p-value < 0.05 (two-tailed test) was
considered statistically significant. Moreover, the random effects are the measures of
variation in birth certification across communities and states expressed as ICC, the
proportional change in variance (PCV), and the median odds ratio (MOR). In a MLRM, the
individual (first) level has a standard logistic distribution with variance 𝜋2 3⁄ which
approximates to 3.29.15 The ICC is calculated as [ICC = 𝑉𝑎 + 𝑉𝑏 + 𝜋23 ], where 𝑉𝑎 and 𝑉𝑏 are
the area level variances, respectively.16 It is used to evaluate which neighborhood context is
more relevant in explaining the variation in the outcome variable [39, 41-42]. The larger the
ICC, the lower (higher) the variability is within (between) the areas [39].The PCV which
indicates the additional effects of the included variables is calculated as [PCV = 𝑉𝑒−𝑉𝑚𝑉𝑒 ],
where 𝑉𝑒 is the variance in the empty model and 𝑉𝑚 variance in the successive models.
Finally, the MOR is calculated as [MOR = exp (2𝜎𝜇2𝜙−1(0.75))], where 𝜙−1 is the inverse
cumulative standard normal distribution function. In simple terms, the MOR is the median
odds of being certified when a child moves from an area with a low to an area with a high
15 π denotes the mathematical constant 3.1416 and not the probability. 16 The ICC is calculated based on the widely adopted latent response formulation that assumes a latent continuous
response underlies the observed binary response.

probability of BC. The higher the MOR, the larger the general contextual effect. If the MOR
is equal to 1 (i.e. 𝜎𝜇2 = 0), it implies the absence of a neighborhood variation.
It is important to note that the non-numerical based categorical variables - gender, size-at-
birth, religion, ethnicity, and place of residence - are effect-coded (yield a sum to zero
constraint) for the regressions. In the case of two distinct values (e.g. gender) this will have
values 1 and -1 [43]. When compared to dummy-coded variables, effect-coded variables have
a greater speed of convergence and mixing of sampled parameters in the Markov Chain
Monte Carlo (MCMC) based Bayesian estimation of the multilevel models [44]. For each
model, a burn-in and monitoring chain length of 5,000 and 10,000 iterations are used,
respectively.
Finally, the Bayesian Deviance Information Criterion (DIC) introduced by [45] is used to
compare the goodness-of-fit of the models. The Bayesian DIC suggests a trade-off between
the complexity and deviance of the model. Models with smaller DIC are preferred to models
with higher DIC, and a difference of 5 or more considered substantial. The data was analyzed
using Stata version 14 [46], and normalized sampling weights were included in the model to
adjust for non-responses and ensuring that the findings can be generalized to the general
population [37]. The MLRM with Binomial, Penalized Quasi Likelihood (PQL) of order-2
and MCMC estimation methods [47] were applied using the runmlwin command available in
Stata 14 which allows researchers to combine the best features of Stata for Windows (Stata
Corporation Inc., College Station, TX, USA) and the MLwiN version 3.04 software [48].
Results
Regional- and state-level distribution of birth certification in Nigeria
Table 1 presents the regional- and state-level distributions of BC in Nigeria between 2008 and
2018. Overall, only 16.14% of children have their births certified. At the regional level, the
BC rates range from 11.91% in the NE to 26.84% in the SW. At the state level, the values
range from 2.10% in Zamfara state (NW) to 33.43% in Oyo state (SW). Moreover, 70% of

the top ten states are in the south (Anambra, Edo, Ekiti, Lagos, Nasarawa, Ondo, Osun and
Oyo states). The gap between Zamfara (lowest BC state) and the best-performer was 31.33%.
Among the 10 worst performing states, the North accounts for 80% of the states and the NW
accounts for 40% of the states in the group. Following Zamfara state in order of rank is:
Sokoto (NW, 2.94%), Kebbi (NW, 5.82%), Bayelsa (SS, 6.81%), Niger (NC, 7.66%), Bauchi
(NE, 7.99%), Plateau (NC, 8.84%), Yobe (NE, 9.01%), Jigawa (NW, 9.13%), and Cross-
River (NW, 11.61%). The North-South gap is not surprising as it has been documented in
various studies for a wide range of development outcomes [49-51].
Insert Table 1 here
Socioeconomic and demographic characteristics of participants.
Table 2 shows the characteristics of the 79,487 children included in the analysis. Male and
twin children make-up 51% and 1% of the sample, respectively, and no statistical differences
were noted between the certified and non-certified groups. Among the children whose data
were analyzed, 22% were aged 0-11 months and 19% aged 48-59 months. In terms of the
birth order, it is common knowledge that fertility rates among Nigerian women are higher
than the global average of 2.5 births [52]. This is evident as 49% of children are in the 4th or
higher-order birth order. Furthermore, 15% were small and 43% were large at birth. This
variable is included in the analysis due to the suggestions in the literature that parental
investments can be responsive to the initial child health endowments [53]. In addition, 36%
had a SBA and 63% had at least one vaccination on record. Finally, the mean interval
between births was 2.9 years.
Among the mothers, 11% were adolescents at the time of the child’s birth, 98% were in a
union (married or cohabiting) and 33% were in a polygynous union.17 According to the
WHO, women should be encouraged to have prenatal care visits during pregnancy at: 1) 8-
17 According to UNICEF, young mothers fall into the age category of 15-24, with adolescent mothers aged 15-19
(see https://data.unicef.org/topic/child-health/adolescent-health/ for details).

12; 2) 24-26; 3) 32, and 4) 36-38 weeks, respectively [54]. Prenatal visits are an indicator for
contact with skilled health personnel, as it is assumed that mothers with contact are likely to
receive information on the birth registration process, and thus likely to start and/or complete
the process. Within the sample, 73% mothers had at least one prenatal visit. Moreover, 57%
contribute to decisions made within the HH, 58% also had access to media (TV, radio or
newspaper), and 15% had lost at least two of their children. The fathers in the sample are
older, with 2% aged less than 25 years and 8% in the 55+ category. In this analysis, the
parents’ total years of schooling was used as an indicator for education. Education is very low
with a mean of five and seven years of schooling for the mothers and fathers, respectively.
Given that complete primary education is six years, this implies that most of the mothers have
incomplete primary education and while the fathers just get by completing primary education.
Parental education has been noted in the human capital literature as an important determinant
of child development. More educated parents are more likely to choose better options for
their children, to enhance future economic and social mobility [54]. Furthermore, only a
handful of parents are engaged in high-skilled (professional, technical or managerial) jobs.
For instance, only four percent of mothers and 10% of fathers are employed in high-skilled
jobs. This is not surprising given the low rate of parental education in Nigeria.
On average, 35% of HHs own a bank account which suggests poor access to formal
institutions in Nigeria. 47% are poor, 59% practice Islam and 40% are from the Hausa/Fulani
ethnic group. 68% of HHs live in rural areas and 47% live in poor communities. In addition,
29% (71%) live at least 10 kms from the nearest registration centers (roads). Also, 49% live
in low and 28% in high altitude communities. On average, community average of parental
education ranges from five years (female) to six years (male), and the community mean of
mortality is 0.58 children. The SW region which accounts for the highest birth registration

rates in Nigeria, accounts for 12% of the children within the sample. Finally, the NW which
has the highest number of low BC states accounts for 30% of the sample.
Insert Table 2 here
Multilevel Logistic Regression
The fixed effects (measure of association) for BC are presented in Table 3. In model 1 only
child-level variables were added, and the results revealed that being large at birth, having a
SBA and being vaccinated were significant predictors of BC. In model 2, the family level
characteristics were added. The results showed that prenatal visits, bank account ownership,
being a Christian and from the Yoruba ethnic group was significantly associated with BC. In
addition, the likelihood of BC increases with parental education and the wealth status of the
HH. Moreover, maternal age at birth had a non-linear effect on the likelihood of BC.
After controlling for the child, family and community level characteristics in model 3,
children in the fifth year of life (48-59 months) had 41.6% lower odds of BC [OR= 0.584,
95%CI: 0.439-0.781] as compared to children in their first year of life (<12 months).
Regarding size at birth, children who were large at birth had 8.3% higher [OR= 1.083,
95%CI: 1.037-1.129] odds of BC compared to children who were small at birth. The results
also suggest that birth interval is associated with 0.982 lower [OR=0.982; 95%CI: 0.967-
0.998] odds of BC. Looking at access to health services, children with a SBA were 25.6%
[OR= 1.256, 95%CI: 1.162-1.359]; children who had at least one vaccination were 60.5%
[OR= 1.605, 95%CI: 1.469-1.742] more likely to have their births certified, compared to
those children without a SBA or no vaccinations.
Keeping other variables constant, mothers who were 25-29 years at the time of the child’s
birth had 15.2% higher [OR= 1.152, 95%CI: 0.999-1.349]; mothers who were 30-34 years at
the time of the child’s birth had 16.7% higher [OR= 1.167, 95%CI: 0.999-1.391]; mothers
were 35+ years at the time of the child’s birth had 14.3% higher [OR= 1.143, 95%CI: 0.960-
1.385] odds of BC than mothers were adolescents at the time of their child’s birth. Looking at

mother’s marital status, children whose mothers are separated had 52.9% lower [OR=0.471,
95%CI: 0.310-0.691]; children whose mothers were divorced had 35.4% lower [OR= 0.646,
95%CI: 0.426-0.910], odds of BC as compared to children whose mothers were in a union. A
child whose mother had at least one prenatal visit has 35.0% higher [OR=1.350; 95%CI:
1.221-1.487] odds of BC than those with no prenatal visits. Children born to polygynous
mothers had 5.7% lower [OR=0.943; 95%CI: 0.873-1.015] odds of BC than children born to
monogamous mothers, however the effect is only significant at the 10% level. Having 2 or
more dead siblings reduces the odds of BC by 17.4% [OR=0.826; 95%CI: 0.747-0.914].
The results also revealed that parental education is positively associated with BC, an
additional year of maternal schooling increased the odds of BC by 1.023 times [OR=1.023,
95%CI:1.014-1.031] and paternal schooling increased the odds of BC by 1.012 times
[OR=1.012, 95%CI:1.004-1.020], respectively. Father’s age also has a positive and non-
linear effect on BC, though the effect is significant at the 10% level. Fathers aged 25-34 years
were 23.9% [OR=1.239, 95%CI:0.904-1.587]; fathers aged 35-44 years were 29.8%
[OR=1.298, 95%CI:0.948-1.672]; fathers aged 45-54 years were 26.1% [OR=1.261,
95%CI:0.896-1.646] and those aged 55+ were 25% [OR=1.250, 95%CI:0.879-1.647], more
likely to have their children’s births registered compared to young fathers (<25 years). The
results also revealed that having a father employed in a low-skill job decreases the odds of
BC by 6.5% [OR=0.935, 95%CI:0.879-0.996].
At the household level, the results suggest that having a bank account increases the odds of
BC by 59.6% [OR=1.596, 95%CI:1.483-1.709]. Regarding wealth, children from middle-
income HHs were 13.2% [OR=1.132, 95%CI:1.020-1.253]; children from rich HHs were
34.2% [OR=1.342, 95%CI:1.170-1.514] more likely to have their births certified as
compared to those living in poor HHs. Christian children had 10.6% higher [OR=1.106,
95%CI:0.996-1.215] and children whose families practiced other religions had 12.6% lower

[OR=0.874, 95%CI:0.730-1.037] odds of BC as compared to children whose families
practice Islam. In terms of religion, children from the Yoruba ethnic group have 16.8%
higher [OR=1.168, 95%CI:1.038-1.298]; children from minority ethnic groups had lower
[OR=0.939, 95%CI:0.869-1.016] odds of BC.
The results also revealed that children living at least 10kms from a registration center had
22% lower [OR=0.780, 95%CI:0.649-0.934] odds of BC as compared to children living less
than 5kms from a registration center. In addition, children living at least 10kms from a road
had 27.4% higher [OR=1.274, 95%CI:1.053-1.539] odds of BC as compared to children
living less than 5kms from a road. Keeping other variables constant, children living in poor
communities are 46.5% [OR=0.535, 95%CI:0.391-0.707] less likely to have their births
certified. Also, the higher the number of children who have died in the communities, the
lower the odds of BC [OR=0.771, 95%CI:0.613-0.941]. In addition, the higher the years of
female education [OR=1.020, 95%CI:1.000-1.050] and male education [OR=1.035,
95%CI:1.008-1.065] in the communities, the more likely the odds of BC. Looking at the
region of residence, only the effects of residing in the NE and SS are statistically significant.
Being resident in the NE is associated with 59.5% higher [OR=1.020, 95%CI:1.000-1.050];
and being resident in the SS is associated with 18.9% lower [OR=0.811, 95%CI:0.560-1.071]
odds of BC as compared to the residents of the SW.
Insert Table 3
The random effects (measures of variation) are presented in Table 4. The results of the empty
model showed that there was a statistically significant variability in the odds of BC between
communities (τ=2.580, p-value=0.000) and states (τ=0.436, p-value=0.000). The ICC implied
that 40.91% and 6.92% of the total variance in BC was attributed to differences in
communities and states, respectively. The MOR suggests a five-fold increase in the median
odds of BC, if a child is moved to a community with a higher probability of BC (MOR =

4.63). On the other hand, moving a child from one state to another with a higher probability
of BC, implies approximately a two-fold increase in the median odds of BC (MOR=1.88).
The ICC in Model 1 indicated that, 31.62% and 4.00% of the variation in BC was attributed
to differences across communities and states, respectively. The PCV revealed that 37.29%
(53.90%) of the variance in BC across communities (states) was explained by the child-level
characteristics. The MOR reduced slightly to 3.36 and 1.53 at the community- and state-
levels, respectively. The ICC in Model 2 implied that differences between communities and
states accounted for 26.28% and 2.86% of the variation in BC, respectively. Moreover, the
PCV revealed that 52.75% and 69.95% of the variation in BC between communities and
states was explained by child and family characteristics. After the inclusion of all the SED
variables in Model 3, the variation in the odds of BC between communities (τ=1.198, p-
value=0.000) and states (τ=0.116, p-value=0.000) remained statistically significant. The
estimated ICC indicated that the differences between communities and states accounted for
25.98% and 2.52% of the variation in BC, respectively. The PCV showed that 53.57%
(73.39%) of the variation in BC across communities and states was explained by all the
included variables in model 3. Finally, the MOR is higher than 1, which suggests that the
heterogeneity evident in BC is substantial.
Insert Table 4 here
Discussion
This study was based on data from the 2008, 2013 and 2018 rounds of the Demographic and
Health Survey conducted in Nigeria and employed multiple analytical approaches. The study
has identified several socioeconomic and demographic characteristics associated with birth
certification. The study findings revealed that access to health care services proxied by
having a skilled attendant at birth being vaccination and prenatal visits has a positive
significant influence on birth certification. The positive effects of health access on BR has
been noted elsewhere by [20, 21, Error! Reference source not found., 29]. The possible

explanation could be, children who have contact with health care services have higher
chances of receiving relevant information on the need for and the process of BC. The child’s
size at birth also has a positive influence on BC. A possible explanation for this could be
related to the argument that parents could reinforce cognitive resources, as parents may not
be willing to make significant investments until they are sure they children will survive.
The results also suggested non-linear effects of maternal age at birth on the likelihood of
BC. This implies that the positive effects of the different age variables inflect at some point
and the efforts to register the child’s birth decreases. The non-linear effect of maternal age
has been noted by [21] on birth registration in Nigeria, and by [55, 56] on other child
health indicators in the Democratic Republic of Congo (DRC) and other low-and-middle
income countries, respectively. Younger mothers may have lower socioeconomic status
and schooling and older mothers are more likely to be busy pushing their career ambitions.
Evidence suggests that children whose parents had higher years of schooling were more
likely to be certified. This finding is in line with previous studies conducted on the
determinants of birth registration in Nigeria and elsewhere [20] and [Error! Reference
source not found., 30]. The possible reasoning for this could be, educated parents have
more awareness of the benefits of BC and have greater capabilities to take actions
regarding the process of BC. In addition, wealth has a significant influence on BC. This
finding is supported by a few studies on BR including [Error! Reference source not
found., 5, 20, 25]. The reasoning behind this could be, richer parents are more aware of the
importance of BC on the child’s future mobility (for example, university education,
participation in the formal job market and legal migration abroad). Higher education and
wealth have also been linked to better decision-making as they are in a better position to
earn money and afford the registration services [57, 58]. Paternal age also had a positive
influence on BC which has not been noted elsewhere, however, the weak significance

imply that more research needs to be carried out before causal inference can be drawn on
it.
In this study, bank account ownership was found to be an important predictor on BC, which
has not been noted anywhere else. However, it is not surprising as birth certificates are one of
the requirements for opening a bank account in Nigeria. Mixed results were noted for the
effect of culture (religion and ethnicity) on the likelihood of BC. In terms of religion, on one
hand, children from Christian HHs are more likely whereas those whose family practice other
forms of religion are less likely to be certified. Moreover, children from the Yoruba ethnic
group had higher chances of being certified while those from minority ethnic groups are less
likely to be certified compared to Hausa/Fulani children. Given that the Yoruba ethnic group
are mostly in the South West, the results could be reflecting the fact that the SW has the
highest BC rates over the reviewed period.
Notable deterrents to BC include child’s age, longer birth intervals, marital status, child
mortality, father working in a low skilled job, living far away from the registration center
(10+ kms) and living in a poor community. The findings also revealed that the older children
are less likely to have their births certified than newborn children. This is contrary to the
findings of [20, 23] in Nigeria and Ghana. The probable reason for this is that newborn
children are more likely to be in contact with health institutions (e.g. during post-natal visits
and vaccinations), where their parents can be reminded of the need for BC. Children whose
mothers are separated or divorced are less likely to be certified which has also been noted by
[21, 60] on birth registration in Nigeria. Mothers in a union may have the assistance from a
spouse or partner to care for the child(ren), while they deal with the process of BC. Also, the
documentation on the process of BC in Nigeria states that both parents are needed to be
available for the registration. This could act as a deterrent for non-married mothers to commit
to BC. In addition, the study finds that polygynous children are less likely to be certified.

While this finding has not been noted for BC, it has been suggested in the literature that
polygamy is associated with poor child welfare outcomes as polygynous parents are more
likely to have lower education and socioeconomic status [59].
Mortality had a negative influence on BC. While this is a new finding, it is not surprising
as mothers who higher mortality may be less willing to make the efforts to register any
more children until they are sure that the child will survive and reap any benefits that may
accrue to birth certification. This finding of the negative effect of distance to registration
centers on BC has not been noted elsewhere for Nigeria, however, [5, 29, 30] reports
similar findings for children living in Indonesia and selected countries in Latin America
and the Caribbean. The findings of higher birth order, longer birth intervals and father’s
work status as significant obstacles to BC are also in line with other studies of birth
registration [60-63].
Being of 4th or higher order births also has a negative albeit weak influence on BC. The
effect of birth order remains mixed in the literature on child development, however, a
typical suggestion for the negative effect on BC is related to the delay in the benefits of
birth registration. After the first child is born and is successfully registered and certified,
without immediate returns to the certification it becomes less likely that later-born children
will be registered. Another explanation for the negative effect of birth order lies in the
resource dilution hypothesis. Older children are proxies for larger family size, and in larger
families it is hypothesized the resources spent on caring for children are diluted [64]. In the
case of birth interval, registration in Nigeria is a significant commitment for parents, and
the longer the spacing between children, the less likely parents will make the commitment
towards BC. Despite this, to draw any causal conclusions on the effects of birth order and
birth interval on birth certification, more empirical work needs to be done to account for
unobserved heterogeneities that may occur within-families.

The findings from the random parts of the MLRM has shown a largely significant variance
between communities and states even after adjusting for the characteristics at the child,
parent, HH and community levels. It thus confirms the use of multilevel modeling
techniques. This finding was consistent with the study conducted by [60], and justified by
the existence of differences in coverage, social norms, cultural beliefs, geography, quality
of health services and distribution of registration centers. One can thus conclude that
2.52% of the variation in BC is attributed to differences between states and 25.98% to
differences between communities nested within the states.
Strengths and Limitations
To the best of my knowledge, this paper counts among the first studies highlighting the
determinants of BC for Nigerian children. The wide range of variables employed in the
analyses allows a true depiction of the SED characteristics associated with BC for children
under-five years in Nigeria, and it is one of the few to carry out such large-scale
investigation on the predictors of BC in the sub-Saharan African context. The study has
numerous strengths. First, the study uses the NDHS data, the largest nationally
representative and repeated cross-sectional data samples available for Nigeria. The pooled
NDHS sample provides substantial heterogeneity within and between communities to
analyze the association between the SED characteristics and BC. Given the comparable
nature of the data, these findings could be tested in and generalized to other developing
countries for whom data is available. Second, the study utilized different empirical
methods including the multilevel logistic regression modeling to accommodate the
hierarchical nature of the NDHS data and the binary nature of the outcome variable. The
nested data structure corrects for bias on the parameter estimates as it explicitly models and
uncovers heterogeneity in covariates effects [44]. Third, the pooled data and empirical
techniques permit going beyond the analyses of [56] who used the BR variable which can

be prone to bias when retrospective information is collection. The study also goes beyond
the findings of [Error! Reference source not found., Error! Reference source not
found., 62], who carried out small-scale studies on BR in Nigeria. Fourth, this study
includes variables to measure geographical accessibility as one of the factors that can affect
the child’s BC status. According to [30], “accessibility to birth registration centers is
influenced by the location, terrain, and infrastructure. The greater the distance to the
registration center, the higher the financial and opportunity costs for the family, and the
lower the likelihood of birth registration and certification.” Previous attempts do not
incorporate the supply-side constraints (e.g. distance to the nearest registration center) that
may affect the probability of certification.
Despite the above strengths, the study has some limitations. First, the NDHS data is cross-
sectional which makes it difficult to track the children over time to confirm their
certification status nor draw causal inference on the estimates. To verify the validity of the
observed associations within the study and make causal claims, the SED variables (child
vs. family vs. community) need to be unpacked by using longitudinal data or instrumental
variable techniques. Second, the data does not precisely state whether the children were
born in the location where they were surveyed. In the absence of information on migration,
this is the basis exploited for the geographical variation to study the factors associated with
birth registration. Further studies can incorporate the effect of internal migration on BC
outcomes. Third, the data does not provide information on the exact timing of the
registration. Hence, discussion on whether the child was registered on time is outside the
scope of this study. It is important that future DHS studies include the age at birth
registration to help improve the research by ascertaining the true impact of age on birth
registration. Furthermore, the spatial data used to construct the accessibility to registration

centers are de-identified to ensure confidentiality of the respondents. Future studies should
employ longitudinal analysis to allow for a stronger generalization of the findings.
Conclusion
This study has provided significant insights into the role of socioeconomic and
demographic factors on the birth certification status of children under-five years in a large
sub-Saharan and middle-income country-Nigeria. Several SED characteristics were found
to have significant influence on BC in Nigeria. The setting of Nigeria is particularly
important for a study of this nature, as the country ranks high in child population, coupled
with the high prevalence of poverty and low parental education (key measures of
socioeconomic status). In addition to this, the inequality in land size across the nation also
has interesting effects on the access to public facilities, which in turn has significant
implications to the utilization of the public services. The results highlight the crucial roles
played by health service utilization, socioeconomic status and accessibility to registration
services. This information is extremely important to the government (e.g. the NPC), local
and multinational organizations interested in improving birth registration and certification
rates in Nigeria. To reduce the inequalities due to accessibility, it is important to increase
the number of registration centers and reduce the distance parents must travel to register
and certify their children’s births. This would need strong political will and concerted
efforts from the Nigerian government in the form of administrative support and funding
systems. Additionally, the study findings suggest that children are less likely to have their
births registered and certified as they near school going age (6 years). This goes against the
mandate of the 2003 Child Rights Act. One way would be to integrate birth registration
into schools or non-formal institutions (religious and community organizations), so that
parents are aware of the process and benefits, or help mitigate distance-related barriers. I
suggest the design and implementation of well targeted birth registration and health
programs in order to ensure children are registered and certified on time. Ensuring this,

will be valuable to achieving target of universal birth registration by 2030. Another
suggestion is to ensure a holistic national child policy, which comprises all child
development factors - health, education and protection that are necessary to ensure that
children survive and thrive in adulthood. Furthermore, to include children of poor and
uneducated parents, free registration can be introduced to ensure that parents begin and
complete the birth registration for the children, and on time too. Finally, for a
comprehensive policy to be enacted, it is important that future studies conduct a causal
investigation for each of the significant factors found in this study.
List of abbreviations
BC: Birth Certification; BR: Birth registration; DIC: Deviance Information Criterion; HH:
Household; ICC: Intraclass Correlation Coefficient; MCMC: Markov Chain Monte Carlo;
MLRM: Multilevel Logistic Regression Model; MOR: Median Odds Ratio; NC: North-
Central; NDHS; Nigerian Demographic & Health Survey; NE: North-East; NPC: National
Population Commission; NW: North-West; OLS: Ordinary Least Squares; OR: Odds Ratio;
PCV: Proportional Change in Variance; PQL: Penalized Quasi Likelihood; RE: Random
Effects; SBA: Skilled Birth Attendant; SDG: Sustainable Development Goals; SE: South-
East; SED: Socioeconomic and Demographic; SS: South-South; SW: South-West; UNCRC:
United Nations Convention on the Rights of the Child.
Declarations
Ethics approval and consent to participate
The author was granted approval from the DHS Review Board, ORC Macro Inc to obtain
and use the collected data for analysis. All the respondent identifiers were removed prior to
the author downloading and using the data.
Consent for publication
Not applicable
Availability of data and materials
The dataset analyzed during the current study are available in the DHS data repository,
https://www.dhsprogram.com/data/dataset_admin/index.cfm.
Competing interests
The author declares no competing interests.
Funding
The research presented in this study was part of a doctoral research program in Lingnan
University funded by the Research Grants Council (RGC) of the Hong Kong PhD Fellowship
Scheme 2016 [grant number PF15-11891]. The RGC provided monthly stipends which
enabled me study in the Department of Economics. They played no role in the design of the
study and collection, analysis, and interpretation of data and in writing the final manuscript.
Authors’ contribution
USA analyzed and interpreted the data. USA also read and approved the final manuscript.
Acknowledgments
I acknowledge the MEASURE-DHS program who made the data publicly available for non-
commercial use. I also thank the doctoral research supervisors, Professor LIN Ping and
Associate Professor WONG Ho Lun (Alex) of Lingnan University for their useful comments
and suggestions during the development and completion of the research project. I also thank
all those who contributed in one way or another in getting the article published.
References
1. United Nations Children’s Fund. Strengthening birth registration in Africa:
Opportunities and partnerships. New York: United Nations Children’s Fund; 2010. Retrieved from https://www.unicef.org/esaro/Technical_paper_low_res_.pdf
2. United Nations Children’s Fund. The ‘Rights’ Start to Life: Statistical Analysis of Birth
Registration. New York: United Nations Children’s Fund; 2005. Retrieved from https://www.unicef.org/protection/BirthReg10a_rev.pdf.
3. Jeong J, Bhatia A, & Fink G. Associations between birth registration and early child
growth and development: Evidence from 31 low- and middle-income countries. BMC
Public Health. 2018; 18(673):1-8. DOI: 10.1186/s12889-018-5598-z.
4. United Nations Children’s Fund. Briefing note No. 15. New York: United Nations Children’s Fund; 2015. Retrieved from https:// data.unicef.org/SDG-briefing-note-
15_birth-registration. Accessed 22 January 2019.
5. Duff P, Kusumaningrum S, & Stark L. Barriers to birth registration in Indonesia
[Correspondence]. The Lancet. 2016;4:e234-e235. Retrieved from: from
https://doi.org/ 10.1016/S2214-109X(15)00321-6. Accessed 10 Jul 2018.
6. Setel PW, Macfarlane SB, Szreter, S, Mikkelsen L, Jha P, Stout S, & AbouZahr C. A
scandal of invisibility: making everyone count by counting everyone. The Lancet.
2007. Retrieved from https://doi.org/ 10.1016/S0140-6736(07)61307-5. Accessed 22
Jan 2019.
7. Setel PW, Macfarlane SB, Szreter S, Mikkelsen L, Jha P, Stout S, & AbouZahr C. Who
Counts? 1. The Lancet. 2007. Retrieved from https://www.who.int/ health
info/statistics/WhoCounts1.pdf. Accessed 22 Jan 2019.
8. United Nations Children’s Fund. Every child’s birthright: Inequities and trends in birth registration. New York: United Nations Children’s Fund; 2013. Retrieved from https: //
www.un.org/ruleoflaw/files/Embargoed_11_Dec_Birth_Registration_report_low_
res.pdf. Accessed 9 July 2018.
9. Garenne M, Collinson MA, Kabudula CW, Gomez-Olive FX, Kahn K, & Tollman S.
Improving completeness of birth and death registration in rural Africa. The Lancet.
Global Health. 2016;4(9):e604-5. Retrieved from https://doi.org/10.1016/S2214-
109X(16)30146-2.
10. Garenne M, Collinson MA, Kabudula CW, Gomez-Olive FX, Kahn K, & Tollman S.
Completeness of birth and death registration in a rural area of South Africa: the
Agincourt health and demographic surveillance, 1992-2014. Global Health Action.
2016:9(1):32795. https://doi.org/10.3402/gha.v9.32795.
11. Giang KB, Oh J, Kien VD, Hoat LN, Choi S, Lee CO, & Minh HV. Changes and
inequalities in early birth registration and childhood care and education in Vietnam:
findings from the Multiple Indicator Cluster Surveys, 2006 and 2011. [Special Issue:

Millennium Development Goals in Vietnam: the Progress and Social Determinants].
Global Health Action. 2016;9(1). https://doi.org/10.1016/10.3402/gha.v9.29470.
12. Szreter S. The right of registration: Development, identity registration, and social
security - a historical perspective. World Development. 2006;35(1).
https://doi.org/10.1016/10.1016/j.worlddev.2006.09.004.
13. United Nations Children’s Fund – Innocenti Research Centre (2002). Birth Registration
(Tech. Rep. No. 9). UNICEF Innocenti Research Centre. Florence: United Nations
Children’s Fund – Innocenti Research Centre; 2002. Retrieved from
https://www.unicef -irc.org/publications/pdf/digest9e.pdf. Accessed 10 Feb 2019.
14. Hunter W. Identity Documents, Welfare Enhancement, and Group Empowerment in
the Global South. The Journal of Development Studies. 2019;155:366-83.
https://doi.org/10.1080/00220388.2018.1451637.
15. Phillips DE, Adair T, & Lopez AD. How useful are registered birth statistics for health
and social policy? A global systematic assessment of the availability and quality of
birth registration data. Population Health Metrics. 2018;16(21):1-13. https://doi.org/
10.1186/ s12963-018-0180-6.
16. AbouZahr C, de Savigny D, Mikkelsen L, Phillip WS, Lozano R, Nichols E, Notzon F,
Lopez AD. Civil registration and vital statistics: progress in the data revolution for
counting and accountability [Series]. The Lancet. 2015;386:1373-1385.
http://dx.doi.org/10.1016/S0140-6736(15)60173-8.
17. Brito S, Corbacho A, & Osorio R. Birth Registration: The Key to Social Inclusion in
Latin America and the Caribbean (Report). Inter-American Development Bank; 2003.
Retrieved from https://publications.iadb.org/publications/ english/document/Birth-
Registration-The-Key-to-Social-Inclusion-in-Latin-America-and-the-Caribbean.pdf.
18. National Population Commission - NPC/Nigeria and ICF. Nigeria Demographic and
Health Survey 2018 [Dataset]. NPC and ICF. Abuja, Nigeria, and Rockville, Maryland,
USA: National Population Commission and ICF International, Inc; 2008-2018.
19. Wilson M. Mapping Access to Birth Registration and Updates from Tanzania. GSM
Association (GSMA); 2017. Retrieved from https://www.gsma.com/mobilefor
development/programme/digital-identity/mapping-access-birth-registration-updates-
tanzania. Accessed 18 Aug 2018.
20. Makinde OA, Olapeju B, Ogbuoji O, & Babalola S. Trends in the completeness of birth
registration in Nigeria: 2002-2010. Journal of Demographic Research. 2016;35(12),
315-338. Retrieved from https://doi.org/10.1016/10.4054/DemRes.2016.35.12.
21. Isara AR, & Atimati AO. Socio-demographic determinants of birth registration among
mothers in an urban community in southern Nigeria. Journal of Medicine in the
Tropics. 2015;17(1):16-21. Retrieved from http://www.jmedtropics.org/temp/JMed
Trop17116-3505407_094414.pdf. Accessed 23 November 2018.
22. Jackson M, Duff P, Kusumanigrum S, & Stark L. Thriving beyond survival:
Understanding utilization of perinatal health services as predictors of birth registration:
A cross-sectional study. BMC International Health and Human Rights. 2014;14(306).
DOI: 10.1186/s12914-014-0038-3.
23. Dake FAA, & Fuseini K. Registered or unregistered? levels and differentials in
registration and certification of births in Ghana. BMC International Health and Human
Rights. 2018;18(25). Retrieved from https://bmcinthealthhumrights
.biomedcentral.com/articles/10.1186/s12914-018-0163-5. Accessed 26 July 2018.
24. Gibberd AJ, Simpson JM, & Eades SJ. No official identity: a data linkage study of
birth registration of Aboriginal children in Western Australia. Australian and New
Zealand Journal of Public Health. 2016;40(4):388-394. Retrieved from
https://doi.org/10.1111/1753-6405.12548. Accessed 9 Nov 2018.

25. Duryea S, Olgiati A, & Stone L. The Under-Registration of Births in Latin America
(Working Paper No. 551). Washington, DC: Inter-American Development Bank; 2006.
Retrieved from https://www.econstor.eu/bitstream/10419/88088/1/idb-wp_551.pdf.
26. Adi AE, Abdu T, Amir K, Rashid, MH, Ebri, UE, Cockcroft A, & Andersson, N.
Understanding whose births get registered: a cross-sectional study in Bauchi and Cross
River states, Nigeria. BMC Research Notes. 2015;8(79).
https://doi.org/10.1186/s13104-015-1026-y.
27. Butt L, & Ball J. Strategic actions of transnational migrant parents regarding birth
registration for stay-behind children in Lombok, Indonesia: Birth registration and stay-
behind children. Population, Space and Place. 2018;25(1):e2152. Retrieved from
https://doi.org/10.1002/psp.2152.
28. Amo-Adjei J, & Annim SK. Socio-Economic determinants of birth registration in
Ghana. BMC International Health and Human Rights. 2015;15(14):1-9. DOI:
https://dx.doi.org/10.1186%2Fs12914-015-0053-z. Accessed 22 Jun 2018
29. Corbacho A, Brito S, & Osorio Rivas R. Birth registration and the impact on
educational attainment. In (p. 1-31). Inter-American Development Bank; 2012
Retrieved from https://www.dartmouth.edu/neudc2012/docs/paper_109.pdf. Accessed
15 Sep 2018.
30. Corbacho A, & Osorio Rivas R. Travelling the distance: A GPS-based study of the
access to birth registration services in Latin America and the Caribbean. IDB Working
Paper Series IDB-WP-307. 2012. Retrieved from http://hdl.handle.net/10419/88998.
Accessed 12 Aug 2018.
31. National Population Commission - NPC/Nigeria and ICF. Nigeria Demographic and
Health Survey 2018 (Final Report No. FR359). NPC and ICF. Abuja, Nigeria, and
Rockville, Maryland, USA: National Population Commission and ICF International,
Inc; 2019. Retrieved from https://dhsprogram.com/pubs/pdf/FR359/FR359.pdf.
32. Althubaiti A. Information bias in health research: definition, pitfalls, and adjustment
methods. Journal of Multidisciplinary Healthcare. 2016;9:211-217.
https://doi.org/10.2147/JMDH.S104807.
33. Mosley, WH, & Chen, L. C. An Analytical Framework for the Study of Child Survival
in Developing Countries. Population and Development Review. 1984;10:25-45.
https://doi.org/10.2307/2807954.
34. McGovern, ME. How much does Birth Weight Matter for Child Health in Developing
Countries? (Working Paper). 2016. Retrieved from https://scholar.harvard.edu/
files/mcgovern/files/mark_mcgovern/birth_weight_may.pdf. Accessed 9 Dec 2017.
35. Filmer D, & Pritchett LH. Estimating Wealth Effects without Expenditure Data-or
Tears: An Application to Educational Enrollments in States of India. Demography.
2001;38(1):115-132. Retrieved from https://www.ncbi.nlm.nih.gov/pubmed/11227840.
Accessed 13 Jun 2018.
36. Filmer D, & Scott K. Assessing asset indices. Demography. 2012;49:359-392.
https://doi.org/10.1007/s13524-011-0077-5.
37. Antai D. Inequitable childhood immunization uptake in Nigeria: a multilevel analysis
of individual and contextual determinants. BMC Infectious Diseases. 2009;9(181);1-
10. Retrieved from: http://www.biomedcentral.com/1471-2334/9/181.
38. Rutstein S, & Johnson K. The DHS Wealth Index (DHS Comparative Reports No. 6).
2004. Retrieved from: https://dhsprogram.com/publications/ publication-cr6-
comparative-reports.cfm. Accessed 23 Jan 2017.
39. Merlo J, Yang M, Chaix B, Lynch J, & Rastam L. A brief conceptual tutorial on
multilevel analysis in social epidemiology: investigating contextual phenomena in

different groups of people. Journal of Epidemiology & Community Health. 2005;59(9):
729-736. http://doi.org/10.1136/ jech.2004.023929.
40. Smith T, & Shively G. Multilevel analysis of individual, household, and community
factors influencing child growth in Nepal. BMC Pediatrics. 2019;19(91):1-14.
https://doi.org/ 10.1186/s12887-019-1469-8.
41. Merlo J, Chaix B, Ohlsson H, Beckman A, Johnell K, Hjerpe P, Rastam L, Larsen K. A
brief conceptual tutorial of multilevel analysis in social epidemiology: using measures
of clustering in multilevel logistic regression to investigate contextual phenomena.
Journal of Epidemiology and Community Health. 2006;60:290-297. http://dx.doi.org
/10.1136/jech.2004.029.454.
42. Snijders TAB, & Bosker RJ. Multilevel Analysis: An Introduction to Basic and
Advanced Multilevel Modeling. 2nd ed. Sage Publishers; 2012.
43. Fahrmeir L, Kneib T, Lang S, & Marx B. Regression: Models, methods and
applications. Springer-Verlag; 2013.
44. Harttgen K, Lang S, & Santer J. Multilevel modelling of child mortality in Africa
(Working Papers in Economics and Statistics No. 2015-03). University of Innsbruck;
2015. Retrieved from https://www2.uibk.ac.at/downloads/ c4041030/wpaper/2015-
03.pdf. Accessed 22 Jan 2020.
45. Spiegelhalter DJ, Best NG, Carlin BP, & van der Linde A. Bayesian measures of model
complexity and fit. Journal of the Royal Statistical Society. 2002;64:583-639.
46. StataCorp. Stata Statistical Software: Release 14. College Station, TX: StataCorp LP;
2015.
47. Browne WJ. (2019). MCMC Estimation in MLwiN v3.03 [Computer software] Centre
for Multilevel Modelling, University of Bristol, UK.
48. Charlton C, Rasbash J, Browne WJ, Healy M, & Cameron B. (2019). MLwiN Version
3.04. Centre for Multilevel Modelling, University of Bristol, UK.
49. Archibong B. Essays on the impacts of geography and institutions on access to energy
and public infrastructure services (Ph.D. thesis, Columbia University, New York,
USA). 2015. Retrieved from https://academiccommons.columbia.edu/catalog/ac:
186998.
50. Babalola S, & Oyenubi O. Factors explaining the North-South differentials in
contraceptive use in Nigeria: A nonlinear decomposition analysis. Demographic
Research. 2018;38(12):287-308. Retrieved from https://www.demographic-
research.org/ Volumes/Vol38/12/ DOI: 10.4054/DemRes.2018.38.12. Accessed 13 Jun
2018.
51. Ecker O, Hatzenbuehler PL, & Mahrt K. Transforming Agriculture for Improving Food
and Nutrition Security among Nigerian Farm Households (Working Paper No. 56).
Washington, DC: IFPRI; 2018. Retrieved from
https://www.ifpri.org/publication/transforming-agriculture-improving-food-and-
nutrition-security-among-nigerian-farm.
52. Roser M. Fertility rate. Our World in Data. 2020. Retrieved from https://ourworldin
data.org/fertility-rate
53. Cunha F, & Heckman, JJ. The Technology of Skill Formation. American Economic
Review. 2007;97(2):31-47. https://doi.org/10.1257/aer.97.2.31
54. Guryan J, Hurst E, & Kearney M. Parental Education and Parental Time with Children.
Journal of Economic Perspectives. 2008;22(3):23–46. https://doi.org/10.1257/
jep.22.3.23.
55. Andrew EV, Pell C, Angwin A, Auwun, A, Daniels J, Mueller I, Phuanukoonnon S,
Pool R. Factors affecting attendance at and timing of formal antenatal care: Results
from a qualitative study in Madang, Papua New Guinea. PLoS ONE.
2014;9(5):e93025. https://doi.org/10.1371/journal.pone.0093025.
56. Kandala N, Madungu TP, Emina JBO, Nzita KPD, & Cappuccio FP. Malnutrition
among children under the age of five in the Democratic Republic of Congo (DRC):
does geographic location matter? BMC Public Health. 2011;11:261.
http://www.biomedcentral.com/1471-2458/11/261
57. Fall CHD, Sachdev HS, Osmond C, Restrepo-Mendez MC, Victora C, Martorell R,
Stein AD, Sinha S, Tandon N, Adair L, Bas I, Norris S, & Richter LM. Association
between maternal age at childbirth and child and adult outcomes in the offspring: a
prospective study in five low-income and middle-income countries (COHORTS
collaboration). Lancet Global Health. 2015 Jul;3(7):e341-e422.
https://doi.org/10.1016/S2215-109X(15)00038-8.
58. Hyuncheol BK, Choi S, Kim B, & Pop-Eleches C. The role of education interventions
in improving economic rationality. Science. 2018;362(6410):83.
https://doi.org/10.1126/science.aar6987.
59. Arthi V, & Fenske J. Polygamy and child mortality: Historical and modern evidence
from Nigeria’s Igbo. Review of Economics of the Household. 2018;16:97-14.
Retrieved from https://doi.org/10.1007/s11150-016-9353-x.
60. Garenne M, Collinson MA, Kabudula CW, Gomez-Olive FX, Kahn K, & Tollman S.
Completeness of birth and death registration in a rural area of South Africa: the
Agincourt health and demographic surveillance, 1992-2014. Global Health Action.
2016;9:1:32795. https://doi.org/10.3402/gha.v9.32795Okunlola OA, Olapade EO,
Mathenge GW, & Folorunso SA. Multilevel Analysis on the Determinants of Birth
Registration in Nigeria. Science and Technology Publishing (SCI & TECH). 2017:1:8.
Retrieved from
https://www.researchgate.net/publication/319352552_Multilevel_Analysis_On_The_D
eterminants_Of_Birth_Registration_In_Nigeria.
61. Tobin EA, Obi AI, & Isah EC. Status of birth and death registration and associated
factors in the South-South region of Nigeria. Annals of Nigerian Medicine. 2013;7:1-5.
Retrieved from https://doi.org/10.4103/0331-3131.119979.
62. Mohanty I, & Gebremedhin TA. Maternal autonomy and birth registration in India:
Who gets counted? PLoS ONE. 2018;13(3);1-20. Retrieved from https://doi.org/
10.1371/journal.pone.0194095.
63. Cappa C., Gregson K., Wardlaw T., & Bissell S. Birth registration: a child’s passport to protection. The Lancet. Global Health. 2013;2(2):PE67-E68. http://dx.doi.org/
10.1016/S2214-109X(13)70180-3.
64. Linder PH. Sibling position and achievement. Journal of Human Resources.
1977;12:198-219.

Table 1 Mean birth certification rates and ranking by regions and states in Nigeria
Region Mean
(%)
Region
rank
State Mean
(%)
State
rank
State mean compared
to regional mean1
South-West 26.84 1 Oyo 33.43 1 Higher
North-Central 13.72 4 FCT2 33.04 2 Higher
North-West 13.17 5 Katsina 29.59 3 Higher
South-East 19.96 2 Anambra 29.17 4 Higher
South-West 26.84 1 Lagos 27.83 5 Higher
South-West 26.84 1 Ekiti 27.07 6 Higher
South-West 26.84 1 Osun 24.64 7 Lower
South-South 17.47 3 Edo 23.74 8 Higher
North-Central 13.72 4 Nasarawa 21.49 9 Higher
South-West 26.84 1 Ondo 20.96 10 Lower
North-East 11.91 6 Adamawa 20.82 11 Higher
South-West 26.84 1 Ogun 20.57 12 Lower
South-South 17.47 3 Delta 19.68 13 Higher
North-Central 13.72 4 Kwara 19.45 14 Higher
South-South 17.47 3 Rivers 19.36 15 Higher
North-West 13.17 5 Kaduna 19.03 16 Higher
South-East 19.96 2 Imo 18.93 17 Lower
South-East 19.96 2 Abia 17.03 18 Lower
South-South 17.47 3 Akwa_Ibom 16.97 19 Lower
South-East 19.96 2 Ebonyi 16.92 20 Lower
North-Central 13.72 4 Kogi 16.06 21 Higher
North-East 11.91 6 Gombe 13.26 22 Higher
North-East 11.91 6 Taraba 12.33 23 Higher
South-East 19.96 2 Enugu 12.26 24 Lower
North-East 11.91 6 Borno 12.14 25 Higher
North-Central 13.72 4 Benue 11.88 26 Lower
North-West 13.17 5 Kano 11.65 27 Lower
South-South 17.47 3 Cross_River 11.61 28 Lower
North-West 13.17 5 Jigawa 9.13 29 Lower
North-East 11.91 6 Yobe 9.01 30 Lower
North-Central 13.72 4 Plateau 8.84 31 Lower
North-East 11.91 6 Bauchi 7.99 32 Lower
North-Central 13.72 4 Niger 7.66 33 Lower
South-South 17.47 3 Bayelsa 6.81 34 Lower
North-West 13.17 5 Kebbi 5.82 35 Lower
North-West 13.17 5 Sokoto 2.94 36 Lower
North-West 13.17 5 Zamfara 2.10 37 Lower
NATIONAL 16.14
Notes: Author's computation from the NDHS dataset (2008-2018). 1The mean rates are ranked at the
regional and state levels, respectively. 2FCT: Federal Capital Territory

Table 2 Participant characteristics (N=79,487).
Meana SD Group Diff. (β)b
Personal characteristics
Male (0/1) 0.51 0.50 -0.00
Child is multiple (0/) 0.01 0.12 -0.00
Age (ref: <12 months) 0.22 0.42 0.01*
12-23 0.20 0.40 -0.01*
24-35 0.19 0.39 -0.01*
36-47 0.20 0.40 -0.01*
48-59 0.19 0.39 0.02***
Birth order (ref: 1st) 0.18 0.38 -0.03***
2nd 0.18 0.38 -0.04***
3rd 0.16 0.36 -0.01**
4th 0.49 0.50 0.08***
Size-at-birth (ref: Small) 0.14 0.34 0.04***
Average 0.44 0.50 0.03***
Large 0.43 0.49 -0.08***
Birth Interval (year) 2.86 1.81 0.07**
SBA (0/1) 0.36 0.48 -0.26***
Vaccination (0/1) 0.63 0.48 -0.24***
Maternal Characteristics
Age (< 20 years) 0.11 0.31 0.04***
20-24 0.25 0.43 0.01**
25-29 0.27 0.45 -0.04***
30-34 0.19 0.40 -0.03***
35+ 0.17 0.38 0.01*
Mother’s marital status (ref: In a union) 0.98 0.15 -0.01***
Separated 0.01 0.08 0.00***
Divorced 0.01 0.08 0.00*
Education (years) 4.92 5.36 -3.16***
Prenatal visits (0/1) 0.73 0.44 -0.18***
Polygynous (0/1) 0.33 0.47 0.09***
Occupation (ref: Other) 0.36 0.48 0.10***
Low skill 0.10 0.30 0.02***
Medium skill 0.50 0.50 -0.08***
High skill 0.04 0.20 -0.04***
Decision-maker (0/1) 0.57 0.50 -0.10***
Access to media (0/1) 0.58 0.49 -0.18***
Lost 2+ children (0/1) 0.15 0.35 0.07***
Paternal Characteristics
Age (< 25 years) 0.02 0.13 0.01***
25-34 0.27 0.44 0.00
35-44 0.40 0.49 -0.05**
45-54 0.24 0.42 0.02***

Table 2 Participant characteristics (N=79,487) (Continued)
55+ 0.08 0.28 0.02***
Education (years) 6.54 5.81 -3.11***
Occupation (ref: Other) 0.03 0.17 0.01***
Low skill 0.46 0.50 0.24***
Medium skill 0.40 0.49 -0.17***
High skill 0.10 0.31 -0.09***
Household characteristics
Owns a bank account (0/1) 0.35 0.48 -0.22***
Wealth (ref: Poor) 0.47 0.50 0.29***
Average 0.20 0.40 0.02***
Rich 0.33 0.47 -0.31***
Religion (ref: Islam) 0.59 0.49 0.14***
Christian 0.40 0.49 -0.14***
Other 0.02 0.13 0.01***
Ethnicity (ref: Hausa/Fulani) 0.40 0.49 0.15***
Igbo 0.12 0.32 -0.06***
Yoruba 0.11 0.31 -0.10***
Other 0.38 0.48 0.10*
Community Characteristics
Rural (ref: Urban) 0.67 0.47 0.25***
Dist. to registration centers (ref: <5 kms) 0.46 0.50 -0.24***
5-9.99 kms 0.25 0.43 0.08***
10+ kms 0.29 0.45 0.16***
Distance to Roads (ref: <5 kms) 0.17 0.38 -0.04***
5-9.99 kms 0.11 0.32 -0.04***
10+ kms 0.71 0.45 0.08***
Altitude (ref: Low) 0.49 0.50 -0.05***
Medium 0.23 0.42 0.03***
High 0.28 0.45 0.03***
Female education 4.95 4.28 -2.49***
Male education 6.49 4.19 -2.40***
% Poor HHs 0.47 0.41 0.27***
Child mortality 0.58 0.42 0.16***
Region (ref: SW) 0.12 0.32 -0.09***
NC 0.17 0.37 -0.01
NE 0.22 0.41 0.04***
NW 0.30 0.46 0.12***
SE 0.10 0.30 -0.04***
SS 0.11 0.31 -0.02***
Note: aThis represents a proportion for categorical variables.b Beta values for the two-sample mean-
comparison tests (ttest) between the certified and non-certified groups. A negative (positive) sign
implies that non-certified children are less (more) likely to have a lower (higher) mean or
proportion for that category. * p<0.10, ** p<0.05, *** p<0.01.

Table 3 Predictors of birth certification
Model 1a Model 2b Model 3c
OR 95% CI OR 95% CI OR 95%CI
Constant 0.136 (0.091-0.187)*** 0.042 (0.022-0.077)*** 0.050 (0.029-0.080)***
Personal characteristics
Age (ref: <12 months)
12-23 0.953 (0.833-1.075) 0.913 (0.811-1.028)* 0.931 (0.822-1.065)
24-35 0.914 (0.745-1.088) 0.820 (0.694-0.984)** 0.850 (0.696-1.040)*
36-47 0.939 (0.736-1.179) 0.781 (0.640-0.996)** 0.824 (0.636-1.058)*
48-59 0.700 (0.530-0.921)** 0.546 (0.431-0.729)*** 0.584 (0.439-0.781)***
Birth order (ref: 1st)
2nd 1.011 (0.928-1.101) 0.987 (0.904-1.076) 0.990 (0.901-1.080)
3rd 0.972 (0.892-1.060) 0.951 (0.863-1.044) 0.955 (0.861-1.048)
4th 0.871 (0.805-0.940)*** 0.931 (0.841-1.027)* 0.935 (0.830-1.040)*
Size-at-birth (ref: Small)
Average 1.019 (0.975-1.062) 1.014 (0.971-1.056) 1.013 (0.971-1.057)
Large 1.114 (1.069-1.157)*** 1.082 (1.038-1.125)*** 1.083 (1.037-1.129)***
Birth Interval
(months)
0.980 (0.966-0.995)** 0.981 (0.965-0.996)*** 0.982 (0.967-0.998)**
SBA (0/1) 1.690 (1.570-1.804)*** 1.272 (1.184-1.366)*** 1.256 (1.162-1.359)***
Vaccination (0/1) 1.863 (1.713-2.023)*** 1.603 (1.463-1.740)*** 1.605 (1.469-1.742)***
Maternal Characteristics
Age (ref: <20 years)
20-24 1.112 (0.997-1.247)** 1.087 (0.958-1.241)*
25-29 1.190 (1.047-1.358)*** 1.152 (0.999-1.349)**
30-34 1.202 (1.037-1.399)*** 1.167 (0.999-1.391)**
35+ 1.186 (1.007-1.391)** 1.143 (0.960-1.385)*
Mother's marital status (ref: In a union)
Separated 0.482 (0.297-0.709)*** 0.471 (0.310-0.691)***
Divorced 0.675 (0.443-0.965)** 0.646 (0.426-0.910)***
Education (years) 1.022 (1.014-1.031)*** 1.023 (1.014-1.031)***
Had 1+ Prenatal
visit (0/1)
1.384 (1.257-1.518)*** 1.350 (1.221-1.487)***
Polygynous (0/1) 0.930 (0.862-1.001)** 0.943 (0.873-1.015)*
Lost 2+ children
(0/1)
0.812 (0.732-0.894)*** 0.826 (0.747-0.914)***
Paternal Characteristics
Father's age (ref: <25 years)
25-34 1.155 (0.940-1.506)* 1.239 (0.904-1.587)*
35-44 1.213 (0.975-1.584)* 1.298 (0.948-1.672)*
45-54 1.180 (0.939-1.589)* 1.261 (0.896-1.646)*
55+ 1.191 (0.930-1.607)* 1.250 (0.879-1.647)*
Education (years) 1.013 (1.006-1.021)*** 1.012 (1.004-1.020)***
Occupation (ref: Other)
Low skill 0.859 (0.802-0.918)*** 0.882 (0.818-0.948)***
Medium skill 1.024 (0.964-1.086) 1.013 (0.956-1.075)
High skill 1.034 (0.960-1.115) 1.030 (0.952-1.109)

Table 3 Predictors of birth certification (Continued).
Household
characteristics
-
Owns a bank
account (0/1)
1.592 (1.480-1.700)*** 1.596 (1.483-1.709)***
Wealth (ref:
Poor)
Average 1.300 (1.172-1.439)*** 1.132 (1.020-1.253)**
Rich 1.642 (1.460-1.841)*** 1.342 (1.170-1.514)***
Religion (ref: Islam)
Christian 1.078 (0.978-1.185)** 1.106 (0.996-1.215)**
Other 0.867 (0.732-1.017)* 0.874 (0.730-1.037)
Ethnicity (ref: Hausa/Fulani)
Igbo 1.061 (0.953-1.181) 1.061 (0.943-1.194)
Yoruba 1.146 (1.024-1.276)** 1.168 (1.038-1.298)***
Other 0.943 (0.879-1.015)* 0.939 (0.869-1.016)*
Community
Characteristics
Dist. to Centers (ref: <5 kms)
5-9.99 kms 0.944 (0.819-1.089)
10+ kms 0.780 (0.643-0.926)**
Dist. to Roads (ref: <5 kms)
5-9.99 kms 1.095 (0.978-1.301)
10+ kms 1.274 (1.053-1.588)**
Average female
education
1.021 (0.912-0.978)***
Average male education 1.035 (1.008-1.071)**
% Poor HHs 0.535 (0.396-0.661)***
Child mortality 0.771 (0.604-0.894)***
Region (ref: SW)
NC 0.974 (0.725-1.324)
NE 1.595 (0.993-2.231)**
NW 1.107 (0.815-1.522)
SE 1.064 (0.694-1.512)
SS 0.811 (0.560-1.071)*
Notes: The Empty model (OR=0.045, 95%CI=0.034-0.052); a Model 1: contained only child characteristics; b
Model 2: Child plus family characteristics; cModel 3: All characteristics; OR = Odds ratio; CI = Credible Interval;
ICC: Intra-class Correlation Coefficient; PCV: Proportional Change in Variance; DIC: Deviation Information
Criterion *: Change in relation to the previous model. Significance level ***p<0.01 **p<0.05 *p<0.10
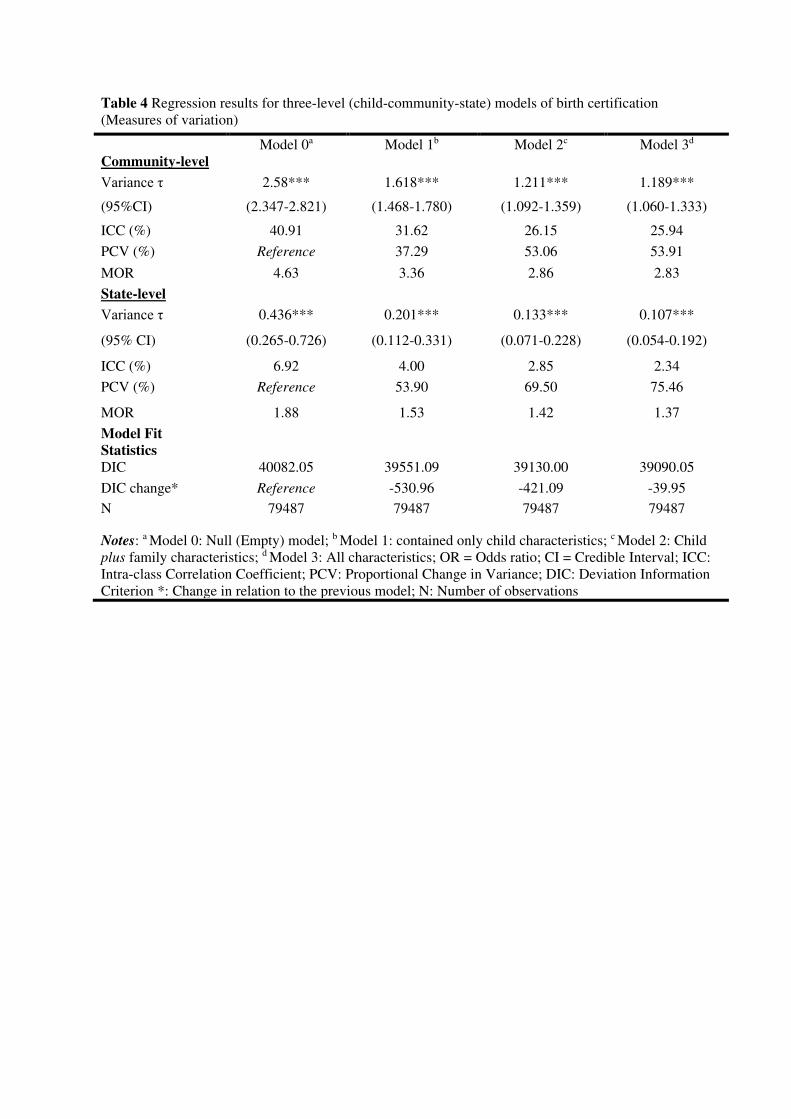
Table 4 Regression results for three-level (child-community-state) models of birth certification
(Measures of variation)
Model 0a Model 1b Model 2c Model 3d
Community-level
Variance τ 2.58*** 1.618*** 1.211*** 1.189***
(95%CI) (2.347-2.821) (1.468-1.780) (1.092-1.359) (1.060-1.333)
ICC (%) 40.91 31.62 26.15 25.94
PCV (%) Reference 37.29 53.06 53.91
MOR 4.63 3.36 2.86 2.83
State-level
Variance τ 0.436*** 0.201*** 0.133*** 0.107***
(95% CI) (0.265-0.726) (0.112-0.331) (0.071-0.228) (0.054-0.192)
ICC (%) 6.92 4.00 2.85 2.34
PCV (%) Reference 53.90 69.50 75.46
MOR 1.88 1.53 1.42 1.37
Model Fit
Statistics
DIC 40082.05 39551.09 39130.00 39090.05
DIC change* Reference -530.96 -421.09 -39.95
N 79487 79487 79487 79487
Notes: a Model 0: Null (Empty) model; b Model 1: contained only child characteristics; c Model 2: Child
plus family characteristics; d Model 3: All characteristics; OR = Odds ratio; CI = Credible Interval; ICC:
Intra-class Correlation Coefficient; PCV: Proportional Change in Variance; DIC: Deviation Information
Criterion *: Change in relation to the previous model; N: Number of observations

Figures
Figure 1
Birth certi�cation rates among children under-�ve years, across 774 local government areas (LGAs),Nigeria, pooled data, 2008-2018

Figure 2
Prevalence of birth certi�cation by region of residence and birth year, Nigeria, pooled data 2008-2018
Supplementary Files
This is a list of supplementary �les associated with this preprint. Click to download.
DetBirthCerti�cationSupplementaryData.pdf