an empirical analysis of insider trading in...
TRANSCRIPT

UNIVERSITEIT GENT
FACULTEIT ECONOMIE EN BEDRIJFSKUNDE
ACADEMIEJAAR 2008 – 2009
An empirical analysis of insider trading in
Belgium
Masterproef voorgedragen tot het bekomen van de graad van
Master in de Toegepaste Economische Wetenschappen
Debby Van Geyt
onder leiding van
Prof. Dr. Philippe Van Cauwenberge

Confidentiality clause
PERMISSION
The present writer declares that the content of this paper may be consulted and/or reproduced, if
acknowledgement is given.
Debby Van Geyt

Declaration of confidentiality with regard to the insider
trading data
Under the following guarantees of confidentiality, the Belgian insider trading data were obtained
from the supervisory authority for the Belgian financial sector, the Banking, Finance, and Insurance
Commission:
• The information from the database containing transactions of managers shall be used
exclusively for the purpose of academic research.
• The information from the database containing transactions of managers shall be treated as
strictly confidential by the persons entrusted with academic research on this subject. They
will not communicate this information to a third party.
• Academic research will not be aimed at the analysis of transactions of individual managers
and other persons enforced with a duty of notification. Moreover, in publications resulting
from an inquiry, only rough data will be included so that the identity of individual managers
and other persons enforced with a duty of notification cannot be discovered.
• In publications regarding academic research on this topic, the conditions under which access
to the information in the database was obtained shall be indicated.

I
Preface
I would like to thank my supervisor prof. dr. Philippe Van Cauwenberge for suggesting the topic of
insider trading and for his aid and assistance. I also want to thank Kelly De Brabanter and Katrien
Kestens for their help with regard to the empirical analysis.
Further, I would also like to express my gratitude to the Banking, Finance, and Insurance Commission
for assembling a database on insider trading and putting this at the disposal of this study.
Finally, I would also like to render thanks to my family for their support and to the University of
Ghent for a valuable and instructive academic training.

II
Table of contents
Preface ...................................................................................................................................................... I
Table of contents ..................................................................................................................................... II
List of abbreviations ............................................................................................................................... IV
List of tables ............................................................................................................................................ V
List of figures .......................................................................................................................................... VI
Abstract ................................................................................................................................................... 1
1. Introduction ..................................................................................................................................... 1
2. Analysis of the Belgian legislation on insider trading ...................................................................... 3
2.1. Responsible authority .............................................................................................................. 6
2.2. Persons submitted to the reporting requirement ................................................................... 6
2.3. Transactions that have to be notified ..................................................................................... 6
2.4. Information that has to be notified ......................................................................................... 7
2.5. Terms of notification ............................................................................................................... 7
2.6. Short-swing prohibition ........................................................................................................... 7
3. Overview of previous research ........................................................................................................ 8
3.1. Abnormal returns of insiders................................................................................................... 8
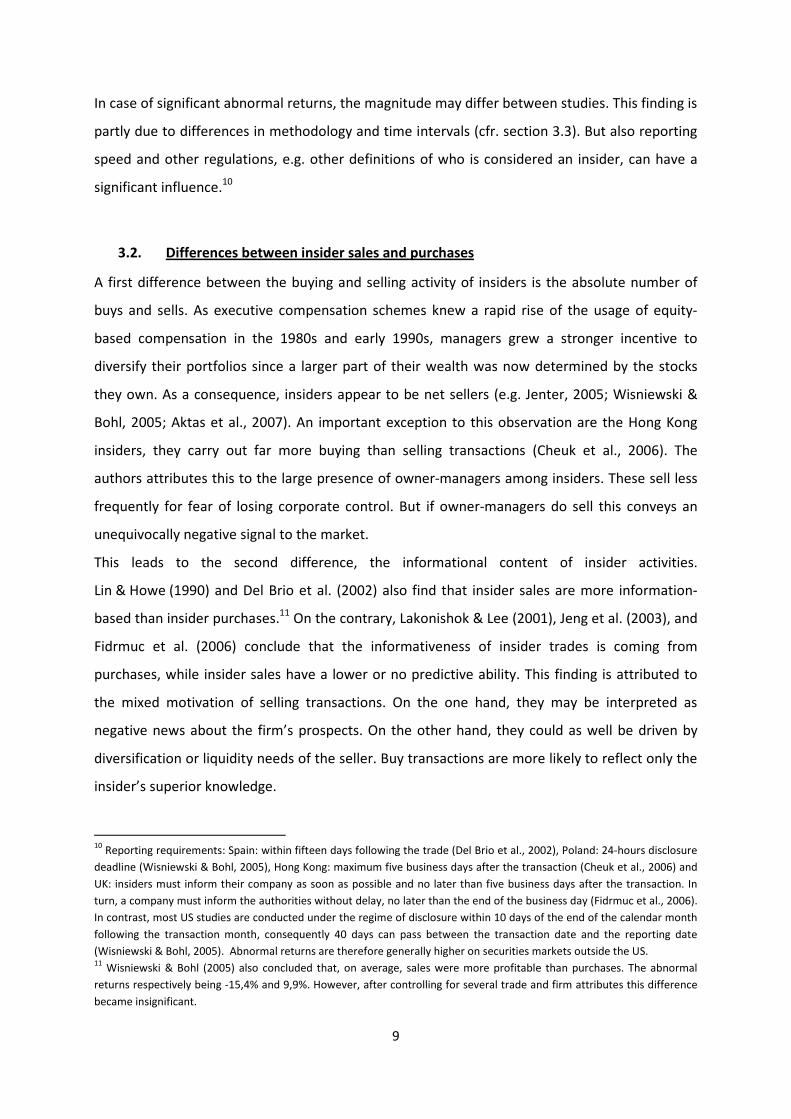
3.2. Differences between insider sales and purchases .................................................................. 9
3.3. Short-term and long-term event-windows ........................................................................... 10
3.4. The influence of firm characteristics on abnormal returns ................................................... 10
3.5. The influence of trade characteristics on abnormal returns ................................................. 13
3.6. Abnormal returns of outsiders .............................................................................................. 14
4. Data ............................................................................................................................................... 15
4.1. Insider trading data ............................................................................................................... 15
4.2. Other required data .............................................................................................................. 17
5. Descriptive statistics ...................................................................................................................... 17

III
6. Methodology ................................................................................................................................. 18
7. Empirical results ............................................................................................................................ 22
7.1. Trade performance of insiders .............................................................................................. 22
7.2. Trade performance of outsiders ........................................................................................... 25
8. Conclusions .................................................................................................................................... 27
References ............................................................................................................................................. VII
Appendix 1 ............................................................................................................................ Appendix 1.1
Appendix 2 ............................................................................................................................ Appendix 2.1
Appendix 3 ............................................................................................................................ Appendix 3.1
IV
List of abbreviations
AR Abnormal return
B/M Book-to-market
CAR Cumulative abnormal return
CBFA Banking, Finance, and Insurance Commission
CESR Committee of European Securities Regulators
P/E Price-earnings
SEC Securities and Exchange Commission

V
List of tables
TABLE 1 Filters used to obtain the final sample of 1,567 transactions .............................................. 16
TABLE 2 Summary statistics ................................................................................................................ 19
TABLE 3 CAR (1,100) for insiders and significance tests ..................................................................... 24
TABLE 4 CAR (1,100) for insiders grouped by firm size and trade value ............................................ 25
TABLE 5 CAR (1,100) for outsiders and significance tests .................................................................. 26

VI
List of figures
FIGURE 1 Number of trading days between the transaction date and the reporting date. ....... 16
FIGURE 2 Empirical distribution of CARs from day 1 until day 100 relative to an insider trade
obtained by bootstrapping and used to evaluated the significance of the CARs for the overall
sample. ........................................................................................................................................... 22
FIGURE 3 Cumulative abnormal returns over days 0 to 100 relative to the trading date. ......... 23
FIGURE 4 Cumulative abnormal returns over days 0 to 100 relative to the reporting date. ...... 26

1
Abstract
This paper studies the profitability of insider trading in the Belgian Stock market or Euronext
Brussels. A sample of 1,567 insider trades is used, consisting of 928 purchase transactions and
639 sale transactions. The question is addressed whether insiders can earn abnormal returns and
whether these depend on the firm size and the trade value. Moreover, it is also investigated if
outsiders, mimicking insiders, are also able to outperform the market. The main findings are that
sales made by insiders as well as by outsiders are profitable. Purchase transactions on the other
hand, yield negative abnormal returns irrespective of the type of investor executing the trade.
Small sales and sale transactions in small companies are the most profitable.
1. Introduction
Corporate insiders find themselves in a position to receive relevant information in a more timely
manner than outsider investors do. They are informed about future project, the results of
research and development activities, sales figures, etc. before the market. This creates an
information asymmetry. Extensive research has already analysed the profitability of trades made
by corporate insiders, answering the questing whether trading on superior information yields
abnormal returns. This inquiry is however unique as it is the first to investigate this subject for
the Belgian stock market. It is aimed at an evaluation of the performance of both insiders and
outsiders, thereby focussing on the economic consequences of insider dealing.
Obviously, insider trading is also of interest to other academic fields. First, there is the legislation
on insider dealing. Previous studies have for example investigated the consequences of lax law
enforcement (Eckbo & Smith, 1998; Wisniewski & Bohl, 2005), the effectiveness of insider
trading laws (Bris, 2005), and the pro’s and con’s of prohibiting insider trading (Leland, 1992).
Here, we limit ourselves to an overview of the Belgian legislation on insider dealing.
The ethical downside of informed trading is also left uncovered. From ethical point of view
opponents argue that it is firstly unfair, because trading should normally take place on a “level
playing field”. Disparities in information tilt the field toward one player and away from another.
Secondly, it is also unethical because it involves a violation of property rights by
misappropriation. Thirdly, insider trading is regarded as harmful to uninformed investors who
engage in trades with corporate insiders. Moreover, it erodes investors’ confidence in the
market, causing investors’ not to participate in the market and thereby harming the market as a
whole (Singh, 2007).

2
The main economic counter-argument in favour of insider trading is the more efficient pricing of
shares since new and useful information will be brought into the prices. Consequently, prices will
be a more accurate reflection of firm-value and economic decision-makers will be faced with
reduced risk and improved performances, ameliorating resource allocation (Leland, 1992).
The notion of accurate share prices is reflected in the efficient market hypothesis (Fama, 1970).
Both the strong and the semi-strong form will be evaluated. The former claims that all
information is reflected into the stock prices, while the later postulates that the prices only
efficiently adjust to information that is publically available. This study will use a sample of insider
trades reported to the Banking, Finance, and Insurance Commission (CBFA) to investigate if
trades made by insiders yield abnormal returns and whether outsiders can benefit from
imitating these transactions. Transactions made by insiders are also split into three equal-sized
groups based on firm size and three equal-sized groups based on trade value to test the
influence of these variables on the abnormal returns.
In particular, this study tests the null hypothesis that insiders are not able to beat the market
and that the abnormal returns have an expected value of zero. To evaluate these abnormal
returns a traditional event-study framework is adopted. This is a frequently applied method to
examine security price behaviour around events. The significance of this market reaction,
measured by the abnormal returns, will be tested using a bootstrap method and a non-
parametric sign test. Any tests performed will be one-tailed test. A positive market reaction is
expected following purchase transactions and when the overall sample is analysed.1 For sale
transactions abnormal returns are expected to be negative.
For the calculation of the abnormal gains, stock-specific returns are adjusted for the return on a
control portfolio. The formation of these portfolios is based on market capitalisation and
market-to-book ratios, implicitly indicating that these factors are important risk factors on the
Belgian stock market.
In general, the results indicate that insiders are able to earn excess returns by decreasing their
holding in a company’s share. This is a finding consistent with the majority of previous research
(e.g. Wisniewski & Bohl, 2005; Aktas, de Bodt, de Smedt, & Riachi, 2007). In contrast, the pattern
of abnormal returns surrounding a buy transaction deviates strongly from what is previously
found. Instead of outperforming the market after an increase in ownership, insiders appear to
invest in shares that subsequently do worse than the market. The lowest abnormal gains are
1 When analyzing the profitability of the overall sample, the abnormal returns of sale transactions are multiplied by minus 1
to match the purchase transactions.
3
found in the subsamples of large purchases and purchases in corporations with a high market
capitalisation. Insiders executing small sales and sale transactions in small companies perform
best. The performance of outside investors trading on a strategy of buying shares previously
bought by insiders and selling shares previously sold by insiders was very similar to the
performance of corporate insiders.
The remainder of this paper is organised as follows. In section 2 the Belgian insider trading
regulation is discussed. In section 3 a summary is given of previous research related to this study.
Section 4 and 5 discuss the data which are used and their accompanying descriptive statistics.
The next section describes the applied methodology. The results of the empirical study are
disclosed and interpreted in section 7 and finally, conclusions are presented in section 8.
2. Analysis of the Belgian legislation on insider trading
Insider trading regulation is concerned with preventing illegal insider transactions. A distinction
between legal and illegal insider trades is made based on the moment the trade takes place.
Security transactions by insiders after material information has been made public are legal. At
that moment, insiders no longer have a direct information advantage over other investors.
Trading on relevant, non-public information however is illegal. It benefits certain investors
compared to others, thereby harming investors’ confidence and market integrity. Consequently,
legislation has developed itself throughout the years in order to prevent corporate insiders to
trade in their own company’s shares when they are in possession of private information.
The Belgian legislation on insider dealing is founded in legal initiatives taken on the level of the
European Union. Initially, there was Directive 89/592/EEC of November 13th 1989 on the
coordination of insider trading regulations.2 Before this directive came into effect some member
states of the European Union had no rules prohibiting insider dealing, while others had very
divergent regulations. Directive 89/592/EEC was the first to provide guidance on this matter to
member states.3 It was converted into Belgian law by the articles 181 until 189 of the Law of
December 4th
1990 on financial transactions and financial markets.4
2 European legislation was obtained from the official website on European Union law: http://eur-lex.europa.eu.
3 Directives of the European Union need to be converted into law by the member states. They require member states to
achieve a particular result, without dictating the means of achieving that result. 4 Belgian legislation was obtained from the official website of the Belgian Federal Public Service of Justice:
http://just.fgov.be.

4
However, because of changes in the financial markets and in Community legislation there grew a
need for a new directive. On January 28th
2003 Directive 2003/6/EC on insider dealing and
market manipulation came into effect. This directive defines inside information as “information
of a precise nature which has not been made public, relating, directly or indirectly, to one or
more issuers of financial instruments or to one or more financial instruments and which, if it
were made public, would be likely to have a significant effect on the prices of those financial
instruments or on the price of related derivative financial instruments”. As an illustration,
appendix 1 includes examples of what might be considered as “inside information” according to
the Committee of European Securities Regulators (CESR). This is an official body advising the
European Commission on new legislation and implementation measures concerning EU
directives in the field of securities.
In Directive 2003/6/EC two important injunctions on the use of inside information are
formulated. In particular, the directive prohibits any person who possesses inside information to
use that information by acquiring or disposing of financial instruments to which that information
relates, or by trying to do so.5 It also prohibits these persons to disclose their inside information,
unless this is part of their job description, or to make recommendations or induce another
person on the basis of that information to acquire or dispose of financial instruments to which
that information relates.6
The prohibitions stated by the European Directive were translated into Belgian legislation by the
articles 25 and 40 of the Law of 2 August 2002 on the supervision of the financial sector and on
financial services. An offender of these legal provisions is penalized by a prison term between
three months and one year and a fine between 50 Euros and 10,000 Euros. Furthermore, the
offender may be ordered to pay an amount corresponding to a maximum of triple the capital
gain that was obtained, directly or indirectly, from the infringement (art. 40, § 6).
5 An exception is made for transactions conducted in the discharge of an obligation that has become due to acquire or
dispose of financial instruments where that obligation results from an agreement concluded before the person concerned
possessed inside information. 6 The prohibitions do not apply to transactions carried out in pursuit of monetary, exchange-rate or public debt-
management policy by a Member State of the European Economic Area, by the European System of Central Banks, by a
national central bank or by any other officially designated body, or by any person on their behalf.

5
Next to the prohibitions, additional preventive guidelines are formulated by Directive 2003/6/EC.
First, to help accomplish full and proper market transparency and in order to examine if
transactions were conducted on the basis of inside information, this directive enforces a duty to
report on persons discharging managerial responsibilities within an issuer of financial
instruments as well as on persons closely related to them. Specifically, these persons must notify
the competent authority the existence of transactions on their own account in stock of the
company to which they relate.
A second preventive measure requires an issuer of financial instruments to draw up a list of
persons employed by the issuer, and which have, on a regular or occasional manner, access to
prior knowledge that directly or indirectly relates to the issuer.
Thirdly, the directive also requires any person professionally arranging transactions in financial
instruments who reasonable suspects that a transaction might constitute insider dealing to
notify the competent authority without delay.
The aforementioned guidelines were converted into Belgian legislation by the Royal Decree of
24 August 2005, which added a new article, art. 25bis, to the Law of 2 August 2002.7 For Belgian
financial market participants, the following rules apply: the list of persons having access to inside
information must be kept at the disposal of the CBFA for a time period of five years. This
authority can request the issuer to submit this list. Normally this will take place as part of an
investigation regarding misuse of inside information. Also the reporting of questionable
transactions will be addressed to the CBFA. This report includes a description of the transaction
and the grounds of the suspicion. Regulations on the notification duty are of special interest to
our research and will therefore be discussed in detail. Moreover, differences in reporting
standards have proven to impact research result (cfr. section 3). Consequently, the most
important differences with the US legislation will be highlighted, as the US market is the most
widely studied. The relevant regulation for the US stock market is included in section 16 of the
1934 Securities Exchange Act.8
7 The modalities of these obligations were specified by the Royal Decree of 5 March 2006 on market abuse.
8 The content of section 16 of the Securities Exchange Act 1934 can be found on the website www.law.uc.edu.

6
2.1. Responsible authority
In Belgian, notification of insider transactions is addressed to the CBFA. This body is responsible
for the public disclosure of the insider transaction. When a transaction is reported, the CBFA
only checks the origin, the content of the notification is part of the responsibility of the person
reporting. Outside investors can consult the insider trading data on the CBFA-website.9
Under the US system, corporate insiders have to file their transactions to the Securities and
Exchange Commission (SEC). The latter is also responsible for publishing the information
concerning insider transactions. This is done by means of the SEC’s online Insider Trading Report
(Fidrmuc, Goergen, & Renneboog, 2006).
2.2. Persons submitted to the reporting requirement
Under the Belgian law, persons who fulfil an executive function in the issuing institution, like
directors and commissioners, as well as persons closely related to them, e.g. spouses, partners,
children and other relatives, have to report their personal transactions in certain categories of
securities.
In the US, filing is required for directors, officers, and principal stockholders of the issuer of
securities. The SEC has defined the term officer to include: company president, principal financial
officer, principal accounting officer, any vice president in charge of a principal business unit,
division or function (such as sales, administration, or finance), and any other person who
performs a policy making function for the company (Bettis, Coles, & Lemmon, 2000). A principal
stockholders is specified as a person who is the beneficial owner of more than 10 percent of any
class of the issuer’s equity securities.
2.3. Transactions that have to be notified
In Belgium, the CBFA has to be notified by the aforementioned persons about transactions for
their own account concerning shares emitted by the issuer which they are part of or, concerning
derivatives or other financial instruments arising out of this.
The US insiders have to notify changes in their ownership of any class of the issuer’s equity
securities and also the purchase or sale of a security-based swap agreement involving such
equity securities.
9 www.cbfa.be

7
2.4. Information that has to be notified
When reporting an insider trade to the CBFA, the following data must be included: the name of
the person conducting the trade, the reason for the notification duty, i.e the relationship to the
corporation, the name of the issuer involved, a description of the financial instrument, the type
of transaction, the date and place of the transaction, and the price and volume of the trade.
Under the US system, the required information is quite similar. It contains the name and address
of reporting person, the issuer name and ticker or trading symbol, the relationship of reporting
person to the issuer (officer, director, or the like), the filing date, the type of security traded, the
transaction date, the transaction code (for example, open-market transaction, private
transaction, transaction under an employee stock ownership plan), the number of equity
securities traded, the per-share price of equity securities and the ownership form (direct or
indirect) (Jeng, Metrick, & Zeckhauser, 2003).
2.5. Terms of notification
Belgian insiders normally have to report their transactions after at most five days following the
execution. However, as long as the total sum of the transactions during the current calendar
year is below 5,000 Euros, the reporting may be delayed until 31 January of the next calendar
year at the latest. In case of overrunning of this limit, all transactions carried out so far have to
be notified within five days after the latest transaction. Afterwards everything is reset to zero
and reporting of subsequent insider trades within the same calendar year can be postponed until
the limit is reached again.
In the US, before August 2002, under the Securities and Exchange Act of 1934, insiders were
obliged to report their transactions by the tenth day of the calendar month after the month in
which the trade occurred. However, since the Sarbanes-Oxley Act came into effect the reporting
terms are reduced to no more than two days following the transaction (Wisniewski &
Bohl, 2005).
2.6. Short-swing prohibition
A final important difference between the Belgian and US legislation is the prohibition of short-
swing-trading on the US market introduced by Section 16(b) of the Securities Exchange Act. To
prevent the unfair use of information which may have been obtained by a principal stockholder,
officer, or director by reason of his relationship to the issuer, this rule implies that insiders must

8
disgorge to the issuer any profit realized as a result of a purchase and sale or a sale and purchase
of equity securities within a six months period, irrespective of their intention. In practice, this
means that if an officer, director, or beneficial owner purchases/sells relevant stock he must wait
at least six months before respectively reselling/rebuying this stock in order not to incur a
liability. Legal action can be taken by the issuer, or by the owner of any security of the issuer in
the name and in behalf of the issuer if the issuer fails or refuses to so. This is possible until two
years after the date such a profit was realized. No comparable prohibition on short-term trading
is operative in Belgium.
3. Overview of previous research
Insider trading is a well documented aspect of securities markets. Many aspects have been
researched, mostly on the US market, and many, sometimes conflicting, conclusions have been
formulated. In this section the results of previous research concerning the abnormal returns of
corporate insiders and determinants that influence these returns will be highlighted.
Furthermore, also the question is addressed whether outsiders can learn something from
transactions conducted by insiders.
3.1. Abnormal returns of insiders
The possibility of insiders to gain abnormal profits is linked to the degree of efficiency of the
financial markets. If traders can outperform the market by using inside information, this
contrasts with the strong definition of market efficiency. The later postulates that all relevant
information is reflected in security prices, regardless of what information is publicly available. In
general, most studies on the US market have suggested that insiders earn a positive abnormal
return, supporting the semi-strong form of efficient markets that only public information is
reflected in the stock prices (Jaffe, 1974; Finnerty, 1976; Seyhun, 1986; Rozeff & Zaman, 1988;
Lakonishok & Lee, 2001). Regarding other countries similar results are found for securities
markets in Spain (Del Brio, Miguel, & Perote, 2002), Poland (Wisniewski & Bohl, 2005), Hong
Kong (Cheuk, Fan, & So, 2006), the Netherlands (Aktas et al., 2007), and the UK (Fidrmuc et al.,
2006). A notable exception however is the Oslo Stock Exchange studied by Eckbo & Smith (1998)
were zero or negative abnormal profits were found.
9
In case of significant abnormal returns, the magnitude may differ between studies. This finding is
partly due to differences in methodology and time intervals (cfr. section 3.3). But also reporting
speed and other regulations, e.g. other definitions of who is considered an insider, can have a
significant influence.10
3.2. Differences between insider sales and purchases
A first difference between the buying and selling activity of insiders is the absolute number of
buys and sells. As executive compensation schemes knew a rapid rise of the usage of equity-
based compensation in the 1980s and early 1990s, managers grew a stronger incentive to
diversify their portfolios since a larger part of their wealth was now determined by the stocks
they own. As a consequence, insiders appear to be net sellers (e.g. Jenter, 2005; Wisniewski &
Bohl, 2005; Aktas et al., 2007). An important exception to this observation are the Hong Kong
insiders, they carry out far more buying than selling transactions (Cheuk et al., 2006). The
authors attributes this to the large presence of owner-managers among insiders. These sell less
frequently for fear of losing corporate control. But if owner-managers do sell this conveys an
unequivocally negative signal to the market.
This leads to the second difference, the informational content of insider activities.
Lin & Howe (1990) and Del Brio et al. (2002) also find that insider sales are more information-
based than insider purchases.11
On the contrary, Lakonishok & Lee (2001), Jeng et al. (2003), and
Fidrmuc et al. (2006) conclude that the informativeness of insider trades is coming from
purchases, while insider sales have a lower or no predictive ability. This finding is attributed to
the mixed motivation of selling transactions. On the one hand, they may be interpreted as
negative news about the firm’s prospects. On the other hand, they could as well be driven by
diversification or liquidity needs of the seller. Buy transactions are more likely to reflect only the
insider’s superior knowledge.
10
Reporting requirements: Spain: within fifteen days following the trade (Del Brio et al., 2002), Poland: 24-hours disclosure
deadline (Wisniewski & Bohl, 2005), Hong Kong: maximum five business days after the transaction (Cheuk et al., 2006) and
UK: insiders must inform their company as soon as possible and no later than five business days after the transaction. In
turn, a company must inform the authorities without delay, no later than the end of the business day (Fidrmuc et al., 2006).
In contrast, most US studies are conducted under the regime of disclosure within 10 days of the end of the calendar month
following the transaction month, consequently 40 days can pass between the transaction date and the reporting date
(Wisniewski & Bohl, 2005). Abnormal returns are therefore generally higher on securities markets outside the US. 11
Wisniewski & Bohl (2005) also concluded that, on average, sales were more profitable than purchases. The abnormal
returns respectively being -15,4% and 9,9%. However, after controlling for several trade and firm attributes this difference
became insignificant.

10
3.3. Short-term and long-term event-windows
Research on the profitability of insider trading can be divided into two categories with regard to
the applied time-frame. Some studies look at the abnormal gains realized in the near future,
while others apply a long-term event-window.
Short-term studies of for example Seyhun (1986), Lakonishok & Lee (2001), Cheuk et al. (2006),
and Aktas, de Bodt, & Van Hoppens (2008), evaluate abnormal returns only a few days
surrounding an insider trade event. These studies observe only small abnormal price movements
after an insider trade. However, it must be emphasised that since, as mentioned above, trades
are a combination of uninformative transactions and transactions that do contain information,
these low returns could still be considered as economically significant.
In long-term studies, overwhelming evidence is found that portfolios that are long on stocks
purchased by insiders and short on stocks sold by insiders outperform the market over a time
horizon ranging from one month to several months (e.g. Jaffe, 1974; Finnerty, 1976; Seyhun,
1986; Jeng et al., 2003; Wisniewski & Bohl, 2005).
The difference between short-term and long-term returns is partly explained by the prohibition
of trading on obvious short-term information, which is operative in the researched countries.
Moreover, in a US context, insiders cannot make more than two round-trip transactions per year
without incurring a penalty, due to the short-swing rule. Therefore, it is more likely that they
trade based on long-term information (Aktas et al., 2007).
3.4. The influence of firm characteristics on abnormal returns
A first important firm characteristic is the firm size. A higher potential for information
asymmetry is expected in small firms. These firms experience less extensive analyst coverage
and it is easier for managers of small companies to know a significant proportion of relevant
information. In general, research indicates that the abnormal gains are higher in small firms as
compared to large firms (e.g. Seyhun, 1986; Cheuk et al., 2006). The Polish stock market appears
to be an exception to this. Here, firm size is irrelevant for the magnitude of the insider trading
profits (Wisniewski & Bohl, 2005). The authors attribute this to the absence of large
multinationals on the Warsaw Stock Exchange and the mean company capitalisation being
roughly than times smaller than in the US.
Linked to the less efficient pricing of small firms and the main motivation of buy transactions
being to gain profit, insiders have the tendency to purchase small stocks and sell large stocks
(Rozeff & Zaman, 1988; Fidrmuc et al., 2006).
11
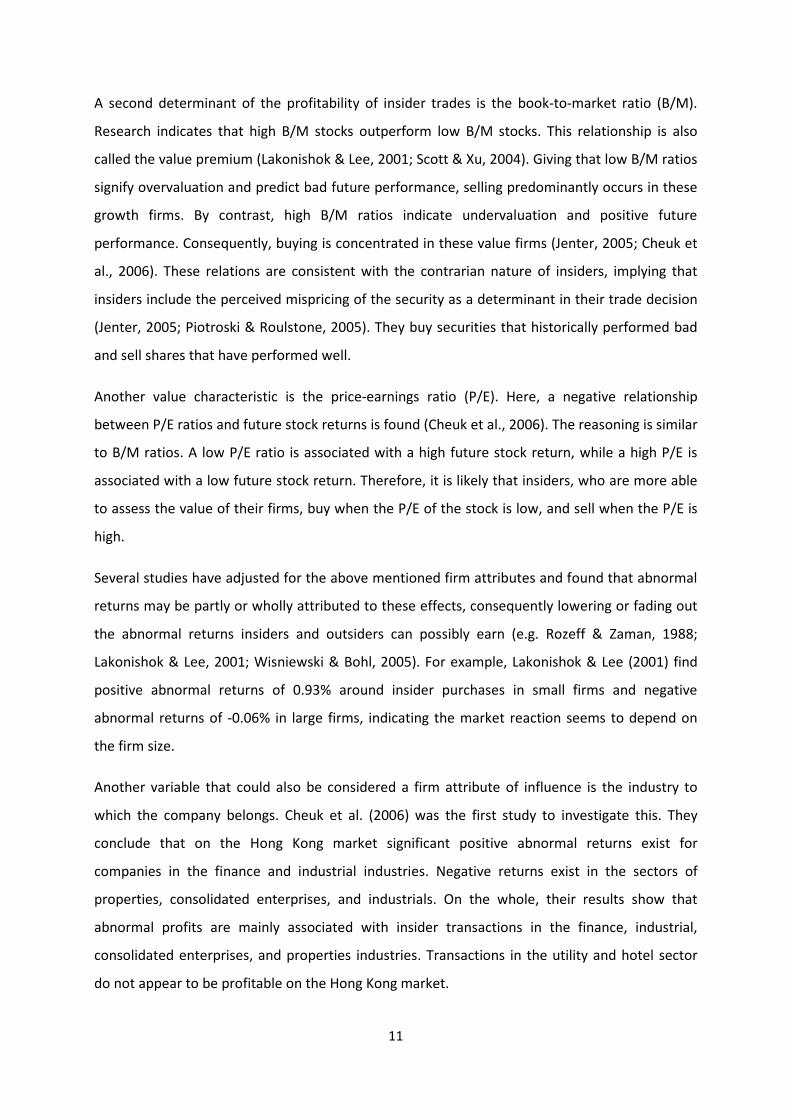
A second determinant of the profitability of insider trades is the book-to-market ratio (B/M).
Research indicates that high B/M stocks outperform low B/M stocks. This relationship is also
called the value premium (Lakonishok & Lee, 2001; Scott & Xu, 2004). Giving that low B/M ratios
signify overvaluation and predict bad future performance, selling predominantly occurs in these
growth firms. By contrast, high B/M ratios indicate undervaluation and positive future
performance. Consequently, buying is concentrated in these value firms (Jenter, 2005; Cheuk et
al., 2006). These relations are consistent with the contrarian nature of insiders, implying that
insiders include the perceived mispricing of the security as a determinant in their trade decision
(Jenter, 2005; Piotroski & Roulstone, 2005). They buy securities that historically performed bad
and sell shares that have performed well.
Another value characteristic is the price-earnings ratio (P/E). Here, a negative relationship
between P/E ratios and future stock returns is found (Cheuk et al., 2006). The reasoning is similar
to B/M ratios. A low P/E ratio is associated with a high future stock return, while a high P/E is
associated with a low future stock return. Therefore, it is likely that insiders, who are more able
to assess the value of their firms, buy when the P/E of the stock is low, and sell when the P/E is
high.
Several studies have adjusted for the above mentioned firm attributes and found that abnormal
returns may be partly or wholly attributed to these effects, consequently lowering or fading out
the abnormal returns insiders and outsiders can possibly earn (e.g. Rozeff & Zaman, 1988;
Lakonishok & Lee, 2001; Wisniewski & Bohl, 2005). For example, Lakonishok & Lee (2001) find
positive abnormal returns of 0.93% around insider purchases in small firms and negative
abnormal returns of -0.06% in large firms, indicating the market reaction seems to depend on
the firm size.
Another variable that could also be considered a firm attribute of influence is the industry to
which the company belongs. Cheuk et al. (2006) was the first study to investigate this. They
conclude that on the Hong Kong market significant positive abnormal returns exist for
companies in the finance and industrial industries. Negative returns exist in the sectors of
properties, consolidated enterprises, and industrials. On the whole, their results show that
abnormal profits are mainly associated with insider transactions in the finance, industrial,
consolidated enterprises, and properties industries. Transactions in the utility and hotel sector
do not appear to be profitable on the Hong Kong market.

12
The study of Aboody & Lev (2000) specifically concentrates on the relationship between R&D
activities and insider gains. They argue that R&D activities are associated with high information
asymmetry for two reasons. Firstly, an asset created from R&D expenditures is likely to be more
unique than a tangible asset. Secondly, considerable information can be derived from the price
of traded tangible and financial assets concerning their values at the firm level. No such direct
price-based information on firm-specific changes in the value and productivity exists for assets
arising from R&D expenditures and the necessary information to determine the value is harder
to obtain. Aboody & Lev (2000) observe substantially larger insider gains in firms with R&D as
opposed to no-R&D firms. Moreover, insiders also take advantage of information on planned
changes in R&D budgets. The statistically and economically significant R&D related gains were
later confirmed by Huddart & Ke (2002).
A possible inverse relationship between abnormal returns on insider trade and ownership
concentration in the firm is investigated by Del Brio & Perote (2007).12
The reasoning is that, due
to high supervisory costs, shareholders of companies characterized by highly diffuse ownership
concentration are less motivated to control managers, resulting in less effective control over
insiders. Therefore, a diffuse ownership concentration encourages bigger information
asymmetries and by consequence larger abnormal gains. Del Brio & Perote (2007) find evidence
supporting this hypothesis.
A final firm characteristic of influence are the corporate policies on insider dealing. Certain
companies appear to have explicit blackout periods during which the company prohibits trading
by insiders (Bettis et al., 2000). For example, insider trading might only be allowed during a
trading window which is open for a period of three through twelve trading days following a
quarterly earnings announcement. The results in the study of Bettis et al. (2000) show that these
corporate trading prohibitions significantly reduce the insider trading activity during the blackout
periods compared to periods in which trading is allowed. Moreover, the profitability of insider
activity appears higher during the allowed trading period than during blackout periods. This is
consistent with the authors’ hypothesis that insiders must obtain permission to trade during the
blackout periods, and that this permission is granted only if the trade is liquidity motivated.
12
Ownership concentration was measured as the percentage of outstanding shares possessed by the five largest
shareholders.
13
3.5. The influence of trade characteristics on abnormal returns
Several trade characteristics appear to be of influence on the realized abnormal returns. Some
studies have investigated the influence of the trade size. On the one hand, one might expect that
the highest-volume trades reflect the strongest believe in future performance and the highest
quality of information. On the other hand, insiders might also conduct several smaller
transactions instead of one large transaction in order not to alert the market. Moreover, large
transactions may also be motivated by a quest for corporate control. These last two factors
militate against finding the highest-volume trades having the highest abnormal returns.
A first measure of the trade size is the value of the trade. The above mentioned positive relation
is found in Givoly & Palmon (1985), Seyhun (1986), and Aktas et al. (2008).13
Wisniewski & Bohl
(2005) and Aktas et al. (2007), respectively researching the Polish and Dutch stock markets do
not find a significant relationship.14
An alternative measure for the trade size is the proportion of the firm traded. This variable is
calculated as the number of shares trades during the transaction divided by the total number of
outstanding shares. Seyhun (1986), Jeng et al. (2003), and Cheuk et al. (2006) confirm the
positive relation between the relative trade size and the information contained in a transaction.
A possible effect on insider returns may also result from the person executing the transaction.
Firstly, it is possible that, when insiders expect high returns, they delegate their transaction to a
third person, like relatives or friends, in order to better camouflage the trade. This positive
relation is corroborated by Wisniewski & Bohl (2005) and Del Brio & Perote (2007). Jeng et al.
(2003) on the other hand do not find supporting evidence.
Secondly, the informational content of transactions may also depend on the position the insider
occupies within the corporation. The information hierarchy hypothesis postulates that directors
who are more familiar with the day-to-day operations of the company trade on more valuable
information than other directors. Support for this hypothesis is found by Seyhun (1986) and
Lin & Howe (1990). In contrast, Jeng et al. (2003) and Fidrmuc et al. (2006) do not find higher
abnormal returns for higher positioned directors. As a possible explanation the authors indicate
that these directors are subject to greater market scrutiny, and therefore trade more cautiously
and at less informative moments.15
13
Seyhun (1986) initially does not find a relationship between abnormal returns and the dollar value of a trade. Only after
taking the natural log, and putting less weight on extremely large dollar value transactions, a significant relation is found. 14
Aktas et al. (2007) do find that for long-term event-windows smaller transactions appear to be more informative. 15
Results of the studies are not directly comparable because of different methodologies in calculating the returns.

14
Bajo & Petracci (2004) investigate the importance of the initial ownership as a variable to
determine the information content of a change in insiders’ holdings. They assumed that changes
are not driven by a need for corporate control when the initial ownership is already reasonably
high. For instance, when a majority shareholder safely holds the control of the company, a
holding increase is likely to be driven by superior information. Bajo & Petracci (2004) find
supporting evidence.
Seyhun (1986) specifically investigate the influence of the net number of insiders executing a
trade on the magnitude of insiders’ abnormal profits.16
A positive relationship is found, similar to
a finding by Jaffe (1974). Still, it must be noted that in the first study, after also including the
natural log of the proportion of the firm traded, the net number of insiders variable is no longer
significant. This suggests that the significance of the net number of insiders is largely due to a
proxy effect of the proportion of the firm traded.
3.6. Abnormal returns of outsiders
Some studies address the question whether outsiders can profit from mimicking insiders’
behaviour. However, mixed results are found on this research topic. Seyhun (1986) and Rozeff &
Zaman (1988) show that, net of transaction costs, outsiders do not benefit by imitating insiders.
Also Lin & Howe (1990) conclude that outsiders cannot make abnormal returns, since insiders
themselves cannot gain excess returns in OTC markets after including transaction costs. More
recently, Del Brio et al. (2002) find that outsiders cannot outperform the Spanish stock market.
On the other hand, Jaffe (1974), Wisniewski & Bohl (2005), Cheuk et al. (2006), and Aktas et al.
(2007), argue that outsiders mimicking insiders can earn excess returns since there are still
significant abnormal gains after the reporting date, the moment outsiders cognizance of the
occurrence of insider trades. Moreover, examining the determinants of outsiders’ excess
returns, Toutkoushian (1996) states that the excess return outsiders can earn from replicating
any particular insider transactions does not only depend on the likelihood that the transaction
was motivated by an insider having private information, but also by the extent to which
potential excess returns have already been captured by other outsiders receiving information in
a more timely manner. Furthermore, the later study also proves that replicating purchases is less
profitable than the replication of sales.
16
Net number of insiders was defined as the absolute difference between the number of buyers and sellers.

15
4. Data
4.1. Insider trading data
The insider trading data used in this study were obtained upon request from the CBFA. The
database compromised 3,440 insider trades reported to the CBFA from January 2006 through
February 2009. Several filters were applied to clean up the initial data. First, transactions were
dropped if they were executed following 16 October 2008 because share prices and other
required data were only collected until 10 March 2009 and returns have to be computed up to
100 trading days following an insider trading event. Secondly, transactions involving companies
which were not listed 100 trading days following an insider trade were eliminated as well as
transactions of companies with missing data to form the control portfolios (see section 4.2).17
Next, trades not involving share, but for example options, warrants, or scripts, were also filtered
out. In addition, transactions other than ordinary sales and purchases, like conversions,
subscriptions, and options being exercised, were deleted. The final sample also excluded trades
that did not take place on Euronext Brussels. When transactions were reported before they were
executed, they were also removed from the sample. Finally, based on figure 1, trades with more
than 15 trading days between the execution date and the communication to investors were
deleted.
For illustration, the transactions constituting figure 1 had a mean number of days between the
transaction date and the announcement date of 13. This is much longer than the normal legal
period of five days. Moreover, only 52,92% of these transactions was reported after at most five
days following the insider trade event. Several explanations are possible. First, there is the
exception which allows reporting to be postponed in case of limited insider trading activity by a
particular person in a particular stock. Secondly, the CBFA-website reporting insiders’
transactions is not updated daily. Furthermore, it is possible that adjustments have to be made
to the reporting after the initial filling of a transaction, prolonging the period between the trade
and the reporting.
In conclusion, the set of applied filters resulted in a final sample of 1,567 transactions between
May 2006 and October 2008 (cfr. table 1).
17
Companies disappeared from the First Market of Euronext Brussels because of mergers and acquisitions or because they
transferred to Euronext Alternext.

16
FIGURE 1 Number of trading days between the transaction date and the reporting date.
18
TABLE 1 Filters used to obtain the final sample of 1,567 transactions
Initial sample 3,440
Deletion of
- Transactions executed after 16 October 2006
- Transactions involving companies not listed 100 trading days following the insider
trade
- Transactions involving companies with missing data to form control portfolios
- Transactions not involving shares
- Transactions not reflecting ordinary sales and purchases
- Transactions that did not taken place on Euronext Brussels
- Transactions reported before they were executed
- Transactions with more than 15 trading days between the transaction and reporting
date
238
222
279
687
57
176
1
213
Final sample 1,567
18
The histogram is based on a sample of 1,780 transactions, resulting from the first seven elimination steps mentioned in
table 1. The accompanying frequency table is provided in appendix 2.
0
50
100
150
200
250
300
1 3 5 7 9
11
13
15
17
19
21
23
25
27
29
31
33
35
37
39
41
43
45
47
49
51
53
55
57
59
Mo
re
Fre
qu
en
cy
Number of trading days between the transaction date and the reporting date
17
4.2. Other required data
In order to be able to compute abnormal returns, information is needed on security prices
inclusive of dividends and on market capitalisation and market-to-book ratios. The latter two
variables are used to form benchmark portfolios.
For the construction of these portfolios, all companies listed on Euronext Brussels were
considered, irrespective of whether they had experienced insider trades. An overview of these
corporations was collected from the official Euronext-website.19
Starting from an original sample
of 174 listed companies, excluding strips and preference shares, 40 companies were deleted due
to missing data with regard to share prices and/or market-to-book ratios. This resulted in a final
set of 134 companies for the construction of benchmark portfolios.20
The data on market capitalisation and market-to-book ratios were mainly collected from
Datastream. Market capitalisation was defined as the share price multiplied by the number of
ordinary shares in issue, while market-to-book ratio was calculated as the market value of the
ordinary equity divided by the balance sheet value of the ordinary equity in the company. For
share certificates listed on Euronext Brussels, information on this book value of equity was
collected by hand from the annual reports of the respective companies, because only their
market capitalisation was included in Datastream.
Further, time series of share prices adjusted for capital actions were also gathered from
Datastream. Stock prices including dividends were not available in this database. Therefore,
information on dividends issued by companies listed on Euronext Brussels was copied manually
from the website of the Belgian financial magazine “De Tijd”.21
The dividends were first
converted into Euro when necessary, then adjusted for capital actions and finally added to the
adjusted prices.
5. Descriptive statistics
The total sample of 1,567 insider trades compromises of 928 purchases and 639 sales. As in
Cheuk et al. (2006), discussing Hong Kong, there were more buyers than sellers on the Belgian
stock market. A potential explanation might by the ownership structure of Belgian listed
19
www.euronext.com 20
In appendix 3 an overview of the sample of listed companies is provided. Companies were first filtered out based on the
availability of stock prices and secondly based on market-to-book values. 21
www.tijd.be
18
companies which is characterised by a high percentage of firms having a single controlling owner
(Faccio & Lang, 2002).22
This potentially results in more control induced trades.
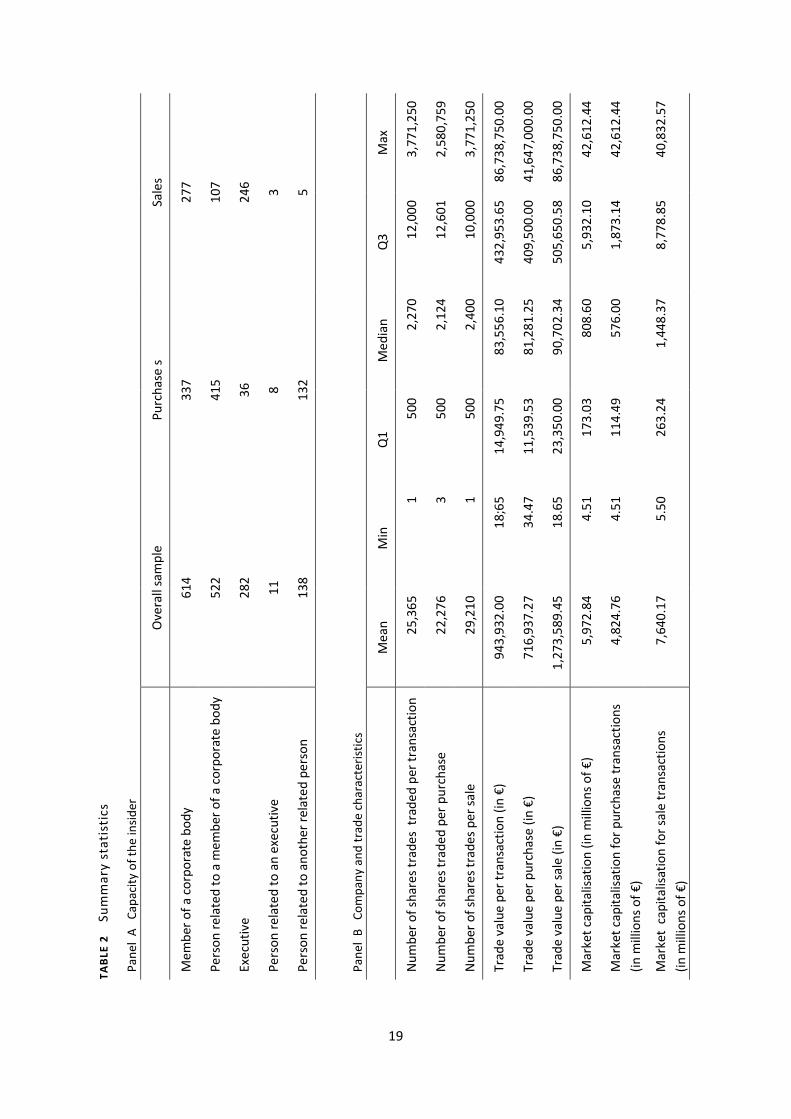
Table 2 presents some descriptive statistics on the insiders’ transactions. Panel A indicates that
614 trades were linked to members of a corporate body, 522 were executed by persons related
to them, 282 transactions were performed by executives, and 11 by persons related to them.
Finally, 138 trades could be linked to persons related to another related person.
More insight on company and trade characteristics is provided by panel B. On average,
25,365 shares were traded per transaction. In case of insider purchase, the average was
22,276 shares, the median being 2,124 shares. On the other hand, insider sales had a mean
of 29,210 shares traded per transaction and a median of 2,400 shares. The trade value
ranges from € 18.65 to € 86,738,750.00, with an average of € 943,932.00 and a median of
€ 83,556.10. A comparison by type of transaction shows that the average trade value in case
of insider sales (€ 1,273,589.45) is much higher than for insider purchases (€ 716,937.27).
Also market capitalisation is higher for sale transactions, indicating a tendency of Belgian
insiders to sell in large stocks and buy in small stocks.
6. Methodology
To measure market reaction around insider trading days a standard event-study methodology
was adopted. The application requires several steps. First, the event must be determined, in this
case the execution or reporting of an insider trade, denoted as day 0. Next, the event window
must be chosen, 100 trading days. Then, normal returns must be estimated and abnormal and
cumulative abnormal returns must be calculated and their significance must be tested.
For the measurement of abnormal returns several approaches are possible. A number of studies
uses the market model, which is based on a linear relationship between the stock return on a
share experiencing insider trading and the return on a market portfolio (e.g. Finnerty, 1976;
Seyhun, 1986; Cheuk et al., 2006). The procedure usually involves the estimation of the
parameters α and β by an ordinary least square regression over an observation period that
excludes the test period. Prediction errors in the test period are then defined as the abnormal
returns. The market adjusted model is also frequently applied (e.g. Lakonishok & Lee, 2001;
Aktas et al., 2007). This method consists of calculating the difference between the daily return of
the share considered and the market return recorded on that day .
22
A controlling shareholder is denoted as “alone” if no other owner controls at least 10% of the voting rights.
19
Sa
les
27
7
10
7
24
6
3
5
Ma
x
3,7
71
,25
0
2,5
80
,75
9
3,7
71
,25
0
86
,73
8,7
50
.00
41
,64
7,0
00
.00
86
,73
8,7
50
.00
42
,61
2.4
4
42
,61
2.4
4
40
,83
2.5
7
Q3
12
,00
0
12
,60
1
10
,00
0
43
2,9
53
.65
40
9,5
00
.00
50
5,6
50
.58
5,9
32
.10
1,8
73
.14
8,7
78
.85
Pu
rch
ase
s
33
7
41
5
36
8
13
2
Me
dia
n
2,2
70
2,1
24
2,4
00
83
,55
6.1
0
81
,28
1.2
5
90
,70
2.3
4
80
8.6
0
57
6.0
0
1,4
48
.37
Q1
50
0
50
0
50
0
14
,94
9.7
5
11
,53
9.5
3
23
,35
0.0
0
17
3.0
3
11
4.4
9
26
3.2
4
Ov
era
ll s
am
ple
61
4
52
2
28
2
11
13
8
Min
1
3
1
18
;65
34
.47
18
.65
4.5
1
4.5
1
5.5
0
Me
an
25
,36
5
22
,27
6
29
,21
0
94
3,9
32
.00
71
6,9
37
.27
1,2
73
,58
9.4
5
5,9
72
.84
4,8
24
.76
7,6
40
.17
TA
BL
E 2
Su
mm
ary
sta
tist
ics
Pa
ne
l A
C
ap
aci
ty o
f th
e i
nsi
de
r
Me
mb
er
of
a c
orp
ora
te b
od
y
Pe
rso
n r
ela
ted
to
a m
em
be
r o
f a
co
rpo
rate
bo
dy
Exe
cuti
ve
Pe
rso
n r
ela
ted
to
an
exe
cuti
ve
Pe
rso
n r
ela
ted
to
an
oth
er
rela
ted
pe
rso
n
Pa
ne
l B
C
om
pa
ny
an
d t
rad
e c
ha
ract
eri
stic
s
Nu
mb
er
of
sha
res
tra
de
s t
rad
ed
pe
r tr
an
sact
ion
Nu
mb
er
of
sha
res
tra
de
d p
er
pu
rch
ase
Nu
mb
er
of
sha
res
tra
de
s p
er
sale
Tra
de
va
lue
pe
r tr
an
sact
ion
(in
€)
Tra
de
va
lue
pe
r p
urc
ha
se (
in €
)
Tra
de
va
lue
pe
r sa
le (
in €
)
Ma
rke
t ca
pit
ali
sati
on
(in
mil
lion
s o
f €
)
Ma
rke
t ca
pit
ali
sati
on
fo
r p
urc
ha
se t
ran
sact
ion
s
(in
mil
lio
ns
of
€)
Ma
rke
t c
ap
ita
lisa
tio
n f
or
sale
tra
nsa
ctio
ns
(in
mil
lio
ns
of
€)

20
This paper however replicates the methodology used in Wisniewski & Bohl (2005) and uses a
control portfolio approach to compute the daily abnormal returns. The advantage of this method
is that no observation period is required. Moreover, previous research has provided evidence
that the market model does not provide a complete control for non-market effect. The
prediction errors incorporate for example size, P/E, and period of listing effects (Rozeff & Zaman,
1988). However, as in Wisniewski & Bohl (2005), additional research using market-adjusted
returns might be conducted to test the robustness of the conclusions based on the control
portfolio approach.
To construct the portfolios, the listed companies used in this study were first ranked based on
their market capitalisation and divided into three equal groups. Within these groups shares were
subsequently split into three groups according to their market-to-book ratios. This resulted into
nine control portfolios. The procedure was executed at 1 January of each year. Consequently, all
transactions for a specific security during a period from 1 January until 31 December of a
particular year were linked to the same portfolio. Moreover, the corresponding portfolio did not
change during the calculation of abnormal returns following an insider trading event. For
example, a security belonged to portfolio 1 in 2006 and to portfolio 2 in 2007 and a transaction
took place on 30 November 2006. Abnormal returns were calculated until 100 days following the
event day. Therefore, part of the abnormal returns were computed in 2007. In this case, the
returns on control portfolio 1, formed in 2006, were used to calculate all abnormal returns.
For the calculation of the portfolio returns, the daily returns of the securities belonging to a
particular portfolio were averaged. Abnormal returns (���,�) were then calculated by deducting
the return of the control portfolios from the return on a security that experienced an insider
trade:
���,� � � �,� – � ��� ,� for t = 0, 100 (1)
with ��,� the return on security i on day t, and ���� ,� the return on the control portfolio
corresponding with security i on day t. Next, the average abnormal returns were computed by aggregating the abnormal returns per
event day t and dividing them by the total number of events:
�������� � �� � ���,�
�� �� for t = 0, 100 (2)
were �������� is the average abnormal return on day t and N is the total number of events.

21
Finally, these average abnormal returns were summed over the time interval in question in order
to obtain the average cumulative abnormal returns:
������, �� � ∑ ���������� �� (3)
where �� and �� are, respectively, the beginning day and ending day of the summation.
The statistical significance of the observed average cumulative abnormal returns was evaluated
using a bootstrap-based test. This involves repeatedly sampling from the actual data in order to
empirically estimate the true distribution of a test statistic. The first step in generating an
empirical distribution of CARs is randomly selecting n combinations of a firm and a trading date
from the sample of listed companies used in this study and the universe of trading dates in the
period from May 2006 through October 2008. The parameter n was equal to 1,567 when the
profitability of the entire sample of insider trades was tested, 928 when the purchases were
evaluated, and 639 for the sale transactions. When testing the subsamples based on firm size
and trade value n was equal to one third of the previous numbers.
Next, the average cumulative abnormal return for the resulting sample was computed using the
method described above. This procedure was repeated 2000 times and the resulting CARs were
ranked from the lowest to the highest to obtain the empirical distribution. As an illustration,
figure 2 shows the empirical distribution obtained by this bootstrap method for the overall
sample. Similar distributions were found for the other subsamples. To evaluate the significance
of the CARs, the bootstrap p-value was calculated as S/2000 for CAR > 0 and (1 - S/2000) for
CAR < 0, where S stands for the number of simulated values above the actual profitability.
To test the robustness of the conclusions based on the bootstrap test, the sign test was applied
as an alternative non-parametric test free from assumptions concerning the underlying
distribution of abnormal returns. Under the null hypothesis of no abnormal event day return,
positive and negative abnormal returns are equally probable. The sign test statistic is given by:
����� � � � 0,5"��1 � �
$ %�/� ~ $�0,1
where p is defined as the proportion of stocks for which the cumulative abnormal return was
positive in a sample of size N. More specifically, for the overall sample it denoted how many of
the 1,567 insider trades had a positive cumulative abnormal return. When looking at insider
purchases and sales, p was respectively the portion of cumulative abnormal returns above zero
in a sample of 928 purchases and 639 sales.

22
FIGURE 2 Empirical distribution of CARs from day 1 until day 100 relative to an insider trade
obtained by bootstrapping and used to evaluated the significance of the CARs for the overall
sample.
7. Empirical results
7.1. Trade performance of insiders
Figure 3 shows the average cumulative abnormal returns for insiders relative to the insider
trading day up to 100 days following the insider trade. A remarkable observation is that buy
trades are only profitable for approximately 20 trading days following an insider trade.
Afterwards the abnormal returns for purchases are negative and show a clear downward trend.
In other words, Belgian insiders appear to buy shares that subsequently are not able to
outperform their peers. This is contradictory to the expectations. In the case of sell trades a
downward movement persisting for approximately 70 trading days is observed. This movement
is consistent with the assumptions because insiders gain when stock prices go down after they
sell.
0
20
40
60
80
100
120
140
160
180
-1,8 -1,6 -1,4 -1,2 -1 -0,8 -0,6 -0,4 -0,2 0 0,2 0,4 0,6 0,8 1 1,2 1,4
Fre
qu
en
cy

23
FIGURE 3 Cumulative abnormal returns over days 0 to 100 relative to the trading date.
Table 3 reports the cumulative abnormal returns over an event-window of 100 trading days
following an insider trade and provides more insight on the significance of these CARs. The null
hypothesis of zero abnormal returns is rejected based on the bootstrap test in both the purchase
and the sale subsample. The distribution free sign test only coincides with the bootstrap test for
the purchases. For both the sales and the overall sample significance levels differ between both
methods. It must however be noted that Kramer (2001) prefers the use of bootstrap tests in
event studies. The author argues that although the sign test demonstrates less bias than
conventional Z test statistics, still significant bias remains, especially in a sample with a small
number of firms.
For buy transactions, the significant CAR of -2,11% does not have the expected sign. Possible
explanation for the negative sign might be that these transactions are mainly driven by the
objective to obtain or maintain corporate control and less by a profit objective. This is consistent
with the observation that Belgian insiders appear to be net buyers as opposed to the majority of
insiders in previous research (e.g. Jenter, 2005; Wisniewski & Bohl, 2005; Aktas et al., 2007).
Selling transactions on the Belgian stock market prove to be profitable since the abnormal return
has the expected negative sign. Consequently, informativeness of insider transactions on the
Belgian stock market is coming from sale transactions.
-3
-2,5
-2
-1,5
-1
-0,5
0
0,5
1
0 5
10
15
20
25
30
35
40
45
50
55
60
65
70
75
80
85
90
95
10
0
Cu
mu
lati
ve
ab
no
rma
l re
turn
s (%
)
Days relative to the trading date
purchases
sales
24
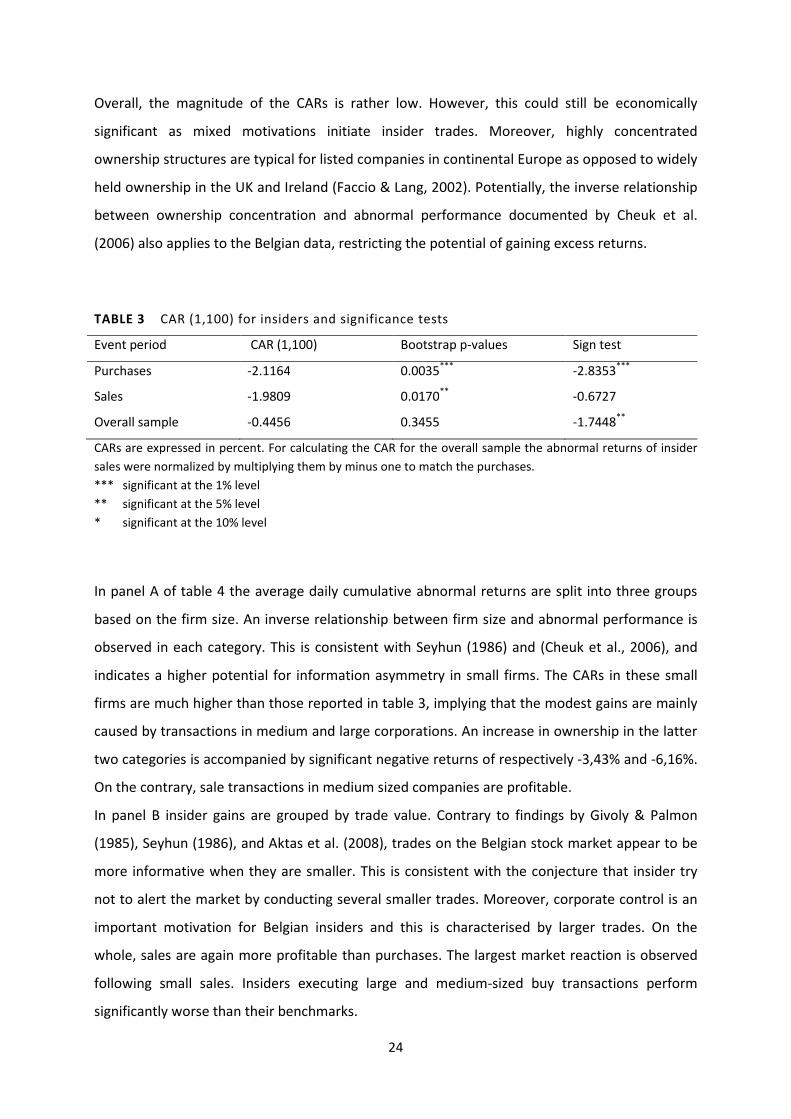
Overall, the magnitude of the CARs is rather low. However, this could still be economically
significant as mixed motivations initiate insider trades. Moreover, highly concentrated
ownership structures are typical for listed companies in continental Europe as opposed to widely
held ownership in the UK and Ireland (Faccio & Lang, 2002). Potentially, the inverse relationship
between ownership concentration and abnormal performance documented by Cheuk et al.
(2006) also applies to the Belgian data, restricting the potential of gaining excess returns.
TABLE 3 CAR (1,100) for insiders and significance tests
Event period CAR (1,100) Bootstrap p-values Sign test
Purchases -2.1164 0.0035***
-2.8353***
Sales -1.9809 0.0170**
-0.6727
Overall sample -0.4456 0.3455 -1.7448**
CARs are expressed in percent. For calculating the CAR for the overall sample the abnormal returns of insider
sales were normalized by multiplying them by minus one to match the purchases.
*** significant at the 1% level
** significant at the 5% level
* significant at the 10% level
In panel A of table 4 the average daily cumulative abnormal returns are split into three groups
based on the firm size. An inverse relationship between firm size and abnormal performance is
observed in each category. This is consistent with Seyhun (1986) and (Cheuk et al., 2006), and
indicates a higher potential for information asymmetry in small firms. The CARs in these small
firms are much higher than those reported in table 3, implying that the modest gains are mainly
caused by transactions in medium and large corporations. An increase in ownership in the latter
two categories is accompanied by significant negative returns of respectively -3,43% and -6,16%.
On the contrary, sale transactions in medium sized companies are profitable.
In panel B insider gains are grouped by trade value. Contrary to findings by Givoly & Palmon
(1985), Seyhun (1986), and Aktas et al. (2008), trades on the Belgian stock market appear to be
more informative when they are smaller. This is consistent with the conjecture that insider try
not to alert the market by conducting several smaller trades. Moreover, corporate control is an
important motivation for Belgian insiders and this is characterised by larger trades. On the
whole, sales are again more profitable than purchases. The largest market reaction is observed
following small sales. Insiders executing large and medium-sized buy transactions perform
significantly worse than their benchmarks.

25
TABLE 4 CAR (1,100) for insiders grouped by firm size and trade value
Panel A Firm size
Purchases Sales Overall sample
CAR(1,100) Bootstrap
p- values
CAR(1,100)
Bootstrap
p- values
CAR(1,100)
Bootstrap
p- values
Smallest 1/3 3.2500 0.0015***
-5.4726 0.0000***
2.7018 0.0015***
Middle 1/3 -3.4299 0.0035***
-2.1451 0.0840*
-1.4279 0.0935*
Largest 1/3 -6.1562 0.0000***
1.6751 0.0670*
-2.6066 0.0030***
Panel B Trade value
Purchases Sales Overall sample
CAR(1,100) Bootstrap
p- values
CAR(1,100)
Bootstrap
p- values
CAR(1,100)
Bootstrap
p- values
Smallest 1/3 0.8323 0.1740 -5.4525 0.0000***
2.3490 0.0025***
Middle 1/3 -3.0237 0.0075***
-1.4940 0.2020
-0.7482 0.2945
Largest 1/3 -4.1513 0.0015***
1.0039 0.1670 -2.9329 0.0015***
CARs are expressed in percent. For the calculation of CARs for the overall sample the abnormal returns of
insider sales were normalized by multiplying them by minus one to match the purchases.
*** significant at the 1% level
** significant at the 5% level
* significant at the 10% level
7.2. Trade performance of outsiders
Similar to figure 3, concerning abnormal returns for insiders, figure 4 also shows a negative trend
for both purchases and sales. Because it is assumed that insider trades become public
knowledge from the moment they are reported on the CBFA-website, cumulative abnormal
returns are calculated relative to the reporting date. The pattern of CARs for sell trades indicates
outsiders can realise profits when they invest in the long-term, not if they invest in the short run.
Imitating purchase transactions on the other hand is clearly an inferior investment strategy on
the Belgian stock market. In contrast to corporate insiders experiencing positive returns on
short-term investments (cfr. figure 3), there are no short-term gains for outsiders who buy
securities. This indicates that if insider purchase on short-term information, the notification term
of five days is insufficiently strict, since figure 3 shows a negative slope after approximately
seven days following an insider purchase.

26
FIGURE 4 Cumulative abnormal returns over days 0 to 100 relative to the reporting date.
Table 5 reports the cumulative abnormal returns for outsiders who mimic stock transactions
made by insiders. Bootstrap p-values for the whole sample as well as for the buy and sell
subsamples are above conventional rejection levels. Results for the sign test are comparable for
the purchases and for the overall sample. For sale transactions, the CAR is not significant according
to the sign test. Similar to the results for insiders, the figures indicate non-profitable buy trades
for outsiders. Replication of sale transactions on the other hand yields abnormal profits of
1,91%. The magnitude of the CARs for sales and purchases made by uninformed investors is
comparable to insiders’ CARs. In the long-term, insiders do not have a significant information
advantage.
TABLE 5 CAR (1,100) for outsiders and significance tests
Event period CAR (1,100) Bootstrap p-values Sign test
Purchases -2.4592 0.0010***
-3.1684***
Sales -1.9115 0.0180**
-0.1187
Overall sample -0.9904 0.0715*
-1.8111**
CARs are expressed in percent . For calculating the CAR for the overall sample the abnormal returns of insider
sales were normalized by multiplying them by minus one to match the purchases.
*** significant at the 1% level
** significant at the 5% level
* significant at the 10% level
-3
-2,5
-2
-1,5
-1
-0,5
0
0,5
0 5
10
15
20
25
30
35
40
45
50
55
60
65
70
75
80
85
90
95
10
0
Cu
mu
lati
ve
ab
no
rma
l re
turn
s
Days relative to the reporting date
purchases
sales

27
8. Conclusions
The previous study investigates the profits made by Belgian insiders on self-reported security
transactions. Overall, evidence was found against the strong as well as the semi-strong form of
the efficient market hypothesis. The first form was refuted because a significant market reaction
was found following insider trades. Evidence against the second form was provided by outsiders
earning significant excess returns. Most remarkable was the evidence of significant negative
abnormal returns after purchase transactions by corporate insiders. This finding is attributed to
the ownership structure in Belgian listed companies. However, further research is necessary to
investigate the significance of this relation.
A second suggestion for additional research is gaining a better understanding of the underlying
drivers of the abnormal profits. This could provide valuable information to outsiders applying an
investment strategy of mimicking insiders’ transactions in helping them select insider trades
which are more profitable than others to replicate. Previous research has already indicated that
the magnitude of abnormal profits is related to firm and trade characteristics like book-to-
market ratios, firm size, trade value, type of insider, etc. This study already observed an inverse
relationship between abnormal gains and the firm and trade size. However, other determinants
might also be of influence on the Belgian data.
Further, it might also be investigated whether alternative event windows would lead to other
conclusions. The results already seemed to indicate that positive abnormal gains on insider
purchases could be found when applying a short-term event window. The significance of these
returns was however not tested within the scope of this inquiry.
Moreover, abnormal returns may also be examined in a period preceding the insider trade. This
can provide more insight on whether Belgian insiders are contrarian.

VII
References
Aboody D., and B. Lev, 2000, Information asymmetry, R&D, and insider gains, Journal of Finance,
55, pp. 2747-2766.
Aktas N., E. de Bodt, J. de Smedt, and I. Riachi, 2007, Legal insider trading and stock market
reaction: Evidence from the Netherlands, Université catholique de Louvain, CORE Discussion
Paper, 2007/67.
Aktas N., E. de Bodt, and H. Van Hoppens, 2008, Legal insider trading and market efficiency,
Journal of Banking & Finance, 32, pp. 1379-1392.
Bajo E., and B. Petracci, 2004, Do what insiders do: Abnormal performances after the release of
insiders’ relevant transactions, University of Bologna, Working paper.
Bettis J.C., J.L. Coles, and M.L. Lemmon, 2000, Corporate policies restricting trading by insiders,
Journal of Financial Economics, 57, pp. 191-220.
Bris A., 2005, Do insider trading laws work?, European Financial Management, 11, pp. 267-312.
Cheuk M.-Y., D.K. Fan, and R.W. So, 2006, Insider trading in Hong Kong: some stylized facts,
Pacific-Basin Finance Journal, 14, pp. 73-90.
Del Brio E.B., A. Miguel, and J. Perote, 2002, An investigation of insider trading profits in the
Spanish stock market, Quarterly Review of Economics & Finance, 42, pp. 73-94.
Del Brio E.B., and J. Perote, 2007, What enhances insider trading profitability, Atlantic Economic
Journal, 35, pp. 173-188.
Eckbo E.B., and D.C. Smith, 1998, The conditional performance of insider trades, Journal of
Finance, 53, pp. 467–498.
Faccio M., and L.H.P. Lang, 2002, The ultimate ownership of Western European corporations,
Journal of Financial Economics, 65, pp. 365-395.
Fama E.F., 1970, Efficient capital markets: A review of theory and empirical work, Journal of
Finance, 25, pp. 383-417.
Fidrmuc J., M. Goergen, and L. Renneboog, 2006, Insider trading, news releases and ownership
concentration, Journal of Finance , 61, pp. 2931–2973.

VIII
Finnerty J.E., 1976, Insiders and market efficiency, Journal of Finance, 31, pp. 1141-1148.
Givoly D., and D. Palmon, 1985, Insider trading and the exploitation of inside information: Some
empirical evidence, Journal of Business, 58, pp. 69-87.
Huddart S.J., and B. Ke, 2002, Information asymmetry and cross-sectional variation in insider
trading, Contemporary accounting research, 24, pp. 195-232
Jaffe J., 1974, Special information and insider trading, Journal of Business, 47, pp. 410-428.
Jeng L., A. Metrick, and R. Zeckhauser, 2003, The Profits to Insider Trading: A Performance-
Evaluation Perspective, Review of Economics and Statistics, 85, pp. 453-471.
Jenter D., 2005, Market timing and managerial portfolio decisions, The Journal of Finance, 9,
pp. 1903-1949.
Kramer L., 2001, Alternative methods for robust analysis in event study applications, in C. F. Lee
(Ed.), Advances in investment analysis and portfolio management, Vol. 8, pp. 109–132, Elsevier
Science Ltd.
Lakonishok J., and I. Lee, 2001, Are insider trades informative?, Review of Financial Studies, 14,
pp. 79–111.
Leland H.E., 1992, Insider trading: should it be prohibited?, Journal of Political Economy, 100,
pp. 859-887.
Lin J., and J.S. Howe, 1990, Insider Trading in the OTC Market, Journal of Finance, 55, pp. 1273–
1284.
Piotroski J.D., and D.T. Roulstone, 2005, Do insider trades reflect both contrarian beliefs and
superior knowledge about future cash flow realizations?, Journal of Accounting and Economics,
39, pp. 55-81.
Rozeff M., and M. Zaman, 1988, Market efficiency and insider trading: new evidence, Journal of
Business, 61, pp. 25–44.
Seyhun N., 1986. Insiders’ profits, costs of trading, and market efficiency, Journal of Financial
Economics, 16, pp. 189–212.

IX
Scott J., and P. Xu, 2004, Some insider sales are positive signals, Financial Analysts Journal, 60,
pp. 44-51.
Singh K., 2007, Insider trading and corporate ethics: a case study of Rene Rivkin,
www.cpaaustralia.com.au.
The Belgian Official Journal, 1990, Law of 4 December 1990 on financial transactions and
financial markets, www.just.fgov.be.
The Belgian Official Journal, 2002, Law of 2 August 2002 on the supervision of the financial sector
and on financial services, www.just.fgov.be.
The Belgian Official Journal, 2005, Royal Decree of 24 August 2005 to amend, with respect to the
provisions regarding market manipulation, the Act of 2 August 2002 on the supervision of the
financial sector and financial services, www.just.fgov.be.
The Belgian Official Journal, 2006, Royal Decree of 6 March 2006 on market abuse,
www.just.fgov.be.
The Committee of European Securities Regulators, 2002, CESR’s Advice on Level 2 Implementing
Measures for the proposed Market Abuse Directive, www.cesr-eu.org.
The Council of the European Communities, 1989, Council directive 89/592/EEC of 13 November
1989 coordinating regulations on insider dealing, http://eur-lex.europa.eu.
The European Parliament and the Council of the European Union, 2003, Directive 2003/6/EC of
the European Parliament and of the Council of 28 January 2003 on insider dealing and market
manipulation (market abuse), http://eur-lex.europa.eu.
Toutkoushian R.K., 1996, Determinants of outsider excess returns from insider transactions and
semi-strong form efficiency, Applied Financial Economics, 6, pp. 155 162.
Wisniewski T.P., and M.T. Bohl, 2005, The information content of registered insider trading
under lax law enforcement, International Review of Law and Economics, 25, pp. 169-185

Appendix 1.1
Appendix 1
This is a non-exhaustive and indicative list of examples, which constitutes a starting point to the
assessment of whether the information is inside information. However the evaluation, in
concrete cases, of whether the threshold to «inside information» has been crossed depends
considerably on the specific circumstances in each single case. For this reason, this list should
not be envisaged as comprehensive and therefore it should not become a legal rule.
Information, which directly concerns the issuer:
- Changes in control and control agreements;
- Changes in management and supervisory boards ;
- Changes in auditors or any other information related to the auditors activity;
- Operations involving the capital or the issue of debt securities or warrants to buy or subscribe
securities;
- Decisions to increase or decrease the share capital
- Mergers, splits and spin-off;
- Purchase or disposal of equity interests or other major assets or branches of corporate
activity;
- Restructurings or reorganizations that have an effect on the issuer’s assets and liabilities,
financial position or profits and losses;
- Decisions concerning buy-back programmes or transactions in other listed financial
instruments;
- Changes in the class rights of the issuer’s own listed shares;
- Filing of petitions in bankruptcy or the issuing of orders for bankruptcy proceedings;
- Significant legal disputes;
- Revocation or cancellation of credit lines by one or more banks;
- Dissolution or verification of a cause of dissolution;
- Relevant changes in the assets’ value:
- Insolvency of relevant debtors;
- Reduction of real properties’ values;
- Physical destruction of uninsured goods;
- New licences, patents, registered trademarks;

Appendix 1.2
- Decrease or increase in value of financial instruments in portfolio;
- Decrease in value of patents or rights or intangible assets due to market innovation;
- Receiving acquisition’s bids for relevant assets;
- Innovative products or processes;
- Serious product liability or environmental damages cases;
- Changes in expected earnings or losses;
- Relevant orders received from customers, their cancellation or important changes;
- Withdrawal from or entering into new core business areas;
- Relevant changes in the investment policy of the issuer;
- Ex-dividend date, dividend payment date and amount of the dividend; changes in dividends
- policy payments
The following list comprehends examples, which would usually only concern the issuer indirectly.
[...]
- Data and statistics published by public institutions disseminating statistics;
- The coming publication of rating agencies’ reports, research, recommendations or
suggestions concerning the value of listed financial instruments;
- Central bank decisions concerning interest rate;
- Government’s decision concerning taxation, industry regulation, debt management, etc.
- Decisions concerning changes in the governance rules of market indices, and especially as
regards their composition ;
- Regulated and unregulated markets’ decisions concerning rules governing the markets;
- Competition and market authorities’ decisions concerning listed companies;
- Relevant orders by government bodies, regional or local authorities or other public
organizations;
- Relevant orders to trade financial instruments;
- A change in trading mode (e.g., information relating to knowledge that an issuer’s financial
instruments will be traded in another market segment: e.g. change from continuous trading
to auction trading); a change of market maker or dealing conditions.
Source: The Committee of European Securities Regulators, 2002, CESR’s Advice on Level 2 Implementing
Measures for the proposed Market Abuse Directive, pp. 11-14, www.cesr-eu.org.

Appendix 2.1
Appendix 2
Frequency table accompanying figure 1
Frequency Frequency
1 28 31 5
2 144 32 5
3 275 33 6
4 243 34 4
5 252 35 2
6 199 36 7
7 139 37 8
8 70 38 2
9 43 39 3
10 48 40 3
11 34 41 2
12 24 42 1
13 25 43 2
14 21 44 0
15 22 45 1
16 10 46 0
17 7 47 1
18 10 48 0
19 6 49 0
20 10 50 0
21 4 51 0
22 12 52 0
23 8 53 1
24 5 54 1
25 4 55 1
26 6 56 1
27 7 57 0
28 8 58 1
29 2 59 0
30 6 60 1
More 50

Appendix 3.1
Appendix 3
Listed companies used for the formation of the control portfolios
1. AB Inbev
2. Accentis
3. Ackermans V.Haaren
4. Agfa-Gevaert
5. Alcatel-Lucent
6. Anglogold Ash Cert
7. Arthur
8. Atenor Group
9. Auximines
10. Barco
11. Befimmo-Sicafi
12. Bekaert
13. Belgacom
14. Belreca
15. Beluga
16. Boeing Cert
17. Bque Nat. Belgique
18. Brederode
19. Campine
20. Catala
21. Caterpillar Cert
22. CFE (D)
23. Cie Bois Sauvage
24. Cimescaut
25. CMB
26. Cofinimmo-Sicafi
27. Colruyt
28. D'ieteren
29. Deceuninck
30. Deficom Group
31. Delhaize Group
32. Devgen
33. Dexia
34. Dow Chemical Cert
35. Drdgold Cert
36. Duvel Moortgat
37. Econocom Group
38. Elia
39. Epiq (D)
40. Euronav
41. EVS Broadc.Equipm.
BE0003793107
BE0003696102
BE0003764785
BE0003755692
FR0000130007
BE0088072930
FR0004166155
BE0003837540
BE0003787042
BE0003790079
BE0003678894
BE0003780948
BE0003810273
BE0020575115
BE0003723377
BE0004066891
BE0003008019
BE0003792091
BE0003825420
BE0003434397
BE0004402377
BE0003883031
BE0003592038
BE0003304061
BE0003817344
BE0003593044
BE0003775898
BE0003669802
BE0003789063
BE0003624351
BE0003562700
BE0003821387
BE0003796134
BE0004594355
BE0004520582
BE0003762763
BE0003563716
BE0003822393
BE0045646560
BE0003816338
BE0003820371
42. Exmar
43. Floridienne
44. Ford Motor Cert
45. Fortis
46. Fountain
47. Galapagos
48. GBL
49. GDF Suez
50. General Elect.Cert
51. General Motorscert
52. Gimv
53. Goldfields(X.Drief)
54. Goodyear Cert
55. Hamon
56. Harmony Cert
57. Henex
58. Home Inv.Belg-Sifi
59. I.R.I.S Group
60. IBA
61. IBM Cert
62. IBT (D)
63. Immobel
64. ING Groep
65. ING Groep Cert
66. Interv.Retail-Sifi
67. Intervest Offices
68. Ipte
69. Itb-Tradetech
70. Jensen-Group
71. KBC
72. KBC Ancora
73. Keyware Tech. (D)
74. Kinepolis Group
75. Lotus Bakeries
76. Melexis (D)
77. Miko
78. Mitiska
79. Mobistar
80. Moury Construct
81. Neufcour-Fin.
82. Omega Pharma
BE0003808251
BE0003215143
BE0004571122
BE0003801181
BE0003752665
BE0003818359
BE0003797140
FR0010208488
BE0004399342
BE0004593340
BE0003699130
BE0004529674
BE0004359916
BE0003700144
BE0004558962
BE0003873909
BE0003760742
BE0003756708
BE0003766806
BE0004607488
BE0003689032
BE0003599108
NL0000303600
BE0004523610
BE0003754687
BE0003746600
BE0003786036
BE0003633444
BE0003858751
BE0003565737
BE0003867844
BE0003880979
BE0003722361
BE0003604155
BE0165385973
BE0003731453
BE0003761757
BE0003735496
BE0003602134
BE0003680916
BE0003785020

Appendix 3.2
83. Option
84. Parc Paradisio
85. Payton Planar
86. PCB
87. Peugeot
88. Pfizer Cert
89. Picanol
90. Pinguinlutosa
91. Punch Int.
92. Questfor Gr-Pricaf
93. Realdolmen
94. Recticel
95. Resilux
96. Retail Est.-Sicafi
97. RHJ International
98. Rio Tinto Cert
99. Robeco
100. Rolinco
101. Rorento
102. Rosier
103. Roularta
104. Sabca (D)
105. Saint Gobain
106. Sapec
107. Scheerd.V Kerchove
108. Serviceflats Cert
BE0003836534
BE0003771855
IL0010830391
BE0003503118
FR0000121501
BE0004536745
BE0003807246
BE0003765790
BE0003748622
BE0003730448
BE0003732469
BE0003656676
BE0003707214
BE0003720340
BE0003815322
BE0004559978
NL0000289783
NL0000289817
ANN757371433
BE0003575835
BE0003741551
BE0003654655
FR0000125007
BE0003625366
BE0012378593
BE0003677888
109. Sioen
110. Sipef (D)
111. Sofina
112. Solvac Nom(Retail)
113. Solvay
114. Spadel
115. Spector
116. Sucraf A & B
117. Systemat
118. Telenet Group
119. Ter Beke
120. Tessenderlo
121. Think-Media
122. Total
123. Tubize-Fin
124. UCB
125. Umicore (D)
126. Unibra
127. Van De Velde
128. VPK Packaging
129. Vranken-Pommery
130. Warehouses-Sicafi
131. WDP-Sicafi
132. Wereldhav B-Sicafi
133. Zenitel
134. Zetes Industries
BE0003743573
BE0003898187
BE0003717312
BE0003545531
BE0003470755
BE0003798155
BE0003663748
BE0003463685
BE0003773877
BE0003826436
BE0003573814
BE0003555639
BE0003804219
FR0000120271
BE0003823409
BE0003739530
BE0003884047
BE0003064574
BE0003839561
BE0003749638
FR0000062796
BE0003734481
BE0003763779
BE0003724383
BE0003806230
BE0003827442
Listed companies deleted from the sample because of missing data regarding stock prices
1. 4Energy Inv (D)
2. Ablynx (D)
3. Aedifica
4. Alfacam Group
5. Arseus (D)
6. Ascencio (D)
7. Banimmo A (D)
8. Brookfield Cert A
9. Immo Moury (D)
10. KBC Groep Nv (D)
11. Metris
BE0003888089
BE0003877942
BE0003851681
BE0003868859
BE0003874915
BE0003856730
BE0003870871
BE0004601424
BE0003893139
BE0380299595
BE0003859767
12. Montea C.V.A.
13. Nyrstar (D)
14. Oncomethylome
15. Punch Telematix
16. Suez Environnement
17. Thenergo (D)
18. Thrombogenics
19. Tigenix Nv
20. Transics Int.
21. VGP
BE0003853703
BE0003876936
BE0003844611
BE0003855724
FR0010613471
BE0003895159
BE0003846632
BE0003864817
BE0003869865
BE0003878957

Appendix 3.3
Listed companies deleted from the sample because of missing data regarding market-to-book
values
1. Aardvark Invest
2. Arcelormittal
3. Biotech (Pricaf)
4. Brookfield(Temp)
5. Cegedel
6. Distrigaz Cat.D
7. Envipco Hold. Cert
8. Fluxys Cat.D
9. Foyer
10. Global Graphics
LU0111311071
LU0323134006
BE0003795128
BE0004532702
LU0093533643
BE0003802197
NL0000349439
BE0003803203
LU0112960504
FR0004152221
11. Imperial Oil
12. Leasinvest-Sicafi
13. Medivision
14. Mopoli
15. Mopoli Fond
16. Nat Portefeuil (D)
17. RTL Group
18. Texaf
19. Unitronics
BE0004602430
BE0003770840
IL0010846314
NL0000488153
NL0000488161
BE0003845626
LU0061462528
BE0003550580
IL0010838311

