an awwa regulatory update - ca-nv...
TRANSCRIPT

An AWWA Regulatory Update
Presented at
California Nevada American Water Works Association
Sacramento, CA
October 1, 2013

Water Infrastructure Financing and Innovation Authority
• Two pronged approach:– For large projects: low interest
direct loans or guarantees– For small projects: low interest
loans through State Revolving Funds
• Loans will be made at Treasury interest rates
• The default rate for water projects bonds is < 0.04%.
• The federal subsidy – which must be appropriated – is extremely low.
Highly Leveraged TIFIA Model
$122 million in appropriated budget authority supports more than $1 billion in annual credit assistance.

Number of Water Systems
Source: SDWIS Pivot Tables for Period 7/1/2011 to 6/30/2012
TypeVery Small
(<500)Small
(501-3,300)
Medium (3,301-10,000)
Large (10,001-100,000)
Very Large (>100,000)
Grand Total
NationCWS 27,965 13,673 4,921 3,821 423 50,803NTNCWS 15,226 2,538 141 16 1 17,922
TNCWS 79,129 2,708 92 13 2 81,944Total Systems (Nation) 122,320 18,919 5,154 3,850 426 150,669
CaliforniaCWS 1,959 465 232 344 88 3,088
NTNCWS 1,426 156 9 1,591
TNCWS 3,098 185 31 5 3,319Total Systems (State) 6,483 806 272 349 88 7,998
NevadaCWS 125 55 19 11 4 214
NTNCWS 101 15 6 122TNCWS 237 7 244
Total Systems (State) 463 77 25 11 4 580

SDWA Regulatory Activity
2014CCL3 Final(10/2009)
2012 2013 2015 2016
Reg Det 3 Final(<9/2014)1
Proposed Rule(s)(<9/2016)*
2017
Final Rule(s)(<1/2018)1
Reg Det 3 Proposal(late 2013 / early2014)
Six-Year 2(3/2010)
LT-LCR Proposal(2015 – 2016?)
RTCR Final(2/2013)
Note: (1) Reflects missed or likely to be missed statutory deadlines.As yet unassigned (fluoride, acrylamide, epichlorohydrin, total chromium / Cr(VI))
Key
Proposal – no fillFinal – filledUncertain – cross hatchedUnique color for related regulatory actions
CCL4 Final(<10/2014) *
CCL4 Proposal(<6/2014)
eCCR Memo(1/2013)
UCMR3 Monitoring(1/2013 – 12/2015)
Round 2 LT2ESWTR Monitoring(4/2015 – 5/2021)
RTCR Effective(4/ 2016)
ClO4- Final
(>11/2015) 1
UCMR3 Final(5/2012)
LT2ESWTR Laboratory List Avail (12/2013)
Stage 2 DBPR & LT2ESWTR Compliant (4/2012 …..
Carcinogenic VOCs Proposal
(2014?)
LT-LCR Final(2017 – 2019?)
LT-LCR Stakeholder Process (10/2013 – mid/late 2014)
Carcinogenic VOCs Final
(>10/2015?)
ClO4- Proposal
(2/2013) 1
ClO4- Proposal
(early 2014?)
Six-Year 3 (12/2015)*

Stage 2 DBPR
• Transitioning to LRAA– Operational evaluations– MCL violations
20142010 2012 2016 2018
>100,000 pop(April 1, 2012)
Stage 2 DBPR(2006)
2020
Stage 1 DBPR(1998)
50,000 –99,999 pop
(Oct 1, 2012)
10,000 –49,999 pop
(Oct 1, 2013)
Start Stage 2 DBPR Compliance Monitoring
<10,000 pop(Oct 1, 2014)
Compliant with Stage 2 DBPR LRAA after 1 year.
Federal GuidanceShift to Stage 2 DBPR monitoring locations occurs regardless of two year extension for capital improvements.
Post-Six-Year Review Revision(Typical Schedule
2021)
Possible 2-year extensions for capital improvements

Future SDWA Regulations for DBPs
2010 2020
Six-YearReview
(Dec, 2015)
Will reviewStage 1 DBPR,Stage 2 DBPR, GWR, IESWTR,
LT1ESWTR, LT2ESWTR, etc.
• Change in regulation is not required.
• No statutory timeframe for action.• Any subsequent rulemaking
process typically >4 years in length.
• Any requirements unlikely to be effective within <7 yrs of 6-Year Review
Reg. Determinations
(late 2013 – early2014?)
Anticipated to consider two disinfection
byproducts –nitrosamines and
chlorate.
• If included regulation is a distinct possibility.
• Statutory timeline for rulemaking, 42 months
• Any requirements unlikely to be effective within <7 yrs of Reg. Det. 3
TODAY

UCMR2 NDMA Observations by System Class
SourceGW – Ground WaterSW – Surface WaterMX - Mixed
DisinfectantBlank – Disinfection not indicatedCL – Free ChlorineCA – Monochloramine
Sample LocationEP – Entry Point to Distribution SystemMR – Maximum Residence Time
Chlorine Chloramines Unknown
MRL
ng/
L
Source: Hrudey et al., Relative Contribution of Drinking Water to Total Nitrosamine Exposure , AWWA Webcast (2012)
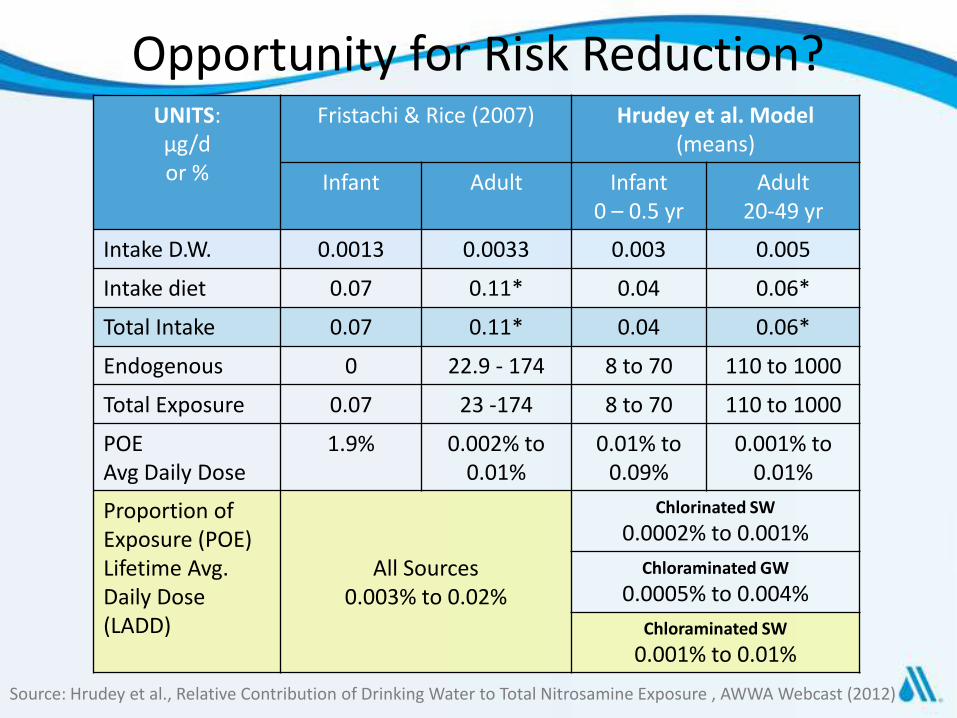
UNITS:µg/d or %
Fristachi & Rice (2007) Hrudey et al. Model (means)
Infant Adult Infant0 – 0.5 yr
Adult20-49 yr
Intake D.W. 0.0013 0.0033 0.003 0.005
Intake diet 0.07 0.11* 0.04 0.06*
Total Intake 0.07 0.11* 0.04 0.06*
Endogenous 0 22.9 - 174 8 to 70 110 to 1000
Total Exposure 0.07 23 -174 8 to 70 110 to 1000
POE Avg Daily Dose
1.9% 0.002% to 0.01%
0.01% to 0.09%
0.001% to 0.01%
Proportion of Exposure (POE)Lifetime Avg.Daily Dose(LADD)
All Sources0.003% to 0.02%
Chlorinated SW
0.0002% to 0.001%
Chloraminated GW
0.0005% to 0.004%
Chloraminated SW
0.001% to 0.01%
Source: Hrudey et al., Relative Contribution of Drinking Water to Total Nitrosamine Exposure , AWWA Webcast (2012)
Opportunity for Risk Reduction?

• Chlorate Risk
– EPA Pesticide Program identified drinking water as primary source of exposure
– OPP risk assessment based on thyroid effect in rats
• Associated with use of
– Chlorine dioxide
– Hypochlorite
Chlorate
• Contribution from hypochlorite is not insignificant
– Formed during manufacture
• Bulk and
• On-site generation
– Formed during bulk supply transport
– Formed during storage
• Monitoring ongoing in UCMR3

• Control removal of transition metal ions by
– Purchasing filtered hypochlorite solution
– Using low metal ion concentration feed water for OSG systems
• If using OSG hypochlorite use low-bromide salt
• Dilute stored hypochlorite solutions upon delivery
• Store hypochlorite solutions at lower temperatures
• Control the pH of stored hypochlorite solutions at pH 11-13
• Use fresh hypochlorite solution when possible
Source: Hypochlorite—An Assessment of Factors that Influence the formation of Perchlorate and Other Contaminants, AWWA/WaterRF, 2010.
Managing Chlorate Formation
Link to Hypochlorite Assessment Toolhttp://www.awwa.org/resources-tools/water-knowledge/hypochlorite-assessment-model.aspx
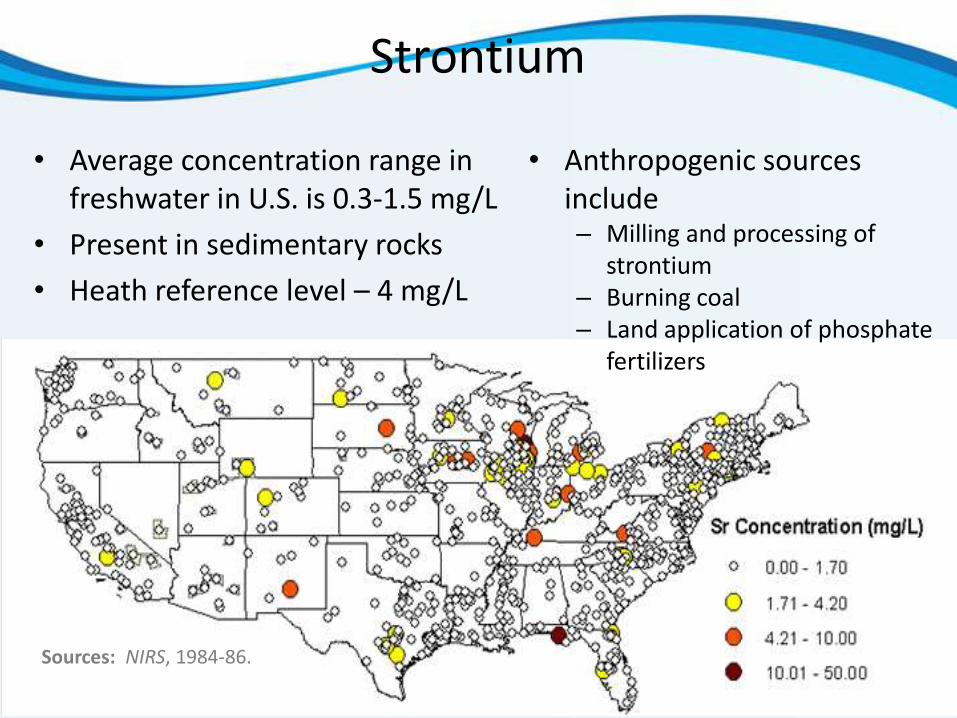
Strontium
• Average concentration range in freshwater in U.S. is 0.3-1.5 mg/L
• Present in sedimentary rocks
• Heath reference level – 4 mg/L
• Anthropogenic sources include – Milling and processing of
strontium– Burning coal– Land application of phosphate
fertilizers
Sources: NIRS, 1984-86.
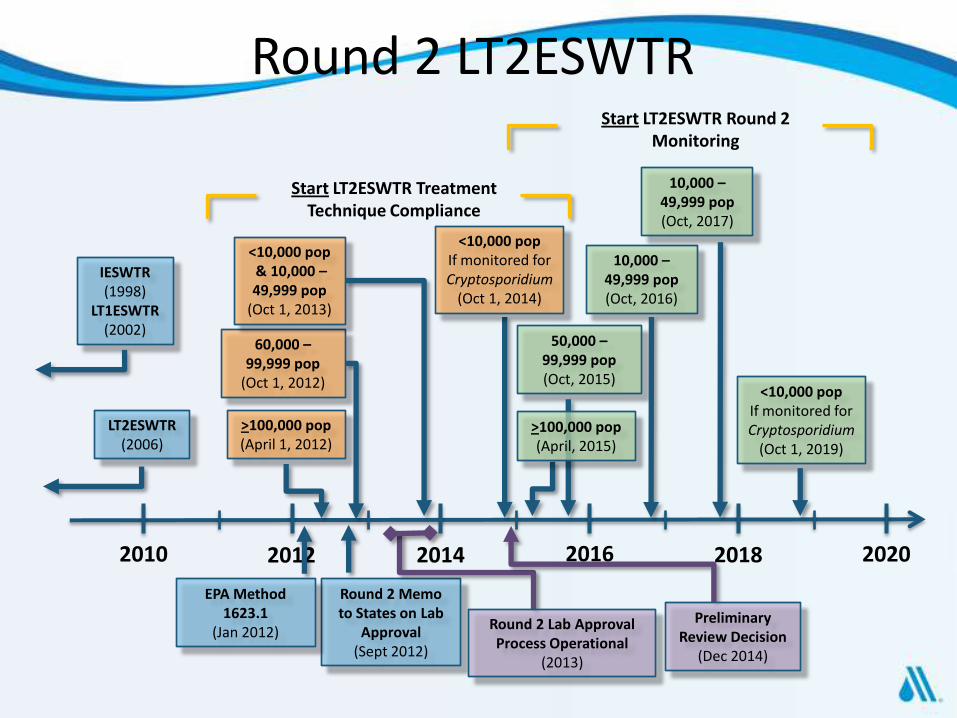
Round 2 LT2ESWTR
20142010 2012 2016 2018
>100,000 pop(April 1, 2012)
LT2ESWTR(2006)
2020
IESWTR(1998)
LT1ESWTR(2002)
60,000 –99,999 pop
(Oct 1, 2012)
<10,000 pop& 10,000 –49,999 pop
(Oct 1, 2013)
Start LT2ESWTR Treatment Technique Compliance
<10,000 popIf monitored for Cryptosporidium
(Oct 1, 2014)
Round 2 Memo to States on Lab
Approval(Sept 2012)
EPA Method 1623.1
(Jan 2012)
50,000 –99,999 pop(Oct, 2015)
10,000 –49,999 pop(Oct, 2016)
<10,000 popIf monitored for Cryptosporidium
(Oct 1, 2019)
10,000 –49,999 pop(Oct, 2017)
>100,000 pop(April, 2015)
Round 2 Lab Approval Process Operational
(2013)
Preliminary Review Decision
(Dec 2014)
Start LT2ESWTR Round 2 Monitoring

Location Type
N Total
NBinned
N (%) with Any Detected
Cryptosporidium
N (%) Bin 1
N (%) Bin 2
N (%) Bin 3
All 1542 1162 576 (50%) 1079 (93%) 83 (7%) 0
GWUDI 118 80 19 (24%) 78 (98%) 2 (2%) 0
SW 1325 997 505 (51%) 921(92%) 76 (8%) 0
Source Type Variable
99 85 52 (60%) 80 (94%) 5 (6%) 0
SW-FS 438 324 224 (69%) 275 (85%) 49 (15%) 0
SW-RL 578 446 168 (38%) 432 (97%) 14 (3%) 0
SW-uncertain
309 227 113 (50%) 214 (94%) 13 (6%) 0
Source: LT2ESWTR Round 1 Monitoring DCTS Data and Calculated Bin Results (2012)
Round 1 LT2ESWTR ObservationsSystems >10,000 pop.

WA
MT
ID
WY
NV
CA
UT
CO
AZNM
NE
KS
OK
TX
SD
ND
MN
IA
MO
AR
LA
MS AL
WI
IL
MI
MI
INOH
PA
WVVA
KY
TNNC
SC
NY
VT
ME
NH
MACT
RINJ
DE
MD
DC
GA
FL
AK
HIPR
OR
2 4 1
21
2
1
1
1
1
1
11
1
3
2 4
1
11
1
1
1
1
3
1
1
5
3
2
6
9
22
5
1
3
4 1
12
,5
1
1
1
1
1
1
1
1
1
1
Schedule
1
2
3
4
Pop. Served*
>100,000
50-99,000
10-49,999
<10,000
No. Utilities
15
23
72
41
* Including wholesale
Round 1 LT2ESWTR Systems in Bin 2 Systems >10,000 pop.

LT2 Round 1 Cryptosporidium MS Recovery by Laboratory
Number MS Samples Processed
Re
co
ve
ry
50 Labs, n=3320 (11 results off-scale)2 1
10
15 6 1 8
12
196 8 8 7
64 4
10
29
16
38
126
90 9
91
13
26
29 6 9
79
79
45
16
14 6
152
36
180
36
155
153
14
39 5
202
337
58
60
34
642
24
120
0%
20%
40%
60%
80%
100%
db
ase
v3
m
s0
05
Source: LT2 Round 1 Monitoring DCTS Data and Calculated Bin Results (2012)
LT2ESWTR Laboratory Performance

Revised Total Coliform Rule (RTCR)
• Revised Total Coliform Rule proposed July 14, 2010– Based on 2008 Agreement in
Principle (AIP)
• Final rule published February 13, 2013– Effective April 1, 2016
• Shift in focus – No longer, just, monitoring and
notification – Rather, monitoring triggers an
assessment and potential corrective action(s)
– Take a look at example assessment forms
A defect that could provide a pathway of entry for microbial contamination into the distribution system or that is indicative of afailure or imminent failure in a barrier that is already in place.
40 CFR 141.2

New Treatment Technique
• Non-acute MCL violation for total coliforms under the 1989 TCR is replaced under the RTCR by a coliform treatment technique.
• Presence of total coliforms is used as an indicator of a potential pathway of contamination into the distribution system.
• A potential pathway of contamination into the distribution system is unexplored and/or uncorrected.
• A system neglects to perform the prescribed assessment or corrective action within schedule
– 30 days
– State approved schedule
Framework Violation occurs when:

• Routine TC+ and repeat EC+
• Routine EC+ and repeat TC+
• System fails to take all required repeat samples following a routine EC+
• System fails to test for EC when any repeat sample is TC+
E. coli MCL Violation (Tier 1 PN)
• Any system fails to – Conduct a required
assessment within 30 days of notification
– Correct any sanitary defect found within 30 days or as scheduled
Coliform Treatment TechniqueViolation (Tier 2 PN)
Violations

• Federal guidance has been delayed by budget and priorities
– Assessment and correction
– State implementation
– Small system
State Implementation
Issues in State Rule Development
• Replace old TCR with revised TCR framework
• Describe assessment expectations• Describe who conducts assessments
Make sure you and primacy agency
are on the same page.
Type CA NV
CWS 3,088 214
NTNCWS 1,591 122
TNCWS 3,319 244
Total 7,998 580
Number of Systems Impacted

State Adoption Process(Illustratory Schedule, * are fixed dates)
20152013 2014 2016 2017
Request for an Extension
Complete Primacy Package
Tentative Schedule for
Rule Approval
RTCR Effective
EPARTCR FR(Feb. 13,
2013)
SDWIS NextGen Operational(Sept, 2014)
Submit Draft Primacy Package
Primacy Approval(Feb. 13,
2015)
Tentative Determination
(≈ 90 day)
Primacy Approval(Feb. 13,
2017)
Determination(≈ 90 day)
State
Early / Pre-Implementation
State Migration to SDWIS NextGen
Complete (Sept, 2015)
State Rulemaking Process
??? Guidance / Outreach ???
**
*
*

Reduction of Lead in Drinking Water Act
• Public Law 111–380 signed January 4, 2011
• Users must comply by January 4, 2014
• EPA guidance is limited.
– Draft FAQs
• Use and sale of non-compliant pipes and fixtures is illegal
…‘lead free’ means—‘‘(A) not containing more than 0.2 percent lead whenused with respect to solder and flux; and‘‘(B) not more than a weighted average of 0.25 percentlead when used with respect to the wetted surfaces ofpipes, pipe fittings, plumbing fittings, and fixtures.
Public Law 111–380
FAQs available at http://water.epa.gov/drink/info/lead/index.cfm

Aspects of LCR in Revision
• Sampling– Criteria for inclusion in
sample pool– Sampling protocol
• Lead service line replacement provisions– Mandatory replacement
requirement– Public education
• Increase system attention on optimized corrosion control– Actions triggered by
exceeding action level– More extensive ongoing
evaluation
• Appropriate education about health risks associated with copper
• Incorporating Public Law 111–380, “Reduction of Lead in Drinking Water Act’’EPA is initiating a
stakeholder process

>20%
<5%
10 – 20%
5 – 10%
<20,000
20,000-100,000 >300,000
100,000-300,000
Number of Connections Which are Lead
Estimated Number of Lead Service Lines(Based on 1990 Weston and EES - All Lead Service Lines))

Perchlorate – Setting an MCLG and MCL
Source: National Cost Implications of a Potential Perchlorate Regulation, Malcolm Pirnie, 2008
$0.0
$0.5
$1.0
$1.5
$2.0
$2.5
4 6 12 18 24
Tota
l NP
VB
illi
on
s
Potential MCL (ppb)
Total NPV - 3% Interest Rate
90th Percentile
Median
Nationwide cost small but very high costs for impacted communities
• EPA responding to SAB (2013) recommendations for MCLG based on physiologically based pharmacokinetic-pharmacodynamicmodeling approach

Regulated– Benzene– Carbon tetrachloride– 1,2-dichloroethane– 1,2-dichloropropane– Dichloromethane– Trichloroethylene
(TCE)– Tetrachloroethylene
(PCE)– Vinyl chloride
Unregulated– Aniline– Benzyl chloride– 1,3-butadiene– 1,2,3-
trichloropropane (TCP)
– 1,1-dichloroethane– Nitrobenzene– Methyl-oxirane– Propylene glycol– Urethane
Second Six-Year Review concluded that MCLs for TCE and PCE should be revised.
Carcinogenic VOCs

• Lower TCE/PCE MCLs would likely remove some of the eight unregulated CCL3 VOCs
• TCP is the biggest concern amongst the eight unregulated CCL3 VOCs
Source: Potentially Regulating Volatile Organic Compounds as a Group, EE&T, 2011
Carcinogenic VOCs

Continue to Manage TCE & PCE
– Current MCLs at 5 μg/L
– MCLG set at zero; analytical method could drive MCL to 1 μg/L or 0.5 μg/L
Defining “VOC”
– “Volatile” and “carcinogenic”
Analytical methods
– EPA Method 524.3 picks up 4 of the 8 unregulated
Occurrence
– Limited occurrence data due to lack of methods
– Different chemical uses yield different occurrence patterns
– Determining co-occurrence is challenging
Treatment
– Packed Tower Aeration (PTA) doesn’t work for all chemicals in group
Carcinogenic VOCs

Fluoride
• EPA analysis suggests level DWEL around 1 ppm
• CDC has proposed but not finalized a new single point value optimal fluoridation level of 0.7 ppm
• CDC guidance on operating tolerance about that 0.7 ppm target when fluoridating is in agency review.
• EPA has not indicated when it would propose revising Fluoride MCL and SMCL
• AWWA is currently revising M4 Water Fluoridation Principles and Practices

Items We Did Not Get To
• Hexavalent Chromium (see other talks at conference)
• Third Unregulated Contaminant Monitoring Rule (see other talks at conference)
• Reciprocating Internal Combustion Engines (compliance required)
• Executive Order on Cybersecurity• Pesticide General Permit (compliance required)
• Integrated Planning of Clean Water Act Compliance Requirements (now available)
• Definition of Waters of the United States• Electronic Reporting (SDWA and CWA)• Cyanotoxins• UIC – Exempted Aquifers• UIC – Aquifer Storage and Recovery Wells

Questions?
Contact Information:
Steve Via
American Water Works Association
1300 Eye Street, NW, Suite 701W
Washington, DC 20005
p. (202) 326-6130