an astract of the thesis of paul edward luebbers for the
TRANSCRIPT

AN ASTRACT OF THE THESIS OF
Paul Edward Luebbers for the Master of Science
in Physical Education presented on April 16, 2001
Abstract Approved: __--<-_--=---=---==-----,."-...........'-=-''--''''-'~"''_''__=~----''---------
The purpose of this study was to determine the relationship among the scores of three
tests of anaerobic capacity for Division II collegiate track and field athletes. Participants
(N=38) completed each ofthe following tests: the Wingate Anaerobic Cycle Test
(WAnT), the Cunningham and Faulkner anaerobic treadmill test, and the Running-based
Anaerobic Sprint Test (RAST). The tests were conducted over a three-week period
during the indoor track and field season. A Pearson-Product correlation was used to
determine the strength ofthe relationship among the anaerobic capacity measurements of
the tests. The correlation among all tests was significant at the Q .::: 0.01 level. A sub-area
ofthis study was to develop a preliminary set of percentile-based norms for the
Cunningham and Faulkner anaerobic treadmill test based on the results of collegiate level
athletes. However, due to the small and selective sample, the norms presented in this
study are to be used with caution and are for comparison purposes only.

AN EXAMINATION OF THE RELATIONSHIP
AMONG THREE TESTS
OF ANAEROBIC CAPACITY
A Thesis
Presented to
the Division of Health,
Physical Education,
and Recreation
EMPORIA STATE UNIVERSITY
In Partial Fulfillment
of the Requirements for the Degree of
Master of Science
c 2001 Paul E. Luebbers
ALL RIGHTS RESERVED
..... i

-rAes ,.~ c9.oo/
1.
l1JA;::f-J Approved for the Division of Health,
Physical Education, and Recreation
11
.....

ACKNOWLEDGEMENTS
I would like to thank Dr. Mark Stanbrough for his support, for sharing his
knowledge of exercise physiology, and serving as the thesis chair. I would also like to
thank Dr. Kathy Ermler who took time during her sabbatical to guide me through the
process of creating this paper. In addition, I would like to thank Dr. Stephen Dempsey for
his help throughout this study, as well as Dr. Michael Butler for his assistance in the
statistical design and analysis.
A special thanks goes out to Emporia State University track and field coach Dave
Harris for his support, granting me permission to utilize his athletes, as well as modify
workouts to meet the needs of this study. Finally, I would like to express my gratitude to
the Emporia State University track and field athletes, without whose efforts, this study
would have not been possible.
III

TABLE OF CONTENTS
Page
ACKNOWLEDGEMENTS iii
TABLE OF CONTENTS iv
LIST OF TABLES vi
CHAPTER
1 INTRODUCUTION 1
Statement of the Problem 5
Statement of Purpose 7
Hypothesis 7
Statement of Significance '" 7
Definitions..... 8
Review of Literature 10
The Energy System 11
The Anaerobic System 11
Tests of Anaerobic Capacity 13
The Wingate Anaerobic Cycle Test 15
Anaerobic Treadmill Tests 18
Anaerobic Running Test.. 20
Summary 21
2 23METHOD
23Participants
Target Population 23
IV

Sampling Procedures 24
24Procedures
25The Wingate Anaerobic Cycle Test..
27The Cunningham and Faulkner Anaerobic Treadmill Test
28The Running-based Anaerobic Sprint Test..
Instrumentation 30
The Wingate Anaerobic Cycle Test.. 30
The Cunningham and Faulkner Anaerobic Treadmill Test 30
The Running-based Anaerobic Sprint Test.. 31
Statistical Design 31
Summary 31
3 RESULTS 32
4 DISCUSSION AND RECOMMENDATIONS 40
Limitations of the Study 41
Recommendations for Future Research 42
REFERENCES 44
APPENDICES 47
A. Wingate Anaerobic Cycle Test Fonnula 47
B. Cunningham and Faulkner Anaerobic Treadmill Test Fonnula 49
C. Running-based Anaerobic Sprint Test Fonnula 51
D. Human Subjects Pennission Letter 53
E. Infonned Consent Document 55
~ Pennission to Copy Statement 58
v
.....l.

LIST OF TABLES
Table Page
1 Descriptive Statistics for Anaerobic Capacity Test Results 34
4 Women's Percentile-Ranked Norms for the
5 Men's Percentile-Ranked Norms for the
2 Compilation of Mean Anaerobic Power Results 35
3 Pearson-Product Correlation Coefficients for Anaerobic Capacity Tests.......... 36
Cunningham and Faulkner Anaerobic Treadmill Test 38
Cunningham and Faulkner Anaerobic Treadmill Test 39
VI
1

1
CHAPTER 1
INTRODUCTION
Measuring and evaluating training methods are essential components of training
for athletes concerned with reaching their ultimate potential. A training program that
does not prepare the proper energy system or muscle group for the athlete's specific sport
or activity is an ineffective training program. Programs need to be developed in
accordance with the individual needs of each athlete in order for the athlete to reach full
potential.
A difficulty many athletes and coaches have with developing a proper training
periodization is finding a way to measure progress and compare performance levels.
Many athletes and coaches believe in the value of comparing their training progress and
performances to personal past performances of themselves or performances of other
athletes. Competitive situations are perhaps the simplest and most valid indicators of an
individual's performance capabilities. However, for most athletes, performing at a peak.
competitive level year round is not a realistic option. As a result, other methods and
testing procedures that can analyze an athlete's physical abilities and compare his/her
training progress and performance with other athletes need to be identified and utilized.
A considerable number of athletic events require similar components. These
components include agility, strength, flexibility, kinesthetic sense, anaerobic
power/capacity, and or cardiovascular endurance (Stanbrough, 1999). Anaerobic activity
is one component that is among the most common in athletic events. Anaerobic activities
are those in which the muscles derive their energy from glycogen stored in the muscles.
The glycogen is the primary source of Adenosine Triphosphate (ATP). During intense

2
anaerobic activity, the ATP is reproduced in the absence of sufficient amounts of oxygen
(Wilmore & Costill, 1999). These types of activities generally involve immediate power
or short bursts of speed, with duration times lasting from less than one second to several
seconds. Sports and athletic competitions, ranging from individual events in track and
field, dual sports such as tennis, and a large number of popular teams sports such as
soccer, basketball, and softball, require a high anaerobic ability as a basis for peak
performance (Powers & Howley, 1997).
An athlete's anaerobic power is derived from the body's initial form of energy
production: the Adenosine Triphosphate Phosphocreatine (ATP-PCr) system. The ATP
PCr system allows muscles to quickly produce power without relying on the use of
oxygen. Power is generally defined as the maximal amount of energy that can be
transformed (work) during a given length of time. The formula used to express power is
written as Power = [(Distance x Force)/Time] (Fox, Bowers, & Foss, 1993).
Activities such as jumping, throwing, lifting weights and running short sprints all
rely on anaerobic power. Anaerobic power is usually tested by using "very brieftests,"
which last less than 10 seconds in length. Examples of such tests are the Vertical Jump
Test, One-Repetition Max weightlifting test, and the Margaria Step Test (running up
stairs), and the Wingate Anaerobic cycle test (WAnT) (Adams, 1998).
The anaerobic glycolytic system is the second form of energy production. This
process allows the muscles to continue to produce high amounts of energy, with very
limited amounts of oxygen, after the ATP-PCr system has been exhausted (Wilmore &
Costill, 1999). The total amount of energy that an individual has available in this energy
system is referred to as anaerobic capacity (MacDougall, Wenger, & Green, 1982).
..
3
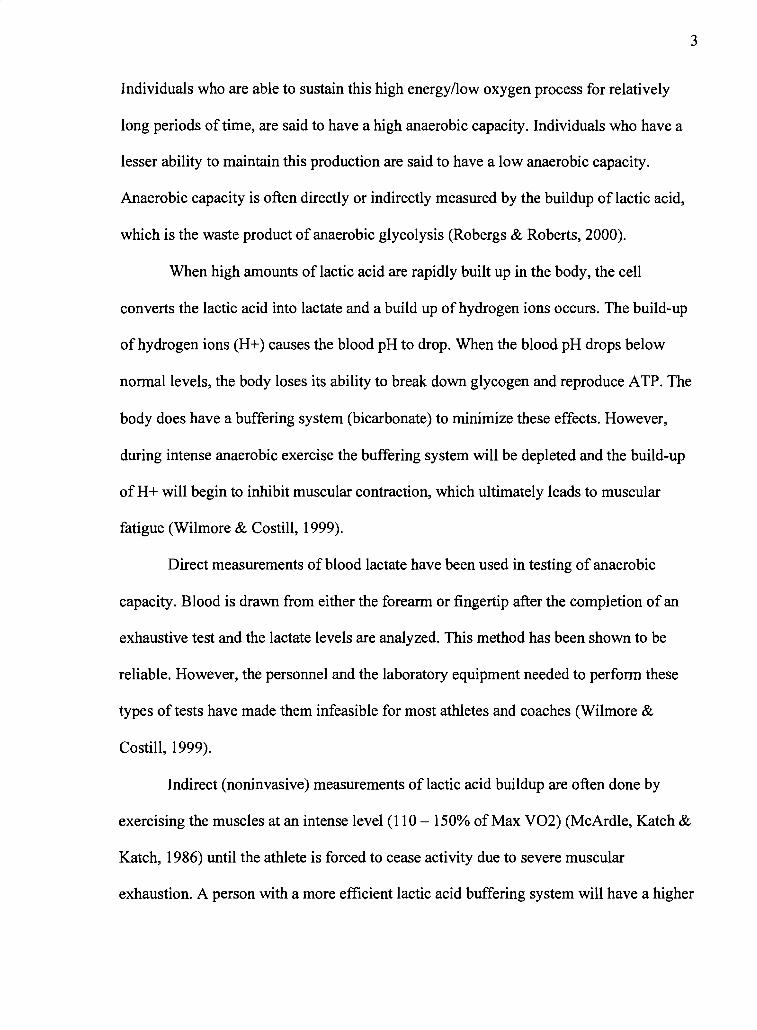
Individuals who are able to sustain this high energy/low oxygen process for relatively
long periods of time, are said to have a high anaerobic capacity. Individuals who have a
lesser ability to maintain this production are said to have a low anaerobic capacity.
Anaerobic capacity is often directly or indirectly measured by the buildup of lactic acid,
which is the waste product of anaerobic glycolysis (Robergs & Roberts, 2000).
When high amounts oflactic acid are rapidly built up in the body, the cell
converts the lactic acid into lactate and a build up of hydrogen ions occurs. The build-up
of hydrogen ions (H+) causes the blood pH to drop. When the blood pH drops below
normal levels, the body loses its ability to break down glycogen and reproduce ATP. The
body does have a buffering system (bicarbonate) to minimize these effects. However,
during intense anaerobic exercise the buffering system will be depleted and the build-up
of H+ will begin to inhibit muscular contraction, which ultimately leads to muscular
fatigue (Wilmore & Costill, 1999).
Direct measurements of blood lactate have been used in testing of anaerobic
capacity. Blood is drawn from either the forearm or fingertip after the completion of an
exhaustive test and the lactate levels are analyzed. This method has been shown to be
reliable. However, the personnel and the laboratory equipment needed to perform these
types of tests have made them infeasible for most athletes and coaches (Wilmore &
Costill, 1999).
Indirect (noninvasive) measurements of lactic acid buildup are often done by
exercising the muscles at an intense level (110 - 150% of Max V02) (McArdle, Katch &
Katch, 1986) until the athlete is forced to cease activity due to severe muscular
exhaustion. A person with a more efficient lactic acid buffering system will have a higher

4
tolerance to lactic acid buildup and will be able to perform the intense exercise for longer
periods of time than a person who has a less efficient system. Individuals who can
perform these intense exercises or activities for relatively long periods of time have a
high anaerobic capacity. Therefore, this type of indirect measurement of lactic acid can
also be used as a measurement of anaerobic capacity (Adams, 1998).
In addition to tests to muscular fatigue, tests lasting a short specified time can also
measure anaerobic capacity when they are performed against a predetermined resistance.
The resistance causes a rapid buildup of lactic acid in the body, which inhibits muscular
contraction as the activity progresses. The higher the anaerobic capacity possessed by an
athlete, the better the athlete's performance will be during the time allotted (Powers &
Howley, 1997).
Both of these types of tests, muscular fatigue and specified time, fall into the
category of "brief tests," generally lasting between 10 to 60 seconds in length, although
trained individuals may go for longer periods oftime. The most common brief tests are
performed either on a cycle ergometer or motorized treadmill. The Wingate is the most
commonly used cycle ergometer test. This test is one which uses a specified time and
resistance, rather than working to muscular fatigue (lnbar et aI., 1996). The newly
developed Running-based Anaerobic Sprint Test (RAST) uses a predetermined distance
to assess a person's anaerobic abilities (Draper & Whyte, 1997).
Testing of anaerobic power or capacity can be beneficial to athletes and their
coaches. Performing tests such as time trials and one-rep maximal efforts, can give a
good indication of an athlete's current individual performance level, training progress,
and how he/she compares to teammates. In addition, athletes who are able to utilize

5
anaerobic tests that have had norms developed are able to compare their own progress
and level with others who are approximately at the same level of athleticism. The
knowledge gained by coaches and athletes from standardized anaerobic testing methods
could help in the improvement of an athlete's training and performance.
Statement of the Problem
Testing of anaerobic power or capacity is generally done in any sport in which
anaerobic ability is a necessity. With some activities, such as short sprints and jumps, the
emphasis is on maximal anaerobic power. Several tests have been developed which are
rather specific to these events (the one-repetition max, or vertical jump) and can easily be
used to track progress and make comparisons to other athletes.
Athletes in activities that require a high level of anaerobic capacity, such as 400
meter sprints and 100-meter swimming, do not have as many options available to assess
anaerobic capabilities. The Wingate Anaerobic Test (WAnT) has become the most
widely used and accepted test of anaerobic capacity. Tests conducted over the past 20
years have shown the results of the Wingate test to be reliable and valid (Inbar et aI.,
1996). However, the Wingate test is done on a cycle ergometer. The cycling motion is
specific to the sport of cycling, and this lack of specificity to running, has been a concern
for some researchers (Draper & Whyte, 1997; Haub, M., personal communication,
October 3, 2000).
There are numerous sporting activities that utilize a running motion as the primary
mode of movement. There is a belief that individuals who participate in these types of
sports may receive a better indication of their anaerobic capacity by using an anaerobic
test that also utilizes a running motion. A treadmill test may be the most feasible

6
laboratory running test. However, many colleges and institutions may not have the
necessary equipment available to conduct a anaerobic treadmill test.
Draper and Whyte (1997) developed a test that provides an alternative to the
Wingate test, as well as being an economical alternative to a laboratory treadmill test.
The Running-based Anaerobic Sprint Test (RAST) is a field test that utilizes
nonconsecutive 35-meter sprints. Preliminary research has shown this test to able to
assess anaerobic capacity in much the same way as the WAnT (Draper & Whyte, 1997).
Currently, there has been little research in comparing any of the anaerobic treadmill tests
with the Wingate cycle test. In addition, the RAST is still undergoing initial studies of
reliability and validity (Whyte, personal communication, November 2, 2000).
The Wingate anaerobic test is a one-effort test that lasts for a specific length of
time against a set resistance. To make an equable comparison as possible, it would be
desirable to use a anaerobic treadmill test that adheres closely to the Wingate protocol
methods.
Most of the anaerobic treadmill tests use repeated test efforts, ranging from 2
trials (Marrin, Sharratt, & Taylor, 1978) to multiple 20-seconds efforts (with 100-second
recovery in between), which continue until muscular failure is reached (Rusko,
Nummela, & Mero, 1993). However, the test developed by Cunningham and Faulkner
utilizes a one-time test effort. Since this test has been used as an indicator of anaerobic
capacity and like the WAnT, uses a one-time test effort, it meets the needs of this study.
In addition to the WAnT and the Cunningham and Faulkner treadmill test,
participants in this study also completed the RAST. The RAST is currently undergoing
reliability and validity procedures at the University of Wolverhampton with the WAnT

7
being used as the basis of comparison. Use ofthe RAST in this study will add to the body
of knowledge.
Statement of Purpose
The purpose of this study is to determine the relationship among the scores of
three tests of anaerobic capacity for collegiate Division II track and field athletes. A sub
area of this study is to develop a preliminary set of norms for the Cunningham and
Faulkner anaerobic treadmill test based on the results of Division II collegiate track and
field athletes.
Hypothesis
There is a relationship among the scores of the Wingate anaerobic cycle test, the
Cunningham and Faulkner anaerobic treadmill test, and the Running-based Anaerobic
Sprint Test for Division II collegiate track athletes.
Statement of Significance
Athletes who compete in sports that require high amounts of energy to be
produced in a short amount of time require conditioning and training that is specific to
the anaerobic energy system. There are several tests available to test training progress and
levels of anaerobic power. However, there seem to be limited options of testing an
athlete's anaerobic capacity, short of competition or expensive laboratory tests.
The ability to identify the anaerobic capacity of an athlete who is involved in a
sport that relies heavily on the anaerobic energy system is important to both the athlete
and the coach. The Wingate cycle test is the most widely used form of standardized
anaerobic testing (Inbar et aI., 1996). However, the cycling motion of the Wingate test
may not be conducive to best-effort results for those athletes whose main mode of
...

8
movement is a running motion. Few, if any studies, have attempted to compare the
anaerobic capacity results of the Wingate with a laboratory test that utilizes a running
motion, including the very limited testing with the Cunningham and Faulkner anaerobic
treadmill test. In addition, no studies have compared the Wingate with a practical running
field test other than competition-style runs.
Due to the expense of cycle ergometers and motorized treadmills, there appears to
be a need for an inexpensive, practical field test that can test as many aspects of
anaerobic perfonnance as the Wingate test and also be as running specific as a treadmill
test. The Running-based Anaerobic Sprint Test was developed with this purpose in mind.
Definitions
I
The following tenns occur in the study and are defined here to provide the reader
with a basic understanding of their meaning.
Adenosine Diphosphate (ADP) - a complex chemical compound which when combined
with phosphate, fonns ATP.
Adenosine Triphosphate (ATP) - A complex chemical compound which when broken
down, provides energy to cells.
Adenosine Triphosphate Phosphocreatine (ATP-PCr) - A simple anaerobic energy
system that functions to maintain ATP levels.
Aerobic - In the presence of oxygen.
Anaerobic - In the absence of sufficient oxygen.
Anaerobic Capacity - Ability to maintain a relatively high power output over a period
of time using little or no oxygen. Often used interchangeably with Mean Anaerobic ~ it. Power. ~;
f'I, 7:.
~
9
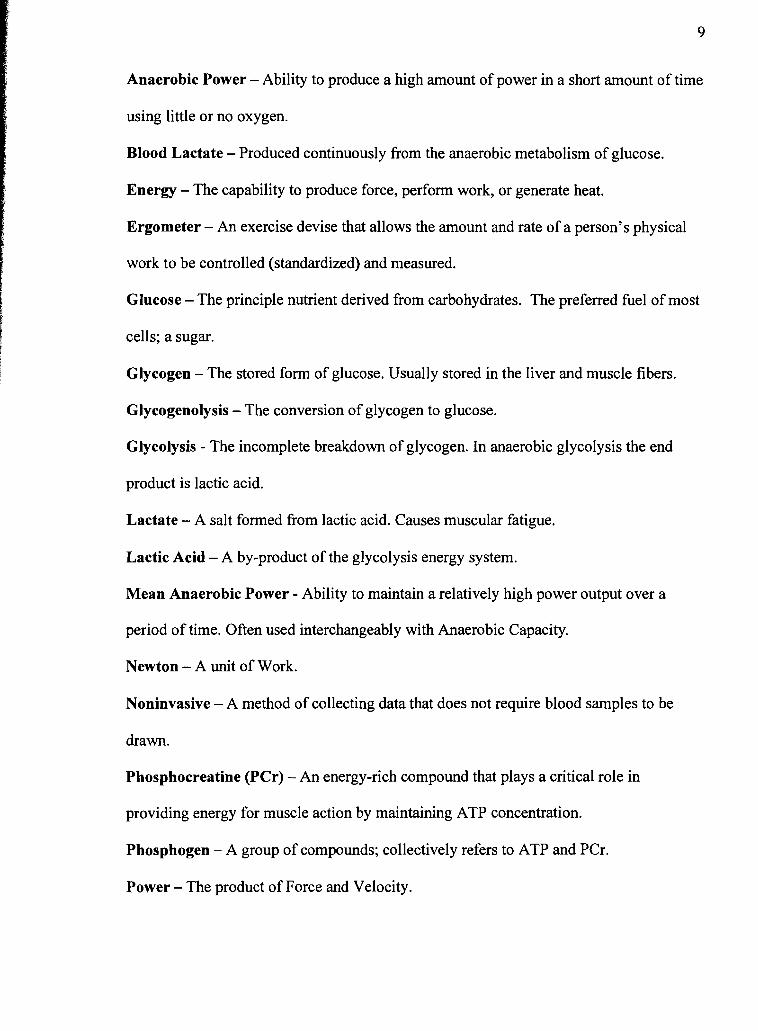
Anaerobic Power - Ability to produce a high amount of power in a short amount of time
using little or no oxygen.
Blood Lactate - Produced continuously from the anaerobic metabolism of glucose.
Energy - The capability to produce force, perform work, or generate heat.
Ergometer - An exercise devise that allows the amount and rate of a person's physical
work to be controlled (standardized) and measured.
Glucose - The principle nutrient derived from carbohydrates. The preferred fuel of most
cells; a sugar.
Glycogen - The stored form of glucose. Usually stored in the liver and muscle fibers.
Glycogenolysis - The conversion of glycogen to glucose.
Glycolysis - The incomplete breakdown of glycogen. In anaerobic glycolysis the end
product is lactic acid.
Lactate - A salt formed from lactic acid. Causes muscular fatigue.
Lactic Acid - A by-product of the glycolysis energy system.
Mean Anaerobic Power - Ability to maintain a relatively high power output over a
period of time. Often used interchangeably with Anaerobic Capacity.
Newton - A unit of Work.
Noninvasive - A method of collecting data that does not require blood samples to be
drawn.
Phosphocreatine (Per) - An energy-rich compound that plays a critical role in
providing energy for muscle action by maintaining ATP concentration.
Phosphogen - A group of compounds; collectively refers to ATP and PCr.
Power - The product of Force and Velocity.

10
Specificity - An exercise or motion that has a distinctive influence or has a high
relationship with another exercise or motion.
Watt - A unit ofPower.
Work - The use of movement to produce energy.
Review of Literature
The purpose of this study is to determine the relationship among the scores of
three tests of anaerobic capacity for Division II collegiate track and field athletes. A sub
area of this study is to develop a preliminary set of norms for the Cunningham and
Faulkner anaerobic treadmill test based on the results of Division II collegiate level track
and field athletes.
The Wingate Anaerobic Test (WAnT) is the most commonly used test of
anaerobic capacity (lnbar et aI., 1996). However, the Wingate test is sport specific to
cycling and may not be the best test for athletes competing in sports or activities that
require running as the primary mode of motion. The Cunningham and Faulkner anaerobic
treadmill test is a laboratory test used to determine anaerobic capacity (Green & Houston,
1975), and the Running-based Anaerobic Sprint Test (RAST) is a practical field test in
which early tests have indicated it to be a measure of anaerobic capacity (Draper &
Whyte, 1997).
The review of literature will discuss the components of the human energy system,
specifically the anaerobic system. In addition, it will include sections on the three
anaerobic capacity tests, the Wingate anaerobic test, the anaerobic treadmill test, the
RAST, and how each has been designed in relation to assessing anaerobic capacity.

11
The Energy System
The body derives energy from the metabolic breakdown of foods, primarily
carbohydrates and fats, with proteins providing a lesser-used third source. Carbohydrates
are broken down through the process of glycolysis and through the Krebs cycle. The
Krebs cycle, which is aerobic in nature, is also responsible for the breakdown of fats into
energy (Fox, Bowers, & Foss, 1993).
Energy derived from the breakdown of foods is used to create a chemical
compound known as adenosine triphosphate (ATP). ATP is stored in the cells of the
muscles and is broken down to provide the energy needed for the cells to be capable of
function. Energy production is a continuous process that generally requires both the
anaerobic and aerobic pathways (Fox et aI., 1993).
The energy system is divided into three stages. Despite their separation by terms
of definition, they are not mutually exclusive. The body shifts from one system to the
next in a graduated process, not an abrupt change from one system to another. The third
system used by the body is largely aerobic, which implies the use of oxygen as a means
of energy production.
The Anaerobic System
The word anaerobic means without air. This is the process of breaking down and
reproducing ATP without the use of oxygen. The anaerobic system is divided into two
sub-systems: the Adenosine Triphosphate Phosphocreatine (ATP-PCr) System and the
Glycolytic System.
The ATP-PCr is the simplest of the body's energy systems and is sometimes
referred to as the phosphogen system (Robergs & Roberts, 2000). PCr is a
I
1

12
phosphocreatine (or creatine phosphate, CrP) molecule used by the body to rapidly
resynthesize ATP. When ATP is broken down, it releases a phosphate molecule. The
ATP then becomes a ADP (adenosine diphosphate) molecule. It is this molecular release
that produces the energy. The PCr is also active during this process. The phosphate
molecule is released from the creatine and is bound to an ADP molecule to form another
molecule of ATP. At this point, the process is repeated. During intense activity, the PCr
levels diminish rapidly, usually in less than 10 seconds (Fox et aI., 1993).
This process is quick and is done without the presence of oxygen (Fox et aI.,
1993). This maximal amount of energy produced by this system, per units of time, is
often referred to as anaerobic power (MacDougall, Wenger, & Green, 1982).
Some common types of tests for anaerobic power are the Wingate cycle test
(Wilmore & Costill, 1999), vertical jump, Margaria power test, and 40-yard dash
(Adams, 1998). These tests have been in use for several years and norms have been
developed for several different types of athletes and populations.
As the body's phosphogen stores (from the PCr) are lowered, the body begins it's
shift to the Glycolytic energy system (Whitmore & Costill, 1999), sometimes referred to
as the Lactic Acid system (Fox et aI., 1993). This system, like the ATP-PCr system, is
able to produce energy anaerobically, although it utilizes glycogen stores rather than
phosphocreatine (Wilmore & Costill, 1999).
In the body, all carbohydrates are converted into glucose and immediately used or
converted and stored as glycogen for use at a later time. Through the process of
glycogenolysis, glycogen is broken down and is used to re-synthesize ATP molecules.
The glycolytic energy system is a much more complex process than the ATP-PCr system
k

13
and does not yield as much energy. Despite this drawback, it does allow the muscles to
perfonn high intensity exercise and produce force for durations lasting as long as two
minutes with very limited amounts of oxygen. However, a major limiting factor of this
system is the buildup of lactic acid, which is the waste or byproduct of anaerobic
glycogenolysis (Wilmore & Costill, 1999).
During intense exercise, lactic acid buildup can only be tolerated to certain levels
(depending on the physical conditioning of the athlete) before the athlete is ultimately
forced to stop due to muscular fatigue (Fox et aI., 1993). This is due to build up of
hydrogen ions (H+) that occur when the lactic acid can no longer be buffered and is
converted to lactate. The H+ is believed to interfere with the anaerobic metabolism as
well as the contractile abilities of the actin and myosin protein filaments, which make up
the muscle fibers. When the actin and myosin are no longer able to function properly, the
muscles rapidly lose their ability to contract forcefully and the intense exercise must
come to an end (Wilmore & Costill, 1999).
Some common noninvasive tests of anaerobic capacity are the Wingate cycle test
(Stanbrough, 1999), exhaustive treadmill running, 200-600m running sprints, and 100
200m swimming sprints (Adams, 1998). These tests can be very demanding of the
participant. It is important for participants to have high motivation in order to get
accurate results from these types of tests.
Tests of Anaerobic Capacity
Under conditions of intense exercise and physical work, the body's ATP-PCr
stores are quickly depleted and the glycolytic system is rapidly phased in as the primary
source of energy production. The ability of the body to anaerobically use glycogen for

14
energy while buffering the effects of lactic acid buildup is sometimes referred to as its
anaerobic capacity (Robergs & Roberts, 2000).
There has been controversy concerning actual ability to test anaerobic capacity,
chiefly because of the nature of the body to gradually shift energy production sources.
While energy production during maximal efforts lasting 60-seconds or more primarily
comes from the anaerobic pathway, studies have shown that as much as 30% of the
energy may come from aerobic energy sources, which are beginning to be phased in at
this point (Powers & Howley, 1994).
The most common indicator of the use of anaerobic energy are blood lactate
levels (McArdle et aI., 1986). When exercise places demands on the body beyond the
ability to provide adequate supplies of oxygen (intense exercise), it utilizes the anaerobic
system. When the glycogenic pathway is used, it produces lactic acid as a waste product.
When lactic acid level can no longer be buffered by the system it is converted to lactate.
A build up of hydrogen ions (H+) accompanies this rise in lactate. It is believed that the
H+ are responsible for the rapid muscle fatigue, bringing an end to an athlete's efforts
(Wilmore & Costill, 1999). By measuring the amount of lactate in the blood (blood
lactate), it is possible to get an accurate account ofan athlete's anaerobic capacity
(Adams, 1998). However, measuring blood lactate is generally not a feasible option for
most athletes and coaches. It requires special laboratory equipment and can be fairly
expensive (Wilmore & Costill, 1999).
The tests discussed in this paper are noninvasive, predictive tests. They indirectly
measure anaerobic capacity by either measuring mean anaerobic power over a specified
distance, duration of time, or by total work completed during intense exercise to

15
exhaustion. Some of these tests do require specific laboratory equipment such as a cycle
ergometer or a motorized treadmill. However, these types of instruments are generally
more common than the equipment necessary for blood lactate measurements (Wilmore &
Costill, 1999), and the RAST, requires equipment no more sophisticated than two
stopwatches and a calculator.
The wingate anaerobic cycle test (WAnT). Tests for anaerobic ability have been
in use since the late 1960's. Research done in the area of muscle biopsies helped advance
the understanding of the anaerobic energy system and it's effect on muscular work and
performance (MacDougall, Wenger, & Green, 1982).
In the early 1970's, physiologists were using treadmills and cycle ergometers in
studies of anaerobic ability. Inspired by a paper presented in 1972, researchers at the
Wingate Institute in Israel decided to develop and standardize an anaerobic test (Inbar et
al., 1996). Some ofthe objectives they aimed to meet were to create a test that:
1. Provided information on peak power, muscle endurance, and muscle
fatigability.
2. Was simple, i.e., it would require equipment that was commonly
available and could be administered by personnel who did not require
special skills or training.
3. Was feasible, such that it could be performed by able-bodied and
disabled people, by a wide spectrum of ages and fitness levels, and by
either sex.
4. Was a safe, noninvasive procedure that would be socially acceptable
to various age and ethnic groups.

16
5. Was highly reliable and repeatable, i.e., the score would reflect the
subject's actual performance, rather than a random occurrence that
might change from one measurement to another.
6. Was valid, i.e., the score would reflect the subject's supramaximal
anaerobic performance capacity.
7. Was specific to anaerobic muscle performance rather than to fitness in
general (Inbar et aI., 1996).
The result was the Wingate Anaerobic Test (WAnT) (Inbar et aI., 1996). This test
uses either a cycle (leg) or crank (arm) ergometer to test anaerobic capacity. The cycle
ergometer test has become the most popular anaerobic cycle test (Adams, 1998). This
popularity is possibly due to the fact that the WAnT is capable of providing a thorough
anaerobic test (power, capacity, muscular fatigue rate) in a relatively convenient manner
(Inbar et al., 1996). Since it's inception, various modifications have been suggested for
the WAnT by a number of researchers (Powers & Howley, 1994). However, the test, as
it was originated, has largely remained unchanged in its general use to evaluate anaerobic
power and capacity (Inbar et aI., 1996).
Anaerobic capacity, as discussed by Inbar, the principle designer of the WAnT, is
determined through the test by calculating the average power output or total work
(Tharp, Newhouse, Uffelman, Thorland, & Johnson, 1985) during the 3D-second trial
(Inbar et al" 1996; Adams, 1998). Although several researchers still prefer to utilize the
term anaerobic capacity when discussing the WAnT test (Calbet, Chavarren, & Dorado,
1997; Drabbs & Maud, 1997; McArdle et aI., 1986; Nicklin, O'Bryant, Zehnbauer, &

17
Collins, 1990; Parry-Billings, Reilly, & MacLaren, 1986; and Tharp et aI., 1985), Inbar
prefers the term Mean Anaerobic Power (Inbar et aI., 1996).
The Wingate protocol for assessing anaerobic capacity (mean anaerobic power)
calls for a 30-second maximal effort on a cycle ergometer against a predetermined
resistance. The resistance (workforce in Newtons, N) is calculated by a ratio formula
(Appendix A) based on the participant's weight and is applied to the ergometer flywheel
(Adams, 1998). The work performed by the participant is derived using a formula
(Appendix A) that utilizes the force (N) and the total number of pedal revolutions
completed during the 30-second trial (Inbar et aI., 1996).
Several studies have examined the relationship between the Wingate and other
tests of anaerobic capacity. These tests include a 25-meter swim time (r= -.90); a 300
meter run time (r= -.88); a 500-meter ice skate speed (r= .76) and the Sergeant Anaerobic
Skating test (r= .79) (Inbar et aI., 1996). Reliability in test-retest comparisons has been
shown to be high. These scores range from a low ofr=.89 to as high as r=.98 (Adams,
1998).
While the Wingate test has been shown to be both a valid and reliable test of
anaerobic performance, it does have a drawback. The WAnT may be too sport specific
(Draper & Whyte, 1997). Although the designers utilized a cycle ergometer to provide an
economical and convenient test to users (Inbar et aI., 1996), the cycling motion utilized
by the test may not allow those who take part in sports or activities that utilize a running
motion, to achieve optimal results. Falk, Weinstein, Dolan, Abramson, and Mann-Segal
(1998) stated "the WAnT my be an excellent cycling-specific test but may not possess
strong validity as a predictor of running performance (p. 259)."

18
Anaerobic treadmill tests. Before the advent ofthe Wingate test and earlier cyclic
tests, exercise and sports physiologist utilized treadmills to calculate anaerobic capacity
in the laboratory. Since the late 1960's, there have been a variety of different approaches
to using a treadmill to test anaerobic power and capacity. Cunningham and Faulkner
(1969) utilized a single-effort treadmill test in their study on the effects of training on the
anaerobic system. The protocol for the anaerobic treadmill test calls for the speed of the
treadmill to be set at 8mph and the incline gradient at 20%. The participant runs until the
muscles are fatigued.
Although the test's original intent was not specific to estimating anaerobic
capacity, it has been used for this purpose by various researchers (Adams, 1998). Green
and Houston (1977) utilized this test to measure anaerobic capacity in their test of
training effects for two elite junior hockey teams. The capacity is derived from the
formula W = Force x Distance (vertical) (Appendix B) which utilized the run time,
participant's weight, speed of the treadmill, and the incline gradient (Adams, 1998).
Marrin, Sharratt, and Taylor (1980) modified the Cunningham and Faulkner test
by having athletes (wrestlers) perform a second effort of the test after a 4 minute rest after
the first trial. The results were compiled as the sum of the two running times and blood
lactate was taken at both 5 and 10 minutes after the second test (MacDougall, Wenger, &
Green, 1982).
Rusko, Nummela, and Mero (1993) developed the Maximal Anaerobic Running
Power (MARP) test, later known as the Maximal Anaerobic Running Test (MART)
(Nummela, Alberts, Rijntjes, Luhtanen, & Rusko, 1996). This was a further expansion on
the anaerobic treadmill test. It was capable oftesting a individual's anaerobic power,

19
capacity, and fatigue index. The test consisted ofn 20-second runs with 100-seconds rest
between. The initial speed of the treadmill was 3.97 mls (8mph) with an incline gradient
of 5%. On each subsequent run the speed was increase by .35 mls. The participant
continued trial runs until physically unable to maintain speed. Blood lactate was tested
after each run. The results of the lactate test showed that the majority of the energy used
during the runs was released from the ATP-PCr and glycogen system (Rusko et aI.,
1993). The research has found a significant negative correlation between these levels and
those obtained after completing a 400m run. It was concluded that the MART is a capable
of a rough estimate of anaerobic capacity (Nummela et aI., 1996). This test has also been
used in Europe as part of a battery of tests to measure the different components of
anaerobic performance (Falk et aI., 1996).
Studies have shown that treadmill tests can be used to estimate anaerobic capacity
(Adams, 1998) and possibly be a better predictor for athletes of running specific sports
(Nummela et ai. 1996). However, treadmill tests are not as commonly used as the
Wingate test (McArdle et aI., 1986).
There are some legitimate reasons for the under-use of treadmill tests. One reason
is a motorized treadmill capable of meeting the needs of most anaerobic test is very
expensive (Adams, 1998). Although cycle ergometers can be expensive, the Wingate test
is capable of testing several factors of anaerobic performance that most treadmill tests
cannot. Therefore, a cycle ergometer may be more cost effective for many colleges and
institutions.
Another reason for the under-use of anaerobic treadmill tests is the apprehension
these tests cause some participants, even those individuals who have experience with

20
treadmill running (Adams, 1998). The fast moving belt may cause enough anxiety in a
participant that he/she may not give a true maximal performance. As Inbar (1996)
commented about the treadmill test, the "endpoint was often determined by the subject's
level of fear, rather than by physiological causes (p. 2)."
A true set of norms has never been established with an anaerobic treadmill test,
possibly due to the factors listed above. Adams (1998) states that more studies of the tests
are needed to better establish reliability and validity. He also goes on to state that norms
for these tests are needed, especially those expressed in total work units.
Anaerobic running test. The Running-based Anaerobic Sprint Test (RAST) is a
practical field test developed to provide athletes and coaches measurements that are
comparable to those of the Wingate anaerobic cycle test. The RAST provides
measurements of peak power, mean power (capacity), and minimum power as well as a
fatigue index. The RAST uses a formula (Appendix C) based on weight, time, and
distance to determine mean anaerobic power. This test is still undergoing studies for
validity and reliability at Wolverhampton University in the United Kingdom (Draper &
Whyte, 1997).
Whyte believes that accurate testing of aerobic and anaerobic abilities in athletes
is specific to each athlete's sport, "cyclist perform better on cycle-based aerobic tests and
runners perform better on running tests" (1997, p 1). However, testing of complete
anaerobic abilities has largely been restricted to the Wingate test (Draper & Whyte,
1997). Although the Cunningham and Faulkner anaerobic treadmill test is capable of
measuring anaerobic capacity, measurements of anaerobic power and fatigue indexes are
not feasible (Inbar et aI., 1996). Draper & Whyte (1997) feel that the development of the

21
RAST will provide a practical running-based test capable of a more complete anaerobic
analysis.
Summary
Noninvasive methods of testing anaerobic capabilities, especially anaerobic
capacity, have largely been limited to the Wingate cycle test. The WAnT has become the
most popular test due to it's ability to assess several characteristics of anaerobic
performance. However, some researchers believe the test is too sport specific to cycling,
thus not allowing for optimal results for other athletes, particularly those athletes who
participate in running-based sports.
Some researchers have utilized treadmill tests for anaerobic capacity. But
limitations, such as treadmill cost and the psychological fear-factor, have presented some
difficulty in acquiring enough information to develop at true set of norms for the test.
The Running-based Anaerobic Sprint test seems to combine the multi-purpose
function of the WAnT with the true running mechanics of the treadmill tests. Due to it's
relatively new development, the RAST has not had enough data collected to establish
reliability and validity.
The purpose of this study was to determine the relationship among the scores of
three tests of anaerobic capacity for collegiate athletes. The WAnT is an established test
with proven reliability and validity and is used as the benchmark for comparison of the
treadmill test and the RAST. By establishing relationships among the tests, this study was
able to prepare a much needed set of norms for the treadmill test, and also added to the
current studies of reliability and validity ofthe RAST. The information obtained from

22
this research provides to coaches and athletes of running-based sports the opportunity to
conduct anaerobic tests in a manner that will provide optimum results.

23
CHAPTER 2
METHOD
The purpose of this study was to determine the relationship among the scores of
three tests of anaerobic capacity for Division II collegiate track and field athletes. A sub
area of this study was to develop a preliminary set of norms for the Cunningham and
Faulkner anaerobic treadmill test based on the results of Division II collegiate track and
field athletes.
Participants
Target Population
The participants of this study were members of the intercollegiate track and field
teams at a medium sized university (5,700 students) located in the Midwest. The athletic
program competes in the Mid-America Intercollegiate Athletic Association (MIAA)
conference and is a member of the National Collegiate Athletic Association Division II '~,
:~ .~(NCAA II). ~
!~
'.~The total number of participants in this study was thirty-eight (N=38). Twenty-
four ofthe participants were male (N=24). Fourteen of the participants were female
(N=14). The participants in this study competed in a variety of track and field events
including mid-distance (600m - 800m), long sprints (200m - 400m), short sprints (SSm
100m), jumps (long jump, triple jump, high jump, and pole vault), and multi-events
(heptathlon and decathlon). The athletes ranged in skill from conference non-placers to
athletes of national caliber. Therefore, the results obtained by using intercollegiate
athletes at this university can be projected to intercollegiate athletes of varying athletic

24
skill levels, particularly athletes who compete in track and field at the NCAA II level in
the United States.
Sampling Procedures
This was a purposive sample. These athletes were chosen due to their familiarity
with anaerobic training. All track and field athletes who competed in events involving
distances of 800 meters or less were considered possible participants unless they were
injured or sick.
Procedures
The Institutional Review Board for Treatment of Human Subjects at Emporia
State University Permission granted permission to conduct this study (Appendix D).
Permission to use the athletes was also obtained from the head coach ofthe Track and
Field program. The tests were incorporated into the normal practice schedule and used as
part ofthe planned workout. All participants were asked to sign the Informed Consent
Form (Appendix E) prior to the start of testing.
Each test was completed on a separate day, with no less than six days and no
more than thirteen days separating individual test efforts. Testing on separate days
allowed the participants enough recovery time from the tests and the normal workouts for
the body to be able to perform at a maximal level. This time period also limited the
effects an increase or decrease in a participant's fitness level may have had on the tests.
The sprinters, jumpers and multi-eventers, completed the tests in the following
order: the Running-based Anaerobic Sprint Test (RAST), the Cunningham and Faulkner
anaerobic treadmill test, and the Wingate Anaerobic Test (WAnT). All tests were
completed one week apart.

25
The middle distance runners completed the test in the following order: the
Cunningham and Faulkner anaerobic treadmill test, the WAnT, and the RAST. The
Cunningham and Faulkner and the WAnT were completed with seven days separating the
two tests. A time period of thirteen days after the Wingate was needed to perform the
RAST due to inclement winter weather conditions.
The Wingate Anaerobic Cycle Test (WAnT)
Three technicians were used for this test. One technician acted as the starter and
timer. A second acted as the pedal revolution counter. The third technician recorded data
onto a data collection sheet.
Prior to the start of the procedure, each participant was weighed in light attire.
The weight was recorded onto the data sheet and used to determine the amount of
resistance to be applied to the ergometer for each participant (Adams, 1998).
The seat of the cycle ergometer was then adjusted by one of the technicians. The
seat was set so the participant's leg had a slight bend at the knee when the leg was
extended at the lowest point of the pedal's revolution (Inbar, Bar-Or, and Skinner, 1996).
The procedure for this test consisted of three phases: the warm-up/familiarization
phase, the test, and the cool down. Each phase was done in succession with the entire
process lasting from twenty to thirty minutes (Adams, 1998). The warm-up consisted of a
five-minute cycling period that was interspersed with 4-5 sprints of 4-6 seconds; with
each sprint the resistance applied was increased (Adams, 1998). The warm-up allowed
the participant to become familiar with the resistance and also allowed the body to adjust
to the physiological and motor adaptations of the cycle ergometer (Inbar et aI., 1996). A
two to three minute rest was given to allow the body to recover from the warm-up and

26
allow the participant to stretch (Adams, 1998). After two to three minutes, the participant
returned to the cycle. The seat was double checked for the proper height and a technician
secured the participant's feet to the pedals by adjusting the toe-clips.
The test phase was broken into two separate periods: the acceleration period, and
the test period. The acceleration period lasted for 15 seconds. The participant began
cycling between 20 to 50 rpm at approximately one-third of his/her force (N) setting.
This activity lasted for 10 seconds. The participant then accelerated towards near
maximal speed for the next five seconds while the technician began to increase the force
towards the appropriate setting. When the correct force setting was reached, the
technician yelled, "GO!" and the second period ofthe test phase began (Adams, 1998).
On "GO!" the technician started the watch and the participant began cycling as
fast as possible while remaining seated. This test phase lasted for thirty seconds and was
broken into six separate five-second intervals. The timer announced each of these
intervals, while the second technician (the counter) stated the number of pedal
revolutions made by the participant during the previous five seconds (rounded up to the
nearest whole revolution). The third technician recorded the number of pedal revolutions
on the a data collection sheet. At the end of the thirty seconds, the cool down phase began
(Adams, 1998).
At the beginning of the cool down phase, the first technician reduced the force to
a low setting and the participant continued to pedal at a moderate pace for two to three
minutes. The participant then walked for two to three more minutes and then performed
some light stretches.

27
The Anaerobic Treadmill Test
Two technicians were used for this test. One technician controlled the treadmill
and the timer. The second technician stood behind the treadmill acting as the spotter.
Prior to beginning the procedure, each participant was weighed in his or her
running attire. The weight was recorded onto a data collection sheet and was used in the
final formula to calculate the participant's anaerobic capacity.
The procedure for the treadmill test consisted of four phases: the warm-up, the
familiarization phase, the test, and the cool-down phased (Adams, 1998). Each phase was
done in succession, with the entire process lasting from twenty to thirty minutes.
The warm-up phase consisted ofa slow jog lasting approximately five minutes.
Each participant was asked to stretch as needed to be able to perform a maximal running
effort. The participant then proceeded to the treadmill to begin the familiarization phase
(Adams, 1998).
During the familiarization phase each participant was shown in detail how to
utilize the handrails to get on and off the moving treadmill belt. After the demonstration,
each participant practiced the procedure with the treadmill moving at a slow pace. Each
participant was allowed to practice getting on and off the moving treadmill belt as many
times as they felt necessary to be comfortable with the method prior to the actual test.
Short runs on a level gradient and brief bouts at test speeds and 20% gradient were used
to familiarize the participant with the treadmill. When the participant felt he/she was
ready, the test phase began (Adams, 1998).
At the beginning ofthe test phase, the technician set the treadmill at a 20% slope
and at a speed of 8mph (3.58m/s). A spotter stood at the rear of the treadmill ready to

28
support the runner if necessary (Adams, 1998). The participant, with hands on the
handrails, stood alongside the treadmill. While still holding onto the handrails, the runner
stepped onto the moving belt and began running. When the participant was comfortable
with the pace, he/she released the handrails. As the participant released the handrails, the
technician started the stopwatch. The runner then ran for as long a time as hislher muscles
could continue the pace. When the participant could no longer maintain the pace, he/she
took himself or herself off of the treadmill by using the handrails. The technician stopped
the timer as soon as the handrails were touched (Adams, 1998). The treadmill was
stopped and the technician recorded the time onto the data sheet. The participant then
began the cool down phase.
The cool down phase consisted of slow walking for approximately five minutes.
The participant then did some light stretching followed by a slow jog lasting five
minutes.
The Running-based Anaerobic Sprint Test (RAST)
Three technicians were required for this test. One technician started the test and
timed the sprints. A second technician timed the 10-second turn-arounds. A third
technician recorded the data onto a data collection sheet (Draper & Whyte, 1997).
Prior to beginning of the procedure, each participant was weighed in his or her
running attire. The weight was recorded onto the data collection sheet and was utilized in
the final formula to calculate the participant's anaerobic capacity (Draper & Whyte,
1997).

29
The RAST consisted of four phases: the warm-up, the familiarization, the test,
and the cool down (Draper & Whyte, 1997). Each phase was done in succession, with the
entire process lasting twenty to thirty minutes.
The warm-up phase consisted of a slow jog lasting approximately five minutes.
Each participant then stretched as needed to be able to perform a maximal running effort.
The participant then proceeded to the marked testing area to begin the familiarization
phase (Draper & Whyte, 1997).
The testing area of the track was a 35-meter straightaway marked by orange cones
at each end. During the familiarization phase, a technician gave a demonstration of the
run and turn-around procedures. Each participant was then allowed to perform some
sprints to become familiar with the track surface and the turn-around procedures. When
the participant indicated he/she was ready, he/she moved on to the testing phase (Draper
& Whyte, 1997).
The test consisted of six 35-meter non-continuous sprints. The participant lined up
at the starting line, using whatever starting position was comfortable (standing, three
point, or four point). The first technician (timer) said, "set." When the participant was
steady, the technician yelled "GO!" and started the stopwatch. The participant sprinted at
maximal effort down the 35-meter stretch. The timer stopped the watch as soon as the
participant passed by the marker cones. The time was recorded onto the data sheet
(Draper & Whyte, 1997).
The runner was given ten seconds (timed by second timer) to turn around and
return to the cones he/she just passed. These cones were used as the starting point for the
return sprint. The second timer counted down the ten seconds out loud which enabled the

30
participant to prepare for the next run. At the end of the ten seconds, the second timer
yelled "GO!" the first timer started the stopwatch and the participant sprinted back down
the straightway towards the original starting point. The six sprints and turn-arounds were
timed and recorded in the same manner as the first. At the completion of the six sprints
the participant began the cool down phase (Draper & Whyte, 1997).
The cool down phase consisted of slow walking for approximately five minutes.
The participant then did some light stretching followed by a slow jog lasting five
minutes.
Instrumentation
Wingate Anaerobic Test (WAnT)
The Monark cycle ergometer is a commonly used ergometer for the Wingate test.
This ergometer is capable of applying force immediately to a flywheel and provides the
resistance against which the participants work. The resistance can be increased or
decreased by simply turning a knob on the ergometer.
The Wingate test has been shown to be reliable and valid in the twenty years since
it's inception. The validity of it's anaerobic capacity measurement, as compared with a
300m run, has been found to range from r= -.64 and -.83 (Adams, 1998) to r= -.92 (lnbar
et ai., 1996). Reliability has ranged from r= .89 (Adams, 1998) to r= .99 (lnbar et ai.,
1996).
Cunningham and Faulkner Anaerobic Treadmill test
The anaerobic treadmill test requires a motorized treadmill. The treadmill must be
capable of maintaining a speed of 8mph, and an incline of 20%. Handrails must be
mounted on the treadmill to provide a measure of safety for the participants.
....

31
Anaerobic treadmill testing has been shown to be both reliable and valid.
Reliability coefficients range from r= .76 to r= .94 (Adams, 1998). Validity, as compared
with a 329m run, has been shown with a coefficient of r= -.82 (Adams, 1998). However,
Adams (1998) feels that more reliability and validity studies are needed on this test.
Running-based Anaerobic Test (RAST)
At this time, no current scores on reliability or validity are available for the RAST
(Draper & Whyte, 1997). In a recent e-mail correspondence, Whyte stated that reliability
and validity testing are part of an ongoing study (Whyte, personal communication,
October 17,2000).
Statistical Design
The relationship of anaerobic capacity results of the three tests was examined by
running a correlational analysis. A Pearson-Product correlation was used, and the data
were analyzed at the 2 :::: .0 I level of significance.
Summary
Track and field athletes at a medium sized midwestern university completed three
test of anaerobic capacity. The tests were completed with a minimum of seven days and a
maximum of fourteen days between tests. The test were integrated into the track and field
workout routine. Scores on the tests were measured using a Pearson-Product correlation
to examine the relationship among the three tests. In addition, percentile-based norms for
both the men and the women were created for the Cunningham and Faulkner anaerobic
treadmill test.

32
CHAPTER 3
RESULTS
The purpose of this study was to detennine the relationship among the scores of
three tests of anaerobic capacity for Division II collegiate track and field athletes.
Participants completed each ofthe following tests: the Wingate Anaerobic Cycle Test,
the Cunningham and Faulkner anaerobic treadmill test, and the Running-based Anaerobic
Sprint Test. A sub-area of this study was to develop a preliminary set of percentile-based
nonns for the Cunningham and Faulkner anaerobic treadmill test based on the results of
Division II collegiate track and field athletes.
This chapter presents an analysis of the data obtained from the results of the three
tests. Data were collected from 38 participants (24 men and 14 women) with a range in
age from 18 - 23 years, and a mean age of 19.68 years. The age range for the males was
18 - 23 years with a mean age of 19.60 years. The age range for the females was 18 - 22
years with a mean age of 19.71 years. Descriptive statistics, including the range, mean
and standard deviation for each of the test results are presented in Table 1. A compilation
of results of mean anaerobic power (watts) for all three tests can be found in Table 2
The hypothesis states that there is a relationship among the test scores of the
Wingate anaerobic cycle test, the Cunningham and Faulkner anaerobic treadmill test, and
the Running-based Anaerobic Sprint Test. A Pearson-Product correlation was used to
detennine the strength of the relationship among the anaerobic capacity measurements of
the tests. The correlation among all tests was significant at the Q~ 0.01 level. The
relationship between the Wingate and the treadmill tests was r=.705, the Wingate and the

33
RAST was F.760, and the treadmill and the RAST was F.89I (Table 3). The hypothesis
was not rejected.

34
TABLE 1 - Descriptive Statistics for Anaerobic Capacity Test Results (watts)
Participants N = 38
Minimum Maximum Mean Std. Deviation
WAnT Tread RAST
322.91 371.02 255.38
805.64 676.95 991.52
547.6316 522.2271 561.2895
112.1175 73.9072 187.7380
Tread = Cunningham and Faulkner Anaerobic Treadmill Test
WAnT = Wingate Anaerobic Test
RAST = Running-based Anaerobic Sprint Test

35
TABLE 2 - Compilation of Mean Anaerobic Power Results
Mean Anaerobic Power scores (watts)
N=38 WAnT Tread RAST
Ml 746.59 595.58 742.81 M2 573.68 481.67 590.50 M3 670.79 550.02 671.55 M4 638.80 566.29 646.86 M5 693.00 584.19 625.64 M6 610.91 523.98 667.36 M7 644.59 533.75 595.89 M8 538.02 497.95 543.21 M9 613.64 598.84 722.35
MIO 538.50 605.35 792.40 MIl 514.64 480.05 477.87 M12 623.76 517.47 646.78 M13 679.09 543.51 877.49 M14 597.82 449.13 560.61 MI5 572.37 676.95 991.52 M16 657.20 598.84 784.14 M17 592.04 605.35 751.44 MI8 492.70 566.29 659.68 M19 447.75 631.38 698.77 M20 613.64 589.07 672.44 M21 512.73 533.75 501.21 M22 589.09 520.73 521.40 M23 696.82 595.58 799.94 M24 805.64 670.44 802.36 FI 385.06 406.82 255.38 F2 559.64 495.50 359.41 F3 420.27 436.11 330.56 F4 472.67 478.42 388.69 F5 448.50 455.64 374.19 F6 351.31 371.02 327.38 F7 510.55 510.96 395.96 F8 448.36 442.62 360.49 F9 450.00 432.85 331.51
FlO 322.91 471.91 361.56 FIl 435.17 455.64 338.69 F12 448.50 462.15 385.58 FI3 468.75 452.38 383.54 F14 424.50 456.45 391.84

36
TABLE 3 - Pearson-Product Correlation Coefficients for Anaerobic Capacity Tests
WAnT Tread RAST
WAnT 1.0 .705* .760*
Tread 1.0 .891 *
RAST 1.0
* Correlation is significant at the .Q'::: 0.0 I level
WAnT = Wingate Anaerobic Test
Tread = Cunningham and Faulkner Treadmill Test
RAST = Running-based Anaerobic Sprint Test
37
A sub-area of this study was to develop a preliminary set of percentile-based
norms for the Cunningham and Faulkner anaerobic treadmill test based on the data
obtained in this study (Tables 4 and 5). Due to the small and selective sample, these
tables are for comparison use only.
38
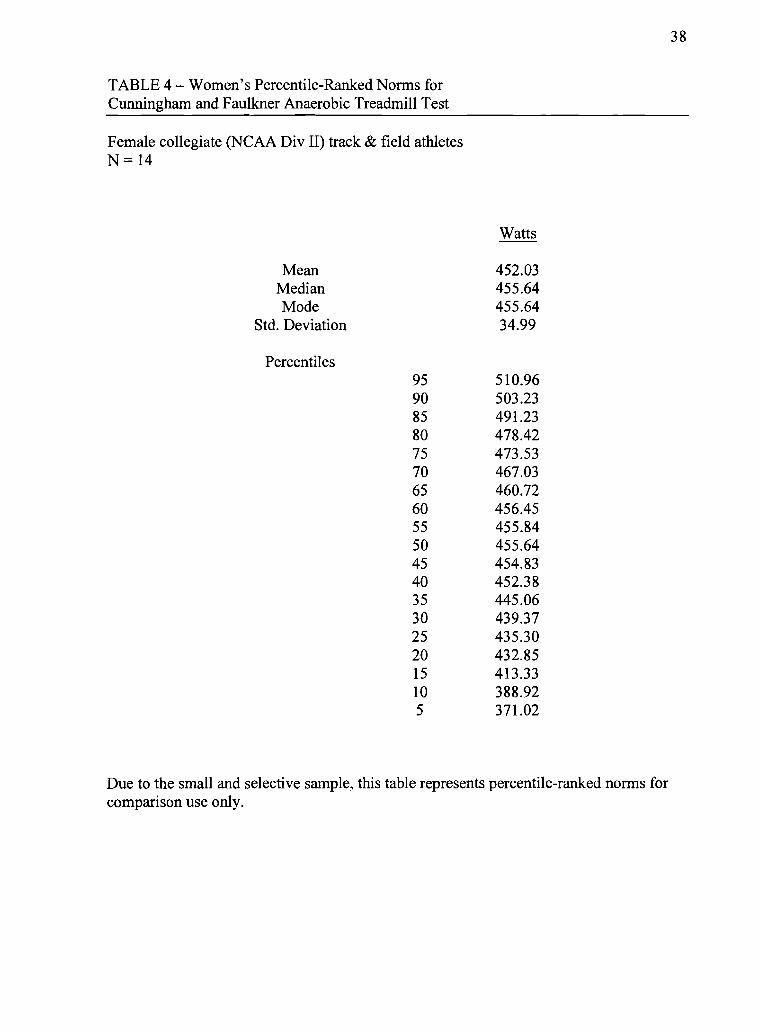
TABLE 4 - Women's Percentile-Ranked Norms for Cunningham and Faulkner Anaerobic Treadmill Test
Female collegiate (NCAA Div II) track & field athletes N= 14
Watts
Mean 452.03 Median 455.64 Mode 455.64
Std. Deviation 34.99
Percentiles 95 510.96 90 503.23 85 491.23 80 478.42 75 473.53 70 467.03 65 460.72 60 456.45 55 455.84 50 455.64 45 454.83 40 452.38 35 445.06 30 439.37 25 435.30 20 432.85 15 413.33 10 388.92 5 371.02
Due to the small and selective sample, this table represents percentile-ranked norms for comparison use only.

39
TABLE 5 - Men's Percentile-Ranked Norms for Cunningham and Faulkner Anaerobic Treadmill Test
Male collegiate (NCAA Div II) track & field athletes N=24
Watts
Mean 563.17 Median 566.29 Mode 533.75*
Std. Deviation 57.85
Percentiles 95 675.32 90 650.91 85 611.86 80 605.35 75 598.84 70 597.21 65 595.58 60 589.07 55 579.72 50 566.29 45 554.09 40 543.51 35 533.75 30 528.87 25 521.55 20 517.47 15 493.88 10 480.86 5 456.86
*Multiple modes exist. The smallest value is shown
Due to the small and selective sample, this table represents percentile ranked norms for comparison use only.
40
CHAPTER 4
DISCUSSION AND RECOMMENDAnONS
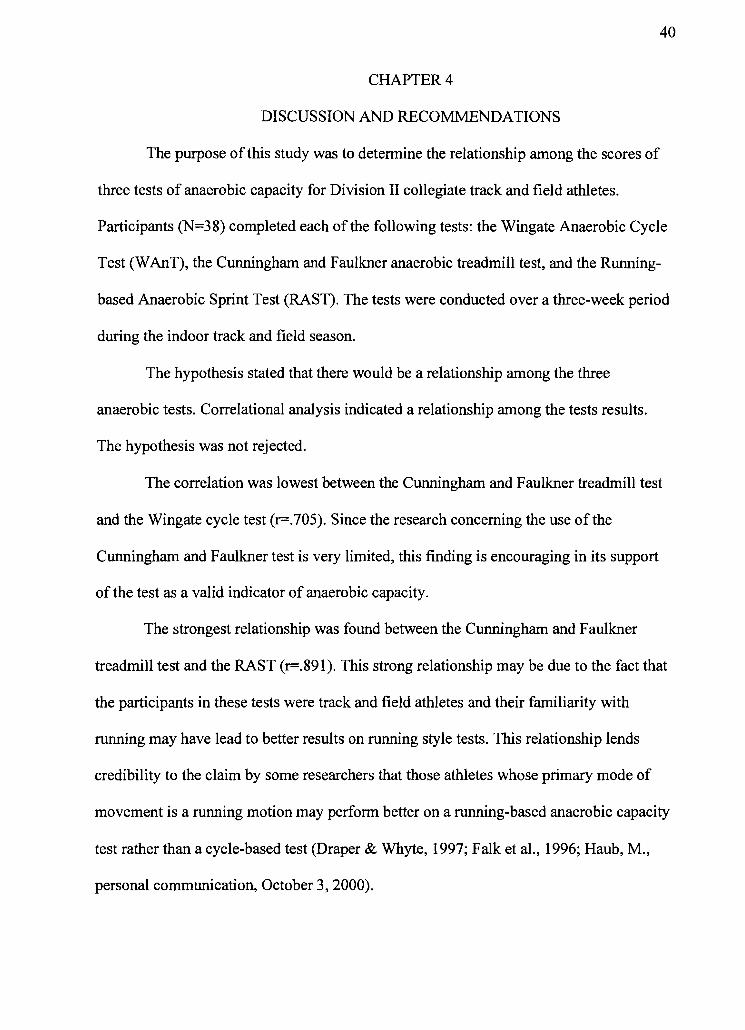
The purpose of this study was to detennine the relationship among the scores of
three tests of anaerobic capacity for Division II collegiate track and field athletes.
Participants (N=38) completed each of the following tests: the Wingate Anaerobic Cycle
Test (WAnT), the Cunningham and Faulkner anaerobic treadmill test, and the Running
based Anaerobic Sprint Test (RAST). The tests were conducted over a three-week period
during the indoor track and field season.
The hypothesis stated that there would be a relationship among the three
anaerobic tests. Correlational analysis indicated a relationship among the tests results.
The hypothesis was not rejected.
The correlation was lowest between the Cunningham and Faulkner treadmill test
and the Wingate cycle test (r=.705). Since the research concerning the use of the
Cunningham and Faulkner test is very limited, this finding is encouraging in its support
of the test as a valid indicator of anaerobic capacity.
The strongest relationship was found between the Cunningham and Faulkner
treadmill test and the RAST (r=.891). This strong relationship may be due to the fact that
the participants in these tests were track and field athletes and their familiarity with
running may have lead to better results on running style tests. This relationship lends
credibility to the claim by some researchers that those athletes whose primary mode of
movement is a running motion may perfonn better on a running-based anaerobic capacity
test rather than a cycle-based test (Draper & Whyte, 1997; Falk et al., 1996; Raub, M.,
personal communication, October 3,2000).
41
The RAST had a higher correlation with the Wingate (r=.760) than the
Cunningham and Faulkner test. This data supports the preliminary research done by
Draper & Whyte (1997) who stated that the RAST was comparable to the Wingate cycle
test. It appears that using the RAST could be a economical alternative for those coaches
and athletes wishing to test anaerobic capacity but do not have the proper laboratory
equipment to perform the more traditional tests.
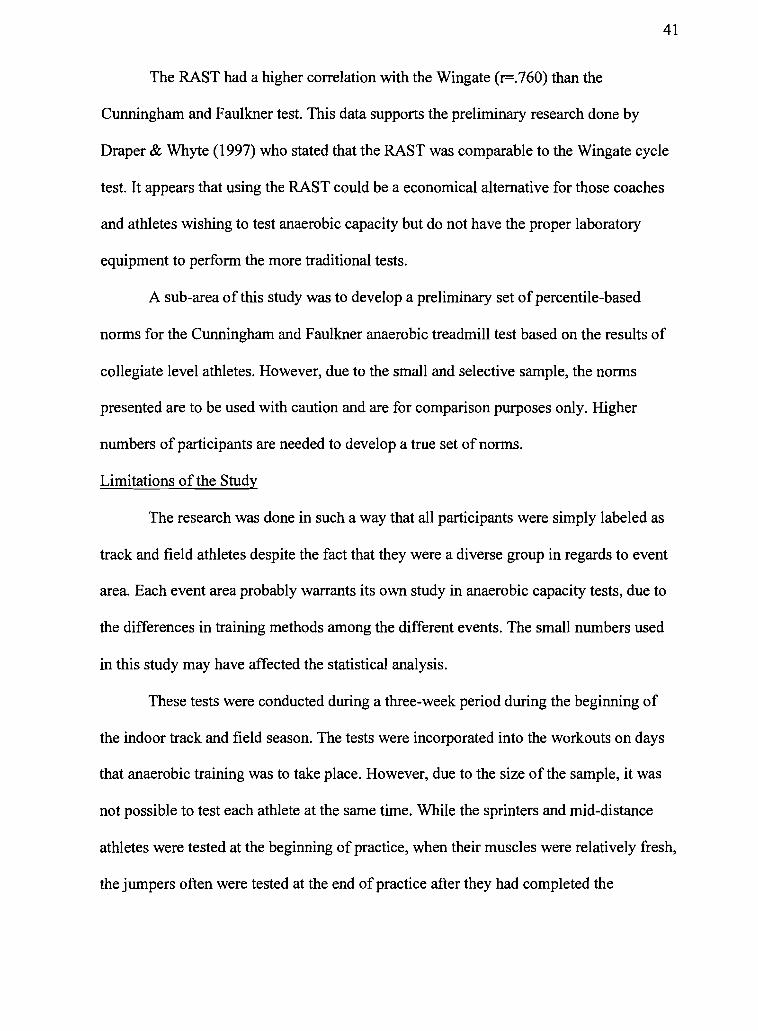
A sub-area of this study was to develop a preliminary set of percentile-based
norms for the Cunningham and Faulkner anaerobic treadmill test based on the results of
collegiate level athletes. However, due to the small and selective sample, the norms
presented are to be used with caution and are for comparison purposes only. Higher
numbers of participants are needed to develop a true set of norms.
Limitations of the Study
The research was done in such a way that all participants were simply labeled as
track and field athletes despite the fact that they were a diverse group in regards to event
area. Each event area probably warrants its own study in anaerobic capacity tests, due to
the differences in training methods among the different events. The small numbers used
in this study may have affected the statistical analysis.
These tests were conducted during a three-week period during the beginning of
the indoor track and field season. The tests were incorporated into the workouts on days
that anaerobic training was to take place. However, due to the size of the sample, it was
not possible to test each athlete at the same time. While the sprinters and mid-distance
athletes were tested at the beginning of practice, when their muscles were relatively fresh,
the jumpers often were tested at the end of practice after they had completed the

42
technique portion of their workout. It is important for jumpers to be as fresh as possible
during technique work. Due to the fatiguing nature of anaerobic capacity tests,
concessions where made for the jumpers to participate in the study after their technique
work was done. Although technique work in itself is not particularly muscle fatiguing,
the amount oftime spent on it can deplete an athlete's energy stores. The participants
who did jump technique work prior to the test, may have reached muscular fatigue earlier
in the tests than if they been able to perform the test prior to technique work.
In addition, the diversity of track athletes (mid-distance, sprinters, jumpers, multi
eventers) did not lend itselfwell to controlling the effects of workouts prior to and during
the data collection phase. Although tests were scheduled on days typically devoted to
anaerobic training, the training that took place the day or days prior to the test day may
have been largely different among the participants. This difference in training may have
affected the ability ofthe athlete, mentally or physically, to perform at a maximum level
during the test.
These types of physical tests are difficult, even for trained athletes, and require a
high level of self-motivation in order to be done correctly. This type of motivation is
beyond the control of the researcher. The inability to control the internal motivation of
the participants may have caused a distortion of the test results.
Recommendations for Future Research
The following are recommendations for future study:
1. Data should be collected among a wider variety of athletes who participate in sports or
activities that require a high use of the anaerobic energy system. A more diverse athletic

43
population can lead to a better generalization of results. More numbers are also needed
for stronger statistical analysis.
2. Data collection should be conducted during the athlete's off-season when control over
workouts prior to testing days can be more firmly established, thus providing consistency
of overload and recovery periods among a wide variety of athletes.
3. Practice tests should be conducted for each participant prior to data collection.
Familiarization with each test may increase the maximal performance for participants.
4. A continuation of data collection for the Cunningham and Faulkner anaerobic treadmill III'
" test. More participants are needed, especially among sports other than track and field. 1\
II," Iii
Larger numbers are needed to develop a proper set of percentile-based norms. IIII III II

44
REFERENCES
Adams, G.M. (1998). Exercise physiology laboratory manual. Boston, MA: WCB
McGraw-Hill.
Calbet, 1.A.L., Chavarren, 1., & Dorado, C. (1997). Fractional use of anaerobic
capacity during a 30- and a 40-second wingate test. European Journal of Applied
Physiology and Occupational Therapy, 76(4), 308-313.
Cunningham, D.A., & Faulkner, J.A. (1969). The effect of training on aerobic and
anaerobic metabolism during a short exhaustive run. Medicine and Science in Sports,
~65-69.
Drabbs, M.E., & Maud, P.J. (1997). A single test for assessing maximum aerobic
and anaerobic performance capacity of competitive cyclist. Journal of Strength and
Conditioning Research, 11(2), 125-128.
Draper, N., & Whyte, G. (1997). Testing anaerobic performance. Retrieved
November 15,2000, from the World Wide Web: www.pponline.co.uk/encyc/0155.htm
Falk, B., Weinstein, Y., Dolan, R., Abramson, D.A., & Mann-Segal, D. (1996). A
treadmill test of sprint running. Scandinavian Journal of Medicine and Science in Sports,
@259-264.
Fox, E., Bowers, R., & Foss, M. (1993). The physiological basis for exercise and
sport. Madison, WI: WCB, Brown and Benchmark.
Green, H.J., & Houston, M.E. (1975). Effects ofa season of ice hockey on energy
capacities and associated functions. Medicine and Science in Sports, 7(64), 299-303.
Inbar, 0., Bar-Or, 0., & Skinner, J.S. (1996). The wingate anaerobic test.
Champaign, IL: Human Kinetics.

45
MacDougall, J.D., Wenger, H.A, & Green, H.J. (Eds.). (1982). Physiological
testing of the elite athlete. Canada: Canadian Association of Sport Sciences.
Maud, P.J., & Schultz, B.B. (1989). Norms for the wingate anaerobic test with
comparison to another similar test. Research Quarterly for Exercise and Sport, 60(2),
144-151.
McArdle, W.D., Katch, F.r., & Katch, V.L. (1986). Exercise physiology, energy,
nutrition, and human performance. Philadelphia, PA: Lea and Febiger.
Nicklin, RC., O'Bryant, H.S., Zehnbauer, T.M., & Collins, M.A (1990). A
computerized method for assessing anaerobic power and work capacity using maximal
cycle ergometry. Journal of Applied Sport Science Research, 4(4), 135-140.
Nummela, A, Alberts, M., Rijntjes, RP., Luhtanen, P., & Rusko, H. (1996).
Reliability and validity ofthe maximal anaerobic running test. International Journal of
Sports Medicine, 17,97-102.
Parry-Billings, M., Reilly, T., & MacLaren, D. (1986). The measurement of
anaerobic power and capacity: studies on the wingate anaerobic test. Snipes Journal, 9(1),
48-58.
Powers, S.K., & Howley, E.T. (1997). Theory and application to fitness and
performance. Madison, WI: WCB, Brown and Benchmark. ~
Robergs, R.A, & Roberts, S.O. (2000). Fundamental principles of exercise
physiology for fitness, performance, and health. Boston, MA: McGraw Hill.
Rusko, H., Nummela, A, & Mero, A (1993). A new method for the evaluation of
anaerobic running power in athletes. European Journal of Applied Physiology and
Occupational Physiology, 66(2), 97-101.

46
Stanbrough, M. (1999) Lifetime fitness. Dubuque, IA: KendalIHunt Publishing.
Tharp, T.D., Newhouse, R.K., Uffelman, 1., Thorland, W.G., & Johnson, G.O.
(1985). Comparison of sprint and run times with performance on the wingate anaerobic
test. Research Quarterly for Exercise and Sport, 56(1), 73-76.
Wilmore, J.H., & Costill, D.L. (1999). Physiology of sport and exercise.
Champaign, IL: Human Kinetics.

'BInWlOd lS:;ll. :;lpAJ ~!qOl:;l'BUY :;ll'B3u!i\\
yx!pu:;lddy
Lt

48
Wingate Anaerobic Test formula
N x (R x 6) = Work Goules)
then
Work/30sec = M-AnP (watts; mean anaerobic power)
W = Work Goules)
N = Newtons (body weight in kg x 10 x .075; force setting on Monarch cycle)
R = total pedal Revolutions completed in 30 seconds
6 = 6m, the distance traveled by the flywheel of the Monarch cycle ergometer
M-AnP = Mean Anaerobic Power (watts)
Example:
60kg participant 50 pedal revolutions in 30 sec
W Goules) = 45 N (60kg x 10 x .075) x 50 (revs) x 6 (distance traveled by flywheel)
W=45 x 50x6
W = 13500 joules
then
M-AnP = Joules/time
M-AnP = 13500/30
M-AnP = 450 watts (mean anaerobic power)
(Adams, 1998)

49
Appendix B
Cunningham and Faulkner Anaerobic Treadmill Test Formula

50
Cunningham & Faulkner Anaerobic Treadmill Test formula
F x D(v) = Work Ooules)
then
Work/Time = M-AnP (watts; mean anaerobic power)
W = Work Ooules)
F = Force (weight of participant) in N (Newtons, N = 10 x kg)
D(v) = Distance (vertical)
D(h) = Distance (horizontal)
M-AnP = Mean Anaerobic Power (watts)
T = Time (total seconds)
D(h) = Distance (horizontal) is determined by multiplying the speed (m/s) by the total
time (seconds)
D(v) = divide the % of slope (20%) by 100 then multiply by D(h) horizontal distance
This is constant in this equation: 20/100 x 3.58m/s(8mph) = .716 D(v) = .716
M-AnP (mean anaerobic power) = Work/Time Ooules/total seconds)
Example:
68 kg participant 20% grade 8mph 60 seconds
W Ooules) = 680 N (68kg x 10) x .716 (Dv) x 60 (total seconds)
W=680x.716x60
W=29,212.8j
then
M-AnP = 29,212.8/60
M-AnP =486.88 watts (mean anaerobic power) (Adams, 1998)

BlnUIlod lS~.L lupdS :>}qOl~BUV p~sBq-3u}uunlI
:J x}pu~ddV

52
Running-Based Anaerobic Sprint Test formula
Power Value for each 35m sprint is calculated with the following formula:
Power = Weight(kg) x Distance x Distance/Time x Time x Time
then
Sum of all 6 Power Values/6 = M-AnP; Mean anaerobic power (watts)
Example
76 kg participant 35m 4.52,4.75,4.92,5.21,5.46,5.62 (times)
Power Value #1 = 76 x 35 x 35/4.52 x 4.52 x 4.52
Power Value #1 = 93100/92.35
Power Value #1 = 1008.12 watts
Repeat formula for each ofthe 6 times taken
then
Mean Anaerobic Power (M-AnP) = sum of all 6 Power Values/6
PI + P2 + P3 + P4 + P5 + P6 = P total / 6
1000.12 + 868.70 + 781.73 + 658.32 + 571.97 + 524.49 = 4413.33
M-AnP = P(total)/6
M-AnP P(mn) = 4413.33/6
M-AnP = 735.55 watts (mean anaerobic power)
(Whyte, 1997)

53
Appendix D
Institutional Review Board for Treatment
of Human Subjects Permission Letter

54
EMPORIA STATE UNIVERSITY 1200 Commercial 316-341-5351 GRADUATE STUDIES AND RESEARCH Emporia, Kansas 316-341·5909 fax RESEARCH AND GRANTS CENTER 66801·5087 www.emparia.edu Campus Bax 4003
November l, 2000
Paul Luebbers 603 E. 11 th, Apt. F Emporia, KS 66801
Dear Mr. Luebbers:
The Institutional Review Board reviewed your application for approval to use human subjects, entitled. "A Correlational Study of Two Methods of Anaerobic Testing: The Wingate Cycle Test and the Cunningham and Faulkner Treadmill Test." I am pleased to infonn you that your application was approved and you may begin your research with subjects as outlined in your application materials.
On behalf of the Institutional Review Board, I wish you luck with your research project. If I can help you in any way, do not hesitate to contact me.
Si~cerely,
/{~ CJJ-. )',,-1 Timothy M. Downs, Ph.D. Dean, Graduate Studies and Lifelong Learning
pf
cc: Mark Stanbrough
An Equal Opportunity Employer

lu~wn:>Oa lU:;)SUO;) P:;)uuoJuI
'3 xIpu:;)ddV
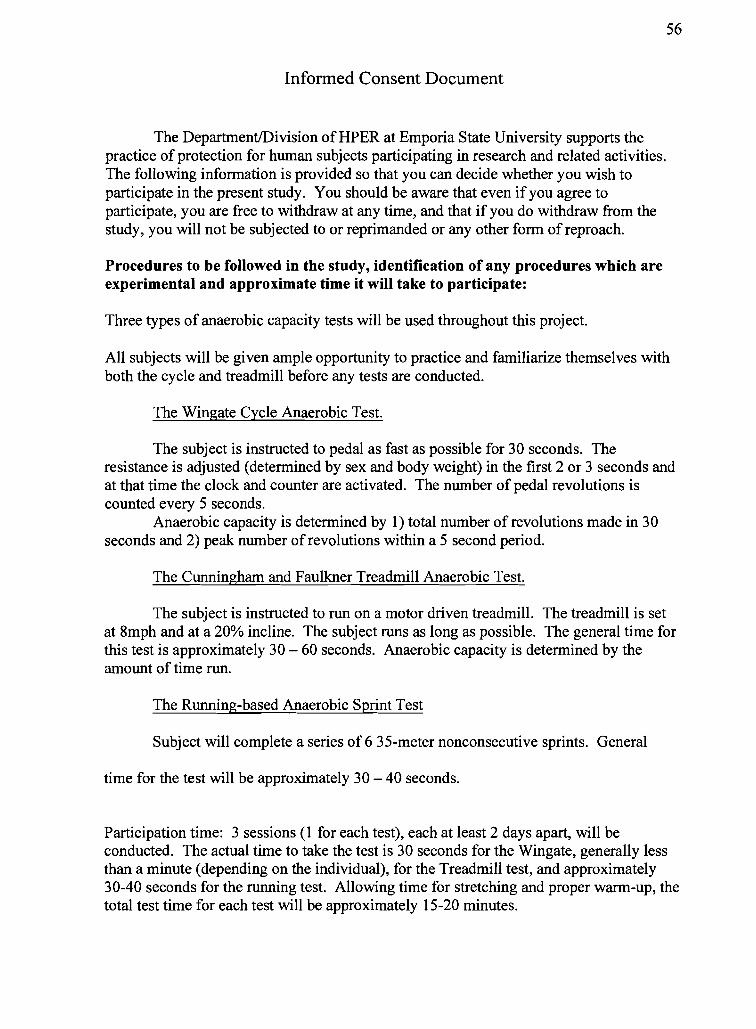
56
Informed Consent Document
The Department/Division of HPER at Emporia State University supports the practice of protection for human subjects participating in research and related activities. The following information is provided so that you can decide whether you wish to participate in the present study. You should be aware that even if you agree to participate, you are free to withdraw at any time, and that if you do withdraw from the study, you will not be subjected to or reprimanded or any other form of reproach.
Procedures to be followed in the study, identification of any procedures which are experimental and approximate time it will take to participate:
Three types of anaerobic capacity tests will be used throughout this project.
All subjects will be given ample opportunity to practice and familiarize themselves with both the cycle and treadmill before any tests are conducted.
The Wingate Cycle Anaerobic Test.
The subject is instructed to pedal as fast as possible for 30 seconds. The resistance is adjusted (determined by sex and body weight) in the first 2 or 3 seconds and at that time the clock and counter are activated. The number of pedal revolutions is counted every 5 seconds.
Anaerobic capacity is determined by 1) total number of revolutions made in 30 seconds and 2) peak number of revolutions within a 5 second period.
The Cunningham and Faulkner Treadmill Anaerobic Test.
The subject is instructed to run on a motor driven treadmill. The treadmill is set at 8mph and at a 20% incline. The subject runs as long as possible. The general time for this test is approximately 30 - 60 seconds. Anaerobic capacity is determined by the amount of time run.
The Running-based Anaerobic Sprint Test
Subject will complete a series of 6 35-meter nonconsecutive sprints. General
time for the test will be approximately 30 - 40 seconds.
Participation time: 3 sessions (1 for each test), each at least 2 days apart, will be conducted. The actual time to take the test is 30 seconds for the Wingate, generally less than a minute (depending on the individual), for the Treadmill test, and approximately 30-40 seconds for the running test. Allowing time for stretching and proper warm-up, the total test time for each test will be approximately 15-20 minutes.

57
Description of any attendant discomforts or other forms of risk involved for subjects taking part in the study:
The testing sessions will require some physical exertion which may induce temporary discomfort and/or muscle soreness. Subjects may terminate testing at any time.
Description of benefits to be expected from this study:
To gain further knowledge of the Cunningham and Faulkner Anaerobic Treadmill Test and the Running-based Anaerobic Sprint Test. These tests may be more pertinent to athletes and coaches since the majority of intercollegiate sports utilize running on a daily basis, whereas cycling, which is employed by the Wingate test, is unique to it's own sport.
If a correlation is found to exist, a set of norms based on the data obtained from this study may begin to be developed, which would enable and encourage a more widespread use of the tests.
"I have read the above statement and have beenfully advised ofthe procedures to be used in this project. I have been given sufficient opportunity to ask any questions I had concerning the procedures andpossible risks involved I understand the potential risks involved and I assume them voluntarily. I likewise understand that I can withdraw from the study at anytime without be subjected to reproach. "
Participant
Date

58
I, Paul Edward Luebbers, hereby submit this thesis to Emporia State University as partial fulfillment of the requirements for an advanced degree. I agree that the Library of the University may make it available for use in accordance with its regulations governing materials of this type. I further agree that quoting, photocopying, or other reproduction of this document is allowed for private study, scholarship (including teaching) and research purposes of a nonprofit nature. No copying which involves potential financial gain will be allowed without written permission of the author.
~Lfl--Signature ofAuthor
~ OLI. O[
Date
An Examination of the Relationship Among Three Tests
of Anaerobic Capacity Title of Thesis
tIL ~kJSig~ture 0 Graduate Office Staff Member
~y -Y, ~ C' CI/
\; ,.,
;i c