an assessment of urban environmental issues using · pdf filean assessment of urban...
TRANSCRIPT

An assessment of urban environmental issues using remote sensing and GIS techniques an integrated approach: A case study: Delhi, India
Atiqur Rahman¹* & Maik Netzband²
¹Department of Geography, Faculty of Natural Sciences, Jamia Millia Islamia University, New Delhi -110 025
E-mail: [email protected] * Presenting author
²Centre for Environmental Research, Department Urban Ecology,
Environmental Planning and Transport, Permoserstr, 15, 04157 Leipzig; E-mail: [email protected]
Paper presented to the PRIPODE workshop on
Urban Population, Development and Environment Dynamics in Developing
Countries
Jointly organized by CICRED, PERN and CIESIN
With support from the APHRC, Nairobi
11-13 June 2007
Nairobi, Kenya
1
1. Introduction
There is an unequal urban growth which is taking place all over the world
but the rate of urbanization is very fast in the developing countries especially in
Asia. In 1800 A.D, only 3% of the world's population lived in urban centres but
this figure reached to 14% in 1900 and in 2000, about 47% (2.8 billion) people
were living in urban areas. India no longer lives in villages and 79 million people
were living in urban areas in 1961 but it went up to 285 million in 2001. In India
and China alone, there are more than 170 urban areas with populations of over
750,000 inhabitants (United Nations Population Division, 2001). Statistics show
that India's urban population is second largest in the world after China, and is
higher than the total urban population of all countries put together barring China,
USA and Russia. In 1991, there were 23 metropolitan cities in India, which
increased to 35 in 2001 (Census of India, 1991 & 2001) some of the prominent
one are Delhi (13.78 million), Mumbai (13.22 million) and Chennai (6.42 million).
There is a mass migration of people from rural to urban and also from smaller to
bigger urban areas and then to metropolitan centres like Delhi, Bombay,
Bangalore, and Mumbai etc. The major cause anticipated for this is the high in-
migration in search of better employment opportunities in these urban centres in
comparison to neighbouring states. As urban population increases, the demand
of land for various urban activities also increases. The process of urbanization in
India gained momentum with the start of industrial revolution way back in 1970s
followed by globalization in 1990s. Forests were cleared, grasslands ploughed or
grazed, wetlands drained and croplands encroached upon under the influence of
expanding cities, yet never as fast as in the last decade (Rahman, 2007).
This explosive increase in the exponential form of ‘Population Growth’ has
caused havoc for the human life in the city environment. Doubling and tripling of
urban population practically in all major cities and towns and the consequent
strain on the existing system manifested in an environmental chaos. Every major
city of India faces the same proliferating problems of urban expansion,
inadequate housing, poor transportation system, poor sewerage, erratic electric
2

supply, insufficient water supplies etc. An increasing number of trucks, buses,
cars, three-wheelers and motorcycles all spewing uncontrolled fumes, surge in
sometimes-haphazard patterns over city streets jammed with jaywalking
pedestrians, rickshaw and cattle. The phenomena of accelerated urbanization is
the main culprit, wherein besides bringing higher standard of living has also
brought problems of growth of dense and unplanned residential areas,
environmental pollution, non-availability of services and amenities and solid
waste generation and growth of slums. Population growth and in-migration of
poor people, industrial growth, inefficient and inadequate traffic corridors, poor
environmental infrastructure, etc. are the main factors that have deteriorated the
overall quality of the city environment. Emerging future of Delhi in the light of its
past experiences, current trends, and development initiatives is one of the
important issue which shows different social and physical factors affecting the
housing and quality of life in Delhi (Misra, et. al. 2001). After independence, when
Delhi witnessed a large influx of migrants, within a very short time, the population
of Delhi increased more than two folds. To house such a large migrant people
city has to expand. The rate of expansion is very fast, unplanned, uncontrolled
and most of them are illegal (Rahman, 2006). Mushrooming of illegal
construction has become day-to-day phenomena in the fringe areas of all big and
medium size cities in India.
The level of pollution i.e. air, water and land has increased because of
lack of poor environmental management. This has its direct impact on quality of
urban environment, affecting efficiency of the people and their productivity in the
overall socio-economic development. India’s urban air quality ranks among the
worlds worst. Vehicles are the major source of this pollution, today with more
than 5 million cars, trucks, buses, taxis, and rickshaws already on the roads in
the country’s capital New Delhi alone. Each urban centre has a number of
environmental problems with varying scale and scopes which are influenced by
factors such as size of population and its density, climatic conditions, water
resources and the flora and fauna in and around the urban centre (Hardoy et al.,
1997). The state of urban environment all over India is deteriorating so fast that
3

the sustainability of the cities is threatened. In metro cities like Delhi, land
environment is under stress due to the pressure of rapid urbanization. As the
cities expand and population increases, the resources, which are limited, are
shared. The lack of services such as water supply, sanitation, drainage of storm
water, treatment and disposal of waste water, management of solid and
hazardous wastes, supply of safe food, water and housing are all unable to keep
pace with urban growth.
So in this context an integrated geo-spatial technology i.e. remote sensing
(RS), geographic information system (GIS) and global positioning system (GPS)
can contribute substantially in a more supplementary fashion to some of the
interactive operations that should become an asset for assessing,
understandings, mapping utility and service facility using GPS and solving
complex urban environmental issues. By utilizing remote sensing data and
implementing GIS mapping techniques, change detection over a period of time of
the urban areas can be monitored and mapped for specific developmental
projects. Creating linkages between remote sensing data and socio economic
data obtained on the ground from household surveys has been recognized as
one of the major challenges of land use/land cover change studies (Rindfuss et
al. 2003). Satellite Remote Sensing, with its repetitive coverage together with
multi-spectral (MSS) capabilities is a powerful tool to map and monitor the
emerging changes in the urban core as well as in the peripheral areas of any
urban areas. The loss of agricultural land because of rapid urbanization has been
detected using remote sensing techniques in some cities of India i.e. Hyderabad,
Madras and Nagpur (NRSA, 1994). The situation is severe in India due to
unplanned growth of the cities in all directions. The spatial patterns of urban
sprawl in all direction over different periods, can be systematically mapped,
monitored and accurately assessed from remotely sensed data along with
conventional ground data (Lata et. al., 2001).
Keeping these above points in mind in this paper an attempt has been
made to assess some of the urban environmental issues which Delhi is currently
4
facing with the help of geo-spatial tools i.e. remote sensing (RS), geographic
information system (GIS) and global positioning system (GPS). 1.1 Objectives
The specific research objectives of this paper are as follows:
To assess the demographic profile of Delhi
To assess the land use/land cover of Delhi during the period1992-2004
To assess the thermal environment of Delhi i.e. night time temperature for
2001 and 2005 in order to asses the Urban Heat Island
To find out the night time temperature on various land use/land cover
To examine the spatial pattern of solid waste generation, collection and its
management
To assess the industrial pollution i.e. air, waste water and noise
1.2 Study Area
Delhi, the capital city of India is located between the 28º 24' 17" and 28º
53' 00” N latitudes and 76° 45' 30” and 77 º 21’ 30” E longitudes (fig. 1) and it
spreads over an area of 1,463 km². It is situated on Aravali quartzite rage of
Rajasthan. The climate is semi-arid with maximum rainfall is in the month of July
(296 mm), October to December are dry. While the hottest months are May and
June with mercury levels touching 48°C, whereas, the lowest falls to 4°C at the
end of December and early January. The total population of Delhi was nearly 0.4
million in 1901, which kept on increasing slowly and it was 1.74 million in 1951
and 9.42 million in 1991. But sharp rise in population was recorded in the last
decade and it reached to 13.78 million in 2001 (Census of India 2001) and as per
Registrar General of India (RGI) estimates Delhi’s population will be 20.78 million
by 2015. East district among all 9 districts of Delhi has been experiencing high
growth rate of urban population and it ranks 6th among all districts with 90.19%
urban population in 1991, while 98.75% urban population growth recorded in
2001, which is only after Central and New Delhi districts. In Delhi about 79.48%
of households have electricity connections and 63.38% of households have toilet
facilities (Economic Survey of Delhi, 1991). About 60% of the households have
both electricity and toilet facilities, 75.7% have piped water supply (individual plus
5

sharing) while 20% depend on hand-plumps/tube-wells (Economic Survey of
Delhi 1999-2000)
Fig. 1
SOUTH
2. Data source and methodology
2.1 Satellite data
Table 1 Details of satellite imageries used S. No. Satellites Sensors Date Resolution No.
Bands Path Row
1 Landsat TM 1992 28.5 m 4 146 40 2 IRS-P6 LISS-III Feb 2004 23.5 m 3 96 51 3 TERRA ASTER Sept. 2003 15.0 m 4 144 48 4 TERRA ASTER Oct. 2001 90.0 m 5 13 204 5 TERRA ASTER Sept. 2003 90.0 m 5 13 204
2.2 Secondary data
• Demographic data of Delhi, Census of India, Delhi
• Air, noise and waste water pollution data, Central Pollution Control Board, (CPCB), Delhi
• Garbage and solid waste data from CPCB, Delhi Pollution Control Board (DPCB) and Municipal Corporation of Delhi (MCD).
2.3 Methodology for temporal land use/land cover and change detection
Landsat and IRS multi spectral (MSS) satellite image of 1992 and 2004
respectively have been used for generation of land use/ land cover map (fig. 2).
The satellite data was enhanced before classification using histogram
equalization in ERDAS Imagine 8.7 for the better quality of the image and to
achieve better classification accuracy. Further both satellite data were rectified to
6

a common Universal Traverse Mercator (UTM) projection/coordinate system on
1:50,000 scale. The data was resampled to a common spatial resolution of 23.5
m. Then supervised classification was performed using maximum likelihood
algorithm of the classified data was recoded and then ground truthing was done
and thereafter accuracy assessment matrix was performed. Two land use/land
cover maps were prepared from i) Landsat TM 1992 and ii) IRS LISS-III satellite
data of 2004 thereafter changes in different land use/land cover was observed.
Change detection (1992-2004)
Landsat TM 1992 IRS P6 LISS –III 2004
Subsetting image
Geometric correction Image to Image
Subsetting image
Resampled Landsat Image Resampled IRS Images
Supervised classification
Supervised classification
Land use/land cover 1992
Accuracy assessment
(Maximum likelihood)Algorithm
Land use/land cover 2004
Fig. 2 Flow chart of methodology for land use/land cover & change detection
2.4 Methodology for estimation of surface temperature from satellite data
To asses the surface temperature of Delhi ASTER datasets have been
rectified to a common UTM (Universal Transverse Mercator) projection and
WGS84 datum using Survey of India (SoI) topographical sheet and then was
resampled using the nearest neighbour algorithm. The DN number of LANDSAT-
7
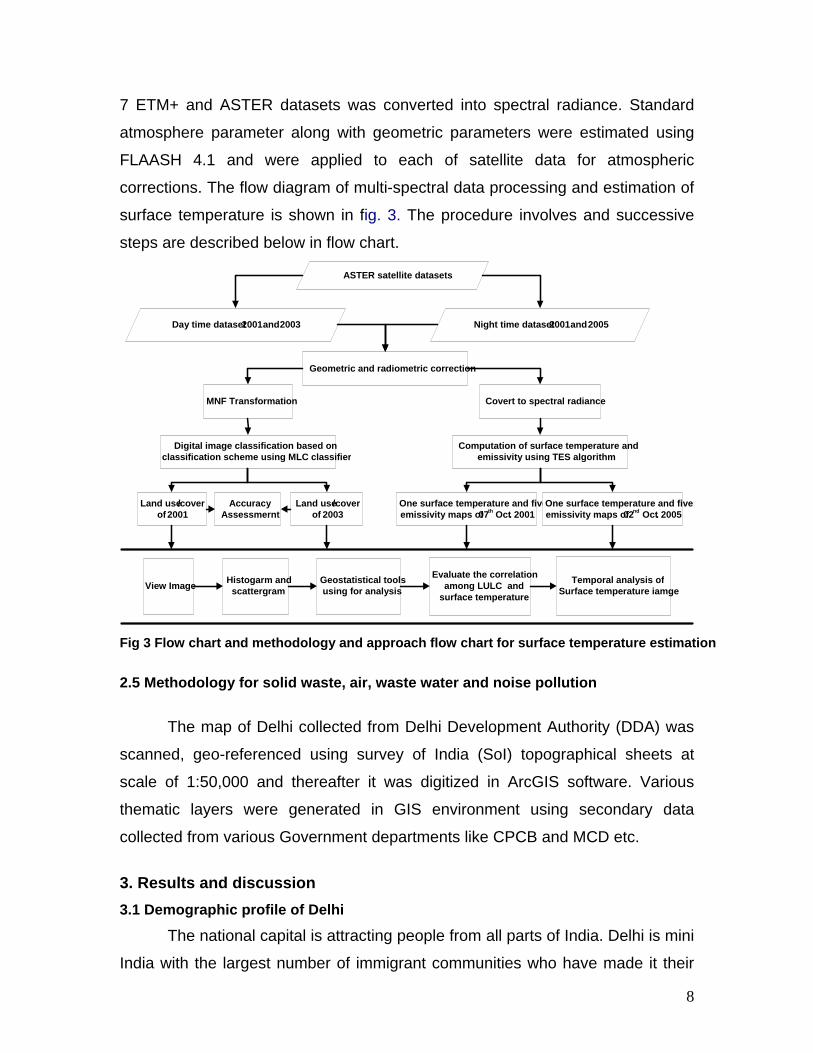
7 ETM+ and ASTER datasets was converted into spectral radiance. Standard
atmosphere parameter along with geometric parameters were estimated using
FLAASH 4.1 and were applied to each of satellite data for atmospheric
corrections. The flow diagram of multi-spectral data processing and estimation of
surface temperature is shown in fig. 3. The procedure involves and successive
steps are described below in flow chart.
ASTER satellite datasets
Day time dataset 2001 and 2003 Night time dataset 2001 and 2005
Geometric and radiometric correction
MNF Transformation
Digital image classification based on classification scheme using MLC classifier
Accuracy Assessmernt
Land use /cover of 2001
Land use/cover of 2003
Covert to spectral radiance
Computation of surface temperature and emissivity using TES algorithm
One surface temperature and five emissivity maps of 07th Oct. 2001
One surface temperature and five emissivity maps of 02nd Oct. 2005
View Image Histogarm and scattergram
Geostatistical tools using for analysis
Evaluate the correlation among LULC and
surface temperature
Temporal analysis of Surface temperature iamge
Fig 3 Flow chart and methodology and approach flow chart for surface temperature estimation
2.5 Methodology for solid waste, air, waste water and noise pollution
The map of Delhi collected from Delhi Development Authority (DDA) was
scanned, geo-referenced using survey of India (SoI) topographical sheets at
scale of 1:50,000 and thereafter it was digitized in ArcGIS software. Various
thematic layers were generated in GIS environment using secondary data
collected from various Government departments like CPCB and MCD etc.
3. Results and discussion 3.1 Demographic profile of Delhi
The national capital is attracting people from all parts of India. Delhi is mini
India with the largest number of immigrant communities who have made it their
8

home. Every day, 665 persons migrate to Delhi-a number that far exceeds
migration to Mumbai (236), Bangalore (165) and Ahemdabad (121) put together
(Delhi’s First Human Development Report, 2006). Delhi has witnessed a
phenomenal population growth during past few decades. From a population of
4,05,819 in 1901, it increased to 13,782,976 in 2001. Since 1951, the population
of Delhi has been increasing at an average rate of about 46% every decade
(table 2). Table 2 District-wise area and population of Delhi during 1991 to 2001
1991 2001 District Area (km2)
% Area to total area of State
Population (In lakhs)
% to Pop- ulation
of State
Density (pers./ km2)
Population (In lakhs)
% to Pop ulation
of State
Density (pers./ km2)
Decadal growth 1991- 2001
North-West 440 29.7 1,778,268 18.88 18,088 2,847,395 20.66 29,395 60.12 South 250 16.9 1,502,878 15.95 26,261 2,258,367 16.38 25,760 50.27 West 129 8.7 1,434,008 15.22 15,986 2,119,641 15.38 22,637 47.81 North-East 60 4.05 1,085,250 11.52 11,116 1,763,712 12.8 16,431 62.52 South-West 420 28.3 1,084,705 11.51 11,471 1,749,492 12.69 12,996 61.29 East 64 4.31 1,023,078 10.86 6,012 1,448,770 10.51 9,033 41.61 North 60 4.05 688,252 7.31 4,042 779,788 5.66 6,471 13.30 Central 25 1.68 656,533 6.97 4,791 644,005 4.67 4,909 -1.91 New Delhi 35 2.36 167,672 1.78 2,583 171,806 1.25 4,165 2.47 Total Delhi 1483 100.00 94,20,644 100.00 6352 137,82,976 100.00 9,294 46.31 Source: Census of India 1991 & 2001
In the 1901 Census, more than 47.34% of Delhi's population lived in rural
areas which showed a gradual decline 17.60% in 1951 to 6.99% in 2001. Urban
population has increased rapidly since 1911 when the capital of India was sifted
from Calcutta (presently Kolkata) to Delhi. The pace of urbanisation was
accelerated during 1941-51 when the country was divided into India and Pakistan
and a large number of migrant settled in Delhi. With rapid urbanisation, the rural
area is shrinking; it has reduced to 591.91 km². (2001) from 1157.52 km². (1961),
but urban population kept on increasing and it reached to almost 14 million in
2001 (fig.5). In 2001 the population density was 14,387 and 1,627 persons/km2 in
urban areas and rural areas respectively. Villages of Delhi, which have coexisted
with the sprawling urban settlements, still retain a great deal of rural tradition.
Pattern of urban and rural population in Delhi 1901 - 2001
0
2
4
6
8
10
12
14
16
Total Urban Rural
9Mill
ions
19 0 1 19 11 19 2 1 19 3 1 19 4 1 19 51 19 6 1 19 71 19 8 1 19 9 1 2 0 0 1

The rapid urbanisation has led to the development of new settlements
colonies in Delhi. These settlements are categorised by DDA in terms of civic
infrastructure, types of houses, authorised, unauthorised settlement,
unauthorised-regularised colonies, Jhuggis and Jhoparis (informal) resettlement
colonies etc. More than three people are residing in a single room, is the same
condition for 56% of the population of Mumbai followed by 43% population of
Kolkata, 30% population of Chennai and 25% population of Delhi. The Master
Plan of Delhi 2001 suggested that 1.61 million new dwelling units should be
made available during 2001 because housing demand is expected to increase
further. The shortage of housing coupled with large influx of migrant population
leads to unplanned city’s expansion and change in land use/land cover over
period of time.
3.2 Land use/land cover change detection
IRS-1C, LISS-III MSS and PAN merged data products has been very
useful in urban analysis and urban land use/land cover mapping (NRSA, 2005).
Digital mapping technique can be applied for information generation and making
an up-to-date urban information (Rathi et. al. 1999). Land use/land cover maps
were produced from Landsat TM and IRS 1C LISS-III satellite images of 1992
and 2004 respectively and expansion of Delhi was mapped from 1992 to 2004.
The study shows that out of 1,48,312 hect. total geographical area of Delhi
aagriculture constitutes 65,114 hect. in 1992 and that declined to (12%) 54,153
hect. by 2004. The major cause of this unprecedented decline in area under
agricultural use was due to increase in urban area (table 3 & fig. 6). At the same
time high dense residential area get more than doubled in the last twelve years.
That is mainly at the cost of high fertile agricultural land (plate 1). Similarly land
transformation has taken place all around Delhi in the fringe areas especially in
East, South-West and North districts of Delhi. Medium and low dense residential
areas have decreased at the cost of high dense residential areas. That means
the areas with low built up in 1992 has been converted into densely built up in
2005. The Delhi ridge which once considered being the lungs of Delhi is fast
10

degrading. There is considerable decrease in the ridge area 6.69% in 1992 to
5.52% in 2004 because there is continuous illegal tree cutting, quarrying and
construction activity is going on especially in the S-E around Vasant Vihar,
Vasant Kunj area and many more areas.
Table 3 Land use/land cover change in Delhi during (1992-2004)
1992 2004 Land use/land cover Area (Hect.) Area (%) Area (Hect.) Area (%) Highly dense residential 15,348.87 10.39 34,123.04 22.95 Medium dense residential 12,039.75 8.15 10,706.75 7.20 Low dense residential 10,661.80 7.22 10,324.30 6.94 Rural settlement 1,457.07 0.99 2,773.80 1.87 Commercial 396.87 0.27 527.86 0.36 Airport 2,261.67 1.53 2,160.02 1.45 Institutional 1,718.19 1.16 1,951.32 1.31 Industrial 689.68 0.47 576.03 0.39 Parks and Zoo 1,650.91 1.12 1,429.43 0.96 Stadium and playground 241.07 0.16 383.22 0.26 Historical monument 1,280.43 0.87 1,293.94 0.87 River 1,728.60 1.17 1,075.87 0.72 Drainage 920.31 0.62 1,088.40 0.73 Water body and reservoir 183.97 0.12 189.08 0.13 Canal 142.95 0.10 185.70 0.12 Agricultural land 65,114.21 44.89 54,152.63 36.94 Scrub land 3,521.43 2.52 3,615.58 2.43 Forest 2,331.06 1.58 2,127.34 1.43 Ridge 9,874.87 6.69 8,211.81 5.52 Pasture land 3,286.05 2.23 554.25 0.37 Urban agriculture 8,102.82 5.49 4,755.28 3.20 Riverine green 177.41 0.12 164.48 0.11 Open land 3,507.95 2.38 5,338.12 3.72 Total 1,48,375.70 100.00 1,48,375.70 100.00
Plate 1 Encroachment of built up area on productive agricultural lands
11

Land use/land cover change in Delhi during (1992-2004) 1992 2004
Fig. 6
3.3 Surface temperature assessment
Studies have been done on the relative warmth of cities by measuring the
air temperature, using meteorological data since this method is time consuming
and it lead to problems in spatial interpolation. Hence satellite borne instruments
can provide quantitative physical data at high spatial or temporal resolutions and
repetitive coverage is capability of measurements of earth surface conditions
(Owen et al., 1998). Temperature data, derived from Landsat ETM+, Vegetation
Index (VI) derived from high resolution IKONOS multi-spectral images, digitized
data of the city urban infrastructure and 3-D virtual reality models were integrated
to assess urban environment quality of Hong Kong (Nichali et. al. 2004). Infrared
remote sensing satellite is now being used in estimating the surface physical
properties and variables Owen et al. (1998), and Voogt and Oke (2003). For the
estimation of surface temperature, derivation of surface emissivity is important.
Since the study area is heterogeneous one, hence estimation of surface
emissivity at pixel scale was calculated. In the overall determination of surface
temperature using LANDSAT-7 ETM+ thermal channel (10.4 - 12.5µm), it would
give more accurate values if the emissivity values are obtained for thermal band
(b6) from the emissivity determined in 8-14µm wavelength band region.
12
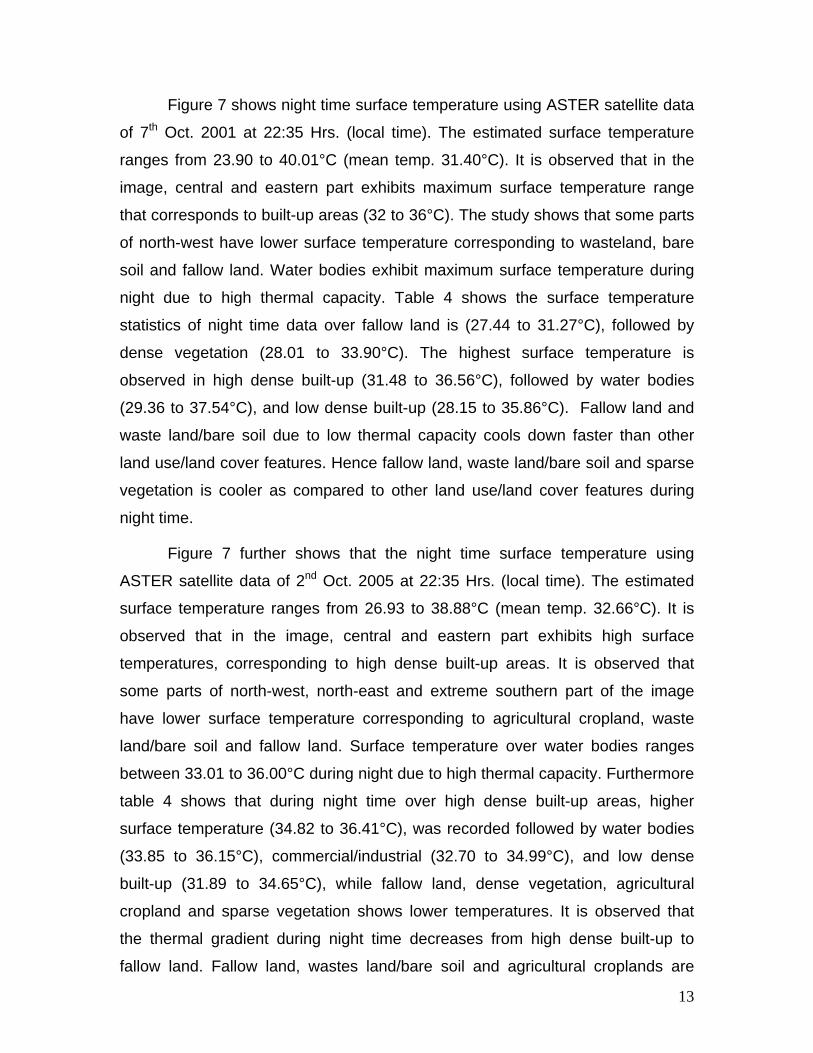
Figure 7 shows night time surface temperature using ASTER satellite data
of 7th Oct. 2001 at 22:35 Hrs. (local time). The estimated surface temperature
ranges from 23.90 to 40.01°C (mean temp. 31.40°C). It is observed that in the
image, central and eastern part exhibits maximum surface temperature range
that corresponds to built-up areas (32 to 36°C). The study shows that some parts
of north-west have lower surface temperature corresponding to wasteland, bare
soil and fallow land. Water bodies exhibit maximum surface temperature during
night due to high thermal capacity. Table 4 shows the surface temperature
statistics of night time data over fallow land is (27.44 to 31.27°C), followed by
dense vegetation (28.01 to 33.90°C). The highest surface temperature is
observed in high dense built-up (31.48 to 36.56°C), followed by water bodies
(29.36 to 37.54°C), and low dense built-up (28.15 to 35.86°C). Fallow land and
waste land/bare soil due to low thermal capacity cools down faster than other
land use/land cover features. Hence fallow land, waste land/bare soil and sparse
vegetation is cooler as compared to other land use/land cover features during
night time.
Figure 7 further shows that the night time surface temperature using
ASTER satellite data of 2nd Oct. 2005 at 22:35 Hrs. (local time). The estimated
surface temperature ranges from 26.93 to 38.88°C (mean temp. 32.66°C). It is
observed that in the image, central and eastern part exhibits high surface
temperatures, corresponding to high dense built-up areas. It is observed that
some parts of north-west, north-east and extreme southern part of the image
have lower surface temperature corresponding to agricultural cropland, waste
land/bare soil and fallow land. Surface temperature over water bodies ranges
between 33.01 to 36.00°C during night due to high thermal capacity. Furthermore
table 4 shows that during night time over high dense built-up areas, higher
surface temperature (34.82 to 36.41°C), was recorded followed by water bodies
(33.85 to 36.15°C), commercial/industrial (32.70 to 34.99°C), and low dense
built-up (31.89 to 34.65°C), while fallow land, dense vegetation, agricultural
cropland and sparse vegetation shows lower temperatures. It is observed that
the thermal gradient during night time decreases from high dense built-up to
fallow land. Fallow land, wastes land/bare soil and agricultural croplands are
13
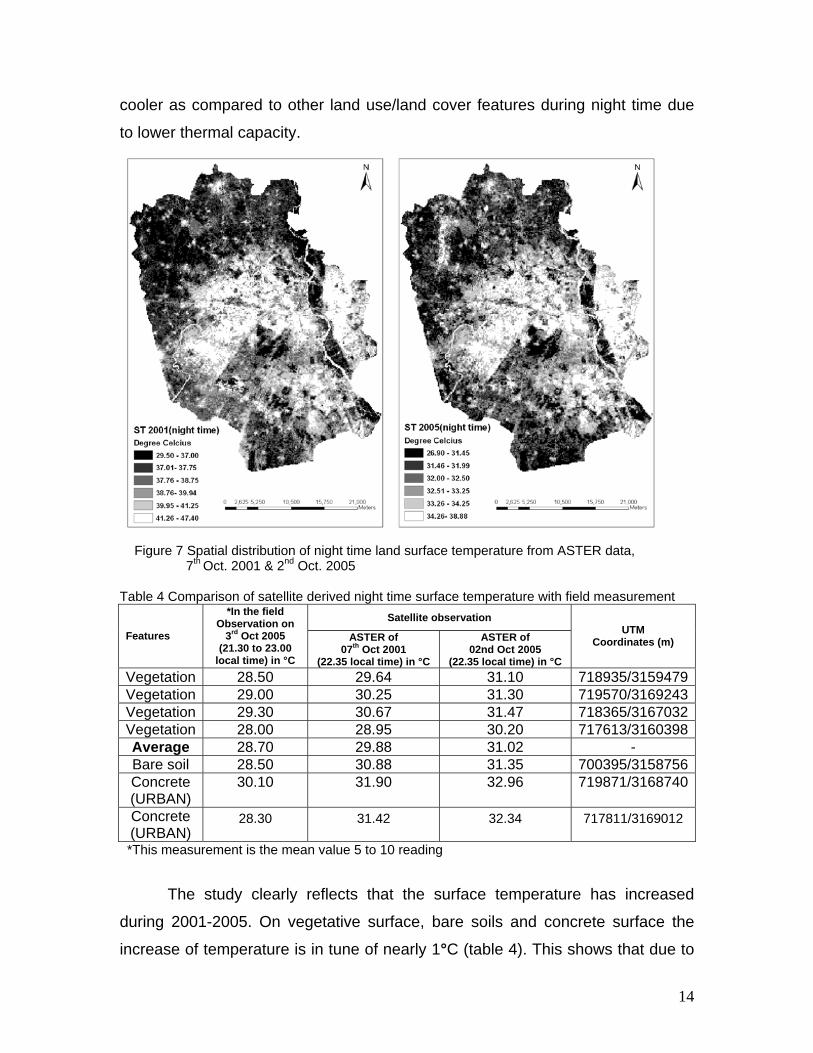
cooler as compared to other land use/land cover features during night time due
to lower thermal capacity.
Figure 7 Spatial distribution of night time land surface temperature from ASTER data,
7th Oct. 2001 & 2nd Oct. 2005 Table 4 Comparison of satellite derived night time surface temperature with field measurement
Satellite observation Features
*In the field Observation on
3rd Oct 2005 (21.30 to 23.00
local time) in °C
ASTER of 07th Oct 2001
(22.35 local time) in °C
ASTER of 02nd Oct 2005
(22.35 local time) in °C
UTM Coordinates (m)
Vegetation 28.50 29.64 31.10 718935/3159479Vegetation 29.00 30.25 31.30 719570/3169243Vegetation 29.30 30.67 31.47 718365/3167032Vegetation 28.00 28.95 30.20 717613/3160398Average 28.70 29.88 31.02 - Bare soil 28.50 30.88 31.35 700395/3158756Concrete (URBAN)
30.10 31.90 32.96 719871/3168740
Concrete (URBAN)
28.30
31.42
32.34
717811/3169012
*This measurement is the mean value 5 to 10 reading
The study clearly reflects that the surface temperature has increased
during 2001-2005. On vegetative surface, bare soils and concrete surface the
increase of temperature is in tune of nearly 1°C (table 4). This shows that due to
14
pressure of population on one side built-up area is increasing and on the other
vegetative area/agricultural land is decreasing that leads to increase in the
surface temperature over different land cover classes.
3.4 Solid waste management
In India increasing level of solid waste generation and its management is
nowadays a serious problem in the urban areas. High growth rates of population
and increasing per-capita income have resulted in the generation of enormous
solid waste posing a serious threat to environmental quality and human health.
Urban solid waste includes garbage or refuse discharged from residential,
market, institutional and industrial activities. India produces about 75 million
tones of waste every year, out of which in urban areas 40-50% remains
uncollected. The quantity of solid waste generated depends on a number of
factors such as food habits, standard of living, and the degree of commercial
activities. In 1999 the estimated quantity of garbage generated in Delhi was
8,203 million tons (MT) based on 0.61 kg/capita per day against which only 4885
MT is properly dispose of. However present consumption patterns are indicative
of an increase to 11,899 MT and 13,616 MT by 2011 leaving a gap of about 40%.
The quantity of solid waste substantially increases during the monsoon because
the moisture content increases.
Remote sensing data can be an aid in identification and location of
garbage dumping sites and in monitoring the changes in the land use within and
near hazardous waste and sanitary landfills (Radhakrishnan, 1996). Land
use/land cover analysis of a part of Delhi has been carried out using IRS data to
analyze feasibility of a suitable site for hazardous waste disposal site in the
Delhi’s national capital region, NCR (Javed and Pandey, 2004). In this paper an
attempt has been made to asses the garbage generation and identification of hot
spots using GIS and GPS. Table 5 shows Zone-wise solid waste generation and
disposal in Delhi during 1996-2005. It is seen that both garbage generation and
disposal in the South and East district of Delhi is highest (750 tones/day) and
15

(528 tones/day) respectively followed by Central Delhi (table 5 & fig. 8) that is
mainly because of the high population density in these districts.
Table 5 Zone-wise solid waste generation and disposal in Delhi (1996-2005)
Source: Central Pollution Control Board, Delhi, 30th Inspection Report (2006)
Figure 9 shows the hot spots which require immediate action with respect
to sanitation and maintenance which includes waste receptacles, open dumping
Zone
Quantity of waste generated/tons/day,
(1996)
Quantity of waste generated/tons/day,
(2005)
Quantity of waste disposed/tons/day,
(1996)
Quantity of waste disposed/tons/day,
(2005)
1 City 442.15 522.15 294.84 329.84
2 Civil lines 457.80 537.80 305.76 345.76
3 Shahdara (N)
415.00 485.05 276.64 306.64
4 Shahdara (S)
480.20 566.15 320.32 370.32
5 Sadar Paharganj
403.00 463.00 269.36 299.36
6 Karolbagh 269.37 339.36 269.37 289.36
7 West Delhi 241.62 311.63 241.62 291.63
8 Central Delhi
548.15 620.00 364.00 404.00
9 South Delhi 680.15 750.00 418.00 528.02
10 Najafgarh 397.15 465.15 265.74 305.72
11 Narela 147.50 207.50 98.28 148.28
12 Rohini 540.10 645.10 426.56 496.56
Total 5417.61 5922.89 3550.49 4115.49
Fig. 8
16
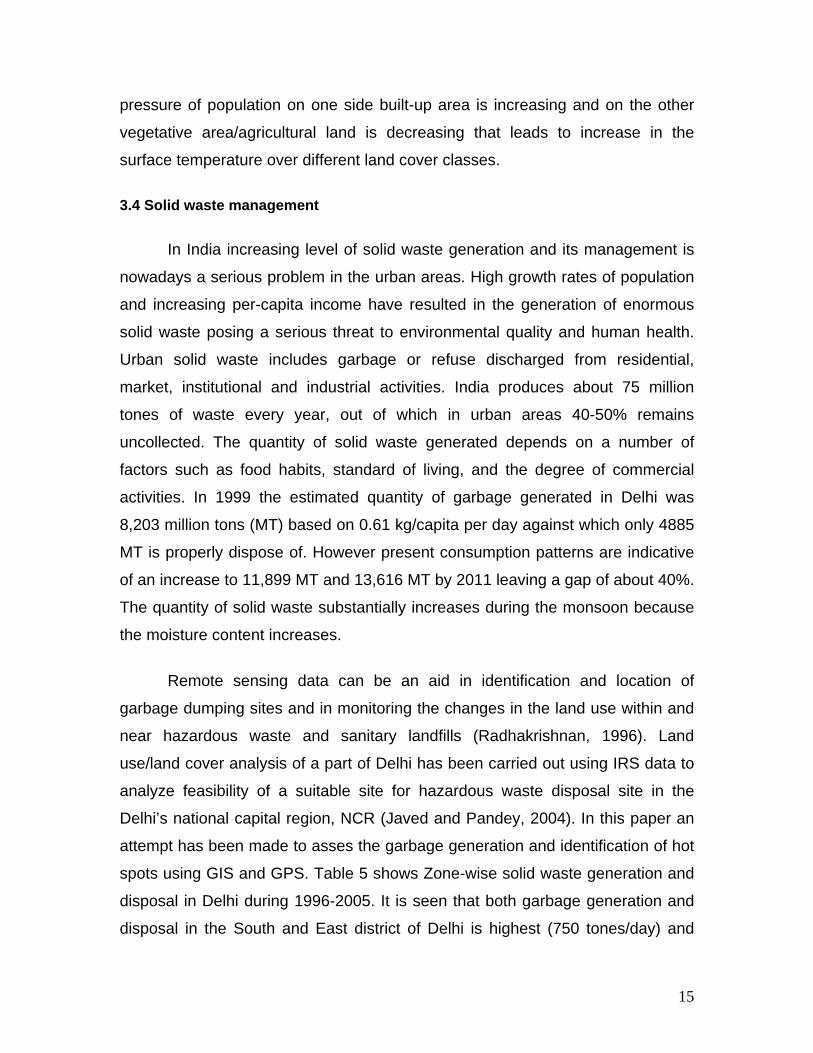
of wastes commonly seen along streets, lanes, road divides, footpaths, open
ground, open plots, and even in parks. The fig. 9 shows that there are 134
hotspots in MCD zone of Delhi. The hot spots were identified using GIS and GPS
field survey in conjunction with survey conducted by central pollution control
board (CPCB). Dustbins are very few in number and can’t hold enough garbage
that is being generated in usually it spills out from bins. So, there is a need to
give due care by the municipal authorities.
Fig. 9
3.5 Industrialization and air pollution
In recent times the growth of Delhi is characterized by increase in
residential complexes, use of vehicles and rapid industrialization. The
deficiencies in both planning and environmental regulations have led to the both
health and environmental damages. Apart form being the capital of the country, it
has become a centre for the commercial, industrial, social, cultural and
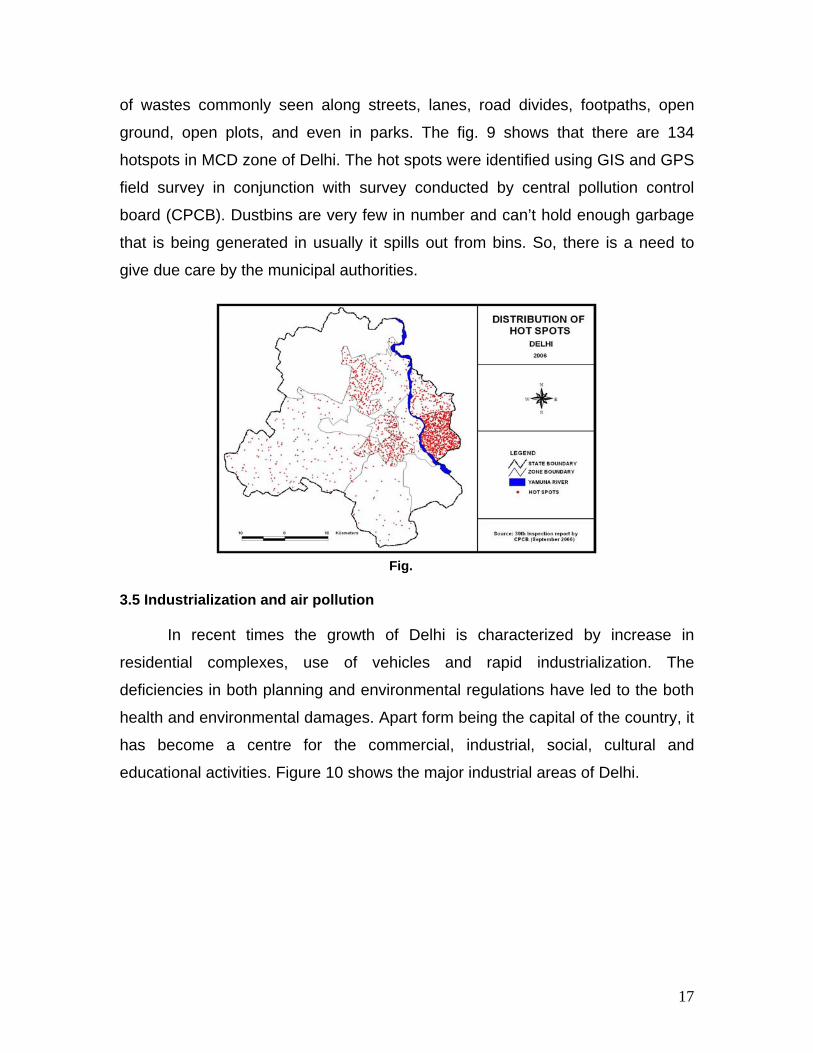
educational activities. Figure 10 shows the major industrial areas of Delhi.
17
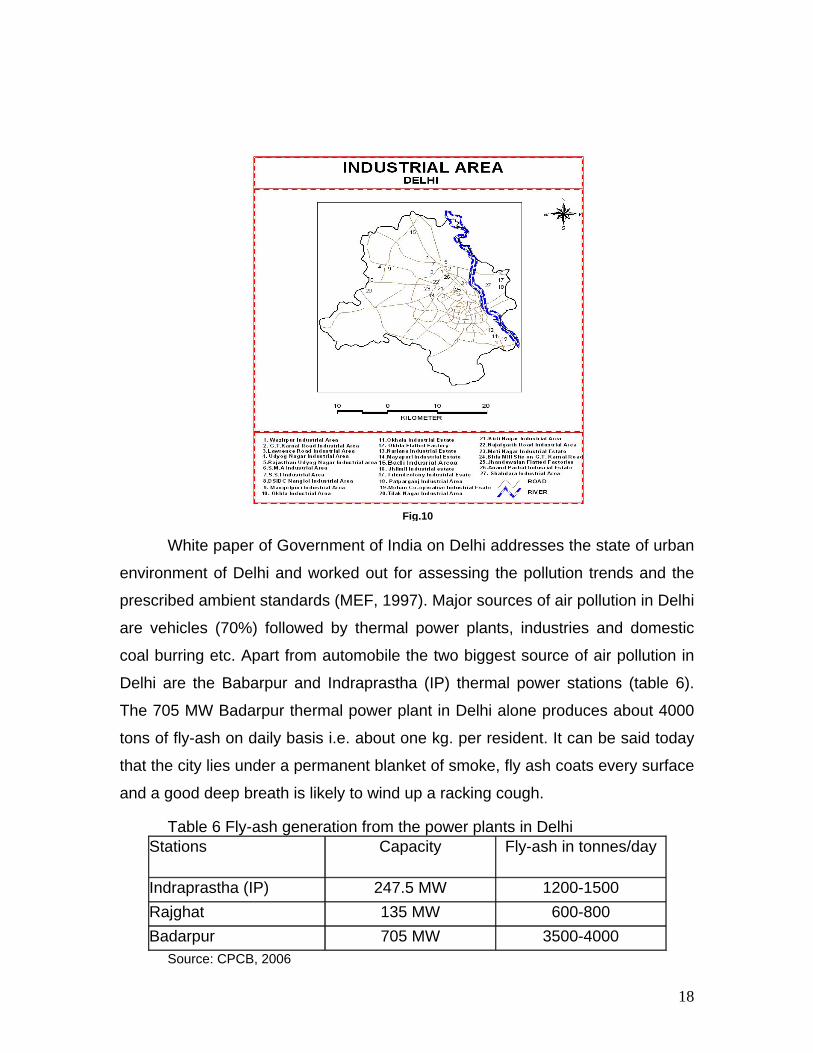
Fig.10
White paper of Government of India on Delhi addresses the state of urban
environment of Delhi and worked out for assessing the pollution trends and the
prescribed ambient standards (MEF, 1997). Major sources of air pollution in Delhi
are vehicles (70%) followed by thermal power plants, industries and domestic
coal burring etc. Apart from automobile the two biggest source of air pollution in
Delhi are the Babarpur and Indraprastha (IP) thermal power stations (table 6).
The 705 MW Badarpur thermal power plant in Delhi alone produces about 4000
tons of fly-ash on daily basis i.e. about one kg. per resident. It can be said today
that the city lies under a permanent blanket of smoke, fly ash coats every surface
and a good deep breath is likely to wind up a racking cough.
Table 6 Fly-ash generation from the power plants in Delhi Stations Capacity Fly-ash in tonnes/day
Indraprastha (IP) 247.5 MW 1200-1500 Rajghat 135 MW 600-800 Badarpur 705 MW 3500-4000
Source: CPCB, 2006
18
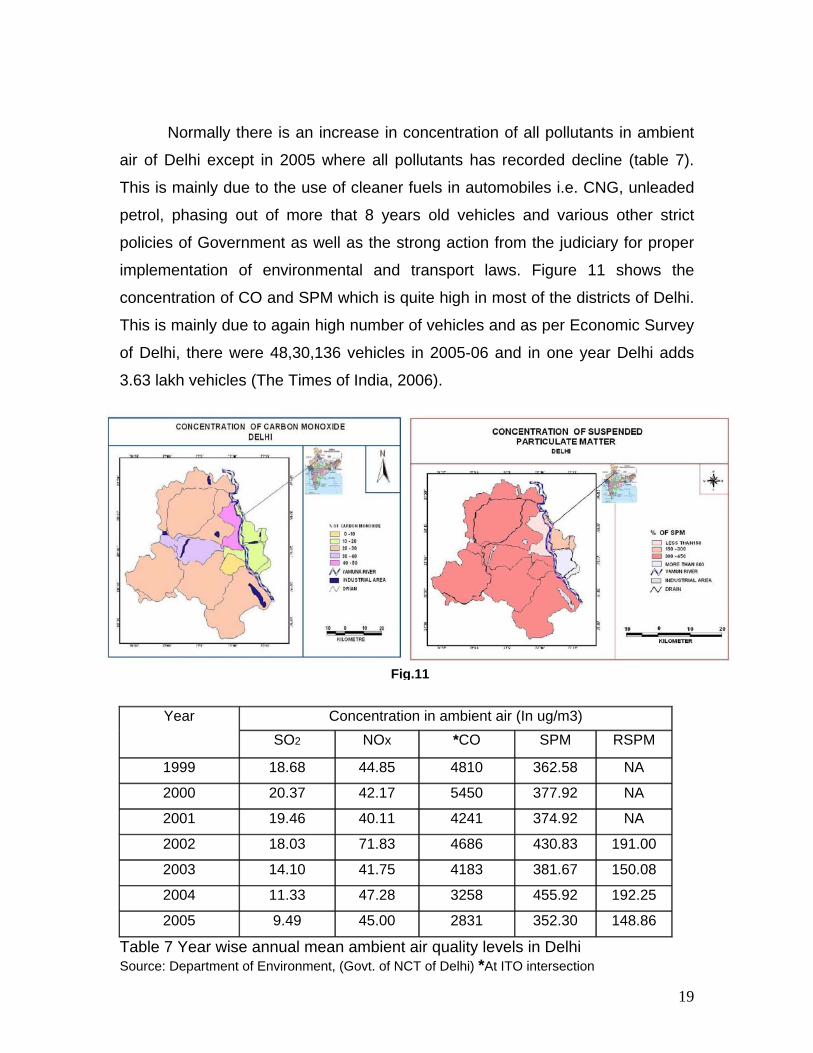
Normally there is an increase in concentration of all pollutants in ambient
air of Delhi except in 2005 where all pollutants has recorded decline (table 7).
This is mainly due to the use of cleaner fuels in automobiles i.e. CNG, unleaded
petrol, phasing out of more that 8 years old vehicles and various other strict
policies of Government as well as the strong action from the judiciary for proper
implementation of environmental and transport laws. Figure 11 shows the
concentration of CO and SPM which is quite high in most of the districts of Delhi.
This is mainly due to again high number of vehicles and as per Economic Survey
of Delhi, there were 48,30,136 vehicles in 2005-06 and in one year Delhi adds
3.63 lakh vehicles (The Times of India, 2006).
Fig.11
Table 7 Year wise annual mean ambient air quality levels in Delhi
Concentration in ambient air (In ug/m3) Year SO2 NOx *CO SPM RSPM
1999 18.68 44.85 4810 362.58 NA
2000 20.37 42.17 5450 377.92 NA
2001 19.46 40.11 4241 374.92 NA
2002 18.03 71.83 4686 430.83 191.00
2003 14.10 41.75 4183 381.67 150.08
2004 11.33 47.28 3258 455.92 192.25
2005 9.49 45.00 2831 352.30 148.86
Source: Department of Environment, (Govt. of NCT of Delhi) *At ITO intersection
19
3.6 Water pollution
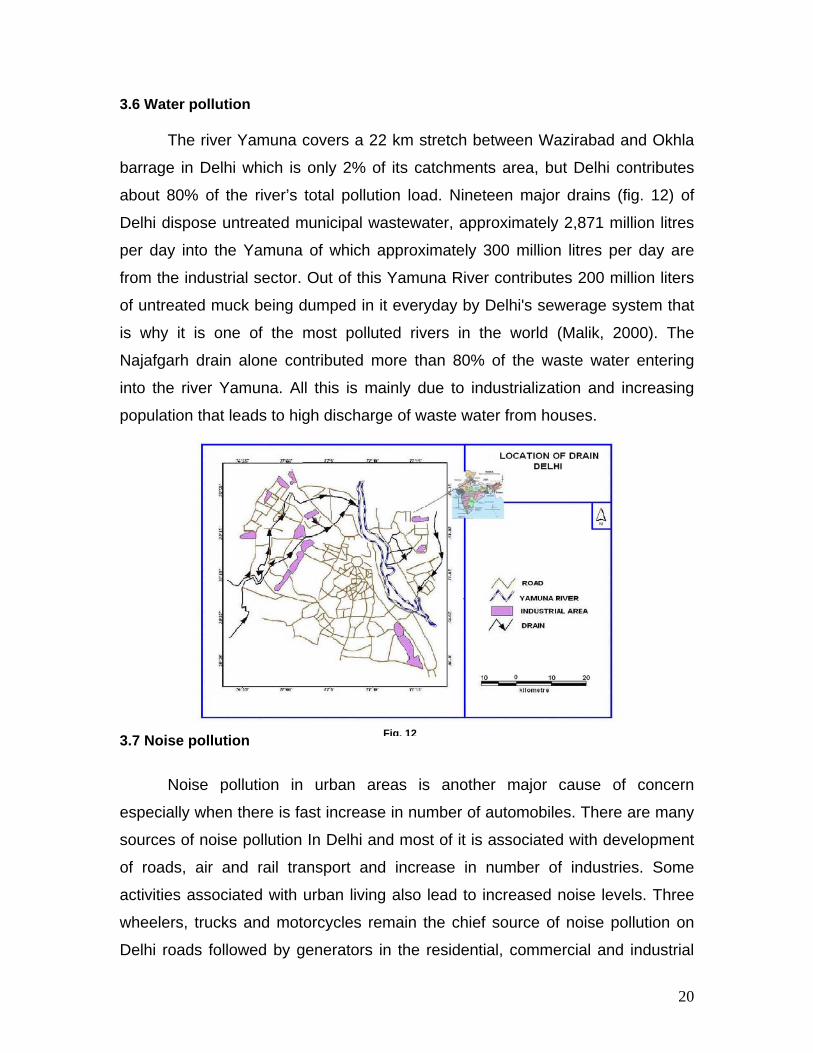
The river Yamuna covers a 22 km stretch between Wazirabad and Okhla
barrage in Delhi which is only 2% of its catchments area, but Delhi contributes
about 80% of the river’s total pollution load. Nineteen major drains (fig. 12) of
Delhi dispose untreated municipal wastewater, approximately 2,871 million litres
per day into the Yamuna of which approximately 300 million litres per day are
from the industrial sector. Out of this Yamuna River contributes 200 million liters
of untreated muck being dumped in it everyday by Delhi's sewerage system that
is why it is one of the most polluted rivers in the world (Malik, 2000). The
Najafgarh drain alone contributed more than 80% of the waste water entering
into the river Yamuna. All this is mainly due to industrialization and increasing
population that leads to high discharge of waste water from houses.
3.7 Noise pollution Fig. 12
Noise pollution in urban areas is another major cause of concern
especially when there is fast increase in number of automobiles. There are many
sources of noise pollution In Delhi and most of it is associated with development
of roads, air and rail transport and increase in number of industries. Some
activities associated with urban living also lead to increased noise levels. Three
wheelers, trucks and motorcycles remain the chief source of noise pollution on
Delhi roads followed by generators in the residential, commercial and industrial
20

locations that is due to short supply of electricity is summer season. The main
industrial areas of Delhi are Wazirpur, Mayapuri, Nariana and some others add
lots of noise pollution to the city environment. The effects of urban traffic on
environment in terms of population affected by air and noise pollution, using
predictive and dispersion models in a GIS environment in Jaipur was studied
using IRS-1C LISS-III FCC and PAN data of 1998 (Maithani. et. al., 2002). This
paper also addresses the noise pollution variation in Delhi using GIS software
with the help of data colleted from CPCB. Figure 13 shows noise pollution level
during day and night time. It is seen that most of the district of East and South
are recording more than 90 db noise levels but during night time the level of
noise goes below 90 db in almost all the districts except in one. The situation is
more serious when we examine the noise level during peak hours. Almost all the
districts of Delhi recorded more than 93 db noise level which is beyond the
permissible limit of 80 db during day time. This high level of noise pollution has
many adverse health effects on human e.g. hearing loss and heart stroke etc. So
there is an urgent need to put strict regulation to reduce the level of noise in
Delhi.
Fig. 13
21

4. Conclusion and suggestions
The critical issues and challenges of development and management for
growing urban centres like Delhi, Mumbai and Kolkata etc. have been the subject
of extensive discussions and debates in recent years. The major problems
associated with the urban centre in India is that of unplanned expansion,
changing land use/land cover, loss of productive agricultural land increase rainfall
runoff and depletion of water table etc. It is evident from the foregoing study that
major urban environmental problems occur due to high population growth
(46.31%) during (1991-2001), uncontrolled and mismanaged urban expansion
densely built up area has been more than doubled (122%) during last decade in
Delhi. There is obvious reduction (16.8%) in agricultural land because of urban
expansion in the fringe areas. Pollution load in terms of air, water, noise, and
solid waste generation and disposal etc. has also increased considerably.
Management of huge garbage and solid waste including medical waste is very
difficult that create unhealthy scene in urban areas. So, remote sensing satellite,
with repetitive and synoptic viewing capabilities together with GIS is an important
tool to map, assess and monitor the changes in the land use/land cover. High-
resolution satellite imagery (IKONOS, Quick Bird) can be used to monitor the
urban expansion and illegal housing constructions over a period of time and to
find out the potential waste disposal sites for solid waste management. Thermal
infrared (TIR) satellite data can be used to assess the so-called ‘urban heat
island’, surface temperature and areas with high atmospheric pollution. The
thermal satellite data of Delhi clearly shows that there 1-2°C increase in surface
temperature in just 4 years that is a subject matter of concern. A database
generated from remote sensing imageries in DIP software and thematic maps
prepared using socio-economic data in GIS environment could be helpful for
sustainable development, planning and good governance of Delhi and some
other cities as well.
To fight with the problems of environmental degradation and to meet the
challenges of sustainable development, it is suggested that the use of remote
sensing and GIS in conjunction with geospatial data is of vital importance.
22

Therefore, there is need for the use of urban information database that can be
generated using remote sensing data and GIS techniques. Top priority should be
given to the issues related to the planed development of the city, reduction in
atmospheric pollution and traffic congestion etc. The administrative, technical,
and managerial people of the urban local bodies (ULBs) need to be
strengthened. The official of various government departments should be given
thorough exposure and training of remote sensing and GIS for its application and
implementation in the urban environmental management plans. The problems
and challenges faced by mankind are of national level but it has to be dealt at the
local level. So, it can be seen from the foregoing study that the deterioration of
urban environmental quality is mainly because of growing population that can be
effectively monitored and assessed by using geo-spatial tools.
23

References Census of India (1991 and 2001), ‘Provisional Population Totals, Office of
Registrar General of India’, Government of India, New Delhi. CPCB, Central Pollution Control Board (2006), Government of NCT of Delhi,
New Delhi. Delhi’s First Human Development Report (2006) Partnerships for Progress,
Oxford university press, New Delhi. Economic Survey of Delhi, (1991) & (1999-2000) Hardoy J. E, Mitlin D, Satterthwaite D. (1997). Environmental Problems in Third
World Cities. Earthscan Publication, London. Javed A., Pandey, S. (2004) Land use/land cover analysis for waste disposal.
GIS Development, Vol.8 No. 6, Delhi Lata K. M., Sankar Rao C. H., Krishna Prasad V., Badrinath K. V. S.,
Raghavaswamy, (2001) Measuring urban sprawl: a case study of Hyderabad, GIS development, Vol. 5, No. 12
Maithani. S., Sokhi. B. S., Subudhi. A. P., and Herath. K. B. (2002).
Environmental Effects of Urban Traffic-A case study of Jaipur City, GIS Development, Vol.6 No. 12, New Delhi
Mallik l, (2000), A Billion Strong or Weak? Down to Earth, June 30, p. 55. MEF (Ministry of Environment and Forest), (1997) White Paper on Pollution in
Delhi with action plan, Government of India. Mishra, B., Singh, R. B. and Malik, Anupama, (2001) Delhi Metropolis: Housing
and Quality of Life in Million Cities of India Vol. 1 , (eds.) R.P. Mishra, pp-196-228.
NRSA, (2005) National Remote Sensing Agency, Quarterly Newsletter,
updates@nrsa, Vol. 2, Issue 2, Balanagar, Hyderabad NRSA, (1994) Mapping and monitoring urban sprawl of Madras, Unpublished
project report, Hyderabad Nichali, J. and Wong, M. S. (2004) “Mapping and Modelling of Urban
Environment Quality in Hong Kong. Owen, T.W., Carlson, T.N., Gillies, R.R., (1998), Remotely sensed surface
parameters governing urban climate change: Internal Journal of Remote Sensing. Vol.19, p.1663–1681.
24

Rahman A. (2007). An integrated geo-spatial approach for monitoring urban environmental management issues and challenges in India, In (eds.) Singh A.L and Fazal S. Urban Environmental Management, B. R. Publishers, New Delhi (In press).
Rahman, A. (2006). Application of remote sensing and GIS technique for urban
environmental management and sustainable development of Delhi, India’, In Applied Remote Sensing for Urban Planning, Governance and Sustainability, (eds.) Netzband M. & Stefnow W. Springer-Verlag Publishes, New York (In press).
Rindfuss, R., Walsh, S., Mishra, V., Fox, J., Dolcemacolo, G., (2003), “Linking Household and Remotely Sensed Data: Methodological and Practical Problems”, In Fox, J., Rindfuss, R.R., Walsh, S.J., Mishra, V. (eds.), People and the Environment: Approaches for Linking Household and Community Surveys to Remote Sensing, Boston: Kluwer Academic Press, pp. 1-29.
Radhakrishnan K., Adiga S., Varadan G., Diwakar P. G. (1996). Enhances GIS application using IRS-1C data-potential for urban utility mapping and modeling. Current Science, Vol. 70, No. 7 and 10.
Rathi, R. S. and Vatsvani R. R., (1999) Digital Mapping of Urban/Sub-Urban
Environment of Dehradun Using SPOT Data, In Remote Sensing of Urban Environmen, (eds.) Sokhi B. S. and Rashid S. M. pp-123-136.
The Times of India, (2006) Car boom fuels air pollution in city, The Times of
India, Nov. 16 United Nations Population Division (2001), World Population Prospects: The
2000 Revision, New York. Voogt, J.A., Oke, T.R., 2003. Thermal remote sensing of urban climates. Remote
Sensing of Environmen,t 86 (3): 370–384.
25